Embed Size (px)
Citation preview

ehavior 86 (2007) 576–586www.elsevier.com/locate/pharmbiochembeh
Pharmacology, Biochemistry and B
Morphine‐3‐glucuronide inhibits morphine induced, but enhancesmorphine‐6‐glucuronide induced locomotor activity in mice☆
Marte Handal a,⁎, Åse Ripel a, Tor Aasmundstad c, Svetlana Skurtveit b,d, Jørg Mørland a,e
a Norwegian Institute of Public Health, Division of Forensic Toxicology and Drug Abuse, P.O. Box 4404 Nydalen, NO‐0403 Oslo, Norwayb Norwegian Institute of Public Health, Division of Epidemiology, P.O. Box 4404 Nydalen, NO‐0403 Oslo, Norway
c Rikshospitalet‐Radiumhospitalet Medical Center, Oslo, Norwayd University of Tromsø, Department of Pharmacy, Tromsø, Norway
e University of Oslo, Faculty Division Rikshospitalet, P.O. Box 1171 Blinderen, NO‐0318 Oslo, Norway
Received 31 March 2006; received in revised form 30 January 2007; accepted 1 February 2007Available online 8 February 2007
Abstract
The main metabolite of morphine, morphine‐3‐glucuronide (M3G) has no opioid effects. Some studies have rather indicated that it antagonizesthe antinociceptive and respiratory depressive effects of both morphine and the active metabolite morphine‐6‐glucuronide (M6G). We studied thepossible influence of M3G on the psychostimulant properties of morphine and M6G measured by locomotor activity. Mice were given twoinjections, one with either 80, 240 or 500 μmol/kg M3G or saline followed by an injection of 20 or 30 μmol/kg morphine or M6G. M3Ginfluenced the locomotor activity induced by both morphine and M6G, but in opposite directions. M3G reduced the morphine induced locomotoractivity during the first hour following morphine injection in a concentration dependent manner. M3G pretreatment did not significantly influencebrain concentrations of morphine indicating that the interaction was of a pharmacodynamic type. In contrast M3G pretreatment increased the M6Ginduced locomotor activity. M3G pretreatment increased serum and brain M6G concentrations to an extent indicating that this interaction wasmainly of a pharmacokinetic type. In conclusion our results disclose complicated interactions between morphine and its two metabolites withrespect to induction of locomotor activity and possibly also with respect to mechanisms related to drug reward.© 2007 Elsevier Inc. All rights reserved.
Keywords: Morphine; Morphine‐3‐glucuronide; Morphine‐6‐glucuronide; Locomotor activity; Pharmacokinetics; Antagonism; Potentiation; Mice
1. Introduction
Morphine causes a spectrum of effects ranging fromanalgesia and respiratory depression to euphoria. These effectsare predominantly mediated by μ‐opioid receptors. Morphinealso has an effect on the mesencephalic dopamine neuronsresulting in locomotor stimulation (Joyce and Iversen, 1979). Inhumans, the main metabolic pathway of morphine is glucur-onidation with the formation of morphine‐3‐glucuronide (M3G)
☆ Presented, in part, in 2004 at the 66th Annual Scientific Meeting of Collageon Problems of Drug Dependence.⁎ Corresponding author. Division of Forensic Toxicology and Drug abuse,
Norwegian Institute of Public Health, P.O. Box 4404 Nydalen, NO‐0403 Oslo,Norway. Tel.: +47 23 40 78 00; fax: +47 23 40 78 78.
E-mail addresses: [email protected] (M. Handal), [email protected](Å. Ripel), [email protected] (T. Aasmundstad),[email protected] (S. Skurtveit), [email protected] (J. Mørland).
0091-3057/$ - see front matter © 2007 Elsevier Inc. All rights reserved.doi:10.1016/j.pbb.2007.02.001
and morphine‐6‐glucuronide (M6G). The plasma concentra-tions of these glucuronides by far exceed the concentration ofmorphine shortly after single dose administrations as well asduring chronic treatment (Sawe et al., 1985; Osborne et al.,1990). Glucuronides are generally considered as highly polarmetabolites unable to cross the lipid layers of the blood–brainbarrier. However, it has been reported that M6G, and to a lesserextent M3G, are more lipophilic than predicted and not muchless lipophilic than morphine itself (Carrupt et al., 1991). Thereis also direct evidence that the morphine glucuronides pass theblood–brain barrier (Aasmundstad et al., 1995; Xie et al., 2000).
M6G is an active metabolite of morphine causing analgesia,ventilatory depression and inhibition of gastrointestinal transit(Milne et al., 1996). M3G does not have analgesic or ventilatorydepressive effects in either animals (Milne et al., 1996) or man(Penson et al., 2000), but is suggested to have effects thatcounteract those of morphine. These effects ranges from

577M. Handal et al. / Pharmacology, Biochemistry and Behavior 86 (2007) 576–586
decreasing morphine analgesia (Smith et al., 1990; Gong et al.,1992; Ekblom et al., 1993) to behavioral excitation (Yaksh etal., 1986).
Mice metabolize morphine to M3G, but produce no M6G(Handal et al., 2002). This makes mice an experimental modelwhere the effects of morphine can be studied undisturbed ofM6G formation, which could otherwise add its pharmacody-namic effects to the effects of morphine. We have previouslydemonstrated that systemic administration of M6G can causelocomotor activation similar to morphine. M3G did not elicitlocomotor activation in mice (Morland et al., 1994; Grung et al.,1998; Grung et al., 2000; Handal et al., 2002).
The present experiments were designed to study the possibleinfluence of M3G, which does not induce locomotor activityitself, on the psychomotor stimulating properties of morphineand M6G measured by locomotor activity. Furthermore wewanted to study whether possible interactions could bepharmacokinetic in nature.
2. Materials and methods
2.1. Animals
C57BL/6J‐Bom adult (7–8 weeks old), drug‐naive, malemice (16.4–28.2 g body weight at testing) from Bomholt,Denmark were used for the experiments. The animals werehoused eight to ten per cage at the National Institute of PublicHealth, Oslo, Norway, at room temperature of 21–26 °C. Theanimals were kept on a 12/12 h light/dark schedule with thelight period from 07:00 h to 19:00 h. The mice were housed forat least 5 days prior to experiments with free access to food andwater throughout this acclimatization period. They were fastedovernight before the experiments. Each animal was tested once.The Norwegian Review Committee for the use of AnimalSubjects approved the experimental protocol of this study.
2.2. Materials
Morphine hydrochloride (mol. wt. 375.9) was purchasedfrom Norsk Medisinaldepot (Oslo, Norway). Because of changein purchase routines both morphine‐6‐β‐D‐glucuronide dihy-drate (mol. wt. 497.5 from Ultrafine Chemicals (Manchester,England)) and morphine‐6‐β‐D‐glucuronide hydrate (mol. wt.461.47 from Lipomed (Arlesheim, Switzerland)) were used inthe experiments. Morphine‐3‐β‐D‐glucuronide (mol. wt.461.47) was purchased from Lipomed (Arlesheim, Switzer-land). The drugs were dissolved in 0.9% saline. Acetonitril fromLabscan Ltd. (Dublin, Ireland) was HPLC‐grade. All otherreagents were analytical grade.
2.3. Experimental design
Four different types of experiments were conducted.
2.3.1. Dose response studiesEach animal was given one subcutaneous (sc) bolus injection
of saline, morphine or M6G. Morphine and M6G were given in
four different doses: 10, 15, 20 and 30 μmol/kg (equivalent to3.8, 5.6, 7.5 and 11.3 mg/kg for morphine and 4.6, 6.9, 9.2 and13.8 mg/kg for M6G). Each treatment group consisted of aminimum of four animals. The injections were given in totalvolumes of 10 ml/kg. Locomotor activity was registered for180 min (description below).
2.3.2. M3G locomotor interaction studiesEach animal received two bolus injections with 30‐min
interval, one intraperitoneal (ip) with M3G or saline followedby one sc with morphine, M6G or saline. The injections weregiven by two different administration routes to avoid anyinteractions at the administration site. M3G was given in threedifferent doses; 80, 240 or 500 μmol/kg (equivalent to 37,111, 231 mg/kg), morphine and M6G were given in twodoses; 20 or 30 μmol/kg (7.5 or 11.3 mg/kg for morphine and9.2 or 13.8 mg/kg for M6G). The agonist doses were chosenbased on the dose response study and our previous workdemonstration that these doses are in the lower segment of thesteepest part of the sigmoid shaped dose response curve (0–120 μmol/kg) (Grung et al., 1998). The ip injections weregiven in total volumes of 20 ml/kg, and the sc injections weregiven in total volumes of 10 ml/kg. There were 9–10animals in each treatment group. Locomotor activity wasthereafter registered for 180 min (20 μmol/kg) or 300 min(30 μmol/kg).
2.3.3. M3G pharmacokinetic interaction studiesEach animal received two bolus injections at 30‐min interval,
one ip with M3G (500 μmol/kg (231 mg/kg)) or saline and onesc with morphine (20 μmol/kg (7.5 mg/kg)) or M6G (20 μmol/kg (9.2 mg/kg)) as described above. Three to five animals werekilled at 15, 30, 45, 60 and 120 min following the secondinjection. At each time point, as well as after 180 min (fromanimals included in Experiment 2.3.2), blood samples weretaken and the brains were removed for further analysis(description below).
2.3.4. Comparative studies of concentrations (serum andbrain) and locomotor activity following 20 and 30 μmol/kg(9.2 and 13.8 mg/kg) M6G respectively
To make it possible to interpret the relationship betweenserum and brain concentrations of M6G and the correspondinglocomotor activity following pretreatment with M3G, we had toexplore how M6G pharmacokinetics influenced M6G locomo-tor activity. Therefore two groups of animals received one scinjection of either 20 or 30 μmol/kg M6G. The injections weregiven in total volumes of 10 ml/kg. Three to five animals werekilled at 15, 30, 45, 60 and 120 min following the injection.Only one animal receiving each dose was killed at 180 minfollowing the injection. At each time point blood samples weretaken and the brains were removed for M6G analysis(description below). Locomotor activity was registered duringthe time period between the injection and the time of blood andbrain sampling. The locomotor activity curve and the totaldistance travelled were calculated based on the mean activity ateach 5‐min interval.

578 M. Handal et al. / Pharmacology, Biochemistry and Behavior 86 (2007) 576–586
2.4. Blood and brain sampling
Animals were killed by heart blood sampling under CO2‐anesthesia. The brains were removed immediately after bloodsampling. They were washed in ice‐cold physiological saline,blotted on a filter paper and instantly frozen in liquid nitrogen.They were stored at − 18 °C until analysis. After 60 min at roomtemperature, the blood samples were centrifuged for 10 min at1670 ×g and serum was removed and stored at − 18°C untilanalyses were preformed.
2.5. Serum and brain sample purification
2.5.1. SerumSolid‐phase extraction and sample injection modified from
Svensson et al. (Svensson et al., 1982; Svensson, 1986) wereperformed by an ASPEC (Automated Sample Preparation withExtraction Columns) robot (Gilson, Medical Electronics,Villiers de Ble, France). The extraction cartridges, Oasis HLB1 cc/30 mg (Waters, U.S.A.), were washed with 1 ml methanoland 1 ml water. Fifty microliters of sample was mixed with1.6 ml 0.5 M ammonium sulfate (pH 9.3) and 50 μl internalstandard (normorphine). Even though normorphine has beendetected in small amounts in urine from mice (Yeh et al., 1977),we have not, in previous experiments, been able to detect it inserum or brain even following administration of high morphinedoses (80 μmol/kg) to C57BL/6J‐Bom mice. Normorphinecould therefore be used as an internal standard withoutinfluencing the other measured concentrations. The samplewas then passed through the cartridge and subsequently washedwith 3 ml 5 mM ammonium sulfate (pH 9.3) and 75 μl 10%acetonitril (ACN) in 10 mM NaH2PO4 (pH 2.1). Morphine andits metabolites were eluted with 500 μl 10% ACN in 10 mMNaH2PO4 (pH 2.1). This 500 μl sample was added and mixedwith 5 mM ammonium sulfate (pH 9.3) and passed through asecond cartridge and subsequently washed with 2 ml 5 mMammonium sulfate (pH 9.3). Morphine and its metabolites wereeluted with 500 μl 10% ACN in 10 mM NaH2PO4 (pH 2.1). A50 μl extract was injected into the HPLC.
2.5.2. BrainPreceding analysis the brains were homogenized with an
Ultra Turrax T8 homogenizer (IKA, Jake and Kunkle,Germany) in ice‐cold water to a final concentration of0.33 g tissue/l homogenate. Five hundred microliter waterwas added to a sample of 600 μl brain homogenate and 50 μlinternal standard (normorphine). This sample was frozen andthawed two times and then centrifuged for 10 min at 1670 ×g.The supernatant was mixed with 1.2 ml 5 mM ammoniumsulfate (pH 9.3) and then subjected to the same procedure ofsolid‐phase extraction and sample injection as describedabove.
2.6. HPLC analysis
The HPLC analysis was an automated modification of themethod described by Svensson et al. (Svensson et al., 1982;
Svensson, 1986). The system consisted of an ASPEC robotmentioned above, HP‐1050 isocratic pump (Hewlett Packard,Waldbronn, Germany), Spectra System UV2000 detector(Spectras Physics Analytical, San Jose, CA, U.S.A.) in serieswith an ESA Coulochem model 5100A with ESA model 5010analytical cell (ESA, Bedford, MA, U.S.A). Drug concentra-tions were determined from curve area by integration withEZChrom (Scientific Software, Inc., San Ramon, CA, USA)or Totalchrom (PerkinElmer Instruments LLC, Shelton, CT,U.S.A.). The column used was Chrompac ODS‐2 (10 cm ×0.46 cm i.d., 3 μm particle size) (Waters, Milford, Massachu-setts, U.S.A.). The mobile phase consisted of 24% ACN (v/v)with the ion‐paring agent sodium dodecyl sulphate (4 mM) in amixture of 10 mM NaH2PO4 and 10 mM H3PO4 (pH 2.1). Theflow rate was 0.8 ml/min. The UVwavelength used was 210 nm.The electrochemical detector operated at electrode potentials of0.3 and 0.42 V and only the second electrode was used forquantification.
2.6.1. Method performance
2.6.1.1. Serum. The analytical recoveries in serum were 70%for M3G, 79% for M6G and 85% for morphine. The inter‐assayvariability of the automated extraction was less than 10% for allcompounds. The limits of detection (LOD) for the electro-chemical detector (M6G and morphine) were 0.2 μM and0.3 μM respectively, and for the UV detector (M3G) 0.2 μM.When the initial morphine concentration was below 5 μM,M6Gand morphine were quantified by the electrochemical detector.Higher concentrations of morphine and M6G and M3G werequantified by UV detection.
2.6.1.2. Brain. The analytical recoveries in brains were 55%for M3G and 75% for M6G and morphine. The inter‐assayvariability of the automated extraction was less than 12% for allcompounds. The limits of detection (LOD) for M6G andmorphine were 0.06 nmol/g (electrochemical detector) and0.6 nmol/g for M3G (UV detector).
2.7. Locomotor activity
Each animal was tested individually in an activity chamberof a Digiscan optical animal activity monitoring system(Omnitec Electonics Inc., Columbus, USA). The chamber sizewas 20 × 20 cm with infrared beam spacing of 2.5 cm. Eachanimal was individually habituated in the activity chamber for90 min before injections. After habituation the mouse wasgently removed from the activity chamber and given itstreatment in another room. If the treatment consisted of morethan one injection the animal was kept in its home cage betweenthe two injections. Immediately following the completetreatment it was gently returned to the same activity chamberas used for habituation. Locomotor activity was measured fordifferent time periods after treatment as described for eachexperiment. Each animal's score was expressed as activitycounts per 5‐min period or as a total sum of activity counts perhour(s). A battery of different activities was measured as
579M. Handal et al. / Pharmacology, Biochemistry and Behavior 86 (2007) 576–586
described earlier (Grung et al., 1998). We focus on one activity,the horizontal distance travelled, to present our results.
2.8. Data analysis
Statistical comparison between groups were preformed byone‐way analysis of variance (ANOVA) followed by Bonfer-roni test or by Student's unpaired T‐test, as appropriate.
Data from the concentration time curves were analyzed usingregression analysis where the concentrations represented thedependent variable and pretreatment was coded as theindependent predictor variable (a dummy variable). In additionthe time variable was coded as a second dummy variable. Theresult of the analysis is presented as an unstandardizedcoefficient.
P values of less than 0.05 were regarded as statisticallysignificant.
Statistical analyses were performed with SPSS version 12.0statistical software.
Data are presented as mean±SEM unless otherwise stated.Calculations of the area under the curve (AUC) were
performed by use of the trapezoidal rule.
3. Results
3.1. Dose response
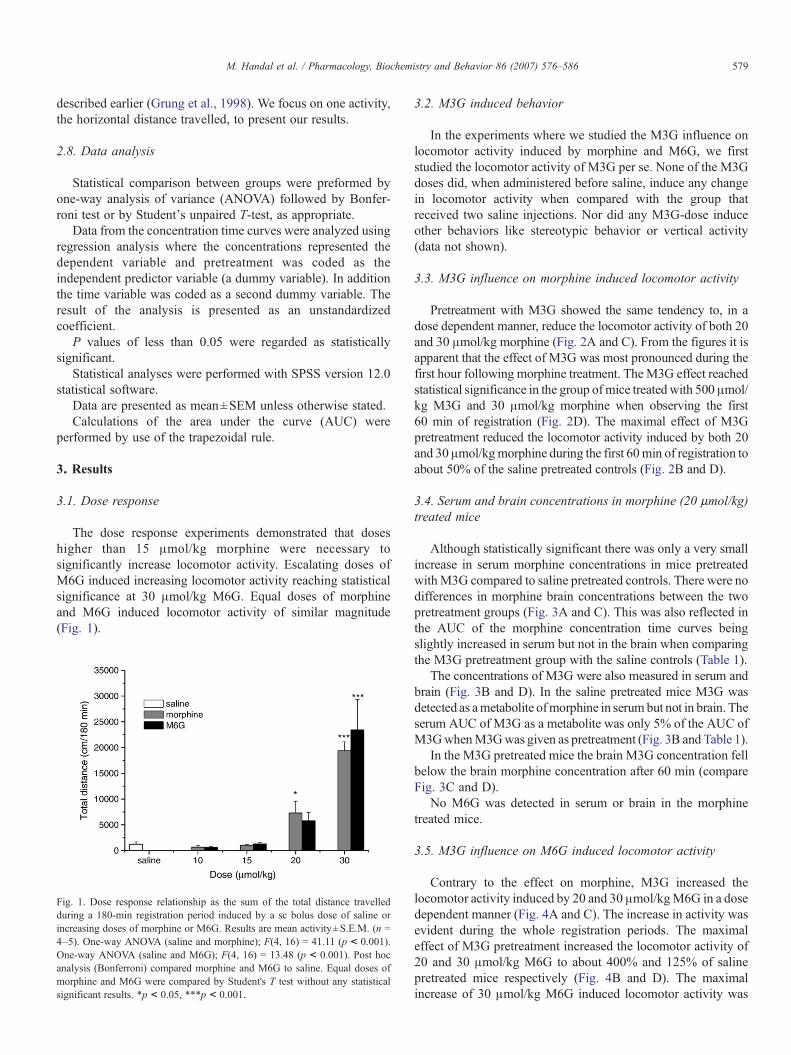
The dose response experiments demonstrated that doseshigher than 15 μmol/kg morphine were necessary tosignificantly increase locomotor activity. Escalating doses ofM6G induced increasing locomotor activity reaching statisticalsignificance at 30 μmol/kg M6G. Equal doses of morphineand M6G induced locomotor activity of similar magnitude(Fig. 1).
Fig. 1. Dose response relationship as the sum of the total distance travelledduring a 180‐min registration period induced by a sc bolus dose of saline orincreasing doses of morphine or M6G. Results are mean activity±S.E.M. (n =4–5). One‐way ANOVA (saline and morphine); F(4, 16) = 41.11 (p < 0.001).One-way ANOVA (saline and M6G); F(4, 16) = 13.48 (p < 0.001). Post hocanalysis (Bonferroni) compared morphine and M6G to saline. Equal doses ofmorphine and M6G were compared by Student's T test without any statisticalsignificant results. *p < 0.05, ***p < 0.001.
3.2. M3G induced behavior
In the experiments where we studied the M3G influence onlocomotor activity induced by morphine and M6G, we firststudied the locomotor activity of M3G per se. None of the M3Gdoses did, when administered before saline, induce any changein locomotor activity when compared with the group thatreceived two saline injections. Nor did any M3G‐dose induceother behaviors like stereotypic behavior or vertical activity(data not shown).
3.3. M3G influence on morphine induced locomotor activity
Pretreatment with M3G showed the same tendency to, in adose dependent manner, reduce the locomotor activity of both 20and 30 μmol/kg morphine (Fig. 2A and C). From the figures it isapparent that the effect of M3G was most pronounced during thefirst hour following morphine treatment. TheM3G effect reachedstatistical significance in the group ofmice treated with 500 μmol/kg M3G and 30 μmol/kg morphine when observing the first60 min of registration (Fig. 2D). The maximal effect of M3Gpretreatment reduced the locomotor activity induced by both 20and 30μmol/kgmorphine during the first 60min of registration toabout 50% of the saline pretreated controls (Fig. 2B and D).
3.4. Serum and brain concentrations in morphine (20 μmol/kg)treated mice
Although statistically significant there was only a very smallincrease in serum morphine concentrations in mice pretreatedwithM3G compared to saline pretreated controls. There were nodifferences in morphine brain concentrations between the twopretreatment groups (Fig. 3A and C). This was also reflected inthe AUC of the morphine concentration time curves beingslightly increased in serum but not in the brain when comparingthe M3G pretreatment group with the saline controls (Table 1).
The concentrations of M3G were also measured in serum andbrain (Fig. 3B and D). In the saline pretreated mice M3G wasdetected as ametabolite ofmorphine in serum but not in brain. Theserum AUC of M3G as a metabolite was only 5% of the AUC ofM3GwhenM3Gwas given as pretreatment (Fig. 3B and Table 1).
In the M3G pretreated mice the brain M3G concentration fellbelow the brain morphine concentration after 60 min (compareFig. 3C and D).
No M6G was detected in serum or brain in the morphinetreated mice.
3.5. M3G influence on M6G induced locomotor activity
Contrary to the effect on morphine, M3G increased thelocomotor activity induced by 20 and 30 μmol/kgM6G in a dosedependent manner (Fig. 4A and C). The increase in activity wasevident during the whole registration periods. The maximaleffect of M3G pretreatment increased the locomotor activity of20 and 30 μmol/kg M6G to about 400% and 125% of salinepretreated mice respectively (Fig. 4B and D). The maximalincrease of 30 μmol/kg M6G induced locomotor activity was
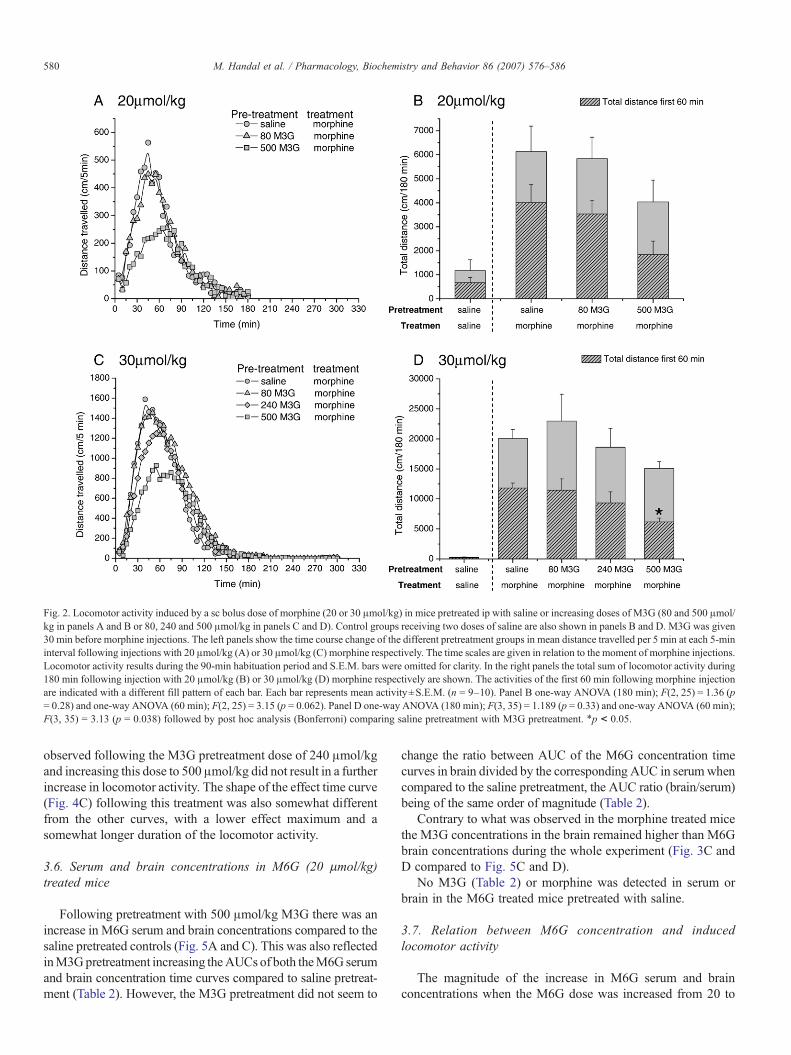
Fig. 2. Locomotor activity induced by a sc bolus dose of morphine (20 or 30 μmol/kg) in mice pretreated ip with saline or increasing doses of M3G (80 and 500 μmol/kg in panels A and B or 80, 240 and 500 μmol/kg in panels C and D). Control groups receiving two doses of saline are also shown in panels B and D. M3G was given30 min before morphine injections. The left panels show the time course change of the different pretreatment groups in mean distance travelled per 5 min at each 5‐mininterval following injections with 20 μmol/kg (A) or 30 μmol/kg (C) morphine respectively. The time scales are given in relation to the moment of morphine injections.Locomotor activity results during the 90‐min habituation period and S.E.M. bars were omitted for clarity. In the right panels the total sum of locomotor activity during180 min following injection with 20 μmol/kg (B) or 30 μmol/kg (D) morphine respectively are shown. The activities of the first 60 min following morphine injectionare indicated with a different fill pattern of each bar. Each bar represents mean activity±S.E.M. (n = 9–10). Panel B one‐way ANOVA (180 min); F(2, 25) = 1.36 (p= 0.28) and one‐way ANOVA (60 min); F(2, 25) = 3.15 (p = 0.062). Panel D one‐way ANOVA (180 min); F(3, 35) = 1.189 (p = 0.33) and one‐way ANOVA (60 min);F(3, 35) = 3.13 (p = 0.038) followed by post hoc analysis (Bonferroni) comparing saline pretreatment with M3G pretreatment. ⁎p < 0.05.
580 M. Handal et al. / Pharmacology, Biochemistry and Behavior 86 (2007) 576–586
observed following the M3G pretreatment dose of 240 μmol/kgand increasing this dose to 500 μmol/kg did not result in a furtherincrease in locomotor activity. The shape of the effect time curve(Fig. 4C) following this treatment was also somewhat differentfrom the other curves, with a lower effect maximum and asomewhat longer duration of the locomotor activity.
3.6. Serum and brain concentrations in M6G (20 μmol/kg)treated mice
Following pretreatment with 500 μmol/kg M3G there was anincrease in M6G serum and brain concentrations compared to thesaline pretreated controls (Fig. 5A and C). This was also reflectedinM3Gpretreatment increasing theAUCs of both theM6G serumand brain concentration time curves compared to saline pretreat-ment (Table 2). However, the M3G pretreatment did not seem to
change the ratio between AUC of the M6G concentration timecurves in brain divided by the corresponding AUC in serumwhencompared to the saline pretreatment, the AUC ratio (brain/serum)being of the same order of magnitude (Table 2).
Contrary to what was observed in the morphine treated micethe M3G concentrations in the brain remained higher than M6Gbrain concentrations during the whole experiment (Fig. 3C andD compared to Fig. 5C and D).
No M3G (Table 2) or morphine was detected in serum orbrain in the M6G treated mice pretreated with saline.
3.7. Relation between M6G concentration and inducedlocomotor activity
The magnitude of the increase in M6G serum and brainconcentrations when the M6G dose was increased from 20 to

Fig. 3. Left panels showmorphine serum (A) and brain (C) concentrations versus time curves in mice pretreated with saline orM3G (500 μmol/kg) ip 30 min before a scbolus dose of morphine (20 μmol/kg). Right panels showM3G serum (B) and brain (D) concentrations in the same treatment groups. Results are mean concentrations±S.E.M. (n = 4–5). Regression analysis: panel A, effect of pretreatment; unstandardized coefficient = 0.18 (CI = 0.04–0.33), p = 0.016. Panel B, effect of pretreatment;unstandardized coefficient = 124 (CI = 87–162), p < 0.001. Panel C, effect of pretreatment; unstandardized coefficient = − 0.01 (CI = − 0.04–0.01), n.s.
581M. Handal et al. / Pharmacology, Biochemistry and Behavior 86 (2007) 576–586
30 μmol/kg M6G is shown in Fig. 6A and C. Following30 μmol/kg M6G the AUC in serum was nearly the double ofthe AUC following 20 μmol/kg M6G (Table 3). In brain the
Table 1Area under the curve (AUC) of the concentration time curves (0–180 min) in serummice pretreated with either M3G (500 μmol/kg) or saline 30 min before morphine i
Concentrations timecurves of:
Morphine (M)
AUCmean (AUCmin–AUCmax) AUC ratio a
(M3G M/saliM3G M Saline M
Serum (μmol⋅min)/l 178 (159–198) 153 (147–159) 1.2Brain (nmol⋅min)/g 45 (43–48) 47 (44–49) 1.0AUC ratio a (brain/serum) 0.25 0.31
AUCmean was calculated based on mean concentrations (Cmean) at each time point.AUCmin was calculated based on Cmean − SEM at each time point.AUCmax was based on Cmean + SEM at each time point.a Ratios were based on AUCmean values.b Not detected.
corresponding increase in AUC was 1.6 (Table 3). The M6Ginduced locomotor activity following the higher dose(30 μmol/kg) was increased to approximately 800% of the
and brain of morphine and M3G respectively in morphine (20 μmol/kg) treatednjection
M3G
ne M)AUCmean (AUCmin–AUCmax) AUC ratio a
(M3G M/saline M)M3G M Saline M
14,550 (12,571–16,529) 755 (635–875) 1982 (63–101) n.d. b –

Fig. 4. Locomotor activity induced by a sc bolus dose of M6G (20 or 30 μmol/kg) in mice pretreated ip with saline or increasing doses of M3G (80 and 500 μmol/kg inpanels A and B or 80, 240 and 500 μmol/kg in panels C and D). Control groups receiving two doses of saline are also shown in panels B and D. Pretreatment was given30 min before M6G injections. The left panels show the time course change of the different pretreatment groups in mean distance travelled per 5 min at each 5‐mininterval following injections with 20 μmol/kg (A) or 30 μmol/kg (C) M6G respectively. The time scales are given in relation to the moment of M6G injections.Locomotor activity results during the 90‐min habituation period and S.E.M. bars were omitted for clarity. In the right panels the total sum of locomotor activity duringthe first 180 min following injection with 20 μmol/kg (B) or 30 μmol/kg (D) M6G respectively are shown. Each bar represents mean activity±S.E.M. (n = 9–10).Panel B one‐way ANOVA; F(2, 24) = 4.58 (p = 0.02) followed by post hoc analysis (Bonferroni) comparing saline pretreatment with M3G pretreatment. Panel D one‐way ANOVA; F(3, 34) = 3.95 (p = 0.02) followed by post hoc analysis (Bonferroni) comparing saline pretreatment with M3G pretreatment. ⁎p < 0.05.
582 M. Handal et al. / Pharmacology, Biochemistry and Behavior 86 (2007) 576–586
locomotor activity induced by the lower dose (20 μmol/kg)(Fig. 6B and D).
4. Discussion
We found that M3G, although inactive as a locomotoractivity agonist when administered alone, influenced thelocomotor activity induced by both morphine and M6G, butin opposite directions. M3G antagonized the locomotor activityof morphine in a dose dependent manner, but gave no reductionin morphine brain concentrations. This indicated that themechanism behind the antagonism was of a pharmacodynamictype. M3G potentiated the locomotor activity of M6G.Simultaneously both the serum and brain concentrations ofM6G were increased, and the observed increase in locomotoractivity could well be explained by the increased brainconcentrations. This indicated that the M3G potentiation of
M6G induced locomotor activity was mainly due to apharmacokinetic interaction.
The reduction in morphine induced locomotor activity wasmost pronounced during the first hour of the registration period.This corresponded with the time period when the M3Gconcentrations were higher than the morphine concentrationsin brain. This supports that there was some kind ofpharmacodynamic antagonistic relationship between M3G andmorphine respectively.
To our knowledge, there are no other studies on M3G‐morphine interaction regarding psychomotor stimulatingeffects. However, M3G has been shown to antagonize morphineanalgesia in animals (Smith et al., 1990; Gong et al., 1992;Ekblom et al., 1993), although this antagonism has not beenshown by others (Suzuki et al., 1993; Ouellet and Pollack,1997). It has even been reported that M3G increased andprolonged the analgesic effect of morphine in rats (Lipkowski

Fig. 5. Left panels show M6G serum (A) and brain (C) concentrations versus time curves in mice pretreated with saline or M3G (500 μmol/kg) ip 30 min before a scbolus dose of M6G (20 μmol/kg). Right panels show M3G serum (B) and brain (D) concentrations in the same treatment groups. Results are mean concentrations±S.E.M. (n = 3–5). Regression analysis: panel A, effect of pretreatment; unstandardized coefficient = 2.5 (CI = 1.5–3.5), p < 0.001. Panel C, effect of pretreatment;unstandardized coefficient = 0.02 (CI = 0.01–0.03), p < 0.001.
583M. Handal et al. / Pharmacology, Biochemistry and Behavior 86 (2007) 576–586
et al., 1994). Two small clinical trials in humans did not showantagonism of M3G on morphine analgesic or respiratorydepressive effects (Penson et al., 2000; Penson et al., 2001). Allof these groups, however, have studied interactions in pain and/or respiration models.
M3G has a very low affinity for opioid receptors (Pasternaket al., 1987). However, Halliday et al. showed that the selectiveμ‐opioid receptor antagonist, beta‐funaltrexamine, reduced theexcitatory effects of M3G (Halliday et al., 1999). This indicatesthat at least some of M3G's effects are mediated through theμ‐opioid receptor. An interaction at this receptor might thereforebe a possible explanation of the observed interaction in ourstudy.
M3G has been shown to cause dose dependent behavioralexcitation when administered to rats or mice by the intrathecal(Yaksh and Harty, 1988) or intracerebroventricular routes(Smith et al., 1990). The increasing M3G doses in the presentstudy resulted in very high concentrations in the brain. Despitethis we observed no change in any conceivable behavior withrespect to neuroexcitatory effects when compared with saline.
Contrary to what we found regarding the M3G‐morphineinteraction, pretreatment with M3G increased the M6Ginduced locomotor activity during the whole registrationperiod. At the same time pretreatment with M3G resulted inan increase in serum and brain concentrations of M6G. Toexplore whether this increase in brain concentrations couldexplain the observed increase in locomotor activity, we com-pared the effects of two doses of M6G from the steep part ofthe sigmoid shaped dose response curve. Increasing the M6Gdose from 20 to 30 μmol/kg resulted in a 1.6 times increase in theAUC of the brain concentration time curve and a corresponding7 times increase locomotor activity. Based on this one wouldexpect that the observed AUC of the brain concentration timecurves ratio (M3G pretreatment/saline pretreatment) of 1.3would result in a corresponding locomotor activity increase of atleast 3 times as observed. This indicated that the M3G–M6Ginteraction was mainly of a pharmacokinetic type.
A conceivable reason for the increase in serum M6Gconcentrations might be that M3G interfered with the systemicexcretion of M6G in the kidneys or into the bile. The most

Table 2Area under the curve (AUC) of the concentration time curves (0–180 min) in serum and brain of M6G and M3G respectively in M6G (20 μmol/kg) treated micefollowing pretreatment with either M3G (500 μmol/kg) or saline 30 min before M6G injection
Concentrations timecurves of:
M6G M3G
AUCmean (AUCmin–AUCmax) AUC ratio a
(M3G M6G/saline M6G)AUCmean (AUCmin–AUCmax)
M3G M6G Saline M6G M3G M6G Saline M6G
Serum (μmol⋅min)/l 955 (827–1083) 665 (613–717) 1.4 15,727 (13,773–17,680) n.d. b
Brain (nmol⋅min)/g 11 (10–12) 8.6 (8.0–9.2) 1.3 200 (178–222) n.d. b
AUC ratio a (brain/serum) 0.012 0.014
AUCmean was calculated based on mean concentrations (Cmean) at each time point.AUCmin was calculated based on Cmean−SEM at each time point.AUCmax was based on Cmean+SEM at each time point.a Ratios were based on AUCmean values.b Not detected.
584 M. Handal et al. / Pharmacology, Biochemistry and Behavior 86 (2007) 576–586
probable explanation would be a competition for a commonsecretion mechanism. Both p‐glycoprotein (MDR1) (Letrentet al., 1998; Lotsch et al., 2002; Bourasset et al., 2003;
Fig. 6. The left panels showM6G serum (A) and brain (C) concentrations versus timekg). Results are mean concentrations±S.E.M and n = 3–5 unless at 180 min where n =(CI = 4.3–8.3), p < 0.001. Panel C, effect of dose; unstandardized coefficient = 0.03same mice as in panels A and C. Panel B shows the time course change of the two diffalive at that time at each 5-min interval following the M6G injections. The time scaresults during the 90-min habituation period were omitted for clarity. Panel D shows th20 or 30 μmol/kg respectively. Because of the nature of the data no statistical analy
Bourasset and Scherrmann, 2005), multidrug resistance protein3 (Mrp3) (Zelcer et al., 2005) and the organic anion transporters(Oats) (Xie et al., 2000; Tunblad et al., 2005) have been studied.
curves in mice treated sc with two different bolus doses of M6G (20 and 30 μmol/1. Regression analysis: panel A, effect of dose; unstandardized coefficient = 6.3
(CI = 0.01–0.05), p = 0.002. The right panels show the locomotor activity of theerent M6G doses as the mean total distance travelled per 5 min of the animals stillles are given in relation to the moment of M6G injections. Locomotor activitye total sum of locomotor activity during 180 min followingM6G injections withses were preformed on data from panel D.

Table 3Area under the curve (AUC) of the concentration time curves (0–180 min) inserum and brain of M6G following injection of either 20 or 30 μmol/kg M6G
Concentrationstime curves of:
AUCmean (AUCmin–AUCmax) AUC ratio a
(M6G 30/M6G 20)M6G (20) M6G (30)
Serum(μmol⋅min)/l
835 (750–920) 1557 (1388–1727) 1.9
Brain(nmol⋅min)/g
8.1 (7.3–8.9) 12 (9.8–15) 1.6
AUC Ratio a
(brain/serum)0.010 0.008
AUCmean was calculated based on mean concentrations (Cmean) at each timepoint.AUCmin was calculated based on Cmean−SEM at each time point.AUCmax was based on Cmean+SEM at each time point.a Ratios were based on AUCmean values.
585M. Handal et al. / Pharmacology, Biochemistry and Behavior 86 (2007) 576–586
However, it is not unambiguously determined which transpor-ters that move morphine glucuronides across biologicalmembranes.
In conflict with the above suggestions of an active transportof morphine glucuronides in the kidneys, it has been reportedthat this was not the case in isolated rat kidney (Van Crugten etal., 1991). This does not exclude a competition in other parts ofthe systemic elimination of the glucuronides.
The observed increase in M6G brain concentrations could beconsidered secondary to the increased serum concentrations, orit could be considered a result of a competition on a transportmolecule in the BBB. Various groups have reported that bothM6G and M3G brain concentrations largely depended upon therespective serum or plasma levels (Tunblad et al., 2005; Zelceret al., 2005). We observed similar AUC ratios (brain/serum) ofM6G in the M3G and saline pretreated mice respectively,indicating that M3G did not affect the BBB transport of M6G.This is in agreement with the difficulty in finding unambiguousevidence for a common M3G and M6G transporter in the BBB.
Our results do not exclude the possibility that in addition to apharmacokinetic interaction there is a component of apharmacodynamic antagonism of M3G on the M6G inducedlocomotor activity. Few other groups have studied theinteraction between M3G and M6G. Gong et al. reported thatM3G might functionally antagonize M6G induced antinocicep-tion and ventilatory depression in rats (Gong et al., 1992), butlack of antagonism has also been reported (Suzuki et al., 1993).
We used pretreatment with rather high M3G doses. Asshown in both serum and brain concentrations the pretreatmentwith the highest M3G dose, reached concentrations far abovewhat was observed when M3G was formed as a metabolite.However, our results demonstrate that the lower doses gavesimilar although less pronounced effects. We also showed thatthe effects of M3G would depend on the concentration of theinteracting opiate. Thus a low dose of M3G could possiblyinteract markedly with the effects of a low concentration ofeither morphine or M6G.
The high M3G pretreatment dose resulted in a ratio in serumof M3G to morphine of about 80 which is very high. In contrastthe same ratio in the saline pretreated mice was five. Route of
administration, renal function and age are some factors that mayinfluence the ratio. We have earlier reported that morphineadministered by different routes of administration to C57BLmice resulted in ratios from 4.6 to 10.5 (Handal et al., 2002).Faura et al. did a systematic review of factors affecting the ratioof morphine and its major metabolites and reported that acrossall studies the M3G to morphine ratio in humans varied from0.001–504 (Faura et al., 1998).
The amount of serum needed for the HPLC analysis in thepharmacokinetic parts of this study did not allow us to takeserial blood samples of each mouse. This makes it impossible tofollow the fate of each substance in one animal. Consequentlywe had to use mean serum concentrations from several animalsper time point to draw the concentration time curve. This makesstatistical analysis of the AUC data very difficult. The AUCvalues, however, give a reasonable estimate of the magnitude ofchange in concentrations.
In conclusion our results point at complicated interactionsbetween morphine, its main metabolite M3G, which itself doesnot induce locomotor activity, and its active metabolite M6Gwith respect to induction of locomotor activity and possiblymechanisms related to drug reward and reinforcement. M3Gantagonize the morphine induced locomotor activity, butpotentiate the M6G induced locomotor activity. The M3G–morphine interaction was of a pharmacodynamic type, while theM3G–M6G interaction mainly was of a pharmacokinetic type.This complexity makes it more difficult to predict theconsequences of an increase in M3G concentrations, thanwould have been the case if M3G had influenced the effects ofthe parent drug (morphine) and the active metabolite (M6G) inthe same direction.
Acknowledgments
This work was supported by a grant (128575/330) from thedivision of Medicine and Health of the Research Council ofNorway.
References
Aasmundstad TA, Morland J, Paulsen RE. Distribution of morphine 6‐glucuronide and morphine across the blood‐brain barrier in awake, freelymoving rats investigated by in vivo microdialysis sampling. J PharmacolExp Ther 1995;275:435–41.
Bourasset F, Cisternino S, Temsamani J, Scherrmann JM. Evidence for an activetransport of morphine‐6‐beta‐d‐glucuronide but not P‐glycoprotein‐mediated at the blood–brain barrier. J Neurochem. 2003;86:1564–7.
Bourasset F, Scherrmann JM. Carrier‐mediated processes at several rat braininterfaces determine the neuropharmacokinetics of morphine and morphine‐6‐beta‐D‐glucuronide. Life Sci 2005.
Carrupt PA, Testa B, Bechalany A, el Tayar N, Descas P, Perrissoud D.Morphine 6‐glucuronide and morphine 3‐glucuronide as molecularchameleons with unexpected lipophilicity. J Med Chem 1991;34:1272–5.
Ekblom M, Gardmark M, Hammarlundudenaes M. Pharmacokinetics andpharmacodynamics of morphine‐3‐glucuronide in rats and its influence onthe antinociceptive effect of morphine. Biopharm Drug Dispos 1993;14:1–11.
Faura CC, Collins SL, Moore RA, McQuay HJ. Systematic review of factorsaffecting the ratios of morphine and its major metabolites. Pain 1998;74:43–53.

586 M. Handal et al. / Pharmacology, Biochemistry and Behavior 86 (2007) 576–586
Gong QL, Hedner J, Bjorkman R, Hedner T. Morphine‐3‐glucuronide mayfunctionally antagonize morphine‐6‐glucuronide induced antinociceptionand ventilatory depression in the rat. Pain 1992;48:249–55.
Grung M, Skurtveit S, Aasmundstad TA, Handal M, Alkana RL, Morland J.Morphine‐6‐glucuronide‐induced locomotor stimulation in mice: role ofopioid receptors. Pharmacol Toxicol 1998;82:3–10.
Grung M, Skurtveit S, Ripel A, Morland J. Lack of crosstolerance betweenmorphine and morphine‐6‐glucuronide as revealed by locomotor activity.Pharmacol Biochem Behav 2000;66:205–10.
Halliday AJ, Bartlett SE, Colditz P, Smith MT. Brain region‐specific studies ofthe excitatory behavioral effects of morphine‐3‐glucuronide. Life Sci1999;65:225–36.
Handal M, Grung M, Skurtveit S, Ripel A, Morland J. Pharmacokineticdifferences of morphine and morphine‐glucuronides are reflected inlocomotor activity. Pharmacol Biochem Behav 2002;73:883–92.
Joyce EM, Iversen SD. The effect of morphine applied locally to mesencephalicdopamine cell bodies on spontaneous motor activity in the rat. Neurosci Lett1979;14:207–12.
Letrent SP, Pollack GM, Brouwer KR, Brouwer KL. Effect of GF120918, apotent P‐glycoprotein inhibitor, on morphine pharmacokinetics andpharmacodynamics in the rat. Pharm Res 1998;15:599–605.
Lipkowski AW, Carr DB, Langlade A, Osgood PF, Szyfelbein SK. Morphine‐3‐glucuronide: silent regulator of morphine actions. Life Sci 1994;55:149–54.
Lotsch J, Schmidt R, Vetter G, Schmidt H, Niederberger E, Geisslinger G, et al.Increased CNS uptake and enhanced antinociception of morphine‐6‐glucuronide in rats after inhibition of P‐glycoprotein. J Neurochem 2002;83:241–8.
Milne RW, Nation RL, Somogyi AA. The disposition of morphine and its 3‐ and6‐glucuronide metabolites in humans and animals, and the importance of themetabolites to the pharmacological effects of morphine. Drug Metab Rev1996;28:345–472.
Morland J, Jones BL, Palomares ML, Alkana RL. Morphine‐6‐glucuronide: apotent stimulator of locomotor activity in mice. Life Sci 1994;55:L163–8.
Osborne R, Joel S, Trew D, Slevin M. Morphine and metabolite behavior afterdifferent routes of morphine administration: demonstration of the impor-tance of the active metabolite morphine‐6‐glucuronide. Clin Pharmacol Ther1990;47:12–9.
Ouellet DM, Pollack GM. Effect of prior morphine‐3‐glucuronide exposure onmorphine disposition and antinociception. Biochem Pharmacol 1997;53:1451–1457.
Pasternak GW, Bodnar RJ, Clark JA, Inturrisi CE. Morphine‐6‐glucuronide, apotent mu agonist. Life Sci 1987;41:2845–9.
Penson RT, Joel SP, Bakhshi K, Clark SJ, Langford RM, Slevin ML.Randomized placebo‐controlled trial of the activity of the morphineglucuronides. Clin Pharmacol Ther 2000;68:667–76.
Penson RT, Joel SP, Clark S, Gloyne A, Slevin ML. Limited phase I study ofmorphine‐3‐glucuronide. J Pharm Sci 2001;90:1810–6.
Sawe J, Kager L, Svensson Eng JO, Rane A. Oral morphine in cancer patients:in vivo kinetics and in vitro hepatic glucuronidation. Br J Clin Pharmacol1985;19:495–501.
Smith MT, Watt JA, Cramond T. Morphine‐3‐glucuronide—a potent antagonistof morphine analgesia. Life Sci 1990;47:579–85.
Suzuki N, Kalso E, Rosenberg PH. Intrathecal morphine‐3‐glucuronide does notantagonize spinal antinociception by morphine or morphine‐6‐glucuronidein rats. Eur J Pharmacol 1993;249:247–50.
Svensson JO. Determination of morphine, morphine‐6‐glucuornide andnormorphine in plasma and urine with high‐performance liquid chromato-graphy and electrochemical detection. J Chromatogr 1986;375:174–8.
Svensson JO, Rane A, Sawe J, Sjoqvist F. Determination of morphine,morphine‐3‐glucuronide and (tentatively) morphine‐6‐glucuronide inplasma and urine using ion‐pair high‐performance liquid chromatography.J Chromatogr 1982;230:427–32.
Tunblad K, Hammarlund‐Udenaes M, Jonsson EN. Influence of probenecid onthe delivery of morphine‐6‐glucuronide to the brain. Eur J Pharm Sci2005;24:49–57.
Van Crugten JT, Sallustio BC, Nation RL, Somogyi AA. Renal tubular transportof morphine, morphine‐6‐glucuronide, and morphine‐3‐glucuronide in theisolated perfused rat kidney. Drug Metab Dispos 1991;19:1087–92.
Xie R, Bouw MR, Hammarlund‐Udenaes M. Modelling of the blood–brainbarrier transport of morphine‐3‐glucuronide studied using microdialysis inthe rat: involvement of probenecid‐sensitive transport. Br J Pharmacol2000;131:1784–92.
Yaksh TL, Harty GJ. Pharmacology of the allodynia in rats evoked by high doseintrathecal morphine. J Pharmacol. Exp Ther 1988;244:501–7.
Yaksh TL, Harty GJ, Onofrio BM. High dose of spinal morphine produce anonopiate receptor‐mediated hyperesthesia: clinical and theoretic implica-tions. Anesthesiology. 1986;64:590–7.
Yeh SY, McQuinn RL, Gorodetzky CW. Biotransformation of morphine todihydromorphinone and normorphine in the mouse, rat, rabbit, guinea pig,cat, dog, and monkey. Drug Metab Dispos 1977;5:335–42.
Zelcer N, van de WK, Hillebrand M, Sarton E, Kuil A, Wielinga PR, et al.Mice lacking multidrug resistance protein 3 show altered morphinepharmacokinetics and morphine‐6‐glucuronide antinociception. Proc NatlAcad Sci U S A 2005;102:7274–9.