Embed Size (px)
Citation preview

Prep
ared
By:
End
o En
gine
erin
gA
pril
2013
Mor
ongo
Out
doo
r E
nter
tain
men
t Fa
cilit
yM
oron
go O
utd
oor
Ent
erta
inm
ent
Faci
lity
Mor
ongo
Out
doo
r E
nter
tain
men
t Fa
cilit
yM
oron
go O
utd
oor
Ent
erta
inm
ent
Faci
lity
Mor
ongo
Out
doo
r E
nter
tain
men
t Fa
cilit
yM
oron
go O
utd
oor
Ent
erta
inm
ent
Faci
lity
Mor
ongo
Out
doo
r E
nter
tain
men
t Fa
cilit
yM
oron
go O
utd
oor
Ent
erta
inm
ent
Faci
lity
Mor
ongo
Out
doo
r E
nter
tain
men
t Fa
cilit
yM
oron
go O
utd
oor
Ent
erta
inm
ent
Faci
lity
Mor
ongo
Out
doo
r E
nter
tain
men
t Fa
cilit
yM
oron
go O
utd
oor
Ent
erta
inm
ent
Faci
lity
Mor
ongo
Out
doo
r E
nter
tain
men
t Fa
cilit
yM
oron
go O
utd
oor
Ent
erta
inm
ent
Faci
lity
Mor
ongo
Out
doo
r E
nter
tain
men
t Fa
cilit
yA
ir Q
ualit
y Im
pac
t S
tud
yA
ir Q
ualit
y Im
pac
t S
tud
yA
ir Q
ualit
y Im
pac
t S
tud
yA
ir Q
ualit
y Im
pac
t S
tud
yA
ir Q
ualit
y Im
pac
t S
tud
yA
ir Q
ualit
y Im
pac
t S
tud
yA
ir Q
ualit
y Im
pac
t S
tud
yA
ir Q
ualit
y Im
pac
t S
tud
yA
ir Q
ualit
y Im
pac
t S
tud
yA
ir Q
ualit
y Im
pac
t S
tud
yA
ir Q
ualit
y Im
pac
t S
tud
yA
ir Q
ualit
y Im
pac
t S
tud
yA
ir Q
ualit
y Im
pac
t S
tud
yA
ir Q
ualit
y Im
pac
t S
tud
yA
ir Q
ualit
y Im
pac
t S
tud
yM
oron
go O
utd
oor
Ent
erta
inm
ent
Faci
lity
Air
Qua
lity
Imp
act
Stu
dy


i
Table of Contents
Section Title Page
1.0 INTRODUCTION .......................................................................... 1-1
2.0 PROJECT DESCRIPTION ........................................................... 2-1- Project Location- Project Description- Surrounding Land Uses
3.0 EXISTING AIR QUALITY .......................................................... 3-1- Air Pollution Fundamentals- Regional Climate and Air Quality- Local Climate and Air Quality- Existing Sensitive Receptors- Local Sources of Air Contaminants- Regulatory Setting
4.0 AIR QUALITY CONSEQUENCES ............................................. 4-1- Methodology- NEPA Impact Significance Considerations- Short-Term Construction Impacts- Long-Term Operational Impacts- Consistency With Regional Air Quality Plans- Cumulative Impacts
5.0 AIR QUALITY MITIGATION MEASURES............................... 5-1
6.0 REFERENCES.............................................................................. 6-1
APPENDICES
A. List of Acronyms and Air Quality GlossaryB. Standards, Health Effects, Wind Rose, Air Monitoring DataC. CalEEMod Assumptions and WorksheetsD. CALINE4 Assumptions and Worksheets
ii
List of Figures
Number Title Following Page
2-1 Regional Map .................................................................................. 2-1
2-2 Vicinity Map ................................................................................... 2-1
2-3 Conceptual Site Development Plan ................................................. 2-1
3-1 Southern California Air Basinsand Federal Planning Areas ............................................................ 3-1
3-2 Maximum Ozone Concentration Trendsin the South Coast Air Basin............................................................ 3-13
3-3 Days in 2011 Exceeding Current FederalEight-Hour Ozone Standard in the SCAB ...................................... 3-13
3-4 Maximum Annual Average Particulate Matter Trendsin the South Coast Air Basin............................................................ 3-13
3-5 Criteria Pollutant Design Valuesin the SCAB and the Coachella Valley............................................. 3-13
3-6 Banning Airport Ozone Data ........................................................... 3-17
3-7 Banning PM10 Data ........................................................................ 3-17

iii
List of Tables
Number Title Page
2-1 Summary of Proposed Project Components ................................... 2-2
2-2 Project-Related Daily Trip GenerationBy Event Type ................................................................................ 2-4
3-1 NAAQS Attainment Status – South Coast Air Basin....................... 3-7
3-2 NAAQS Attainment Status – Coachella Valley Portionof the Salton Sea Air Basin.............................................................. 3-8
3-3 California Air Resources Board 2011Attainment Classifications ............................................................... 3-9
3-4 Health Effects of Air Pollutants ...................................................... 3-11
4-1 General Conformity De Minimis Levels ......................................... 4-5
4-2 Unmitigated Annual Average Air Pollutant EmissionsAssociated With Construction of the Proposed Project .................. 4-10
4-3 Unmitigated Annual Average Air Pollutant EmissionsAssociated With the Operation of the Proposed Project .................. 4-14
4-4 Project-Related Annual AverageOperational Greenhouse Gas Emissions.......................................... 4-15
4-5 Projected Future Carbon Monoxide Concentrations Nearthe Intersection of Thunder Road and Seminole Drive..................... 4-17

1-1
1.0 INTRODUCTION
This air quality impact analysis was prepared to comply with the National Environmental PolicyAct1 (NEPA) and the Bureau of Indian Affairs (BIA) NEPA Guidebook, 30 BIAM Supplement 1.The purpose of this study was to assess the air quality impacts associated with an outdoorentertainment facility proposed on a 310-acre site located within the Morongo Band of MissionIndians Reservation in Southern California. The project site is in the rural community of Cabazon,north of Interstate 10, within the Banning Pass which connects the metropolitan Los Angeles basinto the Coachella Valley in the neighboring Riverside County.
The existing air quality in the study area is described as well as the legislative setting in terms ofapplicable federal, tribal, state and local air quality regulations. Temporary short-term construction-related emissions are evaluated. Potential local and regional air quality impacts associated with thelong-term operation of the proposed project are assessed. Mitigation measures that could minimizeair pollutant emissions and reduce potential air quality impacts are identified. The focus of theanalysis is the emissions of criteria pollutants (i.e. those pollutants for which ambient air qualitystandards have been established to protect human health and the environment).
Local impacts on air quality are evaluated by modeling carbon monoxide concentrations in theproject vicinity. The analysis demonstrates how air pollutant concentrations in the immediatevicinity of the site access roadways are expected to change over a one-hour averaging period andover an eight-hour averaging period.
Potential future emissions of greenhouse gases are estimated based upon the projected combustionof fossil fuels during the construction and operation of the facility. The effects of greenhouse gasemissions on climate change are discussed briefly.
Project-related emissions of hazardous and toxic air contaminants are assessed. The potentialimpacts of toxic emissions on public health and sensitive receptors are discussed.
This report was prepared for use in the preparation of an Environmental Assessment required underNEPA. The Morongo Band of Mission Indians is the lead NEPA agency. The Bureau of IndianAffairs will review the analysis to ensure that it meets all applicable requirements including thoseestablished by the United States Environmental Protection Agency (U.S. EPA) General ConformityRule.
1 40CFR § 1500-1508

2-1
2.0 PROJECT LOCATION AND DESCRIPTION
2.1 PROJECT LOCATION
The 310-acre undeveloped project site is located on the Morongo Indian Reservation, which isFederal land held in trust on behalf of the Morongo Band of Mission Indians (the Tribe) inRiverside County, California. The Reservation covers approximately 35,000 acres located bothnorth and south of Interstate 10 in the Banning Pass, near the community of Cabazon. The projectarea is located immediately north of Interstate 10 and east of Apache Trail within Section 8 andSection 9, Township 3 South, Range 2 East, San Bernardino Meridian, as depicted on the CabazonU.S.G.S. 7.5’ Quad Map.
The project site is located north of Interstate 10 and the community of Cabazon, entirely within theMorongo Band of Mission Indians Sovereign Nation Land. It is, surrounded by the County ofRiverside, and strategically located between the Coachella Valley (to the east) and the metropolitanareas of Los Angeles, Riverside, and San Bernardino County (to the west). The site is situatedbetween the Interstate 10 interchanges at Morongo Trail/Apache Trail and at Main Street. Figure 2-1 (Regional Location) illustrates the project site in its regional context.
The project site is located east of the Morongo Casino Resort and Spa and north of the CanyonLanes at Morongo Bowling Alley, as shown in Figure 2-2 (Vicinity Map). The site extends northof Seminole Drive on both sides of Millard Pass Road. Millard Pass Road is a north/south dirtroad aligned between Section 8 and Section 9 that provides access for service vehicles to a five-acreparcel surrounded by the project site with a reservoir and water well operated by the Cabazon WaterCompany. The 5-acre parcel is not a part of the proposed project.
2.2 EXISTING LAND USE
Morongo’s areas of Indian country encompass more than 35,000 acres where more than 1,500tribal members live. The Morongo Reservation is primarily rural in character, with low-densityresidential and agricultural land uses. The Morongo Casino Resport and Spa, the Morongo TravelCenter (a gasoline and diesel fuel dispensing facility with 36 pumps), the Cabazon Outlets, theDesert Hills Premium Outlets, and other commercial and Tribal enterprises are located adjacent toInterstate 10 along Seminole Drive, east of Banning, in the vicinity of the Cabazon community.
Existing sources of ozone precursor emissions within the tribal boundaries include the MorongoCasino Resort and Spa cogeneration facility. This facility has a Title V operating permit whichlimits the 8.4 megawatt facility’s potential to emit from the four natural gas-fired engines and threediesel-fired backup generators to less than 18.7 tons per day of NOx emissions and less than 18.7tons per day of VOC emissions.
The project site is currently used for cattle grazing. It is bounded or crossed by utility corridorswhich include: (1) electrical transmission lines, (2) gas/oil lines to the north, (3) two gas lines thatcross the southerly half of the site. The site surrounds a 5-acre parcel with a reservoir and welloperated by the Cabazon Water Company that is not a part of the proposed development.
2.3 PROJECT DESCRIPTION
The proposed project is an outdoor entertainment venue for music festivals, concerts, and otherrecreational and cultural entertainment events. Figure 2-3 (Conceptual Site Plan) illustrates theproposed location of the various entertainment venues within the 68-acre outdoor entertainment area

Scal
e: 1
" = 1
3.3
Mile
sE
ndo
Eng
inee
ring
62
1510
215
215
10
111
111
371
79
74
215
6091
74
Salto
nSe
a
Figu
re 2
-1Re
gion
al L
ocat
ion
Pro
jec
tS
ite
Des
ert
Hot
Spr
ings
Palm
Sprin
gsCa
thed
ral
City
Ranc
hoM
irage
Palm
Des
ert
Indi
o
Indi
anW
ells
La Qui
nta
Hem
et
Mur
rieta
Hot
Sprin
gs
Lake
Elsi
nore
Caba
zon
Bann
ing
Tem
ecul
a
Sun
CityM
oren
oVa
lley
Rive
rsid
e
*

Mor
ongo
Cas
ino
Reso
rt &
Spa
Cany
on L
anes
Bow
ling
Alle
y
Mai
n St
reet
Inte
rsta
te 1
0
ThunderRoad
MorongoTrail
MorongoTrail
Mor
ongo
Indi
an R
eser
vatio
nM
oron
goIn
dian
Res
erva
tion
Mor
ongo
Trav
elCe
nter
Caba
zon
Com
mun
ityU
nion
Pac
ific
Railr
oad
Not
APa
rt
Mill
ard
Pass
Roa
d(U
npav
ed)
Figu
re 2
-2Vi
cini
ty M
ap
Pro
jec
t S
ite
Millard Pass
Cabaz
onOutle
ts
Sem
inol
eSe
min
ole
Dr.
Driv
e
Scal
e: 1
" = 0
.22
Mile
End
o E
ngin
eeri
ng

Figu
re 2
-3Co
ncep
tual
Site
Dev
elop
men
t Pla
n
2-2
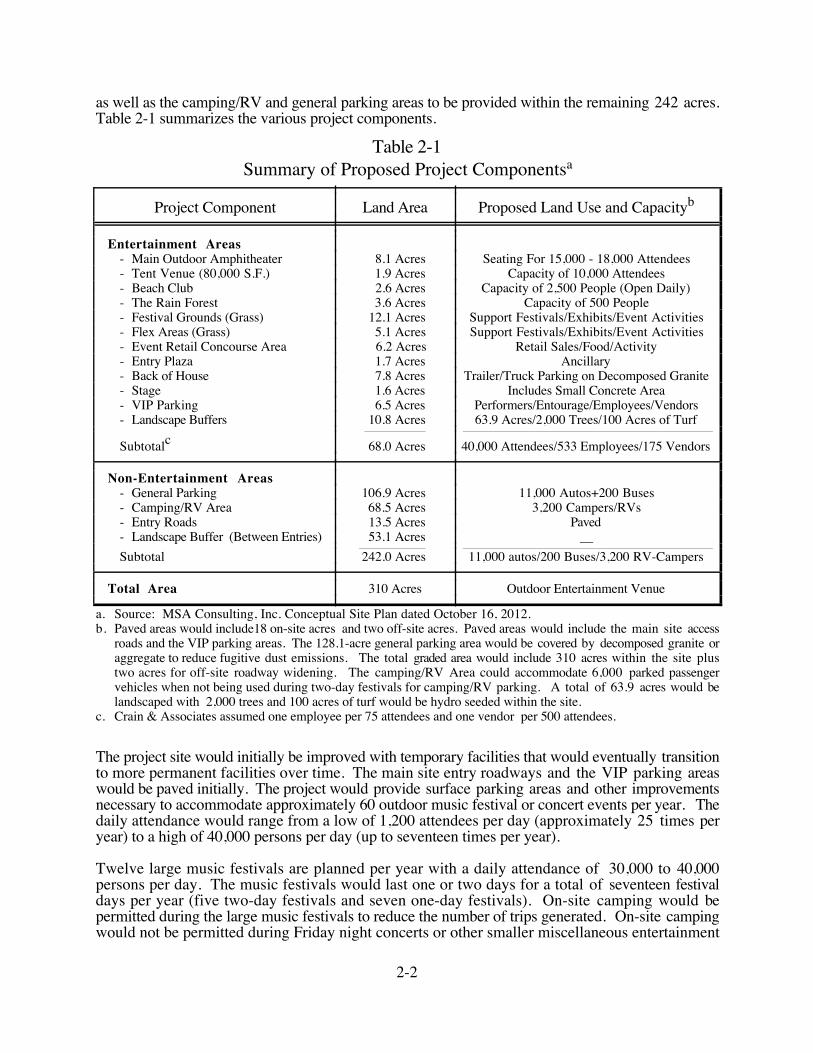
as well as the camping/RV and general parking areas to be provided within the remaining 242 acres.Table 2-1 summarizes the various project components.
Table 2-1Summary of Proposed Project Componentsa
Project Component Land Area Proposed Land Use and Capacityb
Entertainment Areas- Main Outdoor Amphitheater 8.1 Acres Seating For 15,000 - 18,000 Attendees- Tent Venue (80,000 S.F.) 1.9 Acres Capacity of 10,000 Attendees- Beach Club 2.6 Acres Capacity of 2,500 People (Open Daily)- The Rain Forest 3.6 Acres Capacity of 500 People- Festival Grounds (Grass) 12.1 Acres Support Festivals/Exhibits/Event Activities- Flex Areas (Grass) 5.1 Acres Support Festivals/Exhibits/Event Activities- Event Retail Concourse Area 6.2 Acres Retail Sales/Food/Activity- Entry Plaza 1.7 Acres Ancillary- Back of House 7.8 Acres Trailer/Truck Parking on Decomposed Granite- Stage 1.6 Acres Includes Small Concrete Area- VIP Parking 6.5 Acres Performers/Entourage/Employees/Vendors- Landscape Buffers 10.8 Acres 63.9 Acres/2,000 Trees/100 Acres of Turf
_______________________ ______________________________________________________________________________________________
Subtotalc 68.0 Acres 40,000 Attendees/533 Employees/175 Vendors
Non-Entertainment Areas- General Parking 106.9 Acres 11,000 Autos+200 Buses- Camping/RV Area 68.5 Acres 3,200 Campers/RVs- Entry Roads 13.5 Acres Paved- Landscape Buffer (Between Entries) 53.1 Acres __
_________________________ ______________________________________________________________________________________________
Subtotal 242.0 Acres 11,000 autos/200 Buses/3,200 RV-Campers
Total Area 310 Acres Outdoor Entertainment Venue
a. Source: MSA Consulting, Inc. Conceptual Site Plan dated October 16, 2012.b. Paved areas would include18 on-site acres and two off-site acres. Paved areas would include the main site access
roads and the VIP parking areas. The 128.1-acre general parking area would be covered by decomposed granite oraggregate to reduce fugitive dust emissions. The total graded area would include 310 acres within the site plustwo acres for off-site roadway widening. The camping/RV Area could accommodate 6,000 parked passengervehicles when not being used during two-day festivals for camping/RV parking. A total of 63.9 acres would belandscaped with 2,000 trees and 100 acres of turf would be hydro seeded within the site.
c. Crain & Associates assumed one employee per 75 attendees and one vendor per 500 attendees.
The project site would initially be improved with temporary facilities that would eventually transitionto more permanent facilities over time. The main site entry roadways and the VIP parking areaswould be paved initially. The project would provide surface parking areas and other improvementsnecessary to accommodate approximately 60 outdoor music festival or concert events per year. Thedaily attendance would range from a low of 1,200 attendees per day (approximately 25 times peryear) to a high of 40,000 persons per day (up to seventeen times per year).
Twelve large music festivals are planned per year with a daily attendance of 30,000 to 40,000persons per day. The music festivals would last one or two days for a total of seventeen festivaldays per year (five two-day festivals and seven one-day festivals). On-site camping would bepermitted during the large music festivals to reduce the number of trips generated. On-site campingwould not be permitted during Friday night concerts or other smaller miscellaneous entertainment

2-3
events. The Beach Club would be open year round with a capacity of 2,500 persons and an averageoccupancy of 1,500 persons.
SURFACE PARKING PROPOSED
A general surface parking lot proposed would accommodate 11,000 passenger vehicles and 200charter buses. In addition, there would be 3,200 camping/recreational vehicle spaces available foruse during the large two-day music festivals. The general parking areas would be finished withcompacted decomposed granite or similar aggregate material to allow the percolation of rain waterand reduce fugitive dust emissions. During events without camping, the 3,200 camping and RVparking spaces could accommodate up to 6,000 parked passenger vehicles. Camping would not bepermitted in this area except during the large music festivals.
MUSIC FESTIVALS AND OTHER EVENTS PLANNED
The traffic impacts associated with the Morongo Outdoor Entertainment Project were evaluated inthe Draft Traffic Impact Analysis for the Proposed Morongo Outdoor Entertainment Project(Crain & Associates; February, 2013). In addition, Crain & Associates developed a temporal trip-generation forecast by day of the week and hour of the day for a two-day (Saturday and Sunday)music festival with 30,000 to 40,000 attendees as well as a Friday night concert with 20,000attendees. Table 2-2 summarizes the project-related trip generation by event type. The baseassumptions utilized to develop that forecast are discussed below.
A crew would be required on-site for load-in activities prior to music festivals, concerts, and otherlarge events. Approximately ten truck loads per day over a period of five days were assumed todeliver equipment for stage lighting, sound, etc. A crew of workers would also be required to strikethe stage, lights, sound equipment, etc. following festivals and concerts. Ten truck loads per dayover a period of five days were assumed to remove this equipment.
Large Music Festivals
Large music festivals, during which all of the facilities within the site would be active, are expectedto be held twelve times per year. Some of these festivals would last a single day while others wouldlast two days with space on-site made available for Recreational Vehicle (RV) parking and campingfor up to 3,200 attendee vehicles. Large music festivals with all areas on-site active are projected tooccur on a total of seventeen days per year. The daily attendance during large music festival days isprojected to include approximately 30,000 to 40,000 attendees. These events are expected to occuron a combined total of seventeen days per year. Crain & Associates has estimated that the averagetrip length would be 75 miles per trip for attendees and 37 miles per trip for employees andvendors.
Other Events
Many of the events anticipated would use only the main amphitheater, the Beach Club, or the tentvenue. Minor events are expected to occur approximately 25 times per year with approximately1,200 attendees. No overnight on-site camping would be permitted during these events. TheBeach Club would be open daily with a maximum capacity of 2,500 patrons and an annual averageoccupancy of 1,500 patrons per day. After the days when the Beach Club is used for MusicFestivals and Friday night concerts are removed, 307 days per year would remain when the BeachClub could accommodate an average of 1,500 patrons per day.

2-4
Table 2-2Project-Related Daily Trip Generation By Event Typea
Project Component Two-Way Trips Site Use and Capacity Proposedc (Vehicle Occupancy Assumed)b (External)
Two-Day Music Festivals
Weekend Musi c Festival 40,000 Attendees /Day
- Non-Campers (2.5/Vehicle) 48,000 Total 60,000 Attendees (24,000 Vehicles)- RV/Camping Usage (2.5/Vehicle) 8,000 Total 10,000 Attendees (4,000 Vehicles)- Employees (1.15/Vehicle) 3,440 Total 533 Employees/Shift (4.79 Shifts)- Vendors (1.15/Vehicle) 350 Total 160 Vendors/Shift (1.25 Shifts)
___________________________
- Two-Day Festival (5 Times/Year) 59,790 Total 40,000 Saturday + 40,000 Sunday
One Day Music Festivals
Saturday or Sunday Music Fest ival 40,000 Attendees/Day- Non-Campers (2.5/Vehicle) 24,000 Total 30,000 Persons (12,000 Vehicles)- RV/Camping Usage (2.5/Vehicle) 8,000 Total 10,000 Attendees (4,000 Vehicles)- Employees (1.15/Vehicle) 2,460 Total 533 Employees (3 Shifts)- Vendors (1.15/Vehicle) 280 Total 160 Vendors (1 Shift)
___________________________
- One-Day Festival (7 Times/Year) 34,740 Total Capacity Crowd (40,000 Attendees)
Friday Evening Concerts- Non-Campers (2.5/Vehicle) 16,000 Total 20,000 Persons (8,000 Vehicles)- Camping/RV Area Not Allowed Not Allowed- Employees (1.15/Vehicle) 464 Total 267 Employees (One Shift)- Vendors (1.15/Vehicle) 70 Total 40 Vendors (One Shift)
_________________________
Friday & Saturday (16 Times/Year) 16,534 Total 4:00 PM Friday-4:00 AM Saturday
Minor Events
- Beach Club (Open 307 Days/Year) 2,050 Daily 2,500 Capacity (2.5/Vehicle) + Employees1,250 Daily 1,500 Average (2.5/Vehicle) + Employees
- Miscellaneous Events (25/Year) 1,000 Daily 1,200 Attendees (2.5/Vehicle) + Employees
a. Crain & Associates. Draft Traffic Impact Analysis for the Proposed Morongo Outdoor Entertainment Project.February, 2013.
b. Crain & Associates assumed vehicle occupancy factors of 1.15 employees and vendors per vehicle and 2.5attendees per vehicle.
c. The Camping/RV Area could accommodate 6,000 parked passenger vehicles when not being used forcamping/RV parking during two-day festivals. On-site camping would be permitted only during festival eventsand not open for public use at other times.
2.4 CONSISTENCY WITH GENERAL PLAN
The undeveloped project site is not included in The Pass Area Plan or the County of RiversideGeneral Plan. However, the Cabazon Policy Area was based on the Cabazon Community Planadopted in 1998 for 7,490 acres of unincorporated land located north and south of Interstate 10surrounding the project site. This area includes the Cabazon community, which was home toapproximately 2,535 residents at the 2010 census.

2-5
2.5 SURROUNDING LAND USES
The site is currently undeveloped with sparse vegetation. Seminole Drive and Interstate 10 borderthe project site to the south. Undeveloped Morongo Reservation land is located east of the projectsite. The Canyon Lanes at Morongo Bowling Alley is located adjacent to the southwest corner ofthe project site in the former Casino Morongo building. The Morongo Casino, Resort and Spa islocated west of the project site, north of Seminole Drive, and east of Thunder Road. Thisdevelopment includes a 310-room 27-story hotel as well as a landscaped pool and spa complex, afive-story parking structure and surface parking lots. Several rural single-family detached homesare located northwest of Section 8 within Section 6.
The Morongo Travel Center is located west of the site, on the northeast corner of the intersection ofSeminole Drive and Thunder Road. This facility is a 24-hour facility for travelers providing food,gasoline and diesel fuel, and a car wash. A Ruby’s Diner, and Hadley Fruit Orchards retail storeare located on the northwest corner of the intersection of Thunder Road and Seminole Drive. TheCabazon Outlets are located north of Seminole Drive, between Morongo Trail and Millard Pass.There are approximately fifty-five single-family detached residences located north of the CabazonOutlets, between Morongo Trail and Millard Pass. The closest developed residential lot is locatedapproximately one-half mile west of the western site boundary. The Desert Hills Premium Outletsinclude 130 retail stores located north of Seminole Drive and west of Millard Pass.
2.6 CUMULATIVE PROJECTS
Three cumulative developments were identified and evaluated in the traffic impact study. The firstof these projects would include the construction of 93 single-family detached residential dwellingunits. This development would generate approximately 890 weekday trip-ends and 937 daily trip-ends on a typical Saturday.
A 78,000 square foot factory outlet development will be constructed along the north side ofSeminole Drive, west of Apache Trail. This cumulative development would generate 1,867 dailytwo-way trip-ends on a typical weekday and 2,876 daily two-way trip-ends on a typical Saturday.
The third cumulative development is the 158,754 square-foot Desert Hills Premium OutletExpansion Project. This development would generate 3,799 daily two-way trip-ends on a typicalweekday and 5,854 daily two-way trip-ends on a typical Saturday.

3-1
3.0 AFFECTED ENVIRONMENT
Various air quality fundamentals are discussed below including: criteria pollutants, ambient airquality standards, episode criteria, and demonstrated effects of air pollutants on sensitive receptors.This basic information is followed by a discussion of: (1) regional air quality; (2) local ambient airquality; (3) existing sensitive receptor locations in the project vicinity; (4) local sources of aircontaminants; and (5) the regulatory setting. Appendix A includes a list of acronyms and aglossary of technical terms used throughout the air quality analysis.
3.1 AIR POLLUTION FUNDAMENTALS
Air pollution is comprised of many substances generated from a variety of sources, both man-madeand natural. Since the rapid industrialization of the twentieth century, almost every human endeavor,especially those relying on the burning of fossil fuels, creates air pollution. Most contaminants areactually wasted energy in the form of unburned fuels or by-products of the combustion process.
As more people worldwide enjoy modern energy intensive lifestyles, satellites are observing thecontinuous movement of polluted air masses in the form of dusty plumes that cross oceans abovethe marine layer and impact countries other than those that are the source of the polluted air mass.The transport of air pollutants from Asia (and China in particular) may cause or contribute toviolations of health-based ambient air quality standards for particulate matter in California in thefuture. Recent studies indicate that the Asian plume (which is 50% carbonatious, 25% dust and25% sulfate) is already a significant component of the background particulate matter overCalifornia.1
Motor vehicles are by far the most significant source of air pollutants in urban areas, emittingphotochemically reactive hydrocarbons (unburned fuel), carbon monoxide (CO), and oxides ofnitrogen (NOx). These primary pollutants chemically react in the atmosphere with sunlight and thepassage of time to form secondary pollutants such as ozone.
Significant air quality improvements have been made in California as a result of a progression ofstandards that require increasingly cleaner air and improved technology and emission controlprograms. Despite growth in the economy, the population, and vehicle miles traveled, improvementsin ambient air quality have occurred in the South Coast Air Basin (SCAB) since the late 1990s.Ozone and suspended particulate matter with a mean aerodynamic diameter of less than 10micrometers (PM10) represent the major air quality problems in the desert regions of SouthernCalifornia.
The SCAB is the area bounded to the west by the Pacific Ocean, and bounded to the north and eastby the San Gabriel, San Bernardino, and San Jacinto Mountains. This area includes OrangeCounty and the non-desert portions of Los Angeles, Riverside, and San Bernardino Counties. TheSouth Coast Air Quality Management District (SCAQMD) has jurisdiction over the SCAB as wellas the desert portion of Riverside County, where the Coachella Valley is located in the neighboringSalton Sea Air Basin (SSAB). As shown in Figure 3-1, the project site is located in the BanningPass, which connects the SCAB (to the west) to the Coachella Valley (to the east). The CoachellaValley Planning Area is impacted by pollutant transport from the SCAB. The polluted air massflows from the SCAB through the Banning Pass into the Coachella Valley.
1 Presentation of January 22, 2004 by Dr. Vancuren before the California Air Resources Board and Journal of
Geophysical Research; October 2003.

Scal
e: 1
" = 4
4 M
iles
End
o E
ngin
eeri
ng
Pro
jec
tS
ite
*
Figu
re 3
-1So
uthe
rn C
alifo
rnia
Air
Basi
nsan
d Fe
dera
l Pla
nnin
g A
reas
Sour
ce:
SCQA
MD;
Rev
ised
Dra
ft 2
012
Air Q
ualit
y M
anag
emen
t Pla
n; S
epte
mbe
r 201
2.

3-2
The air quality of the Banning Pass and the neighboring Coachella Valley is determined by theprimary pollutant emissions added locally each day and by the primary and secondary pollutantsalready present in the air mass. Primary pollutants are emitted directly from a source. Theyinclude: carbon monoxide, nitric oxide (NO), sulfur dioxide (SO2), particulate matter (PM), andvarious hydrocarbons and other volatile organic compounds (VOC). Secondary pollutants formwithin the air mass through chemical reactions. They include: photochemical oxidants (90% ofwhich are ozone), photochemical aerosols, peroxyacetylnitrate, nitrogen dioxide (NO2), andparticulate matter.
CRITERIA AIR POLLUTANTS
Criteria air pollutants are air contaminants for which ambient air quality standards currently exist.State and federal ambient air quality standards currently exist for: ozone (O3), nitrogen dioxide,sulfur dioxide, carbon monoxide, suspended particulate matter (PM10 and PM2.5), and lead (Pb).California has also set standards for visibility reducing particles, sulfates, hydrogen sulfide andvinyl chloride, none of which are criteria pollutants. Lead and vinyl chloride are toxic aircontaminants with no threshold level determined for adverse health effects.
Carbon Monoxide (CO)
Carbon monoxide is a criteria pollutant that results from the incomplete combustion of fossil fuels.It is a colorless, odorless, toxic gas that interferes with the ability of the blood to carry oxygen to thetissues. Various industrial processes emit carbon monoxide but mobile sources generate 80 percentof the carbon monoxide emitted in urban areas. Gasoline powered automobiles are the mostsignificant source of CO as a result of inefficient fuel usage by their internal combustion engines.Carbon monoxide concentrations are generally higher in the winter, when meteorological conditionsfavor the build-up of directly emitted contaminants. Carbon monoxide health warnings andemergency episodes occur almost entirely during the winter.
Oxides of Nitrogen (NOx)
Oxides of nitrogen are the primary receptors of ultraviolet light initiating the photochemicalreactions that produce smog. Nitric oxide combines with oxygen in the presence of reactivehydrocarbons and sunlight to form NO2 and ozone. Oxides of nitrogen are contributors to otherair pollution problems including: high levels of fine particulate matter (PM2.5), poor visibility andacid deposition. The primary sources of NOx in the basin are incomplete combustion in motorvehicle engines, power plants, refineries and other industrial operations. Ships, railroads andaircraft are other significant emission sources.
Seven oxides of nitrogen and two hydrated oxides can exist in the atmosphere, but only four arepresent in noticeable amounts. Two of these are classified as pollutants including: nitric oxide(NO) which is a colorless and odorless gas and NO2 (a reddish-brown gas formed by thecombination of NO with oxygen). Nitric oxide is far less toxic than NO2 in humans. NO2absorbs blue light, thereby lending a brown cast to the atmosphere over the SCAB on days wheninversions reduce dispersion and trap pollutants near the ground.
Sulfur Dioxide (SO2) and Sulfates (SO42 -)
Sulfur dioxide a criteria pollutant. It is pungent, colorless, and results from the combustion offossil fuels with high sulfur content. Fuel combustion is the major source of SO2, while chemicalplants, sulfur recovery plants, and metal processing are minor contributors. Sulfates result from areaction of SO2 and oxygen in the presence of sunlight. When sunlight is plentiful, sulfate isformed more readily. Therefore, SO2 levels are generally lower in the summer and higher in the

3-3
winter. Recent reductions in SO2 levels reflect the use of natural gas in power plants and boilers(since natural gas is very low in sulfur) and low sulfur fuel oil. SO2 and other sulfur oxidescontribute to ambient PM2.5. Individuals affected by asthma are particularly sensitive to the effectsof SO2 which has been found to irritate and constrict airways in some exercising asthmatics afteronly a few minutes of exposure at relatively low concentrations.
Suspended Particulate Matter (PM10 and PM2.5)
Suspended PM is a mixture of solid or liquid particles of soot, dust, smoke, fumes and aerosolsfound in the air. Particulate matter consists of particles in the atmosphere as a by-product of fuelcombustion, through abrasion such as tire wear, and through soil erosion by the wind. Particulatescan also be formed through photochemical reactions in the atmosphere. PM10 refers to fine dividedsolids or liquids which are 10 microns or less in diameter and can enter the lungs. PM10 includesboth coarse and fine particles (PM2.5). Particulate concentrations are generally higher in the winternear major sources, when more fuel is burned and meteorological conditions favor the build-up ofdirectly-emitted contaminants. PM10 can be reduced by controlling dust generated at constructionand industrial sites. This is accomplished by applying soil stabilizers, sweeping paved roads, andwetting or paving frequently used unpaved roads.
The size of the particles is directly linked to their potential for causing health problems. Largerparticles can irritate eyes, noses, and throats and reduce visibility. Coarse particles (such as thosefound in wind-blown dust) have diameters between 2.5 and 10 micrometers and can be depositedwithin the lungs and result in adverse health effects. Coarse particles are produced primarily bymotor vehicle tire wear, industrial cutting and grinding processes, and the re-suspension of particlesfrom the ground or road surfaces by wind and human activities (construction, agriculture, etc.).About 90 percent of total particulates are less than 5 microns in diameter, while the aerosols formedwithin the atmosphere (primarily sulfate and nitrate) are usually smaller than 1 micron.
Fine particulate matter (2.5 micrometers in diameter or less) includes a mixture of microscopic solidor liquid particles suspended in air which are generally soot and aerosols. Fine particles can beemitted directly from combustion sources such as vehicle exhaust, stationary sources (includingindustrial processes and power plants), and smoke from fires. They can also be formed in theatmosphere from power plant, industrial, and mobile source emissions of gases such as SO2 andNOx. Components may include organic chemicals, metals, soil or dust particles, and allergens(such as fragments or pollen or mold spores).
Fine particulate matter (PM2.5) poses the greatest health risk because it can penetrate deep into thelungs and may even get into the bloodstream. Exposure to such particles can affect both the lungsand the heart. People with heart or lung disease, asthmatics, older adults, and children are especiallyat risk. Fine particulates are unhealthy to breathe and have been associated with serious healtheffects including premature mortality. PM2.5 particles may contain toxic substances and are amajor cause of reduced visibility (haze).
Lead (Pb)
Lead is found in old paints and coatings, plumbing and a variety of other materials. Once in theblood stream, lead can cause damage to the brain, nervous system, and other body systems.Children are highly susceptible to the effects of lead.
Ozone (O3)
Photochemical oxidant can include several different pollutants, but consists primarily of ozone(90%) and a group of chemicals called organic peroxynitrates. Ozone is a pungent, colorlessreactive toxic gas produced near the earth’s surface through photochemical reactions. Photo-

3-4
chemical oxidant is created by complex atmospheric reactions involving CO, NOx and VOC in thepresence of ultraviolet energy from sunlight. The reactions that form ozone begin at sunrise andrequire sunlight to proceed. At the Earth’s surface, ground level ozone is a criteria pollutant and amajor component of smog that causes numerous adverse health effects.
In the upper atmosphere (approximately 12 to 25 miles above the surface of the Earth) ozone isfound at concentrations below 10 parts per million (ppm). This ozone layer is transparent to UV-Aradiation but absorbs harmful ultraviolet radiation (UV-C and UV-B) coming from the sun that cancause skin cancer.
Mobile sources (automobiles, motorcycles, trucks, off-road vehicles, boats, trains and airplanes) arethe major source of ozone precursors (CO, NOx and VOC) in the SCAB. Peak ozone concentra-tions tend to occur in the SCAB between 1:00 and 2:00 p.m. during the summer and early fall,when the solar radiation exposure of the air mass is the greatest. Ozone and ozone precursors aretransported downwind as the photochemical reactions continue to occur. In areas downwind of thesource region like Palm Springs, peak ozone concentrations occur in the late afternoon and earlyevening (between 5:00 and 6:00 p.m.). If the ozone in Palm Springs were locally generated, thepeak concentrations would be found during the middle of the day.
The prevailing marine air currents throughout the South Coast Air Basin typically carry polluted airinland as ozone-forming photochemical reactions proceed. The highest ozone concentrations arefound miles downwind of the largest concentrations of precursor emissions sources. Peak ozoneconcentrations within the SCAB are found in the inland valleys and adjacent mountains between theSan Fernando Valley and the Riverside-San Bernardino area.
Just as oxidant precursors from Los Angeles and the adjacent coastal areas aggravate oxidantproblems inland in Riverside, precursor emissions from the central and eastern areas of the SCAB(including Anaheim) contribute to locally produced oxidant in the Coachella Valley.2 Acomprehensive study confirmed the transport pathways to the Coachella Valley in 1983.3 Althoughthe extent to which the intrusion of ozone contributes to Coachella Valley ozone exceedances hasnot been quantified, “...it is ARB’s judgment that oxidant problems in the Southeast Desert wouldbe minimal if oxidants and oxidant precursors were effectively controlled in the South Coast AirBasin.”4
The role of local emissions in the formation of oxidants in the Coachella Valley is difficult toquantify. Locally produced oxidant undoubtedly accounts for some standard exceedances.However, tracer studies and studies of ozone levels by location, hour of day, day of week, etc.indicate that an oxidant cloud caused directly by transport from the SCAB causes exceedances inPalm Springs as late as 8 p.m., when local photochemical activity has slowed. In addition,transported NOx and VOC that was emitted the previous day have been identified as majorcontributors to ozone concentrations at downwind desert locations.5
OZONE PRECURSORS AND PARTICULATE MATTER PRECURSORS
Ozone precursors are chemicals such as carbon monoxide, hydrocarbons, and oxides of nitrogen,which occur either naturally or as a result of human activities and contribute through photochemicalreactions to the formation of ground level ozone. The U.S. EPA defines mobile source ozone 2 Drivas, P. J. and F. H. Shair; “A Tracer Study of Pollutant Transport in the Los Angeles Area;” Atmospheric
Environment 8 : 1155-1163; 19743 Smith, T.B. et al.; The Impact of Transport from the South Coast Air Basin on Ozone Levels in the Southeast
Desert Air Basin; CARB Research Library Report No. ARB-R-83-183.4 SCAQMD and SCAG; AQMP - Southeast Desert Air Basin, Riverside County; October 1979.5 Ibid.

3-5
precursors as CO, NOx, and volatile organic compounds (VOCs). The California Air ResourcesBoard (CARB) defines ozone precursors as CO, NOx and reactive organic gases (ROGs). Sulfuroxides (SOx) are precursors to particulate matter. VOCs and ROGs are hydrocarbons and ozoneprecursors.
Volatile Organic Compounds (VOC)
Volatile organic compounds are not criteria pollutants but are ozone precursors and may be toxic.VOCs are defined by the U.S. EPA as any compound of carbon which participates in atmosphericphotochemical reactions (excluding methane, carbon monoxide, carbon dioxide, carbonic acid,metallic carbides, ammonium carbonate, and carbonate). Hydrocarbon and other volatile organiccompounds are formed from the combustion of fuels and the evaporation of organic solvents (suchas gasoline, alcohol, and the solvents used in paints and other coatings). Many hydrocarboncompounds are major air pollutants and those classified as aromatics are highly photochemicallyreactive with NOx, forming photochemical smog.
Hydrocarbon concentrations are generally higher in winter, when sunlight is limited andphotochemical reactions occur more slowly. During the winter, meteorological conditions are morefavorable to the accumulation of volatile organic compounds in the atmosphere which, in thepresence of NOx, play a major role in the formation of ozone.
Reactive Organic Gases (ROG)
Reactive organic gas is composed of hydrocarbons and non-methane organic compounds. ROG isnot a criteria pollutant but is an ozone precursor in that it contributes to the formation of smog. TheCARB defines reactive organic gases as non-methane hydrocarbons. Motor vehicles are the majorsource of reactive organic gases in the SCAB.
NATIONAL AND CALIFORNIA AMBIENT AIR QUALITY STANDARDS
Ambient air quality is determined from data collected at air quality monitoring stations locatedthroughout the South Coast Air Basin and the Salton Sea Air Basin. The ambient air quality data isgiven in terms of California and national standards which represent air pollutant concentrationswhich are considered safe to protect the public health and welfare with a reasonable margin ofsafety. As such, they represent objectives for acceptable concentrations of specified pollutants inoutdoor air.
Ambient air quality standards are designed to protect public health and that segment of thepopulation most sensitive and susceptible to respiratory distress or infection such as: asthmatics,the very young, the elderly, people weak with illness or disease, and people engaged in heavy workor exercise (i.e. sensitive receptors). Healthy adults can tolerate periodic exposures to air pollutantlevels well above these standards before adverse health effects are observed.
Two types of national ambient air quality standards (NAAQS) have been established by the U.S.EPA, as required by the Federal Clean Air Act. Primary standards are designed to safeguard thehealth of people considered to be sensitive receptors while outdoors. Secondary standards aredesigned to safeguard public welfare by minimizing damage to plants and animals, buildings, theoxidation of rubber and paint, and protecting against decreased visibility.
The Federal Clean Air Act permits individual states to adopt more protective air quality standards ifneeded. California has set standards which are more protective of public health than the respectiveNAAQS. In addition, California has established standards for some pollutants not addressed bythe national standards. As shown in Appendix B, California and NAAQS currently exist for the

3-6
following criteria pollutants: ozone (O3), nitrogen dioxide (NO2), sulfur dioxide (SO2), carbonmonoxide (CO), suspended particulate matter (PM10 and PM2.5), and lead (Pb).
Changes to the NAAQS have occurred since the 2007 Air Quality Management Plan (2007AQMP) was prepared and approved by the U.S. EPA. Effective June 15, 2005, the U.S. EPArevoked the federal one-hour ozone standard and replaced it with an 8-hour average ozone standard.Since the one-hour federal ozone standard was not attained in the SCAB or the neighboringCoachella Valley by the attainment date, continuing obligations exist with respect to the former one-hour federal ozone standard. On May 27, 2008, the 8-hour ozone NAAQS was reduced from 0.08to 0.075 ppm. The 2008 national health-based 8-hour surface-level ozone standard (< 0.075 ppm)and the 2006 national fine particulate matter (PM2.5) standard are more stringent than the previousstandards. The SIP submittal for the 2008 national 8-hour ozone standard in due in 2015. In 2010,the U.S. EPA proposed that the 8-hour ozone NAAQS be lowered again. To date, no final actionhas been taken on that proposal.
On October 15, 2008, the national standard for lead was revised to a rolling 3-month average of0.15 ug/m3 from a quarterly average of 1.5 ug/m3. On April 7, 2010, the U.S. EPA established anew one-hour NO2 standard of 0.100 ppm. On August 2, 2010 the U.S. EPA revised the SO2standard. A new one-hour standard of 0.075 ppm was established for SO2 and the annual and 24-hour standards were revoked. On December 14, 2012, the U.S. EPA lowered the federal primaryPM2.5 annual standard from 15.0 to 12.0 micrograms per cubic meter (μg/m3).
Unlike national standards, there are no attainment deadlines for state standards. State law requiresthat they be attained as expeditiously as possible. California has also adopted health advisory levelscalled episode criteria for ozone, carbon monoxide, sulfur dioxide, and ozone in combination withsulfates. Episode criteria represent short-term exposures at concentrations which actually threatenpublic health. SCAQMD Rule 701 identifies specific steps that must be taken when healthadvisory levels are exceeded.
SOUTH COAST AIR BASIN ATTAINMENT STATUS
The U.S. EPA periodically reviews recent ambient air quality data that forms the basis fordesignating areas with respect to the NAAQS as: nonattainment, unclassifiable/attainment orattainment (maintenance). The “nonattainment” designation applies to areas that do not meet theprimary standards. The unclassifiable/attainment designation applies to areas found to be betterthan the national standards that cannot be classified for some reason (such as the requisite data isnot available).
The current attainment status of the NAAQS for each of the criteria pollutants is summarized inTable 3-1 for the South Coast Air Basin and Table 3-2 for the Riverside County portion of theSalton Sea Air Basin (the Coachella Valley). The SCAB is currently designated “extreme”nonattainment for ozone, based upon the former one-hour standard and both the former and thecurrent federal 8-hour standards. The SCAB is designated “serious” nonattainment for PM10based upon the federal 24-hour standard. However, a redesignation request to attainment wassubmitted on December 31, 2006 and is currently pending with the U.S. EPA. The SCAB isdesignated nonattainment for both the 24-hour and the annual PM2.5 NAAQS. The attainmentdeadline for the 2006 24-hour PM2.5 NAAQS is December 14, 2014. The attainment deadline forthe annual PM2.5 NAAQS is April 5, 2015. The Los Angeles County portion of the SCAB isdesignated nonattainment for lead with an attainment date of December 31, 2015. The SCAB isdesignated attainment (maintenance) for the one-hour and eight-hour carbon monoxide NAAQS.Attainment for carbon monoxide was achieved on June 11, 2007. The SCAB is designatedattainment (maintenance) for the annual NO2 standard and unclassifiable/attainment for the one-hour NO2 NAAQS and both the 24-hour and the annual SO2 federal standards.

3-7
Table 3-1NAAQS Attainment Status
South Coast Air Basin
Criteria Pollutant Averaging Time U.S. EPA Designation Attainment Date
1979 1-Hour Nonattainment (Extreme) 11/15/20101-Hour Ozonea (0.12 ppm) (Not Attained)a
1997 8-Hour Nonattainment (Extreme) 6/15/20248-Hour Ozoneb (0.08 ppm)
2008 8-Hour Nonattainment (Extreme) 12/31/2032 8-Hour Ozone (0.075 ppm)
1-Hour (35 ppm) Attainment (Maintenance) 6/11/2007 CO 8-Hour (9 ppm) (Attained)
NO2c 1-Hour (100 ppb) Unclassifiable/Attainment Attained
NO2c Annual (0.053 ppm) Attainment (Maintenance) 9/22/1998
SO2d 1-Hour (75 ppb) Designations Pending Pending
SO2d 24-Hour (0.14 ppm) Unclassifiable/Attainment 3/19/1979
Annual (0.03 ppm) (Attained)
12/31/2006 PM10 24-Hour (150 μg/m3) Nonattainment (Serious)e (Redesignation
Request Submitted)e
PM2.5 24-Hour (35 μg/m3) Nonattainment 12/14/2014f
PM2.5 Annual (15.0 μg/m3) Nonattainment 4/5/2015
Lead 3-Months Rolling Nonattainment (Partial)g 12/31/2015 (0.15 μg/m3)
a. 1-hour O3 standard (> 0.12 ppm) was revoked, effective June 15, 2005; however, the SCAB has not attained thisstandard based on 2008-2010 data and has some continuing obligations under the former standard.
b. 1997 8-hour O3 standard (0.08 ppm) was reduced (0.075 ppm), effective May 27, 2008; the 1997 O3 standard andmost related implementation rules remain in place until the 1997 standard is revoked by U.S. EPA.
c. New NO2 1-hour standard, effective August 2, 2010; attainment designations January 20, 2012; annual NO2standard retained.
d. The 1971 annual and 24-hour SO2 standards were revoked, effective August 23, 2010; however, these 1971standards will remain in effect until one year after U.S. EPA promulgates area designations for the 2010 SO2 1-hour standard. Area designations expected in 2012 with SCAB designated Unclassifiable/Attainment.
e. Annual PM10 standard was revoked, effective December 18, 2006; A redesignation request to Attainment of the24-hour PM10 standard was submitted to EPA. The EPA proposed approval of the request and the maintenanceplan on March 22, 2013.
f. Attainment deadline for the 2006 24-Hour PM2.5 NAAQS is December 14, 2014.g. Partial Nonattainment designation – Los Angeles County portion of SCAB only.

3-8
Table 3-2NAAQS Attainment Status
Coachella Valley Portion of the Salton Sea Air Basin
Criteria Pollutant Averaging Time U.S. EPA Designation Attainment Date
1979 1-Hour Nonattainment (Severe-17) 11/15/20071-Hour Ozonea (0.12 ppm) (Not timely attained)
1997 8-Hour Nonattainment (Severe-15) 6/15/20198-Hour Ozoneb (0.08 ppm)
2008 8-Hour Nonattainment (Severe-15) 12/31/2027 8-Hour Ozone (0.075 ppm)
1-Hour (35 ppm) Unclassifiable/Attainment CO 8-Hour (9 ppm) 2nd Highest Non-Overlapping Attained
8-Hour Average
NO2c 1-Hour (100 ppb) Unclassifiable/Attainment Attained
NO2c Annual (0.053 ppm) Unclassifiable/Attainment Attained
SO2d 1-Hour (75 ppb) Designations Pending Pending
SO2d 24-Hour (0.14 ppm) Unclassifiable/Attainment Attained
Annual (0.03 ppm)
12/31/2006 PM10 24-Hour (150 μg/m3) Nonattainment (Serious)e (redesignation
request submitted)
PM2.5 24-Hour (35 μg/m3) Unclassifiable/Attainment Attained Annual (15.0 μg/m3)
Lead 3-Months Rolling Unclassifiable/Attainment Attained (0.15 μg/m3)
a. 1-hour O3 standard (> 0.12 ppm) was revoked, effective June 15, 2005; the Southeast Desert Modified AirQuality Management Area, including the Coachella Valley, has not attained this standard based on 2005-2007 dataand has some continuing obligations under the former standard (latest 2009-2011 data shows attainment).
b. 1997 8-hour O3 standard (0.08 ppm) was reduced (0.075 ppm), effective May 27, 2008; the 1997 O3 standard andmost related implementation rules remain in place until the 1997 standard is revoked by U.S. EPA.
c. New NO2 1-hour standard, effective August 2, 2010; attainment designations January 20, 2012; annual NO2standard retained.
d. The 1971 Annual and 24-hour SO2 standards were revoked, effective August 23, 2010; however, these 1971standards will remain in effect until one year after U.S. EPA promulgates area designations for the 2010 SO2 1-hour standard. Area designations expected in 2012 with SSAB designated Unclassifiable/Attainment.
e. Annual PM10 standard was revoked, effective December 18, 2006; redesignation request to Attainment of the 24-hour PM10 standard is pending with U.S. EPA.

3-9
The California Clean Air Act requires the CARB to establish and periodically review criteria thatprovide the basis for designating areas each year as: attainment, nonattainment, nonattainment-transitional or unclassified. A “nonattainment-transitional” designation means that pollutantconcentrations violate the state standard but air quality is nearing attainment. An “unclassified”designation means there is insufficient data. The 2011 CARB designations for the South Coast AirBasin and the Riverside County Portion of the Salton Sea Air Basin are shown in Table 3-3.
Table 3-3CARB 2011 Attainment Classifications e
Criteria Pollutant South Coast Air Basin Riverside County Portion of theDesignation Salton Sea Air Basin Designation
Carbon Monoxide Attainment Attainment
Lead (Particulate) Nonattainment Attainment(Los Angeles County Only)
NO2 Nonattainment Attainment
Ozone Nonattainment Nonattainment
PM10 Nonattainment Nonattainment
PM2.5 Nonattainment Unclassified
SO2 and Sulfates Attainment Attainment
Hydrogen Sulfide Unclassified Unclassified
Visibility Reducing Particles Unclassified Unclassified
a. Source: CARB March, 2013.
COACHELLA VALLEY ATTAINMENT STATUS
The Coachella Valley portion of the Salton Sea Air Basin has been designated by the U.S. EPA forcriteria pollutants as shown in Table 3-2. The 2007 AQMP and the subsequent SIP submittalrequested a redesignation of the Riverside County portion of the Salton Sea Air Basin from“Serious” nonattainment to “Severe-15” nonattainment. The Riverside County portion of theSalton Sea Air Basin was subsequently redesignated by the U.S. EPA as a “Severe-15” ozonenonattainment area for the 8-hour federal ozone standards for 1997 (0.08 ppm) and the lower 2008standard (0.075 ppm). This extended the attainment deadline to 2019 for the 1997 8-hour ozonestandard and established a new attainment date for the 2008 8-hour ozone standard of December31, 2027. In 2015, a new Ozone SIP attainment demonstration for the 2008 ozone standard willneed to be submitted to the U.S. EPA.
The Revised Draft 2012 AQMP ozone modeling indicates that with no additional emissionscontrols, the 1997 8-hour standard will be attained in the Coachella Valley in 2019. With futureemissions controls in place in the SCAB, the current (2008) 8-hour standard will be attained in theCoachella Valley by the year 2024, three years before the 2007 attainment deadline.

3-10
Nonattainment areas are subject to a number of requirements to improve their air quality includingthe preparation of plans specifying the control requirements that will be employed to meet thenational air quality standards by reducing air pollutant emissions. Nonattainment areas are subjectto a measure known as transportation conformity which requires local transportation and air qualityofficials to coordinate planning to ensure that transportation projects (such as road construction) donot affect an area’s ability to reach its clean air goals. Transportation conformity requirementsbecome effective one year after an area is designated as nonattainment.
Nonattainment areas are also subject to New Source Review (NSR) requirements. NSR is apermitting program for new or modified industrial facilities in nonattainment areas which emitnonattainment criteria pollutants to ensure that these sources of pollution do not impede progresstoward cleaner air. The two primary requirements of NSR are: reductions in emissions through theuse of Best Available Control Technology (BACT) and Emission Offsets. BACT is the most up-to-date methods, systems, techniques, and production processes available to achieve the greatestfeasible emission reductions for regulated air pollutants. Emission Offsets require approval of newor modified stationary sources of pollution to be conditional, based on the reduction of emissionsfrom banked reductions or other existing stationary sources.
EFFECTS OF POLLUTANTS ON SENSITIVE RECEPTORS
The California Air Resources Board has identified the following groups of individuals as the mostlikely to be affected by air pollution: the elderly over 65; children under 14; athletes; and peoplewith cardiovascular and chronic respiratory diseases such as asthma, emphysema, and bronchitis.These sensitive groups represent over 50% of the total California population.6 Demonstratedeffects of specific air contaminants on health and vegetation are discussed in Appendix B andsummarized in Table 3-4.
The elderly are most sensitive, since loss of lung tissue is a natural process of aging. Inhalation ofair pollution accelerates this loss by reducing lung volume and functional lung tissue. Damagedand irritated lung tissue becomes susceptible to bacterial infection. This increases the likelihood ofchronic respiratory disease by reducing the ability of the immune system to fight infection andresist disease.
PM10 can accumulate in the respiratory system and enter the blood stream through the lungs,creating or aggravating cardiovascular and respiratory problems including asthma. EPA's scientificreview concluded that fine particles (PM2.5), which penetrate deeply into the lungs, are more likelythan PM10 particles to contribute to adverse health effects. Elevated ozone concentrations result inreduced lung function, particularly during vigorous physical activity. Carbon monoxide can causedizziness, fatigue, and impairments to central nervous system functions. Lead can cause damage tothe brain, nervous system, and other systems in the human body.
The health effects associated with exposure to fine particles (PM2.5) are significant. Studies haveshown significant associations between elevated fine particles and premature mortality. Adverseeffects include: aggravation of respiratory and cardiovascular disease (as indicated by increasedhospital admissions, emergency room visits, absences from school or work, and restricted activitydays), lung disease, decreased lung function, asthma attacks, and certain cardiovascular problemssuch as heart attacks and cardiac arrhythmia.
Exposure to elevated ozone levels can cause irritated airways, coughing, pain when breathing deeply,wheezing, and inflammation. It can cause headaches, dizziness, memory impairment, aggravateasthma, and cause an increase in susceptibility to respiratory illnesses like bronchitis andpneumonia. Adverse effects vary with the level of exposure and the length of time exposed. 6 CARB; Facts About How Air Pollution Damages Health; 1983.

3-11
Table 3-4Health Effects of Air Pollutants a
Pollutant Most Relevant Effects
Short-Term Exposures: Decline in pulmonary function in healthy individualsincluding breathing pattern changes, reduction of breathing capacity, increasedsusceptibility to infections, inflammation of the lung tissue and immunologicalchanges. Increased frequency of asthma attacks, cough, chest discomfort and
Ozone headache.
Long-Term Exposures: Risk to public health implied by altered connectivetissue metabolism and host defense in animals. A correlation has been reportedbetween elevated ambient ozone levels and increases in daily hospital admissionrates and mortality.
A consistent association between increased ambient CO levels and excess admissionsfor heart diseases (such as congestive heart failure) has been observed.
Carbon Can cause decreased exercise capacity in patients with angina pectoris.
Monoxide Adversely affects conditions with an increased demand for oxygen supply (fetaldevelopment, chronic hypoxemia, anemia, and diseases involving the heart and bloodvessels).
Can cause impairment of time interval estimation and visual function.
Sensory responses may be elicited or altered.
Nitrogen May cause some impairment of pulmonary function and increased incidence of acuteDioxide respiratory disease including infections and respiratory symptoms in children.
Can cause difficulty in breathing in healthy as well as bronchitic groups.
Increase in blood lead levels which may impair or decrease hemoglobin synthesis.Lead Adversely affects the development and function of the central nervous system, leading
to learning disorders, distractibility, lower I.Q. and increased blood pressure. Leadpoisoning can cause anemia, lethargy, seizures and death.
May cause higher frequencies of acute respiratory symptoms (including airwaySulfur constriction in some asthmatics and reduction in breathing capacity leading to severeDioxide difficulties) and diminished ventilatory function in children.
Very high levels of exposure can cause lung edema (fluid accumulation), lung tissuedamage, and sloughing off of cells lining the respiratory tract.
May cause higher frequencies of acute respiratory symptoms and diminishedventilatory function in children.
A consistent correlation between elevated ambient PM10 levels and an increase inParticulates mortality rates, respiratory infections, number and severity of asthma attacks and the
number of hospital admissions has been observed.
Some recent studies have reported an association between long-term exposure to airpollution dominated by fine particles and increased mortality, reduction in life-span,and the possibility of an increased incidence of cancer.
a. SCAQMD, “Draft 1997 Air Quality Management Plan.”

3-12
Diesel engines emit a mixture of air pollutants including both gaseous and solid material (includingsoot) which reduces visibility and is a potent global warmer. Diesel exhaust particulate matter is atoxic air contaminant that has the potential to cause cancer, premature death, and other healthproblems especially for children and the elderly. Diesel engines also emit fine particulate matter(PM2.5). Exposure to DPM is presumed by both federal and state officials to result in excesscancer risk. However, the scientific community is still deliberating over how best to represent therisk from DPM exposure.
Approximately 40% of people in the United States will develop an invasive cancer sometime duringtheir lifetime. Approximately one in every four deaths in the United States is from cancer (AmericanCancer Society, 2002). Associated cancer risks with respect to air pollution are often measured interms of "excess deaths" due to the environmental exposure. A lifetime risk of 10-5 corresponds to10 excess deaths per million people whereas a lifetime risk of 10-4 corresponds to 100 excessdeaths per million people. The EPA has stated that estimated excess cancer risks for backgroundair pollution, even in remote areas of the United States, are on the order of 10-5 (Guinnup, 2003).
With respect to regional air quality, the SCAQMD Multiple Air Toxics Exposure Study (MATES-II, 2000) calculated that the carcinogenic risk in the SCAB was 1,400 excess cancers per millionpeople exposed. This estimate was based on the average of the pollutant concentrations found atten fixed sites within the SCAB that were monitoring more than 30 toxic air contaminants.Approximately 70 percent of the carcinogenic risk was attributed to mobile source emissions ofdiesel particulate matter (DPM). Another 20 percent of the risk was attributed to other toxicsassociated with mobile sources. The remaining 10 percent was attributed to stationary sources oftoxic air pollutants.
3.2 REGIONAL CLIMATE AND AIR QUALITY
The average wind speed in Los Angeles is the lowest of the nation’s ten largest urban areas. Themaximum mixing height during the summer months in Southern California averages the lowest inthe nation, reducing the vertical dispersion of pollutants in the air mass. This region experiencesmore days of sunshine than any other major urban area in the nation except Phoenix. The abundantsunshine in Southern California drives photochemical reactions which form secondary pollutantsincluding ozone.
Although emissions in Southern California change somewhat by season, the observed variations inpollutant concentrations are largely the result of seasonal differences in weather conditions. Ozoneconcentrations peak during the summer months (May through September). CO and PM2.5concentrations peak during the late fall and winter months. Peak PM10 concentrations in the SouthCoast Air Basin reflect no clear seasonal variation.
Southern California, with the lowest summer time mean mixing height, the lowest average windspeed and emissions from the second largest urban area in the U.S., has one of the worst airpollution problems in the nation. Although past programs have been effective at improving the airquality of the SCAB, it still exceeds health-based standards frequently.
Pollution controls have reduced exposures to air pollution in the SCAB but population increaseshave made further emissions reductions more difficult to achieve. Increases in the number ofpollution sources and the magnitude of the pollutant emissions may offset or even reverse the gainsachieved through decades of regulation unless additional steps are taken to further control pollutantemissions.
During 2011, the SCAB did not exceed the ambient air quality standards for CO, NO2, or SO2.The U.S. EPA recently revised the NO2 and SO2 ambient air quality standards but the basinappears to be in compliance with the newly mandated standards.

3-13
OZONE TRENDS IN THE SCAB
The SCAB is currently designated as an “extreme” nonattainment area for the federal 8-hourozone standard. The maximum 8-hour ozone concentrations have decreased by thirty percent overthe last 20 years. Figure 3-2 shows the long-term downward trend in the maximum ambient 8-hourand 1-hour ozone levels within the SCAB since 1990. All of the emission control programsimplemented for the 1-hour ozone standard have contributed to progress on meeting the new 8-hoursurface level standard, which is more stringent. The 8-hour ozone standard will require moreemission reductions and time to achieve than the 1-hour standard. The 1997 8-hour ozonestandard deadline is 2023.
The number of days when the SCAB experiences high ozone levels has decreased dramatically overthe last 20 years. As shown in Figure 3-3, the majority of exceedances of the current federal 8-hourozone standard occur in the mountains and valleys in the southwest portion of San BernardinoCounty.
The 1-hour ozone standard was revoked by the U.S. EPA and replaced by the 8-hour average ozonestandard on June 15, 2005. The U.S. EPA subsequently revised the federal 8-hour ozone standard(from 0.084 ppm to 0.075 ppm) on May 17, 2008. The SCAB still experiences ozone levels whichexceed the revoked 1-hour standard on 5 percent of the days. A new 1-hour ozone SIP may have tobe prepared within the next year demonstrating attainment within 5 years with a potential 5-yearextension.
SUSPENDED PARTICULATE MATTER TRENDS IN THE SCAB
Both PM10 and PM2.5 concentrations have improved dramatically over the last 20 years. As shownin Figure 3-4, the annual average PM10 and PM2.5 levels in the SCAB have been reduced byapproximately 50 percent. The SCAB has met the PM10 standards and a request for redesignationby the U.S. EPA to attainment is pending. During 2011, the annual and the 24-hour PM2.5standards were exceeded at only one location (in Mira Loma).
In the SCAB, PM10 is a complex problem because contributions come from a wide variety ofemission sources. Nevertheless, progress has been made toward attaining the federal PM10standard in several areas, especially those with fugitive dust problems. PM10 concentrations in theSCAB are declining and there has been a substantial decrease in the number of days per year abovethe standard. The SCAB effectively attains the federal 24-hour PM 10 standard, with a fewremaining exceedances in recent years due to natural windblown dust events.
Figure 3-5 shows SCAB and Coachella Valley 3-year design values (2009-2011) for ozone, PM10and PM2.5, as a percentage of the corresponding federal standards. Based on the location of theproject site within the Banning Pass between the SCAB and the Coachella Valley ambient ozoneand particulate concentrations on-site would be expected to be between the levels shown for theSCAB and those shown for the Coachella Valley in Figure 3-5.
OTHER REGIONAL POLLUTANTS
In 2011, the SCAB did not exceed the standards for carbon monoxide, nitrogen dioxide, or sulfurdioxide. Although the U.S. EPA recently revised the NO2 and SO2 ambient air quality standards,the basin appears to be in compliance with the newly mandated standards.
Pollution controls have reduced exposures to air pollution in the SCAB but population increaseshave made further emissions reductions more difficult to achieve. The Revised Draft 2012 AQMPstates that increases in the number of pollution sources and the magnitude of the pollutant

End
o E
ngin
eeri
ng
Figu
re 3
-2M
axim
um O
zone
Con
cent
ratio
n Tr
ends
in th
e So
uth
Coas
t Air
Basi
n
Sour
ce:
SCAQ
MD
“Rev
ised
Dra
ft 2
012
Air
Qua
lity
Man
agem
ent P
lan”
; Sep
tem
ber 2
012.

End
o E
ngin
eeri
ng
Figu
re 3
-3D
ays
in 2
011
Exce
edin
g Cu
rren
tFe
dera
l 8-H
r. O
zone
Sta
ndar
d in
SCA
B
Sour
ce:
SCAQ
MD
“Rev
ised
Dra
ft 2
012
Air
Qua
lity
Man
agem
ent P
lan”
; Sep
tem
ber 2
012.

End
o E
ngin
eeri
ng
Figu
re 3
-4M
axim
um A
nnua
l Ave
rage
Par
ticul
ate
Mat
ter C
once
ntra
tions
in th
e So
uth
Coas
t Air
Basi
n
Sour
ce:
SCAQ
MD
“Rev
ised
Dra
ft 2
012
Air
Qua
lity
Man
agem
ent P
lan”
; Sep
tem
ber 2
012.

End
o E
ngin
eeri
ng
Figu
re 3
-5SC
AB
and
Coac
hella
Val
ley
3-Ye
arD
esig
n Va
lues
(200
9-20
11)
Sour
ce:
SCAQ
MD
“Rev
ised
Dra
ft 2
012
Air
Qua
lity
Man
agem
ent P
lan”
; Sep
tem
ber 2
012.

3-14
emissions may offset or even reverse the gains achieved through decades of regulation unlessadditional steps are taken to further control pollutant emissions.
As federal health-based air quality standards become more stringent and effective new controlstrategies become increasingly difficult to identify, the SCAB faces several ozone and PMattainment challenges. The California GHG reduction targets and timelines also affect manysources of criteria pollutant emissions. Strategies to achieve air quality and climate goals overlap interms of both sources and control measures. Meeting multiple deadlines to achieve multiple airquality, climate, and energy objectives is a complex process which requires a coordinated approachinvolving all levels of government.
GREENHOUSE GASES
Greenhouse gases (GHG) trap solar energy in the Earth’s atmosphere and make the planet warmer.Without GHG, the Earth would be too cold to be inhabitable. Common greenhouse gases in theEarth’s atmosphere include: water vapor, carbon dioxide (CO2), methane (CH4), nitrous oxide(N2O), ozone, and to a lesser extent chlorofluorocarbons. Carbon dioxide is the main GHGthought to contribute to global climate change. Carbon dioxide absorbs long-wave radiant energyreflected by the Earth, which warms the atmosphere. GHG radiate long-wave radiation absorbed bythe atmosphere out to space as well as down toward the Earth’s surface. This process is known asthe “greenhouse effect.” Human activities (such as burning carbon-based fossil fuels) create watervapor and CO2 as byproducts, thereby impacting the levels of GHG in the atmosphere.
Human activities are thought to be responsible for almost all of the increase in GHG within theatmosphere over the last 150 years. The largest source of GHG emissions is burning fossil fuelsfor electricity, heat, and transportation.
The U.S. EPA tracks GHG emissions annually. Since 1990, GHG emissions within the UnitedStates have increased approximately 10 percent. During 2010, GHG emissions in the U.S. totaled6,882 million metric tons of CO2 equivalent. The U.S. EPA attributes GHG emissions to fivesectors. the production of electricity (34%), the transportation sector (27%), industry (21%), thecommercial and residential sector (11%), and agriculture (7%). Seventy percent of our nation’senergy comes from burning fossil fuels. Ninety percent of the fuel used for transportation ispetroleum based. GHG from homes and businesses arise primarily from fossil fuels burned forheat, the use of products containing GHG, and the handling of waste. Managed forests and otherland areas can absorb CO2 from the atmosphere. In the U.S., land-use change and forestry wereestimated to offset approximately 15% of the GHG emissions in 2010.7
Passenger vehicles have been identified by the California Air Resources Board (CARB) as theprimary source of GHG emissions in California. During 2008, the CARB identified the CO2emissions associated with fuel use in the SCAB (mostly transportation fuels) as 32 percent of theCO2 released in California.
In the Revised Draft 2012 AQMP, the SCAQMD identified on-road transportation as the largestsource of GHG and criteria pollutants in the SCAB. Transportation and goods movement areresponsible for over 80% of the NOx and 70% of the CO2 emissions in the SCAB. Relianceprimarily on internal combustion engines which are inherently inefficient to move people and goodsin the SCAB wastes 80 percent of the energy content of the gasoline as heat. The majority of thePM2.5 emissions in 2008 within the SCAB were attributable to transportation sources. Within thetransportation sector, the majority of the NOx emitted in the SCAB in 2008 was emitted by diesel-powered vehicles. On-road heavy-duty diesel vehicles have a slow rate of fleet turnover whichsubstantially increases the time before the benefits of technology improvements are fully realized. 7 U.S. EPA; Sources of Greenhouse Gas Emissions; June 14, 2012.

3-15
Improved policies regarding land use and transportation are essential elements in achieving criteriapollutant standards and California’s 2050 GHG and climate change goals. Although hybrid andelectric vehicles are more efficient than traditional internal combustion engines, additionaltechnology changes in the transportation sector are needed to reduce emissions and increase bothefficiency and the use of renewable fuels. Typical gasoline-fueled vehicles currently utilize 20percent or less of the energy content of gasoline for propulsion.8 The remaining 80 percent iswasted as heat.
Even though the SCAB consumes two percent of the energy consumed in the nation, California’sper capita energy consumption is fourth lowest in the nation. Sixty percent of the energy use in theSCAB is attributed by the SCAQMD to the transportation sector. Three large airports are locatedin the SCAB serving 16 million residents. These residents rely on the freeways and highwayinfrastructure for mobility and use enough gasoline in the process to comprise nearly 50 percent ofthe total energy consumed in the SCAB. Two of the largest maritime ports in the nation are locatedin the SCAB and handle 40 percent of the nation’s container traffic. Local distribution networksrequire diesel-powered trucks and trains to move goods Conservation, renewable energy generationfrom all sources, and lower emission technologies will all be required to reduce criteria airpollutants and GHG emissions.
3.3 LOCAL CLIMATE AND AIR QUALITY
The project site is located within the east/west Banning Pass, an area fifteen miles long and fivemiles wide that connects the SCAB to the Coachella Valley. The Banning Pass is one of the threemajor routes by which air pollutants generated within the Los Angeles metropolitan area aretransported out of the SCAB. The elevation of the Banning Pass is 2,200 feet above mean sea levelin Beaumont, 2,600 feet in Beaumont, and drops to 1,400 feet between Cabazon and Whitewater.On the north side of the Banning Pass, the San Bernardino Mountains rise to an elevation of 11,500feet. The San Jacinto Mountains are located on the south side of the Banning Pass and have amaximum elevation of 10,800 feet. The topographical characteristics of the Banning Pass createpersistent strong westerly winds that are compressed and channeled by the elevated land mass in theBanning Pass and the adjacent mountains to the north and south.
LOCAL CLIMATE AND METEOROLOGY
The prevailing meteorological conditions at the project site include air from the coastal plain to thewest being funneled through the Banning Pass into the desert area within the Coachella Valley tothe east. The meteorology at the site is transitional and unlike that of either the coastal plain or thedesert area. Surface winds at the project site are primarily from the west. They are more frequentand stronger than those in the SCAB or the Coachella Valley. Temperatures within the BanningPass vary more than in the coastal areas of the SCAB (where the Pacific Ocean moderates theclimate) but less than temperatures vary in the Coachella Valley.
The climate station in Beaumont, California is located 5.4 miles west of the Banning Airport andclosest to the project site. The study area is located in the Banning Pass, where the climate is warmduring the summer, with temperatures typically in the 70’s. The warmest month of the year isAugust, with an average maximum temperature of 96.9 degrees Fahrenheit. The winter climate iscool, with temperatures normally in the 50’s. The coldest month of the year is December, with anaverage minimum temperature of 39.4 degrees Fahrenheit. Temperature variations between nightand day can reach 37 degrees Fahrenheit during the summer and 25 degrees during the winter.
8 Source: fueleconomy.gov

3-16
The annual average precipitation in Banning is 19.3 inches. Most of the rainfall occurs betweenNovember and March. With an average rainfall of 4.18 inches, January is typically the month withthe most rainfall.9
Wind direction and speed (which in turn affect atmospheric stability) are the most important climateelements affecting ambient air quality within the area. The prevailing wind direction at the BanningAirport is from the west (85 percent of the time). Westerly wind speeds are predominantly between9 and 14 miles per hour. During approximately 15 percent of the time, winds blow from the east atspeeds ranging from 9 to more than 25 miles per hour. The annual mean wind speed is 9.8 milesper hour. Calm conditions rarely if ever occur at the Banning Airport (as shown in the BanningAirport Wind Rose included in Appendix B).
The Banning Pass is windy most of the time and sparsely populated. Elevated ozone levels areassociated with the westerly flow of polluted air out of the SCAB, which is home to a population ofapproximately 17 million people. Minimal friction is generated between the moving air and therelatively low and sparse vegetation. This allows the wind to maintain its speed as it crosses fromthe SCAB into the Coachella Valley, where the rapid daytime heating of the air closest to the desertsurface leads to convective activity and the exchange of surface air for upper air, which acceleratessurface winds during the warm part of the day.10 The Coachella Valley has a population ofapproximately 2 million people.
Since the dominant daytime onshore wind pattern follows the peak travel period (6:00 a.m. through9:00 a.m.) in the Los Angeles/Orange County area, during periods of low inversions and low windspeeds, the photochemical smog formed in metropolitan areas is transported downwind intoRiverside County, San Bernardino County, and the Coachella Valley. Peak oxidant levels in theCoachella Valley occur in the late afternoon and evening (between 4 p.m. and 8 p.m.), as pollutantsare blown through the Banning Pass. Oxidant concentrations in the 50-mile long and 20-mile wideCoachella Valley are highest, closest to the South Coast Air Basin, and decrease steadily as the airmass moves east from Banning to Palm Springs and then Indio.
Surface-based inversions in the Coachella Valley are prevalent at night throughout the year andusually persist into the day during the winter months. Inversion conditions are associated withdegraded air quality because the surface air is prevented from rising and dissipating the airpollutants that accumulate throughout the day. Radiation inversions are prevalent at nightthroughout the year. They limit the mixing in the lower atmosphere to a height of 200 to 2,000 feet.They persist through much of the day in winter but are destroyed early in the day during thesummer.
LOCAL AMBIENT AIR QUALITY
The 2012 EPA “Technical Analysis for the Morongo Band of Mission Indians” concluded thatalthough the Morongo Reservation does contain stationary and mobile sources of ozone precursors,the magnitude of the emissions of ozone precursors (NOx and VOC) is very small compared toemissions in the adjacent SCAB and Coachella Valley ozone nonattainment areas. The minimalamount of emissions associated with activities on the Morongo lands of Indian country andcorresponding minimal contribution to regional ozone violations within the adjacent nonattainmentareas resulted in the EPA recently designating the Morongo areas of Indian country as a separateozone nonattainment area.
9 http://www.idcide.com/weather/ca/banning.htm.10 CARB; Climate of the Southeast Desert Air Basin, January, 1990.
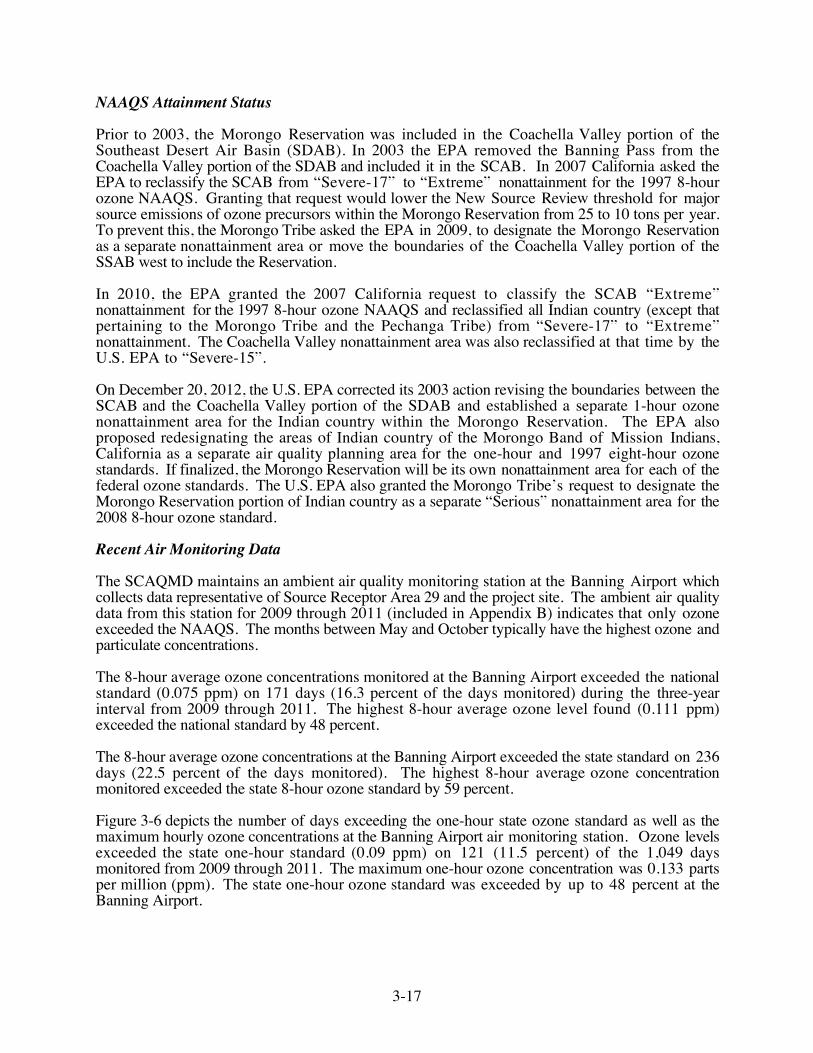
3-17
NAAQS Attainment Status
Prior to 2003, the Morongo Reservation was included in the Coachella Valley portion of theSoutheast Desert Air Basin (SDAB). In 2003 the EPA removed the Banning Pass from theCoachella Valley portion of the SDAB and included it in the SCAB. In 2007 California asked theEPA to reclassify the SCAB from “Severe-17” to “Extreme” nonattainment for the 1997 8-hourozone NAAQS. Granting that request would lower the New Source Review threshold for majorsource emissions of ozone precursors within the Morongo Reservation from 25 to 10 tons per year.To prevent this, the Morongo Tribe asked the EPA in 2009, to designate the Morongo Reservationas a separate nonattainment area or move the boundaries of the Coachella Valley portion of theSSAB west to include the Reservation.
In 2010, the EPA granted the 2007 California request to classify the SCAB “Extreme”nonattainment for the 1997 8-hour ozone NAAQS and reclassified all Indian country (except thatpertaining to the Morongo Tribe and the Pechanga Tribe) from “Severe-17” to “Extreme”nonattainment. The Coachella Valley nonattainment area was also reclassified at that time by theU.S. EPA to “Severe-15”.
On December 20, 2012, the U.S. EPA corrected its 2003 action revising the boundaries between theSCAB and the Coachella Valley portion of the SDAB and established a separate 1-hour ozonenonattainment area for the Indian country within the Morongo Reservation. The EPA alsoproposed redesignating the areas of Indian country of the Morongo Band of Mission Indians,California as a separate air quality planning area for the one-hour and 1997 eight-hour ozonestandards. If finalized, the Morongo Reservation will be its own nonattainment area for each of thefederal ozone standards. The U.S. EPA also granted the Morongo Tribe’s request to designate theMorongo Reservation portion of Indian country as a separate “Serious” nonattainment area for the2008 8-hour ozone standard.
Recent Air Monitoring Data
The SCAQMD maintains an ambient air quality monitoring station at the Banning Airport whichcollects data representative of Source Receptor Area 29 and the project site. The ambient air qualitydata from this station for 2009 through 2011 (included in Appendix B) indicates that only ozoneexceeded the NAAQS. The months between May and October typically have the highest ozone andparticulate concentrations.
The 8-hour average ozone concentrations monitored at the Banning Airport exceeded the nationalstandard (0.075 ppm) on 171 days (16.3 percent of the days monitored) during the three-yearinterval from 2009 through 2011. The highest 8-hour average ozone level found (0.111 ppm)exceeded the national standard by 48 percent.
The 8-hour average ozone concentrations at the Banning Airport exceeded the state standard on 236days (22.5 percent of the days monitored). The highest 8-hour average ozone concentrationmonitored exceeded the state 8-hour ozone standard by 59 percent.
Figure 3-6 depicts the number of days exceeding the one-hour state ozone standard as well as themaximum hourly ozone concentrations at the Banning Airport air monitoring station. Ozone levelsexceeded the state one-hour standard (0.09 ppm) on 121 (11.5 percent) of the 1,049 daysmonitored from 2009 through 2011. The maximum one-hour ozone concentration was 0.133 partsper million (ppm). The state one-hour ozone standard was exceeded by up to 48 percent at theBanning Airport.

0
0.03
0.06
0.09
0.12
0.15
2009 2010 2011
Maximum Hourly Ozone ConcentrationsO
ne-H
our M
axim
um C
once
ntra
tion
(ppm
)
Year
State Standard(.09 ppm)
Figure 3-6Banning Airport Ozone Data
0
10
20
30
40
50
60
2009 2010 2011
Days Exceeding State Ozone Standard
Num
ber o
f Day
s Per
Year
Year

3-18
The annual average PM10 concentration for two of the three years exceeded the state standard of 20μg/m3 in Banning. The annual average PM10 concentration for 2009 (25.9 μg/m3) was the highestand exceeded the state standard by 29.5 percent but did not exceed the national standard (50μg/m3). Figure 3-7 depicts the percentage of PM10 samples exceeding the state 24-hour standardas well as the maximum 24-hour PM10 concentrations. As shown therein, the PM10 concentrationsat the Banning Airport exceeded the California 24-hour standard on two percent of the daysmonitored (one of the days monitored each year). The maximum 24-hour PM10 concentration was99 micrograms per cubic meter (μg/m3) nearly twice the state standard (50 μg/m3) and 66 percentof the national standard (150 μg/m3).
Nitrogen dioxide was monitored at the Banning Airport for all three years but did not exceed thestate one-hour standard (0.18 ppm) or the state annual standard (0.030 ppm). The highest annualaverage NO2 concentration (0.0116 ppm) occurred in 2010 and was 22 percent of the nationalstandard and 39 percent of the state annual standard. The new one-hour national for NO2 standard(0.100 ppm) became effective on April 7, 2010. The highest one-hour concentration (0.0657 ppm)was 66 percent of the new national one-hour standard for NO2.
PM10 sulfate data was monitored in Banning only during the year 2011. Based upon 59 days ofmonitoring data, the highest 24-hour average concentration at the Banning Airport was 4.4 μg/m3.This concentration was 17.6 percent of the state standard (25 μg/m3). There is no national standardfor PM10 sulfate.
The ambient air monitoring station located at the Banning Airport did not monitor all of the criteriapollutants. Between 2009 and 2011, the following pollutants were not monitored at this locations:Carbon monoxide, lead, PM2.5, and sulfur dioxide. PM10 sulfate was not monitored in 2009 or2010.
AIR QUALITY IN THE COACHELLA VALLEY
The Coachella Valley Planning Area is a sub-region of Riverside County and the SSAB located eastof the project site, as shown in Figure 3-1. The Riverside County portion of the SSAB is currentlydesignated as a federal nonattainment area for ozone and PM10 ambient air quality standards.Exceedances of the ozone standards in the Coachella Valley are due to the transport of ozone fromthe densely populated areas of the upwind SCAB.
Air pollutants are not constrained by city or county jurisdictional boundaries. Consequently, localprograms alone will not be sufficient to solve air quality problems that are regional in nature. Thepolluted air mass within the neighboring South Coast Air Basin is routinely transported through theBanning Pass into the Coachella Valley, as photchemical reactions proceed which generate bothozone and suspended particulate matter. Peak ozone levels which are found between 1:00 p.m. and2:00 p.m. within the SCAB occur in the late afternoon and evening in the Coachella Valley. Ozoneconcentrations within the Coachella Valley are highest at the Palm Springs monitoring station,which is located closer to the densely populated SCAB and closer to the Banning Pass than theIndio station. The Palm Springs air monitoring station is located approximately 16 miles east of theproject site
Ozone
Ozone air quality trends for the Coachella-San Jacinto area indicate a downward trend in thenumber of days exceeding the national 1-hour ozone standard since 1976. This has occurreddespite the fact that population growth in the Coachella Valley over this period has been dramatic.

0
25
50
75
100
125
150
2009 2010 2011
Maximum 24-Hour Concentrations
Max
imum
Con
cent
ratio
n (m
icro
gram
s/cu
bic
met
er)
Year
State Standard(>50 µg/m3)
Federal Standard(150 µg/m3)
Figure 3-7Banning Airport PM10 Data
0%
2%
4%
6%
8%
10%
2009 2010 2011
24-Hour PM10 Samples Exceeding State Standard
Perc
enta
ge o
f Day
s St
ate
PM10
Sta
ndar
d W
as E
xcee
ded
Year

3-19
Atmospheric ozone in the Coachella Valley is both directly transported from the SCAB by theprevailing sea breezes and formed from precursors emitted upwind. During 2011, the maximum 1-hour concentration measured was 99 percent of the former federal standard. In 2011, the 1997federal 8-hour standard was exceeded on 18 days during the summer months. The newer and morestringent 2008 federal 8-hour ozone standard was exceeded on 54 days during the summer months.The highest concentration in the Coachella Valley was 129 percent of the current federal standard.
In 2011, the Coachella Valley exceeded the federal 8-hour ozone standards (both the 1997 standard(0.08 ppm) and the lower 2008 standard (0.075 ppm). For both ozone standards, the CoachellaValley is classified as a “severe” ozone nonattainment area. During 2011, the maximum 1-hourconcentration measured was 99 percent of the former federal standard. The state 1-hour and 8-hourstandards for ozone were exceeded on 25 days and 78 days, respectively in the Coachella Valley.
Particulate Matter (PM10)
PM10 in the Coachella Valley comes mostly from locally generated fugitive dust produced by bothhuman activities (on-road and off-road vehicles, construction activities and farming) and naturaloccurrences (sand and dust storms when winds exceed 25 mph). The highest PM10 concentrationsare typically found in the summer, when hot dry weather produces more dust or result from unusualcircumstances such as wildfires or celebrations involving fireworks. The PM10 concentrations inPalm Springs and Indio peaked in 2006 and 2007, when construction activities peaked.
The Coachella Valley exceeds the PM10 standard on days when high wind events cause thetransport of windblown dust from disturbed and natural desert areas. The two days during 2011 onwhich the PM10 standard was exceeded were associated with high-wind natural events and havebeen flagged for exclusion from the federal database. After excluding high-wind natural event days,no days have exceeded the federal 24-hour PM10 standard (150 μg/m3) at Indio or Palm Springssince the mid 1990s.
The Coachella Valley is currently designated “serious” nonattainment of the 24-hour averagePM10 NAAQS by the U.S. EPA. The SCAQMD has requested that the U.S. EPA redesignate theCoachella Valley from nonattainment to attainment of the PM10 NAAQS. That request is currentlypending. During 2011, the maximum PM10 concentration (24-hour average without excluded high-wind days) was 77 percent of the federal standard (150 μg/m3). The annual average PM10
concentration in 2011 was 65 percent of the revoked federal PM10 standard (50 μg/m3).
Fine Particulate Matter (PM2.5)
With fewer combustion sources than the SCAB, increased vertical mixing, and horizontaldispersion in the desert area, PM2.5 concentrations found in the Coachella Valley have remainedrelatively low compared to levels in the SCAB. The Coachella Valley does not exceed the federal24-hour or annual standards for PM2.5. In 2011, the maximum concentration (24-hour average) inIndio on an exceptionally high-wind day was 99.7 percent of the federal standard. The secondhighest value was 74 percent of the federal standard and occurred in Palm Springs. The annualaverage concentration in 2011 was 48 percent of the federal standard.
The PM2.5 standards were not exceeded at the Palm Springs monitoring station between 2009 and2011. The highest 24-hour concentration measured at the Indio monitoring station was 35.4μg/m3 in 2011. The highest 24-hour concentration measured at the Palm Springs monitoringstation was 26.3 μg/m3 in 2011. When rounded down to 35 μg/m3, the 24-hour PM2.5concentration monitored in Indio would not exceed the federal 24-hour standard for PM2.5 (>35μg/m3).

3-20
The federal standard for PM2.5 is 15 μg/m3 (annual arithmetic mean). The highest PM2.5 annualarithmetic mean in Indio was 7.9 μg/m3 in 2009. The highest annual arithmetic mean in PalmSprings was 6.7 μg/m3 in 2009.
Other Criteria Pollutants
PM10 sulfate was monitored in the year 2011 in both Indio and Palm Springs. The maximum 24-hour concentration was 4.4 μg/m3 in Palm Springs and 5.7 μg/m3 in Indio. The state sulfatestandard is 25 μg/m3. During 2011, the maximum 24-hour average sulfate concentration was 23percent of the state standard. There is no federal standard for sulfate.
CO and NO2 levels did not exceed the ambient air quality standards in the Coachella Valley. Sulfurdioxide and lead are not currently monitored in the Coachella Valley. National sulfur dioxidestandards were last exceeded in the 1960’s. These pollutants are not of concern in the CoachellaValley.
3.4 EXISTING SENSITIVE RECEPTORS
A sensitive receptor is a person in the population who is particularly susceptible (i.e. moresusceptible than the population at large) to health effects due to exposure to an air contaminant.Sensitive receptors and the facilities that house them are of particular concern if they are located inproximity to localized sources of carbon monoxide, toxic air contaminants, or odors. Land usesconsidered by the SCAQMD to be sensitive receptors include: residences, long-term health carefacilities, schools, rehabilitation centers, playgrounds, convalescent centers, child care centers,retirement homes, and athletic facilities.
If sensitive receptors are located adjacent to a major intersection, carbon monoxide (CO) "hotspots" may occur during peak travel times. High levels of CO are associated with traffic congestionand with idling or slow-moving vehicles, depending on the background CO concentration.Therefore, projects that could negatively impact levels of service at major intersections with nearbysensitive receptors must quantify and, if necessary, mitigate potential impacts.
The sensitive receptor sites closest to the project site are single-family detached residences locatedapproximately 0.25 miles south of the southern boundary of the general parking area proposed on-site (see Figure 2-2, the Vicinity Map). Approximately seven single-family residences are locatedsouth of Interstate 10 in this area. The area located west of the project site, between Morongo Trailand Millard Pass is developed with approximately 55 single-family detached dwellings. The closestresidential lot in this area is approximately 0.5 miles west of the western site boundary.
3.5 LOCAL SOURCES OF AIR CONTAMINANTS
Ozone precursor emissions generated within the adjacent SCAB exceed 400,000 tons per day ofNOx and more than 200,000 tons per day of VOC. Within the Coachella Valley, ozone precursoremissions exceed 50,000 tons per day of NOx and 28,000 tons per day of VOC. By comparison,the Title V operating permit for the Morongo Casino Resort and Spa cogeneration facility limit itsemissions to less than 18.7 tons per year of NOx and 18.7 tons per year of VOC (i.e., 0.05 tons perday of NOx and 0.05 tons per day of VOC).
Commercial and Industrial Land Uses
Existing sources of ozone precursor emissions within the tribal boundaries include the MorongoCasino Resort and Spa cogeneration facility. This facility has a Title V operating permit whichlimits the 8.4 megawatt facility’s potential to emit from the four natural gas-fired engines and three

3-21
diesel-fired backup generators to less than 18.7 tons per day of NOx emissions and less than 18.7tons per day of VOC emissions.
The Morongo Travel Center is located north of Seminole Drive and east of Thunder Road, just westof the Morongo Casino Resort and Spa. The Morongo Travel Center dispenses gasoline and dieselfuel to the public from thirty-six pumps. The Morongo Travel Center is a stationary source ofVOCs and toxic air contaminants. Gasoline refueling stations emit benzene when gasoline isdispensed to motor vehicles and during the loading and breathing of the underground gasolinestorage tanks. Benzene is a constituent of gasoline and is a toxic air contaminant identified underAssembly Bill 1807. The Morongo Travel Center complies with SCAQMD Rule 1401. A permitto construct was required before this gasoline dispensing station was constructed and put intooperation. A permit to operate ensures that appropriate emissions control measures are in place andfunctioning properly, allowing this gasoline dispensing station to operate safely under theconditions, if any, that limit its operation.
A bulk materials plant (gravel pit) is located southwest of the project site, south of Interstate 10 andwest of Apache Trail. This facility generates fugitive dust emissions as a result of disturbedsurfaces and exhaust emissions associated with the equipment used to extract and process the bulkmaterials and aggregate from the site.
Trains
The Union Pacific Railroad line traverses the area south of Interstate 10 and the project site. TheUnion Pacific Railroad provides freight rail service to Riverside County with up to fifty freighttrains per day passing through the area to and from major cities throughout the continental UnitedStates. Within Riverside County, freight rail is an important backbone of the goods movementindustry.
Amtrak provides regional passenger rail service using the railroad line located south of the projectsite. Amtrak’s Sunset Limited passenger service between the Union Station in Los Angeles andNew Orleans stops at the North Palm Springs Amtrak train station.
The freight trains are moved by locomotives that emit air pollutants. In Southern California,locomotives emit 30 tons per day of pollutants including particulate-forming nitrogen oxides. Thatexceeds the combined total emitted by the region’s 300 largest factories and other facilities.
Freeway Traffic
The Interstate 10 freeway is part of the state highway truck route system and a local source of airpollution located immediately south of the project site. The primary means of transporting goodsand consumer products in Riverside County is large trucks. The agricultural and industrial sectorsof the Riverside County economy generate a significant amount of truck traffic. Between the year2003 and the year 2020, truck volumes in the region are expected to increase by forty percent.Interstate 10 is the primary corridor for the movement of goods within and through the CoachellaValley and the Banning Pass.
Interstate 10 is an eight-lane freeway located immediately south of the project site which currentlyaccommodates up to 99,000 vehicles per day, many of which are trucks. Caltrans data for Interstate10 at Ramsey Street (approximately three miles west of Apache Trail) indicates that approximately20,313 trucks per day were using Interstate 10 in the project vicinity in the year 2010. These trucksrepresented 18.3 percent of the annual average daily traffic volume.
In 2011, the segment of Interstate 10 located near the project site accommodated an annual averagetraffic volume of 91,000 vehicles per day. The traffic volume on Interstate 10 varies by year as well

3-22
as by season. During the peak month in 2011, the average daily traffic volume on Interstate 10 wasapproximately 99,000 vehicles per day (8.8 percent higher than the annual average day). During thehighest hour of the average day in 2011, approximately 8,900 vehicles per hour (9.8 percent of thedaily traffic volume) traveled past the project site on Interstate 10.
The CARB has estimated that 50 percent or more of the air pollution in Southern California is theresult of motor vehicle emissions. Automobiles and trucks emit four of the six criteria pollutantsincluding: carbon monoxide (which is highly toxic), volatile organic compounds (hydrocarbons),nitrogen oxides, and airborne particulate matter. In addition to criteria pollutants, heavy-duty dieseltrucks emit diesel particulate matter (DPM) which has been identified by the CARB as a toxic aircontaminant. Chronic exposure to benzene, a hazardous toxic air pollutant damages bone marrowand can depress the immune system increasing the potential for infection and cancer.
Motor vehicle emissions contain gaseous pollutants, fine particulate matter, ultrafine particles(UFP), metals, organic material, black carbon, VOC, NOx, and CO. Although ultrafine particles aretoxic and have been shown to have adverse health impacts, they are not regulated at this time.Concern has been growing regarding the potential health effects on people living near majorroadways and freeways caused by their exposure to criteria pollutants and air toxics emitted bygasoline and diesel vehicles. Recent studies have identified living near major roadways as a riskfactor for respiratory and cardiovascular problems as well as other health-related problemsincluding lung cancer and premature death. Motor vehicles also emit carbon dioxide, a greenhousegas, thought to play a significant role in climate change.
The available data show that potential cancer risks decrease with distance and the relative exposureand health risk drop substantially within the first 300 feet from the downwind edge of a freeway orrural travel corridor with more than 50,000 vehicles per day. The carcinogenic health risk at 300feet from the upwind side of the freeway is much less than that at the same distance from thedownwind side.11 The CARB has determined that a separation of 500 feet between sensitive landuses and freeways or busy traffic corridors can reduce localized air pollution exposures by as muchas 80 percent.
Traffic volumes and speeds change continuously, as do the number of heavy diesel trucks and lowemission vehicles on the freeway and the localized wind direction and speed. Changing weatherconditions (such as the ambient temperature, humidity, inversion height, and atmospheric stability)alter the mixing height and affect the dispersion of air contaminants. As a result, the concentrationsof various air contaminants found near freeways change constantly and will change in the future asnumerous control measures included in the State Implementation Plan and the CARB Diesel RiskReduction Plan are fully implemented. The emission control standards for passenger vehicles andon-road heavy diesel trucks will become more stringent over time, and the characteristics of thefuels being used will also change over time to reduce emissions. The CARB Diesel Risk ReductionPlan proposes a three-pronged approach that would require: the use of low-sulfur diesel fuel;retrofitting existing engines with PM filters; and nearly a 90 percent reduction of PM emissionsfrom all new diesel engines and vehicles.
3.6 REGULATORY SETTING
The federal Clean Air Act (CAA) governs air quality by directing federal, state and local agencies toregulate activities that generate air pollutants. The U.S. Environmental Protection Agency (U.S.EPA) is responsible for reducing air pollution nationwide and limiting the emissions of airpollutants coming from industrial and other stationary air pollution sources as well as mobile
11 California EPA and CARB; Air Quality and Land Use Handbook: A Community Health Perspective; April
2005; pg. 9-10.

3-23
sources (i.e., on-road motor vehicles and non-road sources such as airplanes, trains, ships, boats,construction equipment, farm machinery etc.).
Section 109 of the CAA requires the U.S. EPA to set NAAQS for pollutants considered to beharmful to human health or the environment. These standards limit how much of certain airpollutants can be in the air anywhere in the United States. The U.S. EPA has established standardsfor six pollutants known as “criteria” pollutants including: CO, NO2, ground-level ozone, lead,particulate matter (PM10 and PM2.5), and SO2. Under the provisions of Section 107 of the CAA,the U.S. EPA designates areas as attainment, nonattainment, or unclassifiable for the criteriapollutants. The U.S. EPA works with state governors and tribal government leaders to identify"nonattainment" areas where the air does not meet allowable limits for a common air pollutant.
Tribal governments monitor air quality, inspect facilities under their jurisdictions, and enforce thefederal Clean Air Act regulations. In the 1990 revision of the Clean Air Act, Congress recognizedthat Indian Tribes have the authority to implement air pollution control programs. The U.S. EPA'sTribal Authority Rule gives tribes the ability to develop air quality management programs, writerules to reduce air pollution and implement and enforce their rules in Indian country. While stateand local agencies are responsible for all Clean Air Act requirements, tribes may develop andimplement only those parts of the Clean Air Act that are appropriate for their lands.
States and tribes do much of the planning necessary to reduce common air pollutants to allowablelevels by developing air quality control plans called State/Tribal Implementation Plans. While notrequired to do so, an eligible tribe may develop its own Tribal Implementation Plan (TIP) forapproval by the U.S. EPA. Once approved, a TIP is legally binding under both tribal and federallaw and may be enforced by the tribe, the U.S. EPA, and the public. If a plan does not meet thenecessary requirements, EPA can issue sanctions and, if necessary, take over enforcing the CleanAir Act in that area.
On June 10, 2011 the EPA finalized a Federal Implementation Plan (FIP) to ensure that CAApermitting requirements are applied consistently to facilities in Indian country to protect air qualityin these areas. The FIP fills a regulatory gap by clarifying the pre-construction air pollutant permitprocess (New Source Review) for large and small facilities which are air pollutant sources andensuring that any increases in emissions from these facilities will not significantly impact air qualityin surrounding areas. Tribes that choose to implement the rules can accept delegation of the FIP ordevelop and seek approval of a Tribal Implementation Plan (TIP) to administer these rules orportions of them, which could include some enforcement authority.
States and tribes often use a permit system as part of their plan to make sure power plants, factories,and other pollution sources meet their goals of attaining the NAAQS. Other Clean Air Actprograms for which tribes may receive approval or delegation include: the Title V permit program,New Source Performance Standards, and National Emission Standards for Hazardous AirPollutants. Tribal New Source Review rules are being developed that will help the U.S. EPAaddress air quality problems in Indian country in cases where a tribe may be unable to do sothemselves. Through the permitting process, these air pollution sources can be required to installthe best available control technology (BACT) and assess their impacts on air quality includingpotential impacts on Class I areas such as national parks and wilderness areas.
Tribes seeking to clean up air pollution are sometimes unable to meet the NAAQS because ofpollution blowing in from other upwind areas. The Clean Air Act has a number of programsdesigned to reduce long-range transport of pollution to ensure that emissions from sources in onearea are not contributing significantly to public health problems in downwind areas that fail to meetthe NAAQS. The Clean Air Act gives any tribe the authority to ask the U.S. EPA to set emissionlimits for specific sources of pollution in other (upwind) areas that significantly contribute to its air

3-24
quality problems. Tribes can petition the U.S. EPA to require the upwind areas to reduce airpollution.
Conformity is a process mandated by the federal CAA to ensure that federal actions do not impedeattainment of the federal health-based ambient air quality standards. General conformityrequirements can be found in Section 176(c) of the CAA. On April 5, 2010, the U.S. EPA issuedthe General Conformity Rule final revision which included annual de minimis levels established foruse in demonstrating conformity. 40 CFR 93§153 defines de minimis levels as the minimumthreshold for which a conformity determination must be performed for various criteria pollutants invarious areas. Both the General Conformity12 and NSR regulations13 require that reductions beenforceable by both the State and EPA.
FEDERAL CLEAN AIR ACT REQUIREMENTS
The Clean Air Act (CAA) is a federal law covering the entire country which requires the adoption ofnational ambient air quality standards (NAAQS) to ensure public health and welfare andenvironmental protection from air pollution. Indian tribes have express authority under the 1990CAA to manage air quality on their reservations. The Clean Air Act gives the U.S. EPA theauthority to limit emissions of air pollutants coming from air pollution sources like industrial plants,and utilities. Individual states or tribes may have stronger air pollution laws, but they may not haveweaker pollution limits than those set by EPA.
Section 110 of the CAA requires that each State adopt a plan which provides for implementation,maintenance and enforcement of the primary and secondary national air quality standards in thatstate. That requirement is met by the State Implementation Plan (SIP). The U.S. EPA mustapprove state, tribal, and local agency plans for reducing air pollution. If a plan does not meet thenecessary requirements, EPA can issue sanctions against the state and, if necessary, take overenforcing the Clean Air Act in that area.
The federal CAA prohibits federal departments and agencies or other agencies from acting onbehalf of the federal government, and the Metropolitan Planning Organization (MPO) fromengaging in, supporting in any way, providing financial assistance for, licensing, permitting, orapproving any activity that does not conform to the SIP. The Coachella Valley Association ofGovernments (CVAG) is the MPO for the Coachella Valley. Federal law requires that a proposedproject conform with the SIP.
The November 1990 amendments to the federal CAA were intended to intensify air pollutioncontrol efforts across the nation. The CAA identified specific emission reduction goals, requiredboth a demonstration of reasonable further progress (an incremental reduction in emissions ofrelevant air pollutants needed to ensure attainment of the national ambient air quality standards orNAAQS by the applicable date) and an attainment demonstration, and incorporates more stringentsanctions for failure to attain or to meet interim milestones.
GENERAL CONFORMITY
The goal of conformity is to ensure that federal funding and approvals are given to activities that areconsistent with air quality goals. The federal Clean Air Act requires federal projects to conform tothe purpose of the State Implementation Plan (SIP). Conformity to a SIP means that such activitieswill not cause or contribute to any new violations of the NAAQS; increase the frequency or severityof the NAAQS violations; or delay timely attainment of the NAAQS or any required interimmilestone. Conformity requirements apply in areas that either do not meet or previously have not 12 40 C.F.R. 93.152 Emission Offset13 40 C.F.R. 51.165

3-25
met air quality standards for ozone, carbon monoxide, particulate matter, or nitrogen dioxide. Theseareas are known as “nonattainment areas” or “maintenance areas,” respectively.
A conformity determination demonstrates that implementation of the project will not cause any newviolations of the air quality standard for which an area is designated “nonattainment” or“maintenance” or delay timely attainment of the standard or any interim milestone. Theconformity determination shows that the total emissions from the project are consistent with thegoals for air quality found in the SIP. Project-level conformity indicates that potential localizedemissions impacts are addressed.
A motor vehicle emissions budget is that portion of the total allowable emissions in the SIP that isallocated to on-road mobile sources, such as automobiles, trucks, and buses. It is the level of on-road emissions that the area can have and still meet the SIP goals. The budget acts as a ceiling onemissions from the on-road transportation sector.
THE CALIFORNIA CLEAN AIR AC T
The California Clean Air Act (CCAA), which is generally more stringent than the federal CAA, wassigned into law in 1988 and amended in 1992. The CCAA divides nonattainment areas intocategories with progressively more stringent requirements, based on pollutant levels monitoredtherein. The CCAA establishes a legal mandate to achieve health-based state air quality standards atthe earliest practicable date that is generally more stringent than the federal CAA. Serious andabove nonattainment areas are required to revise their AQMP to include specified emissionreduction strategies and to meet milestones in implementing emission controls and achieving betterair quality.
The Coachella Valley exceeds the federal ozone standard and is classified as a “Severe-15” ozonenonattainment area. Pollutant transport from the SCAB to the Salton Sea Air Basin through theBanning Pass is the primary cause of the high ozone concentrations found in Indio and PalmSprings in the late afternoon and early evening. Air pollutant emissions within the SCAB arebetween five and fifty times greater than emissions in the Coachella Valley, depending on whichpollutant is considered. Consequently, improved air quality within the Coachella Valley depends onsubstantial emission reductions in the SCAB. Since the SCAB is also designated a nonattainmentarea for ozone, the Coachella Valley may only be able to attain the ozone standard after the SCABreduces emissions of ozone precursors (CO, VOCs and NOx).
Meeting the rate-of-progress requirements of the CAA in rapidly growing areas like the CoachellaValley is difficult. With the control strategy for the SCAB described in the Final 2007 AQMP, thefederal ozone standard can only be attained by the Coachella Valley if further control of locally-generated VOC emissions occurs via state and federal regulations.
The federal Clean Air Act requires the Coachella Valley to: (1) identify specific emission reductiongoals; (2) demonstrate reasonable further progress in VOC emission reductions; (3) demonstrateattainment of the federal ozone standard; and (4) provide contingency actions in the event thatinterim milestones are not met. These requirements are addressed by the Final 2007 AQMP, whichalso satisfies the State Implementation Plan requirements under Title I of the CAA.
REGIONAL AIR QUALITY MANAGEMENT PLAN (AQMP)
Southern California is far from meeting all of the federal and state ambient air quality standards.The current regional strategy to attain the ambient air quality standards relies on incrementalchanges in the SCAQMD Rules and Regulations (a command-and control regulatory structure)supplemented by market incentive and compliance flexibility strategies. To attain the federalstandards, Southern California must significantly accelerate its pollution reduction efforts. The

3-26
SCAQMD is attempting to identify the most effective strategies to improve air quality; maintain ahealthy economy; coordinate their efforts with others; and meet applicable transportation, energyand climate objectives.
The SCAQMD leads the regional effort to attain the state and federal ambient air quality standards.The SCAQMD also develops and implements the Air Quality Management Plan (AQMP). TheAQMP is the region’s comprehensive multi-year control strategy to reduce air pollution fromstationary sources, on-road and off-road mobile sources, and area sources to ensure continuedprogress toward attainment, and comply with state and federal requirements. The federal CAArequires the SCAB (a 24-hour PM2.5 non-attainment area) to prepare and submit a SIPdemonstrating attainment by 2014. It also requires that transportation conformity budgets beestablished based on the most recent planning assumptions (within the last 5 years) and approvedmotor vehicle emission models.
The Draft 2012 AQMP demonstrates attainment of the federal 24-hour PM2.5 standard by 2014 inthe SCAB through adoption of all feasible measures. It revises the U.S. EPA approved 8-hourozone control plan with new commitments for short-term NOx and VOC reductions and updatedemissions inventories and projections. Specific measures that assist in attaining the 1997 8-hourozone (80 ppb) standard by 2023 are included. It builds upon the approaches in the 2007 AQMPfor the attainment of federal PM and ozone standards and shows that additional strategies areneeded (especially for mobile sources) to meet all federal criteria pollutant standards within the timeframes allowed under the federal Clean Air Act.
The purpose of the AQMP is to set forth a comprehensive program to lead the South Coast AirBasin and the desert portion of Riverside County in the Salton Sea Air Basin (including theCoachella Valley) into compliance with all national and state air quality standards. The newestfederal PM2.5 and 8-hour surface-level ozone standards are more stringent than previous standards.Consequently, meeting the federal Clean Air Act deadlines over the next twenty years will bechallenging. Effective strategies are required to improve air quality and meet related transportation,energy, and climate objectives.
Compliance with the provisions of the federal CAA and CCAA is the primary focus of the Final2007 Air Quality Management Plan developed by the SCAQMD and SCAG. Since localgovernment provides the primary focus of land use and growth management decisions, no airquality management plan can succeed without the active participation of local government. Most ofthe control measures relating to local government are in the areas of trip reduction, energyconservation, and dust control.
Consistent with the need to reduce emissions from mobile sources, many control measures focuson alternatives to current transportation strategies. Ride sharing, carpooling, flexible workschedules, parking management and the acquisition of clean-fueled fleet vehicles are a few of thetransportation control measures to be considered for adoption by affected cities and counties. Measures which call upon local jurisdictions to develop more efficient management programs forsolid waste including: (1) recycling programs; (2) energy conservation programs; and (3) programsto reduce fugitive dust emissions are also included. Nearly all of the measures call for the adoptionof ordinances to implement control programs.
Control strategies from the AQMP that should be considered for adoption by local governmentsinclude: (1) emission reductions from paved roads, unpaved roads, unpaved parking lots andstaging areas (SCAQMD Rule 403); (2) promotion of lighter color roofing and road materials andtree planting programs; (3) advanced transportation technology incentive programs such astelecommunications, advanced shuttle transit, zero-emission vehicles, alternative fuel vehicles andIntelligent Vehicle Highway Systems.

3-27
Local governments are also responsible for participating in voluntary supportive programs. Theseprograms include implementing transportation improvements called for in the AQMP, coordinatingwith SCAG and CVAG regarding regional transportation projects, programs and plans thatconform to the State Implementation Plan, and developing and adopting ordinances to comply withthe CMP.
Transportation Control Measures (TCMs) are specific projects or programs designed to reduceemissions from transportation sources that are included in the approved SIP. Emissions can bereduced by reducing vehicle use, changing traffic flow, or changing congestion conditions.Examples include programs for improving public transportation, developing high occupancy vehicle(HOV) lanes, improving vanpooling programs, and ordinances to promote non-motorized vehicletravel. Most AQMP TCMs included in the RTIP are designed to relieve congestion, reduceemissions from idling vehicles, and help maintain the Congestion Management Program level ofservice standards. Projects like signal timing, bicycle lanes, coordinating land use planning withtransportation planning, encouraging the accelerated use of cleaner fuels (especially low diesel fuel)during construction can help reduce emissions.
Most of the air pollutant emissions and health threat to the residents in the SCAQMD region arecurrently the result of mobile sources including: automobiles, trucks, ships, trains, planes, andconstruction equipment. The 2007 AQMP focuses on measures to reduce mobile source emissionsthrough the accelerated turnover of existing fleets and incentive programs to help fund thereplacement of aging dirty diesel engines and clean up locomotives. The 2007 AQMP alsoaddresses the need to further reduce emissions from stationary sources such as power plants,refineries, dry cleaners, gas stations, and industrial facilities. The 2007 AQMP will help reach thegoal of cutting smog-forming emissions an additional 50 percent by the year 2020.
The U.S. EPA approved the 8-hour ozone SIP portion of the 2007 AQMP in 2011. The 2007AQMP demonstrated attainment with the 8-hour ozone standard by the year 2023 using a provisionof the federal CAA that allows credit for emissions reductions from future improvements in controltechniques and technologies. These reductions still account for 65 percent of the remaining NOxemissions reductions needed in 2023. The Draft 2012 AQMP updates certain portions of the 8-hour ozone control plan approved by the U.S. EPA to include new implementation controlmeasures and commitments for short-term NOx and VOC emissions reductions to meet the 2023attainment deadline.
The Draft 2012 AQMP is the latest update of the comprehensive regional plan with all feasiblecontrol measures to attain the health-based federal 24-hour PM2.5 standard by the year 2014 in theSCAB. It also updates the air quality status of the Coachella Valley portion of the Salton Sea AirBasin. A strategy focused on NOx reductions has been identified as the most effective way toachieve both the ozone and PM2.5 attainment objectives.
STATE IMPLEMENTATION PLAN
The SIP is the state air quality plan for meeting the NAAQS. It is a compilation of legallyenforceable rules and regulations prepared by a State or local air quality agency and submitted bythe State’s governor to the U.S. EPA for approval. A SIP is designed to achieve better air qualityby attaining, making progress toward attaining, or maintaining the NAAQS. The SIP accounts foreach pollutant for each source type. There are four types of sources: (1) on-road mobile sources,(2) non-road mobile sources (trains, boats, planes, construction equipment), (3) stationary sources(refineries etc.), and (4) area sources ( dry cleaners). The SCAQMD and CARB identify howpollution from all sources will be reduced sufficiently to achieve the purpose of the SIP. Requiredemissions reductions are calculated and control measures are adopted to achieve needed reductions.

3-28
On April 18, 2003, the U.S. EPA approved the 2002 Coachella Valley State Implementation Plan(2002 CVSIP) which addressed attainment of the PM10 standards by building upon a historicallyproactive and successful dust control program carried out by local jurisdictions in the CoachellaValley and the SCAQMD. The 2002 CVSIP established additional controls needed to demonstrateexpeditious attainment of the standards such as:
• additional stabilizing or paving of unpaved surfaces, including parking lots;
• a prohibition on building new unpaved roads;
• requiring more detailed dust control plans from builders in the valley that specify theuse of more aggressive and frequent watering, soil stabilization, wind screens, andphased development as opposed to mass grading to minimize dust;
• designating a worker to monitor dust control at construction sites; and
• testing requirements for soil and road surfaces.
The Final 2003 Coachella Valley PM10 SIP revised the 2002 CVSIP to reflect updated planningassumptions, fugitive dust source emissions estimates, mobile source emissions estimates, andattainment modeling. The 2002 CVSIP control strategies and control measure commitments werenot revised. The 2003 CVSIP was approved by the U.S. EPA on December 14, 2005.
Over the past five years, annual average PM10 concentrations have met the levels of the revokedfederal annual standard (50 μg/m3) and the peak 24-hour average PM10 concentrations have notexceeded the current federal standard (150 μg/m3). The Coachella Valley is currently eligible forredesignation as attainment. Requests have been submitted to the U.S. EPA to re-designate theCoachella Valley and SCAB as attainment for PM10. These redesignations are currently pending.On February 25, 2010, the CARB approved the 2010 Coachella Valley PM10 Maintenance Planand transmitted it to the U.S. EPA for approval.
The U.S. EPA has designated the SCAB nonattainment for the national PM2.5 standards. TheCoachella Valley is designated by the U.S. EPA as unclassifiable/attainment of this standard. TheRevised Draft 2012 AQMP addresses the Clean Air Act planning requirements for the 24-hourPM2.5 standard in the SCAB, not the Coachella Valley.
The PM2.5 portion of the 2007 AQMP is the adopted State Implementation Plan to achievecompliance with the NAAQS for PM2.5. The majority of the PM2.5 portion of the 2007 AQMPhas been approved by the U.S. EPA. The only exception was the failure to meet contingencymeasure requirements. In 2011, the SCAQMD submitted a PM2.5 SIP revision designed to meetthe contingency measure requirement for the annual PM2.5 SIP.
The U.S. EPA has designated the SCAB and the Coachella Valley portion of the SSAB asnonattainment for the national ozone standards. The 2007 AQMP addressed the Clean Air Actplanning requirements for ozone in the SCAB and the Coachella Valley portion of the SSAB. Theozone portion of the 2007 AQMP was approved by the U.S. EPA into the 8-hour ozone SIP in2011.
The Revised Draft 2012 AQMP for the SCAB is the current regional plan to achieve compliancewith the 2006 health-based federal NAAQS for the 24-hour PM2.5 standard and the federal 8-hourozone standards. Once this plan is approved by the CARB, it will be submitted to the U.S. EPA asthe State Implementation Plan (SIP). The Revised Draft 2012 AQMP addresses the Clean Air Actplanning requirements for the 24-hour PM2.5 standard in the SCAB, not the Coachella Valley. TheCoachella Valley is designated by the U.S. EPA as unclassifiable/attainment for this standard.

3-29
SENATE BILL 375
In 2008, the passage of Senate Bill 375 required the CARB to develop regional GHG reductiontargets for the year 2020 and the year 2035 for passenger vehicle emissions. These GHG targetsinclude: an 8 percent reduction below 2005 levels on a per capita basis by the year 2020 and a 13percent reduction by the year 2035. The SCAG used these targets to develop a SustainableCommunities Strategy integrating land use, housing, and transportation planning in the 2012Regional Transportation Plan (2012 RTP).
The 2012 RTP promotes higher residential and employment densities in high quality transit (HQT)areas and encourages transit-oriented development to reduce the total vehicle miles traveled (VMT)by locating homes and jobs closer to public transportation. Much of the transit network is locatedin close proximity to existing freeways. Consequently, many of the HQT areas are also nearfreeways. Implementation of the 2012 RTP would result in 282,000 households in the SCAGregion located within 500 feet of a freeway and within an HQT area in the year 2035.14
SENATE BILL 97 AND ASSEMBLY BILL 32
The Global Warming Solutions Act of 2006 (AB-32) seeks to reduce GHG emissions in Californiato 1990 levels by the year 2020. To address the long-term adverse impacts associated with globalclimate change, implementation of the Governor’s Executive Order S-3-05 would also reduceGHG emissions in California 80 percent below 1990 levels or 90 percent below current levels bythe year 2050. Achieving this objective would contribute to efforts being made around the globe tostabilize the global climate by capping GHG concentrations at 450 ppm.
To achieve the 2020 goal, the CARB plans to use both voluntary and regulatory measures to reduceGHG emissions. One measure known as the “cap-and-trade” program went into effect in Januaryof 2013. It would establish a cap on GHG emissions for California’s largest emitters (i.e., facilitieswith annual emissions greater than 25,000 MT of CO2e).
New or modified projects must be analyzed pursuant to CEQA and mitigated to the maximumextent feasible. With the passage of Assembly Bill 32 in California, environmental documents forprojects pursuant to CEQA are required to analyze greenhouse gases and assess the potentialsignificance of GHG emission impacts. However, there is currently no statewide threshold forGHG emissions for use in making a determination regarding the significance of environmentaleffects related to GHG emissions in the environmental review process.
The SCAQMD has adopted an interim GHG significance threshold for permitting activities relatedto industrial (stationary source) projects for which the SCAQMD is the lead agency. The thresholdis 10,000 metric tons per year of CO2 equivalent (MT/year of CO2e) emissions. This thresholdincludes construction emissions amortized over 30 years and added to the operational GHGemissions. Although an interim screening level of 3,000 MT/year of CO2e emissions wasidentified by the SCAQMD for new mixed-use residential and commercial projects, it was notrecommended for use at this time.
SCAQMD RULES AND REGULATIONS
The SCAQMD is responsible for controlling stationary air pollution sources. The SCAQMDRules and Regulations address a wide variety of industrial and commercial operations and requireoperational controls on many processes. The SCAQMD establishes Permit to Construct and 14 SCAQMD; Revised Draft 2012 AQMP; September 2012; pg. 9-25. High quality transit areas are the 0.5-mile
corridor surrounding a fixed bus route (or the intersection of two or more major bus routes) with service intervalsno longer than 15 minutes during peak commute hours.

3-30
Permit to Operate requirements, inspects emissions sources, and enforces rules and regulationsthrough educational programs and fines. Rule 1108 specifies the content of cutback asphalt.
Studies indicate that one-third of the SCAB ambient PM10 concentrations and 90 percent of theCoachella Valley PM10 levels are the result of soil dust entrainment (fugitive dust). Rule 403(Fugitive Dust) specifies control measures for use in developing site specific fugitive dust controlplans to minimize blowing dust from construction sites and insure the clean up of construction-related dirt on approach routes to the site including: watering measures, chemical stabilizers, windfencing, covering haul vehicles, bed liners in haul vehicles, wheel washers, and high wind measures.Rule 403 also prohibits the release of fugitive dust emissions from any active operation, openstorage pile, or disturbed surface area beyond the property line of the emission source and prohibitsparticulate matter deposits on public roadways.
In April of 2004, Rule 403 (Fugitive Dust), Rule 1186 (PM10 Emission Reduction from Paved andUnpaved Roads and Livestock Operations), and Rule 403.1 (Supplemental Fugitive Dust ControlRequirements for Coachella Valley Sources) were amended. The amended rules increase thestringency of current Best Available Control Measures (BACM) for many dust sources including:construction and related operations, roadways, Coachella Valley farming, and weed abatementactivities. The amendments will reduce 1.7 tons per day of PM10 emissions from construction,road and agricultural sources. The amendments implement the 2003 AQMP control measureBCM-07 and the SCAQMD rule making portion of the 2002 CVSIP.
SCAQMD PERMITTING REQUIREMENTS FOR FACILITIES EMITTING TACs
The SCAQMD establishes permitting requirements, adopts rules regulating the operation of thesources of toxic contaminants, inspects emission sources, and enforces emission control programrequirements through education and by levying fines. The SCAQMD also verifies for leadagencies all permitted and non-permitted sources of air pollutants that might significantly affect thehealth of students and staff at school sites.
The SCAQMD has developed a number of rules and regulations directed at HAPs to meet state andfederal requirements. Through its Title V permitting program, the SCAQMD implements thenational emission standards for HAPs when they are promulgated by insuring that maximumavailable control technology is implemented by major sources to reduce HAP emissions by newand existing sources. These regulations require that sources of hazardous materials or criteriapollutants above threshold levels obtain permits prior to operation of the facility.
The SCAQMD reviews the potential for TAC emissions from new and modified stationary sourcesand regulates levels of air toxics through the District permitting process for stationary sourceswhich covers both construction and operation. Rule 1401 specifies thresholds for maximumindividual cancer risk from new or modified stationary sources which emit carcinogenic air toxins(with or without best available control technology for toxics (T-BACT).
HAZARDOUS AND TOXIC AIR CONTAMINANTS (TACS)
Hazardous substances that are released into the air are called air toxics. Air toxics are often called"non-criteria" pollutants because ambient air standards have not been established for them. Toxicair contaminants (TACs) are diverse and their effects on health tend to be local rather than regional.There are hundreds of air toxics. Exposure to these pollutants can cause or contribute to cancer,birth defects, genetic damage, and other adverse health effects.
Toxic air contaminants pose health risks to those who are exposed. The regulatory approach usedin controlling toxic air pollutant levels relies on a quantitative risk assessment process to determineallowable emissions from the source, rather than on ambient air concentrations. Local

3-31
concentrations that can pose a significant health risk are termed "toxic hot spots." Several studieshave shown that risk decreases dramatically with increased distance from the source of theemissions.
Young people, the elderly, pregnant women, and people with existing health problems areparticularly susceptible to health effects associated with toxic emissions from certain types ofsources. Occupants of land uses such as schools, hospitals, convalescent homes, and daycarefacilities are considered sensitive receptors. Residential areas are also considered sensitivereceptors, since residents are at home for extended periods of time, which can cause relatively longexposures to air contaminants that are present.
Exposure to toxic compounds can cause a variety of health effects including neurological,respiratory, and developmental effects as well as cancer. Toxic air pollutants may have both chroniceffects (long duration) and acute effects (severe but of short duration) on human health. Chronichealth effects, such as cancer, result from low-dose, long-term exposure from routine releases of airtoxics. Acute health effects are due to sudden exposure to high concentrations of air toxics. Theseeffects may include nausea, skin irritation, respiratory illness, and, in some cases, death.
Title III of the federal Clean Air Act provides a program for the control of Hazardous Air Pollutants(HAPs). Pursuant to Section 112(g) of the federal Clean Air Act (Federal New Source Review forToxics), no person shall begin construction or reconstruction of a major stationary source emittinghazardous air pollutants listed in Section 112 (b) of the CAA, unless the source is constructed withthe Best Available Control Technology for Toxics (T-BACT) and complies with all other applicablerequirements, including public noticing, referenced in 40 CFR 63.40 through 63.44.15
The regulatory approach used in controlling toxic air pollutant levels relies on a quantitative riskassessment process to determine allowable emissions from the source, rather than on ambient airconcentrations. For carcinogenic air pollutants, there is no safe recognized concentration in theatmosphere. Local concentrations that can pose a significant health risk are termed "toxic hotspots."
The SCAQMD and the CARB are responsible for developing and implementing rules andregulations regarding air toxics on the local level. The SCAQMD and the CARB have strongcomprehensive regulatory programs in place for new and existing sources of air pollution. TheSCAQMD has developed a number of rules and regulations directed at HAPs to meet state andfederal requirements. Through its Title V permitting program, the SCAQMD implements thenational emission standards for HAPs when they are promulgated by insuring that maximumavailable control technology is implemented by major sources to reduce HAP emissions by newand existing sources. These regulations require that sources of hazardous materials or criteriapollutants above threshold levels obtain permits prior to operation of the facility.
15 U.S. EPA. 40 CFR Part 63 Hazardous Air Pollutants: Regulations Governing Constructed or Reconstructed
Major Sources; Final Rule. Federal Register: December 27, 1996 (Volume 61, Number 250) Rules andRegulations [Page 68383-68404]. From the Federal Register Online via GPO Access [wais.acess.gpo.gov]

4-1
4.0 AIR QUALITY CONSEQUENCES
The analysis in an Environmental Assessment (EA) need not go beyond that needed to determinewhether impacts will or may significantly affect the human environment. The effects analyzedinclude direct, indirect, and cumulative effects. For each type of effect, those that are short-term,long-term, irreversible, and irretrievable should be considered. The significance of the effects iscritical in that it determines if there will be a need to complete an Environmental Impact Statement(EIS).
Agencies should not rely on the possibility of mitigation as an excuse to avoid the EIS requirement.However, if an EA indicates that the environmental effects of a proposal are significant but that, withmitigation, those effects may be reduced to less than significant levels, the lead agency may make aFinding of No Significant Impact (FONSI) rather than prepare an EIS, provided that: (1) themitigation measures are imposed by statute or regulation; or (2) the mitigation measures aresubmitted by an applicant as part of the original proposal; or (3) the proposal so integratesmitigation from the beginning that is impossible to define the proposal without including themitigation. In such cases, the agency may rely on the mitigation measures as a binding commitmentin determining that the overall effects would not be significant and make the FONSI and EAavailable for 30 days of public comment before taking action.
THE ROLE OF TRIBAL GOVERNMENT
The proposed action would result in regional emissions and localized emissions of criteriapollutants, toxic air contaminants, and greenhouse gases. The public review process providesopportunities to define issues and appropriate alternatives as well as environmental ethics that areconsistent with accepted local values for incorporation in the decision-making process. Theresponsibility for making decisions regarding the significance of a proposed project’s air qualityimpacts ultimately rests with the lead agency. Because there may be differences in perspective aswell as conflicts among federal, state, and local goals for resources management the Tribalgovernment has adopted a flexible and cooperative approach in reaching a rational and balanceddecision.
The impact of air pollutants on sensitive receptors can be controlled through land use decisions anddiscretionary permits. Land use decisions are typically based upon numerous considerations suchas the following.
• What is the intensity and type of project?• What is the location of the project (i.e. upwind of sensitive receptors or in areas with
high pollutant concentrations where the environmental burdens of the project wouldbe borne primarily by residents of a low-income community alreadydisproportionately affected by motor vehicle exhaust and air pollution generated inneighboring areas)?
• Will the project cause an exceedance of any air quality standard?• Will the project make a substantial contribution to an existing exceedance of an air
quality standard?• Is the project inconsistent with the regional Air Quality Management Plan and State
Implementation Plan?

4-2
• Will the project emit toxic air contaminants (TACs) within one-quarter mile of asensitive receptor?
• Will the project causes increases in particulate pollution that exacerbates asthma andcan cause cancer?
• Will the project achieve sustainable decreases in greenhouse gas emissions?• Is the action related to other actions with individually insignificant but cumulatively
significant impacts?• Will the mitigation measures that are attached to the project mitigate the air quality
impacts to the maximum extent feasible?
The South Coast Air Quality Management District (SCAQMD) is responsible for adopting,implementing and enforcing air quality rules and regulations within the South Coast Air Basin andthe Salton Sea Air Basin. The SCAQMD is also responsible for reviewing and commenting onenvironmental documents for projects that may generate significant adverse air quality impacts. TheSCAQMD advises lead agencies in addressing and mitigating the potential adverse air qualityimpacts caused by projects both during and after construction.
4.1 METHODOLOGY
The following air quality impact analysis focuses on the impacts associated with criteria pollutants,greenhouse gases (GHGs), and toxic air contaminants (TACs). Project-related construction andoperational emissions of criteria pollutants were estimated with the California Emissions EstimatorModel (CalEEMod) Version 2011.1.1. CalEEMod provides construction-related and operationalemissions estimates for criteria pollutants (including PM2.5) and greenhouse gases (includingmethane and nitrous oxides).
CalEEMod has been approved by the CARB and the SCAQMD for use in addressing air qualityand climate change impacts in CEQA compliant documents. CalEEMod uses widely acceptedmodels for emission estimates combined with appropriate default data for use if site-specific data isnot available. The model and default estimates use sources such as the U.S. EPA AP-42 emissionfactors, CARB’s EMFAC2007 (Version 2.3) on-road mobile source emission factors and CARB’s2007 OFFROAD emission factors for off-road mobile sources. These emission factors were alsoused to develop the 2007 AQMP and State Implementation Plan.
CalEEMod incorporates the project location, climate zone, utility company providing electricity, anddefault values for trip purpose percentages and average trip lengths by trip type. The model canevaluate conditions when construction phases overlap, and incorporates as default parametersregional vehicle fleet mix and travel characteristics representative of the South Coast Air Basin andthe Coachella Valley portion of the Salton Sea Air Basin. The default trip generation ratesincorporated in CalEEMod were modified to reflect the trip generation forecast developed in theDraft Traffic Impact Analysis For the Proposed Morongo Outdoor Entertainment Project (Crain& Associates; February, 2013). Annual average emissions quantified with CalEEMod were utilizedfor the impact analysis to facilitate comparisons to the U.S. EPA General Conformity de minimislevels. These de minimis levels represent the minimum thresholds for which a conformitydetermination must be performed for various criteria pollutants in various areas. The CalEEModassumptions and output sheets are provided in Appendix C.
In assessing whether or not the project would cause an exceedance of the national ambient airquality standards, the California Line Source Dispersion Model (CALINE4) was utilized tosimulate future conditions adjacent to those roadways which are projected to be the most heavilyused by project-related traffic. Future traffic projections modeled with CALINE4 were derived

4-3
from the Draft Traffic Impact Analysis For the Proposed Morongo Outdoor EntertainmentProject (Crain & Associates; February, 2013).
The potential effect of the proposed project on climate change was evaluated in terms of the quantityof greenhouse gases that would be emitted during both the short-term construction activities and thelong-term operation of the project. CalEEMod was utilized to quantify annual average CO2eemissions that would be result from the proposed action, based upon the global warming potentialof the six greenhouse gases subject to regulation by the U.S. EPA (carbon dioxide, nitrous oxide,methane, hydrofluorocarbons, perfluorocarbons, and sulfur hexafluoride). CalEEMod was alsoutilized to quantify the beneficial impacts associated with project design features that would result inreductions in greenhouse gases from the proposed change in on-site vegetation and sequestration.
Both NEPA and the California Environmental Quality Act (CEQA) require that environmentalimpacts be considered in context. Special attention should be paid to whether a project might causeadditional impacts to communities that are already affected by, or particularly vulnerable to,environmental impacts like air pollution that affect public health and welfare. To evaluate thisimpact, public health risks and environmental justice concerns were identified to ensure thatobligations to improve living conditions and foster the physical health and well-being of localresidents are taken seriously in the decision-making process. This approach ensures that impacts toalready affected communities will not be overlooked in the project permitting process.
Sensitive receptor locations were identified as well a local sources of air contaminants in Section 3.4and Section 3.5, respectively. The potential for project-related emissions of hazardous or toxic aircontaminants (TACs) within one-quarter mile of a sensitive receptor was evaluated. The potentialhealth risks associated with the inhalation of diesel particulate matter and other toxic aircontaminants are addressed.
4.2 NEPA IMPACT SIGNIFICANCE CONSIDERATIONS
Significance varies with the setting of the proposed action. As used in NEPA, the determination ofsignificance requires consideration of both context and intensity. The significance of an actionmust be considered in several contexts including: society as a whole (human, national), the affectedregion, the affected interests, and the locality. Both short-term and long-term effects are relevant.
Intensity refers to the severity of the impact. In evaluating intensity, the degree to which theproposed action affects public health and safety should be considered. The degree to which thepossible effects on the human environment are highly uncertain or involve unique or unknown risksshould be considered. The degree to which the action may establish a precedent for future actionswith significant effects should be considered. Whether the action threatens a violation of Federal,State, or local law or requirements imposed for the protection of the environment. The degree towhich the action may adversely affect an endangered or threatened species or its habitat that hasbeen determined to be critical under the Endangered Species Act of 1973.
Unique characteristics of the geographic area such as its proximity to historic or cultural resources,park lands, prime farmlands, wild and scenic areas, or ecologically critical areas should also beconsidered. Class I federal lands include areas such as national parks, national wilderness areas,and national monuments which are granted special air quality protections under Section 162(a) ofthe federal Clean Air Act. 40 CFR Section 51.307 requires the operator of any new majorstationary source or major modification located within 100 kilometers of a Class I area to contactthe Federal Land Managers for that area. Class I areas in EPA Region 9 in the project vicinityinclude: the Joshua Tree National Park (in the Coachella Valley), and the U.S. Forest Service SanGorgonio Wilderness and San Jacinto Wilderness Class I areas.

4-4
Significance thresholds are valuable tools for use by lead agencies in considering both primary or“direct” impacts and secondary or “indirect” impacts on air quality. If the lead agency finds thata project has the potential to generate emissions that would exceed the applicable significancethresholds, the project may have significant adverse regional effects on air quality and mitigationshould be identified. Neither the CEQA Guidelines nor the CEQA statute prescribe thresholds ofsignificance or particular methodologies for performing impact analyses. This is left to thediscretion and judgment of lead agencies, based upon factual data and guidance from regulatoryagencies and others where applicable and available. Even in the absence of clearly definedthresholds of significance, the law requires that when a lead agency determines that a projectcontributes to a significant individual or cumulative impact, such emissions must be disclosed andmitigated to the extent feasible.
Federal actions require a determination regarding the significance of air quality impacts under theNational Environmental Policy Act (NEPA).1 Significance under NEPA differs from GeneralConformity in that emissions of criteria pollutants in attainment as well as nonattainment andattainment-maintenance areas are considered. General Conformity de minimis levels, as shown inTable 4-1, are appropriate thresholds for use in determining NEPA significance. De minimis levelsare defined in 40 CFR 93 § 153 as the minimum threshold for which a conformity determinationmust be performed for various criteria pollutants in various areas. Project actions with total directand indirect emissions below specified de minimis levels are assumed to conform to FederalImplementation Plans and are not subject to a conformity determination.2
Pursuant to section 107(d) of the CAA, the U.S. EPA must designate as “nonattainment” thoseareas that violate the NAAQS and those areas that contribute to violations. In 2009 and again in2012 the Morongo Band of Mission Indians requested that the U.S. EPA designate the Indiancountry of the Morongo Band of Mission Indians as a separate nonattainment area for the 2008ozone NAAQS. The U.S. EPA completed a technical analysis dated December 20, 2012evaluating: (1) ambient air quality data, (2) emissions and emission-related data, (3) meteorologyand pollution transport patterns, (4) geography and topography, and (5) jurisdictional boundaries.Based on that analysis, the U.S. EPA granted the Morongo Band of Mission Indians request todesignate the Morongo Reservation portion of the Indian country in California as a separate ozonenonattainment area.
In determining significance under NEPA, the annual direct and indirect project-related emissions ofall criteria pollutants (including the ozone precursors VOC and NOx) resulting from projectconstruction and operation activities were compared to the lowest U.S. EPA de minimis levelsshown in Table 4-1 based on the nonattainment status of both of the adjacent air basins.
In accordance with section 101(b)(1) and section 160 of the federal Clean Air Act, each state SIPand each applicable Tribal Implementation Plan shall contain emission limitations and othermeasures as necessary to prevent significant deterioration of air quality. Section 176(c) of thefederal CAA requires the U.S. EPA to adopt regulations to ensure that projects sponsored byfederal agencies do not interfere with a state’s ability to meet or maintain the NAAQS. To fulfillthe CAA requirements in 42 U.S.C. 7506(c), the U.S. EPA promulgated the General ConformityRegulations on November 30, 1993 (58 FR 63214-63259). These regulations prevent federalagencies from taking actions in nonattainment and maintenance areas that increase emissions inviolation of the SIP. Compliance with the General Conformity Regulations can be achieved in thefollowing ways: (1) documenting that planned emission increases are included in the existing SIP;(2) persuading the state to include the emission increases in the SIP; (3) offsetting emissionincreases with concurrent emission decreases of the same size; and (4) mitigating the emissions.
1 National Environmental Policy Act of 1969, as amended (42 U.S.C. 4321 et seq.).2 epa.gov/air/genconform/faq.html#9

4-5
Table 4-1General Conformity De Minimis Levelsa
Pollutant Area Type (Region With Specified EPA Designation)b Tons/Year
Ozone (VOC or NOx) Serious Nonattainment (Morongo Band of Mission Indians Land) 50
Severe Nonattainment (SSAB-Coachella Valley) 25
Extreme Nonattainment (SCAB) 10
Other Areas Outside an Ozone Transport Region 100
Ozone (NOx) Marginal and Moderate NonattainmentInside an Ozone Transport Region 100
Maintenance 100
Ozone (VOC) Marginal and Moderate Nonattainment Inside an Ozone Transport Region 50
Maintenance Within an Ozone Transport Region 50
Maintenance Outside an Ozone Transport Region 100
Carbon Monoxide, All nonattainment and maintenance 100SO2, and NO2
PM10 Serious Nonattainment (SSAB-Coachella Valley & SCAB) 70
Moderate Nonattainment and Maintenance 100
PM2.5 All nonattainment and maintenancec 10
PM2.5 (SO2 or NOx) All nonattainment and maintenancec 40
Lead (Pb) All Nonattainment and Maintenance (SCAB-L.A. County) 25
a. Source: 40 CFR 93 § 153. Annual thresholds given in terms of the emissions in tons per year. b. SSAB-Coachella Valley=Coachella Valley portion of the Salton Sea Air Basin. SCAB=South Coast Air
Basin. SCAB-L.A. County=Only the Los Angeles County portion of the South Coast Air Basin.c. Existing U.S. EPA regulations (74FR28333, May 16, 2008) identify 10 tons/year of direct PM2.5
emissions (including condensable PM) as the de minimis significant emissions rate (SER) for use as ascreening tool to facilitate the implementation of the New Source Review program. For PM2.5 precursors,40 tons/year of SO2 and 40 tons/year of NOx were identified by the EPA as the de minimis SER for use asa screening tool per 40CFR 51.166 (b)(23) and 40 CFR 52.21(b)(23) based on both the annual and 24-hourPM2.5 NAAQS.
d. The U.S. EPA Green Book designation as of December 14, 2012 for the Indian country of the MorongoBand of Mission Indians is “serious” nonattainment for the 2008 8-hr. ozone NAAQS.

4-6
All federal actions are subject to general conformity requirements unless otherwise exempt.Exempt actions include: (1) federal actions covered by the Transportation Conformity Regulations;(2) actions with total direct and indirect emissions below specified de minimis levels; (3) actionsspecifically listed as exempt in the rule; and (4) actions included on any list of “presumed toconform” actions.
GREENHOUSE GASES INDICATOR
There is no formally adopted NEPA threshold for GHG emissions for use in making adetermination regarding the significance of environmental effects related to GHG emissions in theenvironmental review process. However, the United States Council on Environmental QualityGuidance (CEQ) issued guidance for consideration by Federal agencies in scoping their NEPAanalyses in the form of a memorandum entitled Draft NEPA Guidance on Consideration of theEffects of Climate Change and Greenhouse Gas Emissions on February 18, 2010. As statedtherein:
“Specifically, if a proposed action would be reasonably anticipated to cause directemissions of 25,000 metric tons or more of CO2-equivalent GHG emissions on anannual basis, agencies should consider this an indicator that a quantitative andqualitative assessment may be meaningful to decision makers and the public.”
For the purposes of this guidance, the CEQ defines GHGs in accordance with Section 19(i) ofExecutive Order 13514 as: carbon dioxide, methane, nitrous oxide, hydrofluorocarbons,perfluorocarbons, and sulfur hexafluoride. The intent of this guidance was to assist in thedetermination of whether analysis of the direct and indirect GHG emissions from proposed actionswould provide meaningful information to decision makers and the public. CEQ does not proposethis as an indicator of a threshold of significant effects, but rather as an indicator of a minimumlevel of GHG emissions that may warrant some description in the appropriate NEPA analysis foragency actions involving direct emissions of GHGs. This level of greenhouse gas emissions isutilized herein as an indicator of whether or not the project-related GHG emissions duringconstruction or operation would result in an adverse impact on climate change that warrants furthermore detailed analysis. The potential effects of GHG emissions on climate change are global andcumulative. Therefore, they are addressed in the context of cumulative impacts in Section 4.6.
TOXIC AIR CONTAMINANT SIGNIFICANCE THRESHOLDS
Unlike other pollutants regulated by the U.S. EPA, there are no risk levels that represent acceptableor unacceptable regulatory thresholds for air toxics. Based on their national-scale toxicsassessment, the U.S. EPA has determined that millions of people live in areas where air toxics maypose potentially significant health concerns. Risk assessments which estimate average populationexposures include many limitations in the data and methods used which introduce significantuncertainties (particularly with respect to emissions levels, exposure concentrations, and toxicity).An upper limit of acceptability of one in 10,000 lifetime cancer risk for highly exposed individualswas set by the U.S. EPA in the 1989 Benzene National Emission Standard for Hazardous AirPollutants. In the same study, the U.S. EPA set a target of protecting the greatest number ofpersons possible to an individual lifetime risk level no higher than approximately one in onemillion.
The U.S. EPA has concluded that diesel exhaust is likely to be a human carcinogen. However, theavailable data is not sufficient for the U.S. EPA to develop a confident estimate of cancer unit riskfor use in health assessments (i.e., to estimate the environmental risk at a particular location basedupon site-specific environmental exposure data). The current diesel exhaust hazard information issufficient to indicate that this pollutant represents a potentially significant public health concern.The U.S. EPA has concluded that national average lifetime cancer risks from exposure to diesel

4-7
exhaust may exceed one in 100,000 and could be as high as one in one thousand, although thelower end of the risk range includes zero.
The SCAQMD has established the following significance thresholds for TACs. • A maximum incremental cancer risk equal to or exceeding ten per million exposed people
provided that the source has the best available control technology for toxics (T-BACT).• A cancer burden greater than 0.5 excess cancer cases (in areas greater than or equal to one
in one million).• Chronic and acute hazard index equal to or greater than 1.0 (project increment).
The SCAQMD has established a significance threshold for odor. A project is consideredsignificant by the SCAQMD if it creates an odor nuisance pursuant to SCAQMD Rule 402.
4.3 SHORT-TERM CONSTRUCTION IMPACTS
During the construction of the proposed development, air pollutants would be emitted by bothstationary and mobile sources of air pollutants. Stationary sources of air pollutants would includethe construction activities under way within the project site that would generate fugitive dust and thepower plant located off-site that would generate the electricity required to implement the proposedproject. Mobile sources of air pollutants would include both on-road vehicles (used to transportworkers and building materials to the site) and off-road construction equipment (such as scrapers,dozers, water trucks, tractor loader/backhoes, and excavators). Mobile sources would emit exhaustemissions during construction activities, and vehicular travel associated with the constructionworkers and the vendors that would deliver perimeter fencing, aggregate for the unpaved parkingareas, trees required for landscaping, hydro seed for the turf, and asphalt for the paved entry roadsand VIP parking area.
Short-term impacts on air quality would occur during the construction activities required toimplement the proposed project. The proposed construction activities would require approximately65 working days to complete. Construction is expected to begin on September 1, 2013 and becompleted within approximately three months. No permanent buildings or structures would beconstructed within the site. No architectural coatings would be used. Refer to Section 2.3 for adescription of the site-specific construction details and Appendix C for the construction informationrequired as input parameters associated with the California Emissions Estimator Model.
Short-term air pollutant emissions during the construction activities would include the following:• Diesel exhaust emissions from: (1) the construction equipment used on-site; (2) the
vehicles used to transport the off-highway construction equipment to/from the site; (3)the haul trucks used to import the 89,100 tons of aggregate required to cover 128.1acres of the unpaved parking areas on-site; (4) the trucks used to transport 15,000linear feet of perimeter chain link fencing and landscaping (2,000 trees and hydro seedrequired for 100 acres of turf);
• Exhaust and on-road fugitive dust emissions from the vehicles of constructionworkers and vendors;
• Particulate emissions (fugitive dust) during: (1) site clearing, grading the 310 acreson-site, and utility trenching; (2) excavation for the outdoor amphitheater andassociated berms; and (3) and earthwork required to complete the entry roadwayimprovements within and abutting the site;
• Exhaust emissions from the haul trucks used to transport building materials to thesite;

4-8
• Off-gassing emissions associated with the asphalt used for the 15.5 acres of entryroadway improvements required and 6.5 acres of the on-site parking areas.
The number and type of construction equipment as well as the number of hours that they will be inoperation each day are key parameters affecting construction-related air pollutant emissions. Inaddition, the size of the area disturbed on a given day during grading activities and the quantity ofearthwork as well as whether or not the material will be balanced on-site can have a substantialimpact on the air pollutant emissions generated locally and regionally during construction activities.Overlapping construction phases can substantially increase daily air pollutant emissions.
PROJECT-RELATED CONSTRUCTION DETAILS
The California Emissions Estimator Model (CalEEMod Version 2011.1.1) was utilized to estimateshort-term construction-related emissions of criteria air pollutants and greenhouse gas emissionsthat would be associated with the construction activities necessary to implement the proposedproject. Default construction parameters incorporated in the CalEEMod were assumed for someconstruction activities. Appendix C provides additional information on the default values assumedas well as the CalEEMod output.
To the extent that they are currently available, site-specific construction details were used as inputparameters for CalEEMod. The project site is undeveloped and relatively flat. Cut and fillearthwork quantities are expected to be balanced within the project site. Scrapers and dozers will beused to level the ground and move any excess cut material from one area on-site to other areaswithin the site where it will be used as fill material to ensure proper contouring to handle stormwater runoff. No import or export of excess material is expected to be necessary in conjunctionwith site grading activities. The project is expected to be constructed over a period of approximatelytwo to three months.
Four distinct construction phase types would be required to prepare the project site for theproposed outdoor entertainment activities. These construction phase types include: (1) site grading,including the importation of the aggregate necessary to cover the unpaved parking areas; (2) utilitytrenching, (3) paving the entry roadways and 6.5 acres of the parking area; and (4) installation ofperimeter fencing and site landscaping activities.
The number and type of construction equipment and the length of each phase of the proposedconstruction activities were identified by MSA Consultants, Inc. Without building any permanentstructures, the construction time required to complete the temporary improvements within theproject site would be relatively short. The default values in CalEEMod were assumed for thenumber of construction workers and their travel characteristics (i.e., the number and average lengthof worker commute trips. The default value in CalEEMod of 20 miles per trip for haul truck tripswas assumed for perimeter fencing and landscaping (trees and hydro seed for turf). Those haultrips required to import the aggregate needed to cover the unpaved parking areas were assumed tobe shorter than 20 miles because local sources of aggregate are located approximately 1.5 milesfrom the project site.
The default mode of CalEEMod does not assume that construction activities required to implementeach development phase will overlap. Overlapping construction phases are proposed for fifteenworking days, when the utility trenching and the site grading activities would overlap. Theemissions associated with each phase were added together to accurately reflect these concurrentconstruction phases.
The Construction Specifications may require contractors to utilize best-practice procedures toreduce air pollutant emissions during the construction process. For example, submittal of a dust

4-9
control plan could be required for review and approval prior to the issuance of grading permits. Adust control plan would identify all of the control measures that would be implemented to minimizeairborne dust before, during, and after grading activities including measures associated withstockpiling of aggregate or other material. Fugitive dust control measures required by SCAQMDRule 403.1 which have been incorporated in a project are not considered mitigation andconsequently are reflected in the unmitigated short-term air pollutant emissions projections. Noarchitectural coatings would be applied at the site as no permanent building structures are proposedon-site initially. Temporary outdoor facilities are proposed including portable sanitation facilities,tent venues, and a depressed outdoor amphitheater without fixed seats. If the project is successful,the provision of more permanent on-site facilities may be justified and constructed in the future.
CONSTRUCTION-RELATED EMISSIONS PROJECTIONS
Air pollutant emissions generated by construction activities are difficult to accurately quantify, sincethe type and number of equipment that will be used and the acreage that may be disturbed on anygiven day are not known with any reasonable level of certainty. The emphasis in the environmentalprocess has traditionally been on minimizing the emissions as fully as possible throughcomprehensive mitigation strategies, even though the emissions cannot be precisely quantified.
Construction activities required to implement the proposed project will vary from day to day andgenerate increases in localized greenhouse gas emissions as well as criteria pollutant emissions inthe project vicinity. Exhaust emissions during the construction activities on-site will vary asrequired construction equipment and activity levels change. The resulting air pollutantconcentration increases will depend on several factors including: the soil moisture content, themeteorological conditions (such as the wind stability and presence of a temperature inversion thatlimits the atmospheric mixing height) the extent of the construction activity at any given time, thenumber and type of machinery used at any given point in time, and the construction schedule. Thescheduling of concurrent construction processes would increase the daily emissions.
The unmitigated emissions of criteria pollutants and GHGs during the three-month constructionperiod estimated with CalEEMod are shown in Table 4-2. The annual average emissions associatedwith construction activities are shown therein to facilitate comparison to the General Conformity deminimis levels. Table 4-2 summarizes the short-term emissions associated with the constructionactivities required to implement the project. Over the three-month construction period, the project-related construction activities would generate: 0.81 tons of ROG, 6.34 tons of NOx, 3.19 tons ofCO, 0.01 tons of SO2, 0.57 tons of PM10, and 0.32 tons of PM2.5. None of the construction-related criteria pollutant emissions would exceed the General Conformity de minimis levels.
NOx Emissions
The project site is within the Morongo Band of Mission Indians “Serious” nonattainment area forthe 2008 8-hour ozone NAAQS. VOC and NOx are ozone precursors. The VOC and NOxemissions generated by the proposed site grading activities would not exceed the GeneralConformity de minimis levels for serious nonattainment areas of 50 tons per year and are thereforeless than significant. Project-related emissions of ozone precursors would be too low to contributeto nonattainment in the adjacent Coachella Valley portion of the SSAB which is designated“severe” nonattainment for ozone or the SCAB which is designated “extreme” nonattainment forozone by the U.S. EPA. In this context, while mitigation is not required, it may be desirable toimplement feasible control measures to reduce project-related NOx and VOC emissions similar tothe measures required of projects in the neighboring air basins to conform to regional air qualitystrategies (i.e., to reduce ground level ozone levels and ozone precursor emissions to the maximumextent feasible).

4-10
Tabl
e 4-2
Unm
itiga
ted
Ann
ual A
vera
ge A
ir Po
lluta
nt E
miss
ions
a
Ass
ocia
ted
With
Con
struc
tion
of th
e Pr
opos
ed P
roje
ct(T
ons/Y
ear)
E
miss
ions
Sou
rce
RO
GN
Ox
CO
SO2
PM10
PM2.
5C
O2e
Site
Gra
ding
Pha
se -
Fugi
tive
Dus
t 0.
000.
000.
000.
000.
130.
050.
00 -
Off-
Road
Die
sel
0.55
4.79
2.10
0.00
0.19
0.19
507.
66 -
Wor
ker T
rips
0.00
0.01
0.06
0.00
0.01
0.00
9.20
- H
aulin
g0.
050.
430.
340.
000.
170.
0137
.52
——
——
——
——
——
——
——
——
——
——
——
——
——
——
——
——
——
——
—
S
ubto
tal
0.60
5.23
2.50
0.00
0.50
0.25
554.
38
Tre
nchi
ng P
hase
- O
ff-Ro
ad D
iese
l0.
110.
810.
440.
000.
040.
0410
0.59
- W
orke
r Trip
s0.
000.
000.
030.
000.
000.
003.
85—
——
——
——
——
——
——
——
——
——
——
——
——
——
——
——
——
——
——
S
ubto
tal
0.11
0.81
0.47
0.00
0.04
0.04
104.
44
Pavi
ng P
hase
- Pa
vem
ent O
ffgas
sing
0.03
0.00
0.00
0.00
0.00
0.00
0.00
- O
ff-Ro
ad D
iese
l0.
030.
190.
120.
000.
020.
0215
.42
- W
orke
r Trip
s0.
000.
000.
010.
000.
000.
001.
28—
——
——
——
——
——
——
——
——
——
——
——
——
——
——
——
——
——
—
S
ubto
tal
0.06
0.19
0.13
0.00
0.02
0.02
16.7
0
Lan
dsca
ping
Pha
se -
Off-
Road
Die
sel
0.01
0.09
0.07
0.00
0.01
0.01
9.39
- V
endo
r0.
030.
020.
010.
000.
000.
002.
70 -
Wor
ker T
rips
0.00
0.00
0.01
0.00
0.00
0.00
0.93
——
——
——
——
——
——
——
——
——
——
——
——
——
——
——
——
——
——
S
ubto
tal
0.04
0.11
0.09
0.00
0.01
0.01
13.0
2
Tot
al
Con
stru
ctio
n 0.
816.
34 3
.19
0.01
0.57
0.32
68
8.54
De
Min
imis
Lev
el
5050
100
4070
1025
,000
Bel
ow D
e M
inim
isY
esY
esY
esY
esY
esY
esY
es
a.Tw
ice
daily
wat
erin
g of
exp
osed
surfa
ces w
as a
ssum
ed a
s wel
l as r
educ
ed sp
eeds
(les
s tha
n 15
mph
) on
unpa
ved
on-s
ite su
rface
s. T
hese
pra
ctic
es a
rein
clud
ed in
SCA
QM
D R
ule
403.
1 an
d ar
e no
t con
sider
ed b
y th
e SC
AQ
MD
to
be m
itiga
tion.
CO
2e e
mis
sion
s ar
e sh
own
in m
etric
tons
per
yea
r.Se
e A
ppen
dix
C fo
r Cal
EEM
od in
put p
aram
eter
ass
umpt
ions
and
def
aults
.

4-11
NOx emissions generated by off-road diesel-fueled equipment used to grade the project site couldbe reduced by construction activity management (e.g., reducing the number of pieces of equipmentthat would be operating simultaneously during grading activities). However, reducing the intensityof the proposed grading activities would result in soil being disturbed within the project site over alonger period of time before measures proposed to reduce fugitive dust emissions could beimplemented. These measures would include landscaping of the buffer areas (including theintroduction of 2,000 trees and hydro seeding 100 acres for turf), paving the entry roadways, andthe placement of aggregate over 128 acres of compacted unpaved general parking areas.
A substantial reduction in the projected NOx emissions generated by off-road diesel-fueledequipment could be achieved through the use of one or more of the following mitigation strategies.
• Extend the grading period to reduce the daily emissions.• Use grading equipment powered by alternative fuels such as biodiesel, compressed
natural gas, or propane.• Use newer tier engines that meet more stringent U.S. EPA tier emissions standards
than the state fleet mix (Tier 3 and Tier 4 engines) to reduce NOx emissions.• Use a combination of construction activity management techniques (such as extending
the construction period, reducing the number of pieces of equipment usedsimultaneously, turning off heavy equipment on-site when it is not in use to minimizeemission sources, and reducing or changing the hours of construction).
Particulate Matter Emissions
The PM10 emissions generated by the proposed site grading activities would not exceed theGeneral Conformity de minimis for serious nonattainment areas of 70 tons per year and aretherefore less than significant. The neighboring Coachella Valley portion of the SSAB (to the east)is designated “serious” nonattainment for PM10. In this context, while mitigation is not required,it may be desirable to implement feasible control measures to reduce project-related PM10emissions similar to the measures required of projects in the neighboring air basins to conform toregional air quality strategies (i.e., to reduce PM10 emissions to the maximum extent feasible).
The proposed grading activities are scheduled to be completed within thirty working days.Following grading, 40,000 cubic yards of aggregate will be used to cover exposed unpaved parkingareas. Landscaping with 2,000 new trees and 100 acres of turf will be completed within two weeksto reduce the exposure of disturbed surfaces to wind erosion. Paving activities will be completedwithin two weeks to reduce the potential for airborne particulate matter to be generated by vehiclesaccessing the site to deliver portable sanitation facilities, lay concrete over the area in front of thestage, and load in stage lighting and sound equipment.
To be consistent with regional air pollution control efforts to achieve the PM10 NAAQS, themagnitude of the project-related particulate matter emissions could be reduced through theimplementation of fugitive dust control measures. SCAQMD Rule 403 applies to projects withinthe South Coast Air Basin and SCAQMD Rule 403.1-Supplemental Fugitive Dust ControlRequirements for Coachella Valley Sources (Amended April 2, 2004) applies to projects within theCoachella Valley portion of the Salton Sea Air Basin. Rule 403.1 identifies numerous techniquesthat can be implemented to reduce the amount of fugitive dust and P M 10 emitted duringconstruction activities. The Coachella Valley Best Available Control Measures detailed in theCoachella Valley Dust Control Handbook are effective and can be useful in developing a site-specific Fugitive Dust Control Plan for review and approval prior to the issuance of gradingpermits.

4-12
Greenhouse Gas Emissions During Construction
Table 4-2 provides estimates from CalEEMod of the carbon dioxide equivalent emissions duringthe grading, utility trenching, paving, and landscaping activities required to implement the proposedproject. The unmitigated construction-related GHG emissions are projected to total 687.28 metrictons (MT) of CO2e over the three-month period in 2013. Greenhouse gas emissions are projectedto be highest during the site grading activities, primarily as a result of the use of off-road dieselconstruction equipment.
Approximately one hundred on-site acres would hydro seeded to introduce turf as part of the siteimprovements proposed. The turf would reduce fugitive dust emissions generated by pedestriansin the festival grounds and flex areas during events. The change in on-site vegetation to includegrassland that would occur with the proposed project would result in a one-time positive impact onGHG emissions estimated by CalEEMod to be 431 MT of CO2e. Consequently, the net increase inGHG emissions in the year 2013 associated with the three-month project-related constructionactivities would total 256.28 MT of CO2e. The net increase in GHG emissions during projectconstruction would represent approximately 37 percent of the unmitigated GHG emissions shownin Table 4-2.
The State of California has not adopted significance thresholds for GHG emissions althoughvarious thresholds are being considered to reduce net GHG emissions through the implementationof stringent performance standards or equivalent mitigation measures addressing energy use,transportation, water use, waste disposal, and construction. Based upon the United States CEQguidance, since the proposed action would be anticipated to cause direct emissions of less than25,000 metric tons of CO2-equivalent GHG emissions on an annual basis, agencies shouldconsider this an indication that a quantitative and qualitative assessment may not be meaningful todecision makers and the public. Construction-related GHG emissions in 2013 would be less thansignificant and reduced to the maximum extent feasible by project design features.
Toxic Air Contaminants Emitted During Construction
During construction activities required to implement the proposed project, primarily diesel-fueledconstruction equipment will be used on-site. Diesel equipment is durable and tends to last formany years. Consequently, the beneficial effects associated with new emission control technologymay not be seen for many years until older equipment is eventually replaced by newer cleanerequipment. No sensitive receptors are currently located within one-quarter mile of the project siteother than patrons of the Morongo Casino Resort & Spa using the outdoor recreational areassurrounding the Oasis Pool. These areas include a sandy beach area around a heated swimmingpool, two heated Jacuzzis, and a water slide and a lazy river water feature.
The combustion products emitted by diesel-fueled construction equipment include a mix of toxic aircontaminants. Diesel exhaust contains up to 100 times more emissive particles than exhaust fromgasoline-powered equipment. Most of the diesel exhaust will be diesel particulate matter, includingsoot particles that can be inhaled and deposited in the lungs.
Impacts during construction activities will be reduced through the implementation of the CARBDiesel Risk Reduction Plan.3 This plan requires: (1) the use of low-sulfur diesel fuel; (2) theretrofitting of existing engines with particulate matter filters; and (3) a reduction of nearly 90percent in the emissions of particulate matter from all new diesel engines and vehicles. Airregulatory agencies have been working with diesel vehicle manufacturers to reduce emissions by
3 CARB; Risk Reduction Plan to Reduce Particulate Matter Emissions from Diesel-Fueled Engines and Vehicles;
October, 2000.

4-13
establishing cleaner fuel specifications and engine technologies. Regulatory efforts at the national,state and local level are currently lowering the average level of diesel emissions per vehicle.
By the year 2015, all new construction equipment sold in California will have Tier 4 engines whichemit less air pollution. After treatment will be mandatory on Tier 4 engines (including oxidationcatalysts and particulate matter traps) and reduce air pollutant emissions by 90 percent. The CARBgoal is to achieve a statewide reduction in diesel particulate emissions of 85 percent by the year2020. Full implementation of the AQMP and CARB measures is expected to reduce toxic-weighted emissions throughout the SCAB by 50 percent. Consequently, any future construction ofpermanent facilities on-site would most likely be accomplished with equipment that incorporatesmore advanced air pollution control equipment and generates fewer emissions.
4.4 LONG-TERM OPERATIONAL IMPACTS
The significance of project-related operational impacts will vary depending on the frequency withwhich events occur and the types of entertainment events held on-site. The types of events held on-site will determine the number of people traveling to and from the site and the duration of their stay.Large music festivals with many popular performers will occur over longer periods of time andattract a larger audience that would be willing to travel longer distances. The larger the audience, themore vehicular travel would be associated with the event and the more air pollutants would beemitted within the region by mobile sources.
Over the long-term, the operation of the outdoor entertainment facility would generate primarilyindirect air pollutant emissions associated with mobile sources (automobiles, recreational vehicles,buses, and trucks) used to access the project site. Direct on-site emissions would occur duringlarge events, such as one-day and two-day music festivals, and during Friday night concerts whenpatrons, employees and vendors would enter and occupy the site prior to departing following theevents.
OPERATIONAL EMISSIONS OF CRITERIA AIR POLLUTANTS
Table 4-3 shows the projected long-term operational emissions of criteria pollutants once theproject is completed and fully operational with all entertainment venues utilized over the course of ayear. Annual average area source emissions associated with the proposed project would benegligible.
As shown in Table 4-3, the average annual unmitigated operational emissions of criteria pollutantsassociated with the proposed project are projected to total: 1.03 tons per year of ROG, 1.59 tons peryear of NOx, 6.96 tons per year of CO, 0.02 tons per year of PM10, and 0.02 tons per year ofPM2.5. None of the projected annual average criteria pollutant emission levels are expected toexceed the General Conformity de minimis levels. The long-term operational impact of theproposed project on regional emissions of criteria pollutants including ozone precursors would beless than significant.
Project-related mobile source emissions are projected to occur throughout the region, rather thanwithin the project site or within the immediate vicinity of the project site. Many of the peoplefrequenting the events on-site are expected to use Interstate 10 for regional access. The average triplength was estimated by Crain & Associates to be 75 miles per trip for attendees of the large musicfestivals and concert events proposed. The average trip length for employees and vendors wasestimated by Crain & Associates to be 37 miles per trip.
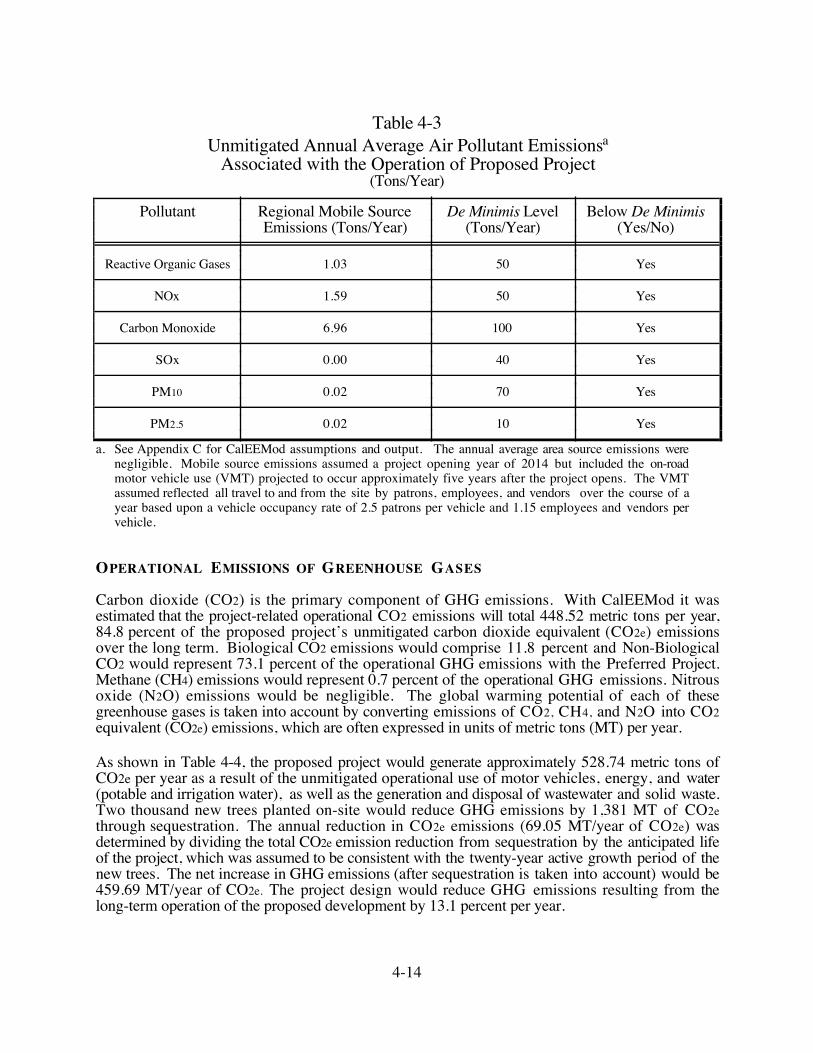
4-14
Table 4-3Unmitigated Annual Average Air Pollutant Emissionsa
Associated with the Operation of Proposed Project(Tons/Year)
Pollutant Regional Mobile Source De Minimis Level Below De MinimisEmissions (Tons/Year) (Tons/Year) (Yes/No)
Reactive Organic Gases 1.03 50 Yes
NOx 1.59 50 Yes
Carbon Monoxide 6.96 100 Yes
SOx 0.00 40 Yes
PM10 0.02 70 Yes
PM2.5 0.02 10 Yes
a. See Appendix C for CalEEMod assumptions and output. The annual average area source emissions werenegligible. Mobile source emissions assumed a project opening year of 2014 but included the on-roadmotor vehicle use (VMT) projected to occur approximately five years after the project opens. The VMTassumed reflected all travel to and from the site by patrons, employees, and vendors over the course of ayear based upon a vehicle occupancy rate of 2.5 patrons per vehicle and 1.15 employees and vendors pervehicle.
OPERATIONAL EMISSIONS OF GREENHOUSE GASES
Carbon dioxide (CO2) is the primary component of GHG emissions. With CalEEMod it wasestimated that the project-related operational CO2 emissions will total 448.52 metric tons per year,84.8 percent of the proposed project’s unmitigated carbon dioxide equivalent (CO2e) emissionsover the long term. Biological CO2 emissions would comprise 11.8 percent and Non-BiologicalCO2 would represent 73.1 percent of the operational GHG emissions with the Preferred Project.Methane (CH4) emissions would represent 0.7 percent of the operational GHG emissions. Nitrousoxide (N2O) emissions would be negligible. The global warming potential of each of thesegreenhouse gases is taken into account by converting emissions of CO2, CH4, and N2O into CO2equivalent (CO2e) emissions, which are often expressed in units of metric tons (MT) per year.
As shown in Table 4-4, the proposed project would generate approximately 528.74 metric tons ofCO2e per year as a result of the unmitigated operational use of motor vehicles, energy, and water(potable and irrigation water), as well as the generation and disposal of wastewater and solid waste.Two thousand new trees planted on-site would reduce GHG emissions by 1,381 MT of CO2ethrough sequestration. The annual reduction in CO2e emissions (69.05 MT/year of CO2e) wasdetermined by dividing the total CO2e emission reduction from sequestration by the anticipated lifeof the project, which was assumed to be consistent with the twenty-year active growth period of thenew trees. The net increase in GHG emissions (after sequestration is taken into account) would be459.69 MT/year of CO2e. The project design would reduce GHG emissions resulting from thelong-term operation of the proposed development by 13.1 percent per year.

4-15
Table 4-4Project-Related Annual Average Operational GHG Emissionsa
Source Unmitigated CO2e Emissions Sequestration Reduction Net CO2e EmissionsCategory (Metric Tons per Year) (Metric Tons/Year) (Metric Tons per Year)
Energy 214.86 NA NA
Mobile 141.99 NA NA
Waste 139.23 NA NA
Water 32.66 NA NA
Total 528.74 -69.04 (-13.1%) 459.69
a. Refer to Appendix C for the CalEEMod assumptions, the mitigation incorporated in the project design as well asthe annual average output. Two thousand new trees planted on-site would reduce GHG emissions by 1,381.00MT of CO2e through sequestration. The annual reduction in CO2e emissions (69.05 MT/year of CO2e) wasdetermined by dividing the total CO2e emission reduction from sequestration by the anticipated life of the project,which was assumed to be consistent with the twenty-year active growth period of the new trees.
The CEQ guidance states that agencies should consider the direct emission of 25,000 metric tons ormore of CO2-equivalent GHG emissions on an annual basis as an indicator that quantitative andqualitative assessment of GHG emissions associated with a proposed action may be meaningful todecision makers and the public. Based upon this indicator, the proposed project would have a lessthan significant impact on GHG emissions and climate change over both the short-term and long-term. Therefore, additional more detailed analyses would not provide meaningful results for thepublic or decision makers.
The California State Attorney General has determined that projects should only be presumed tohave a less-that-significant effect on the environment if specific performance standards are met suchthat their GHG emissions will not prevent California from achieving the GHG reduction targetsidentified under AB 32 to reduce the state’s impact on climate change. As shown in Table 4-4, theproposed project would reduce its long-term operational GHG emissions by 13.1 percent throughspecific design features incorporated in the project. As noted previously, the construction-relatedGHG emissions would be reduced by 63 percent by changing the vegetation of approximately 100acres of the site to turf.
The current fuel economy ratings for passenger vehicles (27.5 miles per gallon for cars and 22miles per gallon for trucks) will be increased to 35.5 miles per gallon by the year 2016. On July29, 2011, the U.S. EPA announced that the administration had reached an agreement withautomakers increasing fuel economy to 54.5 miles per gallon (or 163 grams of CO2 per mile) bythe year 2025. This legislation will effectively double the fuel efficiency of these on-road vehiclesand reduce their GHG emissions by fifty percent.
Since mobile source GHG emissions represent 27 percent of the proposed project’s total GHGemissions, a fifty percent reduction in mobile GHG emissions would be equivalent to a 13.5 percentreduction in the project’s overall operational GHG emissions over the long term. This 13.5 percentreduction, when coupled with the 13.1 percent reduction in project-related GHG emissions shownin Table 4-4, would result in GHG emissions reductions consistent with the California GHGreduction targets identified under AB 32 to reduce the state’s impact on climate change.

4-16
OPERATIONAL HAZARDOUS AND TOXIC AIR CONTAMINANTS (TACS)
Residential areas are considered sensitive receptor sites because residents spend much of their timeat home and tend to live in the same home for many years. This can result in relatively longexposures to any toxic air contaminants that are present. The health risk assessment guidelines forTACs assume that residential exposures will occur over a period of 70 years. Young people, theelderly, and infirm are more susceptible to infections and other health problems related to poor airquality. As a result, occupants of land uses such as schools, hospitals, convalescent homes, and daycare facilities are considered sensitive receptors.
There are no existing sensitive receptor sites located within one-quarter mile of the project site otherthan people who frequent the outdoor recreation area located west of the project site that wasdeveloped in conjunction with the Morongo Casino Resort and Spa. The proposed music festivalsand concerts are not expected to generate significant operational emissions of hazardous or toxic aircontaminants that would result in adverse impacts on existing sensitive receptors located within one-quarter mile of the project site. However, the transport and use of small amounts of materialsclassified as hazardous within the site (such as compressed natural gas, propane, or other flammableliquids used for cooking) and the storage of relatively small amounts of fuels for use by campers inportable lighting equipment may occur. These materials would be transported, stored, and used inaccordance with existing regulations. Their use by employees or vendors at entertainment eventson-site would be subject to the issuance of permits and inspections by the Morongo FireDepartment.
The proposed project would generate heavy-duty diesel truck trips and increase diesel idlingemissions in the vicinity. Diesel particulate matter and diesel exhaust organic gas emissionsassociated with those truck trips would introduce additional toxic air contaminants on and adjacentto the site. Risks associated with diesel particulate matter will decrease over time as cleanertechnology is implemented.
A concentration of multiple sources of air contaminants may pose a public health risk to individualswho are exposed, even though each of the pollution sources may individually comply with airpollution control requirements (or fall below applicable risk thresholds). Freeways and other busytransportation corridors in the immediate vicinity can also contribute to local background airpollution levels.
Traffic management plans shall be developed by qualified traffic engineers with experience onsimilar recreational events and modified as necessary to ensure that adequate capacity is providedand long queues of idling vehicles do not develop along the entry routes to the site prior to the startof events. Similarly, traffic management programs shall be developed and implemented in theproject vicinity to stagger the departure of concert and festival attendees and reduce the number ofidling vehicles queued on-site and in the project vicinity following large events. Idling by charterbuses and heavy-duty diesel trucks on-site will be limited to not more than five consecutive minutesto reduce diesel exhaust and associated health risks.
OPERATIONAL EMISSIONS OF OBJECTIONABLE ODORS
Objectionable odors can be associated with toxic or non-toxic emissions. If objectionable odors aregenerated near a high density residential area, the effects of project-related offensive odor emissionsmay be more pronounced because they may impact a considerable number of people, includingchildren. If a project has the potential to cause an objectionable odor or other nuisance problemwhich could impact a residential area or a considerable number of sensitive receptors, it warrantsclose scrutiny.

4-17
The lead agency and project proponents should coordinate to identify and resolve any potential landuse compatibility issues. In making a determination of odor significance, the distance between theodor source and the sensitive receptors must be considered. For example, all outdoor trash areasand waste bins should be designed and maintained such that deposited material is contained duringwindy periods to minimize litter, odors, and other nuisances. Trash and any recyclables should becollected regularly. Portable sanitation facilities should be located far enough from sensitivereceptors to minimize the potential for impacts associated with objectionable odors.
CARBON MONOXIDE “HOT SPOT” ANALYSIS
There are no existing sensitive residential receptor sites located within one-quarter mile of theproject site. Therefore, carbon monoxide levels were evaluated adjacent to the intersection ofThunder Road and Seminole Drive, which is projected to accommodate the most project-relatedtraffic in the future. The sensitive residential receptors located closest to this intersection areapproximately 700 feet from the center of the intersection.
Future carbon monoxide levels in the project vicinity during peak hour traffic conditions prior to thestart of a concert were evaluated with the California Line Source Dispersion Model (CALINE4).Future traffic volumes in the year 2014 with and without the proposed project were modeled.Carbon monoxide concentrations adjacent to all other intersections accommodating project-relatedtraffic in the project vicinity would be lower than the concentrations shown in Table 4-5.
Table 4-5Projected Future Carbon Monoxide Concentrationsa
Near the Intersection of Thunder Road and Seminole Drive
Future Scenario 1-Hour Averageb 8-Hour Averageb
Future Year 2014 Without Project
- Year 2014 CO Backgroundc 5.1 ppm 3.0 ppm - Ambient Traffic Contribution 0.3 ppm 0.2 ppmd
_________________ __________________
2014 Total Concentration Without Project 5.4 ppm 3.2 ppm
Future Year 2014 With Project
- Year 2014 CO Backgroundc 5.1 ppm 3.0 ppm - Ambient + Project Traffic Contribution 0.9 ppm 0.5 ppmd
_________________ __________________
2014 Total Concentration With Project 6.0 ppm 3.5 ppm
State Standard 20.0 ppm 9.0 ppm Federal Standard 35.0 ppm 9.0 ppm
a. Refer to Appendix D for the input parameters and CALINE4 output sheets.b. These concentrations reflect worst-case conditions at a receptor located downwind of the intersection (100 feet east
of the centerline of Thunder Road and 100 feet north of the Seminole Drive centerline). Existing residentialreceptors are located 700 feet to the northwest (upwind of the intersection 85 percent of the time) and should beexposed to substantially lower CO levels.
c. The SCAQMD website (updated March 11, 2005) identified background CO concentrations. d. A persistence factor of 0.6 was used to determine the 8-hour ambient and ambient + project CO concentrations
from the 1-hour values determined with CALINE4.

4-18
At a point located 100 feet east of the centerline of Thunder Road and 100 feet north of thecenterline of Seminole Drive, the peak hour traffic passing through the intersection in the year 2014would contribute up to 0.9 ppm (over a 1-hour averaging period) and up to 0.5 ppm (over an 8-houraveraging period) to the background carbon monoxide concentrations in this area. Without theproposed project, the highest carbon monoxide concentration expected at this location downwind ofthe intersection of Thunder Road and Seminole Drive in the year 2014 is projected to be 5.4 ppm(over a 1-hour averaging period) and 3.2 ppm (over an 8-hour averaging period). With theproposed project, the carbon monoxide concentration is projected to be 6.0 ppm (averaged over onehour) and 3.5 ppm (averaged over eight hours). The motor vehicles attracted by the proposedproject are projected to increase the local CO concentrations by 0.6 ppm (1-hour average) and 0.3ppm (8-hour average) at a distance 100 feet downwind of the intersection.
A project has a significant impact if it interferes with the attainment of the federal 1-hour or 8-hourcarbon monoxide standards by either exceeding them or contributing to an existing or projectedviolation. Based upon the CO “hotspot” analysis, the proposed project will not interfere with theattainment of the federal 1-hour or 8-hour carbon monoxide standards by either exceeding them orcontributing to an existing or projected violation at sensitive receptor locations. Future year 2014carbon monoxide concentrations adjacent to the worst-case intersection modeled will represent upto 17 percent of the 35 ppm federal standard (1-hour average) with the proposed project. Projected8-hour carbon monoxide concentrations with the proposed development will represent up to 39percent of the federal 8-hour carbon monoxide standard in the year 2014.
4.5 CONSISTENCY WITH AIR QUALITY PLANS, PROGRAMS, AND REGULATIONS
The purpose of a consistency finding is to determine whether or not a project is consistent with theassumptions and objectives of regional air quality plans. Based on this determination, conclusionscan be drawn regarding whether or not the project will interfere with the region’s ability to complywith federal and state air quality standards.
The Planning Department of the Morongo Band of Mission Indians is responsible for preparingthe Morongo General Plan. The Morongo General Plan has over 65 percent of the Tribal Landslisted as “Open Space/Conservation Element Areas” in the Land Use and Open Space/Conservation Elements. The initial site improvements would be temporary and the Tribe wouldmaintain the authority to relocate the 242 acres of parking to another location and developalternative uses within that area. The proposed project would provide the flexibility for the Tribe toeither alter the land uses on-site in the future or incorporate the proposed land use within theMorongo General Plan.
On June 10, 2011, the U.S. EPA finalized a Federal Implementation Plan (FIP) that will helpprovide environmental protection in Indian country by establishing a federal program for issuingpre-construction air permits through a minor New Source Review (NSR) rule and a nonattainmentmajor NSR rule. Tribes that choose to implement these rules can accept delegation of the federalprogram or develop and seek approval of a Tribal Implementation Plan (TIP) to administer theserules or portions of them. The proposed project, if approved and developed, should result in directand indirect air pollutant emissions in quantities well below the minor NSR thresholds and themajor NSR thresholds. Therefore, the proposed project would not be inconsistent with the FIP orany future TIP.
Although Morongo’s areas of Indian country do contain stationary and mobile sources of ozoneprecursors, the magnitude of the ozone precursor emissions is very small compared to emissionsfrom the adjacent SCAB and Coachella Valley nonattainment areas. Consequently, the proposedproject, which would result is lower ozone precursor emissions than the existing land uses in theMorongo Reservation, would have an insignificant impact on the ability of adjacent nonattainmentareas to attain the NAAQS.

4-19
The proposed project does not have the regulatory authority to control motor vehicle tailpipeemissions of the formulation of gasoline and diesel fuel used in Southern California. Motor vehicleemissions are regulated by the U.S. EPA and the California Air Resources Board. The mosteffective way to reduce motor vehicle air pollutant emissions is at the source with emission controldevices such as catalytic converters and other emissions control technology. Project specificTransportation Demand Management strategies would not have a significant effect on whether ornot the SCAB, the Coachella Valley, or the Morongo Band of Mission Indians nonattainment areameet the 2008 8-hour ozone NAAQS. The emission sources located the more densely developedareas upwind and downwind of the project site determine the concentrations of the criteriapollutants for which these areas are nonattainment.
The proposed project includes no residential land uses and would not provide directly and indirectlyfor increased population on-site that would exceed levels previously approved and accounted for inthe forecasts used to develop regional air quality strategies. Although the project would notincrease the population in the area, it would introduce new employment opportunities within theReservation and support existing Tribal enterprises by attracting people to the area who willfrequent existing Tribal enterprises and other commercial/retail and business uses in the projectvicinity.
STATE IMPLEMENTATION PLAN FOR PM10 IN THE COACHELLA VALLEY
The Morongo Tribe’s Ordinance #12 specifies that one goal is to not hinder the adjacent air basinsfrom attaining the NAAQS. Even though the construction-related PM10 emissions are projected tobe de minimis and no mitigation is required, the lead agency may opt to require the applicant to havea Fugitive Dust Control Plan prepared and submitted to the Tribe for review and approval prior tothe initiation of grading activities. SCAQMD Rule 403.1 identifies various dust control measuresand their efficiency for use in developing Fugitive Dust Control Plans to ensure that fugitive dustemissions are minimized during construction activities. Through the Construction Specifications,the project proponent can require that all feasible PM10 control measures be implemented to ensurethat the proposed project is consistent with the goals of the Coachella Valley PM10 SIP.
4.6 CUMULATIVE IMPACTS
Pursuant to 72 Fed. Reg. at 54,139, when the impact of an air pollutant source does not exceed thesignificant impact level for the area in which it is located (i.e., is de minimis) the “EPA considersthe conduct of a cumulative air quality analysis and modeling to yield information of trivial or novalue with respect to the impact of the proposed source of air pollution.” As shown in Table 4-2and 4-3, the impact of the proposed project would be de minimis. Therefore, the project is notrequired to conduct more extensive air quality analyses or modeling to demonstrate that itsemissions, in combination with the emissions of other air pollution sources in the vicinity, will notcause or contribute to a violation of the national ambient air quality standards at the project location.
Project-related direct and indirect air pollutant emissions would not exceed the applicable GeneralConformity de minimis levels. Therefore, the proposed action is exempt from a conformitydetermination and should be assumed to not have a significant cumulative impact on air quality. Airquality impacts associated with the proposed project would not be cumulatively considerable,because the project would not generate criteria air pollutant emissions that would exceed theGeneral Conformity de minimis levels and the project will be consistent with either the FIP or theTIP.4
4 Mr. Steve Smith, Ph.D., SCAQMD Program Supervisor, CEQA Section, Correspondence dated November 9,
2006.

4-20
ROG and NOx are ozone precursors, therefore, the emission of these pollutants constitutes theemission of ozone. The SSAB is a non-attainment area for ozone and PM10. The proposed projectwould not substantially contribute to a cumulative net increase in the emissions of pollutants forwhich the SSAB is designated nonattainment. The U.S. EPA determined in a letter to the MorongoBand of Mission Indians dated December 20, 2012, that the amount of emissions associated withactivities on the Morongo lands of Indian country are minimal and do not contribution to regionalozone violations. The project-related emissions would be less than the existing emissions in theReservation. The project-related cumulative impact on air quality would be less than significantand no mitigation is required.
Cumulative impacts on air quality were addressed in the carbon monoxide “hot spot” analysis.The year 2014 ambient traffic volumes modeled with the California Line Source Dispersion Modelincluded the growth in background traffic volumes expected to occur in the project vicinityincluding the additional traffic that would be generated by cumulative developments in the area. TheCALINE4 modeling assumed background concentrations that included carbon monoxidecontributions from other sources. Traffic levels used in the model included all reasonablyforeseeable projects that will contribute traffic to the intersection and roadway segments evaluated. The project’s cumulative impact on air pollutant concentrations at the intersections carrying themost project-related traffic is not projected to be significant and no mitigation is required.
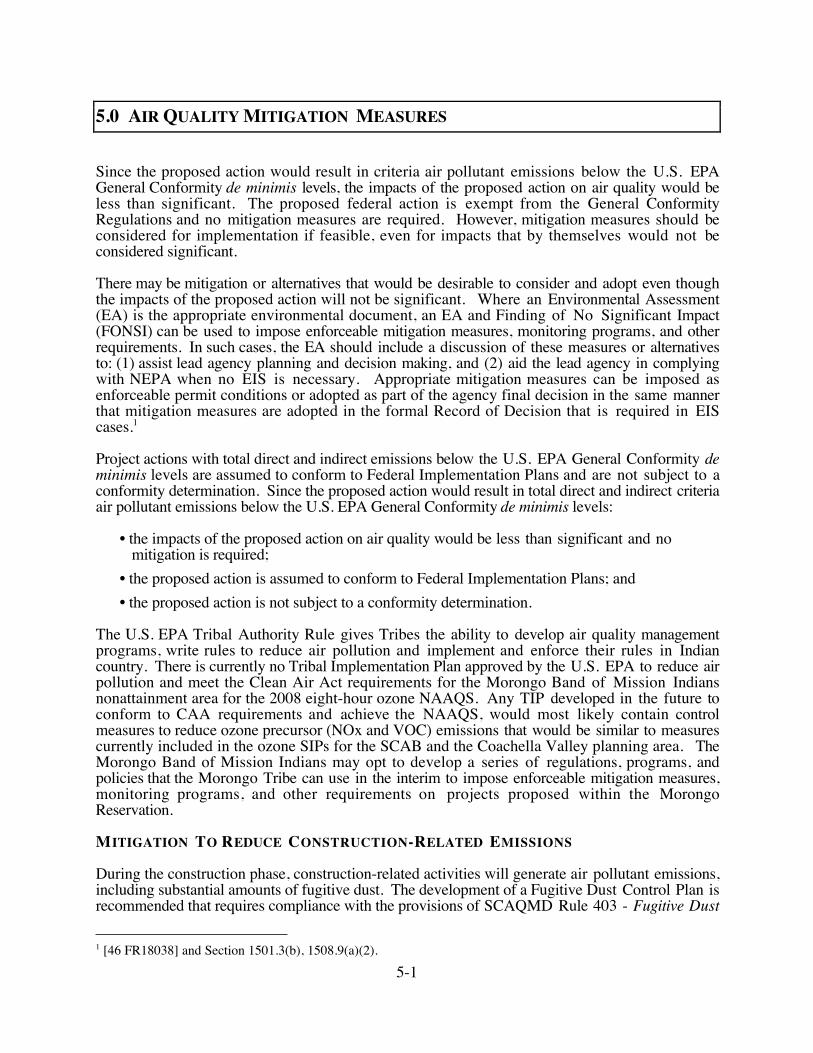
5-1
5.0 AIR QUALITY MITIGATION MEASURES
Since the proposed action would result in criteria air pollutant emissions below the U.S. EPAGeneral Conformity de minimis levels, the impacts of the proposed action on air quality would beless than significant. The proposed federal action is exempt from the General ConformityRegulations and no mitigation measures are required. However, mitigation measures should beconsidered for implementation if feasible, even for impacts that by themselves would not beconsidered significant.
There may be mitigation or alternatives that would be desirable to consider and adopt even thoughthe impacts of the proposed action will not be significant. Where an Environmental Assessment(EA) is the appropriate environmental document, an EA and Finding of No Significant Impact(FONSI) can be used to impose enforceable mitigation measures, monitoring programs, and otherrequirements. In such cases, the EA should include a discussion of these measures or alternativesto: (1) assist lead agency planning and decision making, and (2) aid the lead agency in complyingwith NEPA when no EIS is necessary. Appropriate mitigation measures can be imposed asenforceable permit conditions or adopted as part of the agency final decision in the same mannerthat mitigation measures are adopted in the formal Record of Decision that is required in EIScases.1
Project actions with total direct and indirect emissions below the U.S. EPA General Conformity deminimis levels are assumed to conform to Federal Implementation Plans and are not subject to aconformity determination. Since the proposed action would result in total direct and indirect criteriaair pollutant emissions below the U.S. EPA General Conformity de minimis levels:
• the impacts of the proposed action on air quality would be less than significant and nomitigation is required;
• the proposed action is assumed to conform to Federal Implementation Plans; and• the proposed action is not subject to a conformity determination.
The U.S. EPA Tribal Authority Rule gives Tribes the ability to develop air quality managementprograms, write rules to reduce air pollution and implement and enforce their rules in Indiancountry. There is currently no Tribal Implementation Plan approved by the U.S. EPA to reduce airpollution and meet the Clean Air Act requirements for the Morongo Band of Mission Indiansnonattainment area for the 2008 eight-hour ozone NAAQS. Any TIP developed in the future toconform to CAA requirements and achieve the NAAQS, would most likely contain controlmeasures to reduce ozone precursor (NOx and VOC) emissions that would be similar to measurescurrently included in the ozone SIPs for the SCAB and the Coachella Valley planning area. TheMorongo Band of Mission Indians may opt to develop a series of regulations, programs, andpolicies that the Morongo Tribe can use in the interim to impose enforceable mitigation measures,monitoring programs, and other requirements on projects proposed within the MorongoReservation.
MITIGATION TO REDUCE CONSTRUCTION-RELATED EMISSIONS
During the construction phase, construction-related activities will generate air pollutant emissions,including substantial amounts of fugitive dust. The development of a Fugitive Dust Control Plan isrecommended that requires compliance with the provisions of SCAQMD Rule 403 - Fugitive Dust
1 [46 FR18038] and Section 1501.3(b), 1508.9(a)(2).

5-2
or SCAQMD Rule 403.1-Supplemental Fugitive Dust Control Requirements for Coachella ValleySources. A Fugitive Dust Control Plan should include: (1) the incorporation of appropriate dustcontrol practices in each of the construction activities; and (2) compliance with measures related tothe cleaning of construction equipment and haul trucks that enter and leave the site. If feasible, apaved staging area should be required during construction activities where worker parking canoccur and construction equipment, aggregate, fencing materials, and trees to be planted can be off-loaded and departing haul vehicles can be washed.
To reduce the potential for diesel particulate matter impacts in outdoor recreational areas at theMorongo Casino Resort and Spa associated with construction activities on-site, the constructionspecifications shall limit the idling of construction equipment on-site while not in use to periods nolonger than five consecutive minutes. Emissions of toxic air contaminants and GHG may befurther reduced by requiring the use of cleaner fuels and the preferential use of newer constructionequipment with pollution control equipment installed (such as diesel oxidation catalysts and dieselparticulate matter filters). Tier 3 and Tier 4 equipment may be required to substantially reduceemissions of diesel particulate matter, which is considered by both the CARB and the U.S. EPA tobe a toxic air contaminant.
SCAQMD Rules and Regulations
To be consistent with regional air pollution control efforts to achieve the NAAQS, the Tribe shouldconsider requiring the project proponent to incorporate in the Construction Specificationsprocedures outlined in the following SCAQMD Rules and Regulations.
• Rule 401 (Visible Emissions) specifies control measures for use in developing site-specificFugitive Dust Control Plans to minimize blowing dust from construction sites and insure
• Rule 402 (Public Nuisance) specifies control measures for use in developing site-specificFugitive Dust Control Plans to minimize blowing dust from construction sites and insure
• Rule 403 or Rule 403.1 (Fugitive Dust) specifies control measures for use in developingsite-specific Fugitive Dust Control Plans for projects to minimize blowing dust fromconstruction sites and insure the clean up of construction-related dirt on approach routes tothe site including: watering measures, chemical stabilizers, wind fencing, wheel washers andhigh wind measures.
• Rule 1108 and 1108.1 (Cutback and Emulsified Asphalt) prohibits the use of rapid andmedium cure cutback asphalts as well as organic compounds in emulsified asphalts usedduring the construction process;

1-1
6.0 REFERENCES
California Air Resources Board
1983 CARB; Facts About How Air Pollution Damages Health
1983 Smith, T.B. et al.; The Impact of Transport from the South Coast Air Basin on OzoneLevels in the Southeast Desert Air Basin; CARB Research Library Report No. ARB-R-83-183.
1990 Climate of the Southeast Desert Air Basin, January.
2005 EPA and CARB Air Quality and Land Use Handbook: A Community Health Perspective; April 2005; pg. 9-10.
2011a California Greenhouse Gas Inventory for 2000-2008 – by Category as Defined in theScoping Plan. Available at http://www.arb.ca.gov/cc/inventory/inventory.htm.
2011b State Area Designation Maps, State and National. June 23. Available athttp://www.arb.ca.gov/design/adm/adm.htm.
2012a Ambient Air Quality Standards. February 7. Available athttp://www.arb.ca.gov//research/aaqs/aaqs2.pdf.
2012b Air Quality Monitoring Data. Available athttp://www.arb.ca.gov/adam/topfour/topfour1.php.
California Energy Commission
2006 Inventory of California Greenhouse Gas Emissions and Sinks: 1990 to 2004. (Staff FinalReport). Publication CEC-600-2006-013-SF. Available athttp://www/climatechange.ca.gov/inventory/index.html. Accessed April 1.
Crain & Associates
2013 Draft Traffic Impact Analysis for the Proposed Morongo Outdoor Entertainment Project,Morongo Band of Indians Reservation, North of the City of Cabazon. February.
Drivas, P. J. and F. H. Shair
1974 A Tracer Study of Pollutant Transport in the Los Angeles Area; Atmospheric Environment8: 1155-1163
E Mulberg & Associates
2012 Air Quality/Climate Change Analysis Technical Report Music Festivals Plan Project,Indio, California. November

1-2
Federal Register
1993 EPA 40 CFR Parts 6, 51, and 93, Determining Conformity of General Federal Actions toState or Federal Implementation Plans; Final Rule. November 30. [FRL-4805-1]
1996 40 CFR Part 63, Hazardous Air Pollutants: Regulations Governing Constructed orReconstructed Major Sources; Final Rule. Federal Register: December 27, 1996 (Volume61, Number 250) Rules and Regulations [Page 68383-68404]. From the Federal RegisterOnline via GPO Access [wais.acess.gpo.gov]
2007 40 CFR Parts 50 and 51, Proposed Rule to Implement the 1997 8-hour Ozone NationalAmbient Air Quality Standard: Revision on Subpart 1 Area Reclassification. January 16.Available at http://www.gpo.gov/fdsys/pkg/FR-2009-01-16/pdf/E9-806.pdf#page=1.
2012 EPA 40 CFR Parts 81, Designations of Areas for Air Quality Planning Purposes;California;Morongo Band of Mission Indians. March 22. [EPA R09-OAR-2012-0936; FRL-]
2013 EPA 40 CFR Parts 52 and 81, Designations of Areas for Air Quality Planning Purposes. March 22. [EPA R09-OAR-2013-0007; FRL-]
2013 EPA 40 CFR Parts 93 § 153, General Conformity De Minimis Levels.
National Park Service, Air Resources Division. U.S. Department of the Interior
2011 Technical Guidance on Assessing Impacts to Air Quality in NEPA and PlanningDocuments. January 2011. Natural Resource Report NPS/NRPC/ARD/NRR-2011/289.National Park Service, Denver, Colorado.
South Coast Air Quality Management District
1979 SCAQMD and SCAG; AQMP - Southeast Desert Air Basin, Riverside County; October.
2000 Multiple Air Toxics Exposure Study (MATES-II); Zhu, Yifang, W.C. Hinds, S. Kim, and S.Shen
2012 Revised Draft 2012 AQMP; September 2012; pg. 9-25.
U.S. Court of Appeals – District of Columbia Circuit
2013 No. 10-1413, Sierra Club v. Environmental Projection Agency; decided 1/22.
U.S. Department of Interior
2012 Indian Affairs National Environmental Policy Act (NEPA) Guidebook; August.
U.S. Environmental Protection Agency
2002 Study of Ultrafine Particles Near a Major Highway with Heavy-Duty Diesel TrafficAtmospheric Environment 36:4323-4335.
2011 General Conformity revision. July 22. Available athttp://www.epa.gov/air/genconfrom/documents.20100324rule.pdf

1-3
2011 Technical Support Document for 2008 Ozone NAAQS Designations (Coachella Valley)
2012 Green Book: Currently Designated Nonattainment Areas for All Criteria PollutantsMarch 30. Available at http://www.epa.gov/air/oaqps/greenbk/.
2012 Sources of Greenhouse Gas EmissionsMarch 30. Available at http://www.epa.gov/air/oaqps/greenbk/.
2012 Technical Support Document for 2008 Ozone NAAQS Designations; Technical Analysisfor Morongo Band of Mission Indians (Morongo nonattainment area)

Appendices
A. List of Acronyms and GlossaryB. Ambient Air Quality Standards,
Health Effects of Air PollutantsBanning Airport Wind RoseAmbient Air Quality Monitoring Data
C. CalEEMod Assumptions and OutputD. CALINE4 Assumptions and Output

Appendix A
ACRONYMS AND GLOSSARY

A-1
Appendix AList of Acronyms
AB Assembly BillADT Average Daily TrafficAQMP Air Quality Management PlanBACM Best Available Control MeasuresCAA Clean Air ActCARB California Air Resources BoardCCAA Claifornia Clean Air ActCFR Code of Federal RegulationsCMP Congestion Management ProgramCO Carbon MonoxideCO2 Carbon DioxideCO2e CO2 equivalentCVAG Coachella Valley Association of GovernmentsCVSIP Coachella Valley State Implementation PlanDPM Diesel Particulate MatterFIP Federal Implementation PlanGHG Greenhouse GasHAP Hazardous Air PollutantHQT High Quality TransitI-10 Interstate 10MPO Metropolitan Planning OrganizationMSAT Mobile Source Air ToxicsMT Metric TonsNAAQS National Ambient Air Quality StandardsNATA National-Scale Air Toxics AssessmentNEPA National Environmental Policy ActNO Nitric OxideNO2 Nitrogen DioxideNOx Oxides of NitrogenNSR New Source ReviewO3 OzoneOPR California Governor’s Office of Planning and ResearchPb Lead (particulate)PM Particulate MatterPM2.5 Fine Particulate Matter 2.5 microns or less in diameterPM10 Particulate Matter 10 microns or less in diameterPSD Prevention of Significant DeteriorationROG Reactive Organic GasRTP Regional Transportation PlanSCAB South Coast Air BasinSCAG Southern California Association of GovernmentsSCAQMD South Coast Air Quality Management DistrictSER Significant Emission RateSIL Significant Impact LevelSIP State Implementation PlanSO2 Sulfur DioxideSO42- SulfateSOx Sulfur OxidesSSAB Salton Sea Air Basin

A-2
T-BACT Best Available Control Technology for ToxicsTAC Toxic Air ContaminantTDM Transportation Demand ManagementTIP Tribal Implementation PlanTSM Transportation Systems ManagementUFP Ultra Fine ParticulatesU.S. EPA United States Environmental Protection AgencyVMT Vehicle Miles TraveledVOC Volatile Organic CompoundVPD Vehicles Per Day

A-3
Appendix AAir Quality Glossary
AAQS – Ambient Air Quality Standards.AB 32 – Assembly Bill 32 is California’s Global Warming Solutions Act of 2006 which requiresthe CARB to establish a greenhouse gas emissions cap for the year 2020 and adopt mandatoryreporting rules for significant sources of greenhouse gas.Air Basin – An area with common and distinctive geographical features.Air Monitoring – Sampling and measuring pollutants present in the atmosphere.Ambient Air – Outside air.AQMP – The Air Quality Management Plan.ARB – The California Air Resources Board.Attainment – Legal recognition that an area meets standards for a particulate pollutant.AVR – Average Vehicle RidershipBACT – Best Available Control Technology.CAA – The Federal Clean Air Act.CALINE4 – The California Line Source Dispersion Model.CARB – The California Air Resources Board.CalEEMod – The California Emissions Estimator Model (Version 2011.1.1) is a land useemissions computer model developed by ENVIRON International Corporation for the SCAQMDto provide a uniform platform for governmental agencies, planners, and environmental professionalsto quantify criteria pollutant and greenhouse gas emissions associated with both construction andoperation from land use projects throughout California.CCAA – The California Clean Air Act.CEQA – The California Environmental Quality Act.CMP – The Congestion Management Program.CO – Carbon monoxide is a colorless, odorless, toxic gas formed by incomplete combustion offossil fuels.Coachella Valley Blowsand Zone – The corridor of land extending two miles to either side ofthe centerline of the I-10 Freeway beginning at the SR-111/I-10 junction and continuing southeastto the I-10/Jefferson Street interchange in Indio.Construction/Demolition Activities – Any on-site mechanical activities preparatory to or relatedto the building, alteration, rehabilitation, demolition or improvement of property, including, but notlimited to the following activities; grading, excavation, loading, crushing, cutting, planning, shapingor ground breaking.Contingency Measures – Actions which will be implemented in the event of a failure to attain orto meet interim milestones.Criteria Air Contaminants – Criteria air contaminants are pollutants for which air qualitystandards currently exist (i.e. ozone, nitrogen dioxide (NO2), sulfur dioxide (SO2), carbonmonoxide (CO), fine suspended particulates (PM10), lead and sulfate).

A-4
CVAG – The Coachella Valley Association of Governments.CVSIP – The Coachella Valley PM10 State Implementation Plan.De Minimis Levels – 40 CFR 93§153 defines de minimis levels as the minimum threshold forwhich a conformity determination must be performed for various criteria pollutants in various areasDisturbed Surface Area – A portion of the earth's surface which has been physically moved,uncovered, de stabilized, or otherwise modified from its undisturbed natural soil condition, therebyincreasing the potential for emission of fugitive dust. This definition excludes those areas restoredto a natural state, such that vegetative ground cover and soil characteristics are similar to adjacent ornear-by natural conditions.DPM – Diesel particulate matter.DRRP – CARB Diesel Risk Reduction Plan.Dust Suppressants – Water, hygroscopic materials, or non-toxic chemical stabilizers used as atreatment material to reduce fugitive emissions. Non-toxic chemical stabilizers must not be used ifprohibited by the Regional Water Quality Control Boards, the California Air Resources Board, theEnvironmental Protection Agency, or any other applicable law, rule or regulation; and should meetany specifications, criteria, or tests required by any federal, state, or local water agency.Earth-Moving Activities – Shall include, but not be limited to, such operations as grading,loading or unloading of dirt or bulk materials, adding to or removing from open storage piles ofbulk materials, landfill operations, soil mulching, or agricultural tilling.EIR – Environmental Impact Report.EMFAC2007 – Version 2.3 Burden model developed by the CARB and used by CalEEMod toidentify on-road mobile source emission factors for various speeds throughout California based onlocal conditions including the vehicle fleet mix and year of interest.Emission Inventory – A listing by source of pollutants emitted into a community’s atmosphere(typically given in units of pounds per day or tons per year).EPA – The U.S. Environmental Protection Agency (i.e., the federal agency with responsibility forambient air quality).Episode Criteria – California has adopted health advisory levels called episode criteria for ozone,carbon monoxide, sulfur dioxide, and ozone in combination with sulfates. Episode criteriarepresent short-term exposures at concentrations which actually threaten public health.Facility – Any permit unit or grouping of permit units or other air contaminant-emitting activitieswhich are located on one or more contiguous properties within the District, in actual physicalcontact or separated solely by a public roadway or other public right-of-way, and are owned oroperated by the same person (or by persons under common control).FIP – The Federal Implementation Plan.Fugitive Dust – Any solid particulate matter that becomes airborne, other than that emitted from anexhaust stack, directly or indirectly as a result of the activities of man.GHG – Greenhouse gas emissions usually given in units of metric tons per year of equivalent CO2(MT/year of CO2e).GP – General Plan.Health Advisory – Issued when ozone levels are projected to reach 15 parts per hundred millionto warn athletes to avoid strenuous outdoor activities.

A-5
HOV – High Occupancy Vehicle.Hydrocarbons – Any compound containing carbon and hydrogen in various combinations foundin solvents and fuels.Inversion – A layer of warm air in the atmosphere that lies over a layer of cooler air, trappingpollutants in the mixing layer beneath it.
µg/m3 – Microgram (1/1,000,000 of a gram) per cubic meter of air.NAAQS – National Ambient Air Quality Standards.NATA – The National-Scale Air Toxics Assessment is EPA’s ongoing comprehensive evaluationof air toxics in the United States. It is a screening tool for State/Local/Tribal Agencies to prioritizepollutants, emission sources, and locations of concern for further study of the risks of cancer andother serious health effects from inhaling air toxics.New Source Review – requires major stationary pollution sources to obtain permits issued by theEPA, the state, or local agencies which establish construction details, emission limits, monitoring,recordkeeping, and reporting requirements.NO – Nitric oxide, a colorless, odorless gas.NO2 – Nitrogen dioxide, a reddish-brown gas formed by the combination of nitric oxide withoxygen.Nonattainment Area – An area that does not meet state or national standards for a given pollutantand is designated as nonattainment under section 107 of the federal Clean Air Act as amended in1990 and described in 40 CFR part 81.Nonroad Mobile Sources – Mobile sources not found on roads or highways including: airplanes,trains, lawn mowers, construction vehicles, farm machinery, ships, and boats.NOx – Oxides of nitrogen. Gases formed primarily from atmospheric nitrogen and oxygen whencombustion takes place (particularly under conditions of high temperature). Oxides of nitrogen areprimary receptors of ultraviolet light initiating the photochemical reactions that produce smog.O3 – Ozone, a pungent, colorless toxic gas which is produced by the photochemical process.Ozone is formed through chemical reactions of VOCs, oxides of nitrogen and oxygen in thepresence of sunlight.OFFROAD2007 – A program that identifies emission factors for off-road equipment (includingoff-highway trucks, scrapers, graders, etc.) that is used by CalEEMod to estimate construction-related equipment exhaust emissions.Offset – An emission reduction that compensates for an emission increase.OPR – Governor’s Office of Planning and ResearchOzone Precursors – Chemicals such as volatile organic compounds (VOCs) and nitrogen oxides(NOx) which contribute to the formation of ozone.Particulate Matter – Particulate matter consists of particles in the atmosphere as a by-product offuel combustion, through abrasion such as tire wear, and through soil erosion by the wind.Particulates can also be formed through photochemical reactions in the atmosphere.Particulate Matter Precursors – PM2.5 precursors include sulfur dioxide (SO2) and nitrogenoxides (NOx).Photochemical – Requiring the presence of sunlight for a chemical reaction.

A-6
Photochemical Oxidant – Photochemical oxidant (O3) can include several different pollutants,but consists primarily of ozone (90%) and a group of chemicals called organic peroxynitrates.Photochemical oxidant is created by complex atmospheric reactions involving oxides of nitrogenand volatile organic compounds, in the presence of ultraviolet energy from sunlight.PM – Total suspended particulate matter.PM2.5 – Suspended particulate matter with a mean aerodynamic diameter of less than 2.5micrometers. PM2.5 from stationary source fuel combustion comprises approximately 99 percentof the PM10. PM2.5 from fugitive dust represents approximately 21 percent of the PM10. PM2.5from off-road equipment comprises approximately 89 percent of the PM10.PM10 – Suspended particulate matter with a mean aerodynamic diameter of less than 10micrometers.PM10 SIP – The PM10 State Implementation Plan.PPM – Parts per million parts of air.Primary Pollutants – Primary pollutants (i.e., those emitted directly from a source and include:carbon monoxide (CO), nitric oxide (NO), sulfur dioxide (SO2), particulates, and varioushydrocarbons and other volatile organic compounds (VOC).RACM – Reasonably Available Control Measures.RACT – Reasonably Available Control Technology.Rate-of-Progress – Reducing pollutants contributing to nonattainment by five percent per year orall feasible control measures and an expeditious adoption schedule.Regionally Significant Action – A federal action for which the direct and indirect emissions ofany pollutant represent ten percent or more of a nonattainment or maintenance area’s emissionsinventory for that pollutant. Reasonably Foreseeable Emissions – Projected future indirect emissions that are identified at thetime a conformity determination is made. The location of such emissions must be known and theemissions must be quantifiable.Receptor Location – Any location outside the boundaries of the facility at which a person couldexperience acute or chronic exposure. The SCAQMD shall consider the potential for exposure indetermining whether the location will be considered a receptor location.Reasonable Further Progress – An incremental reduction in emissions of relevant air pollutantsthat is needed to ensure attainment of the national ambient air quality standards or NAAQS by theapplicable date.Risk Assessment – An evaluation of expected health impacts on a specific population.ROC – Reactive organic compounds (i.e., compounds composed of hydrocarbons that contributeto the formation of photochemical oxidant).ROG – Reactive organic gases (i.e., gases composed of hydrocarbons that contribute to theformation of photochemical oxidant).SCAB – The South Coast Air Basin.SCAG – The Southern California Association of Governments.SCAQMD – The South Coast Air Quality Management District.
A-7
Secondary Pollutants – Secondary pollutants are created with the passage of time in the air massand include: photochemical oxidants (90% of which are ozone), photochemical aerosols,peroxyacetylnitrate (PAN), and nitrogen dioxide (NO2).Senate Bill 97 – Amended the CEQA statute to establish that GHG emissions and their effects areappropriate topics for CEQA analysis.Sensitive Land Use – Sensitive land uses are land uses associated with indoor and/or outdoorhuman activities that may be subject to stress and/or significant impact as a result of air pollutantexposure. They include residential (single-family and multi-family dwellings, mobile home parks,dormitories and similar uses); transient lodging (including hotels, motels and similar uses);hospitals, nursing homes, convalescent hospitals and other facilities for long-term medical care; andpublic or private educational facilities.SIP – State Implementation Plan. A document that shows the steps planned to meet federal airquality standards (outlined in the Clean Air Act). Each nonattainment area prepares an air qualityimprovement plan. These plans are combined to make the statewide SIP.SO2 – Sulfur dioxide results from the combustion of high sulfur content fuels.SOx – Sulfates result from a reaction of sulfur dioxide and oxygen in the presence of sunlight.SRA – Source Receptor Area. The Coachella Valley is in Source Receptor Area 30.SSAB – The Salton Sea Air Basin.Stage I Alert – alert called when ozone concentrations are projected to reach 20 parts per hundredmillion. A Stage I Alert indicates that the general public should avoid strenuous outdoor activitiesbecause of unhealthful air quality.Stage II Alert – Alert called when ozone concentrations are projected to reach 35 parts per hundredmillion. A Stage II Alert indicates that everyone should remain indoors because of very unhealthfulair quality.TACs – Toxic air contaminants.T-BACT – Best Available Control Technology For Toxics means the most stringent emissionslimitation or control technique which has been achieved in practice for such permit unit category orclass of source or any other emissions limitation or control technique found by the SCAQMD to betechnologically feasible for a specific source.TCM – Transportation Control Measures.TDM – Transportation Demand Management.Toxic Air Contaminant – An air pollutant which may cause or contribute to an increase inmortality or serious illness, or which may pose a present or potential hazard to human health. VMT – Vehicle Miles Traveled (usually daily). CalEEMod determines the annual VMT.VOC – Hydrocarbon and other Volatile Organic Compounds are formed from combustion of fuelsand the evaporation of organic solvents. Many hydrocarbon compounds are major air pollutants,and those classified as aromatics are highly photochemically reactive with NOx, formingphotochemical smog.VT – Vehicle Trips.

Appendix B
AMBIENT AIR QUALITY STANDARDS
EFFECTS OF AIR POLLUTANTS ON SENSITIVE RECEPTORS
BANNING AIRPORT WIND ROSE
AMBIENT AIR QUALITY MONITORING DATA

Concentration 3 Method 4 Primary 3,5 Secondary 3,6 Method 7
1 Hour 0.09 ppm (180 µg/m3) —
8 Hour 0.070 ppm (137 µg/m3) 0.075 ppm (147 µg/m3)
24 Hour 50 µg/m3 150 µg/m3
Annual Arithmetic Mean 20 µg/m3 —
24 Hour — — 35 µg/m3
Annual Arithmetic Mean 12 µg/m3 Gravimetric or
Beta Attenuation 15 µg/m3
1 Hour 20 ppm (23 mg/m3) 35 ppm (40 mg/m3) —
8 Hour 9.0 ppm (10 mg/m3) 9 ppm (10 mg/m3) —
8 Hour (Lake Tahoe) 6 ppm (7 mg/m3) — —
1 Hour 0.18 ppm (339 µg/m3) 100 ppb (188 µg/m3) —
Annual Arithmetic Mean
0.030 ppm (57 µg/m3) 0.053 ppm (100 µg/m3)Same as
Primary Standard
1 Hour 0.25 ppm (655 µg/m3) 75 ppb (196 µg/m3) —
3 Hour — —0.5 ppm
(1300 µg/m3)
24 Hour 0.04 ppm (105 µg/m3)0.14 ppm
(for certain areas)9 —
Annual Arithmetic Mean
—0.030 ppm
(for certain areas)9 —
30 Day Average 1.5 µg/m3 — —
Calendar Quarter —1.5 µg/m3
(for certain areas)11
Rolling 3-Month Average
— 0.15 µg/m3
No
24 Hour 25 µg/m3 Ion ChromatographyNational
1 Hour 0.03 ppm (42 µg/m3)Ultraviolet
Fluorescence Standards
24 Hour 0.01 ppm (26 µg/m3)Gas
Chromatography
For more information please call ARB-PIO at (916) 322-2990 California Air Resources Board (6/7/12)
Same as Primary Standard
California Standards 1 National Standards 2
Same as Primary Standard
Same as Primary Standard
Same as Primary Standard
Gravimetric or Beta Attenuation
8 Hour
High Volume Sampler and Atomic
Absorption
Non-Dispersive Infrared Photometry
(NDIR)
Non-Dispersive Infrared Photometry
(NDIR)
Ultraviolet Photometry
Nitrogen Dioxide (NO 2)
8
Lead 10,11
Gas Phase Chemiluminescence
Gas Phase Chemiluminescence
Atomic Absorption
Ultraviolet Photometry
Sulfur Dioxide (SO2)
9
Inertial Separation and Gravimetric
Analysis
Inertial Separation and Gravimetric
Analysis
Ambient Air Quality Standards
Pollutant
Ozone (O3)
Respirable Particulate
Matter (PM10)
Fine Particulate
Matter (PM2.5)
Carbon Monoxide
(CO)
Averaging Time
Ultraviolet Fluorescence
Ultraviolet Flourescence;
Spectrophotometry (Pararosaniline
Method)
See footnote 12Beta Attenuation and
Transmittance through Filter Tape
Visibility Reducing Particles 12
Sulfates
Hydrogen Sulfide
Vinyl Chloride 10
See footnotes on next page …

1.
2.
3.
4.
5.
6.
7.
8.
9.
10.
11.
12.
For more information please call ARB-PIO at (916) 322-2990 California Air Resources Board (6/7/12)
Reference method as described by the U.S. EPA. An “equivalent method” of measurement may be used but must have a “consistent relationship to the reference method” and must be approved by the U.S. EPA.
The ARB has identified lead and vinyl chloride as 'toxic air contaminants' with no threshold level of exposure for adverse health effects determined. These actions allow for the implementation of control measures at levels below the ambient concentrations specified for these pollutants.
The national standard for lead was revised on October 15, 2008 to a rolling 3-month average. The 1978 lead standard (1.5 µg/m3 as a quarterly average) remains in effect until one year after an area is designated for the 2008 standard, except that in areas designated nonattainment for the 1978 standard, the 1978 standard remains in effect until implementation plans to attain or maintain the 2008 standard are approved.
California standards for ozone, carbon monoxide (except 8-hour Lake Tahoe), sulfur dioxide (1 and 24 hour), nitrogen dioxide, and particulate matter (PM10, PM2.5, and visibility reducing particles), are values that are not to be exceeded. All others are not to be equaled or exceeded. California ambient air quality standards are listed in the Table of Standards in Section 70200 of Title 17 of the California Code of Regulations.
National standards (other than ozone, particulate matter, and those based on annual arithmetic mean) are not to be exceeded more than once a year. The ozone standard is attained when the fourth highest 8-hour concentration measured at each site in a year, averaged over three years, is equal to or less than the standard. For PM10, the 24 hour standard is attained when the expected number of days per
calendar year with a 24-hour average concentration above 150 µg/m3 is equal to or less than one. For PM2.5, the 24 hour standard is attained when 98 percent of the daily concentrations, averaged over three years, are equal to or less than the standard. Contact the U.S. EPA for further clarification and current national policies.
Concentration expressed first in units in which it was promulgated. Equivalent units given in parentheses are based upon a reference temperature of 25°C and a reference pressure of 760 torr. Most measurements of air quality are to be corrected to a reference temperature of 25°C and a reference pressure of 760 torr; ppm in this table refers to ppm by volume, or micromoles of pollutant per mole of gas.
Any equivalent measurement method which can be shown to the satisfaction of the ARB to give equivalent results at or near the level of the air quality standard may be used.
National Primary Standards: The levels of air quality necessary, with an adequate margin of safety to protect the public health.
To attain the 1-hour national standard, the 3-year average of the annual 98th percentile of the 1-hour daily maximum concentrations at each site must not exceed 100 ppb. Note that the national 1-hour standard is in units of parts per billion (ppb). California standards are in units of parts per million (ppm). To directly compare the national 1-hour standard to the California standards the units can be converted from ppb to ppm. In this case, the national standard of 100 ppb is identical to 0.100 ppm.
Note that the 1-hour national standard is in units of parts per billion (ppb). California standards are in units of parts per million (ppm). To directly compare the 1-hour national standard to the California standard the units can be converted to ppm. In this case, the national standard of 75 ppb is identical to 0.075 ppm.
National Secondary Standards: The levels of air quality necessary to protect the public welfare from any known or anticipated adverse effects of a pollutant.
On June 2, 2010, a new 1-hour SO2 standard was established and the existing 24-hour and annual primary standards were revoked. To attain the 1-hour national standard, the 3-year average of the annual 99th percentile of the 1-hour daily maximum concentrations at each site must not exceed 75 ppb. The 1971 SO2 national standards (24-hour and annual) remain in effect until one year after an area is designated for the 2010 standard, except that in areas designated nonattainment for the 1971 standards, the 1971 standards remain in effect until implementation plans to attain or maintain the 2010 standards are approved.
In 1989, the ARB converted both the general statewide 10-mile visibility standard and the Lake Tahoe 30-mile visibility standard to instrumental equivalents, which are "extinction of 0.23 per kilometer" and "extinction of 0.07 per kilometer" for the statewide and Lake Tahoe Air Basin standards, respectively.

B-3
Appendix BEffects of Air Pollutantson Sensitive Receptors
Oxidants (primarily ozone) at high enough concentrations can cause eye irritation;aggravate respiratory disease; suppress the body's capacity to fight infection; impair athleticperformance and cause growth retardation in sensitive trees. Oxidants also cause crackingof untreated rubber. Short-term and long-term ozone exposures have been found to haveadverse health effects on humans and animals. Ozone and fine particulates are responsiblefor a wide range of health effects including slowed lung growth in children, worsening ofasthma symptoms, increased susceptibility to respiratory infections, increased hospitaladmissions, and increased death rates.
Suspended particulates such as soot, dust, aerosols, fumes, and mists produce haze andreduce visibility. Health concerns focus on smaller particles that penetrate deeply into andthen damage the human respiratory tract. Deaths from short-term exposures have beendocumented and symptoms are exacerbated in sensitive patients with respiratory disease.Excess seasonal declines in pulmonary function have been found (especially in children).Typically, industrial and agricultural operations, combustion, and photochemical reactionsproduce suspended particulates.
Volatile organic compounds in the presence of other primary pollutants (particularlyoxides of nitrogen) lead to the formation of oxidants. VOCs also damage plants byinhibiting growth and causing flowers and leaves to fall.
Carbon monoxide is essentially colorless, odorless and toxic to humans. It enters theblood stream and interferes with the transfer of fresh oxygen, thereby depriving sensitivetissues in the heart and brain of oxygen. At high enough concentrations it can impair visualfunction, psychomotor performance and time discrimination. Carbon monoxide exposureaggravates angina pectoris and other aspects of coronary heart disease. It may also imposeincrease risks to fetuses.
Nitrogen dioxide at high enough exposures can cause fibrotic lung changes, broncho-striction, and acute bronchitis among infants and school children. Over several months, itcan cause collapsed lesions near the leaf margin and moderate injury in sensitive plants.Nitrogen dioxide aggravates chronic respiratory disease and respiratory symptoms insensitive groups.
Lead at high enough concentrations impairs hemoglobin synthesis and nerve conduction byincreasing lead levels in the blood. Sulfur dioxide and suspended particulate exposures caneach cause higher frequencies of acute respiratory symptoms and diminished ventilatoryfunction in children. In addition, these two pollutants at lower concentrations can act inconjunction to cause greater harm by injuring lung tissue. Sulfur oxides, in combinationswith moisture and oxygen, can yellow the leaves of plants, dissolve marble, and erode ironand steel. Sulfates decrease ventilatory function, aggravate asthmatic symptoms, aggravatecardio-pulmonary disease and cause damage to vegetation (while degrading visibility).


2009 A
IR Q
UA
LIT
Y
SO
UT
H C
OA
ST
AIR
QU
AL
ITY
MA
�A
GE
ME
�T
DIS
TR
ICT
Car
bon
Mon
oxid
e a)
O
zon
e
Nit
rogen
Dio
xid
e d)
Su
lfu
r D
ioxid
e e)
No.
Day
s
of
Dat
a
Max
.
Conc.
in
pp
m
1-h
our
Max
Conc.
in
pp
m
8-h
our
No
.
Day
s
of
Dat
a
Max
.
Co
nc.
in
pp
m
1-h
ou
r
Max
.
Co
nc.
in
pp
m
8-h
ou
r
Fo
urt
h
Hig
h
Co
nc.
pp
m
8-h
ou
r
N
o.
Day
s S
tand
ard
Exce
eded
Max
Conc.
in
pp
m
1-h
our
98
th
Per
centi
le
Conc.
pp
m
1-h
our
Annual
Avera
ge
AA
M
Conc.
pp
m
No.
Day
s
of
Dat
a
Max
.
Conc.
in
pp
m
1-h
our
Max
.
Conc.
in
pp
m
24-h
our
Hea
lth
Ad
vis
ory
≥ 0
.15
pp
m
1-h
ou
r
F
ed
era
l b)
Sta
te c)
No.
Day
s
of
Dat
a
So
urc
e/R
ecep
tor
Are
a
O
ld
> 0
.12
pp
m
1-h
ou
r
Cu
rrent
> 0
.07
5
pp
m
8-h
ou
r
Cu
rrent
> 0
.09
pp
m
1-h
ou
r
Curr
ent
> 0
.070
pp
m
8-h
our
Sta
tio
n
No.
No.
Lo
cati
on
LO
S A
NG
EL
ES
CO
UN
TY
1
Cen
tral
LA
087
357
3
2.2
3
65
0
.13
9
0.1
00
0
.07
3
0
1
2
3
5
365
0.1
2
0.0
7
0.0
281
365
0.0
1
0.0
02
2
No
rthw
est
Co
asta
l L
A C
ou
nty
091
365
2
1.5
3
65
0
.13
1
0.0
94
0
.07
5
0
1
3
6
5
355
0.0
8
0.0
6
0.0
170
--
--
--
3
So
uth
wes
t C
oas
tal
LA
Co
unty
820
349
2
1.9
3
52
0
.07
7
0.0
70
0
.06
1
0
0
0
0
0
362
0.0
8
0.0
7
0.0
159
362
0.0
2
0.0
06
4
So
uth
Co
asta
l L
A C
ou
nty
1
072
362
3
2.2
3
63
0
.08
9
0.0
68
0
.06
4
0
0
0
0
0
362
0.1
1
0.0
7
0.0
212
361
0.0
2
0.0
05
4
So
uth
Co
asta
l L
A C
ou
nty
2
077
--
--
--
--
--
--
--
--
--
--
--
--
--
--
--
--
--
--
--
6
Wes
t S
an F
ernan
do
Vall
ey
074
365
4
2.8
3
65
0
.13
5
0.1
00
0
.09
3
0
1
19
1
5
31
365
0.0
7
0.0
6
0.0
171
--
--
--
7
Eas
t S
an F
ernand
o V
all
ey
069
365
3
2.9
3
65
0
.14
5
0.0
96
0
.08
6
1
1
14
1
6
28
353
0.0
9
0.0
7
0.0
274
362
0.0
1
0.0
03
8
Wes
t S
an G
abri
el
Vall
ey
088
365
4
2.1
3
65
0
.17
6
0.1
14
0
.09
5
1
3
12
1
2
19
365
0.0
8
0.0
6
0.0
221
--
--
--
--
--
9
Eas
t S
an G
abri
el
Vall
ey 1
060
357
3
1.7
3
65
0
.15
0
0.1
07
0
.09
1
1
4
17
2
3
32
365
0.1
0
0.0
7
0.0
194
--
--
9
Eas
t S
an G
abri
el
Vall
ey 2
591
351
3
2.1
3
52
0
.15
0
0.1
18
0
.10
8
3
7
42
4
5
64
350
0.0
9
0.0
6
0.0
170
--
--
10
Po
mo
na/
Waln
ut
Vall
ey
075
365
3
1.8
3
65
0
.13
8
0.0
99
0
.09
5
0
1
23
2
5
37
365
0.1
0
0.0
8
0.0
274
--
--
--
--
--
--
11
So
uth
San G
abri
el
Vall
ey
085
365
3
2.1
3
65
0
.13
1
0.1
01
0
.07
2
0
1
3
8
6
361
0.1
0
0.0
7
0.0
259
--
--
12
So
uth
Centr
al
LA
Co
un
ty
1
12+
354
7
4.6
3
54
0
.10
4
0.0
86
0
.06
4
0
0
1
2
1
354
0.0
9
0.0
7
0.0
214
--
--
13
Santa
Cla
rita
Vall
ey
090
361
2
1.4
3
57
0
.14
0
0.1
22
0
.10
3
0
5
64
5
7
77
357
0.0
6
0.0
5
0.0
151
--
--
OR
AN
GE
CO
UN
TY
16
No
rth O
ran
ge
Co
un
ty
3177
365
4
2.3
3
65
0
.11
5
0.0
82
0
.07
5
0
0
3
4
9
365
0.1
0
0.0
6
0.0
206
--
--
--
17
Cen
tral
Ora
nge
Co
unty
3176
365
3
2.7
3
65
0
.09
3
0.0
77
0
.06
8
0
0
1
0
2
365
0.0
7
0.0
6
0.0
179
--
--
--
18
No
rth C
oas
tal
Ora
nge
Co
unty
3195
362
3
2.2
3
65
0
.08
7
0.0
75
0
.06
6
0
0
0
0
3
365
0.0
7
0.0
6
0.0
130
364
0.0
1
0.0
04
19
Sad
dle
bac
k V
all
ey
3812
362
2
1.0
3
62
0
.12
1
0.0
95
0
.08
4
0
0
10
7
14
--
--
--
--
--
--
--
RIV
ER
SID
E C
OU
NT
Y
22
No
rco
/Co
rona
4155
--
--
--
--
--
--
--
--
--
--
--
--
--
--
--
--
--
--
--
23
Met
rop
oli
tan R
ivers
ide
Co
unty
1
4144
364
2
1.9
3
46
0
.11
6
0.1
00
0
.08
9
0
0
35
2
5
57
357
0.0
8
0.0
6
0.0
171
364
0.0
1
0.0
03
23
Met
rop
oli
tan R
ivers
ide
Co
unty
2
4146
365
3
1.8
--
--
--
--
--
--
--
--
--
365
0.0
8
0.0
6
0.0
200
--
--
--
23
Mir
a L
om
a
4165
364
3
2.4
3
64
0
.11
8
0.0
90
0
.08
6
0
0
22
1
5
37
364
0.0
8
0.0
5
0.0
158
--
--
--
24
Per
ris
Vall
ey
4149
--
--
--
3
54
0
.12
5
0.1
08
0
.10
1
0
1
67
5
3
88
--
--
--
--
--
--
--
25
Lak
e E
lsin
ore
4158
365
1
0.7
3
65
0
.12
8
0.1
05
0
.09
6
0
1
37
2
4
65
365
0.0
6
0.0
4
0.0
129
--
--
--
29
Ban
nin
g A
irp
ort
4164
--
--
--
3
59
0
.13
3
0.1
04
0
.10
0
0
1
70
5
5
93
359
0.0
6
0.0
5
0.0
109
--
--
--
30
Coac
hell
a V
all
ey 1
**
4137
365
2
0.7
3
65
0
.12
0
0.0
98
0
.09
6
0
0
53
2
8
73
349
0.0
5
0.0
4
0.0
081
--
--
--
30
Coac
hell
a V
all
ey 2
**
4157
--
--
--
3
65
0
.09
7
0.0
90
0
.08
5
0
0
24
6
41
--
--
--
--
--
--
--
SA
N B
ER
NA
RD
INO
CO
UN
TY
32
No
rthw
est
San B
ernar
din
o V
all
ey
5175
365
2
1.5
3
65
0
.14
6
0.1
21
0
.10
2
1
3
49
5
1
71
363
0.1
1
0.0
7
0.0
239
--
--
--
33
So
uth
wes
t S
an B
ernar
din
o V
all
ey
5817
--
--
--
--
--
--
--
--
--
--
--
--
--
--
--
--
--
--
--
34
Cen
tral
San B
ern
ard
ino
Vall
ey 1
5197
365
2
1.5
3
65
0
.14
2
0.1
28
0
.10
0
0
3
48
4
5
65
365
0.1
1
0.0
7
0.0
235
365
0.0
1
0.0
02
34
Cen
tral
San B
ern
ard
ino
Vall
ey 2
5203
363
3
1.9
3
63
0
.15
0
0.1
26
0
.10
1
1
2
62
5
3
79
363
0.0
8
0.0
6
0.0
196
--
--
--
35
Eas
t S
an B
ernard
ino
Val
ley
5204
--
--
--
3
65
0
.14
5
0.1
22
0
.10
0
1
1
73
6
2
91
--
--
--
--
--
--
--
37
Cen
tral
San B
ern
ard
ino
Mo
unta
ins
5181
--
--
--
3
64
0
.14
9
0.1
17
0
.11
0
2
7
92
7
0
107
--
--
--
--
--
--
--
38
Eas
t S
an B
ernard
ino
Mo
un
tain
s 5818
--
--
--
--
--
--
--
--
--
--
--
--
--
--
--
--
--
--
--
D
IST
RIC
T M
AX
IMU
M
7
4.6
0.1
76
0
.12
8
0.1
10
3
7
9
2
70
107
0.1
2
0.0
8
0.0
281
0.0
2
0.0
06
S
OU
TH
CO
AS
T A
IR B
AS
IN
7
4.6
0.1
76
0
.12
8
0.1
10
6
1
5
11
3
10
2
133
0.1
2
0.0
8
0.0
281
0.0
2
0.0
06
pp
m -
Par
ts P
er M
illi
on p
arts
of
air
, b
y v
olu
me.
AA
M =
An
nu
al
Ari
thm
etic
Mea
n
-- -
Po
llu
tant
no
t m
on
ito
red
.
** S
alt
on S
ea A
ir B
asin
.
+ S
ite
was
relo
cate
d.
a) -
The
fed
eral
8-h
our
stand
ard
(8
-ho
ur
aver
age
CO
> 9
pp
m)
and s
tate
8-h
our
stand
ard
(8
-ho
ur
aver
age
CO
> 9
.0 p
pm
) w
ere
no
t ex
ceed
ed.
The
feder
al
and
sta
te 1
-ho
ur
stan
dard
s (3
5 p
pm
and
20 p
pm
) w
ere
not
exce
eded
, ei
ther.
b)
- T
he
fed
eral
1-h
our
ozo
ne
stand
ard w
as r
evoked
and r
epla
ced b
y t
he
8-h
ou
r av
era
ge
ozo
ne
stan
dard
eff
ecti
ve
June
15
, 2
00
5.
U.S
. E
PA
has
rev
ised
the
fed
eral
8-h
our
ozo
ne
stand
ard
fro
m 0
.084 p
pm
to 0
.075 p
pm
, eff
ecti
ve
May
27,
2008
.
c) -
The
8-h
ou
r av
era
ge
Cal
ifo
rnia
ozo
ne
stan
dard
of
0.0
70 p
pm
was
est
abli
shed
eff
ecti
ve
May 1
7,
20
06
.
d)
- T
he
fed
eral
stand
ard
is
an
nual
arit
hm
etic
mea
n N
O2 >
0.0
534 p
pm
. C
alif
orn
ia A
ir R
eso
urc
es B
oar
d h
as r
ev
ised
the
NO
2 1
-ho
ur
stat
e st
and
ard
fro
m 0
.25
pp
m t
o 0
.18
pp
m a
nd h
as
esta
bli
shed
a n
ew a
nn
ual
stand
ard
of
0.0
30 p
pm
, eff
ecti
ve
Mar
ch 2
0,
2008
. U
.S.
EP
A h
as e
stab
lish
ed
a n
ew N
O2
1-h
ou
r st
and
ard
of
10
0 p
pb
(0
.10
0 p
pm
), e
ffec
tiv
e A
pri
l 7,
2010.
e) -
The
stat
e st
and
ard
s ar
e 1
-ho
ur
aver
age
SO
2 >
0.2
5 p
pm
an
d 2
4-h
our
aver
age
SO
2 >
0.0
4 p
pm
. U
.S.
EP
A h
as r
ev
ised
the
fed
era
l st
and
ard
by e
stab
lish
ing
a n
ew S
O2
1-h
our
stan
dard
of
75
ppb
(0.0
75
pp
m)
and
revo
kin
g t
he
exis
ting a
nnual
(0.0
3 p
pm
) and 2
4-h
our
(0.1
4 p
pm
) S
O2
sta
nd
ard
s, e
ffec
tive
Au
gust
2,
20
10
. T
he
fed
eral
and
sta
te S
O2 s
tand
ard
s w
ere
not
exce
eded
.
So
uth
Co
ast
A
ir Q
ua
lity
Ma
na
gem
ent
Dis
tric
t 2
186
5 C
op
ley D
rive
Dia
mo
nd
Bar
, C
A
91
76
5-4
18
2
ww
w.a
qm
d.g
ov
20
09

20
09 A
IR Q
UA
LIT
Y
SO
UT
H C
OA
ST
AIR
QU
AL
ITY
MA
�A
GE
ME
�T
DIS
TR
ICT
So
urc
e/R
ecep
tor
Are
a
N
o.
L
oca
tio
n
Sta
tio
n
No
.
Susp
ended
Par
ticu
late
s P
M1
0 f)
F
ine
Par
ticu
late
s P
M2
.5 g
) P
arti
cula
tes
TS
P
Lea
d
Sulf
ate
No.
Day
s
of
Dat
a
Max
.
Conc.
in
µg/m
3
24-h
ou
r
No
. (%
) S
am
ple
s
Exce
edin
g S
tan
dar
ds
An
nu
al
Avera
ge
Co
nc.
h)
(AA
M)
µg/m
3
No
.
Day
s
of
Dat
a
Max
.
Co
nc.
in
µg/m
3
24
-ho
ur
98
th
Per
centi
le
Co
nc.
in
µg/m
3
24
-ho
ur
No
. (%
)
Sam
ple
s
Exce
edin
g
Fed
eral
Std
> 3
5 µ
g/m
3
24
-ho
ur
Annual
Avera
ge
Conc.
i)
(AA
M)
µg/m
3
No.
Day
s
of
Dat
a
Max
.
Conc.
in
µg/m
3
24-h
our
Annual
Avera
ge
Conc.
(AA
M)
µg/m
3
Max
.
Month
ly
Avera
ge
Conc.
j)
µg/m
3
Max
.
Quart
erly
Avera
ge
Conc.
j)
µg/m
3
Max
.
Conc.
in
µg/m
3
24-h
our
No.
Day
s
Exce
edin
g
Sta
te S
td
≥ 2
5 µ
g/m
3
24-h
our
Fed
eral
> 1
50
µg/m
3
24
-ho
ur
Sta
te
> 5
0
µg/m
3
24
-ho
ur
LO
S A
NG
EL
ES
CO
UN
TY
1
Cen
tral
LA
0
87
60
72
0
4(6
.7)
33
.1
35
9
61
.7
34
.0
7(1
.9)
14.3
61
148
66.8
0.0
2
0.0
1
9.8
0
2
No
rthw
est
Co
asta
l L
A C
ou
nty
0
91
--
--
--
--
--
--
--
--
--
--
59
99
50.8
--
--
9.1
0
3
So
uth
wes
t C
oas
tal
LA
Co
unty
8
20
60
52
0
1(1
.7)
25
.4
--
--
--
--
--
48
87
42.4
0.0
1
0.0
1
8.6
0
4
So
uth
Co
asta
l L
A C
ou
nty
1
072
57
62
0
3(5
.3)
30
.5
32
8
63
.0
34
.2
6(1
.8)
13.0
60
128
55.4
0.0
1
0.0
1
13.6
0
4
So
uth
Co
asta
l L
A C
ou
nty
2
077
56
83
0
5(8
.9)
33
.2
35
0
55
.8
30
.5
4(1
.1)
12.5
59
159
65.2
0.0
1
0.0
1
12.1
0
6
Wes
t S
an F
ernan
do
Vall
ey
074
--
--
--
--
--
1
10
3
9.9
2
7.2
1
(0.9
) 1
1.4
--
--
--
--
--
--
--
7
Eas
t S
an F
ernand
o V
all
ey
0
69
60
80
0
11
(18
.3)
39
.2
24
3
67
.5
34
.4
4(1
.6)
14.4
--
--
--
--
--
--
--
8
Wes
t S
an G
abri
el
Vall
ey
0
88
--
--
--
--
--
1
09
5
2.0
3
5.7
3
(2.8
) 12.3
59
153
48.5
--
--
8.8
0
9
Eas
t S
an G
abri
el
Vall
ey 1
0
60
52
74
0
7(1
3.5
) 3
2.0
1
53
7
2.1
4
2.9
6
(3.9
) 1
2.8
58
208
74.9
--
--
7.9
0
9
Eas
t S
an G
abri
el
Vall
ey 2
5
91
--
--
--
--
--
--
--
--
--
--
--
--
--
--
--
--
--
10
Po
mo
na/
Waln
ut
Vall
ey
075
--
--
--
--
--
--
--
--
--
--
--
--
--
--
--
--
--
11
So
uth
San G
abri
el
Vall
ey
085
--
--
--
--
--
1
18
7
1.1
3
5.4
2
(1.7
) 14.8
59
194
69.7
0.0
4
0.0
2
9.9
0
12
So
uth
Centr
al
LA
Co
un
ty+
112+
--
--
--
--
--
1
14
6
9.2
3
7.7
3
(2.6
) 1
4.7
57
118
59.6
0.0
3
0.0
2
9.9
0
13
Santa
Cla
rita
Vall
ey
0
90
53
56
0
1(1
.9)
23
.4
--
--
--
--
--
--
--
--
--
--
--
--
OR
AN
GE
CO
UN
TY
16
No
rth O
ran
ge
Co
un
ty
31
77
--
--
--
--
--
--
--
--
--
--
--
--
--
--
--
--
--
17
Cen
tral
Ora
nge
Co
unty
31
76
56
63
0
1(1
.8)
30
.9
33
4
64
.6
32
.1
4(1
.2)
11.8
--
--
--
--
--
--
--
18
No
rth C
oas
tal
Ora
nge
Co
unty
31
95
--
--
--
--
--
--
--
--
--
--
--
--
--
--
--
--
--
19
Sad
dle
bac
k V
all
ey
38
12
60
56
0
1(1
.7)
23
.5
11
6
39
.2
23
.8
1(0
.9)
9.5
--
--
--
--
--
--
--
RIV
ER
SID
E C
OU
NT
Y
22
No
rco
/Co
rona
41
55
59
79
0
7(1
1.9
) 3
5.6
--
--
--
--
--
--
--
--
--
--
--
--
23
Met
rop
oli
tan R
ivers
ide
Co
unty
1
41
44
119
77
0
35
(29
.4)
42
.5
34
7
54
.5
39
.6
13
(3.7
) 1
5.3
60
161
87.6
0.0
1
0.0
1
7.3
0
23
Met
rop
oli
tan R
ivers
ide
Co
unty
2
41
46
--
--
--
--
--
1
14
4
2.2
3
4.0
2
(1.8
) 13.4
61
162
66.0
0.0
1
0.0
1
6.8
0
23
Mir
a L
om
a
41
65
59
108
0
3
3(5
5.9
) 5
3.4
2
29
4
9.2
4
0.6
1
4(6
.1)
16.9
--
--
--
--
--
--
--
24
Per
ris
Vall
ey
41
49
58
80
0
9(1
5.5
) 3
4.8
--
--
--
--
--
--
--
--
--
--
--
--
25
Lak
e E
lsin
ore
41
58
--
--
--
--
--
--
--
--
--
--
--
--
--
--
--
--
--
29
Ban
nin
g A
irp
ort
41
64
59
99
0
1(1
.7)
25
.9
--
--
--
--
--
--
--
--
--
--
--
--
30
Co
achell
a V
all
ey 1
**
41
37
54
140
0
1
(1.9
) 2
2.6
1
12
2
1.8
1
4.6
0
6
.7
--
--
--
--
--
--
--
30
Co
achell
a V
all
ey 2
**
41
57
120
132
0
9
(7.5
) 3
2.5
1
12
2
7.5
1
7.0
0
7
.9
--
--
--
--
--
--
--
SA
N B
ER
NA
RD
INO
CO
UN
TY
32
No
rthw
est
San B
ernar
din
o V
all
ey
51
75
--
--
--
--
--
--
--
--
--
--
59
123
58.5
0.0
1
0.0
1
6.8
0
33
So
uth
wes
t S
an B
ernar
din
o V
all
ey
58
17
62
70
0
9(1
4.5
) 3
5.6
1
14
4
6.9
3
5.9
3
(2.6
) 1
4.7
--
--
--
--
--
--
--
34
Cen
tral
San B
ern
ard
ino
Vall
ey 1
51
97
60
75
0
13
(21
.7)
40
.2
11
8
46
.4
32
.7
2(1
.7)
14.3
58
185
84.3
--
--
6.7
0
34
Cen
tral
San B
ern
ard
ino
Vall
ey 2
52
03
52
66
0
11
(21
.2)
41
.5
11
0
37
.8
35
.2
2(1
.8)
13.0
61
125
74.3
0.0
1
0.0
1
7.1
0
35
Eas
t S
an B
ernard
ino
Val
ley
52
04
60
52
0
2(3
.3)
30
.2
--
--
--
--
--
--
--
--
--
--
--
--
37
Cen
tral
San B
ern
ard
ino
Mo
unta
ins
51
81
51
57
0
1(2
.0)
24
.5
--
--
--
--
--
--
--
--
--
--
--
--
38
Eas
t S
an B
ernard
ino
Moun
tain
s 58
18
--
--
--
--
--
5
6
40
.8
29
.4
1(1
.8)
9.9
--
--
--
--
--
--
--
D
IST
RIC
T
MA
XIM
UM
140
0
3
5
53
.4
7
2.1
4
2.9
1
4
16.9
208
87.6
0.0
4
0.0
2
13.6
0
S
OU
TH
CO
AS
T A
IR B
AS
IN
108
0
6
0
53
.4
7
2.1
4
2.9
2
7
16.9
208
87.6
0.0
4
0.0
2
13.6
0
µg/m
3 -
Mic
rog
ram
s p
er c
ub
ic m
eter
of
air
.
A
AM
= A
nn
ual
Ari
thm
etic
Mea
n
-- -
Po
llu
tant
no
t m
on
ito
red
.
** S
alt
on S
ea A
ir B
asin
.
+ S
ite
was
relo
cate
d.
f) -
PM
10
sam
ple
s w
ere
coll
ecte
d e
very
6 d
ays
at a
ll s
ites
exce
pt
for
Sta
tio
n N
um
bers
41
44
and
41
57
wher
e sa
mp
les
wer
e co
llec
ted
ever
y 3
days.
g)
- P
M2.5
sam
ple
s w
ere
coll
ecte
d e
ver
y 3
day
s at
all
sit
es e
xce
pt
for
the
foll
ow
ing s
ites
: S
tati
on N
um
ber
s 0
69
, 0
72
, 0
77
, 0
87
, 3
17
6,
41
44
and
41
65
wher
e sa
mp
les
wer
e ta
ken
ever
y d
ay,
and S
tati
on N
um
ber
5818 w
her
e
sam
ple
s w
ere
tak
en e
ver
y 6
days.
h)
- F
eder
al
an
nual
PM
10
sta
nd
ard (
AA
M >
50 µ
g/m
3)
was
rev
oked
eff
ecti
ve
Dec
em
ber
17
, 2
00
6.
Sta
te s
tand
ard
is
an
nual
aver
age
(AA
M)
> 2
0 µ
g/m
3.
i) -
Fed
eral
PM
2.5
sta
nd
ard
is
annual
avera
ge
(AA
M)
> 1
5.0
µg/m
3.
Sta
te s
tand
ard
is
ann
ual
aver
age
(AA
M)
> 1
2.0
µg/m
3.
j) -
Fed
eral
lead
sta
nd
ard
s ar
e ro
llin
g 3
-mo
nth
avera
ge
> 0
.15 µ
g/m
3,
and q
uar
terl
y a
ver
age
> 1
.5 µ
g/m
3.
Sta
te s
tand
ard
is
mo
nth
ly a
ver
age ≥
1.5
µg/m
3.
Map
s sh
ow
ing t
he
sourc
e/re
cep
tor
area
bo
undari
es c
an b
e ac
cess
ed v
ia t
he
Inte
rnet
by e
nte
rin
g y
ou
r ad
dre
ss i
n t
he
AQ
MD
Curr
en
t H
ou
rly A
ir Q
uali
ty M
ap,
acce
ssed
fro
m h
ttp
://w
ww
2.a
qm
d.g
ov/w
ebap
pl/
gis
aqi2
/VE
Map
3D
.asp
x
or
at h
ttp
://w
ww
.aq
md.g
ov/m
ap
/Map
AQ
MD
2.p
df
. A
map
is
also
avail
able
fre
e o
f ch
arge
fro
m t
he
AQ
MD
Pub
lic
Info
rmat
ion C
ente
r at
1-8
00
-CU
T-S
MO
G.
20
09
Printed on
Recycled
Paper

2010 A
IR Q
UA
LIT
Y
SO
UT
H C
OA
ST
AIR
QU
AL
ITY
MA
�A
GE
ME
�T
DIS
TR
ICT
Car
bon
Mon
oxid
e a)
O
zon
e
Nit
rogen
Dio
xid
e b)
Su
lfu
r D
ioxid
e c)
No.
Day
s
of
Dat
a
Max
.
Conc.
in
pp
m
1-h
our
Max
Co
nc.
in
pp
m
8-h
our
No
.
Day
s
of
Dat
a
Max
.
Co
nc.
in
pp
m
1-h
ou
r
Max
.
Co
nc.
in
pp
m
8-h
ou
r
Fo
urt
h
Hig
h
Co
nc.
pp
m
8-h
ou
r
N
o.
Day
s S
tand
ard
Exce
eded
Max
Conc.
in
pp
b
1-h
our
98
th
Per
centi
le
Conc.
pp
b
1-h
our
Annual
Avera
ge
AA
M
Conc.
pp
b
No.
Day
s
of
Dat
a
Max
.
Conc.
in
pp
b
1-h
our
Max
.
Conc.
in
pp
b
24-h
our
Hea
lth
Ad
vis
ory
≥ 0
.15
pp
m
1-h
ou
r
Fed
era
l
Sta
te
No.
Day
s
of
Dat
a
So
urc
e/R
ecep
tor
Are
a
O
ld
> 0
.12
pp
m
1-h
ou
r
Cu
rrent
> 0
.07
5
pp
m
8-h
ou
r
Cu
rrent
> 0
.09
pp
m
1-h
ou
r
Curr
ent
> 0
.070
pp
m
8-h
our
Sta
tio
n
No.
No
. L
oca
tio
n
LO
S A
NG
EL
ES
CO
UN
TY
1
Cen
tral
LA
0
87
364
3
2.3
3
57
0.098
0.0
80
0
.06
4
0
0
1
1
1
36
4
89.0
70.5
25.0
355
9.8
1.5
2
Nort
hw
est
Co
asta
l L
A C
ou
nty
0
91
364
2
1.4
3
60
0.099
0.0
78
0
.06
9
0
0
1
2
4
36
5
70.8
57.4
15.6
--
--
--
3
So
uth
wes
t C
oas
tal
LA
Co
unty
8
20
344
3
2.2
3
19
0.089
0.0
70
0
.05
9
0
0
0
0
1
35
8
75.8
60.9
12.1
327
25.9
3.5
4
So
uth
Coas
tal
LA
Co
unty
1
072
358
3
2.1
3
58
0.101
0.0
84
0
.05
7
0
0
1
1
1
36
0
92.8
70.2
19.8
329
40.0
6.0
4
So
uth
Coas
tal
LA
Co
unty
2
077
--
--
--
--
--
--
--
--
--
--
--
--
--
--
--
--
--
6
Wes
t S
an F
ernan
do
Vall
ey
0
74
365
3
2.6
2
95
0.122
0.0
91
0
.08
6
0
0
19
11
40
36
5
75.0
56.0
16.7
--
--
--
7
Eas
t S
an F
ernand
o V
all
ey
0
69
364
3
2.4
3
17
0.111
0.0
84
0
.07
6
0
0
4
3
11
35
9
82.0
64.3
24.1
233
*
14.9
4.1
8
Wes
t S
an G
abri
el
Vall
ey
0
88
355
3
2.0
3
25
0.101
0.0
81
0
.07
5
0
0
3
1
6
35
5
71.0
63.0
19.6
--
--
--
9
Eas
t S
an G
abri
el
Vall
ey 1
0
60
355
3
1.3
3
56
0.104
0.0
81
0
.07
5
0
0
3
5
10
36
4
77.2
59.6
18.5
--
--
--
9
Eas
t S
an G
abri
el
Vall
ey 2
5
91
360
2
1.3
3
50
0.124
0.0
99
0
.09
0
0
0
20
25
48
36
0
78.5
55.5
15.4
--
--
--
10
P
om
ona/
Waln
ut
Vall
ey
0
75
365
3
1.8
3
42
0.115
0.0
82
0
.07
6
0
0
4
9
20
36
5
97.0
72.5
26.2
--
--
--
11
S
outh
San G
abri
el
Vall
ey
0
85
364
2
1.9
3
58
0.112
0.0
86
0
.05
9
0
0
1
1
1
36
4
79.0
65.4
22.9
--
--
--
12
S
outh
Centr
al
LA
Co
un
ty
112
353
6
3.6
3
58
0.081
0.0
62
0
.05
0
0
0
0
0
0
36
4
76.8
68.8
17.9
--
--
--
13
S
anta
Cla
rita
Vall
ey
0
90
355
2
1.1
3
31
0.126
0.1
05
0
.08
7
0
1
23
18
44
36
4
59.3
54.2
14.3
--
--
--
OR
AN
GE
CO
UN
TY
16
N
ort
h O
ran
ge
Co
un
ty
31
77
356
3
1.8
3
51
0.118
0.0
96
0
.07
1
0
0
1
2
4
33
3
82.5
61.6
20.1
--
--
--
17
C
entr
al
Ora
nge
Co
unty
31
76
358
3
2.0
3
31
0.104
0.0
88
0
.06
0
0
0
1
1
1
36
4
73.3
61.1
17.5
--
--
--
18
N
ort
h C
oas
tal
Ora
nge
Co
unty
31
95
364
2
2.1
3
53
0.097
0.0
76
0
.06
0
0
0
1
1
2
36
4
70.0
56.0
11.3
348
9.5
2.1
19
S
add
leb
ack
Vall
ey
38
12
362
1
0.9
3
53
0.117
0.0
82
0
.06
9
0
0
2
2
2
--
--
--
--
--
RIV
ER
SID
E C
OU
NT
Y
22
N
orc
o/C
oro
na
41
55
--
--
--
--
--
--
--
--
--
--
--
--
--
--
--
--
--
23
M
etro
po
lita
n R
ivers
ide
Co
unty
1
41
44
364
3
1.8
3
41
0.128
0.0
98
0
.09
2
0
1
47
31
78
33
3
64.5
57.0
16.8
349
17.6
4.6
23
M
etro
po
lita
n R
ivers
ide
Co
unty
2
41
46
355
3
1.7
--
--
--
--
--
--
--
--
--
36
1
60.8
51.5
17.2
--
--
--
23
M
ira
Lo
ma
41
65
360
3
1.9
3
24
0.121
0.0
94
0
.09
0
0
0
38
22
63
36
5
62.2
50.3
15.1
--
--
--
24
P
erri
s V
all
ey
41
49
--
--
--
3
43
0.122
0.1
07
0
.09
9
0
0
50
42
82
--
--
--
--
--
25
L
ake
Els
ino
re
41
58
363
1
0.6
3
55
0.107
0.0
91
0
.08
6
0
0
24
15
42
36
3
51.2
40.6
10.1
--
--
--
29
B
an
nin
g A
irp
ort
41
64
--
--
--
3
28
0.124
0.1
07
0
.09
9
0
0
60
31
84
36
5
65.7
53.2
11.6
--
--
--
30
C
oac
hell
a V
all
ey 1
**
41
37
365
2
0.5
3
61
0.114
0.0
99
0
.09
2
0
0
52
23
83
36
5
45.7
39.0
8.5
--
--
--
30
C
oac
hell
a V
all
ey 2
**
41
57
--
--
--
3
48
0.100
0.0
87
0
.08
4
0
0
19
7
47
--
--
--
--
--
SA
N B
ER
NA
RD
INO
CO
UN
TY
--
32
N
ort
hw
est
San B
ernar
din
o V
all
ey
51
75
353
2
1.8
3
49
0.131
0.0
97
0
.09
0
0
1
39
31
59
36
5
78.9
58.0
20.4
--
--
--
33
S
outh
wes
t S
an B
ernar
din
o V
all
ey
58
17
--
--
--
--
--
--
--
--
--
--
--
--
--
--
--
--
--
34
C
entr
al
San B
ern
ard
ino
Vall
ey 1
51
97
359
3
1.4
3
50
0.143
0.1
00
0
.09
4
0
2
33
28
55
36
3
71.9
64.8
23.1
330
*
6.6
1.6
34
C
entr
al
San B
ern
ard
ino
Vall
ey 2
52
03
326
2
1.7
3
54
0.129
0.1
05
0
.09
5
0
1
40
27
63
36
5
69.2
56.6
18.8
--
--
--
35
E
ast
San B
ernard
ino
Val
ley
52
04
--
--
--
3
63
0.128
0.1
12
0
.09
7
0
1
61
43
86
--
--
--
--
--
37
C
entr
al
San B
ern
ard
ino
Mo
unta
ins
51
81
--
--
--
3
64
0.142
0.1
23
0
.10
9
0
6
74
52
101
--
--
--
--
--
38
E
ast
San B
ernard
ino
Mo
un
tain
s 58
18
--
--
--
--
--
--
--
--
--
--
--
--
--
--
--
--
--
D
IST
RIC
T M
AX
IMU
M
6
3.6
0.1
43
0
.12
3
0.1
09
0
6
7
4
52
101
97.0
72.5
26.2
40.0
6.0
S
OU
TH
CO
AS
T A
IR B
AS
IN
6
3.6
0.1
43
0
.12
3
0.1
09
0
7
1
02
79
131
97.0
72.5
26.2
40.0
6.0
p
pm
- P
art
s P
er M
illi
on p
art
s o
f ai
r, b
y v
olu
me
pp
b –
Par
ts P
er B
illi
on p
art
s o
f ai
r, b
y v
olu
me
A
AM
= A
nn
ual
Ari
thm
etic
Mea
n
-- -
Po
lluta
nt
not
mo
nit
ore
d
** S
alt
on S
ea A
ir B
asin
•
In 2
010
, th
e S
tate
and
Fed
era
l A
mb
ien
t A
ir Q
uali
ty S
tandar
ds
wer
e m
et f
or
the
gas
eou
s p
oll
uta
nts
CO
, N
O2
and
SO
2 a
t al
l D
istr
ict
reg
ula
r m
on
ito
rin
g s
ites
, li
sted
ab
ove.
a) -
The
feder
al
8-h
our
stand
ard
is
8-h
our
aver
age
CO
> 9
pp
m a
nd s
tate
8-h
our
stand
ard
is
8-h
our
aver
age
CO
> 9
.0 p
pm
. T
he
fed
eral
and
sta
te 1
-ho
ur
stand
ard
s ar
e 3
5 p
pm
and 2
0 p
pm
.
b)
- T
he
NO
2 f
eder
al
1-h
ou
r st
and
ard
is
100 p
pb
and t
he
annual
stand
ard i
s an
nu
al
arit
hm
eti
c m
ean N
O2 >
0.0
53
4 p
pm
. T
he
stat
e 1
-ho
ur
and
an
nual
stand
ard
s ar
e 0
.18
pp
m a
nd 0
.030 p
pm
.
c) -
The
feder
al
SO
2 1
-ho
ur
stan
dard
is
75 p
pb
(0.0
75
pp
m).
T
he
stat
e st
and
ards
are
1-h
our
aver
age
SO
2 >
0.2
5 p
pm
and
24
-ho
ur
aver
age
SO
2 >
0.0
4 p
pm
.
•
Rev
ised
/New
Sta
nd
ard
s in
20
10
:
-- U
.S.
EP
A e
stab
lish
ed t
he
new
NO
2 1
-ho
ur
feder
al
standar
d o
f 10
0 p
pb
(0.1
00
pp
m),
eff
ecti
ve
Ap
ril
7,
20
10
.
-- U
.S.
EP
A r
ev
ised
the
SO
2 f
edera
l st
andard
by e
stab
lish
ing t
he
new
1-h
our
stan
dard
of
75
pp
b (
0.0
75
pp
m)
and
rev
ok
ing t
he
ex
isti
ng a
nn
ual
(0.0
3 p
pm
) and
2
4-h
ou
r (0
.14 p
pm
)
stan
dar
ds,
eff
ecti
ve
Au
gust
2,
2010.
So
uth
Co
ast
A
ir Q
ua
lity
Ma
na
gem
ent
Dis
tric
t 2
186
5 C
op
ley D
rive
Dia
mond
Bar
, C
A
917
65
-418
2
ww
w.a
qm
d.g
ov
20
10
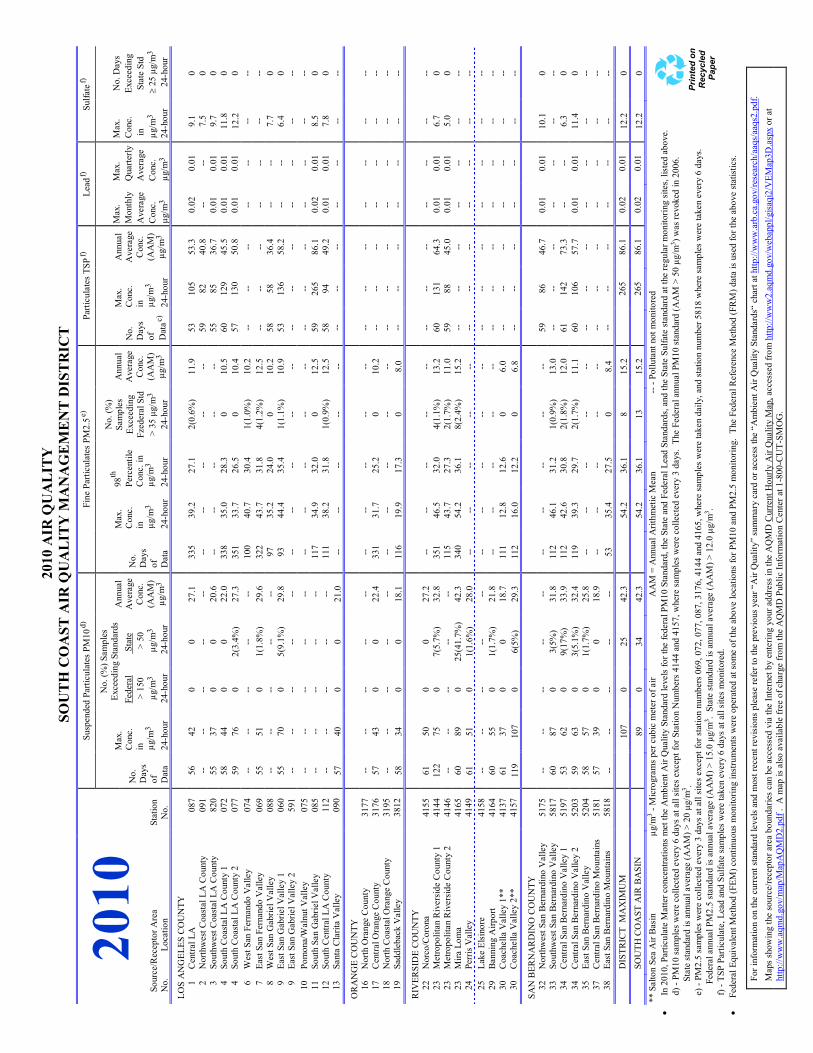
20
10 A
IR Q
UA
LIT
Y
SO
UT
H C
OA
ST
AIR
QU
AL
ITY
MA
�A
GE
ME
�T
DIS
TR
ICT
So
urc
e/R
ecep
tor
Are
a
N
o.
L
oca
tio
n
Sta
tio
n
No
.
Susp
end
ed P
arti
cu
late
s P
M1
0 d
) F
ine
Par
ticu
late
s P
M2
.5 e)
P
arti
cula
tes
TS
P f)
L
ead f)
S
ulf
ate
f)
No.
Day
s
of
Dat
a
Max
.
Conc.
in
µg/m
3
24-h
ou
r
No
. (%
) S
am
ple
s
Exce
edin
g S
tan
dar
ds
An
nu
al
Avera
ge
Co
nc.
(AA
M)
µg/m
3
No
.
Day
s
of
Dat
a
Max
.
Co
nc.
in
µg/m
3
24
-ho
ur
98
th
Per
centi
le
Co
nc.
in
µg/m
3
24
-ho
ur
No
. (%
)
Sam
ple
s
Exce
edin
g
Fze
dera
l S
td
> 3
5 µ
g/m
3
24
-ho
ur
Annual
Avera
ge
Conc.
(AA
M)
µg/m
3
No.
Day
s
of
Dat
a c)
Max
.
Conc.
in
µg/m
3
24-h
our
Annual
Avera
ge
Conc.
(AA
M)
µg/m
3
Max
.
Month
ly
Avera
ge
Conc.
µg/m
3
Max
.
Quart
erly
Avera
ge
Conc.
µg/m
3
Max
.
Conc.
in
µg/m
3
24-h
our
No.
Day
s
Exce
edin
g
Sta
te S
td
≥ 2
5 µ
g/m
3
24-h
our
Fed
eral
> 1
50
µg/m
3
24
-ho
ur
Sta
te
> 5
0
µg/m
3
24
-ho
ur
LO
S A
NG
EL
ES
CO
UN
TY
1
Cen
tral
LA
0
87
56
42
0
0
27
.1
33
5
39
.2
27
.1
2(0
.6%
) 11.9
53
105
53.3
0.0
2
0.0
1
9.1
0
2
No
rthw
est
Co
asta
l L
A C
ou
nty
0
91
--
--
--
--
--
--
--
--
--
--
59
82
40.8
--
--
7.5
0
3
So
uth
wes
t C
oas
tal
LA
Co
unty
8
20
55
37
0
0
20
.6
--
--
--
--
--
55
85
36.7
0.0
1
0.0
1
9.7
0
4
So
uth
Co
asta
l L
A C
ou
nty
1
072
58
44
0
0
22
.0
33
8
35
.0
28
.3
0
10.5
60
129
45.5
0.0
1
0.0
1
11.8
0
4
So
uth
Co
asta
l L
A C
ou
nty
2
077
59
76
0
2(3
.4%
) 2
7.3
3
51
3
3.7
2
6.5
0
10.4
57
130
50.8
0.0
1
0.0
1
12.2
0
6
Wes
t S
an F
ernan
do
Vall
ey
074
--
--
--
--
--
1
00
4
0.7
3
0.4
1
(1.0
%)
10.2
--
--
--
--
--
--
--
7
Eas
t S
an F
ernand
o V
all
ey
0
69
55
51
0
1(1
.8%
) 2
9.6
3
22
4
3.7
3
1.8
4
(1.2
%)
12.5
--
--
--
--
--
--
--
8
Wes
t S
an G
abri
el
Vall
ey
0
88
--
--
--
--
--
9
7
35
.2
24
.0
0
10.2
58
58
36.4
--
--
7.7
0
9
Eas
t S
an G
abri
el
Vall
ey 1
0
60
55
70
0
5(9
.1%
) 2
9.8
9
3
44
.4
35
.4
1(1
.1%
) 1
0.9
53
136
58.2
--
--
6.4
0
9
Eas
t S
an G
abri
el
Vall
ey 2
5
91
--
--
--
--
--
--
--
--
--
--
--
--
--
--
--
--
--
10
Po
mo
na/
Waln
ut
Vall
ey
075
--
--
--
--
--
--
--
--
--
--
--
--
--
--
--
--
--
11
So
uth
San G
abri
el
Vall
ey
085
--
--
--
--
--
1
17
3
4.9
3
2.0
0
12.5
59
265
86.1
0.0
2
0.0
1
8.5
0
12
So
uth
Centr
al
LA
Co
un
ty
112
--
--
--
--
--
1
11
3
8.2
3
1.8
1
(0.9
%)
12.5
58
94
49.2
0.0
1
0.0
1
7.8
0
13
Santa
Cla
rita
Vall
ey
0
90
57
40
0
0
21
.0
--
--
--
--
--
--
--
--
--
--
--
--
OR
AN
GE
CO
UN
TY
16
No
rth O
ran
ge
Co
un
ty
31
77
--
--
--
--
--
--
--
--
--
--
--
--
--
--
--
--
--
17
Cen
tral
Ora
nge
Co
unty
31
76
57
43
0
0
22
.4
33
1
31
.7
25
.2
0
10.2
--
--
--
--
--
--
--
18
No
rth C
oas
tal
Ora
nge
Co
unty
31
95
--
--
--
--
--
--
--
--
--
--
--
--
--
--
--
--
--
19
Sad
dle
bac
k V
all
ey
38
12
58
34
0
0
18
.1
11
6
19
.9
17
.3
0
8.0
--
--
--
--
--
--
--
RIV
ER
SID
E C
OU
NT
Y
22
No
rco
/Co
rona
41
55
61
50
0
0
27
.2
--
--
--
--
--
--
--
--
--
--
--
--
23
Met
rop
oli
tan R
ivers
ide
Co
unty
1
41
44
122
75
0
7(5
.7%
) 3
2.8
3
51
4
6.5
3
2.0
4
(1.1
%)
13.2
60
131
64.3
0.0
1
0.0
1
6.7
0
23
Met
rop
oli
tan R
ivers
ide
Co
unty
2
41
46
--
--
--
--
--
1
15
4
3.7
2
7.3
2
(1.7
%)
11.0
59
88
45.0
0.0
1
0.0
1
5.0
0
23
Mir
a L
om
a
41
65
60
89
0
25
(41
.7%
) 4
2.3
3
40
5
4.2
3
6.1
8
(2.4
%)
15.2
--
--
--
--
--
--
--
24
Per
ris
Vall
ey
41
49
61
51
0
1(1
.6%
) 2
8.0
--
--
--
--
--
--
--
--
--
--
--
--
25
Lak
e E
lsin
ore
41
58
--
--
--
--
--
--
--
--
--
--
--
--
--
--
--
--
--
29
Ban
nin
g A
irp
ort
41
64
60
55
0
1(1
.7%
) 2
1.8
--
--
--
--
--
--
--
--
--
--
--
--
30
Co
achell
a V
all
ey 1
**
41
37
61
37
0
0
18
.7
11
1
12
.8
12
.6
0
6.0
--
--
--
--
--
--
--
30
Co
achell
a V
all
ey 2
**
41
57
119
107
0
6
(5%
) 2
9.3
1
12
1
6.0
1
2.2
0
6.8
--
--
--
--
--
--
--
SA
N B
ER
NA
RD
INO
CO
UN
TY
32
No
rthw
est
San B
ernar
din
o V
all
ey
51
75
--
--
--
--
--
--
--
--
--
--
59
86
46.7
0.0
1
0.0
1
10.1
0
33
So
uth
wes
t S
an B
ernar
din
o V
all
ey
58
17
60
87
0
3(5
%)
31
.8
11
2
46
.1
31
.2
1(0
.9%
) 1
3.0
--
--
--
--
--
--
--
34
Cen
tral
San B
ern
ard
ino
Vall
ey 1
51
97
53
62
0
9(1
7%
) 3
3.9
1
12
4
2.6
3
0.8
2
(1.8
%)
12.0
61
142
73.3
--
--
6.3
0
34
Cen
tral
San B
ern
ard
ino
Vall
ey 2
52
03
59
63
0
3(5
.1%
) 3
2.4
1
19
3
9.3
2
9.7
2
(1.7
%)
11.1
60
106
57.7
0.0
1
0.0
1
11.4
0
35
Eas
t S
an B
ernard
ino
Val
ley
52
04
58
57
0
1(1
.7%
) 2
5.8
--
--
--
--
--
--
--
--
--
--
--
--
37
Cen
tral
San B
ern
ard
ino
Mo
unta
ins
51
81
57
39
0
0
18
.9
--
--
--
--
--
--
--
--
--
--
--
--
38
Eas
t S
an B
ernard
ino
Moun
tain
s 58
18
--
--
--
--
--
5
3
35
.4
27
.5
0
8.4
--
--
--
--
--
--
--
D
IST
RIC
T
MA
XIM
UM
107
0
2
5
42
.3
5
4.2
3
6.1
8
15.2
265
86.1
0.0
2
0.0
1
12.2
0
S
OU
TH
CO
AS
T A
IR B
AS
IN
89
0
34
4
2.3
54
.2
36
.1
13
15.2
265
86.1
0.0
2
0.0
1
12.2
0
** S
alt
on S
ea A
ir B
asin
µ
g/m
3 -
Mic
rogra
ms
per
cub
ic m
eter
of
air
A
AM
= A
nn
ual
Ari
thm
etic
Mea
n
-- -
Po
lluta
nt
not
mo
nit
ore
d
•
In
20
10
, P
arti
cu
late
Mat
ter
conce
ntr
atio
ns
met
the
Am
bie
nt
Air
Quali
ty S
tand
ard
levels
fo
r th
e fe
dera
l P
M1
0 S
tan
dar
d,
the
Sta
te a
nd
Fed
era
l L
ead
Sta
nd
ard
s, a
nd
the
Sta
te S
ulf
ate
standar
d a
t th
e re
gula
r m
onit
ori
ng s
ites
, li
sted
ab
ove.
d)
- P
M1
0 s
am
ple
s w
ere
coll
ecte
d e
ver
y 6
day
s at
all
sit
es e
xce
pt
for
Sta
tio
n N
um
bers
41
44
and
41
57
, w
her
e sa
mp
les
wer
e co
llec
ted
ever
y 3
days.
T
he
Fed
era
l an
nu
al
PM
10 s
tandar
d (
AA
M >
50 µ
g/m
3)
was
revok
ed i
n 2
006.
S
tate
sta
nd
ard
is
ann
ual
aver
age
(AA
M)
> 2
0 µ
g/m
3.
e) -
PM
2.5
sam
ple
s w
ere
coll
ecte
d e
very
3 d
ays
at a
ll s
ites
exce
pt
for
stat
ion n
um
ber
s 0
69
, 0
72
, 0
77
, 0
87
, 3
17
6,
41
44
and
41
65
, w
here
sam
ple
s w
ere
tak
en d
ail
y,
and
sta
tio
n n
um
ber
5818 w
her
e sa
mp
les
wer
e ta
ken e
ver
y 6
days.
Fed
eral
an
nual
PM
2.5
sta
nd
ard
is
ann
ual
aver
age
(AA
M)
> 1
5.0
µg/m
3.
Sta
te s
tand
ard
is
ann
ual
aver
age
(AA
M)
> 1
2.0
µg
/m3.
f) -
TS
P P
arti
cu
late
, L
ead
an
d S
ulf
ate
sam
ple
s w
ere
taken e
very
6 d
ays
at a
ll s
ites
mo
nit
ore
d.
•
Fed
eral
Eq
uiv
ale
nt
Met
ho
d (
FE
M)
conti
nu
ous
mo
nit
ori
ng i
nst
rum
ents
wer
e op
erat
ed a
t so
me
of
the
abo
ve
loca
tio
ns
for
PM
10
an
d P
M2
.5 m
on
ito
rin
g.
The
Fed
era
l R
efe
rence
Met
hod (
FR
M)
dat
a is
use
d f
or
the
abo
ve
stat
isti
cs.
Fo
r in
form
ati
on o
n t
he
curr
ent
stan
dard
level
s an
d m
ost
rec
ent
revis
ions
ple
ase
refe
r to
the
pre
vio
us
yea
r “A
ir Q
uali
ty”
sum
mary
car
d o
r ac
cess
the
“A
mb
ien
t A
ir Q
uali
ty S
tandard
s“ c
har
t at
htt
p:/
/ww
w.a
rb.c
a.go
v/r
esea
rch/a
aqs/
aaqs2
.pd
f.
Map
s sh
ow
ing t
he
sou
rce/
rece
pto
r ar
ea b
ound
ari
es c
an b
e ac
cess
ed v
ia t
he
Inte
rnet
by e
nte
rin
g y
ou
r ad
dre
ss i
n t
he
AQ
MD
Curr
en
t H
ou
rly A
ir Q
uali
ty M
ap,
acce
ssed
fro
m h
ttp
://w
ww
2.a
qm
d.g
ov/w
ebap
pl/
gis
aqi2
/VE
Map
3D
.asp
x o
r at
htt
p:/
/ww
w.a
qm
d.g
ov/m
ap/M
apA
QM
D2.p
df
. A
map
is
also
avail
able
fre
e o
f ch
arg
e fr
om
the
AQ
MD
Pub
lic
Info
rmat
ion C
ente
r at
1-8
00
-CU
T-S
MO
G.
20
10
Printed on
Recycled
Paper

201
1 A
IR Q
UA
LIT
Y
SO
UT
H C
OA
ST
AIR
QU
AL
ITY
MA
�A
GE
ME
�T
DIS
TR
ICT
C
arb
on
M
on
ox
ide
a)
Ozo
ne
�
itro
gen
Dio
xid
e b
) S
ulf
ur
Dio
xid
e c)
N
o.
Day
s S
tand
ard
Exce
eded
So
urc
e/R
ecep
tor
Are
a
No
.
Lo
cati
on
Sta
tio
n
No.
No.
Day
s
of
Dat
a
Max
Conc.
in
pp
m
8-h
our
No
.
Day
s
of
Dat
a
Max
.
Co
nc.
in
pp
m
1-h
ou
r
Max
.
Co
nc.
in
pp
m
8-h
ou
r
Fo
urt
h
Hig
h
Co
nc.
pp
m
8-h
ou
r
Hea
lth
Ad
vis
ory
≥ 0
.15
pp
m
1-h
ou
r
Old
Fed
eral
> 0
.12
4
pp
m
1-h
ou
r
Cu
rrent
Fed
eral
> 0
.07
5
pp
m
8-h
ou
r
Cu
rrent
Sta
te
> 0
.09
pp
m
1-h
ou
r
Curr
ent
Sta
te
> 0
.070
pp
m
8-h
our
No.
Day
s
of
Dat
a
Max
Conc.
in
pp
b
1-h
our
98
th
Per
centi
le
Conc.
pp
b
1-h
our
Annual
Avera
ge
AA
M
Conc.
pp
b
No.
Day
s
of
Dat
a
Max
.
Conc.
in
pp
b
1-h
our
99
th
Per
centi
le
Conc.
pp
b
1-h
our
LO
S A
NG
EL
ES
CO
UN
TY
1
Cen
tral
LA
087
365
2.4
36
5
0.0
87
0
.06
5
0.0
60
0
0
0
0
0
36
5
109.6
67.0
23.1
331
19.8
11.0
2
Nort
hw
est
Co
asta
l L
A C
ounty
091
360
1.3
360
0
.09
8
0.0
68
0
.06
1
0
0
0
2
0
36
0
81.3
58.2
13.9
--
--
--
3
So
uth
wes
t C
oas
tal
LA
Co
unty
820
364
1.8
360
0
.07
8
0.0
67
0
.06
2
0
0
0
0
0
36
5
97.6
64.8
13.4
365
11.5
8.3
4
So
uth
Co
asta
l L
A C
ou
nty
1
072
365
2.6
363
0
.07
3
0.0
61
0
.05
9
0
0
0
0
0
36
5
106.4
67.6
17.7
365
14.8
10.7
4
So
uth
Co
asta
l L
A C
ou
nty
2
077
--
--
--
--
--
--
--
--
--
--
--
--
--
--
--
--
--
--
4
So
uth
Co
asta
l L
A C
ou
nty
3
033
354
3.3
360
0
.07
4
0.0
63
0
.05
7
0
0
0
0
0
35
9
90.0
74.0
21.2
350
43.3
24.7
6
Wes
t S
an F
ernan
do
Vall
ey
074
355
2.8
36
5
0.1
30
0
.10
3
0.0
91
0
3
2
6
17
35
35
9
56.1
53.8
14.9
--
--
--
7
Eas
t S
an F
ernand
o V
all
ey
069
365
2.4
36
4
0.1
20
0
.08
4
0.0
81
0
0
6
8
10
36
5
67.8
56.2
22.1
363
9.0
5.2
8
Wes
t S
an G
abri
el
Vall
ey
088
365
2.2
36
5
0.1
07
0
.08
4
0.0
77
0
0
5
5
13
35
9
87.3
72.8
20.3
--
--
--
9
Eas
t S
an G
abri
el
Vall
ey 1
060
365
1.4
36
5
0.1
11
0
.09
2
0.0
82
0
0
1
2
13
19
35
6
79.5
65.1
19.0
--
--
--
9
Eas
t S
an G
abri
el
Vall
ey 2
591
362
1.1
36
2
0.1
34
0
.11
1
0.0
95
0
4
3
0
35
40
36
1
77.6
53.9
12.9
--
--
--
10
Po
mo
na/
Waln
ut
Vall
ey
075
364
1.6
36
4
0.1
19
0
.09
6
0.0
86
0
0
1
6
15
24
36
4
87.3
66.7
24.6
--
--
--
11
So
uth
San G
abri
el
Vall
ey
085
365
2.4
362
0
.09
6
0.0
74
0
.06
1
0
0
0
1
1
36
2
90.6
72.5
23.7
--
--
--
12
So
uth
Centr
al
LA
Co
un
ty
112
364
4.7
36
2
0.0
82
0
.06
5
0.0
61
0
0
0
0
0
36
1
75.4
65.3
18.6
--
--
--
13
Santa
Cla
rita
Vall
ey
090
363
0.8
36
3
0.1
44
0
.12
2
0.1
01
0
3
3
0
31
52
36
0
60.1
46.8
13.3
--
--
--
OR
AN
GE
CO
UN
TY
16
Nort
h O
ran
ge
Co
un
ty
3177
365
2.1
36
5
0.0
95
0
.07
4
0.0
69
0
0
0
1
3
36
5
69.8
60.7
17.7
--
--
--
17
Cen
tral
Ora
nge
Co
unty
3176
365
2.1
365
0
.08
8
0.0
72
0
.06
4
0
0
0
0
1
36
5
73.8
60.8
16.8
--
--
--
18
Nort
h C
oas
tal
Ora
nge
Co
unty
3195
344
2.2
36
0
0.0
93
0
.07
7
0.0
63
0
0
1
0
2
35
0
60.5
52.8
10.0
357
7.7
4.8
19
Sad
dle
bac
k V
all
ey
3812
365
0.8
36
5
0.0
94
0
.08
3
0.0
74
0
0
2
0
5
--
--
--
--
--
--
RIV
ER
SID
E C
OU
NT
Y
22
Norc
o/C
oro
na
4155
--
--
--
--
--
--
--
--
--
--
--
--
--
--
--
--
--
--
23
Met
rop
oli
tan R
ivers
ide
Co
unty
1
4144
365
1.4
36
5
0.1
28
0
.11
5
0.1
06
0
4
6
7
52
92
35
9
63.3
56.5
16.6
365
51.3
12.5
23
Met
rop
oli
tan R
ivers
ide
Co
unty
2
4146
365
1.5
--
--
--
--
--
--
--
--
--
36
4
57.1
50.4
16.9
--
--
--
23
Mir
a L
om
a
4165
361
1.4
362
0
.12
6
0.1
04
0
.09
6
0
1
36
3
2
63
36
4
58.8
51.8
15.3
--
--
--
24
Per
ris
Vall
ey
4149
--
--
364
0
.12
5
0.1
12
0
.09
4
0
2
54
4
4
77
--
--
--
--
--
--
--
25
Lak
e E
lsin
ore
4158
365
0.7
365
0
.13
3
0.1
06
0
.09
2
0
1
28
1
9
45
36
5
50.3
41.3
9.6
--
--
--
26
Tem
ecu
la
4031
--
--
355
0
.10
5
0.0
85
0
.07
3
0
0
14
1
27
--
--
--
--
--
--
--
29
Ban
nin
g A
irp
ort
4164
--
--
36
2
0.1
27
0
.11
1
0.1
00
0
3
4
1
35
59
35
0
60.7
50.2
9.5
--
--
--
30
Coac
hell
a V
all
ey 1
**
4137
350
0.6
350
0
.12
4
0.0
98
0
.09
2
0
0
49
2
1
69
35
0
44.7
39.4
8.0
--
--
--
30
Coac
hell
a V
all
ey 2
**
4157
--
--
360
0
.09
9
0.0
90
0
.08
5
0
0
19
3
42
--
--
--
--
--
--
--
SA
N B
ER
NA
RD
INO
CO
UN
TY
32
Nort
hw
est
San B
ernar
din
o V
all
ey
5175
365
1.3
365
0
.14
5
0.1
22
0
.09
8
0
5
36
3
6
45
35
3
68.5
60.1
19.6
--
--
--
33
So
uth
wes
t S
an B
ernar
din
o V
all
ey
5817
--
--
--
--
--
--
--
--
--
--
--
--
--
--
--
--
--
--
34
Cen
tral
San B
ern
ard
ino
Vall
ey 1
5197
365
1.1
36
5
0.1
44
0
.12
4
0.1
05
0
5
3
9
39
53
36
5
76.4
64.6
21.1
365
12.3
7.2
34
Cen
tral
San B
ern
ard
ino
Vall
ey 2
5203
365
1.7
36
5
0.1
35
0
.12
1
0.1
01
0
2
3
9
40
66
36
5
61.9
52.9
16.9
--
--
--
35
Eas
t S
an B
ernard
ino
Val
ley
5204
--
--
36
4
0.1
51
0
.13
3
0.1
13
1
7
8
0
64
96
--
--
--
--
--
--
--
37
Cen
tral
San B
ern
ard
ino
Mo
unta
ins
5181
--
--
360
0
.16
0
0.1
36
0
.10
6
1
8
84
5
8
103
--
--
--
--
--
--
--
38
Eas
t S
an B
ernard
ino
Mo
unta
ins
5818
--
--
--
--
--
--
--
--
--
--
--
--
--
--
--
--
--
--
D
IST
RIC
T M
AX
IMU
M
4.7
0.1
60
0
.13
6
0.1
13
1
8
8
4
64
103
109.6
74.0
24.6
51.3
24.7
S
OU
TH
CO
AS
T A
IR B
AS
IN
4.7
0.1
60
0
.13
6
0.1
13
1
1
6
10
6
90
125
109.6
74.0
24.6
51.3
24.7
pp
m -
Part
s P
er M
illi
on p
art
s o
f ai
r, b
y v
olu
me
ppb
– P
arts
Per
Bil
lio
n p
art
s o
f ai
r, b
y v
olu
me
A
AM
= A
nn
ual
Ari
thm
etic
Mea
n
-- -
Po
lluta
nt
not
mo
nit
ore
d
** S
alt
on S
ea A
ir B
asin
a) -
The
fed
eral
8-h
our
stand
ard
(8-h
our
aver
age
CO
> 9
pp
m)
and s
tate
8-h
our
stand
ard
(8
-ho
ur
aver
age
CO
> 9
.0 p
pm
) w
ere
no
t ex
ceed
ed.
T
he
fed
era
l an
d s
tate
1-h
our
stand
ards
(35 p
pm
and 2
0 p
pm
) w
ere
not
exce
eded
eit
her
.
b)
- T
he
NO
2 f
ed
eral
1-h
ou
r st
and
ard
is
100
ppb
and
the
ann
ual
stan
dar
d i
s an
nual
ari
thm
etic
mea
n N
O2 >
0.0
53
4 p
pm
(5
.34
pp
b).
T
he
stat
e 1
-ho
ur
and
an
nu
al
stan
dar
ds
are
0.1
8 p
pm
(1
80 p
pb
)
a
nd
0.0
30
pp
m (
30
pp
b).
c) -
The
fed
eral
SO
2 1
-ho
ur
standar
d i
s 75 p
pb
(0.0
75 p
pm
).
The
stat
e st
andar
ds
are
1-h
ou
r aver
age
SO
2 >
0.2
5 p
pm
(2
50
pp
b)
and
24
-ho
ur
aver
age
SO
2 >
0.0
4 p
pm
(4
0 p
pb
).
For
info
rmati
on o
n t
he
curr
en
t st
andard
level
s an
d m
ost
rec
ent
revis
ions
ple
ase
refe
r to
“A
pp
end
ix I
I –
Cu
rren
t A
ir Q
uali
ty”
of
the “
Fin
al
20
12
AQ
MP
(D
ecem
ber)
” w
hic
h c
an b
e ac
cess
ed a
t htt
p:/
/ww
w.a
qm
d.g
ov/a
qm
p/2
012aq
mp
/Dra
ftF
inal/
app
II.p
df.
Map
s sh
ow
ing t
he
sou
rce/
rece
pto
r ar
ea b
oundari
es c
an b
e ac
cess
ed v
ia t
he
Inte
rnet
by e
nte
rin
g y
ou
r ad
dre
ss i
n t
he
AQ
MD
Curr
en
t H
ou
rly A
ir Q
uali
ty M
ap,
acce
ssed
fro
m h
ttp
://w
ww
2.a
qm
d.g
ov/w
ebap
pl/
gis
aqi2
/VE
Map
3D
.asp
x o
r at
htt
p:/
/ww
w.a
qm
d.g
ov/m
ap/M
apA
QM
D2.p
df
. A
map
or
cop
y o
f th
e A
QM
P A
pp
en
dix
II
is a
lso
avail
able
fre
e o
f char
ge
fro
m t
he A
QM
D P
ub
lic
Info
rmat
ion C
ente
r at
1-8
00-C
UT
-SM
OG
.
20
11
Sou
th C
oast
Air
Qu
ali
ty M
an
ag
em
en
t D
istr
ict
21865 C
op
ley D
rive
Dia
mo
nd B
ar,
CA
91765
-4182
ww
w.a
qm
d.g
ov

201
1 A
IR Q
UA
LIT
Y
SO
UT
H C
OA
ST
AIR
QU
AL
ITY
MA
�A
GE
ME
�T
DIS
TR
ICT
S
usp
end
ed
Part
icu
late
s P
M10
d)
Fin
e P
art
icu
late
s P
M2.5
f)
Part
icu
late
s T
SP
L
ead
h)
PM
10 S
ulf
ate
i)
No.
Day
s
of
Dat
a
Max
.
Conc.
in
µg/m
3
24-h
our
No
. (%
) S
am
ple
s
Exce
edin
g S
tan
dar
ds
An
nu
al.
Avera
ge
Co
nc.
e)
(AA
M)
µg/m
3
No
.
Day
s
of
Dat
a
Max
.
Co
nc.
in
µg/m
3
24
-ho
ur
98
th
Per
centi
le
Co
nc.
in
µg/m
3
24
-ho
ur
No
. (%
)
Sam
ple
s
Exce
edin
g
Fed
eral
Std
> 3
5 µ
g/m
3
24
-ho
ur
An
nu
al.
Avera
ge
Co
nc.
(AA
M)
µg/m
3
No.
Day
s
of
Dat
a
Max
.
Conc.
in
µg/m
3
24-h
our
Annual.
Avera
ge
Conc.
(AA
M)
µg/m
3
Max
.
Month
ly
Avera
ge
Conc.
µg/m
3
Max
.
3-M
onth
s
Roll
ing
Avera
ges
µg/m
3
Max
.
Quart
erly
Avera
ge
Conc.
µg/m
3
No.
Day
s
of
Dat
a
Max
.
Conc.
in
µg/m
3
24-h
our
So
urc
e/R
ecep
tor
Are
a
No
.
Lo
cati
on
Sta
tio
n
No.
Feder
al
> 1
50
µg/m
3
24-h
ou
r
S
tate
> 5
0
µg/m
3
24
-ho
ur
LO
S A
NG
EL
ES
CO
UN
TY
1
Cen
tral
LA
087
59
53
0
1
(2%
) 2
9.0
3
31
4
9.3
3
1.5
4
(1.2
%)
13
.0
60
84
53.7
0.0
12
0.0
11
0.0
11
58
8.0
2
Nort
hw
est
Co
asta
l L
A C
ou
nty
091
--
--
--
--
--
--
--
--
--
--
59
15
5
49.3
--
--
--
--
--
3
So
uth
wes
t C
oas
tal
LA
Co
unty
820
58
41
0
0
2
1.7
--
--
--
--
--
55
69
36.1
0.0
08
0.0
05
0.0
05
58
5.9
4
So
uth
Co
asta
l L
A C
ou
nty
1
072
60
43
0
0
2
4.2
3
40
3
9.7
2
7.8
1
(0.3
%)
11
.0
61
91
44.0
0.0
10
0.0
07
0.0
07
59
6.1
4
So
uth
Co
asta
l L
A C
ou
nty
2
077
60
50
0
0
2
8.7
3
46
4
2.0
2
6.6
3
(0.9
%)
10
.7
56
81
43.9
0.0
13
0.0
09
0.0
09
60
5.9
4
So
uth
Co
asta
l L
A C
ou
nty
3
033
--
--
--
--
--
--
--
--
--
--
--
--
--
--
--
--
--
--
6
Wes
t S
an F
ernan
do
Vall
ey
074
--
--
--
--
--
1
17
3
9.8
2
3.6
1
(0.9
%)
10
.2
--
--
--
--
--
--
--
--
7
Eas
t S
an F
ernand
o V
all
ey
069
55
61
0
2
(4%
) 2
8.4
3
21
4
7.8
3
3.5
5
(1.6
%)
13
.2
--
--
--
--
--
--
54
7.4
8
Wes
t S
an G
abri
el
Vall
ey
088
--
--
--
--
--
9
7
43
.8
29
.8
1(1
.0%
) 1
0.8
59
74
44.1
--
--
--
--
--
9
Eas
t S
an G
abri
el
Vall
ey 1
060
61
65
0
9
(15
%)
32
.7
11
8 g
) 4
9.5
g)
26
.9 g
) 1
(0.8
%) g
) 1
1.4
g)
57
15
4
72.5
--
--
--
60
6.6
9
Eas
t S
an G
abri
el
Vall
ey 2
591
--
--
--
--
--
--
--
--
--
--
--
--
--
--
--
--
--
--
10
Po
mo
na/
Waln
ut
Vall
ey
075
--
--
--
--
--
--
--
--
--
--
--
--
--
--
--
--
--
--
11
So
uth
San G
abri
el
Vall
ey
085
--
--
--
--
--
1
14
4
1.2
3
1.5
1
(0.9
%)
12
.5
59
14
0
64.4
0.0
11
0.0
10
0.0
10
--
--
12
So
uth
Centr
al
LA
Co
un
ty
112
--
--
--
--
--
1
10
3
5.3
3
1.5
0
1
3.0
57
11
2
52.8
0.0
14
0.0
10
0.0
10
--
--
13
Santa
Cla
rita
Vall
ey
090
58
45
0
0
2
0.8
--
--
--
--
--
--
--
--
--
--
--
58
6.1
OR
AN
GE
CO
UN
TY
16
Nort
h O
ran
ge
Co
un
ty
3177
--
--
--
--
--
--
--
--
--
--
--
--
--
--
--
--
--
--
17
Cen
tral
Ora
nge
Co
unty
3
176
60
53
0
2
(3%
) 2
4.8
3
52
3
9.2
2
8.1
2
(0.6
%)
11
.0
--
--
--
--
--
--
60
6.5
18
Nort
h C
oas
tal
Ora
nge
Co
unty
3
195
--
--
--
--
--
--
--
--
--
--
--
--
--
--
--
--
--
--
19
Sad
dle
bac
k V
all
ey
3
812
61
48
0
0
1
9.2
1
10
3
3.4
2
8.8
0
8
.6
--
--
--
--
--
--
61
4.8
RIV
ER
SID
E C
OU
NT
Y
22
Norc
o/C
oro
na
4155
59
60
0
2
(3%
) 2
7.6
--
--
--
--
--
--
--
--
--
--
--
56
5.1
23
Met
rop
oli
tan R
ivers
ide
Co
unty
1
4144
112
82
0
1
4(1
3%
) 3
3.7
3
52
6
0.8
3
1.0
4
(1.1
%)
13
.6
60
10
7
62.7
0.0
07
0.0
07
0.0
07
119
5.1
23
Met
rop
oli
tan R
ivers
ide
Co
unty
2
4146
--
--
--
--
--
1
12
5
1.6
2
8.0
2
(1.8
%)
11
.8
59
83
43.8
0.0
07
0.0
06
0.0
06
--
--
23
Mir
a L
om
a
4165
59
79
0
2
5(4
2%
) 4
1.3
3
43
5
6.3
3
6.6
8
(3%
) 1
5.3
--
--
--
--
--
--
58
5.4
24
Per
ris
Vall
ey
4
149
60
65
0
3
(5%
) 2
9.2
--
--
--
--
--
--
--
--
--
--
--
58
4.4
25
Lak
e E
lsin
ore
4
158
--
--
--
--
--
--
--
--
--
--
--
--
--
--
--
--
--
--
26
Tem
ecu
la
4031
--
--
--
--
--
--
--
--
--
--
--
--
--
--
--
--
--
--
29
Ban
nin
g A
irp
ort
4
164
59
51
0
1
(2%
) 1
9.3
--
--
--
--
--
--
--
--
--
--
--
59
4.4
30
Coac
hell
a V
all
ey 1
**
4
137
61 g
) 42
g)
0 g
) 0
g)
18
.5 g
) 1
14
2
6.3
1
2.5
0
6
.1
--
--
--
--
--
--
61
4.4
30
Coac
hell
a V
all
ey 2
**
4
157
119 g
) 106
g)
0 g
) 3
(3%
) g)
28
.5 g
) 1
11
3
5.4
1
5.6
0
7
.2
--
--
--
--
--
--
110
5.7
SA
N B
ER
NA
RD
INO
CO
UN
TY
32
Nort
hw
est
San B
ernar
din
o V
all
ey
5175
--
--
--
--
--
--
--
--
--
--
58
94
47.2
0.0
09
0.0
08
0.0
07
--
--
33
So
uth
wes
t S
an B
ernar
din
o V
all
ey
5817
60
70
0
3
(5%
) 3
0.8
1
18
5
2.9
3
5.3
2
(1.7
%)
13
.2
--
--
--
--
--
--
60
5.5
34
Cen
tral
San B
ern
ard
ino
Vall
ey 1
5
197
60
84
0
4
(7%
) 3
1.8
1
09
6
0.1
2
8.2
2
(1.8
%)
12
.6
54
13
1
64.7
--
--
--
59
6.0
34
Cen
tral
San B
ern
ard
ino
Vall
ey 2
5
203
58
56
0
3
(5%
) 3
1.5
1
01
6
5.0
3
2.5
2
(2%
) 1
2.2
61
97
51.4
0.0
08
0.0
07
0.0
07
59
5.5
35
Eas
t S
an B
ernard
ino
Val
ley
5
204
58
71
0
2
(3%
) 2
4.9
--
--
--
--
--
--
--
--
--
--
--
57
4.9
37
Cen
tral
San B
ern
ard
ino
Mo
unta
ins
5181
59
43
0
0
1
9.0
--
--
--
--
--
--
--
--
--
--
--
57
4.0
38
Eas
t S
an B
ernard
ino
Mo
un
tain
s 5
818
--
--
--
--
--
5
5
30
.7
30
.6
0
8.5
--
--
--
--
--
--
--
--
D
IST
RIC
T
MA
XIM
UM
106
0
2
5
41
.3
6
5.0
3
6.6
8
1
5.3
15
5
72.5
0.0
14
0.0
11
0.0
11
8.0
S
OU
TH
CO
AS
T A
IR B
AS
IN
84
g)
0
35
4
1.3
65
.0
36
.6
17
1
5.3
15
5
72.5
0.0
14
0.0
11
0.0
11
8.0
** S
alt
on S
ea A
ir B
asin
µ
g/m
3 -
Mic
rog
ram
s p
er c
ub
ic m
eter
of
air
A
AM
= A
nn
ual
Ari
thm
etic
Mea
n
-- -
Po
lluta
nt
not
mo
nit
ore
d
d)
- F
eder
al
Refe
rence
Met
ho
d (
FR
M)
PM
10 s
am
ple
s w
ere
coll
ecte
d e
ver
y 6
days
at a
ll s
ites
exce
pt
for
Sta
tio
ns
41
44
and
41
57
, w
here
sam
ple
s w
ere
coll
ecte
d e
ver
y 3
days.
P
M10 s
tati
stic
s li
sted
ab
ove
are
for
the
FR
M d
ata
only
. F
eder
al
Eq
uiv
ale
nt
Met
ho
d (
FE
M)
PM
10
co
nti
nuo
us
mo
nit
ori
ng i
nst
rum
ents
wer
e op
erat
ed a
t so
me
of
the
abo
ve
loca
tio
ns.
M
ax 2
4-h
ou
r aver
age
PM
10
at
site
s w
ith F
EM
mo
nit
ori
ng w
as 1
52 µ
g/m
3,
at M
ira
Lo
ma
(155 µ
g/m
3 i
s nee
ded
to e
xce
ed t
he
PM
10 s
tandard
).
e) -
Fed
era
l an
nu
al
PM
10
sta
nd
ard (
AA
M >
50 µ
g/m
3)
was
rev
oked
in 2
006
. S
tate
sta
nd
ard
is
ann
ual
aver
age
(AA
M)
> 2
0 µ
g/m
3.
f) -
PM
2.5
sam
ple
s w
ere
coll
ecte
d e
ver
y 3
day
s at
all
sit
es e
xce
pt
for
stat
ion n
um
ber
s 0
69
, 0
72
, 0
77
, 0
87
, 3
17
6,
41
44
and
41
65
, w
here
sam
ple
s w
ere
tak
en d
ail
y,
and
sta
tio
n n
um
ber
5818 w
her
e sa
mp
les
wer
e ta
ken e
ver
y 6
days.
P
M2.5
sta
tist
ics
lis
ted a
bo
ve
are
for
the
FR
M d
ata
only
. F
EM
PM
2.5
conti
nuo
us
mo
nit
ori
ng i
nst
rum
ents
wer
e op
erat
ed a
t so
me
of
the
abo
ve
loca
tio
ns.
M
ax 2
4-h
our
aver
age
PM
2.5
co
nce
ntr
atio
n r
eco
rded
at
FE
M s
ites
was
73.1
µg/m
3,
at M
ira
Lo
ma.
Fed
eral
an
nual
PM
2.5
sta
nd
ard i
s an
nual
aver
age
(AA
M)
> 1
5.0
µg/m
3.
Sta
te s
tand
ard
is
ann
ual
avera
ge
(AA
M)
> 1
2.0
µg/m
3.
g)
- H
igh P
M1
0 a
nd
PM
2.5
dat
a sa
mp
les
exclu
ded
in a
ccord
ance
wit
h t
he
EP
A E
xce
pti
onal
Even
t R
egu
lati
on d
ue
to t
he
spec
ial
events
(i.
e.,
hig
h w
ind
, fi
rew
ork
act
ivit
ies,
etc
.) a
re a
s fo
llo
ws:
P
M10 (
FR
M)
on A
ugust
28 a
t In
dio
(323 µ
g/m
3);
and P
M2
.5 (
FR
M)
on J
uly
5 a
t S
tati
on 0
60
(94.6
µg/m
3).
A
lso,
the
foll
ow
ing h
igh P
M1
0 F
EM
dat
a w
ere
exclu
ded
: J
uly
3 (
39
6 a
nd
34
4 µ
g/m
3)
and
Au
gust
28
(2
65
and 3
75 µ
g/m
3),
both
dat
es r
ecord
ed a
t S
tati
ons
4137 a
nd 4
157,
resp
ecti
vely
.
h)
– F
edera
l le
ad s
tand
ard
is
3-m
onth
s ro
llin
g a
ver
age
> 0
.15 µ
g/m
3;
stat
e st
andar
d i
s m
on
thly
aver
age ≥
1.5
µg/m
3.
Lea
d s
tati
stic
s li
sted
ab
ove
are
for
pop
ula
tio
n-o
riente
d s
ites
only
; st
andar
ds
wer
e not
exce
eded
at
any o
f th
ese
site
s.
Lea
d
stan
dar
ds
wer
e ex
ceed
ed a
t so
urc
e-ori
ente
d
mo
nit
ori
ng s
ites
im
med
iate
ly d
ow
nw
ind
of
stat
ionary
lea
d s
ou
rces
. M
axim
um
mo
nth
ly a
nd
3-m
onth
ro
llin
g a
vera
ges
at
sourc
e-o
riente
d s
ites
wer
e 0.5
1 µ
g/m
3 a
nd 0
.46 µ
g/m
3,
resp
ecti
vely
.
i) –
Sta
te s
ulf
ate
stan
dard
is
24
-ho
ur ≥
25 µ
g/m
3.
There
is
no
fed
eral
standar
d f
or
sulf
ate
.
Printed on
Recycled
Paper
20
11

Appendix C
CALIFORNIA EMISSIONS ESTIMATOR MODELASSUMPTIONS AND OUTPUT SHEETS
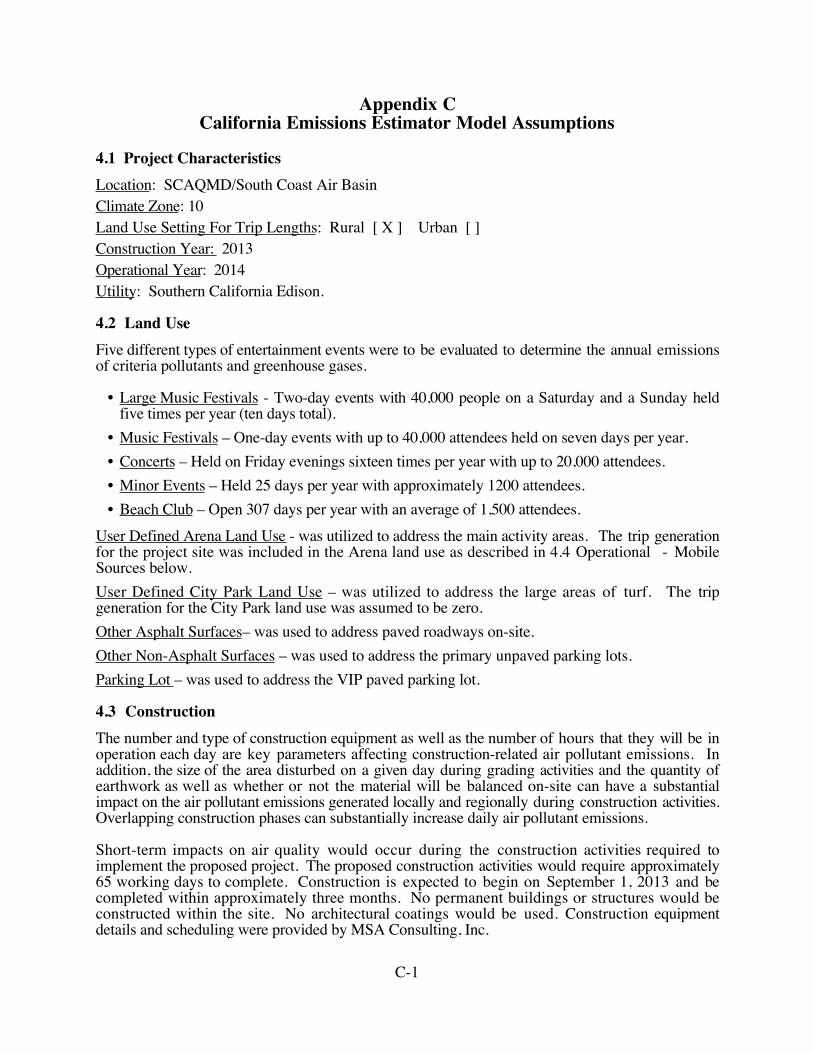
C-1
Appendix CCalifornia Emissions Estimator Model Assumptions
4.1 Project CharacteristicsLocation: SCAQMD/South Coast Air BasinClimate Zone: 10Land Use Setting For Trip Lengths: Rural [ X ] Urban [ ]Construction Year: 2013Operational Year: 2014Utility: Southern California Edison.
4.2 Land UseFive different types of entertainment events were to be evaluated to determine the annual emissionsof criteria pollutants and greenhouse gases.
• Large Music Festivals - Two-day events with 40,000 people on a Saturday and a Sunday heldfive times per year (ten days total).
• Music Festivals – One-day events with up to 40,000 attendees held on seven days per year.• Concerts – Held on Friday evenings sixteen times per year with up to 20,000 attendees.• Minor Events – Held 25 days per year with approximately 1200 attendees.• Beach Club – Open 307 days per year with an average of 1,500 attendees.
User Defined Arena Land Use - was utilized to address the main activity areas. The trip generationfor the project site was included in the Arena land use as described in 4.4 Operational - MobileSources below.User Defined City Park Land Use – was utilized to address the large areas of turf. The tripgeneration for the City Park land use was assumed to be zero.Other Asphalt Surfaces– was used to address paved roadways on-site. Other Non-Asphalt Surfaces – was used to address the primary unpaved parking lots.Parking Lot – was used to address the VIP paved parking lot.
4.3 ConstructionThe number and type of construction equipment as well as the number of hours that they will be inoperation each day are key parameters affecting construction-related air pollutant emissions. Inaddition, the size of the area disturbed on a given day during grading activities and the quantity ofearthwork as well as whether or not the material will be balanced on-site can have a substantialimpact on the air pollutant emissions generated locally and regionally during construction activities.Overlapping construction phases can substantially increase daily air pollutant emissions.
Short-term impacts on air quality would occur during the construction activities required toimplement the proposed project. The proposed construction activities would require approximately65 working days to complete. Construction is expected to begin on September 1, 2013 and becompleted within approximately three months. No permanent buildings or structures would beconstructed within the site. No architectural coatings would be used. Construction equipmentdetails and scheduling were provided by MSA Consulting, Inc.

C-2
Assumptions by Construction Phase TypeDemolition: No demolition will be required.Site Preparation: No tree or rock removal will be required.Building Construction: No permanent buildings or structures would be constructed within the site.Architectural Coating: No architectural coatings would be used.Grading: Cut and fill will be balanced on-site. The 128.1-acre general parking area would becovered by 40,000 cubic yards (89,100 tons) of decomposed granite or native stones to reducefugitive dust. A total of 4000 truck loads would be transported approximately 1.5 miles per tripresulting in 12,000 vehicle miles traveled. The total graded area would include 310 acres within thesite plus two acres for off-site roadway widening. Off-road equipment included three water trucks.Trenching Phase: This phase was added based on equipment and schedule information provided byMSA Consulting, Inc.Paving: Paving includes18 on-site acres plus two off-site acres. Paved areas include the main siteaccess roads and the VIP parking areas.Landscaping: Landscaping includes vendors that would deliver perimeter fencing, trees required forlandscaping, and hydro seed for the turf. The hydro seeding would be delivered to the site in thirtytruck loads at a rate of ten loads per day for three days resulting in 1,200 vehicle miles traveled. Aneight-foot tall chain link perimeter fence approximately 15,000 linear feet in length would beinstalled. A total of four truck loads of fencing materials would be delivered to the site at a rate ofone truckload per day for four days resulting in 160 vehicle miles traveled.
4.4 Operational - Mobile SourcesUser Defined Arena Land Use - assumed a Saturday trip-generation for a two-day music festival of59,791 two-way daily trips. Per Crain & Associates, it was assumed that 93.66% of the trips weremade by attendees with an average trip length of 75 miles per trip; 5.76% of the daily trips areemployee trips and 0.59% of the daily trips are vendor trips with an average trip length of 37 milesper trip). The trip lengths for the attendees, employees, and vendors replaced the CalEEMod non-residential commercial-customer, commercial-work, and commercial-nonwork trip lengths. The trippurpose percentages for attendees, employees, and vendors replaced the trip purpose percentagesfor non-residential commercial-customer, commercial-work, and commercial-nonwork trips.Detailed trip generation information was provided for a two-day music festival and a one-nightconcert.
Unlike the one-night concerts, the one and two-day music festivals last all day long and may includecamping. The trip generation for the one-day music festival was assumed to be one-half of the two-day festival rather than the one-night concert. Therefore, the trip generation associated with the 12music festivals was assumed to be 59,791 daily trips per 2-day event times (17/2) 2-day festivals, or508,224 daily festival trips per year.
The trip generation associated with a one-night concert is 16,534 daily two-way trips. The tripgeneration for the minor events and beach club were assumed to be similar to the one-night concert,but were proportionately adjusted by the number of attendees. There would be 810,500 attendeesannually associated with the concert, minor events, and beach club activities. This is equivalent to40.53 one-night concerts generating a total of 670,040 daily concert equivalent trips per year.

C-3
The total annual daily trip generation from the site is projected to be 1,178,264 daily trips. Thisannual trip generation rate was applied to the arena land use that included 50.7 acres of developmenton 52 Saturdays per year. The total annual daily trip generation is equivalent to 446.92 Saturdaytrips per acre.
4.5 Operational - Area SourcesHearths: No residential uses with stoves or fireplaces.Architectural Coating: No architectural coatings would be used.
4.6 Energy UseNo Title 24 energy usage because no permanent buildings or structures would be constructedwithin the site. Electricity usage for two-day large music festival is estimated at 45,600 kilowatt-hours used during a two-day (48-hour) event with up to 40,000 attendees. For a concert event,approximately 8,550 kW hours consumed during for a six-hour event with 20,000 attendees.Source: Remy Garson, Garson Entertainment Group, LLC.
4.7 Water and Wastewater Use The project will require an estimated 1,221,074 gallons per year of indoor potable water. Inaddition, the Arena was assumed to use 2,560,700 gallons per year of outdoor water use. The CityPark use requires 5,717,382 gallons per year of outdoor water use for the turf.
4.8 Solid WasteSolid waste projections include 4.36 tons per year per acre for the Arena use and 5.5 tons per yearper acre for the City Park use. These projections were based upon the 75 tons per day generated bythe Coachella Stagecoach festival that included 765,000 people days.
4.9 Vegetation and SequestrationThe project will include 100 acres of new turf that will be seeded in the landscaping phase. Inaddition, the project will plant 2,000 new trees that will continue to grow for the next 20 years.


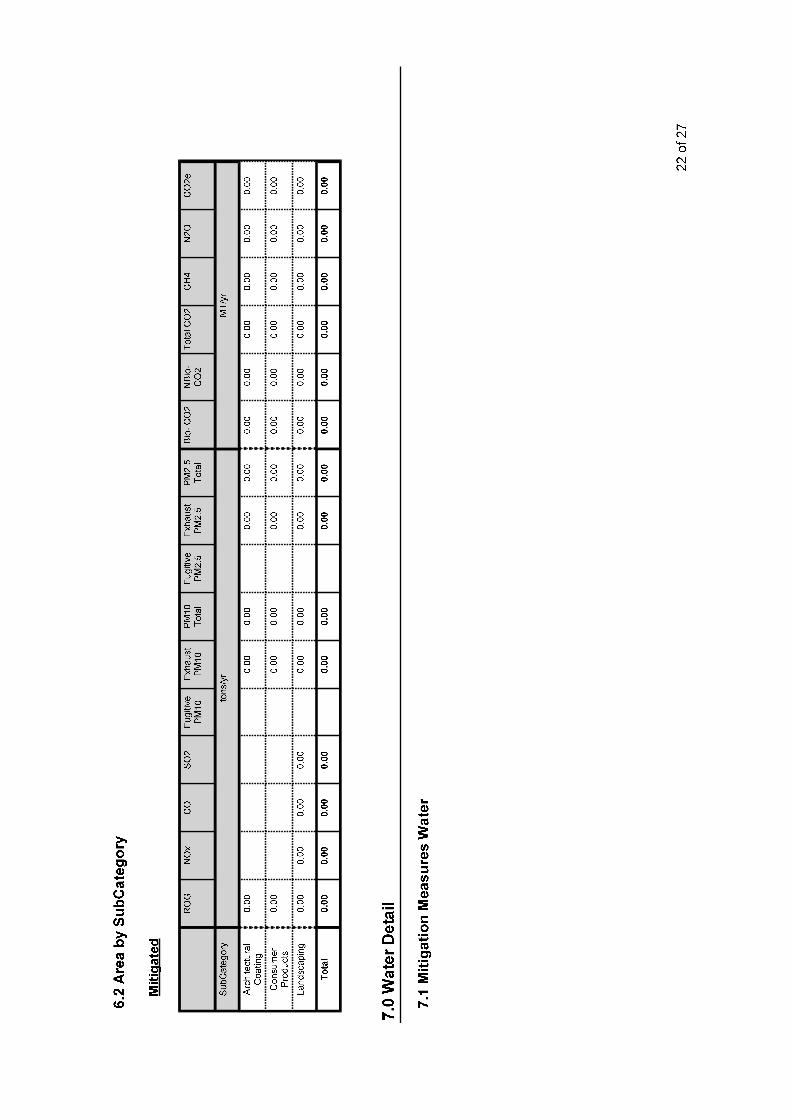


Appendix D
CALINE4 ASSUMPTIONS AND OUTPUT SHEETS

D-1
Appendix DCALINE4 ASSUMPTIONS
Traffic Data -- was taken from the Draft Traffic Impact Analysis for the ProposedMorongo Outdoor Entertainment Project (February, 2013) prepared by Crain &Associates. Traffic volumes were provided representing future conditions in the year 2014with and without the proposed project. Cumulative traffic was included in the trafficprojections and evaluated with the CALINE 4 model.
Roadway Speeds -- Average speeds for the approach and departure segments weredeveloped from Table B.13 and Table B.14 from the Transportation Project-Level CarbonMonoxide Protocol, revised December, 1997. The percent red time and traffic volume weretaken from the traffic study.
Meteorological Conditions -- included 0.5 mph winds, stability class G for one-hourvalues, a persistence factor of 0.60 for eight-hour values and wind directions determined byiterative runs of the computer model to insure that carbon monoxide concentrations aremaximized (greatest concentration for the nearest receptor).
Highway Widths -- were derived for existing roadway cross-sections. Future cross-sections were based upon the master planned classifications. The widths included 3 metersper side as specified for the CALINE 4 model input.
Receptor Placement and Height – the receptors modeled was located on the northwestcorner of the intersection. The height assumed was 1.8 meters, as specified by the EPA andCaltrans receptor height guidance presented in the Transportation Project-Level CarbonMonoxide Protocol, revised December, 1997.
Emission Factors -- were developed from EMFAC 2007 Version 2.3 using the proceduresdetailed in the Transportation Project-Level Carbon Monoxide Protocol, revisedDecember, 1997.
Background Concentrations -- for the year 2014 were taken from the AQMD websiteCEQA Air Quality Handbook CO html for CO hotspots analysis (updated March 11,2005). The background concentration, when added to the CO concentration near theintersection, yields the total CO concentration projected to occur in the vicinity.

MOE.rtsTitle : MOE Year 2013Version : Emfac2007 V2.3 Nov 1 2006Run Date : 2013/03/14 02:32:46Scen Year: 2013 -- All model years in the range 1969 to 2013 selectedSeason : AnnualArea : South Coast***************************************************************************************** Year: 2013 -- Model Years 1969 to 2013 Inclusive -- Annual Emfac2007 Emission Factors: V2.3 Nov 1 2006
South Coast Basin Average Basin Average
Table 1: Running Exhaust Emissions (grams/mile)
Pollutant Name: Total Organic Gases Temperature: 75F Relative Humidity: 40%
Speed MPH LDA LDT MDT HDT UBUS MCY ALL
3 0.334 0.487 0.790 6.112 4.239 5.050 0.725 4 0.306 0.447 0.745 6.112 4.239 5.050 0.693 5 0.281 0.411 0.704 6.112 4.239 5.050 0.663 6 0.258 0.378 0.647 5.510 3.914 4.770 0.606 7 0.238 0.349 0.597 4.947 3.619 4.514 0.554 8 0.219 0.323 0.551 4.422 3.353 4.281 0.506 9 0.203 0.299 0.510 3.935 3.111 4.067 0.462 10 0.188 0.278 0.473 3.486 2.892 3.872 0.422 15 0.133 0.197 0.333 1.790 2.056 3.120 0.272 30 0.063 0.095 0.154 0.684 0.942 2.191 0.126
Pollutant Name: Carbon Monoxide Temperature: 75F Relative Humidity: 40%
Speed MPH LDA LDT MDT HDT UBUS MCY ALL
3 3.356 5.112 7.118 17.099 29.039 25.955 5.166 4 3.261 4.955 6.943 17.099 29.039 25.955 5.046 5 3.171 4.807 6.779 17.099 29.039 25.955 4.933 6 3.085 4.666 6.458 15.836 26.529 24.976 4.739 7 3.004 4.533 6.164 14.677 24.292 24.076 4.558 8 2.926 4.407 5.894 13.611 22.295 23.249 4.390 9 2.853 4.288 5.646 12.631 20.509 22.490 4.233 10 2.783 4.175 5.417 11.730 18.910 21.792 4.087 15 2.477 3.687 4.507 8.229 13.043 19.090 3.483 30 1.859 2.734 3.071 4.241 6.036 16.396 2.486
Pollutant Name: Oxides of Nitrogen Temperature: 75F Relative Humidity: 40%
Speed MPH LDA LDT MDT HDT UBUS MCY ALL
3 0.237 0.482 0.864 17.816 27.825 1.043 1.205 4 0.230 0.466 0.847 17.816 27.825 1.043 1.194
Page 1

CALINE4: CALIFORNIA LINE SOURCE DISPERSION MODEL JUNE 1989 VERSION PAGE 1
JOB: MOE W/Proj - Apache Drive @ Seminole Roa RUN: Hour 1 (WORST CASE ANGLE) POLLUTANT: Carbon Monoxide
I. SITE VARIABLES
U= .5 M/S Z0= 100. CM ALT= 0. (M) BRG= WORST CASE VD= .0 CM/S CLAS= 7 (G) VS= .0 CM/S MIXH= 1000. M AMB= .0 PPM SIGTH= 20. DEGREES TEMP= 7.0 DEGREE (C)
II. LINK VARIABLES
LINK * LINK COORDINATES (M) * EF H W DESCRIPTION * X1 Y1 X2 Y2 * TYPE VPH (G/MI) (M) (M) ----------------*-------------------------*------------------------------ A. NTA * 313 300 315 150 * AG 563 4.9 .0 21.0 B. NWA * 300 300 450 250 * AG 293 4.9 .0 13.0 C. SD * 288 300 285 150 * AG 136 3.5 .0 21.0 D. STA * 288 300 290 450 * AG 222 4.1 .0 17.0 E. NWAE * 450 250 600 250 * AG 293 4.1 .0 10.0 F. ND * 313 300 310 450 * AG 161 4.9 .0 17.0 G. WDE * 150 250 0 250 * AG 506 2.5 .0 19.0 H. EDE * 450 287 600 287 * AG 455 4.9 .0 19.0 I. WD * 300 313 150 250 * AG 506 3.5 .0 19.0 J. WTA * 300 313 450 313 * AG 313 4.1 .0 14.0 K. WAE * 450 313 600 313 * AG 313 4.1 .0 19.0 L. ED * 300 287 450 287 * AG 455 4.9 .0 14.0 M. NAE * 315 150 315 0 * AG 563 4.1 .0 21.0 N. NDE * 310 450 310 600 * AG 161 3.5 .0 17.0 O. SAE * 290 450 290 600 * AG 222 4.1 .0 17.0 P. SDE * 285 150 285 0 * AG 136 2.5 .0 14.0
III. RECEPTOR LOCATIONS
* COORDINATES (M) RECEPTOR * X Y Z ------------*--------------------- 1. Recpt 1 * 330 330 1.8 2. Recpt 2 * 361 361 1.8 3. Recpt 3 * 391 391 1.8

�
CALINE4: CALIFORNIA LINE SOURCE DISPERSION MODEL JUNE 1989 VERSION PAGE 2
JOB: MOE W/Proj - Apache Drive @ Seminole Roa RUN: Hour 1 (WORST CASE ANGLE) POLLUTANT: Carbon Monoxide
IV. MODEL RESULTS (WORST CASE WIND ANGLE )
* * PRED * CONC/LINK * BRG * CONC * (PPM) RECEPTOR * (DEG) * (PPM) * A B C D E F G H-------------*-------*-------*---------------------------------------- 1. Recpt 1 * 191. * .3 * .1 .0 .0 .0 .0 .0 .0 .0 2. Recpt 2 * 201. * .2 * .0 .0 .0 .0 .0 .0 .0 .0 3. Recpt 3 * 205. * .2 * .0 .0 .0 .0 .0 .0 .0 .0
* CONC/LINK * (PPM) RECEPTOR * I J K L M N O P ------------*---------------------------------------- 1. Recpt 1 * .0 .0 .0 .0 .0 .0 .0 .0 2. Recpt 2 * .0 .0 .0 .0 .0 .0 .0 .0 3. Recpt 3 * .0 .0 .0 .0 .0 .0 .0 .0

CALINE4: CALIFORNIA LINE SOURCE DISPERSION MODEL JUNE 1989 VERSION PAGE 1
JOB: MOE W/Proj - Apache Drive @ Seminole Roa RUN: Hour 1 (WORST CASE ANGLE) POLLUTANT: Carbon Monoxide
I. SITE VARIABLES
U= .5 M/S Z0= 100. CM ALT= 0. (M) BRG= WORST CASE VD= .0 CM/S CLAS= 7 (G) VS= .0 CM/S MIXH= 1000. M AMB= .0 PPM SIGTH= 20. DEGREES TEMP= 7.0 DEGREE (C)
II. LINK VARIABLES
LINK * LINK COORDINATES (M) * EF H W DESCRIPTION * X1 Y1 X2 Y2 * TYPE VPH (G/MI) (M) (M) ----------------*-------------------------*------------------------------ A. NTA * 313 300 315 150 * AG 2553 4.9 .0 21.0 B. NWA * 300 300 450 250 * AG 293 4.9 .0 13.0 C. SD * 288 300 285 150 * AG 136 3.5 .0 21.0 D. STA * 288 300 290 450 * AG 222 4.1 .0 17.0 E. NWAE * 450 250 600 250 * AG 293 4.1 .0 10.0 F. ND * 313 300 310 450 * AG 2284 4.9 .0 17.0 G. WDE * 150 250 0 250 * AG 506 2.5 .0 19.0 H. EDE * 450 287 600 287 * AG 455 4.9 .0 19.0 I. WD * 300 313 150 250 * AG 506 3.5 .0 19.0 J. WTA * 300 313 450 313 * AG 313 4.1 .0 14.0 K. WAE * 450 313 600 313 * AG 313 4.1 .0 19.0 L. ED * 300 287 450 287 * AG 455 4.9 .0 14.0 M. NAE * 315 150 315 0 * AG 2553 4.1 .0 21.0 N. NDE * 310 450 310 600 * AG 2284 3.5 .0 17.0 O. SAE * 290 450 290 600 * AG 222 4.1 .0 17.0 P. SDE * 285 150 285 0 * AG 136 2.5 .0 14.0
III. RECEPTOR LOCATIONS
* COORDINATES (M) RECEPTOR * X Y Z ------------*--------------------- 1. Recpt 1 * 330 330 1.8 2. Recpt 2 * 361 361 1.8 3. Recpt 3 * 391 391 1.8

�
CALINE4: CALIFORNIA LINE SOURCE DISPERSION MODEL JUNE 1989 VERSION PAGE 2
JOB: MOE W/Proj - Apache Drive @ Seminole Roa RUN: Hour 1 (WORST CASE ANGLE) POLLUTANT: Carbon Monoxide
IV. MODEL RESULTS (WORST CASE WIND ANGLE )
* * PRED * CONC/LINK * BRG * CONC * (PPM) RECEPTOR * (DEG) * (PPM) * A B C D E F G H-------------*-------*-------*---------------------------------------- 1. Recpt 1 * 196. * .9 * .5 .0 .0 .0 .0 .1 .0 .0 2. Recpt 2 * 204. * .5 * .3 .0 .0 .0 .0 .0 .0 .0 3. Recpt 3 * 209. * .4 * .2 .0 .0 .0 .0 .0 .0 .0
* CONC/LINK * (PPM) RECEPTOR * I J K L M N O P ------------*---------------------------------------- 1. Recpt 1 * .0 .0 .0 .0 .0 .0 .0 .0 2. Recpt 2 * .0 .0 .0 .0 .0 .0 .0 .0 3. Recpt 3 * .0 .0 .0 .0 .0 .0 .0 .0