Embed Size (px)
Citation preview

Rudi Swanepoel
Tel: 011-787 3666 Morning Agricultural Market Report
Fax: 011-787 3710
www.farmwise.co.za
CME Corn Sep'12 830 1/4 -1 831 3/4
CME Corn Dec'12 834 3/4 -4 836 1 1/4
CME Corn Mar'13 833 1/4 -4 1/2 835 1 3/4
CME Corn May'13 823 1/4 -5 3/4 825 1/2 2 1/4
CME Corn July'13 807 -7 1/2 809 1/4 2 1/4
CME Corn Sep'13 692 -2 3/4 693 1/4 1 1/4
CME Corn Dec'13 653 1/2 -1 3/4 655 1 1/2
Gold 06:59 1662.9 Rand/Pound 06:55 13.037
Brent Crude 06:56 117.3 Rand/Euro 06:55 10.3072
Rand/Dollar 06:59 8.2199 Dollar/Euro 06:59 1.2538
2011/12 2011/12 2012/13 2012/13
USDA Informa USDA Informa
Aug Aug Aug Aug
91.9 91.9 96.4 96.4
84.0 84.0 87.4 85.7
147.2 147.2 123.4 131.1
1128 1128 1021 1041
12358 12358 10779 11235
25 25 75 100
13511 13511 11875 12376
4550 4500 4075 4425
6390 6420 5850 6175
5000 5000 4500 4750
10940 10920 9925 10600
1550 1550 1300 1200
12490 12470 11225 11800
1021 1041 650 576
8.2% 8.3% 5.8% 4.9%
Initial Stocks(M/Bu)
Ending Stocks
Stks/Use Ratio
Imports
LATEST SPOT PRICES
US CORN SUPPLY & DEMAND PROJECTION (M/Bu)
(M Acres)
23 August 2012
US CORN RECAP
CME CORN FUTURES
Net
Change
CME CORN FUTURES MARKET RECAP
Net
Change
Total Domestic
December Corn finished down 4 at 834 3/4, 4 3/4 off the high and 6 1/2 up from the low. March Corn closed down 4 1/2 at 833 1/4. This was 5
3/4 up from the low and 5 1/4 off the high. December corn closed slightly lower on the day and well off session lows. Traders continue to
monitor yield and condition reports as a large crop tour moves across the Corn Belt today. Early yield reports have been worse than expected,
which has traders questioning if the US average corn yield could be near 121 bushels per acre vs. the current USDA estimate of 123.4. If
achieved, production could fall to an 8 year low which would mean further demand cuts across the balance sheet. Ethanol production for the
week ending August 17 averaged 823,000 barrels per day which is down 8.96% from last year. Total Ethanol production for the week was 5.76
million barrels vs. 5.73 the week prior. Corn used in last week's production is estimated at 87.67 million bushels which was the 4th
consecutive week corn usage has increased. News that Argentina grain and vegetable oil exports have been halted for 3 days due to a strike
offered support to the grain complex. The US Dollar traded slightly higher midday but the gains were erased after the FOMC minutes suggested that further monetary easing may be needed to jump start the US economy. The US Dollar turned lower for the remainder of the session and corn climbed off it's session lows.
Overnight
Market
Last
Main Board
Close
Future
Month
Commodity
Planting Acres
CME DEC'12 CORN - WEEKLY SNAPSHOT
Harvested Acres
Total Usage
Exports
Yield (Bu / Acre)
Food/Seed & Industry
Total Supply
Production FUNDAMENTAL CHARTS
Ethanol
Feed/Residual
Weekly QCZ2 2010/06/27 - 2012/10/07 (CHG)
Cndl, QCZ2, Last Trade
SMA, QCZ2, Last Trade(Last), 13
SMA, QCZ2, Last Trade(Last), 21
Price
USc
Bsh
1/8
480
510
540
570
600
630
660
690
720
750
780
810
840
870
Jul Aug Sep Oct Nov Dec Jan Feb Mar Apr May Jun Jul Aug Sep Oct Nov Dec Jan Feb Mar Apr May Jun Jul Aug Sep Oct
Q3 2010 Q4 2010 Q1 2011 Q2 2011 Q3 2011 Q4 2011 Q1 2012 Q2 2012 Q3 2012

Sep'12 Dec'12 Mar'13 May'13 Jul'13 Sep'13
SAFEX WMAZ Aug'12 2737 12 0.00 -R 10 3408 3460 3492 3483 3452 3078
SAFEX WMAZ Sep'12 2753 13 28.50 -R 10 3434 3493 3527 3517 3489 3111
SAFEX WMAZ Dec'12 2825 16 26.50 -R 10 R -26 R -33 R -34 R -34 R -36 R -33
SAFEX WMAZ Mar'13 2812 12 26.50 -R 10 668 676 730 1008 1062 n/a
SAFEX WMAZ May'13 2490 0 0.00 -R 10
SAFEX WMAZ Jul'13 2395 10 30.50 -R 10
Sep'12 Dec'12 Mar'13 May'13 Jul'13 Sep'13
SAFEX YMAZ Aug'12 2730 8 0.00 -R 10 3728 3780 3812 3803 3772 3398
SAFEX YMAZ Sep'12 2740 1 25.50 -R 10 3754 3813 3847 3837 3809 3431
SAFEX YMAZ Dec'12 2784 8 25.00 -R 10 R -26 R -33 R -34 R -34 R -36 R -33
SAFEX YMAZ Mar'13 2762 4 26.00 -R 10 988 996 1050 1328 1382 n/a
SAFEX YMAZ May'13 2475 15 26.00 -R 10
SAFEX YMAZ Jul'13 2390 0 27.00 -R 10
Sep'12 Dec'12 Mar'13 May'13 Jul'13 Sep'13
2524 2573 2601 2591 2559 2190
2548 2603 2633 2622 2592 2219
R -23 R -30 R -31 R -31 R -33 R -30
216 211 161 -116 -169 n/a
Africa Overseas
WMAZ 117 377 429 375 546 752 WMAZ 5 537 231 6 193 425
YMAZ 36 582 2 002 38 584 YMAZ 3 881 384 4 644 378
Total 153 959 431 377 585 336 Total 9 418 615 10 837 804
YMAZ Export Parity Randfontein
SAFEX Below Randfontein
R/ton (Current 07:00am)
Today's
Opening
Call
US No.3 YMAZ Import Parity FOR Durban Harbour
Indicative Import and Export Parity Prices - USA No.3 Yellow Maize Gulf
SAFEX WMAZ FUTURES (Previous Close)
Parity Change Up/Down
South African Maize Recap
Main Board
Close Month
Future
Month
Commodity
Parity Change Up/Down
SAFEX Above Export Parity
R/ton (Previous 12:00pm)
SAFEX Below Durban Harbour
Month
SAFEX YMAZ FUTURES (Previous Close)
R/ton (Current 07:00am)
R/ton (Current 07:00am)
R/ton (Previous 12:00pm)
Option
Volatility
(%)
Net
Change
MAIZE EXPORTS - Progressive 2012/13 Season
Exported from
RSA:
Latest SAGIS Figures
RSA MAIZE SUPPLY & DEMAND PROJECTION ('000 tons)
US No.3 YMAZ Import Parity - Delivered - Durban to Randfontein
R/ton (Previous 12:00pm)
Month
Parity Change Up/Down
PARITY GRAPH www.grainsa.co.za
WEEKLY PRODUCER DELIVERIES ('000) (1May'12 - 30Apr'13)Outstanding
(excluding
Retentions)
Plus Early
DeliveriesLess CECTotalCommodity
Destined forTotal
CME Soybeans Sep'12 1748 -5 1/2 1756 3/4 8 3/4
CME Soybeans Nov'12 1727 3/4 -4 3/4 1735 1/2 7 3/4
CME Soybeans Jan'13 1715 -5 1/2 1722 3/4 7 3/4
CME Soybeans Mar'13 1623 1/4 0 1631 1/4 8
CME Soybeans May'13 1532 3 1/4 1546 1/2 14 1/2
CME Soybeans Jul'13 1508 4 1/4 1520 12
CME Soy Meal Aug'12 0.00 0.00 0.00 0.00
CME Soy Meal Sep'12 535.70 -7.90 536.80 1.10
CME Soy Meal Oct'12 526.90 -5.60 529.00 2.10
CME Soy Meal Dec'12 519.70 -4.80 522.40 2.70
CME Soy Meal Jan'13 509.80 -4.40 513.40 3.60
CME Soy Meal Mar'13 474.80 -3.00 480.60 5.80
CME Soybean Oil Aug'12 0.00 0.00 0.00 0.00
CME Soybean Oil Sep'12 56.17 0.60 56.09 -0.08
CME Soybean Oil Oct'12 56.39 0.62 56.27 -0.12
CME Soybean Oil Dec'12 56.83 0.61 56.71 -0.12
CME Soybean Oil Jan'13 57.05 0.59 56.94 -0.11
CME Soybean Oil Mar'13 57.07 0.59 56.88 -0.19
2011/12 2011/12 2012/13 2012/13
USDA Informa USDA Informa
Aug Aug Aug Aug
75 75 76.1 76.1
73.6 73.6 74.6 74.6
41.5 41.5 36.1 37.4
215 215 145 138
3056 3056 2692 2790
15 10 20 25
3286 3281 2857 2953
1690 1705 1515 1575
1350 1370 1110 1250
101 68 116 119
3141 3143 2742 2944
145 138 115 8
4.6% 4.4% 4.2% 0.3%
US SOY RECAP
Net
Change
Overnight
Market
Last
Production
Initial Stocks(M/Bu)
Net
Change
(M Acres)
FUNDAMENTAL CHARTS
Main Board
Close
Planting Acres
CME SOYBEAN FUTURES
CME NOV'12 SOYBEAN - WEEKLY SNAPSHOT
Future
Month
US SOYBEAN SUPPLY & DEMAND PROJECTION
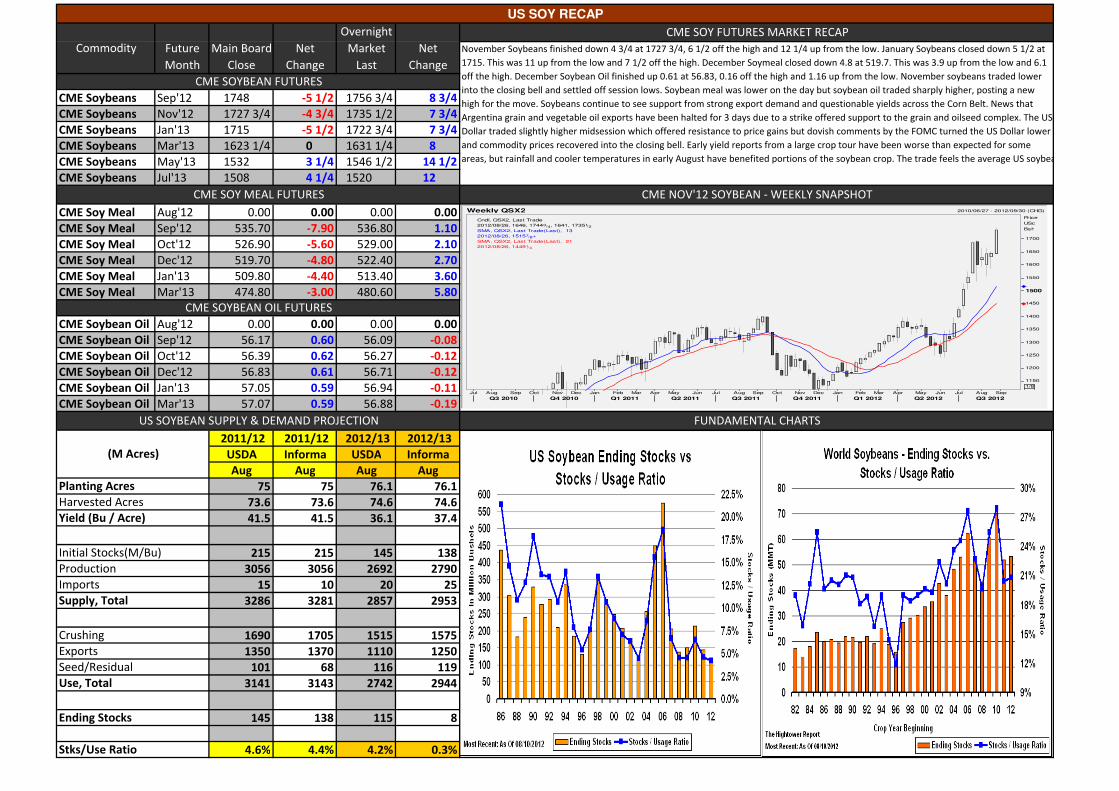
Commodity November Soybeans finished down 4 3/4 at 1727 3/4, 6 1/2 off the high and 12 1/4 up from the low. January Soybeans closed down 5 1/2 at
1715. This was 11 up from the low and 7 1/2 off the high. December Soymeal closed down 4.8 at 519.7. This was 3.9 up from the low and 6.1
off the high. December Soybean Oil finished up 0.61 at 56.83, 0.16 off the high and 1.16 up from the low. November soybeans traded lower
into the closing bell and settled off session lows. Soybean meal was lower on the day but soybean oil traded sharply higher, posting a new
high for the move. Soybeans continue to see support from strong export demand and questionable yields across the Corn Belt. News that
Argentina grain and vegetable oil exports have been halted for 3 days due to a strike offered support to the grain and oilseed complex. The US
Dollar traded slightly higher midsession which offered resistance to price gains but dovish comments by the FOMC turned the US Dollar lower
and commodity prices recovered into the closing bell. Early yield reports from a large crop tour have been worse than expected for some
areas, but rainfall and cooler temperatures in early August have benefited portions of the soybean crop. The trade feels the average US soybean yield could be near 36.5 bushels per acre vs. the August USDA estimate of 36.1.
CME SOY MEAL FUTURES
CME SOY FUTURES MARKET RECAP
CME SOYBEAN OIL FUTURES
Harvested Acres
Crushing
Yield (Bu / Acre)
Imports
Supply, Total
Exports
Use, Total
Ending Stocks
Seed/Residual
Stks/Use Ratio
Weekly QSX2 2010/06/27 - 2012/09/30 (CHG)
Cndl, QSX2, Last Trade
2012/08/26, 1646, 17443/4, 1641, 17351/2
SMA, QSX2, Last Trade(Last), 13
2012/08/26, 15157/8+
SMA, QSX2, Last Trade(Last), 21
2012/08/26, 14491/4
Price
USc
Bsh
1/8
1150
1200
1250
1300
1350
1400
1450
1500
1550
1600
1650
1700
Jul Aug Sep Oct Nov Dec Jan Feb Mar Apr May Jun Jul Aug Sep Oct Nov Dec Jan Feb Mar Apr May Jun Jul Aug Sep
Q3 2010 Q4 2010 Q1 2011 Q2 2011 Q3 2011 Q4 2011 Q1 2012 Q2 2012 Q3 2012

Sep'12 Nov'12 Jan'13 Mar'13 May'13 Jul'13
SAFEX SUNS Aug'12 5705 90 0.00 R 0 6511 6486 6491 6229 5978 5937
SAFEX SUNS Sep'12 5710 86 26.00 R 0 6543 6511 6519 6240 5961 5917
SAFEX SUNS Dec'12 5886 89 26.00 R 0 -32 -25 -28 -11 16 19
SAFEX SUNS Mar'13 5750 76 0.00 R 0 666 591 616 744 1088 n/a
SAFEX SOYA Aug'12 5820 25 0.00 R 0
SAFEX SOYA Sep'12 5845 93 16.00 R 0 Sep'12 Nov'12 Jan'13 Mar'13 May'13 Jul'13
SAFEX SOYA Dec'12 5885 105 22.00 R 0 6831 6806 6811 6549 6298 6257
SAFEX SOYA Mar'13 5485 75 22.50 R 0 6863 6831 6839 6560 6281 6237
-32 -25 -28 -11 16 19
986 911 936 1064 1408 n/a
SOYA 597 200 655 700 0 58 500 Sep'12 Nov'12 Jan'13 Mar'13 May'13 Jul'13
SUNS 480 000 527 110 0 47 110 5357 5332 5334 5094 4862 4823
5383 5351 5357 5101 4845 4802
-26 -20 -22 -7 18 20
488 543 561 391 28 n/a
Commodity
Parity Change Up/Down
R/ton (Previous 12:00pm)
Indicative Import and Export Parity Prices - USA SOYBEANS
Future
Month Month
Net
Change
USA SOYBEANS Import Parity FOR Durban HarbourMain Board
Close
Parity Change Up/Down
SAFEX SOYA FUTURES (Previous Close)
SAFEX Below Durban Harbour
USA SOYBEANS Import Parity - Delivered - Durban to Randfontein
Month
Today's
Opening
Call
SAFEX SUNFLOWER FUTURES (Previous Close)
Option
Volatility
(%)
South African Soy and Sunflower Recap
RSA SOYA AND SUNFLOWER SUPPLY & DEMAND PROJECTION
SAFEX Above Export Parity
Out-
standing
R/ton (Previous 12:00pm)
R/ton (Current 07:00am)
Month
Parity Change Up/Down
PARITY GRAPH www.grainsa.co.za
Commodity
R/ton (Previous 12:00pm)
SAFEX Below Randfontein
R/ton (Current 07:00am)
Latest SAGIS - MONTHLY PRODUCER DELIVERIES
PROG. JAN 2012 - DEC 2012 (tons)
RetentionsFarm
Deliveries
SOYBEANS Export Parity Durban HarbourLess CEC
R/ton (Current 07:00am)

CME Wheat Sep'12 896 1/2 -4 894 -2 1/2
CME Wheat Dec'12 917 -5 914 -3
CME Wheat Mar'13 925 1/4 -4 3/4 922 -3 1/4
CME Wheat May'13 915 1/2 1/4 915 1/2 0
CME Wheat July'13 861 3/4 3/4 860 -1 3/4
CME Wheat Sep'13 860 1/4 -1 1/4 0 0
KCBT Wheat Sep'12 905 1/4 -3 902 1/4 -3
KCBT Wheat Dec'12 930 -2 1/2 927 1/2 -2 1/2
KCBT Wheat Mar'13 938 3/4 -2 3/4 938 3/4
KCBT Wheat May'13 934 3/4 -1 3/4 934 3/4 -1 3/4
KCBT Wheat July'13 877 1/4 -3 3/4 877 - 1/4
KCBT Wheat Sep'13 877 1/4 -5 3/4 877 1/4 -5 3/4
2011/12 2011/12 2012/13 2012/13
USDA Informa USDA Informa
Aug Aug Aug Aug
54.40 54.40 56.00 56.00
45.70 45.70 48.80 48.80
43.70 43.70 46.50 46.50
862 862 743 743
1999 1999 2268 2268
112 113 130 125
2974 2975 3141 3136
941 940 950 945
77 76 73 76
163 167 220 250
1181 1182 1243 1271
1050 1050 1200 1250
2231 2232 2443 2521
743 743 698 615
33.3% 33.3% 28.6% 24.4%
Net
Change
US WHEAT RECAP
Commodity Net
Change
Overnight
Market
Last
December Wheat finished down 5 at 917, 4 1/4 off the high and 5 3/4 up from the low. March Wheat closed down 4 3/4 at 925 1/4. This was 5
1/4 up from the low and 3 3/4 off the high. December Chicago Wheat closed slightly lower on the day. Kansas City and Minneapolis wheat
settled lower as well. Wheat found support on reports that the European Union soft wheat crop may produce 125 million tonnes for 2012/13
which is down 3% from 2011 but traders took profits early in the day on reports that hard red winter wheat areas are expected to see good
rainfall in the next 7-10 days. The rainfall is expected to help topsoil conditions as farmers begin to plant next year's wheat crop. Farmers in
Argentina will plant 3.6 million hectares of wheat for the 2012/13 marketing year. This was unchanged from a July estimate. Argentina wheat
plantings have declined year over year due to better prices for other cash crops and frustration with the Argentina government wheat export
quota system. The US Dollar traded slightly higher midday but the gains were erased after the FOMC minutes suggested that further monetary
easing may be needed to jump start the US economy. The US Dollar turned lower for the remainder of the session and wheat climbed off it's session lows. December Oats closed down 1 1/2 at 395 1/2. This was 4 1/4 up from the low and 2 1/2 off the high.
CME WHEAT FUTURES MARKET RECAP
KCBT WHEAT FUTURES
Total Supply
CME NOV'12 WHEAT - WEEKLY SNAPSHOT
FUNDAMENTAL CHARTS
US WHEAT SUPPLY & DEMAND PROJECTION (M/Bu)
Yield (Bu / Acre)
Planting Acres
Imports
Production
CME WHEAT FUTURES
Main Board
Close
Future
Month
Initial Stocks(M/Bu)
(M Acres)
Harvested Acres
Exports
Total Domestic
Feed/Residual
Seed
Food
Stks/Use Ratio
Total Usage
Ending Stocks
Weekly QZWZ2 2010/07/11 - 2012/10/05 (CHG)
Cndl, QZWZ2, Last Trade
SMA, QZWZ2, Last Trade(Last), 13
SMA, QZWZ2, Last Trade(Last), 21
Price
USc
Bsh
1/8
660
680
700
720
740
760
780
800
820
840
860
880
900
920
940
Aug Sep Oct Nov Dec Jan Feb Mar Apr May Jun Jul Aug Sep Oct Nov Dec Jan Feb Mar Apr May Jun Jul Aug Sep
Q3 2010 Q4 2010 Q1 2011 Q2 2011 Q3 2011 Q4 2011 Q1 2012 Q2 2012 Q3 2012

Sep'12 Dec'12 Mar'13 May'13 Jul'13 Sep'13
SAFEX Wheat Aug'12 3502 13 0.00 -R 20 3569 3685 3756 3771 3614 3639
SAFEX Wheat Sep'12 3511 12 26.50 -R 20 3597 3712 3774 3778 3650 3675
SAFEX Wheat Dec'12 3529 24 23.00 -R 20 -28 -27 -18 -7 -37 -36
SAFEX Wheat Mar'13 3590 21 24.00 -R 20 58 156 166 n/a n/a n/a
Sep'12 Dec'12 Mar'13 May'13 Jul'13 Sep'13
3889 4005 4076 4091 3934 3959
3917 4032 4094 4098 3970 3995
RSA Africa Overseas -28 -27 -18 -7 -37 -36
Overseas 1443074 1411512 31562 0 378 476 486 n/a n/a n/a
Africa Overseas
Overseas 31454 31454 0 Sep'12 Dec'12 Mar'13 May'13 Jul'13 Sep'13
RSA 227010 227010 0 2286 2385 2445 2457 2315 2335
2308 2406 2458 2459 2344 2364
-22 -21 -13 -3 -29 -29
1225 1144 1145 n/a n/a n/a
South African Wheat Recap
Option
Volatility
(%)
Commodity Net
Change
Parity Change Up/Down
Future
Month
R/ton (Previous 12:00pm)
Month
Today's
Opening
Call
R/ton (Current 07:00am)
Indicative Import and Export Parity Prices - USA HRW No.2 Wheat
USA HRW No.2 Wheat Import Parity FOR Durban Harbour
SAFEX WHEAT FUTURES (Previous Close)
Main Board
Close
Imported from:
SAFEX Below Durban Harbour
USA HRW No.2 Wheat Import Parity - Delivered - Durban to Randfontein
Latest SAGIS WHEAT IMPORTS / EXPORTS ('11/'12)
Destined for:
Month
Parity Change Up/DownTotal Tons
Destined for:
RSA WHEAT SUPPLY & DEMAND PROJECTION PARITY GRAPH www.grainsa.co.za
Total TonsExported from:
R/ton (Current 07:00am)
Wheat Export Parity Randfontein
Month
SAFEX Above Export Parity
R/ton (Current 07:00am)
R/ton (Previous 12:00pm)
SAFEX Below Randfontein
R/ton (Previous 12:00pm)
Parity Change Up/Down

Daily Precipitation Forecast -
Daily Precipitation Forecast -
25-Aug-12
24-Aug-12
Weather Forecasts : Africa
2 Weekly Precipitation Forecast
Daily Precipitation Forecast - IRI Seasonal Climate Forecasts 26-Aug-12

US Crop Moisture Index
Weather Forecasts : North America
Current US Surface Analysis2 Weekly Precipitation Forecast
North America Accumalated Weekly Precipitation Palmer Drought Index

SAFEX DEC'12 WMAZ - DAILY
TECHNICAL GRAPH OUTLOOK
RSI, QMAWZ2
2012/08/22, 63.017 Value
ZAR
T
.123
Cndl, QMAWZ2
2012/08/22, 2,818.00, 2,834.00, 2,818.00, 2,825.00
2MA, QMAWZ2
2012/08/22, 2,788.69, 2,796.24
Price
ZAR
T
.12
2,200
2,300
2,400
2,500
2,600
2,700
2,800
StochS, QMAWZ2
2012/08/22, 55.551, 42.969
StochS, QMAWZ2
2012/08/22, 44.735, 37.523
Value
ZAR
T
.12312 19 26 02 10 16 23 30 07 14 21 28 04 11 18 25 02 09 16 23 30 06 13 20 27
March 2012 April 2012 May 2012 June 2012 July 2012 August 2012

SAFEX DEC'12 YMAZ - DAILY
TECHNICAL GRAPH OUTLOOK
RSI, QMAYZ2
2012/08/22, 60.698 Value
ZAR
T
.123
Cndl, QMAYZ2
2012/08/22, 2,794.00, 2,801.00, 2,781.20, 2,784.00
2MA, QMAYZ2
2012/08/22, 2,762.54, 2,766.00
Price
ZAR
T
.12
2,200
2,300
2,400
2,500
2,600
2,700
2,800
StochS, QMAYZ2
2012/08/22, 55.031, 48.692
StochS, QMAYZ2
2012/08/22, 48.391, 43.599
Value
ZAR
T
.123
12 19 26 02 10 16 23 30 07 14 21 28 04 11 18 25 02 09 16 23 30 06 13 20 27
March 2012 April 2012 May 2012 June 2012 July 2012 August 2012

TECHNICAL GRAPH OUTLOOK
SAFEX DEC'12 WMAZ vs. CORN DEC'12 (Corn Split) - Daily
Spread, QCORZ2
2012/08/22, -60.00
SMA, Spread(QCORZ2, QMAWZ2)
2012/08/22, -97.60
SMA, Spread(QCORZ2, QMAWZ2)
2012/08/22, -137.00
Value
ZAR
T
.12
-520
-480
-440
-400
-360
-320
-280
-240
-200
-160
-120
-80
09 16 23 30 06 13 20 27 05 12 19 26 02 10 16 23 30 07 14 21 28 04 11 18 25 02 09 16 23 30 06 13 20 27 03
Jan 12 Feb 12 Mar 12 Apr 12 May 12 Jun 12 Jul 12 Aug 12

CME DEC'12 CORN - DAILY
TECHNICAL GRAPH OUTLOOK
RSI, QCZ2
2012/08/23, 69.906 Value
USc
Bsh
.123
Cndl, QCZ2
2012/08/23, 834, 8383/4, 8323/4, 8361/2
2MA, QCZ2
2012/08/23, 8141/8+, 8085/8+
Price
USc
Bsh
1/8
570
600
630
660
690
720
750
780
810
StochS, QCZ2
2012/08/23, 80.423, 71.697
StochS, QCZ2
2012/08/23, 68.008, 49.907
Value
USc
Bsh
.12319 26 02 09 16 23 30 07 14 21 29 04 11 18 25 02 09 16 23 30 06 13 20 27
March 2012 April 2012 May 2012 June 2012 July 2012 August 2012
TECHNICAL GRAPH OUTLOOK
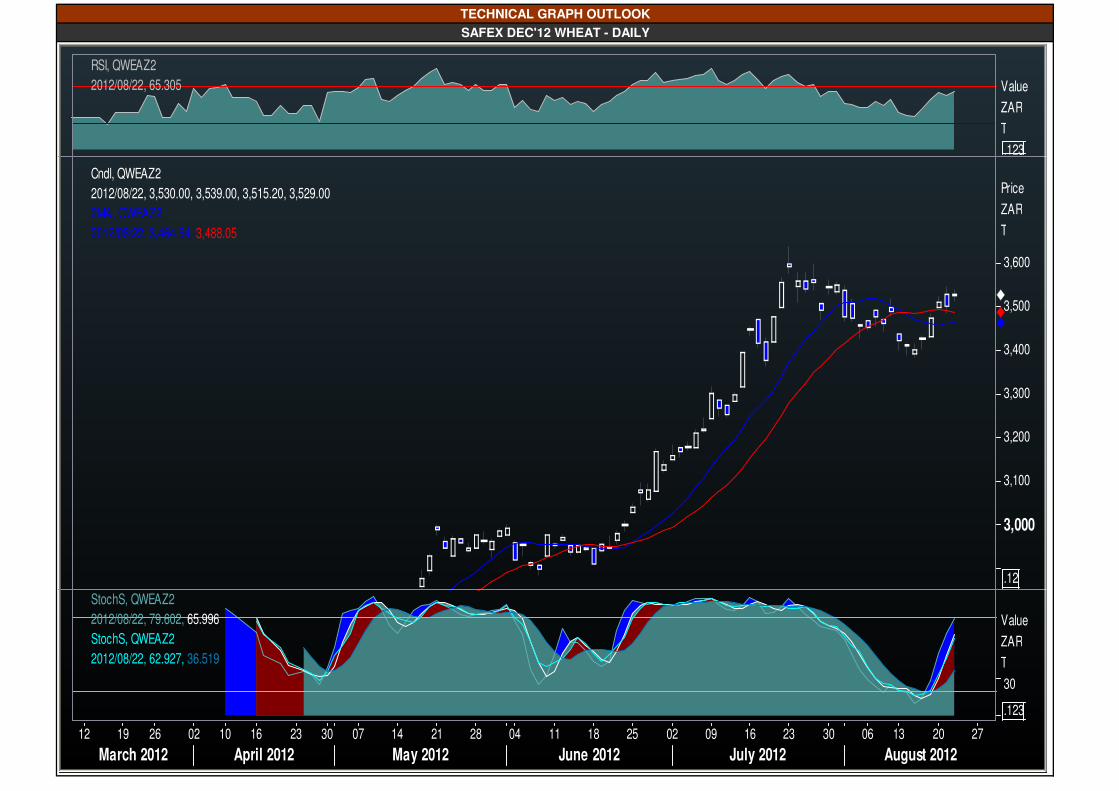
SAFEX DEC'12 WHEAT - DAILY
RSI, QWEAZ2
2012/08/22, 65.305 Value
ZAR
T
.123
Cndl, QWEAZ2
2012/08/22, 3,530.00, 3,539.00, 3,515.20, 3,529.00
2MA, QWEAZ2
2012/08/22, 3,464.54, 3,488.05
Price
ZAR
T
.12
3,000
3,100
3,200
3,300
3,400
3,500
3,600
StochS, QWEAZ2
2012/08/22, 79.602, 65.996
StochS, QWEAZ2
2012/08/22, 62.927, 36.519
Value
ZAR
T
.123
30
12 19 26 02 10 16 23 30 07 14 21 28 04 11 18 25 02 09 16 23 30 06 13 20 27
March 2012 April 2012 May 2012 June 2012 July 2012 August 2012

TECHNICAL GRAPH OUTLOOK
CME DEC'12 WHEAT - DAILY
RSI, QZWZ2
2012/08/23, 59.402 Value
USc
Bsh
.123
Cndl, QZWZ2
2012/08/23, 9163/4, 917, 9141/2, 9151/4
2MA, QZWZ2
2012/08/23, 8981/4+, 8997/8+
Price
USc
Bsh
1/8
690
720
750
780
810
840
870
900
930
StochS, QZWZ2
2012/08/23, 68.933, 62.952
StochS, QZWZ2
2012/08/23, 60.113, 39.602
Value
USc
Bsh
.123
19 26 02 09 16 23 30 07 14 21 29 04 11 18 25 02 09 16 23 30 06 13 20 27
March 2012 April 2012 May 2012 June 2012 July 2012 August 2012

TECHNICAL GRAPH OUTLOOK
SAFEX SEP'12 SUNFLOWER - DAILY
RSI, QSUFU2
2012/08/22, 88.647 Value
ZAR
T
.123
Cndl, QSUFU2
2012/08/22, 5,660.00, 5,714.00, 5,660.00, 5,710.00
2MA, QSUFU2
2012/08/22, 5,420.38, 5,386.67
Price
ZAR
T
.12
4,800
4,900
5,000
5,100
5,200
5,300
5,400
5,500
5,600
5,700
StochS, QSUFU2
2012/08/22, 96.077, 95.850
StochS, QSUFU2
2012/08/22, 97.024, 96.056
Value
ZAR
T
30 07 14 21 28 04 11 18 25 02 09 16 23 30 06 13 20 27
Apr 12 May 2012 June 2012 July 2012 August 2012

TECHNICAL GRAPH OUTLOOK
SAFEX SEP'12 SOYA - DAILY
RSI, QSOYU2
2012/08/22, 84.907 Value
ZAR
T
.123
Cndl, QSOYU2
2012/08/22, 5,902.00, 5,902.00, 5,810.00, 5,845.00
2MA, QSOYU2
2012/08/22, 5,432.00, 5,444.05
Price
ZAR
T
.12
4,200
4,400
4,600
4,800
5,000
5,200
5,400
5,600
StochS, QSOYU2
2012/08/22, 97.439, 97.361
StochS, QSOYU2
2012/08/22, 95.911, 76.569
Value
ZAR
T
.12312 19 26 02 10 16 23 30 07 14 21 28 04 11 18 25 02 09 16 23 30 06 13 20 27
March 2012 April 2012 May 2012 June 2012 July 2012 August 2012

CME NOV'12 SOY - DAILY
TECHNICAL GRAPH OUTLOOK
RSI, QSX2
2012/08/23, 74.493 Value
USc
Bsh
.123
Cndl, QSX2
2012/08/23, 17291/4, 17443/4, 17281/4, 1736
2MA, QSX2
2012/08/23, 16461/2+, 16341/8+
Price
USc
Bsh
1/8
1350
1400
1450
1500
1550
1600
1650
1700
StochS, QSX2
2012/08/23, 96.971, 95.951
StochS, QSX2
2012/08/23, 94.004, 78.590
Value
USc
Bsh
.12319 26 02 09 16 23 30 07 14 21 29 04 11 18 25 02 09 16 23 30 06 13 20 27
March 2012 April 2012 May 2012 June 2012 July 2012 August 2012

TECHNICAL GRAPH OUTLOOK
CME DEC'12 SOYMEAL - DAILY
RSI, QSMZ2
2012/08/23, 70.439 Value
USD
STn
.123
2MA, QSMZ2
2012/08/23, 496.9, 492.6
Cndl, QSMZ2
2012/08/23, 519.7, 526.1, 519.5, 522.8
Price
USD
STn
.1
400
420
440
460
480
500
520
StochS, QSMZ2
2012/08/23, 90.814, 91.750
StochS, QSMZ2
2012/08/23, 90.404, 75.940
Value
USD
STn
.123
19 26 02 09 16 23 30 07 14 21 29 04 11 18 25 02 09 16 23 30 06 13 20 27
March 2012 April 2012 May 2012 June 2012 July 2012 August 2012

TECHNICAL GRAPH OUTLOOK
USD / EUR - DAILY
ZAR / USD - DAILY
RSI, QZAR=
2012/08/23, 48.927 Value
/USD
.123
2MA, QZAR=
2012/08/23, 8.1932, 8.2044
Cndl, QZAR=
2012/08/23, 8.2335, 8.2421, 8.1500, 8.2198
Price
/USD
.1234
7.6
7.7
7.8
7.9
8
8.1
8.2
8.3
8.4
8.5
8.6
StochS, QZAR=
2012/08/23, 64.653, 69.558
StochS, QZAR=
2012/08/23, 69.389, 62.531
Value
/USD
.123
30
09 16 23 30 06 13 20 27 05 12 19 26 02 09 16 23 30 07 14 21 28 04 11 18 25 02 09 16 23 30 06 13 20 27
Jan 12 Feb 12 Mar 12 Apr 12 May 12 Jun 12 Jul 12 Aug 12
RSI, QEUR=
2012/08/23, 75.205 Value
USD
.123
2MA, QEUR=
2012/08/23, 1.2374, 1.2343
Cndl, QEUR=
2012/08/23, 1.2526, 1.2553, 1.2522, 1.2539
Price
USD
.1234
1.2
1.21
1.22
1.23
1.24
1.25
1.26
1.27
1.28
1.29
1.3
StochS, QEUR=
2012/08/23, 95.324, 85.686
StochS, QEUR=
2012/08/23, 83.690, 71.547
Value
USD
.123
19 26 02 09 16 23 30 07 14 21 28 04 11 18 25 02 09 16 23 30 06 13 20 27
March 2012 April 2012 May 2012 June 2012 July 2012 August 2012

TECHNICAL GRAPH OUTLOOK
F-wise Capital (Pty) Ltd is a member of the Johannesburg Securities Exchange, and a wholly owned subsidiary of Farmwise Grains(Pty)Ltd Some text, images and any other
material contained or displayed are proprietary to F-wise Capital (Pty) Ltd or Farmwise Grains(Pty)Ltd and constitutes valuable intellectual property intended for subscribers to
services offered by F-wise Capital(Pty)Ltd or Farmwise Grains (Pty) Ltd. Any information provided in this report is for interest and educational purposes only, and does not
constitute advice. F-wise Capital (Pty)Ltd or Farmwise Grains (Pty) Ltd will not be responsible for losses incurred as a result of the opinions expressed in this report. Since one
deals in probabilities in market forecasting, the accuracy cannot be guaranteed. There is a risk of monetary loss in trading and/or investing on the financial markets. F-wise
Capital (Pty) or Farmwise Grains (Pty)Ltd does not warrant the integrity of this communication or that it is free of errors, viruses, interception or interference. For more
information about Farmwise Grains(Pty)Ltd or F-wise Capital(Pty)Ltd, visit our website at http://www.farmwise.co.za
BRENT CRUDE BFO - DAILY
RSI, QBFO-
2012/08/23, 74.867 Value
USD
Bbl
.1232MA, QBFO-
2012/08/23, 114.79, 111.86
Cndl, QBFO-
2012/08/23, 115.94, 116.80, 115.80, 116.65
Price
USD
Bbl
.12
92
96
100
104
108
112
116
120
StochS, QBFO-
2012/08/23, 86.457, 84.051
StochS, QBFO-
2012/08/23, 84.503, 87.842
Value
USD
Bbl
.123
23 30 06 13 20 27 05 12 19 26 02 10 16 23 30 08 14 21 28 06 11 18 25 02 09 16 23 30 06 13 20 27 03
Jan 12 Feb 12 Mar 12 Apr 12 May 12 Jun 12 Jul 12 Aug 12