Embed Size (px)
Citation preview
INVESTMENT MANAGEMENT
e-DELIVERY: Go Paperless. It’s faster, easier and greener.Sign up today at: www.icsdelivery.comMay not be available for all accounts.
Morgan StanleyInstitutionalLiquidity FundsMoney Market PortfolioPrime PortfolioGovernment PortfolioGovernment Securities PortfolioTreasury PortfolioTreasury Securities PortfolioTax-Exempt PortfolioSemi-Annual ReportApril 30, 2018
Merrill Corp - MS ILF Semi-Annual Report [Funds] 04-30-2018 ED [AUX] | thunt | 21-Jun-18 10:25 | 18-13101-10.aa | Sequence: 1CHKSUM Content: 22537 Layout: 2202 Graphics: 39024 CLEAN
JOB: 18-13101-10 CYCLE#;BL#: 5; 0 TRIM: 8.25" x 10.75" COMPOSITECOLORS: Black, ~note-color 2, ~note-color 3 GRAPHICS: e-del_3L_60k_2013.eps, morgan_stanley_new_k_logo.eps V1.5

Merrill Corp - Merrill Corporation ED True Blanks 7.5x8.75 Prospectus [Funds] Style Only | rradatz | 05-Aug-10 13:03 | 07-28247-18.tb1 | Sequence: 1CHKSUM Content: No Content Layout: 0 Graphics: No Graphics CLEAN
JOB: 07-28247-18 CYCLE#;BL#: 2; 0 TRIM: 7.5" x 8.75" COMPOSITECOLORS: none GRAPHICS: none V1.5
Shareholders’ Letter.......................................................................................................................................2
Performance Summary...................................................................................................................................3
Expense Examples.........................................................................................................................................4
Portfolio of Investments:Money Market Portfolio ....................................................................................................................................................................6Prime Portfolio ................................................................................................................................................................................9Government Portfolio .....................................................................................................................................................................12Government Securities Portfolio......................................................................................................................................................17Treasury Portfolio..........................................................................................................................................................................19Treasury Securities Portfolio ..........................................................................................................................................................21Tax-Exempt Portfolio......................................................................................................................................................................22
Statements of Assets and Liabilities ..............................................................................................................25
Statements of Operations.............................................................................................................................29
Statements of Changes in Net Assets............................................................................................................31
Financial Highlights.......................................................................................................................................38
Notes to Financial Statements.......................................................................................................................53
Privacy Notice .............................................................................................................................................60
Trustee and Officer Information.....................................................................................................................63
This report is authorized for distribution only when preceded or accompanied by prospectuses of the Morgan Stanley Institutional Liquidity Funds(the “Trust”). To receive a prospectus and/or Statement of Additional Information (SAI), which contains more complete information such asinvestment objectives, charges, expenses, policies for voting proxies, risk considerations and describes in detail each of the Fund’s investmentpolicies to the prospective investor, please call toll free 1 (888) 378-1630. Please read the prospectus carefully before you invest or send money.
Additionally, you can access fund information including performance, characteristics and investment team commentary through Morgan StanleyInvestment Management’s website: www.morganstanley.com/liquidity.
There is no assurance that a Fund will achieve its investment objective. The Trust is subject to market risk, which is the possibility that marketvalues of securities owned by the Trust will decline and, therefore, the value of the Trust’s shares may be less than what you paid for them.Accordingly, you can lose money investing in this Trust. Please see the prospectus for more complete information on investment risks.
Table of Contents
1
2018 Semi-Annual Report
April 30, 2018
Merrill Corp - MS ILF Semi-Annual Report [Funds] 04-30-2018 ED [AUX] | thunt | 21-Jun-18 10:25 | 18-13101-10.ba | Sequence: 1CHKSUM Content: 32993 Layout: 17900 Graphics: No Graphics CLEAN
JOB: 18-13101-10 CYCLE#;BL#: 5; 0 TRIM: 8.25" x 10.75" COMPOSITECOLORS: Black, ~note-color 2 GRAPHICS: none V1.5
2
Dear Shareholders:
We are pleased to present the Morgan Stanley Institutional Liquidity Funds (“the Trust”) Semi-Annual Report for the periodended April 30, 2018. The Trust currently offers seven funds (Money Market, Prime, Government, Government Securities,Treasury, Treasury Securities and Tax-Exempt), which together are designed to provide flexible cash management options. TheTrust’s funds provide investors with a means to help them meet specific cash investment needs, whether they need a rated fund,capital preservation, or tax-efficient returns.
Sincerely,
John H. GernonPresident and Principal Executive Officer
May 2018
Shareholders’ Letter (unaudited)
2018 Semi-Annual Report
April 30, 2018
Merrill Corp - MS ILF Semi-Annual Report [Funds] 04-30-2018 ED [AUX] | thunt | 21-Jun-18 10:25 | 18-13101-10.ba | Sequence: 2CHKSUM Content: 56699 Layout: 36371 Graphics: 44807 CLEAN
JOB: 18-13101-10 CYCLE#;BL#: 5; 0 TRIM: 8.25" x 10.75" COMPOSITECOLORS: Black, ~note-color 2 GRAPHICS: John_Gernon_Sig.eps V1.5
3
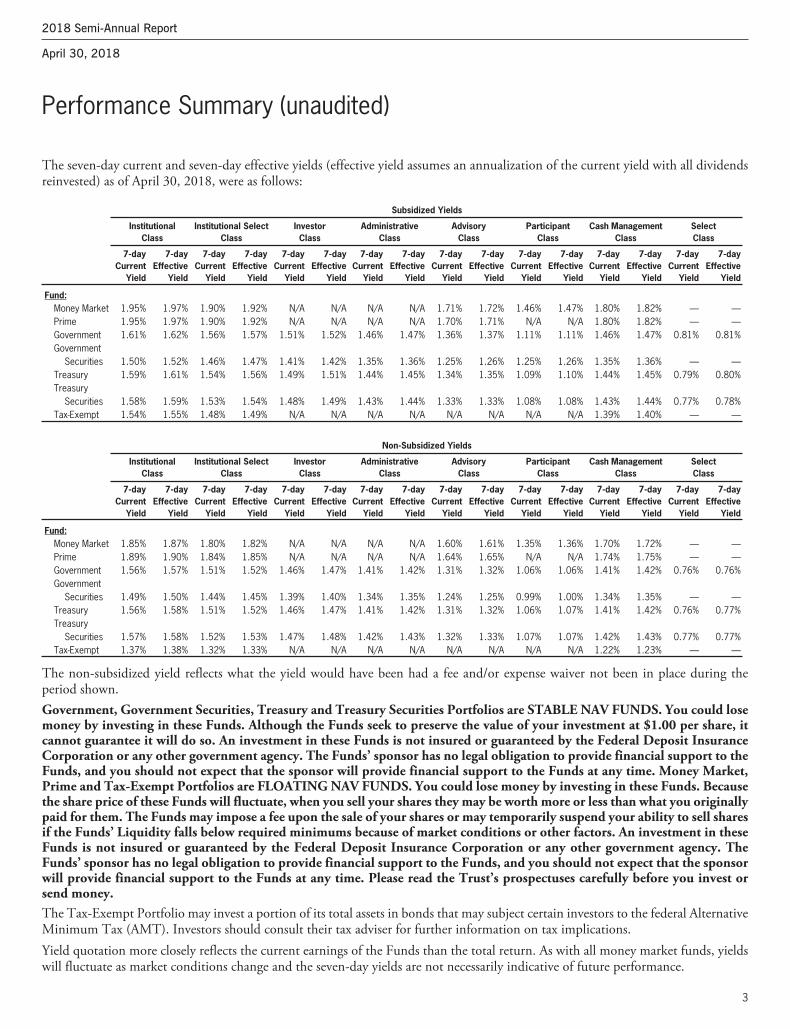
The seven-day current and seven-day effective yields (effective yield assumes an annualization of the current yield with all dividendsreinvested) as of April 30, 2018, were as follows:
Subsidized Yields
Institutional Institutional Select Investor Administrative Advisory Participant Cash Management SelectClass Class Class Class Class Class Class Class
7-day 7-day 7-day 7-day 7-day 7-day 7-day 7-day 7-day 7-day 7-day 7-day 7-day 7-day 7-day 7-day Current Effective Current Effective Current Effective Current Effective Current Effective Current Effective Current Effective Current Effective Yield Yield Yield Yield Yield Yield Yield Yield Yield Yield Yield Yield Yield Yield Yield Yield
Fund:Money Market 1.95% 1.97% 1.90% 1.92% N/A N/A N/A N/A 1.71% 1.72% 1.46% 1.47% 1.80% 1.82% — —Prime 1.95% 1.97% 1.90% 1.92% N/A N/A N/A N/A 1.70% 1.71% N/A N/A 1.80% 1.82% — —Government 1.61% 1.62% 1.56% 1.57% 1.51% 1.52% 1.46% 1.47% 1.36% 1.37% 1.11% 1.11% 1.46% 1.47% 0.81% 0.81%Government
Securities 1.50% 1.52% 1.46% 1.47% 1.41% 1.42% 1.35% 1.36% 1.25% 1.26% 1.25% 1.26% 1.35% 1.36% — —Treasury 1.59% 1.61% 1.54% 1.56% 1.49% 1.51% 1.44% 1.45% 1.34% 1.35% 1.09% 1.10% 1.44% 1.45% 0.79% 0.80%Treasury
Securities 1.58% 1.59% 1.53% 1.54% 1.48% 1.49% 1.43% 1.44% 1.33% 1.33% 1.08% 1.08% 1.43% 1.44% 0.77% 0.78%Tax-Exempt 1.54% 1.55% 1.48% 1.49% N/A N/A N/A N/A N/A N/A N/A N/A 1.39% 1.40% — —
Non-Subsidized Yields
Institutional Institutional Select Investor Administrative Advisory Participant Cash Management SelectClass Class Class Class Class Class Class Class
7-day 7-day 7-day 7-day 7-day 7-day 7-day 7-day 7-day 7-day 7-day 7-day 7-day 7-day 7-day 7-day Current Effective Current Effective Current Effective Current Effective Current Effective Current Effective Current Effective Current Effective Yield Yield Yield Yield Yield Yield Yield Yield Yield Yield Yield Yield Yield Yield Yield Yield
Fund:Money Market 1.85% 1.87% 1.80% 1.82% N/A N/A N/A N/A 1.60% 1.61% 1.35% 1.36% 1.70% 1.72% — —Prime 1.89% 1.90% 1.84% 1.85% N/A N/A N/A N/A 1.64% 1.65% N/A N/A 1.74% 1.75% — —Government 1.56% 1.57% 1.51% 1.52% 1.46% 1.47% 1.41% 1.42% 1.31% 1.32% 1.06% 1.06% 1.41% 1.42% 0.76% 0.76%Government
Securities 1.49% 1.50% 1.44% 1.45% 1.39% 1.40% 1.34% 1.35% 1.24% 1.25% 0.99% 1.00% 1.34% 1.35% — —Treasury 1.56% 1.58% 1.51% 1.52% 1.46% 1.47% 1.41% 1.42% 1.31% 1.32% 1.06% 1.07% 1.41% 1.42% 0.76% 0.77%Treasury
Securities 1.57% 1.58% 1.52% 1.53% 1.47% 1.48% 1.42% 1.43% 1.32% 1.33% 1.07% 1.07% 1.42% 1.43% 0.77% 0.77%Tax-Exempt 1.37% 1.38% 1.32% 1.33% N/A N/A N/A N/A N/A N/A N/A N/A 1.22% 1.23% — —
The non-subsidized yield reflects what the yield would have been had a fee and/or expense waiver not been in place during theperiod shown.Government, Government Securities, Treasury and Treasury Securities Portfolios are STABLE NAV FUNDS. You could losemoney by investing in these Funds. Although the Funds seek to preserve the value of your investment at $1.00 per share, itcannot guarantee it will do so. An investment in these Funds is not insured or guaranteed by the Federal Deposit InsuranceCorporation or any other government agency. The Funds’ sponsor has no legal obligation to provide financial support to theFunds, and you should not expect that the sponsor will provide financial support to the Funds at any time. Money Market,Prime and Tax-Exempt Portfolios are FLOATING NAV FUNDS. You could lose money by investing in these Funds. Becausethe share price of these Funds will fluctuate, when you sell your shares they may be worth more or less than what you originallypaid for them. The Funds may impose a fee upon the sale of your shares or may temporarily suspend your ability to sell sharesif the Funds’ Liquidity falls below required minimums because of market conditions or other factors. An investment in theseFunds is not insured or guaranteed by the Federal Deposit Insurance Corporation or any other government agency. TheFunds’ sponsor has no legal obligation to provide financial support to the Funds, and you should not expect that the sponsorwill provide financial support to the Funds at any time. Please read the Trust’s prospectuses carefully before you invest orsend money.The Tax-Exempt Portfolio may invest a portion of its total assets in bonds that may subject certain investors to the federal AlternativeMinimum Tax (AMT). Investors should consult their tax adviser for further information on tax implications.Yield quotation more closely reflects the current earnings of the Funds than the total return. As with all money market funds, yieldswill fluctuate as market conditions change and the seven-day yields are not necessarily indicative of future performance.
Performance Summary (unaudited)
2018 Semi-Annual Report
April 30, 2018
Merrill Corp - MS ILF Semi-Annual Report [Funds] 04-30-2018 ED [AUX] | thunt | 21-Jun-18 10:25 | 18-13101-10.ba | Sequence: 3CHKSUM Content: 19643 Layout: 15984 Graphics: No Graphics CLEAN
JOB: 18-13101-10 CYCLE#;BL#: 5; 0 TRIM: 8.25" x 10.75" COMPOSITECOLORS: Black, ~note-color 2 GRAPHICS: none V1.5
4
As a shareholder of a Fund, you incur ongoing costs, which might include advisory fees, administration plan fees, service andshareholder administration plan fees, distribution plan fees, shareholder services fees and other Fund expenses. These examples areintended to help you understand your ongoing costs (in dollars) of investing in each Fund and to compare these costs with theongoing costs of investing in other mutual funds.These examples are based on an investment of $1,000 invested at the beginning of the six-month period ended April 30, 2018 andheld for the entire six-month period.Actual Expenses
The table on the following page provides information about actual account values and actual expenses. You may use theinformation in this table, together with the amount you invested, to estimate the expenses that you paid over the period. Simplydivide your account value by $1,000 (for example, an $8,600 account value divided by $1,000 = 8.6), then multiply the result bythe number in the table under the heading entitled “Actual Expenses Paid During Period” to estimate the expenses you paid onyour account during this period.Hypothetical Example for Comparison Purposes
The table on the following page provides information about hypothetical account values and hypothetical expenses based on aFund’s actual expense ratio and an assumed rate of return of 5% per year before expenses, which is not the Fund’s actual return.The hypothetical account values and expenses may not be used to estimate the actual ending account balance or expenses you paidfor the period. You may use this information to compare the ongoing costs of investing in a Fund and other funds. To do so,compare this 5% hypothetical example with the 5% hypothetical examples that appear in the shareholder reports of the otherfunds.Please note that the expenses shown in the table are meant to highlight your ongoing costs only. Therefore, the information foreach class in the table is useful in comparing ongoing costs, and will not help you determine the relative total cost of owningdifferent funds that have transactional costs, such as sales charges (loads) or exchange fees.
Expense Examples (unaudited)
2018 Semi-Annual Report
April 30, 2018
Merrill Corp - MS ILF Semi-Annual Report [Funds] 04-30-2018 ED [AUX] | thunt | 21-Jun-18 10:25 | 18-13101-10.ba | Sequence: 4CHKSUM Content: 16763 Layout: 59192 Graphics: No Graphics CLEAN
JOB: 18-13101-10 CYCLE#;BL#: 5; 0 TRIM: 8.25" x 10.75" COMPOSITECOLORS: Black, ~note-color 2 GRAPHICS: none V1.5
5
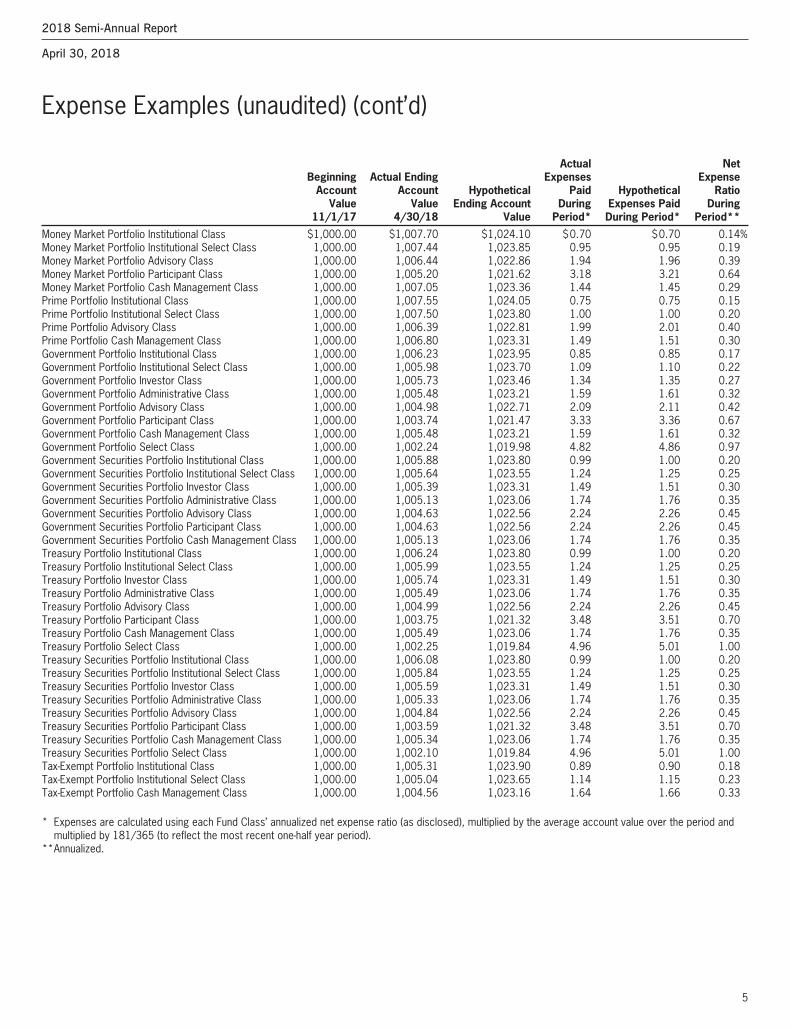
Actual Net Beginning Actual Ending Expenses Expense Account Account Hypothetical Paid Hypothetical Ratio Value Value Ending Account During Expenses Paid During 11/1/17 4/30/18 Value Period* During Period* Period**
Money Market Portfolio Institutional Class $1,000.00 $1,007.70 $1,024.10 $0.70 $0.70 0.14%Money Market Portfolio Institutional Select Class 1,000.00 1,007.44 1,023.85 0.95 0.95 0.19Money Market Portfolio Advisory Class 1,000.00 1,006.44 1,022.86 1.94 1.96 0.39Money Market Portfolio Participant Class 1,000.00 1,005.20 1,021.62 3.18 3.21 0.64Money Market Portfolio Cash Management Class 1,000.00 1,007.05 1,023.36 1.44 1.45 0.29Prime Portfolio Institutional Class 1,000.00 1,007.55 1,024.05 0.75 0.75 0.15Prime Portfolio Institutional Select Class 1,000.00 1,007.50 1,023.80 1.00 1.00 0.20Prime Portfolio Advisory Class 1,000.00 1,006.39 1,022.81 1.99 2.01 0.40Prime Portfolio Cash Management Class 1,000.00 1,006.80 1,023.31 1.49 1.51 0.30Government Portfolio Institutional Class 1,000.00 1,006.23 1,023.95 0.85 0.85 0.17Government Portfolio Institutional Select Class 1,000.00 1,005.98 1,023.70 1.09 1.10 0.22Government Portfolio Investor Class 1,000.00 1,005.73 1,023.46 1.34 1.35 0.27Government Portfolio Administrative Class 1,000.00 1,005.48 1,023.21 1.59 1.61 0.32Government Portfolio Advisory Class 1,000.00 1,004.98 1,022.71 2.09 2.11 0.42Government Portfolio Participant Class 1,000.00 1,003.74 1,021.47 3.33 3.36 0.67Government Portfolio Cash Management Class 1,000.00 1,005.48 1,023.21 1.59 1.61 0.32Government Portfolio Select Class 1,000.00 1,002.24 1,019.98 4.82 4.86 0.97Government Securities Portfolio Institutional Class 1,000.00 1,005.88 1,023.80 0.99 1.00 0.20Government Securities Portfolio Institutional Select Class 1,000.00 1,005.64 1,023.55 1.24 1.25 0.25Government Securities Portfolio Investor Class 1,000.00 1,005.39 1,023.31 1.49 1.51 0.30Government Securities Portfolio Administrative Class 1,000.00 1,005.13 1,023.06 1.74 1.76 0.35Government Securities Portfolio Advisory Class 1,000.00 1,004.63 1,022.56 2.24 2.26 0.45Government Securities Portfolio Participant Class 1,000.00 1,004.63 1,022.56 2.24 2.26 0.45Government Securities Portfolio Cash Management Class 1,000.00 1,005.13 1,023.06 1.74 1.76 0.35Treasury Portfolio Institutional Class 1,000.00 1,006.24 1,023.80 0.99 1.00 0.20Treasury Portfolio Institutional Select Class 1,000.00 1,005.99 1,023.55 1.24 1.25 0.25Treasury Portfolio Investor Class 1,000.00 1,005.74 1,023.31 1.49 1.51 0.30Treasury Portfolio Administrative Class 1,000.00 1,005.49 1,023.06 1.74 1.76 0.35Treasury Portfolio Advisory Class 1,000.00 1,004.99 1,022.56 2.24 2.26 0.45Treasury Portfolio Participant Class 1,000.00 1,003.75 1,021.32 3.48 3.51 0.70Treasury Portfolio Cash Management Class 1,000.00 1,005.49 1,023.06 1.74 1.76 0.35Treasury Portfolio Select Class 1,000.00 1,002.25 1,019.84 4.96 5.01 1.00Treasury Securities Portfolio Institutional Class 1,000.00 1,006.08 1,023.80 0.99 1.00 0.20Treasury Securities Portfolio Institutional Select Class 1,000.00 1,005.84 1,023.55 1.24 1.25 0.25Treasury Securities Portfolio Investor Class 1,000.00 1,005.59 1,023.31 1.49 1.51 0.30Treasury Securities Portfolio Administrative Class 1,000.00 1,005.33 1,023.06 1.74 1.76 0.35Treasury Securities Portfolio Advisory Class 1,000.00 1,004.84 1,022.56 2.24 2.26 0.45Treasury Securities Portfolio Participant Class 1,000.00 1,003.59 1,021.32 3.48 3.51 0.70Treasury Securities Portfolio Cash Management Class 1,000.00 1,005.34 1,023.06 1.74 1.76 0.35Treasury Securities Portfolio Select Class 1,000.00 1,002.10 1,019.84 4.96 5.01 1.00Tax-Exempt Portfolio Institutional Class 1,000.00 1,005.31 1,023.90 0.89 0.90 0.18Tax-Exempt Portfolio Institutional Select Class 1,000.00 1,005.04 1,023.65 1.14 1.15 0.23Tax-Exempt Portfolio Cash Management Class 1,000.00 1,004.56 1,023.16 1.64 1.66 0.33
* Expenses are calculated using each Fund Class’ annualized net expense ratio (as disclosed), multiplied by the average account value over the period andmultiplied by 181/365 (to reflect the most recent one-half year period).
**Annualized.
Expense Examples (unaudited) (cont’d)
2018 Semi-Annual Report
April 30, 2018
Merrill Corp - MS ILF Semi-Annual Report [Funds] 04-30-2018 ED [AUX] | thunt | 21-Jun-18 10:25 | 18-13101-10.ba | Sequence: 5CHKSUM Content: 34304 Layout: 30892 Graphics: No Graphics CLEAN
JOB: 18-13101-10 CYCLE#;BL#: 5; 0 TRIM: 8.25" x 10.75" COMPOSITECOLORS: Black, ~note-color 2 GRAPHICS: none V1.5
6
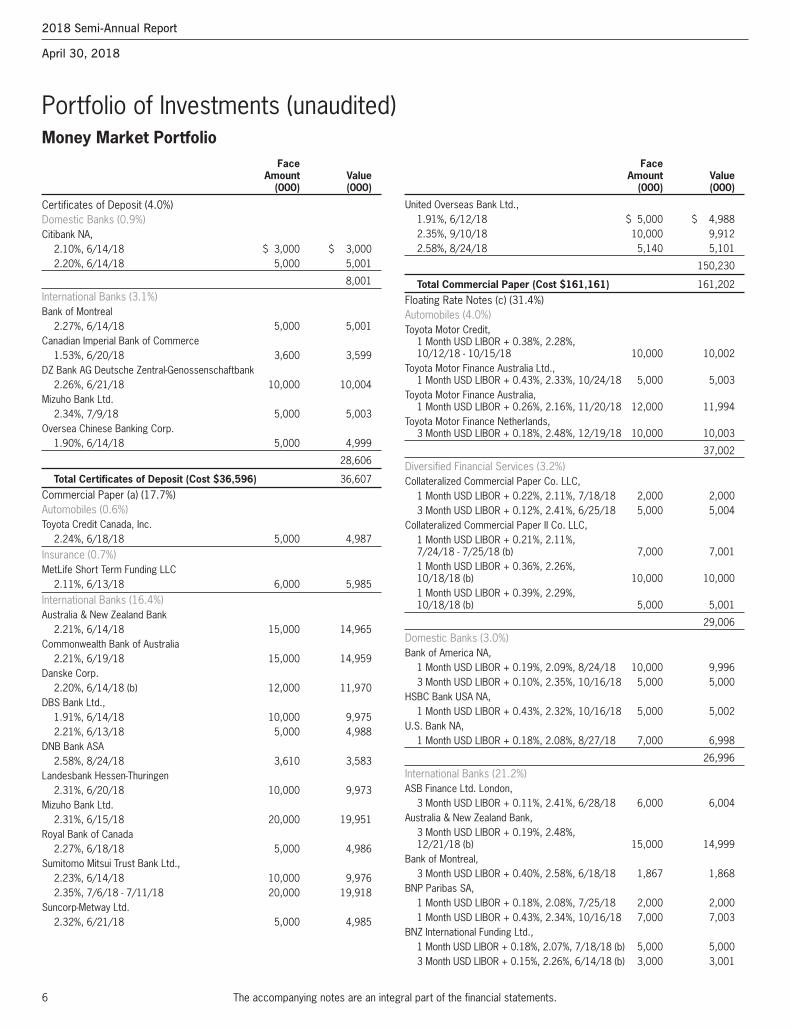
United Overseas Bank Ltd.,1.91%, 6/12/18 $ 5,000 $ 4,9882.35%, 9/10/18 10,000 9,9122.58%, 8/24/18 5,140 5,101
150,230
Total Commercial Paper (Cost $161,161) 161,202
Floating Rate Notes (c) (31.4%)Automobiles (4.0%)Toyota Motor Credit,
1 Month USD LIBOR + 0.38%, 2.28%, 10/12/18 - 10/15/18 10,000 10,002
Toyota Motor Finance Australia Ltd.,1 Month USD LIBOR + 0.43%, 2.33%, 10/24/18 5,000 5,003
Toyota Motor Finance Australia,1 Month USD LIBOR + 0.26%, 2.16%, 11/20/18 12,000 11,994
Toyota Motor Finance Netherlands,3 Month USD LIBOR + 0.18%, 2.48%, 12/19/18 10,000 10,003
37,002
Diversified Financial Services (3.2%)Collateralized Commercial Paper Co. LLC,
1 Month USD LIBOR + 0.22%, 2.11%, 7/18/18 2,000 2,0003 Month USD LIBOR + 0.12%, 2.41%, 6/25/18 5,000 5,004
Collateralized Commercial Paper II Co. LLC,1 Month USD LIBOR + 0.21%, 2.11%, 7/24/18 - 7/25/18 (b) 7,000 7,0011 Month USD LIBOR + 0.36%, 2.26%, 10/18/18 (b) 10,000 10,0001 Month USD LIBOR + 0.39%, 2.29%, 10/18/18 (b) 5,000 5,001
29,006
Domestic Banks (3.0%)Bank of America NA,
1 Month USD LIBOR + 0.19%, 2.09%, 8/24/18 10,000 9,9963 Month USD LIBOR + 0.10%, 2.35%, 10/16/18 5,000 5,000
HSBC Bank USA NA,1 Month USD LIBOR + 0.43%, 2.32%, 10/16/18 5,000 5,002
U.S. Bank NA,1 Month USD LIBOR + 0.18%, 2.08%, 8/27/18 7,000 6,998
26,996
International Banks (21.2%)ASB Finance Ltd. London,
3 Month USD LIBOR + 0.11%, 2.41%, 6/28/18 6,000 6,004Australia & New Zealand Bank,
3 Month USD LIBOR + 0.19%, 2.48%, 12/21/18 (b) 15,000 14,999
Bank of Montreal,3 Month USD LIBOR + 0.40%, 2.58%, 6/18/18 1,867 1,868
BNP Paribas SA,1 Month USD LIBOR + 0.18%, 2.08%, 7/25/18 2,000 2,0001 Month USD LIBOR + 0.43%, 2.34%, 10/16/18 7,000 7,003
BNZ International Funding Ltd.,1 Month USD LIBOR + 0.18%, 2.07%, 7/18/18 (b) 5,000 5,0003 Month USD LIBOR + 0.15%, 2.26%, 6/14/18 (b) 3,000 3,001
Portfolio of Investments (unaudited)Money Market Portfolio Face Amount Value (000) (000)
Face Amount Value (000) (000)
Certificates of Deposit (4.0%)Domestic Banks (0.9%)Citibank NA,
2.10%, 6/14/18 $ 3,000 $ 3,0002.20%, 6/14/18 5,000 5,001
8,001
International Banks (3.1%)Bank of Montreal
2.27%, 6/14/18 5,000 5,001Canadian Imperial Bank of Commerce
1.53%, 6/20/18 3,600 3,599DZ Bank AG Deutsche Zentral-Genossenschaftbank
2.26%, 6/21/18 10,000 10,004Mizuho Bank Ltd.
2.34%, 7/9/18 5,000 5,003Oversea Chinese Banking Corp.
1.90%, 6/14/18 5,000 4,999
28,606
Total Certificates of Deposit (Cost $36,596) 36,607
Commercial Paper (a) (17.7%)Automobiles (0.6%)Toyota Credit Canada, Inc.
2.24%, 6/18/18 5,000 4,987
Insurance (0.7%)MetLife Short Term Funding LLC
2.11%, 6/13/18 6,000 5,985
International Banks (16.4%)Australia & New Zealand Bank
2.21%, 6/14/18 15,000 14,965Commonwealth Bank of Australia
2.21%, 6/19/18 15,000 14,959Danske Corp.
2.20%, 6/14/18 (b) 12,000 11,970DBS Bank Ltd.,
1.91%, 6/14/18 10,000 9,9752.21%, 6/13/18 5,000 4,988
DNB Bank ASA2.58%, 8/24/18 3,610 3,583
Landesbank Hessen-Thuringen2.31%, 6/20/18 10,000 9,973
Mizuho Bank Ltd.2.31%, 6/15/18 20,000 19,951
Royal Bank of Canada2.27%, 6/18/18 5,000 4,986
Sumitomo Mitsui Trust Bank Ltd.,2.23%, 6/14/18 10,000 9,9762.35%, 7/6/18 - 7/11/18 20,000 19,918
Suncorp-Metway Ltd.2.32%, 6/21/18 5,000 4,985
The accompanying notes are an integral part of the financial statements.
2018 Semi-Annual Report
April 30, 2018
Merrill Corp - MS ILF Semi-Annual Report [Funds] 04-30-2018 ED [AUX] | thunt | 21-Jun-18 10:25 | 18-13101-10.ca | Sequence: 1CHKSUM Content: 24119 Layout: 19530 Graphics: No Graphics CLEAN
JOB: 18-13101-10 CYCLE#;BL#: 5; 0 TRIM: 8.25" x 10.75" COMPOSITECOLORS: Black, ~note-color 2 GRAPHICS: none V1.5
7
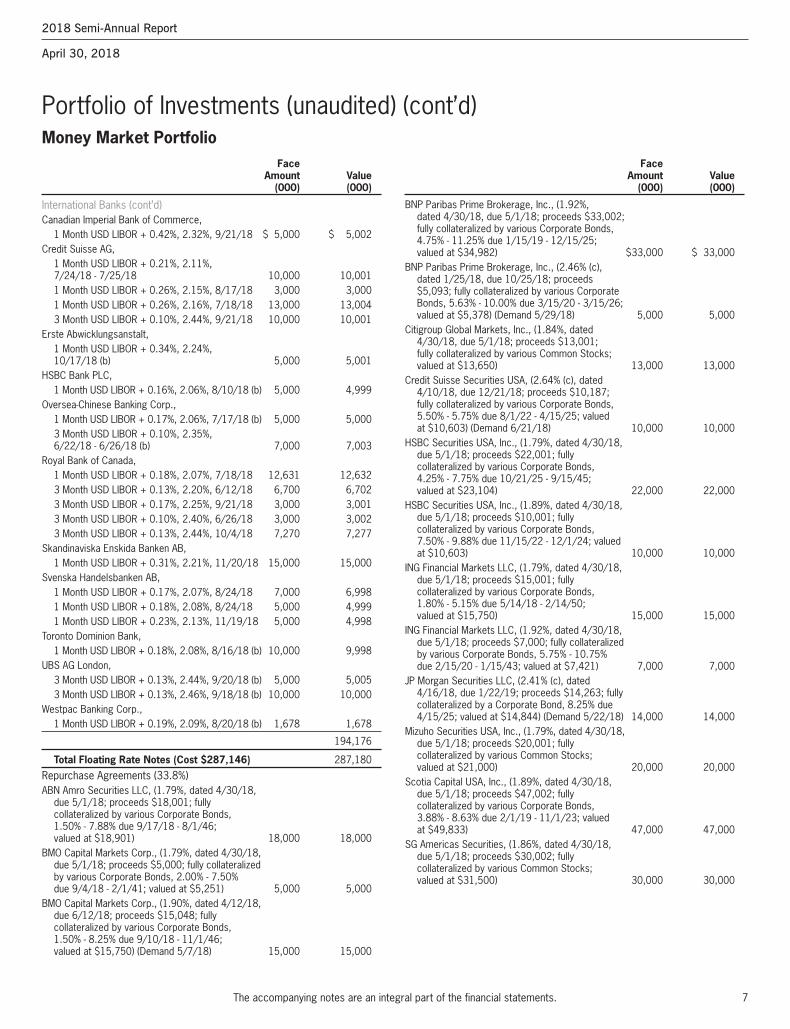
Portfolio of Investments (unaudited) (cont’d)Money Market Portfolio
The accompanying notes are an integral part of the financial statements.
BNP Paribas Prime Brokerage, Inc., (1.92%, dated 4/30/18, due 5/1/18; proceeds $33,002; fully collateralized by various Corporate Bonds, 4.75% - 11.25% due 1/15/19 - 12/15/25; valued at $34,982) $33,000 $ 33,000
BNP Paribas Prime Brokerage, Inc., (2.46% (c), dated 1/25/18, due 10/25/18; proceeds $5,093; fully collateralized by various Corporate Bonds, 5.63% - 10.00% due 3/15/20 - 3/15/26; valued at $5,378) (Demand 5/29/18) 5,000 5,000
Citigroup Global Markets, Inc., (1.84%, dated 4/30/18, due 5/1/18; proceeds $13,001; fully collateralized by various Common Stocks; valued at $13,650) 13,000 13,000
Credit Suisse Securities USA, (2.64% (c), dated 4/10/18, due 12/21/18; proceeds $10,187; fully collateralized by various Corporate Bonds, 5.50% - 5.75% due 8/1/22 - 4/15/25; valued at $10,603) (Demand 6/21/18) 10,000 10,000
HSBC Securities USA, Inc., (1.79%, dated 4/30/18, due 5/1/18; proceeds $22,001; fully collateralized by various Corporate Bonds, 4.25% - 7.75% due 10/21/25 - 9/15/45; valued at $23,104) 22,000 22,000
HSBC Securities USA, Inc., (1.89%, dated 4/30/18, due 5/1/18; proceeds $10,001; fully collateralized by various Corporate Bonds, 7.50% - 9.88% due 11/15/22 - 12/1/24; valued at $10,603) 10,000 10,000
ING Financial Markets LLC, (1.79%, dated 4/30/18, due 5/1/18; proceeds $15,001; fully collateralized by various Corporate Bonds, 1.80% - 5.15% due 5/14/18 - 2/14/50; valued at $15,750) 15,000 15,000
ING Financial Markets LLC, (1.92%, dated 4/30/18, due 5/1/18; proceeds $7,000; fully collateralized by various Corporate Bonds, 5.75% - 10.75% due 2/15/20 - 1/15/43; valued at $7,421) 7,000 7,000
JP Morgan Securities LLC, (2.41% (c), dated 4/16/18, due 1/22/19; proceeds $14,263; fully collateralized by a Corporate Bond, 8.25% due 4/15/25; valued at $14,844) (Demand 5/22/18) 14,000 14,000
Mizuho Securities USA, Inc., (1.79%, dated 4/30/18, due 5/1/18; proceeds $20,001; fully collateralized by various Common Stocks; valued at $21,000) 20,000 20,000
Scotia Capital USA, Inc., (1.89%, dated 4/30/18, due 5/1/18; proceeds $47,002; fully collateralized by various Corporate Bonds, 3.88% - 8.63% due 2/1/19 - 11/1/23; valued at $49,833) 47,000 47,000
SG Americas Securities, (1.86%, dated 4/30/18, due 5/1/18; proceeds $30,002; fully collateralized by various Common Stocks; valued at $31,500) 30,000 30,000
Face Amount Value (000) (000)
Face Amount Value (000) (000)
International Banks (cont’d)Canadian Imperial Bank of Commerce,
1 Month USD LIBOR + 0.42%, 2.32%, 9/21/18 $ 5,000 $ 5,002Credit Suisse AG,
1 Month USD LIBOR + 0.21%, 2.11%, 7/24/18 - 7/25/18 10,000 10,0011 Month USD LIBOR + 0.26%, 2.15%, 8/17/18 3,000 3,0001 Month USD LIBOR + 0.26%, 2.16%, 7/18/18 13,000 13,0043 Month USD LIBOR + 0.10%, 2.44%, 9/21/18 10,000 10,001
Erste Abwicklungsanstalt,1 Month USD LIBOR + 0.34%, 2.24%, 10/17/18 (b) 5,000 5,001
HSBC Bank PLC,1 Month USD LIBOR + 0.16%, 2.06%, 8/10/18 (b) 5,000 4,999
Oversea-Chinese Banking Corp.,1 Month USD LIBOR + 0.17%, 2.06%, 7/17/18 (b) 5,000 5,0003 Month USD LIBOR + 0.10%, 2.35%, 6/22/18 - 6/26/18 (b) 7,000 7,003
Royal Bank of Canada,1 Month USD LIBOR + 0.18%, 2.07%, 7/18/18 12,631 12,6323 Month USD LIBOR + 0.13%, 2.20%, 6/12/18 6,700 6,7023 Month USD LIBOR + 0.17%, 2.25%, 9/21/18 3,000 3,0013 Month USD LIBOR + 0.10%, 2.40%, 6/26/18 3,000 3,0023 Month USD LIBOR + 0.13%, 2.44%, 10/4/18 7,270 7,277
Skandinaviska Enskida Banken AB,1 Month USD LIBOR + 0.31%, 2.21%, 11/20/18 15,000 15,000
Svenska Handelsbanken AB,1 Month USD LIBOR + 0.17%, 2.07%, 8/24/18 7,000 6,9981 Month USD LIBOR + 0.18%, 2.08%, 8/24/18 5,000 4,9991 Month USD LIBOR + 0.23%, 2.13%, 11/19/18 5,000 4,998
Toronto Dominion Bank,1 Month USD LIBOR + 0.18%, 2.08%, 8/16/18 (b) 10,000 9,998
UBS AG London,3 Month USD LIBOR + 0.13%, 2.44%, 9/20/18 (b) 5,000 5,0053 Month USD LIBOR + 0.13%, 2.46%, 9/18/18 (b) 10,000 10,000
Westpac Banking Corp.,1 Month USD LIBOR + 0.19%, 2.09%, 8/20/18 (b) 1,678 1,678
194,176
Total Floating Rate Notes (Cost $287,146) 287,180
Repurchase Agreements (33.8%)ABN Amro Securities LLC, (1.79%, dated 4/30/18,
due 5/1/18; proceeds $18,001; fully collateralized by various Corporate Bonds, 1.50% - 7.88% due 9/17/18 - 8/1/46; valued at $18,901) 18,000 18,000
BMO Capital Markets Corp., (1.79%, dated 4/30/18, due 5/1/18; proceeds $5,000; fully collateralized by various Corporate Bonds, 2.00% - 7.50% due 9/4/18 - 2/1/41; valued at $5,251) 5,000 5,000
BMO Capital Markets Corp., (1.90%, dated 4/12/18, due 6/12/18; proceeds $15,048; fully collateralized by various Corporate Bonds, 1.50% - 8.25% due 9/10/18 - 11/1/46; valued at $15,750) (Demand 5/7/18) 15,000 15,000
2018 Semi-Annual Report
April 30, 2018
Merrill Corp - MS ILF Semi-Annual Report [Funds] 04-30-2018 ED [AUX] | thunt | 21-Jun-18 10:25 | 18-13101-10.ca | Sequence: 2CHKSUM Content: 48286 Layout: 16832 Graphics: No Graphics CLEAN
JOB: 18-13101-10 CYCLE#;BL#: 5; 0 TRIM: 8.25" x 10.75" COMPOSITECOLORS: Black, ~note-color 2 GRAPHICS: none V1.5
8
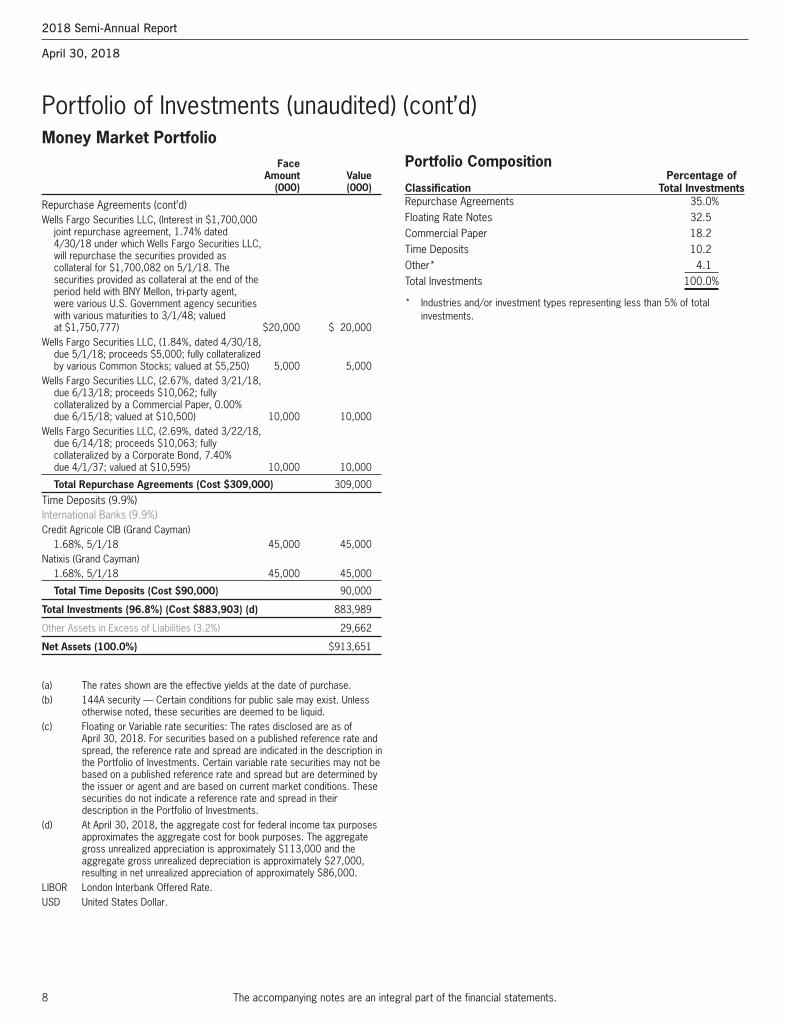
Portfolio of Investments (unaudited) (cont’d)Money Market Portfolio
The accompanying notes are an integral part of the financial statements.
Portfolio Composition Percentage ofClassification Total InvestmentsRepurchase Agreements 35.0%Floating Rate Notes 32.5Commercial Paper 18.2Time Deposits 10.2Other* 4.1Total Investments 100.0%
* Industries and/or investment types representing less than 5% of totalinvestments.
Face Amount Value (000) (000)
Repurchase Agreements (cont’d)Wells Fargo Securities LLC, (Interest in $1,700,000
joint repurchase agreement, 1.74% dated 4/30/18 under which Wells Fargo Securities LLC, will repurchase the securities provided as collateral for $1,700,082 on 5/1/18. The securities provided as collateral at the end of the period held with BNY Mellon, tri-party agent, were various U.S. Government agency securities with various maturities to 3/1/48; valued at $1,750,777) $20,000 $ 20,000
Wells Fargo Securities LLC, (1.84%, dated 4/30/18, due 5/1/18; proceeds $5,000; fully collateralized by various Common Stocks; valued at $5,250) 5,000 5,000
Wells Fargo Securities LLC, (2.67%, dated 3/21/18, due 6/13/18; proceeds $10,062; fully collateralized by a Commercial Paper, 0.00% due 6/15/18; valued at $10,500) 10,000 10,000
Wells Fargo Securities LLC, (2.69%, dated 3/22/18, due 6/14/18; proceeds $10,063; fully collateralized by a Corporate Bond, 7.40% due 4/1/37; valued at $10,595) 10,000 10,000
Total Repurchase Agreements (Cost $309,000) 309,000
Time Deposits (9.9%)International Banks (9.9%)Credit Agricole CIB (Grand Cayman)
1.68%, 5/1/18 45,000 45,000Natixis (Grand Cayman)
1.68%, 5/1/18 45,000 45,000
Total Time Deposits (Cost $90,000) 90,000
Total Investments (96.8%) (Cost $883,903) (d) 883,989
Other Assets in Excess of Liabilities (3.2%) 29,662
Net Assets (100.0%) $913,651
(a) The rates shown are the effective yields at the date of purchase.(b) 144A security — Certain conditions for public sale may exist. Unless
otherwise noted, these securities are deemed to be liquid.(c) Floating or Variable rate securities: The rates disclosed are as of
April 30, 2018. For securities based on a published reference rate andspread, the reference rate and spread are indicated in the description inthe Portfolio of Investments. Certain variable rate securities may not bebased on a published reference rate and spread but are determined bythe issuer or agent and are based on current market conditions. Thesesecurities do not indicate a reference rate and spread in theirdescription in the Portfolio of Investments.
(d) At April 30, 2018, the aggregate cost for federal income tax purposesapproximates the aggregate cost for book purposes. The aggregategross unrealized appreciation is approximately $113,000 and theaggregate gross unrealized depreciation is approximately $27,000,resulting in net unrealized appreciation of approximately $86,000.
LIBOR London Interbank Offered Rate.USD United States Dollar.
2018 Semi-Annual Report
April 30, 2018
Merrill Corp - MS ILF Semi-Annual Report [Funds] 04-30-2018 ED [AUX] | thunt | 21-Jun-18 10:25 | 18-13101-10.ca | Sequence: 3CHKSUM Content: 4228 Layout: 16844 Graphics: No Graphics CLEAN
JOB: 18-13101-10 CYCLE#;BL#: 5; 0 TRIM: 8.25" x 10.75" COMPOSITECOLORS: Black, ~note-color 2 GRAPHICS: none V1.5
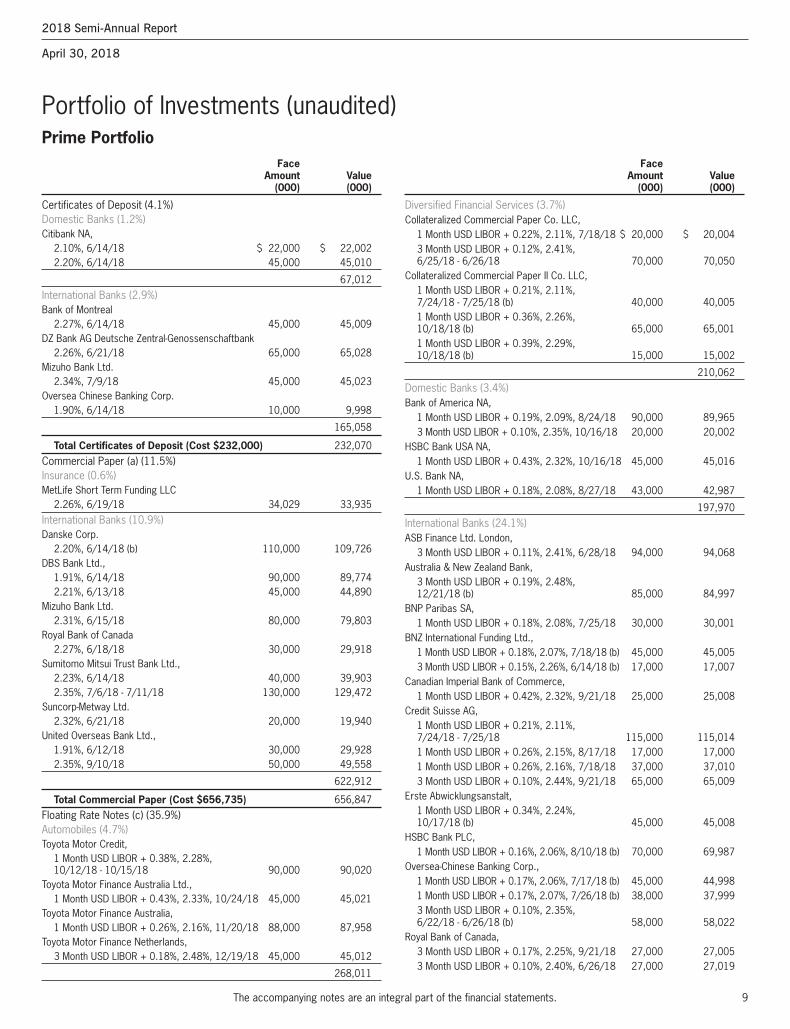
9
Diversified Financial Services (3.7%)Collateralized Commercial Paper Co. LLC,
1 Month USD LIBOR + 0.22%, 2.11%, 7/18/18 $ 20,000 $ 20,0043 Month USD LIBOR + 0.12%, 2.41%, 6/25/18 - 6/26/18 70,000 70,050
Collateralized Commercial Paper II Co. LLC,1 Month USD LIBOR + 0.21%, 2.11%, 7/24/18 - 7/25/18 (b) 40,000 40,0051 Month USD LIBOR + 0.36%, 2.26%, 10/18/18 (b) 65,000 65,0011 Month USD LIBOR + 0.39%, 2.29%, 10/18/18 (b) 15,000 15,002
210,062Domestic Banks (3.4%)Bank of America NA,
1 Month USD LIBOR + 0.19%, 2.09%, 8/24/18 90,000 89,9653 Month USD LIBOR + 0.10%, 2.35%, 10/16/18 20,000 20,002
HSBC Bank USA NA,1 Month USD LIBOR + 0.43%, 2.32%, 10/16/18 45,000 45,016
U.S. Bank NA,1 Month USD LIBOR + 0.18%, 2.08%, 8/27/18 43,000 42,987
197,970International Banks (24.1%)ASB Finance Ltd. London,
3 Month USD LIBOR + 0.11%, 2.41%, 6/28/18 94,000 94,068Australia & New Zealand Bank,
3 Month USD LIBOR + 0.19%, 2.48%, 12/21/18 (b) 85,000 84,997
BNP Paribas SA,1 Month USD LIBOR + 0.18%, 2.08%, 7/25/18 30,000 30,001
BNZ International Funding Ltd.,1 Month USD LIBOR + 0.18%, 2.07%, 7/18/18 (b) 45,000 45,0053 Month USD LIBOR + 0.15%, 2.26%, 6/14/18 (b) 17,000 17,007
Canadian Imperial Bank of Commerce,1 Month USD LIBOR + 0.42%, 2.32%, 9/21/18 25,000 25,008
Credit Suisse AG,1 Month USD LIBOR + 0.21%, 2.11%, 7/24/18 - 7/25/18 115,000 115,0141 Month USD LIBOR + 0.26%, 2.15%, 8/17/18 17,000 17,0001 Month USD LIBOR + 0.26%, 2.16%, 7/18/18 37,000 37,0103 Month USD LIBOR + 0.10%, 2.44%, 9/21/18 65,000 65,009
Erste Abwicklungsanstalt,1 Month USD LIBOR + 0.34%, 2.24%, 10/17/18 (b) 45,000 45,008
HSBC Bank PLC,1 Month USD LIBOR + 0.16%, 2.06%, 8/10/18 (b) 70,000 69,987
Oversea-Chinese Banking Corp.,1 Month USD LIBOR + 0.17%, 2.06%, 7/17/18 (b) 45,000 44,9981 Month USD LIBOR + 0.17%, 2.07%, 7/26/18 (b) 38,000 37,9993 Month USD LIBOR + 0.10%, 2.35%, 6/22/18 - 6/26/18 (b) 58,000 58,022
Royal Bank of Canada,3 Month USD LIBOR + 0.17%, 2.25%, 9/21/18 27,000 27,0053 Month USD LIBOR + 0.10%, 2.40%, 6/26/18 27,000 27,019
Portfolio of Investments (unaudited)Prime Portfolio Face Amount Value (000) (000)
Face Amount Value (000) (000)
Certificates of Deposit (4.1%)Domestic Banks (1.2%)Citibank NA,
2.10%, 6/14/18 $ 22,000 $ 22,0022.20%, 6/14/18 45,000 45,010
67,012International Banks (2.9%)Bank of Montreal
2.27%, 6/14/18 45,000 45,009DZ Bank AG Deutsche Zentral-Genossenschaftbank
2.26%, 6/21/18 65,000 65,028Mizuho Bank Ltd.
2.34%, 7/9/18 45,000 45,023Oversea Chinese Banking Corp.
1.90%, 6/14/18 10,000 9,998
165,058
Total Certificates of Deposit (Cost $232,000) 232,070Commercial Paper (a) (11.5%)Insurance (0.6%)MetLife Short Term Funding LLC
2.26%, 6/19/18 34,029 33,935International Banks (10.9%)Danske Corp.
2.20%, 6/14/18 (b) 110,000 109,726DBS Bank Ltd.,
1.91%, 6/14/18 90,000 89,7742.21%, 6/13/18 45,000 44,890
Mizuho Bank Ltd.2.31%, 6/15/18 80,000 79,803
Royal Bank of Canada2.27%, 6/18/18 30,000 29,918
Sumitomo Mitsui Trust Bank Ltd.,2.23%, 6/14/18 40,000 39,9032.35%, 7/6/18 - 7/11/18 130,000 129,472
Suncorp-Metway Ltd.2.32%, 6/21/18 20,000 19,940
United Overseas Bank Ltd.,1.91%, 6/12/18 30,000 29,9282.35%, 9/10/18 50,000 49,558
622,912
Total Commercial Paper (Cost $656,735) 656,847Floating Rate Notes (c) (35.9%)Automobiles (4.7%)Toyota Motor Credit,
1 Month USD LIBOR + 0.38%, 2.28%, 10/12/18 - 10/15/18 90,000 90,020
Toyota Motor Finance Australia Ltd.,1 Month USD LIBOR + 0.43%, 2.33%, 10/24/18 45,000 45,021
Toyota Motor Finance Australia,1 Month USD LIBOR + 0.26%, 2.16%, 11/20/18 88,000 87,958
Toyota Motor Finance Netherlands,3 Month USD LIBOR + 0.18%, 2.48%, 12/19/18 45,000 45,012
268,011
The accompanying notes are an integral part of the financial statements.
2018 Semi-Annual Report
April 30, 2018
Merrill Corp - MS ILF Semi-Annual Report [Funds] 04-30-2018 ED [AUX] | thunt | 21-Jun-18 10:25 | 18-13101-10.ca | Sequence: 4CHKSUM Content: 19677 Layout: 42546 Graphics: No Graphics CLEAN
JOB: 18-13101-10 CYCLE#;BL#: 5; 0 TRIM: 8.25" x 10.75" COMPOSITECOLORS: Black, ~note-color 2 GRAPHICS: none V1.5
10
Portfolio of Investments (unaudited) (cont’d)Prime Portfolio
The accompanying notes are an integral part of the financial statements.
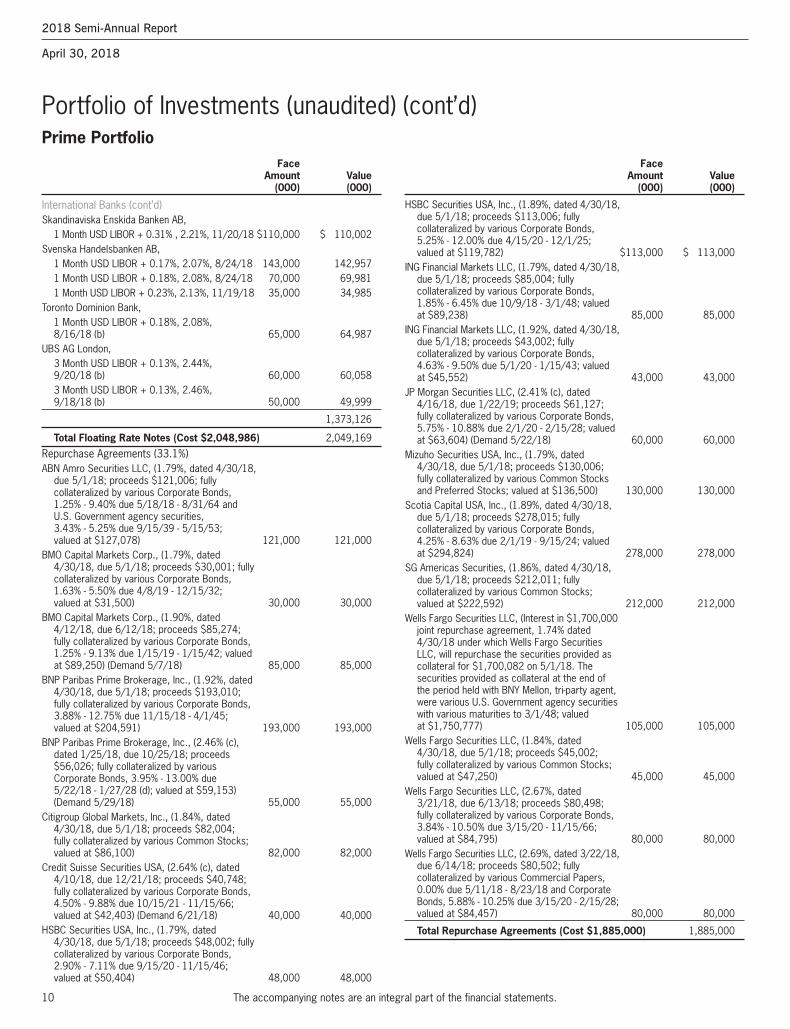
HSBC Securities USA, Inc., (1.89%, dated 4/30/18, due 5/1/18; proceeds $113,006; fully collateralized by various Corporate Bonds, 5.25% - 12.00% due 4/15/20 - 12/1/25; valued at $119,782) $113,000 $ 113,000
ING Financial Markets LLC, (1.79%, dated 4/30/18, due 5/1/18; proceeds $85,004; fully collateralized by various Corporate Bonds, 1.85% - 6.45% due 10/9/18 - 3/1/48; valued at $89,238) 85,000 85,000
ING Financial Markets LLC, (1.92%, dated 4/30/18, due 5/1/18; proceeds $43,002; fully collateralized by various Corporate Bonds, 4.63% - 9.50% due 5/1/20 - 1/15/43; valued at $45,552) 43,000 43,000
JP Morgan Securities LLC, (2.41% (c), dated 4/16/18, due 1/22/19; proceeds $61,127; fully collateralized by various Corporate Bonds, 5.75% - 10.88% due 2/1/20 - 2/15/28; valued at $63,604) (Demand 5/22/18) 60,000 60,000
Mizuho Securities USA, Inc., (1.79%, dated 4/30/18, due 5/1/18; proceeds $130,006; fully collateralized by various Common Stocks and Preferred Stocks; valued at $136,500) 130,000 130,000
Scotia Capital USA, Inc., (1.89%, dated 4/30/18, due 5/1/18; proceeds $278,015; fully collateralized by various Corporate Bonds, 4.25% - 8.63% due 2/1/19 - 9/15/24; valued at $294,824) 278,000 278,000
SG Americas Securities, (1.86%, dated 4/30/18, due 5/1/18; proceeds $212,011; fully collateralized by various Common Stocks; valued at $222,592) 212,000 212,000
Wells Fargo Securities LLC, (Interest in $1,700,000 joint repurchase agreement, 1.74% dated 4/30/18 under which Wells Fargo Securities LLC, will repurchase the securities provided as collateral for $1,700,082 on 5/1/18. The securities provided as collateral at the end of the period held with BNY Mellon, tri-party agent, were various U.S. Government agency securities with various maturities to 3/1/48; valued at $1,750,777) 105,000 105,000
Wells Fargo Securities LLC, (1.84%, dated 4/30/18, due 5/1/18; proceeds $45,002; fully collateralized by various Common Stocks; valued at $47,250) 45,000 45,000
Wells Fargo Securities LLC, (2.67%, dated 3/21/18, due 6/13/18; proceeds $80,498; fully collateralized by various Corporate Bonds, 3.84% - 10.50% due 3/15/20 - 11/15/66; valued at $84,795) 80,000 80,000
Wells Fargo Securities LLC, (2.69%, dated 3/22/18,due 6/14/18; proceeds $80,502; fully collateralized by various Commercial Papers, 0.00% due 5/11/18 - 8/23/18 and Corporate Bonds, 5.88% - 10.25% due 3/15/20 - 2/15/28; valued at $84,457) 80,000 80,000
Total Repurchase Agreements (Cost $1,885,000) 1,885,000
Face Amount Value (000) (000)
Face Amount Value (000) (000)
International Banks (cont’d)Skandinaviska Enskida Banken AB,
1 Month USD LIBOR + 0.31% , 2.21%, 11/20/18 $110,000 $ 110,002Svenska Handelsbanken AB,
1 Month USD LIBOR + 0.17%, 2.07%, 8/24/18 143,000 142,9571 Month USD LIBOR + 0.18%, 2.08%, 8/24/18 70,000 69,9811 Month USD LIBOR + 0.23%, 2.13%, 11/19/18 35,000 34,985
Toronto Dominion Bank,1 Month USD LIBOR + 0.18%, 2.08%, 8/16/18 (b) 65,000 64,987
UBS AG London,3 Month USD LIBOR + 0.13%, 2.44%, 9/20/18 (b) 60,000 60,0583 Month USD LIBOR + 0.13%, 2.46%, 9/18/18 (b) 50,000 49,999
1,373,126
Total Floating Rate Notes (Cost $2,048,986) 2,049,169
Repurchase Agreements (33.1%)ABN Amro Securities LLC, (1.79%, dated 4/30/18,
due 5/1/18; proceeds $121,006; fully collateralized by various Corporate Bonds, 1.25% - 9.40% due 5/18/18 - 8/31/64 and U.S. Government agency securities, 3.43% - 5.25% due 9/15/39 - 5/15/53; valued at $127,078) 121,000 121,000
BMO Capital Markets Corp., (1.79%, dated 4/30/18, due 5/1/18; proceeds $30,001; fully collateralized by various Corporate Bonds, 1.63% - 5.50% due 4/8/19 - 12/15/32; valued at $31,500) 30,000 30,000
BMO Capital Markets Corp., (1.90%, dated 4/12/18, due 6/12/18; proceeds $85,274; fully collateralized by various Corporate Bonds, 1.25% - 9.13% due 1/15/19 - 1/15/42; valued at $89,250) (Demand 5/7/18) 85,000 85,000
BNP Paribas Prime Brokerage, Inc., (1.92%, dated 4/30/18, due 5/1/18; proceeds $193,010; fully collateralized by various Corporate Bonds, 3.88% - 12.75% due 11/15/18 - 4/1/45; valued at $204,591) 193,000 193,000
BNP Paribas Prime Brokerage, Inc., (2.46% (c), dated 1/25/18, due 10/25/18; proceeds $56,026; fully collateralized by various Corporate Bonds, 3.95% - 13.00% due 5/22/18 - 1/27/28 (d); valued at $59,153) (Demand 5/29/18) 55,000 55,000
Citigroup Global Markets, Inc., (1.84%, dated 4/30/18, due 5/1/18; proceeds $82,004; fully collateralized by various Common Stocks; valued at $86,100) 82,000 82,000
Credit Suisse Securities USA, (2.64% (c), dated 4/10/18, due 12/21/18; proceeds $40,748; fully collateralized by various Corporate Bonds, 4.50% - 9.88% due 10/15/21 - 11/15/66; valued at $42,403) (Demand 6/21/18) 40,000 40,000
HSBC Securities USA, Inc., (1.79%, dated 4/30/18, due 5/1/18; proceeds $48,002; fully collateralized by various Corporate Bonds, 2.90% - 7.11% due 9/15/20 - 11/15/46; valued at $50,404) 48,000 48,000
2018 Semi-Annual Report
April 30, 2018
Merrill Corp - MS ILF Semi-Annual Report [Funds] 04-30-2018 ED [AUX] | thunt | 21-Jun-18 10:25 | 18-13101-10.ca | Sequence: 5CHKSUM Content: 62361 Layout: 53646 Graphics: No Graphics CLEAN
JOB: 18-13101-10 CYCLE#;BL#: 5; 0 TRIM: 8.25" x 10.75" COMPOSITECOLORS: Black, ~note-color 2 GRAPHICS: none V1.5
11
Portfolio of Investments (unaudited) (cont’d)Prime Portfolio
The accompanying notes are an integral part of the financial statements.
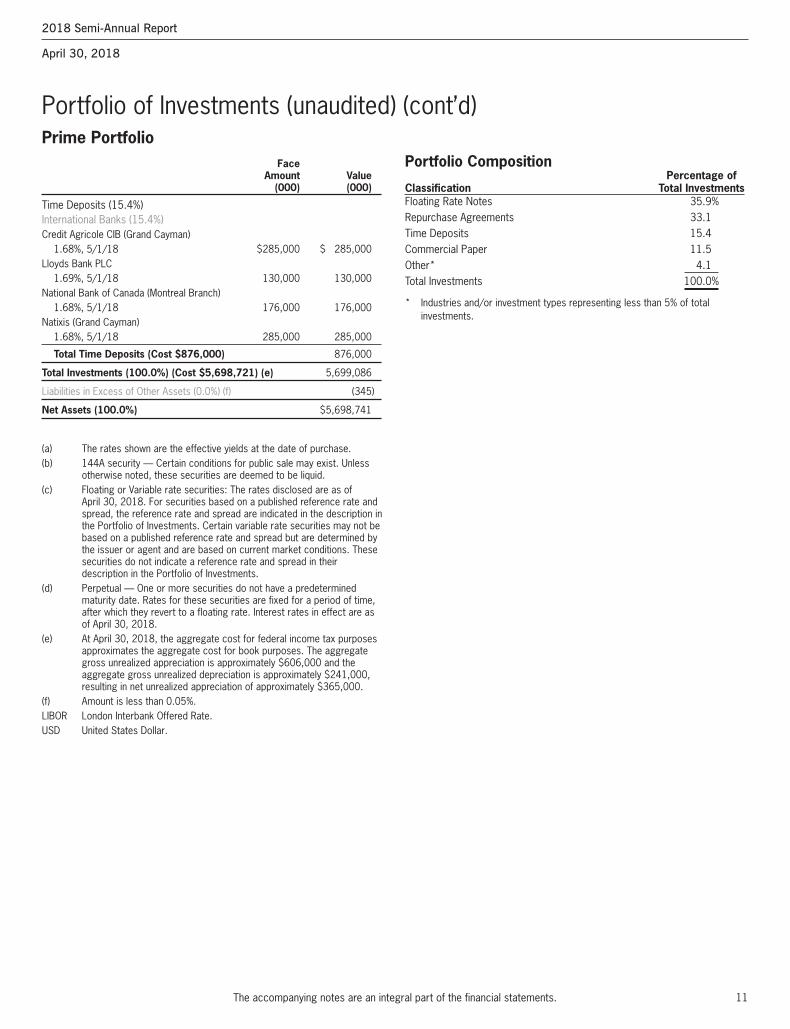
Portfolio Composition Percentage ofClassification Total InvestmentsFloating Rate Notes 35.9%Repurchase Agreements 33.1Time Deposits 15.4Commercial Paper 11.5Other* 4.1Total Investments 100.0%
* Industries and/or investment types representing less than 5% of totalinvestments.
Face Amount Value (000) (000)
Time Deposits (15.4%)International Banks (15.4%)Credit Agricole CIB (Grand Cayman)
1.68%, 5/1/18 $285,000 $ 285,000Lloyds Bank PLC
1.69%, 5/1/18 130,000 130,000National Bank of Canada (Montreal Branch)
1.68%, 5/1/18 176,000 176,000Natixis (Grand Cayman)
1.68%, 5/1/18 285,000 285,000
Total Time Deposits (Cost $876,000) 876,000
Total Investments (100.0%) (Cost $5,698,721) (e) 5,699,086
Liabilities in Excess of Other Assets (0.0%) (f) (345)
Net Assets (100.0%) $5,698,741
(a) The rates shown are the effective yields at the date of purchase.(b) 144A security — Certain conditions for public sale may exist. Unless
otherwise noted, these securities are deemed to be liquid.(c) Floating or Variable rate securities: The rates disclosed are as of
April 30, 2018. For securities based on a published reference rate andspread, the reference rate and spread are indicated in the description inthe Portfolio of Investments. Certain variable rate securities may not bebased on a published reference rate and spread but are determined bythe issuer or agent and are based on current market conditions. Thesesecurities do not indicate a reference rate and spread in theirdescription in the Portfolio of Investments.
(d) Perpetual — One or more securities do not have a predeterminedmaturity date. Rates for these securities are fixed for a period of time,after which they revert to a floating rate. Interest rates in effect are asof April 30, 2018.
(e) At April 30, 2018, the aggregate cost for federal income tax purposesapproximates the aggregate cost for book purposes. The aggregategross unrealized appreciation is approximately $606,000 and theaggregate gross unrealized depreciation is approximately $241,000,resulting in net unrealized appreciation of approximately $365,000.
(f) Amount is less than 0.05%.LIBOR London Interbank Offered Rate.USD United States Dollar.
2018 Semi-Annual Report
April 30, 2018
Merrill Corp - MS ILF Semi-Annual Report [Funds] 04-30-2018 ED [AUX] | thunt | 21-Jun-18 10:25 | 18-13101-10.ca | Sequence: 6CHKSUM Content: 9850 Layout: 64674 Graphics: No Graphics CLEAN
JOB: 18-13101-10 CYCLE#;BL#: 5; 0 TRIM: 8.25" x 10.75" COMPOSITECOLORS: Black, ~note-color 2 GRAPHICS: none V1.5
12
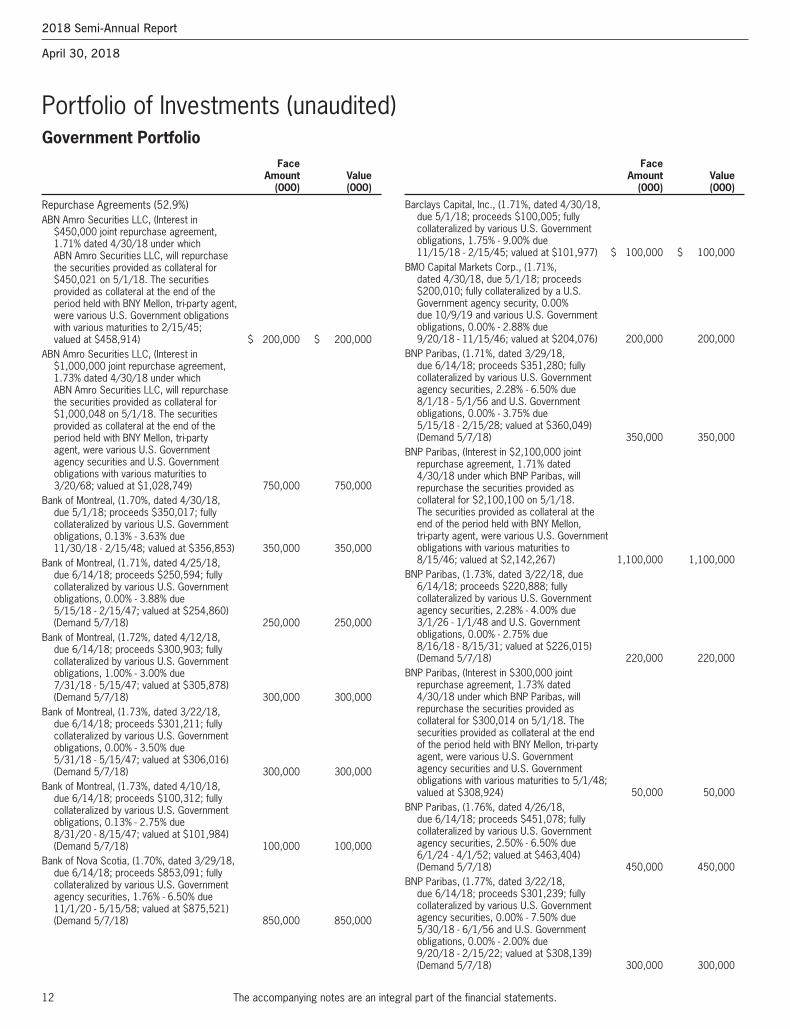
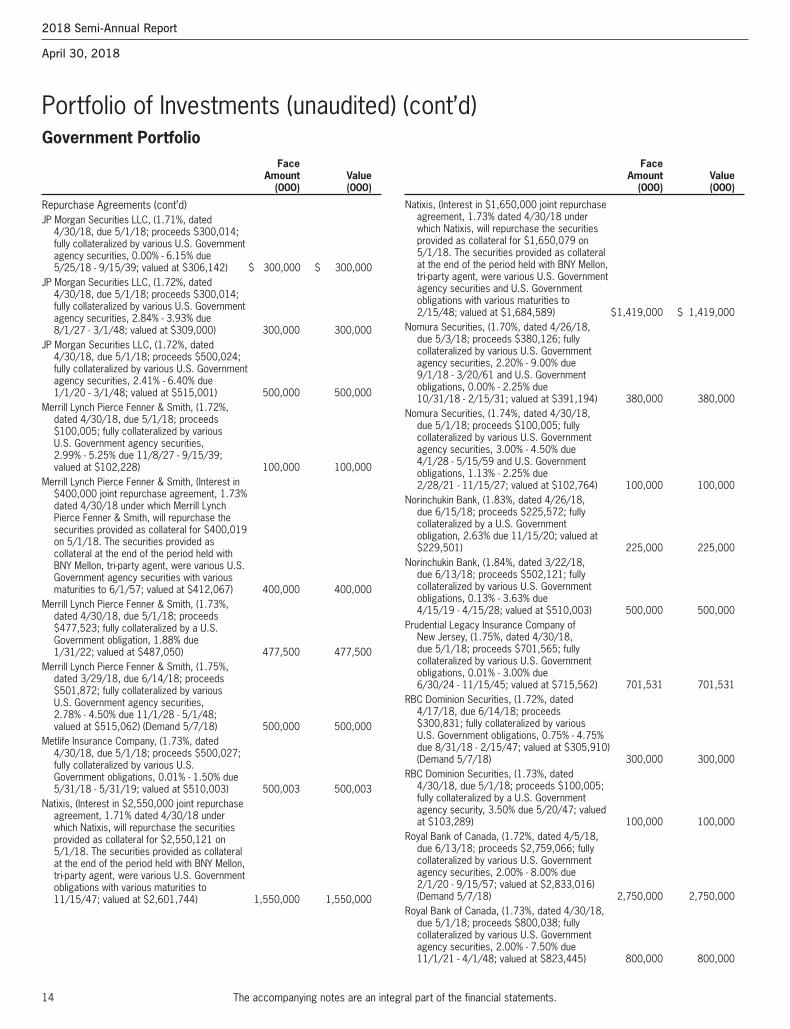
Barclays Capital, Inc., (1.71%, dated 4/30/18,due 5/1/18; proceeds $100,005; fullycollateralized by various U.S. Governmentobligations, 1.75% - 9.00% due 11/15/18 - 2/15/45; valued at $101,977) $ 100,000 $ 100,000
BMO Capital Markets Corp., (1.71%, dated 4/30/18, due 5/1/18; proceeds $200,010; fully collateralized by a U.S. Government agency security, 0.00%due 10/9/19 and various U.S. Governmentobligations, 0.00% - 2.88% due 9/20/18 - 11/15/46; valued at $204,076) 200,000 200,000
BNP Paribas, (1.71%, dated 3/29/18,due 6/14/18; proceeds $351,280; fullycollateralized by various U.S. Governmentagency securities, 2.28% - 6.50% due 8/1/18 - 5/1/56 and U.S. Governmentobligations, 0.00% - 3.75% due 5/15/18 - 2/15/28; valued at $360,049)(Demand 5/7/18) 350,000 350,000
BNP Paribas, (Interest in $2,100,000 joint repurchase agreement, 1.71% dated 4/30/18 under which BNP Paribas, will repurchase the securities provided as collateral for $2,100,100 on 5/1/18. The securities provided as collateral at the end of the period held with BNY Mellon, tri-party agent, were various U.S. Governmentobligations with various maturities to 8/15/46; valued at $2,142,267) 1,100,000 1,100,000
BNP Paribas, (1.73%, dated 3/22/18, due 6/14/18; proceeds $220,888; fullycollateralized by various U.S. Governmentagency securities, 2.28% - 4.00% due 3/1/26 - 1/1/48 and U.S. Governmentobligations, 0.00% - 2.75% due 8/16/18 - 8/15/31; valued at $226,015)(Demand 5/7/18) 220,000 220,000
BNP Paribas, (Interest in $300,000 joint repurchase agreement, 1.73% dated 4/30/18 under which BNP Paribas, will repurchase the securities provided as collateral for $300,014 on 5/1/18. The securities provided as collateral at the end of the period held with BNY Mellon, tri-party agent, were various U.S. Governmentagency securities and U.S. Governmentobligations with various maturities to 5/1/48; valued at $308,924) 50,000 50,000
BNP Paribas, (1.76%, dated 4/26/18,due 6/14/18; proceeds $451,078; fullycollateralized by various U.S. Governmentagency securities, 2.50% - 6.50% due 6/1/24 - 4/1/52; valued at $463,404)(Demand 5/7/18) 450,000 450,000
BNP Paribas, (1.77%, dated 3/22/18,due 6/14/18; proceeds $301,239; fullycollateralized by various U.S. Governmentagency securities, 0.00% - 7.50% due 5/30/18 - 6/1/56 and U.S. Governmentobligations, 0.00% - 2.00% due 9/20/18 - 2/15/22; valued at $308,139)(Demand 5/7/18) 300,000 300,000
Portfolio of Investments (unaudited)Government Portfolio Face Amount Value (000) (000)
Face Amount Value (000) (000)
Repurchase Agreements (52.9%)ABN Amro Securities LLC, (Interest in
$450,000 joint repurchase agreement, 1.71% dated 4/30/18 under which ABN Amro Securities LLC, will repurchase the securities provided as collateral for $450,021 on 5/1/18. The securities provided as collateral at the end of the period held with BNY Mellon, tri-party agent, were various U.S. Government obligations with various maturities to 2/15/45; valued at $458,914) $ 200,000 $ 200,000
ABN Amro Securities LLC, (Interest in $1,000,000 joint repurchase agreement, 1.73% dated 4/30/18 under which ABN Amro Securities LLC, will repurchase the securities provided as collateral for $1,000,048 on 5/1/18. The securities provided as collateral at the end of the period held with BNY Mellon, tri-party agent, were various U.S. Government agency securities and U.S. Government obligations with various maturities to 3/20/68; valued at $1,028,749) 750,000 750,000
Bank of Montreal, (1.70%, dated 4/30/18, due 5/1/18; proceeds $350,017; fully collateralized by various U.S. Government obligations, 0.13% - 3.63% due 11/30/18 - 2/15/48; valued at $356,853) 350,000 350,000
Bank of Montreal, (1.71%, dated 4/25/18, due 6/14/18; proceeds $250,594; fully collateralized by various U.S. Government obligations, 0.00% - 3.88% due 5/15/18 - 2/15/47; valued at $254,860) (Demand 5/7/18) 250,000 250,000
Bank of Montreal, (1.72%, dated 4/12/18,due 6/14/18; proceeds $300,903; fullycollateralized by various U.S. Governmentobligations, 1.00% - 3.00% due 7/31/18 - 5/15/47; valued at $305,878)(Demand 5/7/18) 300,000 300,000
Bank of Montreal, (1.73%, dated 3/22/18,due 6/14/18; proceeds $301,211; fullycollateralized by various U.S. Governmentobligations, 0.00% - 3.50% due 5/31/18 - 5/15/47; valued at $306,016)(Demand 5/7/18) 300,000 300,000
Bank of Montreal, (1.73%, dated 4/10/18,due 6/14/18; proceeds $100,312; fullycollateralized by various U.S. Governmentobligations, 0.13% - 2.75% due 8/31/20 - 8/15/47; valued at $101,984)(Demand 5/7/18) 100,000 100,000
Bank of Nova Scotia, (1.70%, dated 3/29/18,due 6/14/18; proceeds $853,091; fullycollateralized by various U.S. Governmentagency securities, 1.76% - 6.50% due 11/1/20 - 5/15/58; valued at $875,521)(Demand 5/7/18) 850,000 850,000
The accompanying notes are an integral part of the financial statements.
2018 Semi-Annual Report
April 30, 2018
Merrill Corp - MS ILF Semi-Annual Report [Funds] 04-30-2018 ED [AUX] | thunt | 21-Jun-18 10:25 | 18-13101-10.cc | Sequence: 1CHKSUM Content: 1363 Layout: 11812 Graphics: No Graphics CLEAN
JOB: 18-13101-10 CYCLE#;BL#: 5; 0 TRIM: 8.25" x 10.75" COMPOSITECOLORS: Black, ~note-color 2 GRAPHICS: none V1.5
13
Portfolio of Investments (unaudited) (cont’d)Government Portfolio
The accompanying notes are an integral part of the financial statements.
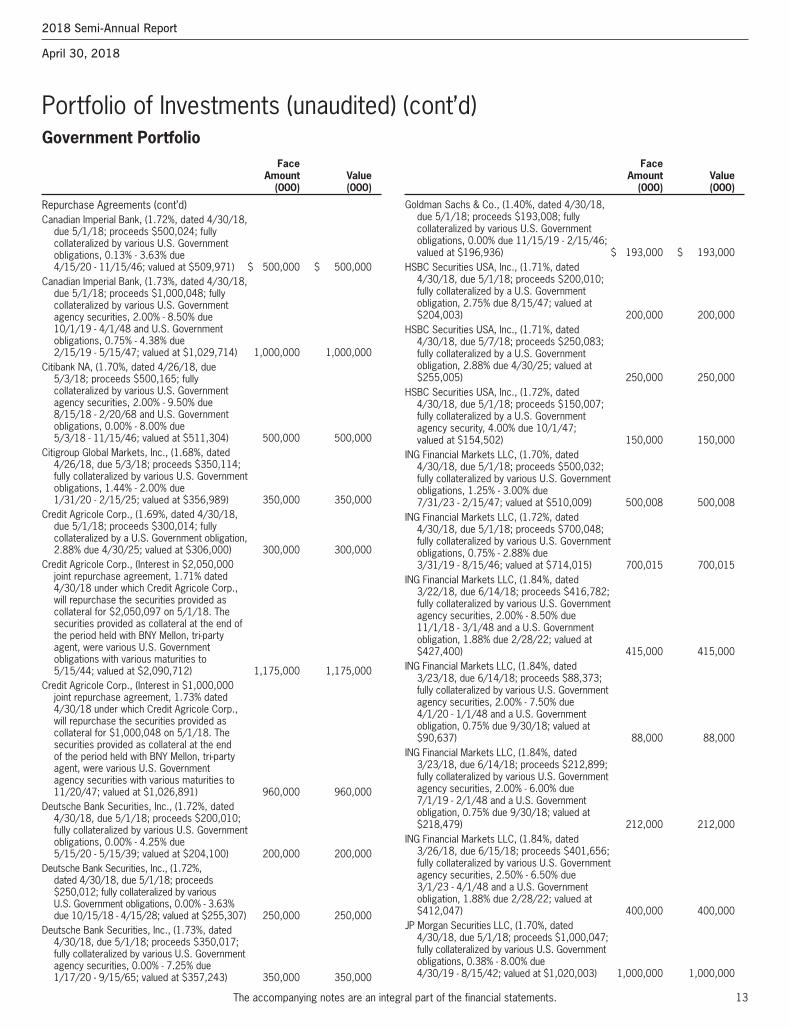
Goldman Sachs & Co., (1.40%, dated 4/30/18, due 5/1/18; proceeds $193,008; fully collateralized by various U.S. Government obligations, 0.00% due 11/15/19 - 2/15/46; valued at $196,936) $ 193,000 $ 193,000
HSBC Securities USA, Inc., (1.71%, dated 4/30/18, due 5/1/18; proceeds $200,010; fully collateralized by a U.S. Government obligation, 2.75% due 8/15/47; valued at $204,003) 200,000 200,000
HSBC Securities USA, Inc., (1.71%, dated 4/30/18, due 5/7/18; proceeds $250,083; fully collateralized by a U.S. Government obligation, 2.88% due 4/30/25; valued at $255,005) 250,000 250,000
HSBC Securities USA, Inc., (1.72%, dated 4/30/18, due 5/1/18; proceeds $150,007; fully collateralized by a U.S. Governmentagency security, 4.00% due 10/1/47; valued at $154,502) 150,000 150,000
ING Financial Markets LLC, (1.70%, dated 4/30/18, due 5/1/18; proceeds $500,032; fully collateralized by various U.S. Governmentobligations, 1.25% - 3.00% due 7/31/23 - 2/15/47; valued at $510,009) 500,008 500,008
ING Financial Markets LLC, (1.72%, dated 4/30/18, due 5/1/18; proceeds $700,048; fully collateralized by various U.S. Governmentobligations, 0.75% - 2.88% due 3/31/19 - 8/15/46; valued at $714,015) 700,015 700,015
ING Financial Markets LLC, (1.84%, dated 3/22/18, due 6/14/18; proceeds $416,782; fully collateralized by various U.S. Governmentagency securities, 2.00% - 8.50% due 11/1/18 - 3/1/48 and a U.S. Government obligation, 1.88% due 2/28/22; valued at $427,400) 415,000 415,000
ING Financial Markets LLC, (1.84%, dated 3/23/18, due 6/14/18; proceeds $88,373; fully collateralized by various U.S. Governmentagency securities, 2.00% - 7.50% due 4/1/20 - 1/1/48 and a U.S. Government obligation, 0.75% due 9/30/18; valued at $90,637) 88,000 88,000
ING Financial Markets LLC, (1.84%, dated 3/23/18, due 6/14/18; proceeds $212,899; fully collateralized by various U.S. Governmentagency securities, 2.00% - 6.00% due 7/1/19 - 2/1/48 and a U.S. Government obligation, 0.75% due 9/30/18; valued at $218,479) 212,000 212,000
ING Financial Markets LLC, (1.84%, dated 3/26/18, due 6/15/18; proceeds $401,656; fully collateralized by various U.S. Governmentagency securities, 2.50% - 6.50% due 3/1/23 - 4/1/48 and a U.S. Government obligation, 1.88% due 2/28/22; valued at $412,047) 400,000 400,000
JP Morgan Securities LLC, (1.70%, dated 4/30/18, due 5/1/18; proceeds $1,000,047; fully collateralized by various U.S. Governmentobligations, 0.38% - 8.00% due 4/30/19 - 8/15/42; valued at $1,020,003) 1,000,000 1,000,000
Face Amount Value (000) (000)
Face Amount Value (000) (000)
Repurchase Agreements (cont’d)Canadian Imperial Bank, (1.72%, dated 4/30/18,
due 5/1/18; proceeds $500,024; fullycollateralized by various U.S. Governmentobligations, 0.13% - 3.63% due 4/15/20 - 11/15/46; valued at $509,971) $ 500,000 $ 500,000
Canadian Imperial Bank, (1.73%, dated 4/30/18,due 5/1/18; proceeds $1,000,048; fullycollateralized by various U.S. Governmentagency securities, 2.00% - 8.50% due 10/1/19 - 4/1/48 and U.S. Governmentobligations, 0.75% - 4.38% due 2/15/19 - 5/15/47; valued at $1,029,714) 1,000,000 1,000,000
Citibank NA, (1.70%, dated 4/26/18, due 5/3/18; proceeds $500,165; fullycollateralized by various U.S. Governmentagency securities, 2.00% - 9.50% due 8/15/18 - 2/20/68 and U.S. Governmentobligations, 0.00% - 8.00% due 5/3/18 - 11/15/46; valued at $511,304) 500,000 500,000
Citigroup Global Markets, Inc., (1.68%, dated 4/26/18, due 5/3/18; proceeds $350,114; fully collateralized by various U.S. Governmentobligations, 1.44% - 2.00% due 1/31/20 - 2/15/25; valued at $356,989) 350,000 350,000
Credit Agricole Corp., (1.69%, dated 4/30/18,due 5/1/18; proceeds $300,014; fullycollateralized by a U.S. Government obligation, 2.88% due 4/30/25; valued at $306,000) 300,000 300,000
Credit Agricole Corp., (Interest in $2,050,000 joint repurchase agreement, 1.71% dated 4/30/18 under which Credit Agricole Corp., will repurchase the securities provided as collateral for $2,050,097 on 5/1/18. The securities provided as collateral at the end of the period held with BNY Mellon, tri-party agent, were various U.S. Governmentobligations with various maturities to 5/15/44; valued at $2,090,712) 1,175,000 1,175,000
Credit Agricole Corp., (Interest in $1,000,000 joint repurchase agreement, 1.73% dated 4/30/18 under which Credit Agricole Corp., will repurchase the securities provided as collateral for $1,000,048 on 5/1/18. The securities provided as collateral at the end of the period held with BNY Mellon, tri-party agent, were various U.S. Governmentagency securities with various maturities to 11/20/47; valued at $1,026,891) 960,000 960,000
Deutsche Bank Securities, Inc., (1.72%, dated 4/30/18, due 5/1/18; proceeds $200,010; fully collateralized by various U.S. Governmentobligations, 0.00% - 4.25% due 5/15/20 - 5/15/39; valued at $204,100) 200,000 200,000
Deutsche Bank Securities, Inc., (1.72%, dated 4/30/18, due 5/1/18; proceeds $250,012; fully collateralized by various U.S. Government obligations, 0.00% - 3.63%due 10/15/18 - 4/15/28; valued at $255,307) 250,000 250,000
Deutsche Bank Securities, Inc., (1.73%, dated 4/30/18, due 5/1/18; proceeds $350,017; fully collateralized by various U.S. Governmentagency securities, 0.00% - 7.25% due 1/17/20 - 9/15/65; valued at $357,243) 350,000 350,000
2018 Semi-Annual Report
April 30, 2018
Merrill Corp - MS ILF Semi-Annual Report [Funds] 04-30-2018 ED [AUX] | thunt | 21-Jun-18 10:25 | 18-13101-10.cc | Sequence: 2CHKSUM Content: 2247 Layout: 10475 Graphics: No Graphics CLEAN
JOB: 18-13101-10 CYCLE#;BL#: 5; 0 TRIM: 8.25" x 10.75" COMPOSITECOLORS: Black, ~note-color 2 GRAPHICS: none V1.5
14
Portfolio of Investments (unaudited) (cont’d)Government Portfolio
The accompanying notes are an integral part of the financial statements.
Natixis, (Interest in $1,650,000 joint repurchase agreement, 1.73% dated 4/30/18 under which Natixis, will repurchase the securities provided as collateral for $1,650,079 on 5/1/18. The securities provided as collateral at the end of the period held with BNY Mellon, tri-party agent, were various U.S. Governmentagency securities and U.S. Governmentobligations with various maturities to 2/15/48; valued at $1,684,589) $1,419,000 $ 1,419,000
Nomura Securities, (1.70%, dated 4/26/18,due 5/3/18; proceeds $380,126; fullycollateralized by various U.S. Governmentagency securities, 2.20% - 9.00% due 9/1/18 - 3/20/61 and U.S. Governmentobligations, 0.00% - 2.25% due 10/31/18 - 2/15/31; valued at $391,194) 380,000 380,000
Nomura Securities, (1.74%, dated 4/30/18,due 5/1/18; proceeds $100,005; fullycollateralized by various U.S. Governmentagency securities, 3.00% - 4.50% due 4/1/28 - 5/15/59 and U.S. Governmentobligations, 1.13% - 2.25% due 2/28/21 - 11/15/27; valued at $102,764) 100,000 100,000
Norinchukin Bank, (1.83%, dated 4/26/18,due 6/15/18; proceeds $225,572; fullycollateralized by a U.S. Government obligation, 2.63% due 11/15/20; valued at $229,501) 225,000 225,000
Norinchukin Bank, (1.84%, dated 3/22/18,due 6/13/18; proceeds $502,121; fullycollateralized by various U.S. Governmentobligations, 0.13% - 3.63% due 4/15/19 - 4/15/28; valued at $510,003) 500,000 500,000
Prudential Legacy Insurance Company of New Jersey, (1.75%, dated 4/30/18,due 5/1/18; proceeds $701,565; fullycollateralized by various U.S. Governmentobligations, 0.01% - 3.00% due 6/30/24 - 11/15/45; valued at $715,562) 701,531 701,531
RBC Dominion Securities, (1.72%, dated 4/17/18, due 6/14/18; proceeds $300,831; fully collateralized by various U.S. Government obligations, 0.75% - 4.75%due 8/31/18 - 2/15/47; valued at $305,910)(Demand 5/7/18) 300,000 300,000
RBC Dominion Securities, (1.73%, dated 4/30/18, due 5/1/18; proceeds $100,005; fully collateralized by a U.S. Governmentagency security, 3.50% due 5/20/47; valued at $103,289) 100,000 100,000
Royal Bank of Canada, (1.72%, dated 4/5/18,due 6/13/18; proceeds $2,759,066; fullycollateralized by various U.S. Governmentagency securities, 2.00% - 8.00% due 2/1/20 - 9/15/57; valued at $2,833,016)(Demand 5/7/18) 2,750,000 2,750,000
Royal Bank of Canada, (1.73%, dated 4/30/18,due 5/1/18; proceeds $800,038; fullycollateralized by various U.S. Governmentagency securities, 2.00% - 7.50% due 11/1/21 - 4/1/48; valued at $823,445) 800,000 800,000
Face Amount Value (000) (000)
Face Amount Value (000) (000)
Repurchase Agreements (cont’d)JP Morgan Securities LLC, (1.71%, dated
4/30/18, due 5/1/18; proceeds $300,014; fully collateralized by various U.S. Governmentagency securities, 0.00% - 6.15% due 5/25/18 - 9/15/39; valued at $306,142) $ 300,000 $ 300,000
JP Morgan Securities LLC, (1.72%, dated 4/30/18, due 5/1/18; proceeds $300,014; fully collateralized by various U.S. Governmentagency securities, 2.84% - 3.93% due 8/1/27 - 3/1/48; valued at $309,000) 300,000 300,000
JP Morgan Securities LLC, (1.72%, dated 4/30/18, due 5/1/18; proceeds $500,024; fully collateralized by various U.S. Governmentagency securities, 2.41% - 6.40% due 1/1/20 - 3/1/48; valued at $515,001) 500,000 500,000
Merrill Lynch Pierce Fenner & Smith, (1.72%, dated 4/30/18, due 5/1/18; proceeds $100,005; fully collateralized by various U.S. Government agency securities, 2.99% - 5.25% due 11/8/27 - 9/15/39; valued at $102,228) 100,000 100,000
Merrill Lynch Pierce Fenner & Smith, (Interest in $400,000 joint repurchase agreement, 1.73% dated 4/30/18 under which Merrill Lynch Pierce Fenner & Smith, will repurchase the securities provided as collateral for $400,019 on 5/1/18. The securities provided as collateral at the end of the period held with BNY Mellon, tri-party agent, were various U.S. Government agency securities with various maturities to 6/1/57; valued at $412,067) 400,000 400,000
Merrill Lynch Pierce Fenner & Smith, (1.73%, dated 4/30/18, due 5/1/18; proceeds $477,523; fully collateralized by a U.S. Government obligation, 1.88% due 1/31/22; valued at $487,050) 477,500 477,500
Merrill Lynch Pierce Fenner & Smith, (1.75%, dated 3/29/18, due 6/14/18; proceeds $501,872; fully collateralized by various U.S. Government agency securities, 2.78% - 4.50% due 11/1/28 - 5/1/48; valued at $515,062) (Demand 5/7/18) 500,000 500,000
Metlife Insurance Company, (1.73%, dated 4/30/18, due 5/1/18; proceeds $500,027; fully collateralized by various U.S. Government obligations, 0.01% - 1.50% due 5/31/18 - 5/31/19; valued at $510,003) 500,003 500,003
Natixis, (Interest in $2,550,000 joint repurchase agreement, 1.71% dated 4/30/18 under which Natixis, will repurchase the securities provided as collateral for $2,550,121 on 5/1/18. The securities provided as collateral at the end of the period held with BNY Mellon, tri-party agent, were various U.S. Governmentobligations with various maturities to 11/15/47; valued at $2,601,744) 1,550,000 1,550,000
2018 Semi-Annual Report
April 30, 2018
Merrill Corp - MS ILF Semi-Annual Report [Funds] 04-30-2018 ED [AUX] | thunt | 21-Jun-18 10:25 | 18-13101-10.cc | Sequence: 3CHKSUM Content: 36387 Layout: 47241 Graphics: No Graphics CLEAN
JOB: 18-13101-10 CYCLE#;BL#: 5; 0 TRIM: 8.25" x 10.75" COMPOSITECOLORS: Black, ~note-color 2 GRAPHICS: none V1.5
15
Portfolio of Investments (unaudited) (cont’d)Government Portfolio
The accompanying notes are an integral part of the financial statements.
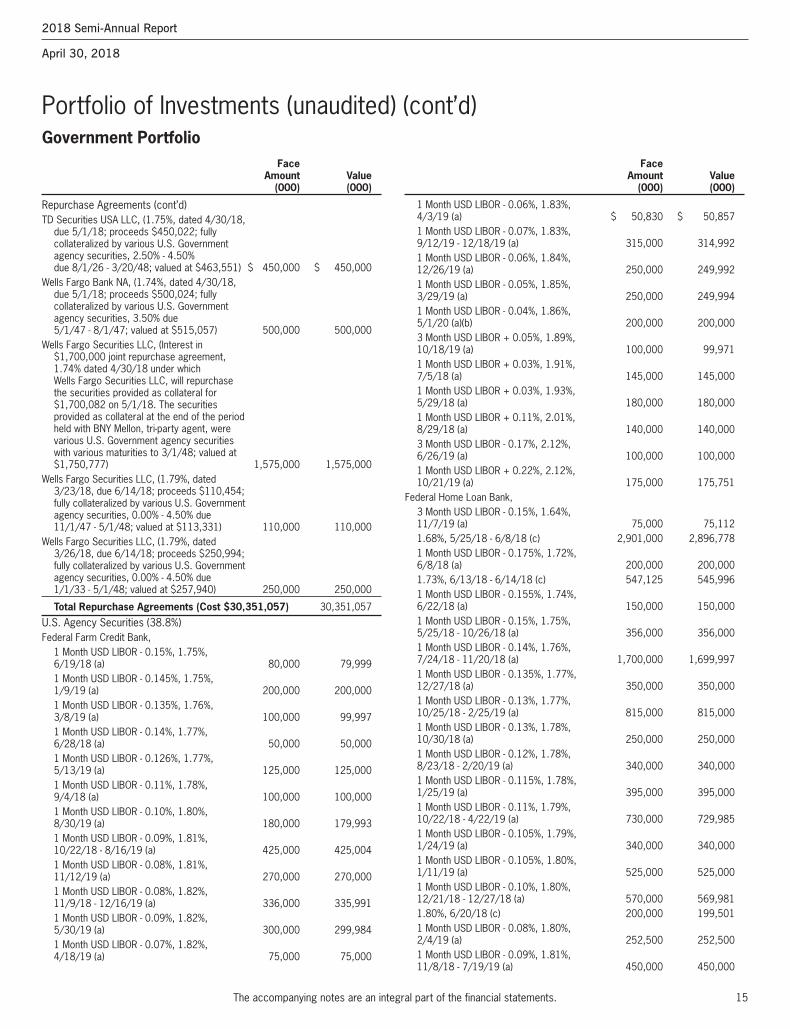
1 Month USD LIBOR - 0.06%, 1.83%, 4/3/19 (a) $ 50,830 $ 50,8571 Month USD LIBOR - 0.07%, 1.83%, 9/12/19 - 12/18/19 (a) 315,000 314,9921 Month USD LIBOR - 0.06%, 1.84%, 12/26/19 (a) 250,000 249,9921 Month USD LIBOR - 0.05%, 1.85%, 3/29/19 (a) 250,000 249,9941 Month USD LIBOR - 0.04%, 1.86%, 5/1/20 (a)(b) 200,000 200,0003 Month USD LIBOR + 0.05%, 1.89%, 10/18/19 (a) 100,000 99,9711 Month USD LIBOR + 0.03%, 1.91%, 7/5/18 (a) 145,000 145,0001 Month USD LIBOR + 0.03%, 1.93%, 5/29/18 (a) 180,000 180,0001 Month USD LIBOR + 0.11%, 2.01%, 8/29/18 (a) 140,000 140,0003 Month USD LIBOR - 0.17%, 2.12%, 6/26/19 (a) 100,000 100,0001 Month USD LIBOR + 0.22%, 2.12%, 10/21/19 (a) 175,000 175,751
Federal Home Loan Bank,3 Month USD LIBOR - 0.15%, 1.64%, 11/7/19 (a) 75,000 75,1121.68%, 5/25/18 - 6/8/18 (c) 2,901,000 2,896,7781 Month USD LIBOR - 0.175%, 1.72%, 6/8/18 (a) 200,000 200,0001.73%, 6/13/18 - 6/14/18 (c) 547,125 545,9961 Month USD LIBOR - 0.155%, 1.74%, 6/22/18 (a) 150,000 150,0001 Month USD LIBOR - 0.15%, 1.75%, 5/25/18 - 10/26/18 (a) 356,000 356,0001 Month USD LIBOR - 0.14%, 1.76%, 7/24/18 - 11/20/18 (a) 1,700,000 1,699,9971 Month USD LIBOR - 0.135%, 1.77%, 12/27/18 (a) 350,000 350,0001 Month USD LIBOR - 0.13%, 1.77%, 10/25/18 - 2/25/19 (a) 815,000 815,0001 Month USD LIBOR - 0.13%, 1.78%, 10/30/18 (a) 250,000 250,0001 Month USD LIBOR - 0.12%, 1.78%, 8/23/18 - 2/20/19 (a) 340,000 340,0001 Month USD LIBOR - 0.115%, 1.78%, 1/25/19 (a) 395,000 395,0001 Month USD LIBOR - 0.11%, 1.79%, 10/22/18 - 4/22/19 (a) 730,000 729,9851 Month USD LIBOR - 0.105%, 1.79%, 1/24/19 (a) 340,000 340,0001 Month USD LIBOR - 0.105%, 1.80%, 1/11/19 (a) 525,000 525,0001 Month USD LIBOR - 0.10%, 1.80%, 12/21/18 - 12/27/18 (a) 570,000 569,9811.80%, 6/20/18 (c) 200,000 199,5011 Month USD LIBOR - 0.08%, 1.80%, 2/4/19 (a) 252,500 252,5001 Month USD LIBOR - 0.09%, 1.81%, 11/8/18 - 7/19/19 (a) 450,000 450,000
Face Amount Value (000) (000)
Face Amount Value (000) (000)
Repurchase Agreements (cont’d)TD Securities USA LLC, (1.75%, dated 4/30/18,
due 5/1/18; proceeds $450,022; fullycollateralized by various U.S. Governmentagency securities, 2.50% - 4.50%due 8/1/26 - 3/20/48; valued at $463,551) $ 450,000 $ 450,000
Wells Fargo Bank NA, (1.74%, dated 4/30/18,due 5/1/18; proceeds $500,024; fullycollateralized by various U.S. Governmentagency securities, 3.50% due 5/1/47 - 8/1/47; valued at $515,057) 500,000 500,000
Wells Fargo Securities LLC, (Interest in $1,700,000 joint repurchase agreement, 1.74% dated 4/30/18 under which Wells Fargo Securities LLC, will repurchase the securities provided as collateral for $1,700,082 on 5/1/18. The securities provided as collateral at the end of the period held with BNY Mellon, tri-party agent, were various U.S. Government agency securities with various maturities to 3/1/48; valued at $1,750,777) 1,575,000 1,575,000
Wells Fargo Securities LLC, (1.79%, dated 3/23/18, due 6/14/18; proceeds $110,454; fully collateralized by various U.S. Governmentagency securities, 0.00% - 4.50% due 11/1/47 - 5/1/48; valued at $113,331) 110,000 110,000
Wells Fargo Securities LLC, (1.79%, dated 3/26/18, due 6/14/18; proceeds $250,994; fully collateralized by various U.S. Governmentagency securities, 0.00% - 4.50% due 1/1/33 - 5/1/48; valued at $257,940) 250,000 250,000
Total Repurchase Agreements (Cost $30,351,057) 30,351,057
U.S. Agency Securities (38.8%)Federal Farm Credit Bank,
1 Month USD LIBOR - 0.15%, 1.75%, 6/19/18 (a) 80,000 79,9991 Month USD LIBOR - 0.145%, 1.75%, 1/9/19 (a) 200,000 200,0001 Month USD LIBOR - 0.135%, 1.76%, 3/8/19 (a) 100,000 99,9971 Month USD LIBOR - 0.14%, 1.77%, 6/28/18 (a) 50,000 50,0001 Month USD LIBOR - 0.126%, 1.77%, 5/13/19 (a) 125,000 125,0001 Month USD LIBOR - 0.11%, 1.78%, 9/4/18 (a) 100,000 100,0001 Month USD LIBOR - 0.10%, 1.80%, 8/30/19 (a) 180,000 179,9931 Month USD LIBOR - 0.09%, 1.81%, 10/22/18 - 8/16/19 (a) 425,000 425,0041 Month USD LIBOR - 0.08%, 1.81%, 11/12/19 (a) 270,000 270,0001 Month USD LIBOR - 0.08%, 1.82%, 11/9/18 - 12/16/19 (a) 336,000 335,9911 Month USD LIBOR - 0.09%, 1.82%, 5/30/19 (a) 300,000 299,9841 Month USD LIBOR - 0.07%, 1.82%, 4/18/19 (a) 75,000 75,000
2018 Semi-Annual Report
April 30, 2018
Merrill Corp - MS ILF Semi-Annual Report [Funds] 04-30-2018 ED [AUX] | thunt | 21-Jun-18 10:25 | 18-13101-10.cc | Sequence: 4CHKSUM Content: 21233 Layout: 24141 Graphics: No Graphics CLEAN
JOB: 18-13101-10 CYCLE#;BL#: 5; 0 TRIM: 8.25" x 10.75" COMPOSITECOLORS: Black, ~note-color 2 GRAPHICS: none V1.5
16
Portfolio of Investments (unaudited) (cont’d)Government Portfolio
The accompanying notes are an integral part of the financial statements.
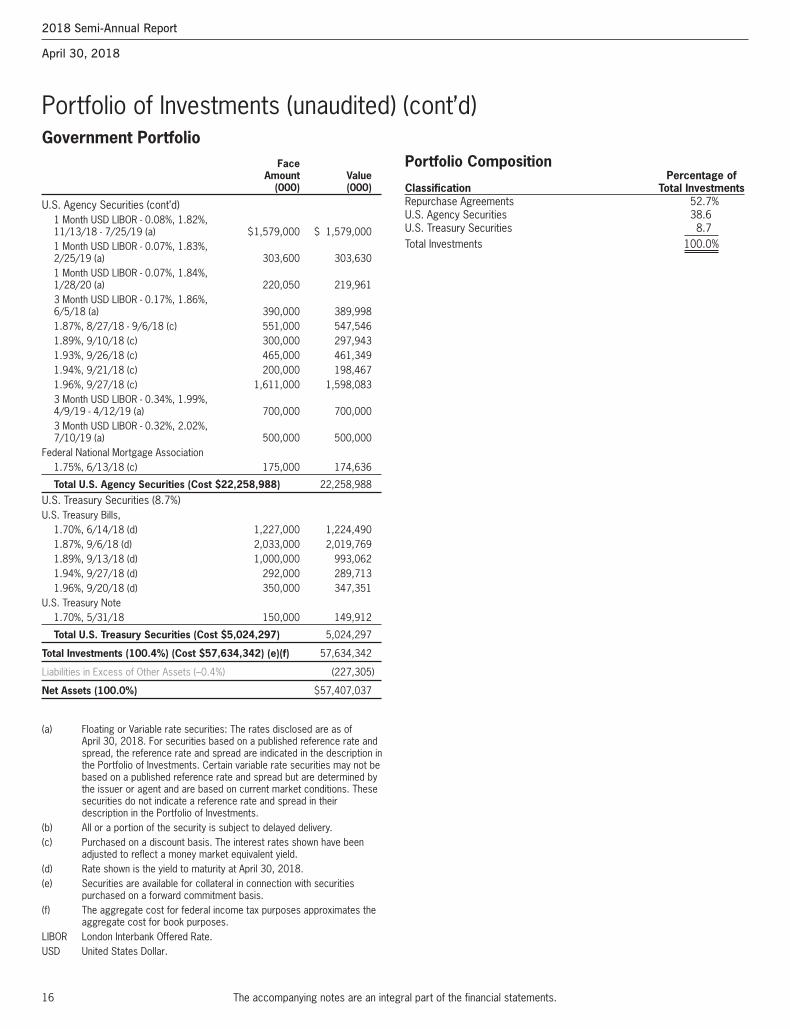
Portfolio Composition Percentage ofClassification Total InvestmentsRepurchase Agreements 52.7%U.S. Agency Securities 38.6U.S. Treasury Securities 8.7Total Investments 100.0%
Face Amount Value (000) (000)
U.S. Agency Securities (cont’d)1 Month USD LIBOR - 0.08%, 1.82%, 11/13/18 - 7/25/19 (a) $1,579,000 $ 1,579,0001 Month USD LIBOR - 0.07%, 1.83%, 2/25/19 (a) 303,600 303,6301 Month USD LIBOR - 0.07%, 1.84%, 1/28/20 (a) 220,050 219,9613 Month USD LIBOR - 0.17%, 1.86%, 6/5/18 (a) 390,000 389,9981.87%, 8/27/18 - 9/6/18 (c) 551,000 547,5461.89%, 9/10/18 (c) 300,000 297,9431.93%, 9/26/18 (c) 465,000 461,3491.94%, 9/21/18 (c) 200,000 198,4671.96%, 9/27/18 (c) 1,611,000 1,598,0833 Month USD LIBOR - 0.34%, 1.99%, 4/9/19 - 4/12/19 (a) 700,000 700,0003 Month USD LIBOR - 0.32%, 2.02%, 7/10/19 (a) 500,000 500,000
Federal National Mortgage Association1.75%, 6/13/18 (c) 175,000 174,636
Total U.S. Agency Securities (Cost $22,258,988) 22,258,988
U.S. Treasury Securities (8.7%)U.S. Treasury Bills,
1.70%, 6/14/18 (d) 1,227,000 1,224,4901.87%, 9/6/18 (d) 2,033,000 2,019,7691.89%, 9/13/18 (d) 1,000,000 993,0621.94%, 9/27/18 (d) 292,000 289,7131.96%, 9/20/18 (d) 350,000 347,351
U.S. Treasury Note1.70%, 5/31/18 150,000 149,912
Total U.S. Treasury Securities (Cost $5,024,297) 5,024,297
Total Investments (100.4%) (Cost $57,634,342) (e)(f) 57,634,342
Liabilities in Excess of Other Assets (–0.4%) (227,305)
Net Assets (100.0%) $57,407,037
(a) Floating or Variable rate securities: The rates disclosed are as ofApril 30, 2018. For securities based on a published reference rate andspread, the reference rate and spread are indicated in the description inthe Portfolio of Investments. Certain variable rate securities may not bebased on a published reference rate and spread but are determined bythe issuer or agent and are based on current market conditions. Thesesecurities do not indicate a reference rate and spread in theirdescription in the Portfolio of Investments.
(b) All or a portion of the security is subject to delayed delivery.(c) Purchased on a discount basis. The interest rates shown have been
adjusted to reflect a money market equivalent yield.(d) Rate shown is the yield to maturity at April 30, 2018.(e) Securities are available for collateral in connection with securities
purchased on a forward commitment basis.(f) The aggregate cost for federal income tax purposes approximates the
aggregate cost for book purposes.LIBOR London Interbank Offered Rate.USD United States Dollar.
2018 Semi-Annual Report
April 30, 2018
Merrill Corp - MS ILF Semi-Annual Report [Funds] 04-30-2018 ED [AUX] | thunt | 21-Jun-18 10:25 | 18-13101-10.cc | Sequence: 5CHKSUM Content: 9406 Layout: 56052 Graphics: No Graphics CLEAN
JOB: 18-13101-10 CYCLE#;BL#: 5; 0 TRIM: 8.25" x 10.75" COMPOSITECOLORS: Black, ~note-color 2 GRAPHICS: none V1.5
17
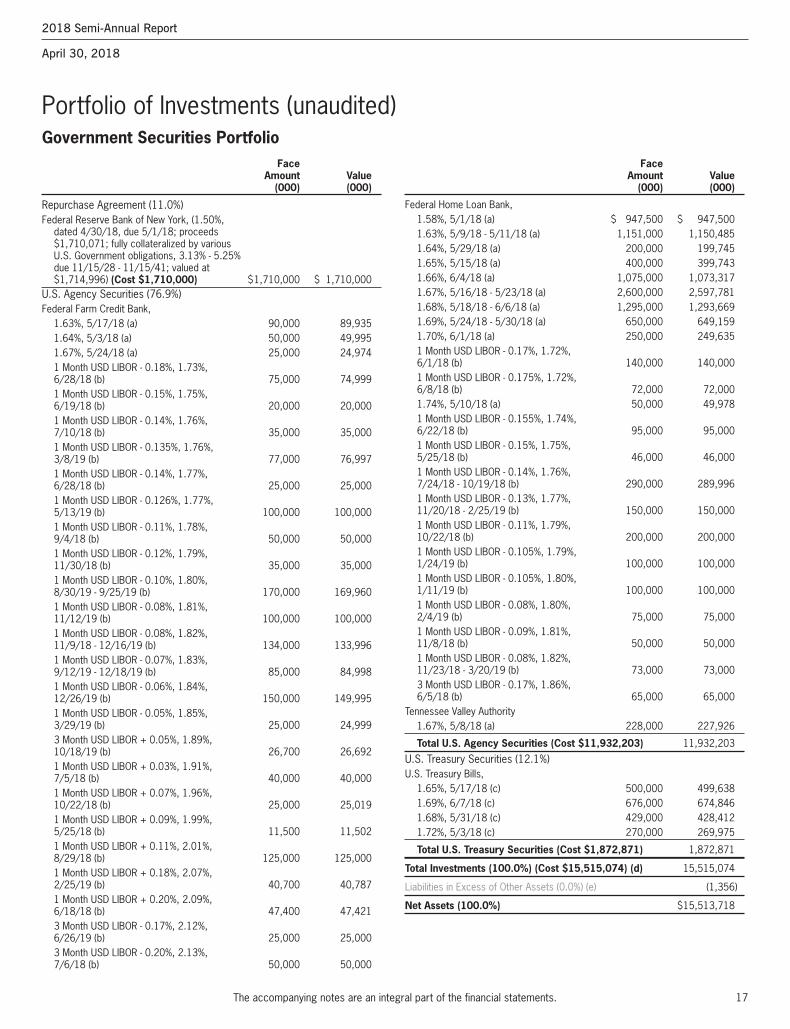
Federal Home Loan Bank,1.58%, 5/1/18 (a) $ 947,500 $ 947,5001.63%, 5/9/18 - 5/11/18 (a) 1,151,000 1,150,4851.64%, 5/29/18 (a) 200,000 199,7451.65%, 5/15/18 (a) 400,000 399,7431.66%, 6/4/18 (a) 1,075,000 1,073,3171.67%, 5/16/18 - 5/23/18 (a) 2,600,000 2,597,7811.68%, 5/18/18 - 6/6/18 (a) 1,295,000 1,293,6691.69%, 5/24/18 - 5/30/18 (a) 650,000 649,1591.70%, 6/1/18 (a) 250,000 249,6351 Month USD LIBOR - 0.17%, 1.72%,6/1/18 (b) 140,000 140,0001 Month USD LIBOR - 0.175%, 1.72%,6/8/18 (b) 72,000 72,0001.74%, 5/10/18 (a) 50,000 49,9781 Month USD LIBOR - 0.155%, 1.74%,6/22/18 (b) 95,000 95,0001 Month USD LIBOR - 0.15%, 1.75%,5/25/18 (b) 46,000 46,0001 Month USD LIBOR - 0.14%, 1.76%,7/24/18 - 10/19/18 (b) 290,000 289,9961 Month USD LIBOR - 0.13%, 1.77%,11/20/18 - 2/25/19 (b) 150,000 150,0001 Month USD LIBOR - 0.11%, 1.79%,10/22/18 (b) 200,000 200,0001 Month USD LIBOR - 0.105%, 1.79%,1/24/19 (b) 100,000 100,0001 Month USD LIBOR - 0.105%, 1.80%,1/11/19 (b) 100,000 100,0001 Month USD LIBOR - 0.08%, 1.80%,2/4/19 (b) 75,000 75,0001 Month USD LIBOR - 0.09%, 1.81%,11/8/18 (b) 50,000 50,0001 Month USD LIBOR - 0.08%, 1.82%,11/23/18 - 3/20/19 (b) 73,000 73,0003 Month USD LIBOR - 0.17%, 1.86%,6/5/18 (b) 65,000 65,000
Tennessee Valley Authority1.67%, 5/8/18 (a) 228,000 227,926
Total U.S. Agency Securities (Cost $11,932,203) 11,932,203
U.S. Treasury Securities (12.1%)U.S. Treasury Bills,
1.65%, 5/17/18 (c) 500,000 499,6381.69%, 6/7/18 (c) 676,000 674,8461.68%, 5/31/18 (c) 429,000 428,4121.72%, 5/3/18 (c) 270,000 269,975
Total U.S. Treasury Securities (Cost $1,872,871) 1,872,871
Total Investments (100.0%) (Cost $15,515,074) (d) 15,515,074
Liabilities in Excess of Other Assets (0.0%) (e) (1,356)
Net Assets (100.0%) $15,513,718
Portfolio of Investments (unaudited)Government Securities Portfolio Face Amount Value (000) (000)
Face Amount Value (000) (000)
Repurchase Agreement (11.0%)Federal Reserve Bank of New York, (1.50%,
dated 4/30/18, due 5/1/18; proceeds $1,710,071; fully collateralized by various U.S. Government obligations, 3.13% - 5.25% due 11/15/28 - 11/15/41; valued at $1,714,996) (Cost $1,710,000) $1,710,000 $ 1,710,000
U.S. Agency Securities (76.9%)Federal Farm Credit Bank,
1.63%, 5/17/18 (a) 90,000 89,9351.64%, 5/3/18 (a) 50,000 49,9951.67%, 5/24/18 (a) 25,000 24,9741 Month USD LIBOR - 0.18%, 1.73%, 6/28/18 (b) 75,000 74,9991 Month USD LIBOR - 0.15%, 1.75%,6/19/18 (b) 20,000 20,0001 Month USD LIBOR - 0.14%, 1.76%,7/10/18 (b) 35,000 35,0001 Month USD LIBOR - 0.135%, 1.76%,3/8/19 (b) 77,000 76,9971 Month USD LIBOR - 0.14%, 1.77%,6/28/18 (b) 25,000 25,0001 Month USD LIBOR - 0.126%, 1.77%,5/13/19 (b) 100,000 100,0001 Month USD LIBOR - 0.11%, 1.78%,9/4/18 (b) 50,000 50,0001 Month USD LIBOR - 0.12%, 1.79%,11/30/18 (b) 35,000 35,0001 Month USD LIBOR - 0.10%, 1.80%,8/30/19 - 9/25/19 (b) 170,000 169,9601 Month USD LIBOR - 0.08%, 1.81%,11/12/19 (b) 100,000 100,0001 Month USD LIBOR - 0.08%, 1.82%,11/9/18 - 12/16/19 (b) 134,000 133,9961 Month USD LIBOR - 0.07%, 1.83%,9/12/19 - 12/18/19 (b) 85,000 84,9981 Month USD LIBOR - 0.06%, 1.84%,12/26/19 (b) 150,000 149,9951 Month USD LIBOR - 0.05%, 1.85%,3/29/19 (b) 25,000 24,9993 Month USD LIBOR + 0.05%, 1.89%,10/18/19 (b) 26,700 26,6921 Month USD LIBOR + 0.03%, 1.91%,7/5/18 (b) 40,000 40,0001 Month USD LIBOR + 0.07%, 1.96%,10/22/18 (b) 25,000 25,0191 Month USD LIBOR + 0.09%, 1.99%,5/25/18 (b) 11,500 11,5021 Month USD LIBOR + 0.11%, 2.01%,8/29/18 (b) 125,000 125,0001 Month USD LIBOR + 0.18%, 2.07%,2/25/19 (b) 40,700 40,7871 Month USD LIBOR + 0.20%, 2.09%,6/18/18 (b) 47,400 47,4213 Month USD LIBOR - 0.17%, 2.12%,6/26/19 (b) 25,000 25,0003 Month USD LIBOR - 0.20%, 2.13%,7/6/18 (b) 50,000 50,000
The accompanying notes are an integral part of the financial statements.
2018 Semi-Annual Report
April 30, 2018
Merrill Corp - MS ILF Semi-Annual Report [Funds] 04-30-2018 ED [AUX] | thunt | 21-Jun-18 10:25 | 18-13101-10.cc | Sequence: 6CHKSUM Content: 42734 Layout: 33801 Graphics: No Graphics CLEAN
JOB: 18-13101-10 CYCLE#;BL#: 5; 0 TRIM: 8.25" x 10.75" COMPOSITECOLORS: Black, ~note-color 2 GRAPHICS: none V1.5
18
Portfolio of Investments (unaudited) (cont’d)Government Securities Portfolio
The accompanying notes are an integral part of the financial statements.
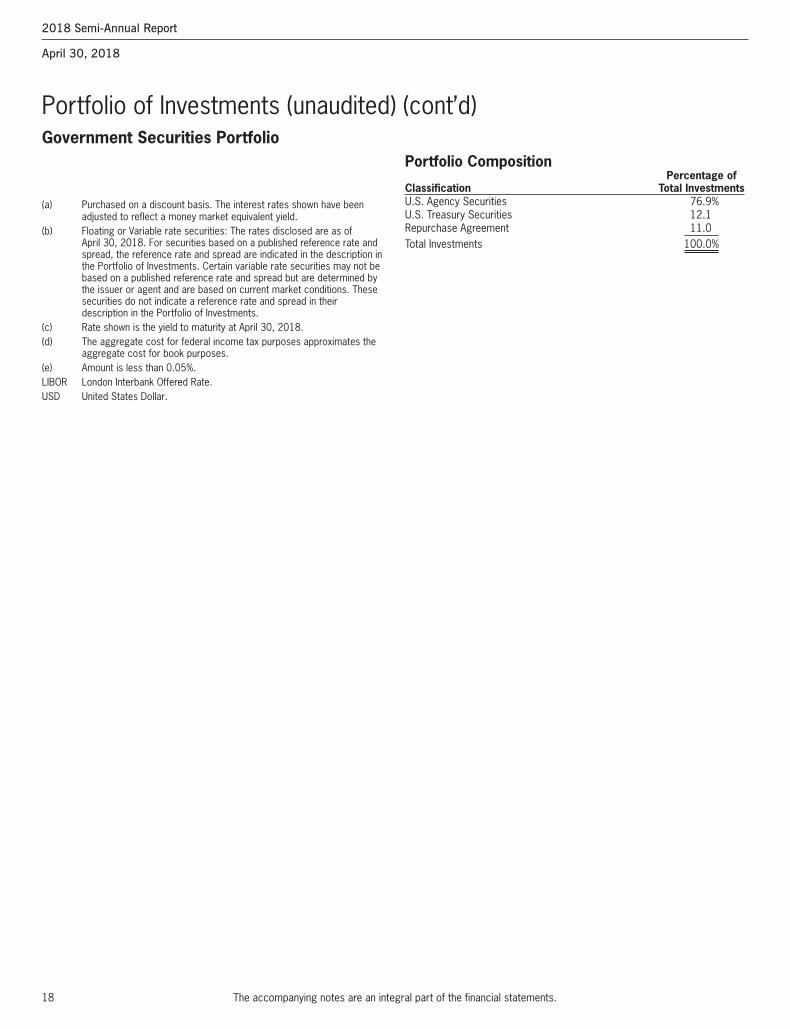
Portfolio Composition Percentage ofClassification Total InvestmentsU.S. Agency Securities 76.9%U.S. Treasury Securities 12.1Repurchase Agreement 11.0Total Investments 100.0%
(a) Purchased on a discount basis. The interest rates shown have beenadjusted to reflect a money market equivalent yield.
(b) Floating or Variable rate securities: The rates disclosed are as ofApril 30, 2018. For securities based on a published reference rate andspread, the reference rate and spread are indicated in the description inthe Portfolio of Investments. Certain variable rate securities may not bebased on a published reference rate and spread but are determined bythe issuer or agent and are based on current market conditions. Thesesecurities do not indicate a reference rate and spread in theirdescription in the Portfolio of Investments.
(c) Rate shown is the yield to maturity at April 30, 2018.(d) The aggregate cost for federal income tax purposes approximates the
aggregate cost for book purposes.(e) Amount is less than 0.05%.LIBOR London Interbank Offered Rate.USD United States Dollar.
2018 Semi-Annual Report
April 30, 2018
Merrill Corp - MS ILF Semi-Annual Report [Funds] 04-30-2018 ED [AUX] | thunt | 21-Jun-18 10:25 | 18-13101-10.cc | Sequence: 7CHKSUM Content: 7054 Layout: 49696 Graphics: No Graphics CLEAN
JOB: 18-13101-10 CYCLE#;BL#: 5; 0 TRIM: 8.25" x 10.75" COMPOSITECOLORS: Black, ~note-color 2 GRAPHICS: none V1.5
19
Credit Agricole Corp., (Interest in $2,050,000 joint repurchase agreement, 1.71% dated 4/30/18 under which Credit Agricole Corp., will repurchase the securities provided as collateral for $2,050,097 on 5/1/18. The securities provided as collateral at the end of the period held with BNY Mellon, tri-party agent, were various U.S. Governmentobligations with various maturities to 5/15/44; valued at $2,090,712) $ 687,000 $ 687,000
Deutsche Bank Securities, Inc., (1.72%, dated 4/30/18, due 5/1/18; proceeds $300,014; fully collateralized by various U.S. Government obligations, 0.00% due11/15/18 - 11/15/45; valued at $305,899) 300,000 300,000
Goldman Sachs & Co., (1.40%, dated 4/30/18, due 5/1/18; proceeds $57,002; fullycollateralized by various U.S. Governmentobligations, 0.00% due 2/15/38 - 8/15/41; valued at $58,200) 57,000 57,000
HSBC Securities USA, Inc., (1.71%, dated 4/30/18, due 5/7/18; proceeds $250,083; fully collateralized by various U.S. Governmentobligations, 2.75% - 2.88% due4/30/25 - 8/15/47; valued at $255,002) 250,000 250,000
ING Financial Markets LLC, (1.70%, dated 4/30/18, due 5/1/18; proceeds $300,018; fully collateralized by various U.S. Governmentobligations, 1.38% - 3.13% due1/15/20 - 5/15/43; valued at $306,005) 300,004 300,004
Natixis, (Interest in $2,550,000 joint repurchase agreement, 1.71% dated 4/30/18 under which Natixis, will repurchase the securities provided as collateral for $2,550,121 on 5/1/18. The securities provided as collateral at the end of the period held with BNY Mellon, tri-party agent, were various U.S. Governmentobligations with various maturities to 11/15/47; valued at $2,601,744) 1,000,000 1,000,000
Norinchukin Bank, (1.83%, dated 4/26/18, due6/15/18; proceeds $25,064; fullycollateralized by a U.S. Government obligation, 2.63% due 11/15/20; valued at $25,501) 25,000 25,000
Prudential Legacy Insurance Company of New Jersey, (1.75%, dated 4/30/18, due5/1/18; proceeds $390,907; fullycollateralized by various U.S. Governmentobligations, 0.01% due 5/15/27 - 11/15/45; valued at $398,705) 390,888 390,888
RBC Dominion Securities, (1.72%, dated 4/17/18, due 6/14/18; proceeds $200,554; fully collateralized by various U.S. Governmentobligations, 0.13% - 3.38% due10/31/18 - 11/15/27; valued at $204,035)(Demand 5/7/18) 200,000 200,000
Wells Fargo Securities LLC, (Interest in $50,000 joint repurchase agreement, 1.72% dated 4/30/18 under which Wells Fargo Securities LLC, will repurchase the securities provided as collateral for $50,002 on 5/1/18. The securities provided as collateral at the end of the period held with BNY Mellon, tri-party agent, were various U.S. Governmentobligations with various maturities to 1/15/21; valued at $51,000) 50,000 50,000
Portfolio of Investments (unaudited)Treasury Portfolio Face Amount Value (000) (000)
Face Amount Value (000) (000)
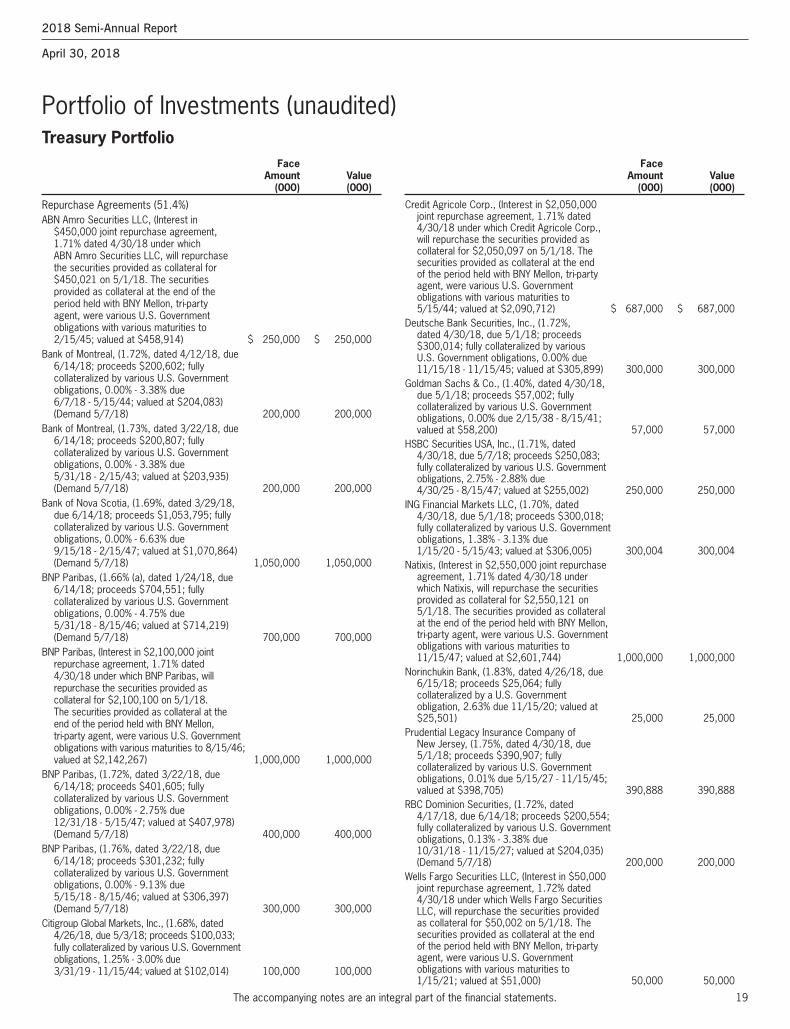
Repurchase Agreements (51.4%)ABN Amro Securities LLC, (Interest in
$450,000 joint repurchase agreement, 1.71% dated 4/30/18 under which ABN Amro Securities LLC, will repurchase the securities provided as collateral for $450,021 on 5/1/18. The securities provided as collateral at the end of the period held with BNY Mellon, tri-party agent, were various U.S. Governmentobligations with various maturities to 2/15/45; valued at $458,914) $ 250,000 $ 250,000
Bank of Montreal, (1.72%, dated 4/12/18, due6/14/18; proceeds $200,602; fullycollateralized by various U.S. Governmentobligations, 0.00% - 3.38% due6/7/18 - 5/15/44; valued at $204,083)(Demand 5/7/18) 200,000 200,000
Bank of Montreal, (1.73%, dated 3/22/18, due6/14/18; proceeds $200,807; fullycollateralized by various U.S. Governmentobligations, 0.00% - 3.38% due5/31/18 - 2/15/43; valued at $203,935)(Demand 5/7/18) 200,000 200,000
Bank of Nova Scotia, (1.69%, dated 3/29/18, due 6/14/18; proceeds $1,053,795; fullycollateralized by various U.S. Governmentobligations, 0.00% - 6.63% due9/15/18 - 2/15/47; valued at $1,070,864)(Demand 5/7/18) 1,050,000 1,050,000
BNP Paribas, (1.66% (a), dated 1/24/18, due6/14/18; proceeds $704,551; fullycollateralized by various U.S. Governmentobligations, 0.00% - 4.75% due5/31/18 - 8/15/46; valued at $714,219)(Demand 5/7/18) 700,000 700,000
BNP Paribas, (Interest in $2,100,000 joint repurchase agreement, 1.71% dated 4/30/18 under which BNP Paribas, will repurchase the securities provided as collateral for $2,100,100 on 5/1/18. The securities provided as collateral at the end of the period held with BNY Mellon, tri-party agent, were various U.S. Governmentobligations with various maturities to 8/15/46; valued at $2,142,267) 1,000,000 1,000,000
BNP Paribas, (1.72%, dated 3/22/18, due6/14/18; proceeds $401,605; fullycollateralized by various U.S. Governmentobligations, 0.00% - 2.75% due12/31/18 - 5/15/47; valued at $407,978)(Demand 5/7/18) 400,000 400,000
BNP Paribas, (1.76%, dated 3/22/18, due6/14/18; proceeds $301,232; fullycollateralized by various U.S. Governmentobligations, 0.00% - 9.13% due5/15/18 - 8/15/46; valued at $306,397)(Demand 5/7/18) 300,000 300,000
Citigroup Global Markets, Inc., (1.68%, dated 4/26/18, due 5/3/18; proceeds $100,033; fully collateralized by various U.S. Governmentobligations, 1.25% - 3.00% due3/31/19 - 11/15/44; valued at $102,014) 100,000 100,000
The accompanying notes are an integral part of the financial statements.
2018 Semi-Annual Report
April 30, 2018
Merrill Corp - MS ILF Semi-Annual Report [Funds] 04-30-2018 ED [AUX] | thunt | 21-Jun-18 10:25 | 18-13101-10.ce | Sequence: 1CHKSUM Content: 58137 Layout: 33801 Graphics: No Graphics CLEAN
JOB: 18-13101-10 CYCLE#;BL#: 5; 0 TRIM: 8.25" x 10.75" COMPOSITECOLORS: Black, ~note-color 2 GRAPHICS: none V1.5
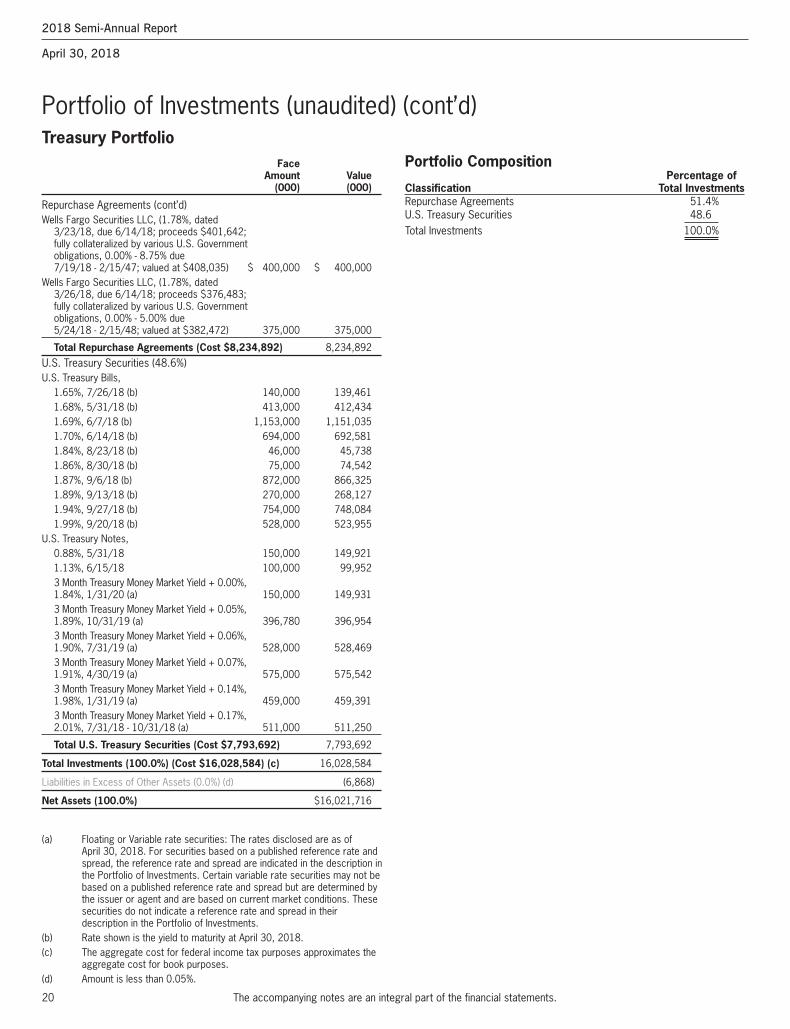
20
Portfolio of Investments (unaudited) (cont’d)Treasury Portfolio
The accompanying notes are an integral part of the financial statements.
Portfolio Composition Percentage ofClassification Total InvestmentsRepurchase Agreements 51.4%U.S. Treasury Securities 48.6Total Investments 100.0%
Face Amount Value (000) (000)
Repurchase Agreements (cont’d)Wells Fargo Securities LLC, (1.78%, dated
3/23/18, due 6/14/18; proceeds $401,642; fully collateralized by various U.S. Governmentobligations, 0.00% - 8.75% due7/19/18 - 2/15/47; valued at $408,035) $ 400,000 $ 400,000
Wells Fargo Securities LLC, (1.78%, dated 3/26/18, due 6/14/18; proceeds $376,483; fully collateralized by various U.S. Governmentobligations, 0.00% - 5.00% due5/24/18 - 2/15/48; valued at $382,472) 375,000 375,000
Total Repurchase Agreements (Cost $8,234,892) 8,234,892U.S. Treasury Securities (48.6%)U.S. Treasury Bills,
1.65%, 7/26/18 (b) 140,000 139,4611.68%, 5/31/18 (b) 413,000 412,4341.69%, 6/7/18 (b) 1,153,000 1,151,0351.70%, 6/14/18 (b) 694,000 692,5811.84%, 8/23/18 (b) 46,000 45,7381.86%, 8/30/18 (b) 75,000 74,5421.87%, 9/6/18 (b) 872,000 866,3251.89%, 9/13/18 (b) 270,000 268,1271.94%, 9/27/18 (b) 754,000 748,0841.99%, 9/20/18 (b) 528,000 523,955
U.S. Treasury Notes,0.88%, 5/31/18 150,000 149,9211.13%, 6/15/18 100,000 99,9523 Month Treasury Money Market Yield + 0.00%, 1.84%, 1/31/20 (a) 150,000 149,9313 Month Treasury Money Market Yield + 0.05%, 1.89%, 10/31/19 (a) 396,780 396,9543 Month Treasury Money Market Yield + 0.06%, 1.90%, 7/31/19 (a) 528,000 528,4693 Month Treasury Money Market Yield + 0.07%, 1.91%, 4/30/19 (a) 575,000 575,5423 Month Treasury Money Market Yield + 0.14%, 1.98%, 1/31/19 (a) 459,000 459,3913 Month Treasury Money Market Yield + 0.17%, 2.01%, 7/31/18 - 10/31/18 (a) 511,000 511,250
Total U.S. Treasury Securities (Cost $7,793,692) 7,793,692
Total Investments (100.0%) (Cost $16,028,584) (c) 16,028,584
Liabilities in Excess of Other Assets (0.0%) (d) (6,868)
Net Assets (100.0%) $16,021,716
(a) Floating or Variable rate securities: The rates disclosed are as ofApril 30, 2018. For securities based on a published reference rate andspread, the reference rate and spread are indicated in the description inthe Portfolio of Investments. Certain variable rate securities may not bebased on a published reference rate and spread but are determined bythe issuer or agent and are based on current market conditions. Thesesecurities do not indicate a reference rate and spread in theirdescription in the Portfolio of Investments.
(b) Rate shown is the yield to maturity at April 30, 2018.(c) The aggregate cost for federal income tax purposes approximates the
aggregate cost for book purposes.(d) Amount is less than 0.05%.
2018 Semi-Annual Report
April 30, 2018
Merrill Corp - MS ILF Semi-Annual Report [Funds] 04-30-2018 ED [AUX] | thunt | 21-Jun-18 10:25 | 18-13101-10.ce | Sequence: 2CHKSUM Content: 21731 Layout: 49696 Graphics: No Graphics CLEAN
JOB: 18-13101-10 CYCLE#;BL#: 5; 0 TRIM: 8.25" x 10.75" COMPOSITECOLORS: Black, ~note-color 2 GRAPHICS: none V1.5
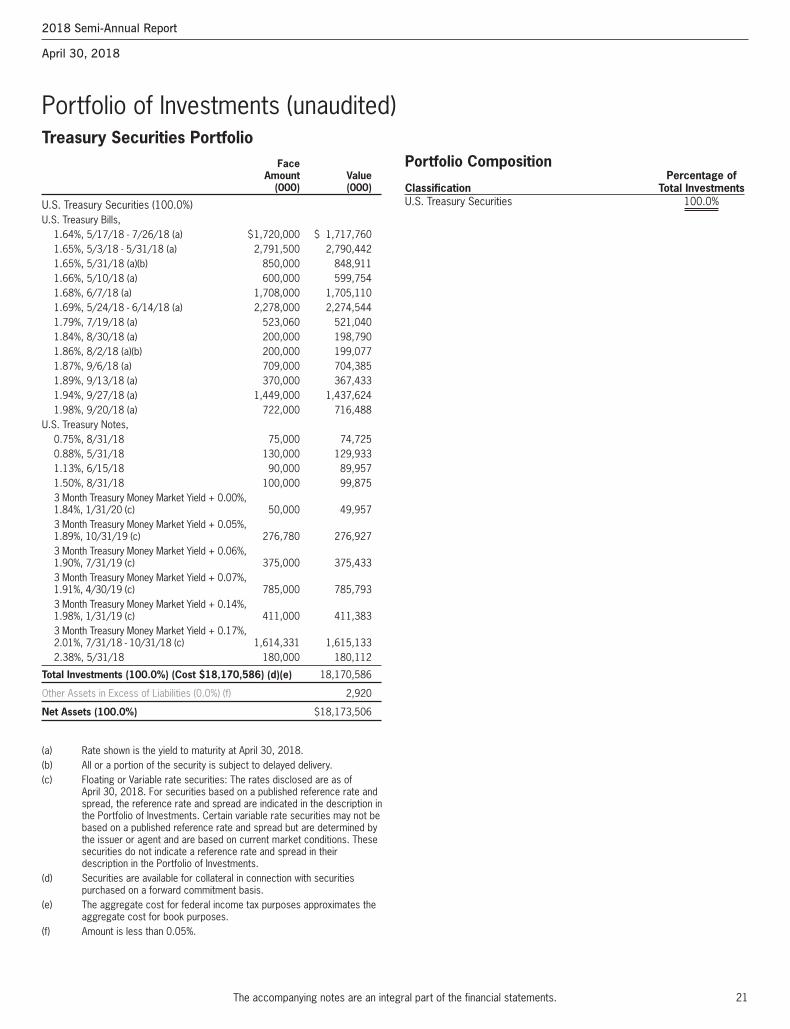
21
Portfolio Composition Percentage ofClassification Total InvestmentsU.S. Treasury Securities 100.0%
Portfolio of Investments (unaudited)Treasury Securities Portfolio Face Amount Value (000) (000)
U.S. Treasury Securities (100.0%)U.S. Treasury Bills,
1.64%, 5/17/18 - 7/26/18 (a) $1,720,000 $ 1,717,7601.65%, 5/3/18 - 5/31/18 (a) 2,791,500 2,790,4421.65%, 5/31/18 (a)(b) 850,000 848,9111.66%, 5/10/18 (a) 600,000 599,7541.68%, 6/7/18 (a) 1,708,000 1,705,1101.69%, 5/24/18 - 6/14/18 (a) 2,278,000 2,274,5441.79%, 7/19/18 (a) 523,060 521,0401.84%, 8/30/18 (a) 200,000 198,7901.86%, 8/2/18 (a)(b) 200,000 199,0771.87%, 9/6/18 (a) 709,000 704,3851.89%, 9/13/18 (a) 370,000 367,4331.94%, 9/27/18 (a) 1,449,000 1,437,6241.98%, 9/20/18 (a) 722,000 716,488
U.S. Treasury Notes,0.75%, 8/31/18 75,000 74,7250.88%, 5/31/18 130,000 129,9331.13%, 6/15/18 90,000 89,9571.50%, 8/31/18 100,000 99,8753 Month Treasury Money Market Yield + 0.00%, 1.84%, 1/31/20 (c) 50,000 49,9573 Month Treasury Money Market Yield + 0.05%, 1.89%, 10/31/19 (c) 276,780 276,9273 Month Treasury Money Market Yield + 0.06%, 1.90%, 7/31/19 (c) 375,000 375,4333 Month Treasury Money Market Yield + 0.07%, 1.91%, 4/30/19 (c) 785,000 785,7933 Month Treasury Money Market Yield + 0.14%, 1.98%, 1/31/19 (c) 411,000 411,3833 Month Treasury Money Market Yield + 0.17%, 2.01%, 7/31/18 - 10/31/18 (c) 1,614,331 1,615,1332.38%, 5/31/18 180,000 180,112
Total Investments (100.0%) (Cost $18,170,586) (d)(e) 18,170,586
Other Assets in Excess of Liabilities (0.0%) (f) 2,920
Net Assets (100.0%) $18,173,506
(a) Rate shown is the yield to maturity at April 30, 2018.(b) All or a portion of the security is subject to delayed delivery.(c) Floating or Variable rate securities: The rates disclosed are as of
April 30, 2018. For securities based on a published reference rate andspread, the reference rate and spread are indicated in the description inthe Portfolio of Investments. Certain variable rate securities may not bebased on a published reference rate and spread but are determined bythe issuer or agent and are based on current market conditions. Thesesecurities do not indicate a reference rate and spread in theirdescription in the Portfolio of Investments.
(d) Securities are available for collateral in connection with securitiespurchased on a forward commitment basis.
(e) The aggregate cost for federal income tax purposes approximates theaggregate cost for book purposes.
(f) Amount is less than 0.05%.
The accompanying notes are an integral part of the financial statements.
2018 Semi-Annual Report
April 30, 2018
Merrill Corp - MS ILF Semi-Annual Report [Funds] 04-30-2018 ED [AUX] | thunt | 21-Jun-18 10:25 | 18-13101-10.ce | Sequence: 3CHKSUM Content: 62583 Layout: 58823 Graphics: No Graphics CLEAN
JOB: 18-13101-10 CYCLE#;BL#: 5; 0 TRIM: 8.25" x 10.75" COMPOSITECOLORS: Black, ~note-color 2 GRAPHICS: none V1.5
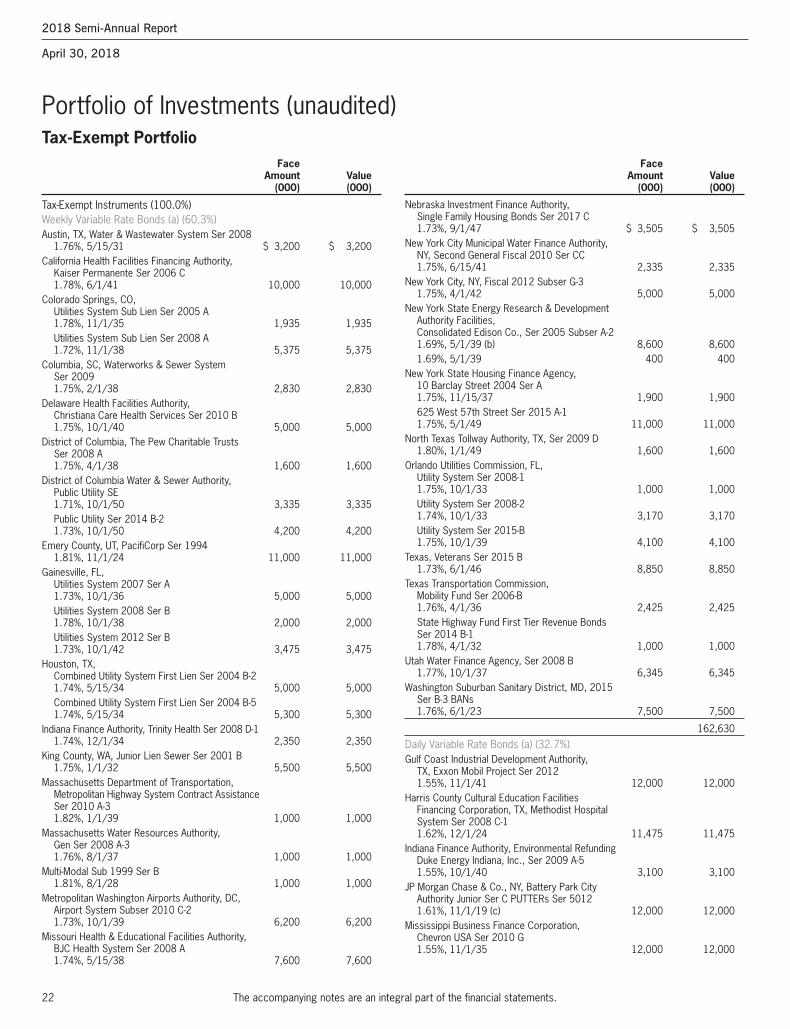
22
Nebraska Investment Finance Authority, Single Family Housing Bonds Ser 2017 C1.73%, 9/1/47 $ 3,505 $ 3,505
New York City Municipal Water Finance Authority, NY, Second General Fiscal 2010 Ser CC1.75%, 6/15/41 2,335 2,335
New York City, NY, Fiscal 2012 Subser G-31.75%, 4/1/42 5,000 5,000
New York State Energy Research & Development Authority Facilities,Consolidated Edison Co., Ser 2005 Subser A-21.69%, 5/1/39 (b) 8,600 8,6001.69%, 5/1/39 400 400
New York State Housing Finance Agency,10 Barclay Street 2004 Ser A1.75%, 11/15/37 1,900 1,900625 West 57th Street Ser 2015 A-11.75%, 5/1/49 11,000 11,000
North Texas Tollway Authority, TX, Ser 2009 D1.80%, 1/1/49 1,600 1,600
Orlando Utilities Commission, FL,Utility System Ser 2008-11.75%, 10/1/33 1,000 1,000Utility System Ser 2008-21.74%, 10/1/33 3,170 3,170Utility System Ser 2015-B1.75%, 10/1/39 4,100 4,100
Texas, Veterans Ser 2015 B1.73%, 6/1/46 8,850 8,850
Texas Transportation Commission,Mobility Fund Ser 2006-B1.76%, 4/1/36 2,425 2,425State Highway Fund First Tier Revenue Bonds Ser 2014 B-11.78%, 4/1/32 1,000 1,000
Utah Water Finance Agency, Ser 2008 B1.77%, 10/1/37 6,345 6,345
Washington Suburban Sanitary District, MD, 2015 Ser B-3 BANs1.76%, 6/1/23 7,500 7,500
162,630
Daily Variable Rate Bonds (a) (32.7%)Gulf Coast Industrial Development Authority,
TX, Exxon Mobil Project Ser 20121.55%, 11/1/41 12,000 12,000
Harris County Cultural Education Facilities Financing Corporation, TX, Methodist Hospital System Ser 2008 C-11.62%, 12/1/24 11,475 11,475
Indiana Finance Authority, Environmental Refunding Duke Energy Indiana, Inc., Ser 2009 A-51.55%, 10/1/40 3,100 3,100
JP Morgan Chase & Co., NY, Battery Park City Authority Junior Ser C PUTTERs Ser 50121.61%, 11/1/19 (c) 12,000 12,000
Mississippi Business Finance Corporation, Chevron USA Ser 2010 G1.55%, 11/1/35 12,000 12,000
Portfolio of Investments (unaudited)Tax-Exempt Portfolio Face Amount Value (000) (000)
Face Amount Value (000) (000)
Tax-Exempt Instruments (100.0%)Weekly Variable Rate Bonds (a) (60.3%)Austin, TX, Water & Wastewater System Ser 2008
1.76%, 5/15/31 $ 3,200 $ 3,200California Health Facilities Financing Authority,
Kaiser Permanente Ser 2006 C1.78%, 6/1/41 10,000 10,000
Colorado Springs, CO,Utilities System Sub Lien Ser 2005 A1.78%, 11/1/35 1,935 1,935Utilities System Sub Lien Ser 2008 A1.72%, 11/1/38 5,375 5,375
Columbia, SC, Waterworks & Sewer System Ser 20091.75%, 2/1/38 2,830 2,830
Delaware Health Facilities Authority, Christiana Care Health Services Ser 2010 B1.75%, 10/1/40 5,000 5,000
District of Columbia, The Pew Charitable Trusts Ser 2008 A1.75%, 4/1/38 1,600 1,600
District of Columbia Water & Sewer Authority,Public Utility SE1.71%, 10/1/50 3,335 3,335Public Utility Ser 2014 B-21.73%, 10/1/50 4,200 4,200
Emery County, UT, PacifiCorp Ser 19941.81%, 11/1/24 11,000 11,000
Gainesville, FL,Utilities System 2007 Ser A1.73%, 10/1/36 5,000 5,000Utilities System 2008 Ser B1.78%, 10/1/38 2,000 2,000Utilities System 2012 Ser B1.73%, 10/1/42 3,475 3,475
Houston, TX,Combined Utility System First Lien Ser 2004 B-21.74%, 5/15/34 5,000 5,000Combined Utility System First Lien Ser 2004 B-51.74%, 5/15/34 5,300 5,300
Indiana Finance Authority, Trinity Health Ser 2008 D-11.74%, 12/1/34 2,350 2,350
King County, WA, Junior Lien Sewer Ser 2001 B1.75%, 1/1/32 5,500 5,500
Massachusetts Department of Transportation, Metropolitan Highway System Contract Assistance Ser 2010 A-31.82%, 1/1/39 1,000 1,000
Massachusetts Water Resources Authority,Gen Ser 2008 A-31.76%, 8/1/37 1,000 1,000
Multi-Modal Sub 1999 Ser B1.81%, 8/1/28 1,000 1,000
Metropolitan Washington Airports Authority, DC, Airport System Subser 2010 C-21.73%, 10/1/39 6,200 6,200
Missouri Health & Educational Facilities Authority, BJC Health System Ser 2008 A1.74%, 5/15/38 7,600 7,600
The accompanying notes are an integral part of the financial statements.
2018 Semi-Annual Report
April 30, 2018
Merrill Corp - MS ILF Semi-Annual Report [Funds] 04-30-2018 ED [AUX] | thunt | 21-Jun-18 10:25 | 18-13101-10.ce | Sequence: 4CHKSUM Content: 44806 Layout: 19070 Graphics: No Graphics CLEAN
JOB: 18-13101-10 CYCLE#;BL#: 5; 0 TRIM: 8.25" x 10.75" COMPOSITECOLORS: Black, ~note-color 2 GRAPHICS: none V1.5
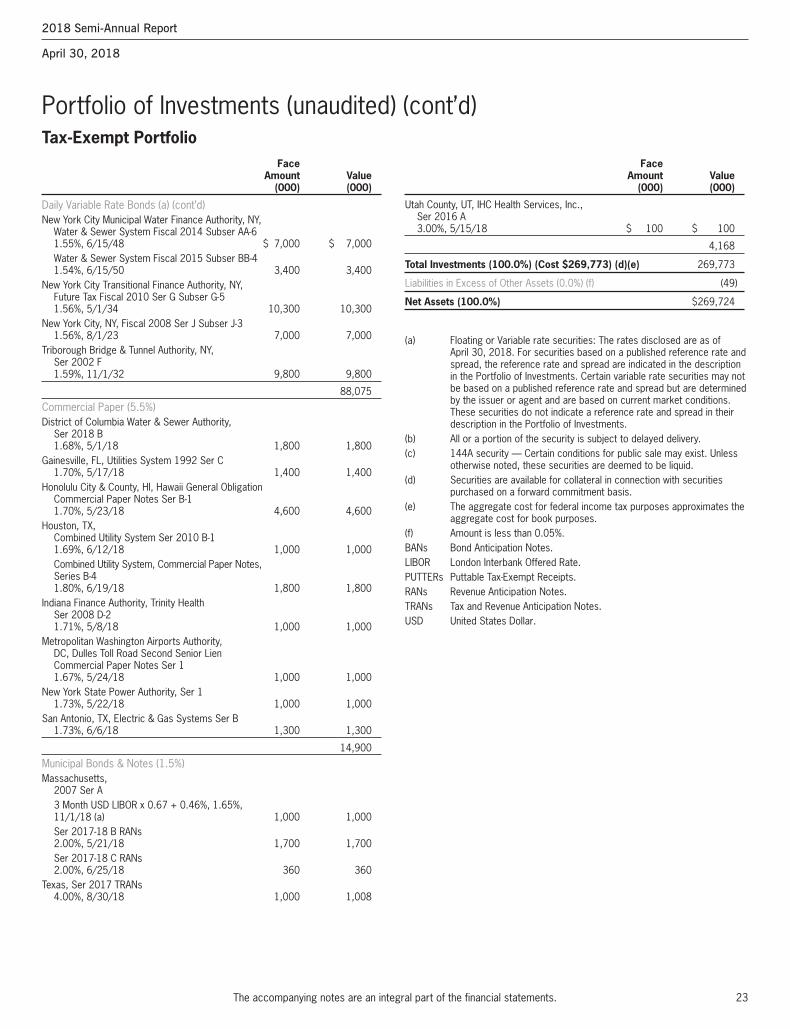
23
Portfolio of Investments (unaudited) (cont’d)Tax-Exempt Portfolio
The accompanying notes are an integral part of the financial statements.
Utah County, UT, IHC Health Services, Inc., Ser 2016 A3.00%, 5/15/18 $ 100 $ 100
4,168
Total Investments (100.0%) (Cost $269,773) (d)(e) 269,773
Liabilities in Excess of Other Assets (0.0%) (f) (49)
Net Assets (100.0%) $269,724
(a) Floating or Variable rate securities: The rates disclosed are as ofApril 30, 2018. For securities based on a published reference rate andspread, the reference rate and spread are indicated in the descriptionin the Portfolio of Investments. Certain variable rate securities may notbe based on a published reference rate and spread but are determinedby the issuer or agent and are based on current market conditions.These securities do not indicate a reference rate and spread in theirdescription in the Portfolio of Investments.
(b) All or a portion of the security is subject to delayed delivery.(c) 144A security — Certain conditions for public sale may exist. Unless
otherwise noted, these securities are deemed to be liquid.(d) Securities are available for collateral in connection with securities
purchased on a forward commitment basis.(e) The aggregate cost for federal income tax purposes approximates the
aggregate cost for book purposes.(f) Amount is less than 0.05%.BANs Bond Anticipation Notes.LIBOR London Interbank Offered Rate.PUTTERs Puttable Tax-Exempt Receipts.RANs Revenue Anticipation Notes.TRANs Tax and Revenue Anticipation Notes.USD United States Dollar.
Face Amount Value (000) (000)
Face Amount Value (000) (000)
Daily Variable Rate Bonds (a) (cont’d)New York City Municipal Water Finance Authority, NY,
Water & Sewer System Fiscal 2014 Subser AA-61.55%, 6/15/48 $ 7,000 $ 7,000Water & Sewer System Fiscal 2015 Subser BB-41.54%, 6/15/50 3,400 3,400
New York City Transitional Finance Authority, NY, Future Tax Fiscal 2010 Ser G Subser G-51.56%, 5/1/34 10,300 10,300
New York City, NY, Fiscal 2008 Ser J Subser J-31.56%, 8/1/23 7,000 7,000
Triborough Bridge & Tunnel Authority, NY, Ser 2002 F1.59%, 11/1/32 9,800 9,800
88,075
Commercial Paper (5.5%)District of Columbia Water & Sewer Authority,
Ser 2018 B1.68%, 5/1/18 1,800 1,800
Gainesville, FL, Utilities System 1992 Ser C1.70%, 5/17/18 1,400 1,400
Honolulu City & County, HI, Hawaii General Obligation Commercial Paper Notes Ser B-11.70%, 5/23/18 4,600 4,600
Houston, TX,Combined Utility System Ser 2010 B-11.69%, 6/12/18 1,000 1,000Combined Utility System, Commercial Paper Notes, Series B-41.80%, 6/19/18 1,800 1,800
Indiana Finance Authority, Trinity Health Ser 2008 D-21.71%, 5/8/18 1,000 1,000
Metropolitan Washington Airports Authority, DC, Dulles Toll Road Second Senior Lien Commercial Paper Notes Ser 11.67%, 5/24/18 1,000 1,000
New York State Power Authority, Ser 11.73%, 5/22/18 1,000 1,000
San Antonio, TX, Electric & Gas Systems Ser B1.73%, 6/6/18 1,300 1,300
14,900
Municipal Bonds & Notes (1.5%)Massachusetts,
2007 Ser A3 Month USD LIBOR x 0.67 + 0.46%, 1.65%, 11/1/18 (a) 1,000 1,000Ser 2017-18 B RANs2.00%, 5/21/18 1,700 1,700Ser 2017-18 C RANs2.00%, 6/25/18 360 360
Texas, Ser 2017 TRANs4.00%, 8/30/18 1,000 1,008
2018 Semi-Annual Report
April 30, 2018
Merrill Corp - MS ILF Semi-Annual Report [Funds] 04-30-2018 ED [AUX] | thunt | 21-Jun-18 10:25 | 18-13101-10.ce | Sequence: 5CHKSUM Content: 23037 Layout: 24141 Graphics: No Graphics CLEAN
JOB: 18-13101-10 CYCLE#;BL#: 5; 0 TRIM: 8.25" x 10.75" COMPOSITECOLORS: Black, ~note-color 2 GRAPHICS: none V1.5
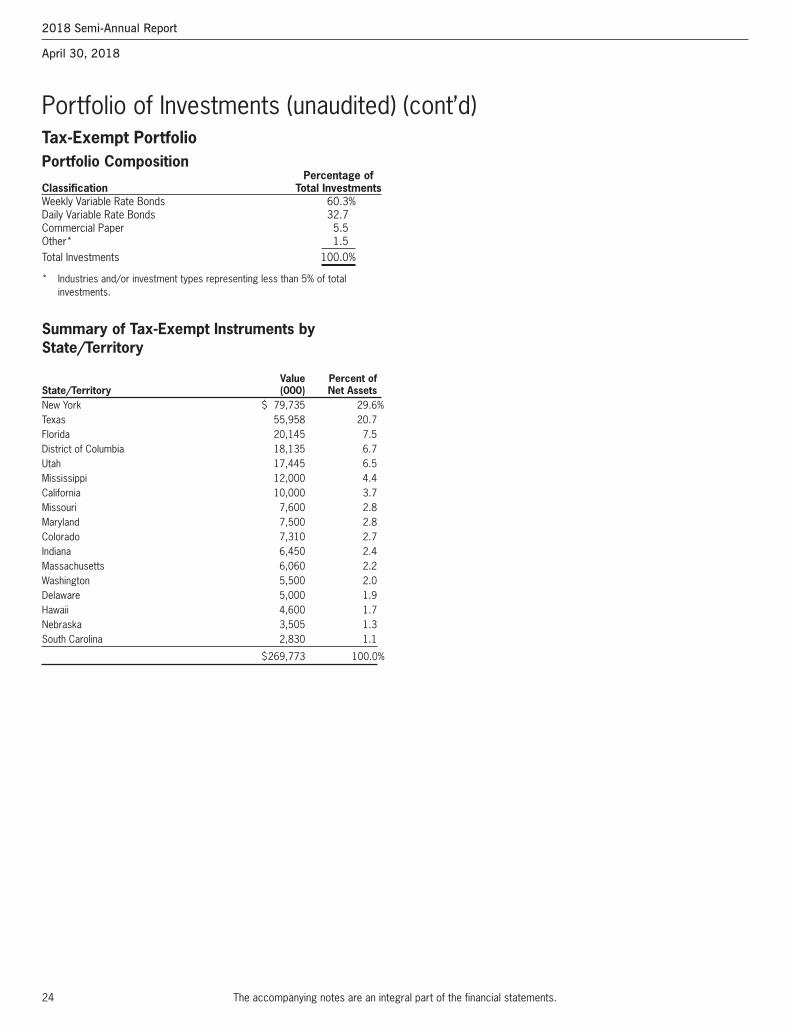
24
Portfolio of Investments (unaudited) (cont’d)Tax-Exempt Portfolio
The accompanying notes are an integral part of the financial statements.
Portfolio Composition Percentage ofClassification Total InvestmentsWeekly Variable Rate Bonds 60.3%Daily Variable Rate Bonds 32.7Commercial Paper 5.5Other* 1.5Total Investments 100.0%
* Industries and/or investment types representing less than 5% of total investments.
Summary of Tax-Exempt Instruments byState/Territory
Value Percent ofState/Territory (000) Net AssetsNew York $ 79,735 29.6%Texas 55,958 20.7Florida 20,145 7.5District of Columbia 18,135 6.7Utah 17,445 6.5Mississippi 12,000 4.4California 10,000 3.7Missouri 7,600 2.8Maryland 7,500 2.8Colorado 7,310 2.7Indiana 6,450 2.4Massachusetts 6,060 2.2Washington 5,500 2.0Delaware 5,000 1.9Hawaii 4,600 1.7Nebraska 3,505 1.3South Carolina 2,830 1.1
$269,773 100.0%
2018 Semi-Annual Report
April 30, 2018
Merrill Corp - MS ILF Semi-Annual Report [Funds] 04-30-2018 ED [AUX] | thunt | 21-Jun-18 10:25 | 18-13101-10.ce | Sequence: 6CHKSUM Content: 13399 Layout: 20024 Graphics: No Graphics CLEAN
JOB: 18-13101-10 CYCLE#;BL#: 5; 0 TRIM: 8.25" x 10.75" COMPOSITECOLORS: Black, ~note-color 2 GRAPHICS: none V1.5
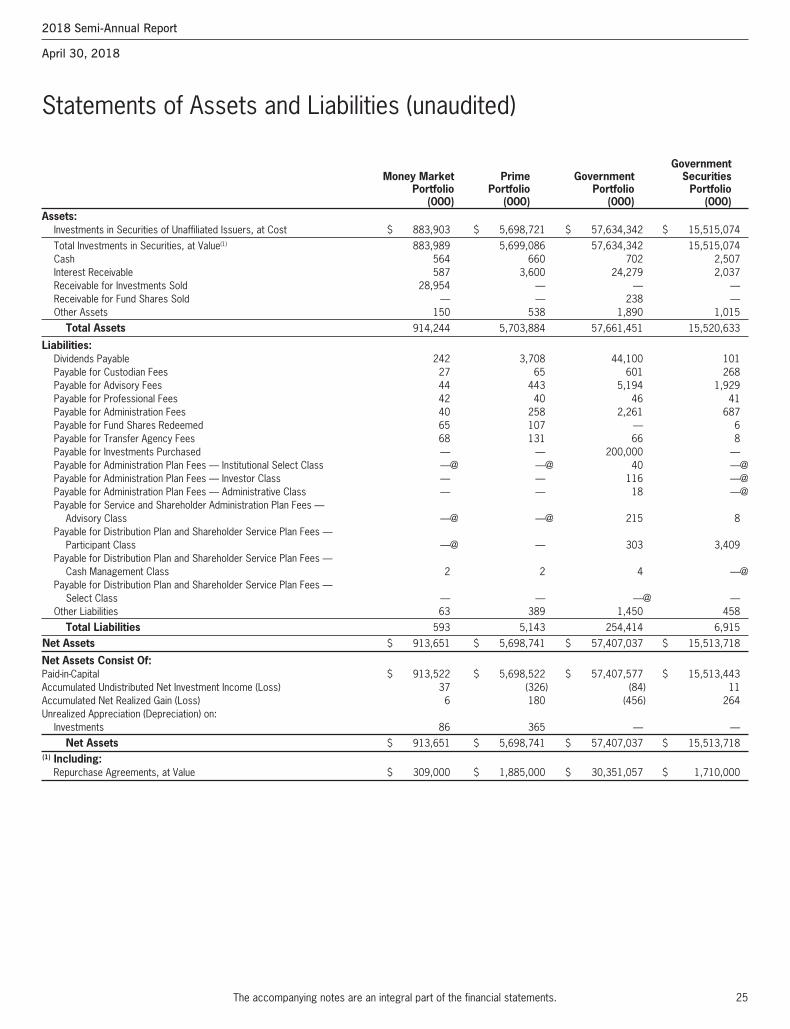
25
Statements of Assets and Liabilities (unaudited)
The accompanying notes are an integral part of the financial statements.
Government Money Market Prime Government Securities Portfolio Portfolio Portfolio Portfolio (000) (000) (000) (000)Assets:
Investments in Securities of Unaffiliated Issuers, at Cost $ 883,903 $ 5,698,721 $ 57,634,342 $ 15,515,074
Total Investments in Securities, at Value(1) 883,989 5,699,086 57,634,342 15,515,074Cash 564 660 702 2,507Interest Receivable 587 3,600 24,279 2,037Receivable for Investments Sold 28,954 — — —Receivable for Fund Shares Sold — — 238 —Other Assets 150 538 1,890 1,015
Total Assets 914,244 5,703,884 57,661,451 15,520,633
Liabilities:Dividends Payable 242 3,708 44,100 101Payable for Custodian Fees 27 65 601 268Payable for Advisory Fees 44 443 5,194 1,929Payable for Professional Fees 42 40 46 41Payable for Administration Fees 40 258 2,261 687Payable for Fund Shares Redeemed 65 107 — 6Payable for Transfer Agency Fees 68 131 66 8Payable for Investments Purchased — — 200,000 —Payable for Administration Plan Fees — Institutional Select Class —@ —@ 40 —@Payable for Administration Plan Fees — Investor Class — — 116 —@Payable for Administration Plan Fees — Administrative Class — — 18 —@Payable for Service and Shareholder Administration Plan Fees —
Advisory Class —@ —@ 215 8Payable for Distribution Plan and Shareholder Service Plan Fees —
Participant Class —@ — 303 3,409Payable for Distribution Plan and Shareholder Service Plan Fees —
Cash Management Class 2 2 4 —@Payable for Distribution Plan and Shareholder Service Plan Fees —
Select Class — — —@ —Other Liabilities 63 389 1,450 458
Total Liabilities 593 5,143 254,414 6,915
Net Assets $ 913,651 $ 5,698,741 $ 57,407,037 $ 15,513,718
Net Assets Consist Of:Paid-in-Capital $ 913,522 $ 5,698,522 $ 57,407,577 $ 15,513,443Accumulated Undistributed Net Investment Income (Loss) 37 (326) (84) 11Accumulated Net Realized Gain (Loss) 6 180 (456) 264Unrealized Appreciation (Depreciation) on:
Investments 86 365 — —
Net Assets $ 913,651 $ 5,698,741 $ 57,407,037 $ 15,513,718(1) Including:
Repurchase Agreements, at Value $ 309,000 $ 1,885,000 $ 30,351,057 $ 1,710,000
2018 Semi-Annual Report
April 30, 2018
Merrill Corp - MS ILF Semi-Annual Report [Funds] 04-30-2018 ED [AUX] | thunt | 21-Jun-18 10:25 | 18-13101-10.da | Sequence: 1CHKSUM Content: 42463 Layout: 30745 Graphics: No Graphics CLEAN
JOB: 18-13101-10 CYCLE#;BL#: 5; 0 TRIM: 8.25" x 10.75" COMPOSITECOLORS: Black, ~note-color 2 GRAPHICS: none V1.5
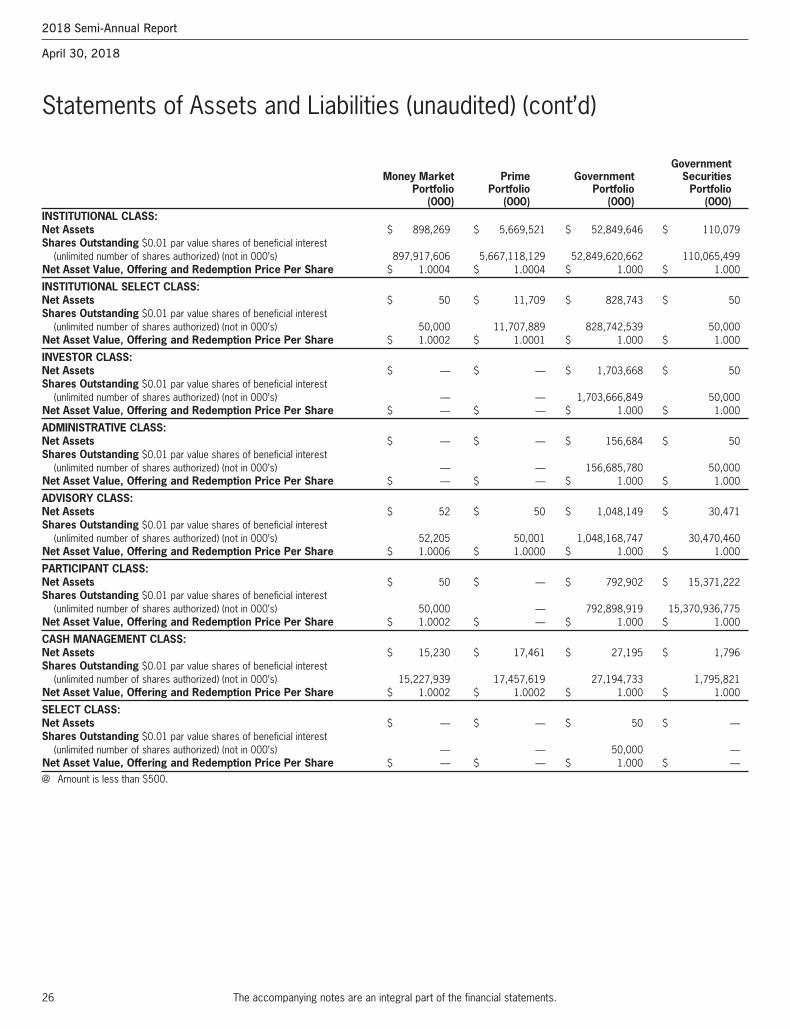
26
Statements of Assets and Liabilities (unaudited) (cont’d)
The accompanying notes are an integral part of the financial statements.
Government Money Market Prime Government Securities Portfolio Portfolio Portfolio Portfolio (000) (000) (000) (000)INSTITUTIONAL CLASS:Net Assets $ 898,269 $ 5,669,521 $ 52,849,646 $ 110,079Shares Outstanding $0.01 par value shares of beneficial interest
(unlimited number of shares authorized) (not in 000’s) 897,917,606 5,667,118,129 52,849,620,662 110,065,499Net Asset Value, Offering and Redemption Price Per Share $ 1.0004 $ 1.0004 $ 1.000 $ 1.000
INSTITUTIONAL SELECT CLASS:Net Assets $ 50 $ 11,709 $ 828,743 $ 50Shares Outstanding $0.01 par value shares of beneficial interest
(unlimited number of shares authorized) (not in 000’s) 50,000 11,707,889 828,742,539 50,000Net Asset Value, Offering and Redemption Price Per Share $ 1.0002 $ 1.0001 $ 1.000 $ 1.000
INVESTOR CLASS:Net Assets $ — $ — $ 1,703,668 $ 50Shares Outstanding $0.01 par value shares of beneficial interest
(unlimited number of shares authorized) (not in 000’s) — — 1,703,666,849 50,000Net Asset Value, Offering and Redemption Price Per Share $ — $ — $ 1.000 $ 1.000
ADMINISTRATIVE CLASS:Net Assets $ — $ — $ 156,684 $ 50Shares Outstanding $0.01 par value shares of beneficial interest
(unlimited number of shares authorized) (not in 000’s) — — 156,685,780 50,000Net Asset Value, Offering and Redemption Price Per Share $ — $ — $ 1.000 $ 1.000
ADVISORY CLASS:Net Assets $ 52 $ 50 $ 1,048,149 $ 30,471Shares Outstanding $0.01 par value shares of beneficial interest
(unlimited number of shares authorized) (not in 000’s) 52,205 50,001 1,048,168,747 30,470,460Net Asset Value, Offering and Redemption Price Per Share $ 1.0006 $ 1.0000 $ 1.000 $ 1.000
PARTICIPANT CLASS:Net Assets $ 50 $ — $ 792,902 $ 15,371,222Shares Outstanding $0.01 par value shares of beneficial interest
(unlimited number of shares authorized) (not in 000’s) 50,000 — 792,898,919 15,370,936,775Net Asset Value, Offering and Redemption Price Per Share $ 1.0002 $ — $ 1.000 $ 1.000
CASH MANAGEMENT CLASS:Net Assets $ 15,230 $ 17,461 $ 27,195 $ 1,796Shares Outstanding $0.01 par value shares of beneficial interest
(unlimited number of shares authorized) (not in 000’s) 15,227,939 17,457,619 27,194,733 1,795,821Net Asset Value, Offering and Redemption Price Per Share $ 1.0002 $ 1.0002 $ 1.000 $ 1.000
SELECT CLASS:Net Assets $ — $ — $ 50 $ —Shares Outstanding $0.01 par value shares of beneficial interest
(unlimited number of shares authorized) (not in 000’s) — — 50,000 —Net Asset Value, Offering and Redemption Price Per Share $ — $ — $ 1.000 $ —
@ Amount is less than $500.
2018 Semi-Annual Report
April 30, 2018
Merrill Corp - MS ILF Semi-Annual Report [Funds] 04-30-2018 ED [AUX] | thunt | 21-Jun-18 10:25 | 18-13101-10.da | Sequence: 2CHKSUM Content: 48913 Layout: 25309 Graphics: No Graphics CLEAN
JOB: 18-13101-10 CYCLE#;BL#: 5; 0 TRIM: 8.25" x 10.75" COMPOSITECOLORS: Black, ~note-color 2 GRAPHICS: none V1.5
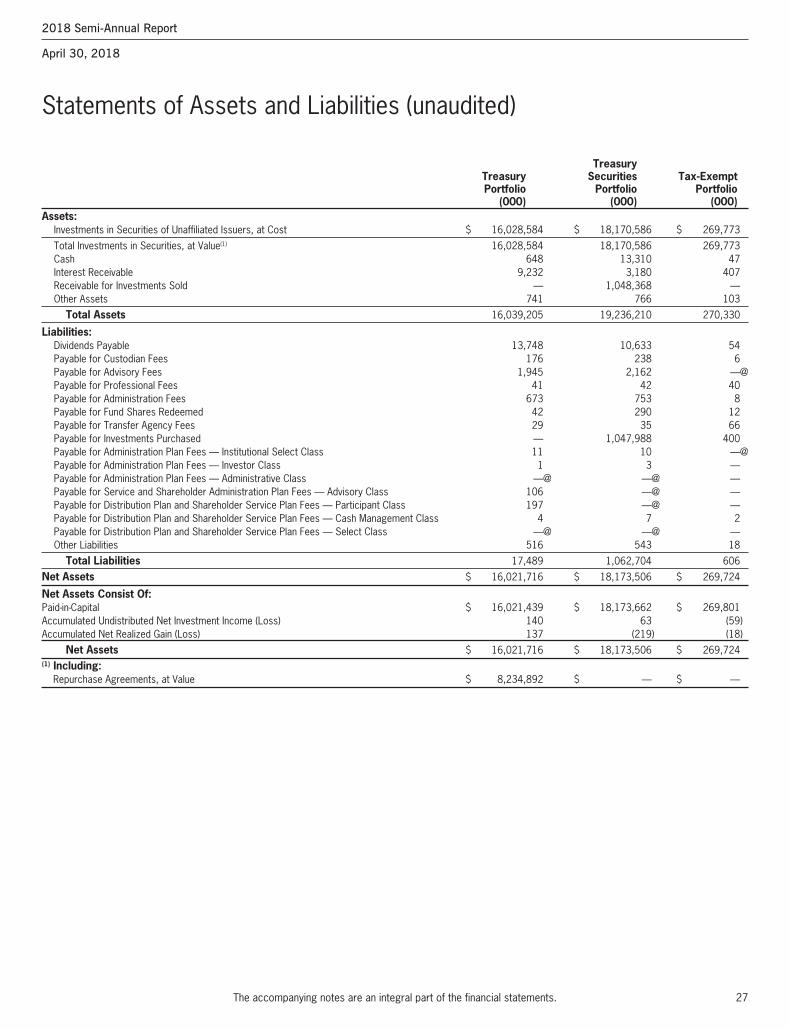
27
Statements of Assets and Liabilities (unaudited)
The accompanying notes are an integral part of the financial statements.
Treasury Treasury Securities Tax-Exempt Portfolio Portfolio Portfolio (000) (000) (000)Assets:
Investments in Securities of Unaffiliated Issuers, at Cost $ 16,028,584 $ 18,170,586 $ 269,773
Total Investments in Securities, at Value(1) 16,028,584 18,170,586 269,773Cash 648 13,310 47Interest Receivable 9,232 3,180 407Receivable for Investments Sold — 1,048,368 —Other Assets 741 766 103
Total Assets 16,039,205 19,236,210 270,330
Liabilities:Dividends Payable 13,748 10,633 54Payable for Custodian Fees 176 238 6Payable for Advisory Fees 1,945 2,162 —@Payable for Professional Fees 41 42 40Payable for Administration Fees 673 753 8Payable for Fund Shares Redeemed 42 290 12Payable for Transfer Agency Fees 29 35 66Payable for Investments Purchased — 1,047,988 400Payable for Administration Plan Fees — Institutional Select Class 11 10 —@Payable for Administration Plan Fees — Investor Class 1 3 —Payable for Administration Plan Fees — Administrative Class —@ —@ —Payable for Service and Shareholder Administration Plan Fees — Advisory Class 106 —@ —Payable for Distribution Plan and Shareholder Service Plan Fees — Participant Class 197 —@ —Payable for Distribution Plan and Shareholder Service Plan Fees — Cash Management Class 4 7 2Payable for Distribution Plan and Shareholder Service Plan Fees — Select Class —@ —@ —Other Liabilities 516 543 18
Total Liabilities 17,489 1,062,704 606
Net Assets $ 16,021,716 $ 18,173,506 $ 269,724
Net Assets Consist Of:Paid-in-Capital $ 16,021,439 $ 18,173,662 $ 269,801Accumulated Undistributed Net Investment Income (Loss) 140 63 (59)Accumulated Net Realized Gain (Loss) 137 (219) (18)
Net Assets $ 16,021,716 $ 18,173,506 $ 269,724(1) Including:
Repurchase Agreements, at Value $ 8,234,892 $ — $ —
2018 Semi-Annual Report
April 30, 2018
Merrill Corp - MS ILF Semi-Annual Report [Funds] 04-30-2018 ED [AUX] | thunt | 21-Jun-18 10:25 | 18-13101-10.da | Sequence: 3CHKSUM Content: 54406 Layout: 53290 Graphics: No Graphics CLEAN
JOB: 18-13101-10 CYCLE#;BL#: 5; 0 TRIM: 8.25" x 10.75" COMPOSITECOLORS: Black, ~note-color 2 GRAPHICS: none V1.5
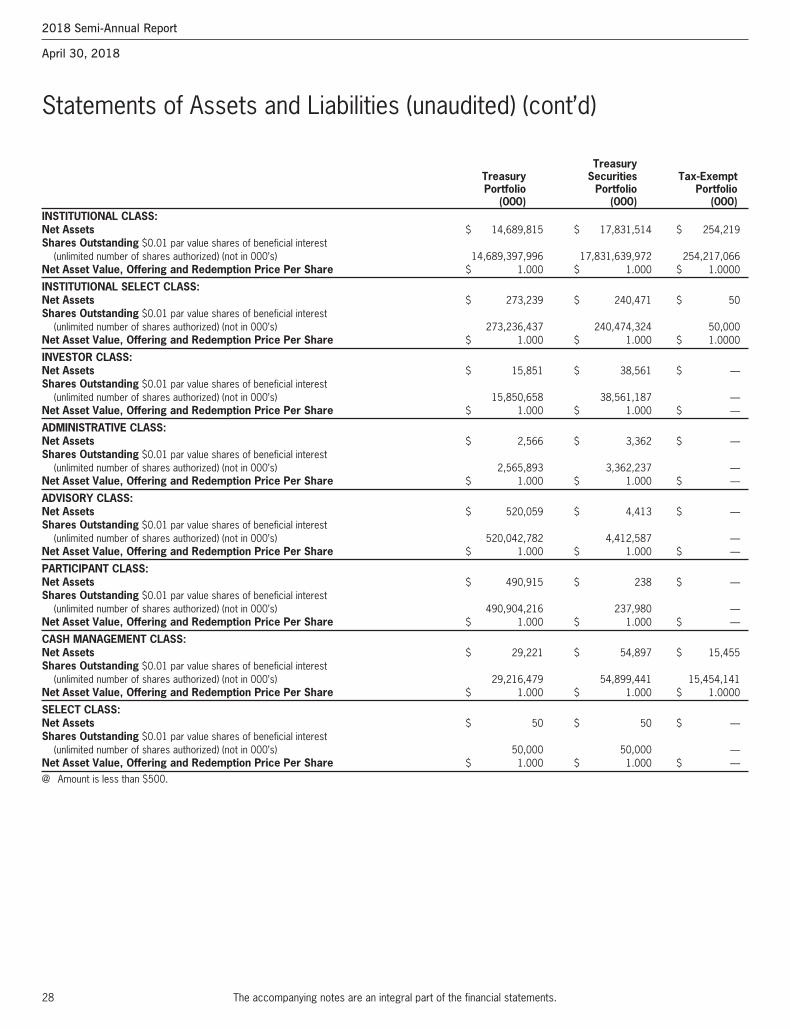
28
Statements of Assets and Liabilities (unaudited) (cont’d)
The accompanying notes are an integral part of the financial statements.
Treasury Treasury Securities Tax-Exempt Portfolio Portfolio Portfolio (000) (000) (000)INSTITUTIONAL CLASS:Net Assets $ 14,689,815 $ 17,831,514 $ 254,219Shares Outstanding $0.01 par value shares of beneficial interest
(unlimited number of shares authorized) (not in 000’s) 14,689,397,996 17,831,639,972 254,217,066Net Asset Value, Offering and Redemption Price Per Share $ 1.000 $ 1.000 $ 1.0000
INSTITUTIONAL SELECT CLASS:Net Assets $ 273,239 $ 240,471 $ 50Shares Outstanding $0.01 par value shares of beneficial interest
(unlimited number of shares authorized) (not in 000’s) 273,236,437 240,474,324 50,000Net Asset Value, Offering and Redemption Price Per Share $ 1.000 $ 1.000 $ 1.0000
INVESTOR CLASS:Net Assets $ 15,851 $ 38,561 $ —Shares Outstanding $0.01 par value shares of beneficial interest
(unlimited number of shares authorized) (not in 000’s) 15,850,658 38,561,187 —Net Asset Value, Offering and Redemption Price Per Share $ 1.000 $ 1.000 $ —
ADMINISTRATIVE CLASS:Net Assets $ 2,566 $ 3,362 $ —Shares Outstanding $0.01 par value shares of beneficial interest
(unlimited number of shares authorized) (not in 000’s) 2,565,893 3,362,237 —Net Asset Value, Offering and Redemption Price Per Share $ 1.000 $ 1.000 $ —
ADVISORY CLASS:Net Assets $ 520,059 $ 4,413 $ —Shares Outstanding $0.01 par value shares of beneficial interest
(unlimited number of shares authorized) (not in 000’s) 520,042,782 4,412,587 —Net Asset Value, Offering and Redemption Price Per Share $ 1.000 $ 1.000 $ —
PARTICIPANT CLASS:Net Assets $ 490,915 $ 238 $ —Shares Outstanding $0.01 par value shares of beneficial interest
(unlimited number of shares authorized) (not in 000’s) 490,904,216 237,980 —Net Asset Value, Offering and Redemption Price Per Share $ 1.000 $ 1.000 $ —
CASH MANAGEMENT CLASS:Net Assets $ 29,221 $ 54,897 $ 15,455Shares Outstanding $0.01 par value shares of beneficial interest
(unlimited number of shares authorized) (not in 000’s) 29,216,479 54,899,441 15,454,141Net Asset Value, Offering and Redemption Price Per Share $ 1.000 $ 1.000 $ 1.0000
SELECT CLASS:Net Assets $ 50 $ 50 $ —Shares Outstanding $0.01 par value shares of beneficial interest
(unlimited number of shares authorized) (not in 000’s) 50,000 50,000 —Net Asset Value, Offering and Redemption Price Per Share $ 1.000 $ 1.000 $ —
@ Amount is less than $500.
2018 Semi-Annual Report
April 30, 2018
Merrill Corp - MS ILF Semi-Annual Report [Funds] 04-30-2018 ED [AUX] | thunt | 21-Jun-18 10:25 | 18-13101-10.da | Sequence: 4CHKSUM Content: 28388 Layout: 25309 Graphics: No Graphics CLEAN
JOB: 18-13101-10 CYCLE#;BL#: 5; 0 TRIM: 8.25" x 10.75" COMPOSITECOLORS: Black, ~note-color 2 GRAPHICS: none V1.5
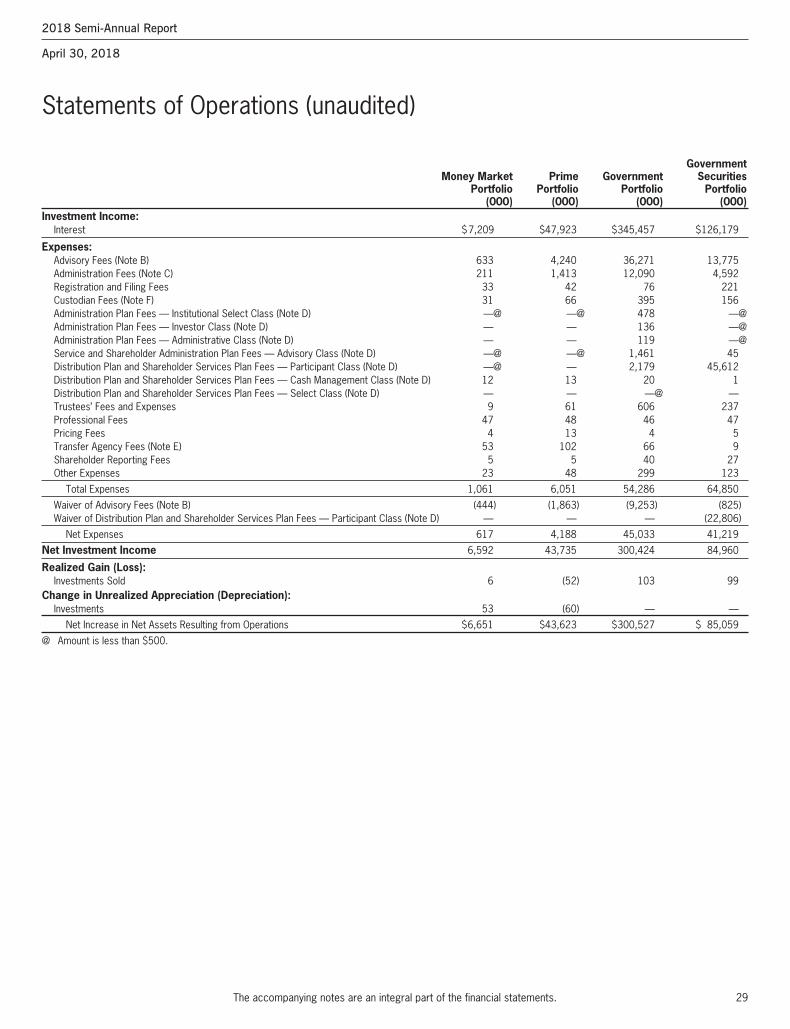
29
Statements of Operations (unaudited)
The accompanying notes are an integral part of the financial statements.
Government Money Market Prime Government Securities Portfolio Portfolio Portfolio Portfolio (000) (000) (000) (000)Investment Income:
Interest $7,209 $47,923 $345,457 $126,179
Expenses:Advisory Fees (Note B) 633 4,240 36,271 13,775Administration Fees (Note C) 211 1,413 12,090 4,592Registration and Filing Fees 33 42 76 221Custodian Fees (Note F) 31 66 395 156Administration Plan Fees — Institutional Select Class (Note D) —@ —@ 478 —@Administration Plan Fees — Investor Class (Note D) — — 136 —@Administration Plan Fees — Administrative Class (Note D) — — 119 —@Service and Shareholder Administration Plan Fees — Advisory Class (Note D) —@ —@ 1,461 45Distribution Plan and Shareholder Services Plan Fees — Participant Class (Note D) —@ — 2,179 45,612Distribution Plan and Shareholder Services Plan Fees — Cash Management Class (Note D) 12 13 20 1Distribution Plan and Shareholder Services Plan Fees — Select Class (Note D) — — —@ —Trustees’ Fees and Expenses 9 61 606 237Professional Fees 47 48 46 47Pricing Fees 4 13 4 5Transfer Agency Fees (Note E) 53 102 66 9Shareholder Reporting Fees 5 5 40 27Other Expenses 23 48 299 123
Total Expenses 1,061 6,051 54,286 64,850
Waiver of Advisory Fees (Note B) (444) (1,863) (9,253) (825)Waiver of Distribution Plan and Shareholder Services Plan Fees — Participant Class (Note D) — — — (22,806)
Net Expenses 617 4,188 45,033 41,219
Net Investment Income 6,592 43,735 300,424 84,960
Realized Gain (Loss):Investments Sold 6 (52) 103 99
Change in Unrealized Appreciation (Depreciation):Investments 53 (60) — —
Net Increase in Net Assets Resulting from Operations $6,651 $43,623 $300,527 $ 85,059
@ Amount is less than $500.
2018 Semi-Annual Report
April 30, 2018
Merrill Corp - MS ILF Semi-Annual Report [Funds] 04-30-2018 ED [AUX] | thunt | 21-Jun-18 10:25 | 18-13101-10.da | Sequence: 5CHKSUM Content: 38757 Layout: 5555 Graphics: No Graphics CLEAN
JOB: 18-13101-10 CYCLE#;BL#: 5; 0 TRIM: 8.25" x 10.75" COMPOSITECOLORS: Black, ~note-color 2 GRAPHICS: none V1.5
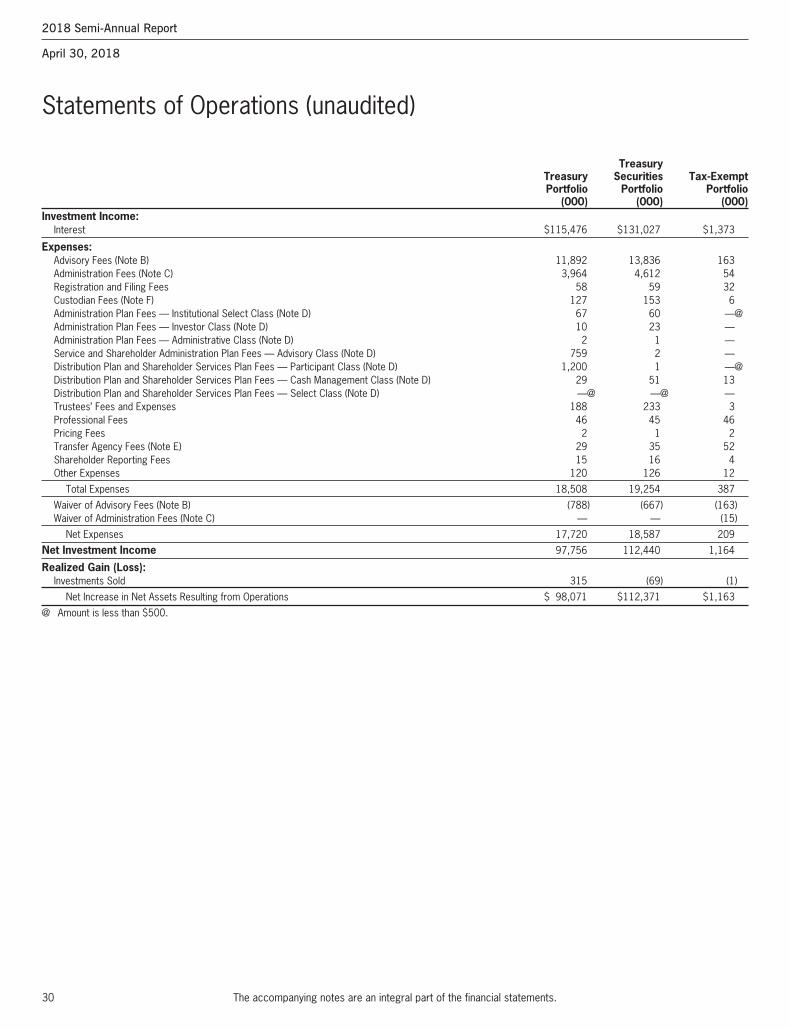
30
Statements of Operations (unaudited)
The accompanying notes are an integral part of the financial statements.
Treasury Treasury Securities Tax-Exempt Portfolio Portfolio Portfolio (000) (000) (000)Investment Income:
Interest $115,476 $131,027 $1,373
Expenses:Advisory Fees (Note B) 11,892 13,836 163Administration Fees (Note C) 3,964 4,612 54Registration and Filing Fees 58 59 32Custodian Fees (Note F) 127 153 6Administration Plan Fees — Institutional Select Class (Note D) 67 60 —@Administration Plan Fees — Investor Class (Note D) 10 23 —Administration Plan Fees — Administrative Class (Note D) 2 1 —Service and Shareholder Administration Plan Fees — Advisory Class (Note D) 759 2 —Distribution Plan and Shareholder Services Plan Fees — Participant Class (Note D) 1,200 1 —@Distribution Plan and Shareholder Services Plan Fees — Cash Management Class (Note D) 29 51 13Distribution Plan and Shareholder Services Plan Fees — Select Class (Note D) —@ —@ —Trustees’ Fees and Expenses 188 233 3Professional Fees 46 45 46Pricing Fees 2 1 2Transfer Agency Fees (Note E) 29 35 52Shareholder Reporting Fees 15 16 4Other Expenses 120 126 12
Total Expenses 18,508 19,254 387
Waiver of Advisory Fees (Note B) (788) (667) (163)Waiver of Administration Fees (Note C) — — (15)
Net Expenses 17,720 18,587 209
Net Investment Income 97,756 112,440 1,164
Realized Gain (Loss):Investments Sold 315 (69) (1)
Net Increase in Net Assets Resulting from Operations $ 98,071 $112,371 $1,163
@ Amount is less than $500.
2018 Semi-Annual Report
April 30, 2018
Merrill Corp - MS ILF Semi-Annual Report [Funds] 04-30-2018 ED [AUX] | thunt | 21-Jun-18 10:25 | 18-13101-10.da | Sequence: 6CHKSUM Content: 55547 Layout: 25309 Graphics: No Graphics CLEAN
JOB: 18-13101-10 CYCLE#;BL#: 5; 0 TRIM: 8.25" x 10.75" COMPOSITECOLORS: Black, ~note-color 2 GRAPHICS: none V1.5
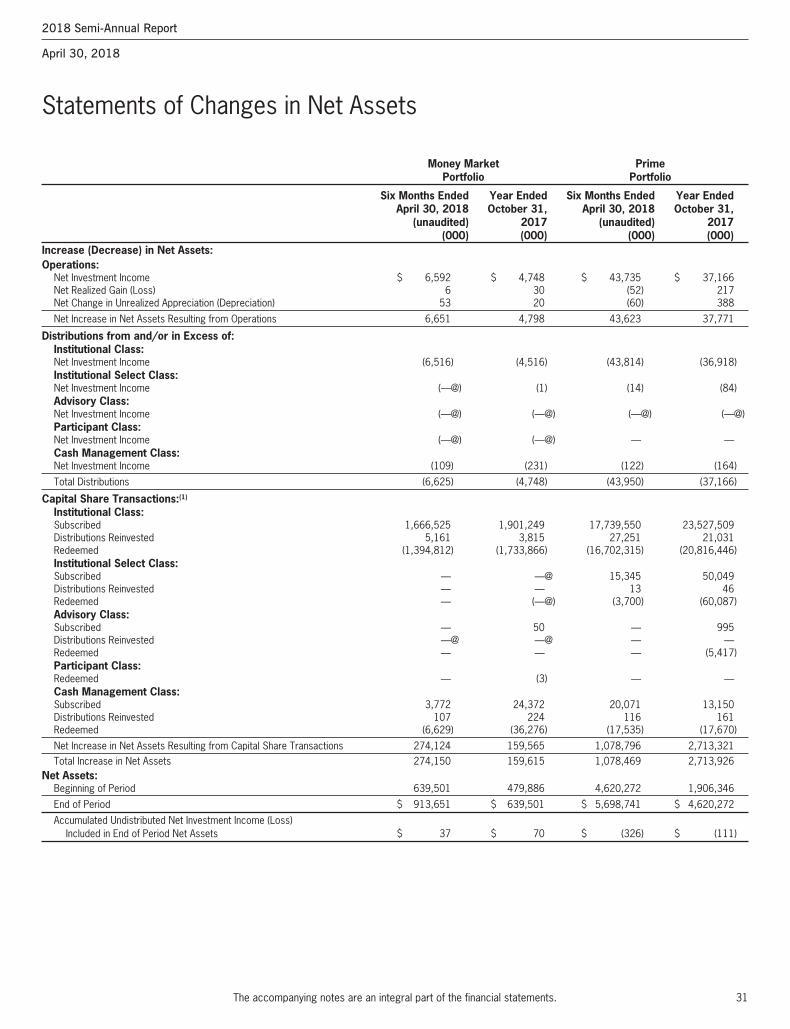
31
Statements of Changes in Net Assets
The accompanying notes are an integral part of the financial statements.
Money Market Prime Portfolio Portfolio
Six Months Ended Year Ended Six Months Ended Year Ended April 30, 2018 October 31, April 30, 2018 October 31, (unaudited) 2017 (unaudited) 2017 (000) (000) (000) (000)Increase (Decrease) in Net Assets:Operations:
Net Investment Income $ 6,592 $ 4,748 $ 43,735 $ 37,166Net Realized Gain (Loss) 6 30 (52) 217Net Change in Unrealized Appreciation (Depreciation) 53 20 (60) 388
Net Increase in Net Assets Resulting from Operations 6,651 4,798 43,623 37,771
Distributions from and/or in Excess of:Institutional Class:Net Investment Income (6,516) (4,516) (43,814) (36,918)Institutional Select Class:Net Investment Income (—@) (1) (14) (84)Advisory Class:Net Investment Income (—@) (—@) (—@) (—@)Participant Class:Net Investment Income (—@) (—@) — —Cash Management Class:Net Investment Income (109) (231) (122) (164)
Total Distributions (6,625) (4,748) (43,950) (37,166)
Capital Share Transactions:(1)
Institutional Class:Subscribed 1,666,525 1,901,249 17,739,550 23,527,509Distributions Reinvested 5,161 3,815 27,251 21,031Redeemed (1,394,812) (1,733,866) (16,702,315) (20,816,446)Institutional Select Class:Subscribed — —@ 15,345 50,049Distributions Reinvested — — 13 46Redeemed — (—@) (3,700) (60,087)Advisory Class:Subscribed — 50 — 995Distributions Reinvested —@ —@ — —Redeemed — — — (5,417)Participant Class:Redeemed — (3) — —Cash Management Class:Subscribed 3,772 24,372 20,071 13,150Distributions Reinvested 107 224 116 161Redeemed (6,629) (36,276) (17,535) (17,670)
Net Increase in Net Assets Resulting from Capital Share Transactions 274,124 159,565 1,078,796 2,713,321Total Increase in Net Assets 274,150 159,615 1,078,469 2,713,926
Net Assets:Beginning of Period 639,501 479,886 4,620,272 1,906,346
End of Period $ 913,651 $ 639,501 $ 5,698,741 $ 4,620,272
Accumulated Undistributed Net Investment Income (Loss) Included in End of Period Net Assets $ 37 $ 70 $ (326) $ (111)
2018 Semi-Annual Report
April 30, 2018
Merrill Corp - MS ILF Semi-Annual Report [Funds] 04-30-2018 ED [AUX] | thunt | 21-Jun-18 10:25 | 18-13101-10.da | Sequence: 7CHKSUM Content: 54476 Layout: 5555 Graphics: No Graphics CLEAN
JOB: 18-13101-10 CYCLE#;BL#: 5; 0 TRIM: 8.25" x 10.75" COMPOSITECOLORS: Black, ~note-color 2 GRAPHICS: none V1.5
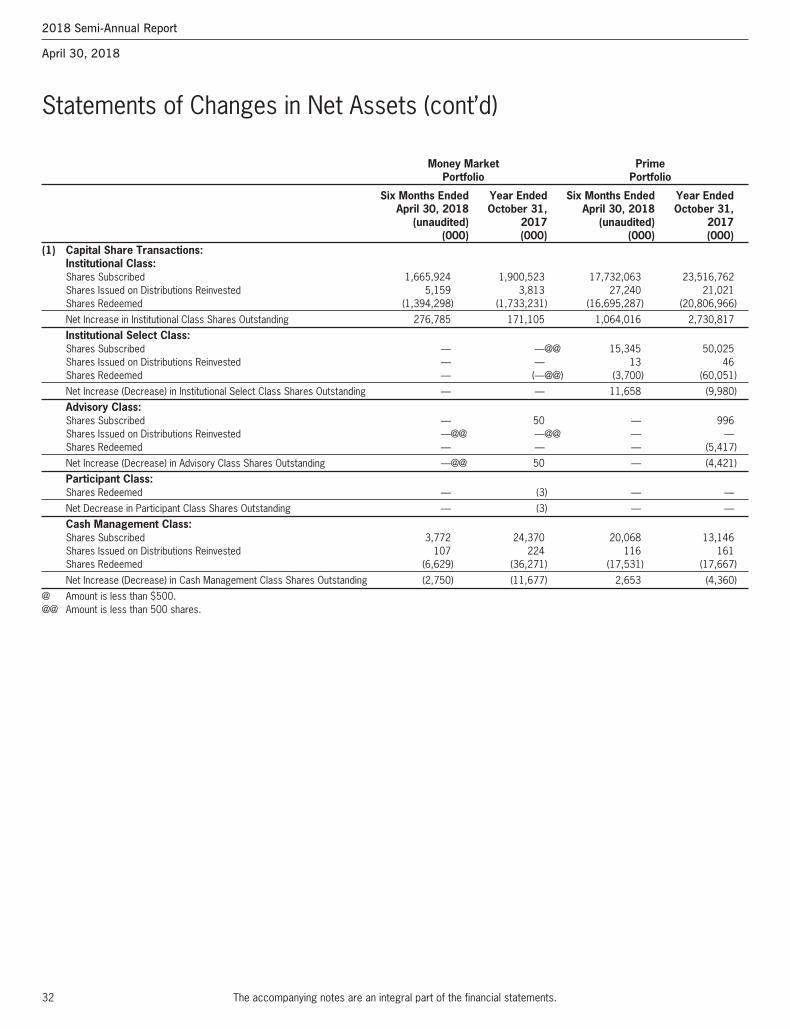
32
Statements of Changes in Net Assets (cont’d)
The accompanying notes are an integral part of the financial statements.
Money Market Prime Portfolio Portfolio
Six Months Ended Year Ended Six Months Ended Year Ended April 30, 2018 October 31, April 30, 2018 October 31, (unaudited) 2017 (unaudited) 2017 (000) (000) (000) (000)(1) Capital Share Transactions:
Institutional Class:Shares Subscribed 1,665,924 1,900,523 17,732,063 23,516,762Shares Issued on Distributions Reinvested 5,159 3,813 27,240 21,021Shares Redeemed (1,394,298) (1,733,231) (16,695,287) (20,806,966)
Net Increase in Institutional Class Shares Outstanding 276,785 171,105 1,064,016 2,730,817
Institutional Select Class:Shares Subscribed — —@@ 15,345 50,025Shares Issued on Distributions Reinvested — — 13 46Shares Redeemed — (—@@) (3,700) (60,051)
Net Increase (Decrease) in Institutional Select Class Shares Outstanding — — 11,658 (9,980)
Advisory Class:Shares Subscribed — 50 — 996Shares Issued on Distributions Reinvested —@@ —@@ — —Shares Redeemed — — — (5,417)
Net Increase (Decrease) in Advisory Class Shares Outstanding —@@ 50 — (4,421)
Participant Class:Shares Redeemed — (3) — —
Net Decrease in Participant Class Shares Outstanding — (3) — —
Cash Management Class:Shares Subscribed 3,772 24,370 20,068 13,146Shares Issued on Distributions Reinvested 107 224 116 161Shares Redeemed (6,629) (36,271) (17,531) (17,667)
Net Increase (Decrease) in Cash Management Class Shares Outstanding (2,750) (11,677) 2,653 (4,360)
@ Amount is less than $500.@@ Amount is less than 500 shares.
2018 Semi-Annual Report
April 30, 2018
Merrill Corp - MS ILF Semi-Annual Report [Funds] 04-30-2018 ED [AUX] | thunt | 21-Jun-18 10:25 | 18-13101-10.da | Sequence: 8CHKSUM Content: 15322 Layout: 47719 Graphics: No Graphics CLEAN
JOB: 18-13101-10 CYCLE#;BL#: 5; 0 TRIM: 8.25" x 10.75" COMPOSITECOLORS: Black, ~note-color 2 GRAPHICS: none V1.5
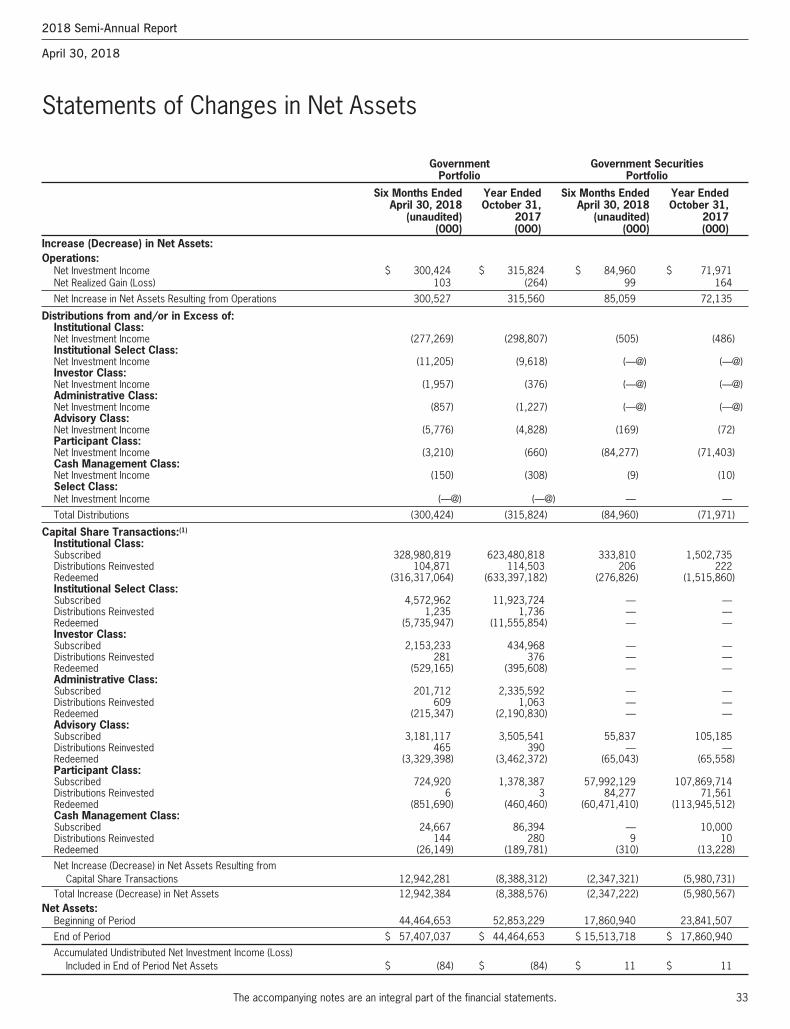
33
Statements of Changes in Net Assets
The accompanying notes are an integral part of the financial statements.
Government Government Securities Portfolio Portfolio
Six Months Ended Year Ended Six Months Ended Year Ended April 30, 2018 October 31, April 30, 2018 October 31, (unaudited) 2017 (unaudited) 2017 (000) (000) (000) (000)Increase (Decrease) in Net Assets:Operations:
Net Investment Income $ 300,424 $ 315,824 $ 84,960 $ 71,971Net Realized Gain (Loss) 103 (264) 99 164
Net Increase in Net Assets Resulting from Operations 300,527 315,560 85,059 72,135
Distributions from and/or in Excess of:Institutional Class:Net Investment Income (277,269) (298,807) (505) (486)Institutional Select Class:Net Investment Income (11,205) (9,618) (—@) (—@)Investor Class:Net Investment Income (1,957) (376) (—@) (—@)Administrative Class:Net Investment Income (857) (1,227) (—@) (—@)Advisory Class:Net Investment Income (5,776) (4,828) (169) (72)Participant Class:Net Investment Income (3,210) (660) (84,277) (71,403)Cash Management Class:Net Investment Income (150) (308) (9) (10)Select Class:Net Investment Income (—@) (—@) — —
Total Distributions (300,424) (315,824) (84,960) (71,971)
Capital Share Transactions:(1)
Institutional Class:Subscribed 328,980,819 623,480,818 333,810 1,502,735Distributions Reinvested 104,871 114,503 206 222Redeemed (316,317,064) (633,397,182) (276,826) (1,515,860)Institutional Select Class:Subscribed 4,572,962 11,923,724 — —Distributions Reinvested 1,235 1,736 — —Redeemed (5,735,947) (11,555,854) — —Investor Class:Subscribed 2,153,233 434,968 — —Distributions Reinvested 281 376 — —Redeemed (529,165) (395,608) — —Administrative Class:Subscribed 201,712 2,335,592 — —Distributions Reinvested 609 1,063 — —Redeemed (215,347) (2,190,830) — —Advisory Class:Subscribed 3,181,117 3,505,541 55,837 105,185Distributions Reinvested 465 390 — —Redeemed (3,329,398) (3,462,372) (65,043) (65,558)Participant Class:Subscribed 724,920 1,378,387 57,992,129 107,869,714Distributions Reinvested 6 3 84,277 71,561Redeemed (851,690) (460,460) (60,471,410) (113,945,512)Cash Management Class:Subscribed 24,667 86,394 — 10,000Distributions Reinvested 144 280 9 10Redeemed (26,149) (189,781) (310) (13,228)
Net Increase (Decrease) in Net Assets Resulting from Capital Share Transactions 12,942,281 (8,388,312) (2,347,321) (5,980,731)
Total Increase (Decrease) in Net Assets 12,942,384 (8,388,576) (2,347,222) (5,980,567)Net Assets:
Beginning of Period 44,464,653 52,853,229 17,860,940 23,841,507
End of Period $ 57,407,037 $ 44,464,653 $ 15,513,718 $ 17,860,940
Accumulated Undistributed Net Investment Income (Loss) Included in End of Period Net Assets $ (84) $ (84) $ 11 $ 11
2018 Semi-Annual Report
April 30, 2018
Merrill Corp - MS ILF Semi-Annual Report [Funds] 04-30-2018 ED [AUX] | thunt | 21-Jun-18 10:25 | 18-13101-10.da | Sequence: 9CHKSUM Content: 49005 Layout: 8130 Graphics: No Graphics CLEAN
JOB: 18-13101-10 CYCLE#;BL#: 5; 0 TRIM: 8.25" x 10.75" COMPOSITECOLORS: Black, ~note-color 2 GRAPHICS: none V1.5
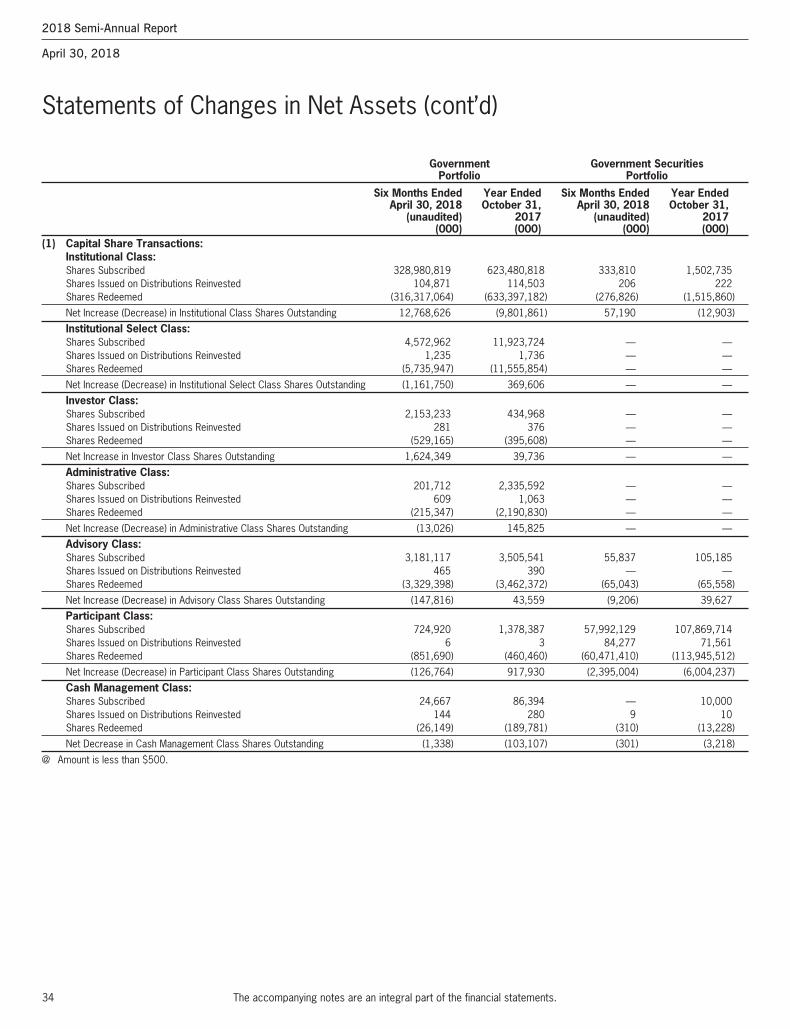
34
Statements of Changes in Net Assets (cont’d)
The accompanying notes are an integral part of the financial statements.
Government Government Securities Portfolio Portfolio
Six Months Ended Year Ended Six Months Ended Year Ended April 30, 2018 October 31, April 30, 2018 October 31, (unaudited) 2017 (unaudited) 2017 (000) (000) (000) (000)(1) Capital Share Transactions:
Institutional Class:Shares Subscribed 328,980,819 623,480,818 333,810 1,502,735Shares Issued on Distributions Reinvested 104,871 114,503 206 222Shares Redeemed (316,317,064) (633,397,182) (276,826) (1,515,860)
Net Increase (Decrease) in Institutional Class Shares Outstanding 12,768,626 (9,801,861) 57,190 (12,903)
Institutional Select Class:Shares Subscribed 4,572,962 11,923,724 — —Shares Issued on Distributions Reinvested 1,235 1,736 — —Shares Redeemed (5,735,947) (11,555,854) — —
Net Increase (Decrease) in Institutional Select Class Shares Outstanding (1,161,750) 369,606 — —
Investor Class:Shares Subscribed 2,153,233 434,968 — —Shares Issued on Distributions Reinvested 281 376 — —Shares Redeemed (529,165) (395,608) — —
Net Increase in Investor Class Shares Outstanding 1,624,349 39,736 — —
Administrative Class:Shares Subscribed 201,712 2,335,592 — —Shares Issued on Distributions Reinvested 609 1,063 — —Shares Redeemed (215,347) (2,190,830) — —
Net Increase (Decrease) in Administrative Class Shares Outstanding (13,026) 145,825 — —
Advisory Class:Shares Subscribed 3,181,117 3,505,541 55,837 105,185Shares Issued on Distributions Reinvested 465 390 — —Shares Redeemed (3,329,398) (3,462,372) (65,043) (65,558)
Net Increase (Decrease) in Advisory Class Shares Outstanding (147,816) 43,559 (9,206) 39,627
Participant Class:Shares Subscribed 724,920 1,378,387 57,992,129 107,869,714Shares Issued on Distributions Reinvested 6 3 84,277 71,561Shares Redeemed (851,690) (460,460) (60,471,410) (113,945,512)
Net Increase (Decrease) in Participant Class Shares Outstanding (126,764) 917,930 (2,395,004) (6,004,237)
Cash Management Class:Shares Subscribed 24,667 86,394 — 10,000Shares Issued on Distributions Reinvested 144 280 9 10Shares Redeemed (26,149) (189,781) (310) (13,228)
Net Decrease in Cash Management Class Shares Outstanding (1,338) (103,107) (301) (3,218)
@ Amount is less than $500.
2018 Semi-Annual Report
April 30, 2018
Merrill Corp - MS ILF Semi-Annual Report [Funds] 04-30-2018 ED [AUX] | thunt | 21-Jun-18 10:25 | 18-13101-10.da | Sequence: 10CHKSUM Content: 56700 Layout: 35554 Graphics: No Graphics CLEAN
JOB: 18-13101-10 CYCLE#;BL#: 5; 0 TRIM: 8.25" x 10.75" COMPOSITECOLORS: Black, ~note-color 2 GRAPHICS: none V1.5
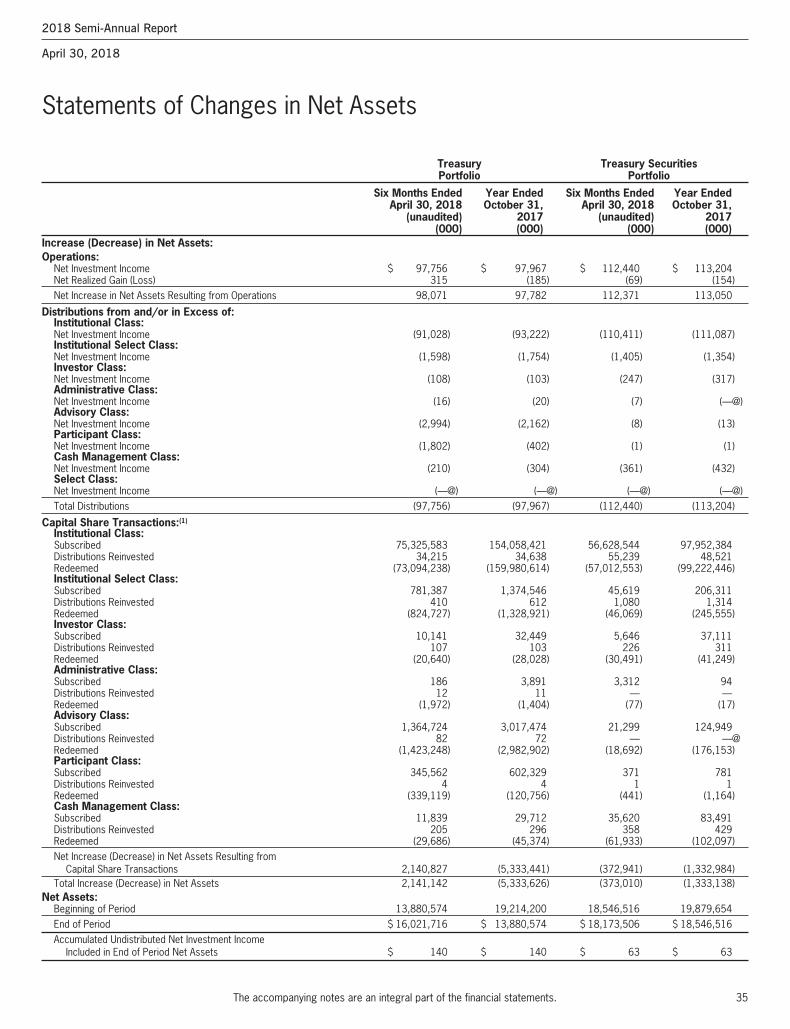
35
Statements of Changes in Net Assets
The accompanying notes are an integral part of the financial statements.
Treasury Treasury Securities Portfolio Portfolio
Six Months Ended Year Ended Six Months Ended Year Ended April 30, 2018 October 31, April 30, 2018 October 31, (unaudited) 2017 (unaudited) 2017 (000) (000) (000) (000)Increase (Decrease) in Net Assets:Operations:
Net Investment Income $ 97,756 $ 97,967 $ 112,440 $ 113,204Net Realized Gain (Loss) 315 (185) (69) (154)Net Increase in Net Assets Resulting from Operations 98,071 97,782 112,371 113,050
Distributions from and/or in Excess of:Institutional Class:Net Investment Income (91,028) (93,222) (110,411) (111,087)Institutional Select Class:Net Investment Income (1,598) (1,754) (1,405) (1,354)Investor Class:Net Investment Income (108) (103) (247) (317)Administrative Class:Net Investment Income (16) (20) (7) (—@)Advisory Class:Net Investment Income (2,994) (2,162) (8) (13)Participant Class:Net Investment Income (1,802) (402) (1) (1)Cash Management Class:Net Investment Income (210) (304) (361) (432)Select Class:Net Investment Income (—@) (—@) (—@) (—@)Total Distributions (97,756) (97,967) (112,440) (113,204)
Capital Share Transactions:(1)
Institutional Class:Subscribed 75,325,583 154,058,421 56,628,544 97,952,384Distributions Reinvested 34,215 34,638 55,239 48,521Redeemed (73,094,238) (159,980,614) (57,012,553) (99,222,446)Institutional Select Class:Subscribed 781,387 1,374,546 45,619 206,311Distributions Reinvested 410 612 1,080 1,314Redeemed (824,727) (1,328,921) (46,069) (245,555)Investor Class:Subscribed 10,141 32,449 5,646 37,111Distributions Reinvested 107 103 226 311Redeemed (20,640) (28,028) (30,491) (41,249)Administrative Class:Subscribed 186 3,891 3,312 94Distributions Reinvested 12 11 — —Redeemed (1,972) (1,404) (77) (17)Advisory Class:Subscribed 1,364,724 3,017,474 21,299 124,949Distributions Reinvested 82 72 — —@Redeemed (1,423,248) (2,982,902) (18,692) (176,153)Participant Class:Subscribed 345,562 602,329 371 781Distributions Reinvested 4 4 1 1Redeemed (339,119) (120,756) (441) (1,164)Cash Management Class:Subscribed 11,839 29,712 35,620 83,491Distributions Reinvested 205 296 358 429Redeemed (29,686) (45,374) (61,933) (102,097)Net Increase (Decrease) in Net Assets Resulting from
Capital Share Transactions 2,140,827 (5,333,441) (372,941) (1,332,984)Total Increase (Decrease) in Net Assets 2,141,142 (5,333,626) (373,010) (1,333,138)
Net Assets:Beginning of Period 13,880,574 19,214,200 18,546,516 19,879,654End of Period $ 16,021,716 $ 13,880,574 $ 18,173,506 $ 18,546,516Accumulated Undistributed Net Investment Income
Included in End of Period Net Assets $ 140 $ 140 $ 63 $ 63
2018 Semi-Annual Report
April 30, 2018
Merrill Corp - MS ILF Semi-Annual Report [Funds] 04-30-2018 ED [AUX] | thunt | 21-Jun-18 10:25 | 18-13101-10.da | Sequence: 11CHKSUM Content: 24526 Layout: 14027 Graphics: No Graphics CLEAN
JOB: 18-13101-10 CYCLE#;BL#: 5; 0 TRIM: 8.25" x 10.75" COMPOSITECOLORS: Black, ~note-color 2 GRAPHICS: none V1.5
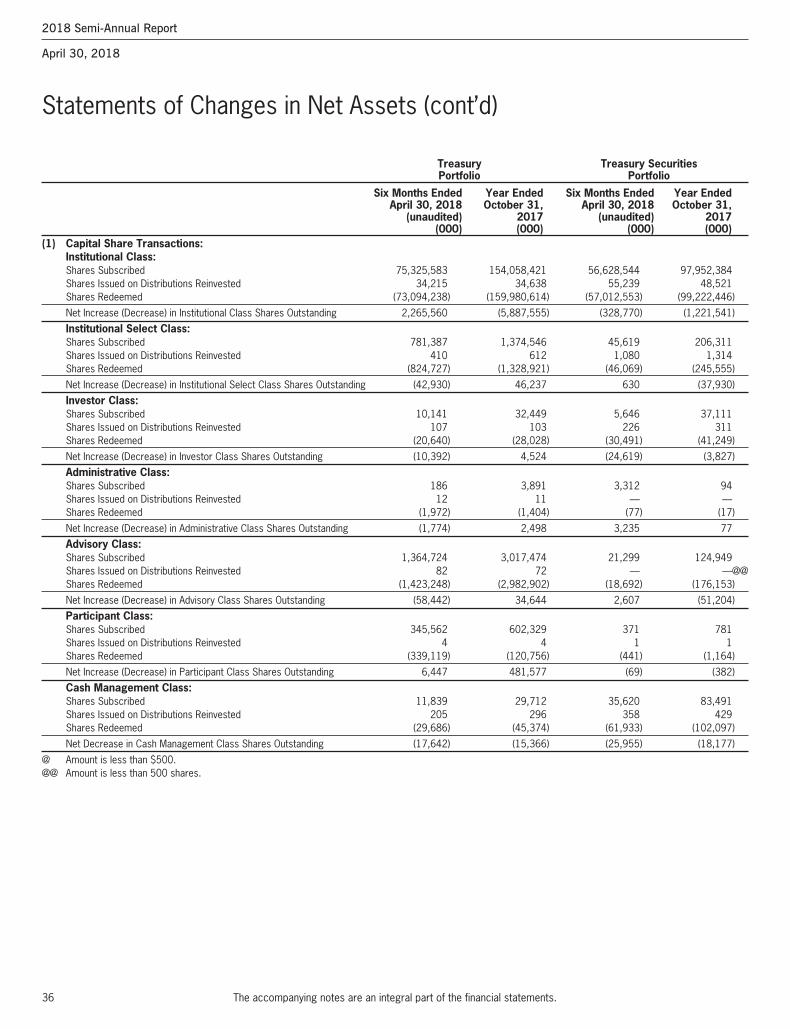
36
Statements of Changes in Net Assets (cont’d)
The accompanying notes are an integral part of the financial statements.
Treasury Treasury Securities Portfolio Portfolio
Six Months Ended Year Ended Six Months Ended Year Ended April 30, 2018 October 31, April 30, 2018 October 31, (unaudited) 2017 (unaudited) 2017 (000) (000) (000) (000)(1) Capital Share Transactions:
Institutional Class:Shares Subscribed 75,325,583 154,058,421 56,628,544 97,952,384Shares Issued on Distributions Reinvested 34,215 34,638 55,239 48,521Shares Redeemed (73,094,238) (159,980,614) (57,012,553) (99,222,446)
Net Increase (Decrease) in Institutional Class Shares Outstanding 2,265,560 (5,887,555) (328,770) (1,221,541)
Institutional Select Class:Shares Subscribed 781,387 1,374,546 45,619 206,311Shares Issued on Distributions Reinvested 410 612 1,080 1,314Shares Redeemed (824,727) (1,328,921) (46,069) (245,555)
Net Increase (Decrease) in Institutional Select Class Shares Outstanding (42,930) 46,237 630 (37,930)
Investor Class:Shares Subscribed 10,141 32,449 5,646 37,111Shares Issued on Distributions Reinvested 107 103 226 311Shares Redeemed (20,640) (28,028) (30,491) (41,249)
Net Increase (Decrease) in Investor Class Shares Outstanding (10,392) 4,524 (24,619) (3,827)
Administrative Class:Shares Subscribed 186 3,891 3,312 94Shares Issued on Distributions Reinvested 12 11 — —Shares Redeemed (1,972) (1,404) (77) (17)
Net Increase (Decrease) in Administrative Class Shares Outstanding (1,774) 2,498 3,235 77
Advisory Class:Shares Subscribed 1,364,724 3,017,474 21,299 124,949Shares Issued on Distributions Reinvested 82 72 — —@@Shares Redeemed (1,423,248) (2,982,902) (18,692) (176,153)
Net Increase (Decrease) in Advisory Class Shares Outstanding (58,442) 34,644 2,607 (51,204)
Participant Class:Shares Subscribed 345,562 602,329 371 781Shares Issued on Distributions Reinvested 4 4 1 1Shares Redeemed (339,119) (120,756) (441) (1,164)
Net Increase (Decrease) in Participant Class Shares Outstanding 6,447 481,577 (69) (382)
Cash Management Class:Shares Subscribed 11,839 29,712 35,620 83,491Shares Issued on Distributions Reinvested 205 296 358 429Shares Redeemed (29,686) (45,374) (61,933) (102,097)
Net Decrease in Cash Management Class Shares Outstanding (17,642) (15,366) (25,955) (18,177)
@ Amount is less than $500.@@ Amount is less than 500 shares.
2018 Semi-Annual Report
April 30, 2018
Merrill Corp - MS ILF Semi-Annual Report [Funds] 04-30-2018 ED [AUX] | thunt | 21-Jun-18 10:25 | 18-13101-10.da | Sequence: 12CHKSUM Content: 14418 Layout: 62273 Graphics: No Graphics CLEAN
JOB: 18-13101-10 CYCLE#;BL#: 5; 0 TRIM: 8.25" x 10.75" COMPOSITECOLORS: Black, ~note-color 2 GRAPHICS: none V1.5
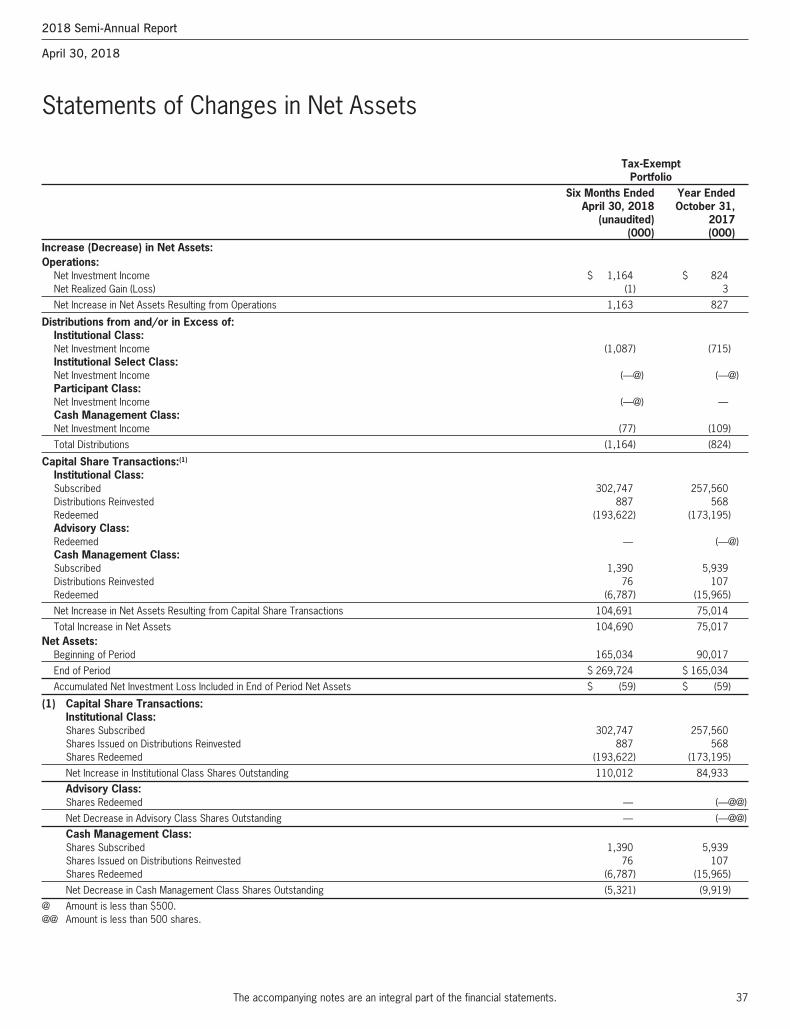
37
Statements of Changes in Net Assets
The accompanying notes are an integral part of the financial statements.
Tax-Exempt Portfolio Six Months Ended Year Ended April 30, 2018 October 31, (unaudited) 2017 (000) (000)Increase (Decrease) in Net Assets:Operations:
Net Investment Income $ 1,164 $ 824Net Realized Gain (Loss) (1) 3
Net Increase in Net Assets Resulting from Operations 1,163 827
Distributions from and/or in Excess of:Institutional Class:Net Investment Income (1,087) (715)Institutional Select Class:Net Investment Income (—@) (—@)Participant Class:Net Investment Income (—@) —Cash Management Class:Net Investment Income (77) (109)
Total Distributions (1,164) (824)
Capital Share Transactions:(1)
Institutional Class:Subscribed 302,747 257,560Distributions Reinvested 887 568Redeemed (193,622) (173,195)Advisory Class:Redeemed — (—@)Cash Management Class:Subscribed 1,390 5,939Distributions Reinvested 76 107Redeemed (6,787) (15,965)
Net Increase in Net Assets Resulting from Capital Share Transactions 104,691 75,014
Total Increase in Net Assets 104,690 75,017Net Assets:
Beginning of Period 165,034 90,017
End of Period $ 269,724 $ 165,034
Accumulated Net Investment Loss Included in End of Period Net Assets $ (59) $ (59)
(1) Capital Share Transactions:Institutional Class:Shares Subscribed 302,747 257,560Shares Issued on Distributions Reinvested 887 568Shares Redeemed (193,622) (173,195)
Net Increase in Institutional Class Shares Outstanding 110,012 84,933
Advisory Class:Shares Redeemed — (—@@)
Net Decrease in Advisory Class Shares Outstanding — (—@@)
Cash Management Class:Shares Subscribed 1,390 5,939Shares Issued on Distributions Reinvested 76 107Shares Redeemed (6,787) (15,965)
Net Decrease in Cash Management Class Shares Outstanding (5,321) (9,919)
@ Amount is less than $500.@@ Amount is less than 500 shares.
2018 Semi-Annual Report
April 30, 2018
Merrill Corp - MS ILF Semi-Annual Report [Funds] 04-30-2018 ED [AUX] | thunt | 21-Jun-18 10:25 | 18-13101-10.da | Sequence: 13CHKSUM Content: 12354 Layout: 48351 Graphics: No Graphics CLEAN
JOB: 18-13101-10 CYCLE#;BL#: 5; 0 TRIM: 8.25" x 10.75" COMPOSITECOLORS: Black, ~note-color 2 GRAPHICS: none V1.5
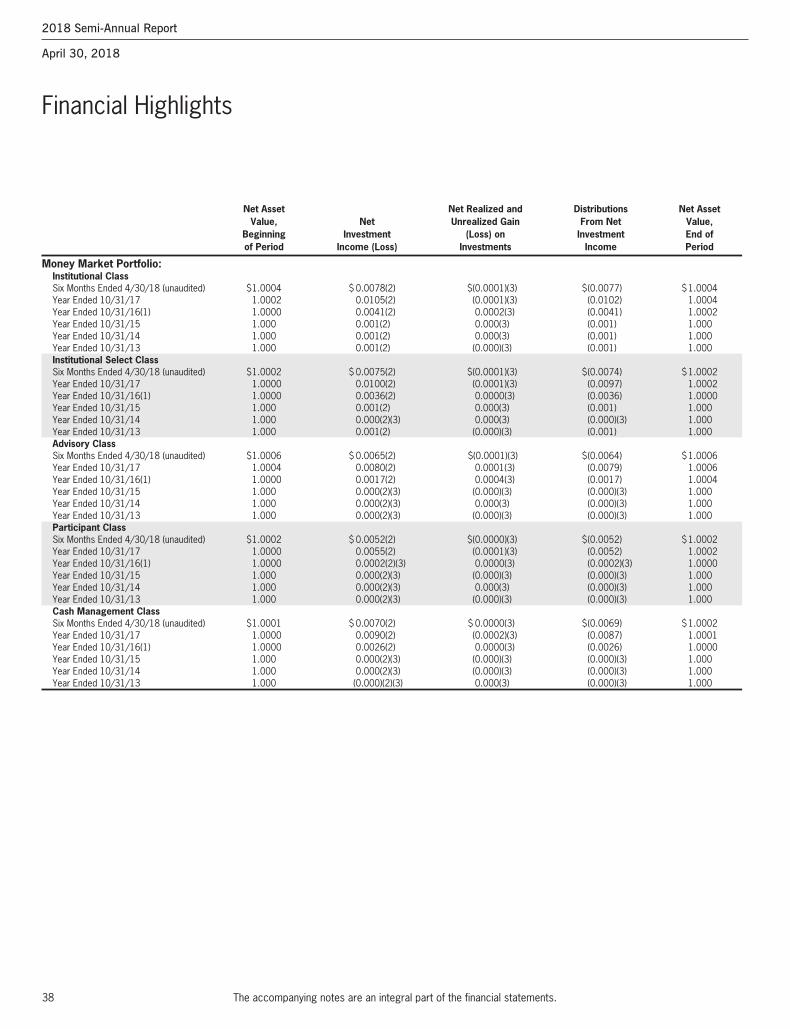
38
Financial Highlights
The accompanying notes are an integral part of the financial statements.
Net Asset Net Realized and Distributions Net Asset Value, Net Unrealized Gain From Net Value, Beginning Investment (Loss) on Investment End of of Period Income (Loss) Investments Income Period
Money Market Portfolio:Institutional ClassSix Months Ended 4/30/18 (unaudited) $1.0004 $ 0.0078(2) $(0.0001)(3) $(0.0077) $1.0004 Year Ended 10/31/17 1.0002 0.0105(2) (0.0001)(3) (0.0102) 1.0004 Year Ended 10/31/16(1) 1.0000 0.0041(2) 0.0002(3) (0.0041) 1.0002 Year Ended 10/31/15 1.000 0.001(2) 0.000(3) (0.001) 1.000 Year Ended 10/31/14 1.000 0.001(2) 0.000(3) (0.001) 1.000 Year Ended 10/31/13 1.000 0.001(2) (0.000)(3) (0.001) 1.000 Institutional Select ClassSix Months Ended 4/30/18 (unaudited) $1.0002 $ 0.0075(2) $(0.0001)(3) $(0.0074) $1.0002 Year Ended 10/31/17 1.0000 0.0100(2) (0.0001)(3) (0.0097) 1.0002 Year Ended 10/31/16(1) 1.0000 0.0036(2) 0.0000(3) (0.0036) 1.0000 Year Ended 10/31/15 1.000 0.001(2) 0.000(3) (0.001) 1.000 Year Ended 10/31/14 1.000 0.000(2)(3) 0.000(3) (0.000)(3) 1.000 Year Ended 10/31/13 1.000 0.001(2) (0.000)(3) (0.001) 1.000 Advisory ClassSix Months Ended 4/30/18 (unaudited) $1.0006 $ 0.0065(2) $(0.0001)(3) $(0.0064) $1.0006 Year Ended 10/31/17 1.0004 0.0080(2) 0.0001(3) (0.0079) 1.0006 Year Ended 10/31/16(1) 1.0000 0.0017(2) 0.0004(3) (0.0017) 1.0004 Year Ended 10/31/15 1.000 0.000(2)(3) (0.000)(3) (0.000)(3) 1.000 Year Ended 10/31/14 1.000 0.000(2)(3) 0.000(3) (0.000)(3) 1.000 Year Ended 10/31/13 1.000 0.000(2)(3) (0.000)(3) (0.000)(3) 1.000 Participant ClassSix Months Ended 4/30/18 (unaudited) $1.0002 $ 0.0052(2) $(0.0000)(3) $(0.0052) $1.0002 Year Ended 10/31/17 1.0000 0.0055(2) (0.0001)(3) (0.0052) 1.0002 Year Ended 10/31/16(1) 1.0000 0.0002(2)(3) 0.0000(3) (0.0002)(3) 1.0000 Year Ended 10/31/15 1.000 0.000(2)(3) (0.000)(3) (0.000)(3) 1.000 Year Ended 10/31/14 1.000 0.000(2)(3) 0.000(3) (0.000)(3) 1.000 Year Ended 10/31/13 1.000 0.000(2)(3) (0.000)(3) (0.000)(3) 1.000 Cash Management ClassSix Months Ended 4/30/18 (unaudited) $1.0001 $ 0.0070(2) $ 0.0000(3) $(0.0069) $1.0002 Year Ended 10/31/17 1.0000 0.0090(2) (0.0002)(3) (0.0087) 1.0001 Year Ended 10/31/16(1) 1.0000 0.0026(2) 0.0000(3) (0.0026) 1.0000 Year Ended 10/31/15 1.000 0.000(2)(3) (0.000)(3) (0.000)(3) 1.000 Year Ended 10/31/14 1.000 0.000(2)(3) (0.000)(3) (0.000)(3) 1.000 Year Ended 10/31/13 1.000 (0.000)(2)(3) 0.000(3) (0.000)(3) 1.000
2018 Semi-Annual Report
April 30, 2018
Merrill Corp - MS ILF Semi-Annual Report [Funds] 04-30-2018 ED [AUX] | thunt | 21-Jun-18 10:26 | 18-13101-10.ea | Sequence: 1CHKSUM Content: 36650 Layout: 46710 Graphics: No Graphics CLEAN
JOB: 18-13101-10 CYCLE#;BL#: 5; 0 TRIM: 8.25" x 10.75" COMPOSITECOLORS: Black, ~note-color 2 GRAPHICS: none V1.5
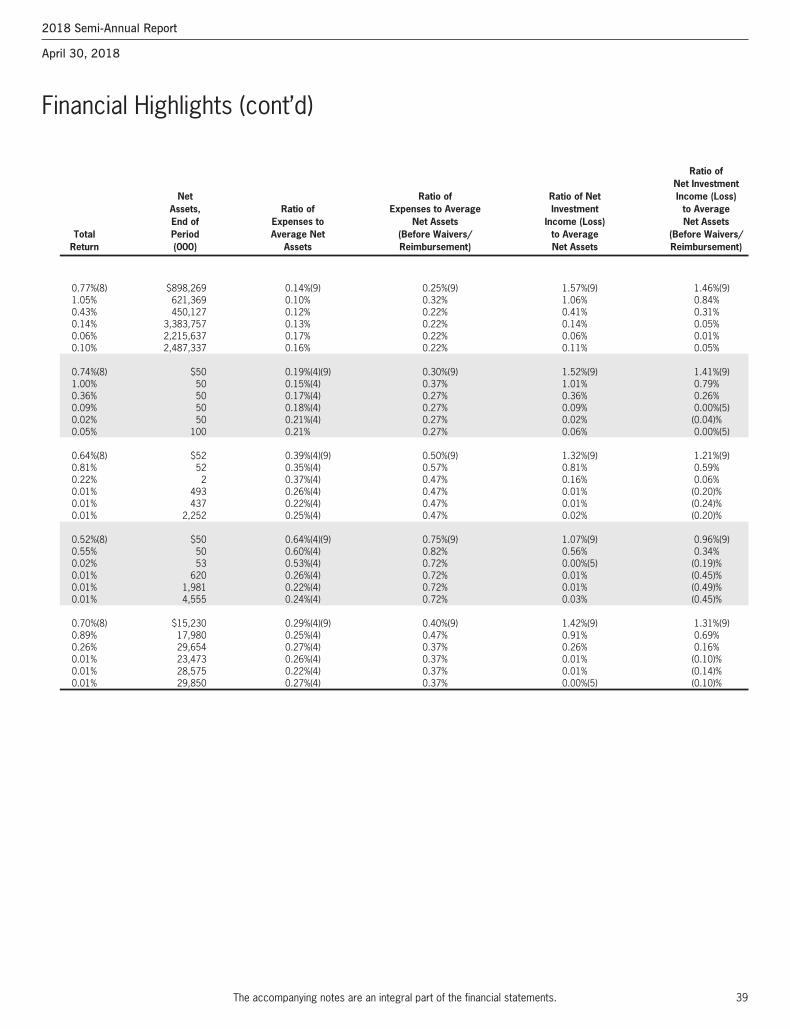
39
Financial Highlights (cont’d)
The accompanying notes are an integral part of the financial statements.
2018 Semi-Annual Report
April 30, 2018
Ratio of Net Investment Net Ratio of Ratio of Net Income (Loss) Assets, Ratio of Expenses to Average Investment to Average End of Expenses to Net Assets Income (Loss) Net Assets Total Period Average Net (Before Waivers/ to Average (Before Waivers/ Return (000) Assets Reimbursement) Net Assets Reimbursement)
0.77%(8) $898,269 0.14%(9) 0.25%(9) 1.57%(9) 1.46%(9) 1.05% 621,369 0.10% 0.32% 1.06% 0.84% 0.43% 450,127 0.12% 0.22% 0.41% 0.31% 0.14% 3,383,757 0.13% 0.22% 0.14% 0.05% 0.06% 2,215,637 0.17% 0.22% 0.06% 0.01% 0.10% 2,487,337 0.16% 0.22% 0.11% 0.05%
0.74%(8) $50 0.19%(4)(9) 0.30%(9) 1.52%(9) 1.41%(9) 1.00% 50 0.15%(4) 0.37% 1.01% 0.79% 0.36% 50 0.17%(4) 0.27% 0.36% 0.26% 0.09% 50 0.18%(4) 0.27% 0.09% 0.00%(5) 0.02% 50 0.21%(4) 0.27% 0.02% (0.04)% 0.05% 100 0.21% 0.27% 0.06% 0.00%(5)
0.64%(8) $52 0.39%(4)(9) 0.50%(9) 1.32%(9) 1.21%(9) 0.81% 52 0.35%(4) 0.57% 0.81% 0.59% 0.22% 2 0.37%(4) 0.47% 0.16% 0.06% 0.01% 493 0.26%(4) 0.47% 0.01% (0.20)% 0.01% 437 0.22%(4) 0.47% 0.01% (0.24)% 0.01% 2,252 0.25%(4) 0.47% 0.02% (0.20)%
0.52%(8) $50 0.64%(4)(9) 0.75%(9) 1.07%(9) 0.96%(9) 0.55% 50 0.60%(4) 0.82% 0.56% 0.34% 0.02% 53 0.53%(4) 0.72% 0.00%(5) (0.19)% 0.01% 620 0.26%(4) 0.72% 0.01% (0.45)% 0.01% 1,981 0.22%(4) 0.72% 0.01% (0.49)% 0.01% 4,555 0.24%(4) 0.72% 0.03% (0.45)%
0.70%(8) $15,230 0.29%(4)(9) 0.40%(9) 1.42%(9) 1.31%(9) 0.89% 17,980 0.25%(4) 0.47% 0.91% 0.69% 0.26% 29,654 0.27%(4) 0.37% 0.26% 0.16% 0.01% 23,473 0.26%(4) 0.37% 0.01% (0.10)% 0.01% 28,575 0.22%(4) 0.37% 0.01% (0.14)% 0.01% 29,850 0.27%(4) 0.37% 0.00%(5) (0.10)%
Merrill Corp - MS ILF Semi-Annual Report [Funds] 04-30-2018 ED [AUX] | thunt | 21-Jun-18 10:26 | 18-13101-10.ea | Sequence: 2CHKSUM Content: 50533 Layout: 35811 Graphics: No Graphics CLEAN
JOB: 18-13101-10 CYCLE#;BL#: 5; 0 TRIM: 8.25" x 10.75" COMPOSITECOLORS: Black, ~note-color 2 GRAPHICS: none V1.5

40
Financial Highlights
The accompanying notes are an integral part of the financial statements.
Net Asset Net Realized and Distributions Net Asset Value, Net Unrealized Gain From Net Value, Beginning Investment (Loss) on Investment End of of Period Income Investments Income Period
Prime Portfolio:Institutional ClassSix Months Ended 4/30/18 (unaudited) $1.0005 $0.0077(2) $(0.0002)(3) $(0.0076) $1.0004 Year Ended 10/31/17 1.0002 0.0109(2) (0.0005)(3) (0.0101) 1.0005 Year Ended 10/31/16(1) 1.0000 0.0036(2) 0.0002(3) (0.0036) 1.0002 Year Ended 10/31/15 1.000 0.001(2) 0.000(3) (0.001) 1.000 Year Ended 10/31/14 1.000 0.000(2)(3) (0.000)(3) (0.000)(3) 1.000 Year Ended 10/31/13 1.000 0.001(2) (0.000)(3) (0.001) 1.000 Institutional Select ClassSix Months Ended 4/30/18 (unaudited) $1.0000 $0.0074(2) $ 0.0001(3) $(0.0074) $1.0001 Year Ended 10/31/17 1.0005 0.0104(2) (0.0033) (0.0076) 1.0000 Year Ended 10/31/16(1) 1.0000 0.0031(2) 0.0005(3) (0.0031) 1.0005 Year Ended 10/31/15 1.000 0.000(2)(3) (0.000)(3) (0.000)(3) 1.000 Year Ended 10/31/14 1.000 0.000(2)(3) (0.000)(3) (0.000)(3) 1.000 Year Ended 10/31/13 1.000 0.000(2)(3) 0.000(3) (0.000)(3) 1.000 Advisory ClassSix Months Ended 4/30/18 (unaudited) $1.0000 $0.0064(2) $ 0.0000(3) $(0.0064) $1.0000 Year Ended 10/31/17 1.0000 0.0086(2) (0.0038) (0.0048) 1.0000 Year Ended 10/31/16(1) 1.0000 0.0013(2) 0.0000(3) (0.0013) 1.0000 Year Ended 10/31/15 1.000 0.000(2)(3) 0.000(3) (0.000)(3) 1.000 Year Ended 10/31/14 1.000 0.000(2)(3) (0.000)(3) (0.000)(3) 1.000 Year Ended 10/31/13 1.000 0.000(2)(3) (0.000)(3) (0.000)(3) 1.000 Cash Management ClassSix Months Ended 4/30/18 (unaudited) $1.0003 $0.0069(2) $(0.0001)(3) $(0.0069) $1.0002 Year Ended 10/31/17 1.0000 0.0094(2) (0.0005)(3) (0.0086) 1.0003 Year Ended 10/31/16(1) 1.0000 0.0022(2) 0.000(3) (0.0022) 1.0000 Year Ended 10/31/15 1.000 0.000(2)(3) 0.000(3) (0.000)(3) 1.000 Year Ended 10/31/14 1.000 0.000(2)(3) 0.000(3) (0.000)(3) 1.000 Year Ended 10/31/13 1.000 0.000(2)(3) 0.000(3) (0.000)(3) 1.000
2018 Semi-Annual Report
April 30, 2018
Merrill Corp - MS ILF Semi-Annual Report [Funds] 04-30-2018 ED [AUX] | thunt | 21-Jun-18 10:26 | 18-13101-10.ea | Sequence: 3CHKSUM Content: 64863 Layout: 46710 Graphics: No Graphics CLEAN
JOB: 18-13101-10 CYCLE#;BL#: 5; 0 TRIM: 8.25" x 10.75" COMPOSITECOLORS: Black, ~note-color 2 GRAPHICS: none V1.5
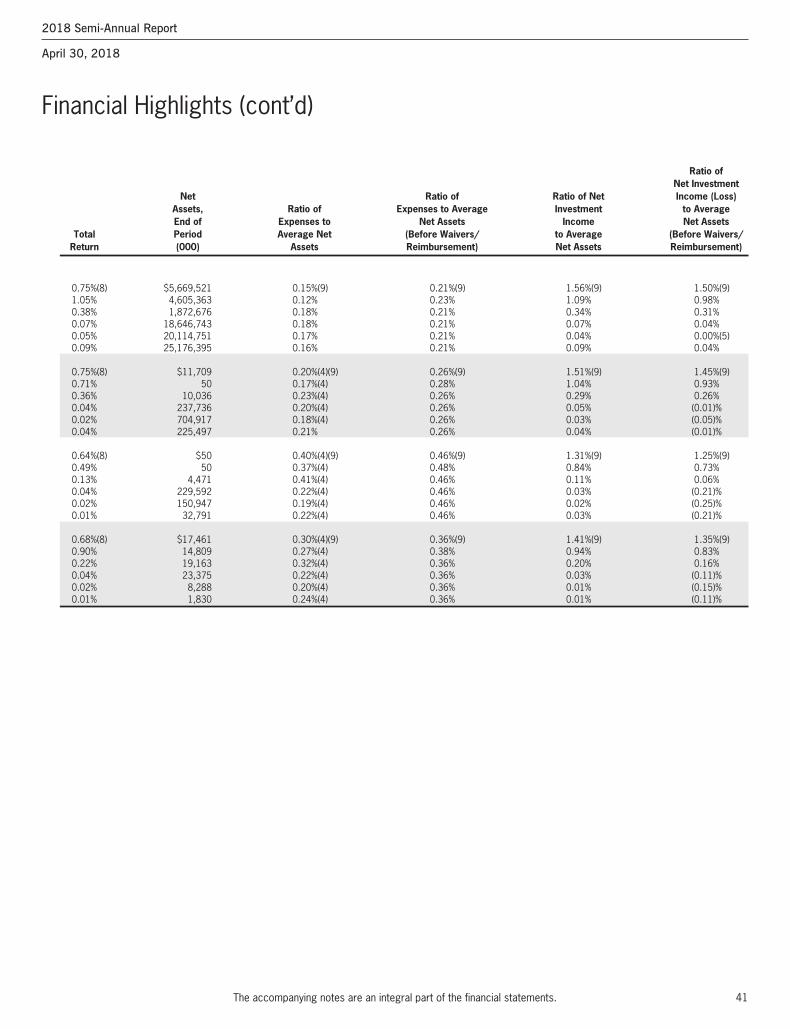
41
Financial Highlights (cont’d)
The accompanying notes are an integral part of the financial statements.
2018 Semi-Annual Report
April 30, 2018
Ratio of Net Investment Net Ratio of Ratio of Net Income (Loss) Assets, Ratio of Expenses to Average Investment to Average End of Expenses to Net Assets Income Net Assets Total Period Average Net (Before Waivers/ to Average (Before Waivers/ Return (000) Assets Reimbursement) Net Assets Reimbursement)
0.75%(8) $5,669,521 0.15%(9) 0.21%(9) 1.56%(9) 1.50%(9) 1.05% 4,605,363 0.12% 0.23% 1.09% 0.98% 0.38% 1,872,676 0.18% 0.21% 0.34% 0.31% 0.07% 18,646,743 0.18% 0.21% 0.07% 0.04% 0.05% 20,114,751 0.17% 0.21% 0.04% 0.00%(5) 0.09% 25,176,395 0.16% 0.21% 0.09% 0.04%
0.75%(8) $11,709 0.20%(4)(9) 0.26%(9) 1.51%(9) 1.45%(9) 0.71% 50 0.17%(4) 0.28% 1.04% 0.93% 0.36% 10,036 0.23%(4) 0.26% 0.29% 0.26% 0.04% 237,736 0.20%(4) 0.26% 0.05% (0.01)% 0.02% 704,917 0.18%(4) 0.26% 0.03% (0.05)% 0.04% 225,497 0.21% 0.26% 0.04% (0.01)%
0.64%(8) $50 0.40%(4)(9) 0.46%(9) 1.31%(9) 1.25%(9) 0.49% 50 0.37%(4) 0.48% 0.84% 0.73% 0.13% 4,471 0.41%(4) 0.46% 0.11% 0.06% 0.04% 229,592 0.22%(4) 0.46% 0.03% (0.21)% 0.02% 150,947 0.19%(4) 0.46% 0.02% (0.25)% 0.01% 32,791 0.22%(4) 0.46% 0.03% (0.21)%
0.68%(8) $17,461 0.30%(4)(9) 0.36%(9) 1.41%(9) 1.35%(9) 0.90% 14,809 0.27%(4) 0.38% 0.94% 0.83% 0.22% 19,163 0.32%(4) 0.36% 0.20% 0.16% 0.04% 23,375 0.22%(4) 0.36% 0.03% (0.11)% 0.02% 8,288 0.20%(4) 0.36% 0.01% (0.15)% 0.01% 1,830 0.24%(4) 0.36% 0.01% (0.11)%
Merrill Corp - MS ILF Semi-Annual Report [Funds] 04-30-2018 ED [AUX] | thunt | 21-Jun-18 10:26 | 18-13101-10.ea | Sequence: 4CHKSUM Content: 40270 Layout: 24807 Graphics: No Graphics CLEAN
JOB: 18-13101-10 CYCLE#;BL#: 5; 0 TRIM: 8.25" x 10.75" COMPOSITECOLORS: Black, ~note-color 2 GRAPHICS: none V1.5
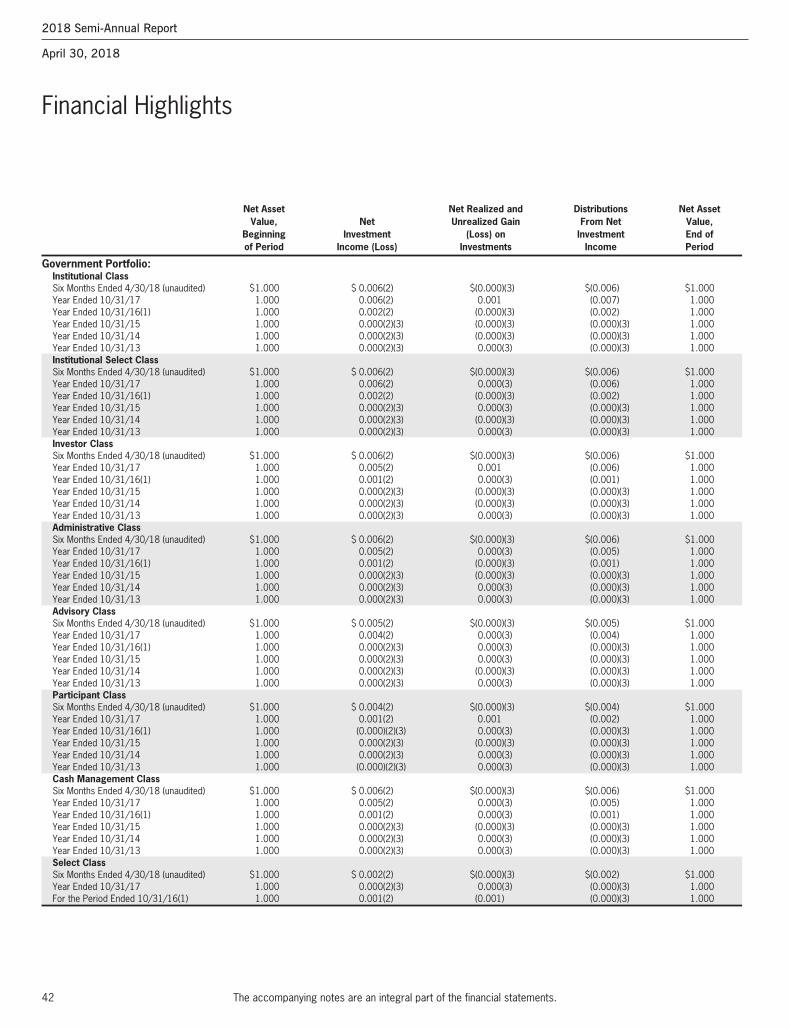
42
Financial Highlights
The accompanying notes are an integral part of the financial statements.
Net Asset Net Realized and Distributions Net Asset Value, Net Unrealized Gain From Net Value, Beginning Investment (Loss) on Investment End of of Period Income (Loss) Investments Income Period
Government Portfolio:Institutional ClassSix Months Ended 4/30/18 (unaudited) $1.000 $ 0.006(2) $(0.000)(3) $(0.006) $1.000 Year Ended 10/31/17 1.000 0.006(2) 0.001 (0.007) 1.000 Year Ended 10/31/16(1) 1.000 0.002(2) (0.000)(3) (0.002) 1.000 Year Ended 10/31/15 1.000 0.000(2)(3) (0.000)(3) (0.000)(3) 1.000 Year Ended 10/31/14 1.000 0.000(2)(3) (0.000)(3) (0.000)(3) 1.000 Year Ended 10/31/13 1.000 0.000(2)(3) 0.000(3) (0.000)(3) 1.000 Institutional Select ClassSix Months Ended 4/30/18 (unaudited) $1.000 $ 0.006(2) $(0.000)(3) $(0.006) $1.000 Year Ended 10/31/17 1.000 0.006(2) 0.000(3) (0.006) 1.000 Year Ended 10/31/16(1) 1.000 0.002(2) (0.000)(3) (0.002) 1.000 Year Ended 10/31/15 1.000 0.000(2)(3) 0.000(3) (0.000)(3) 1.000 Year Ended 10/31/14 1.000 0.000(2)(3) (0.000)(3) (0.000)(3) 1.000 Year Ended 10/31/13 1.000 0.000(2)(3) 0.000(3) (0.000)(3) 1.000 Investor ClassSix Months Ended 4/30/18 (unaudited) $1.000 $ 0.006(2) $(0.000)(3) $(0.006) $1.000 Year Ended 10/31/17 1.000 0.005(2) 0.001 (0.006) 1.000 Year Ended 10/31/16(1) 1.000 0.001(2) 0.000(3) (0.001) 1.000 Year Ended 10/31/15 1.000 0.000(2)(3) (0.000)(3) (0.000)(3) 1.000 Year Ended 10/31/14 1.000 0.000(2)(3) (0.000)(3) (0.000)(3) 1.000 Year Ended 10/31/13 1.000 0.000(2)(3) 0.000(3) (0.000)(3) 1.000 Administrative ClassSix Months Ended 4/30/18 (unaudited) $1.000 $ 0.006(2) $(0.000)(3) $(0.006) $1.000 Year Ended 10/31/17 1.000 0.005(2) 0.000(3) (0.005) 1.000 Year Ended 10/31/16(1) 1.000 0.001(2) (0.000)(3) (0.001) 1.000 Year Ended 10/31/15 1.000 0.000(2)(3) (0.000)(3) (0.000)(3) 1.000 Year Ended 10/31/14 1.000 0.000(2)(3) 0.000(3) (0.000)(3) 1.000 Year Ended 10/31/13 1.000 0.000(2)(3) 0.000(3) (0.000)(3) 1.000 Advisory ClassSix Months Ended 4/30/18 (unaudited) $1.000 $ 0.005(2) $(0.000)(3) $(0.005) $1.000 Year Ended 10/31/17 1.000 0.004(2) 0.000(3) (0.004) 1.000 Year Ended 10/31/16(1) 1.000 0.000(2)(3) 0.000(3) (0.000)(3) 1.000 Year Ended 10/31/15 1.000 0.000(2)(3) 0.000(3) (0.000)(3) 1.000 Year Ended 10/31/14 1.000 0.000(2)(3) (0.000)(3) (0.000)(3) 1.000 Year Ended 10/31/13 1.000 0.000(2)(3) 0.000(3) (0.000)(3) 1.000 Participant ClassSix Months Ended 4/30/18 (unaudited) $1.000 $ 0.004(2) $(0.000)(3) $(0.004) $1.000 Year Ended 10/31/17 1.000 0.001(2) 0.001 (0.002) 1.000 Year Ended 10/31/16(1) 1.000 (0.000)(2)(3) 0.000(3) (0.000)(3) 1.000 Year Ended 10/31/15 1.000 0.000(2)(3) (0.000)(3) (0.000)(3) 1.000 Year Ended 10/31/14 1.000 0.000(2)(3) 0.000(3) (0.000)(3) 1.000 Year Ended 10/31/13 1.000 (0.000)(2)(3) 0.000(3) (0.000)(3) 1.000 Cash Management ClassSix Months Ended 4/30/18 (unaudited) $1.000 $ 0.006(2) $(0.000)(3) $(0.006) $1.000 Year Ended 10/31/17 1.000 0.005(2) 0.000(3) (0.005) 1.000 Year Ended 10/31/16(1) 1.000 0.001(2) 0.000(3) (0.001) 1.000 Year Ended 10/31/15 1.000 0.000(2)(3) (0.000)(3) (0.000)(3) 1.000 Year Ended 10/31/14 1.000 0.000(2)(3) 0.000(3) (0.000)(3) 1.000 Year Ended 10/31/13 1.000 0.000(2)(3) 0.000(3) (0.000)(3) 1.000 Select ClassSix Months Ended 4/30/18 (unaudited) $1.000 $ 0.002(2) $(0.000)(3) $(0.002) $1.000 Year Ended 10/31/17 1.000 0.000(2)(3) 0.000(3) (0.000)(3) 1.000 For the Period Ended 10/31/16(1) 1.000 0.001(2) (0.001) (0.000)(3) 1.000
2018 Semi-Annual Report
April 30, 2018
Merrill Corp - MS ILF Semi-Annual Report [Funds] 04-30-2018 ED [AUX] | thunt | 21-Jun-18 10:26 | 18-13101-10.ea | Sequence: 5CHKSUM Content: 20185 Layout: 46710 Graphics: No Graphics CLEAN
JOB: 18-13101-10 CYCLE#;BL#: 5; 0 TRIM: 8.25" x 10.75" COMPOSITECOLORS: Black, ~note-color 2 GRAPHICS: none V1.5
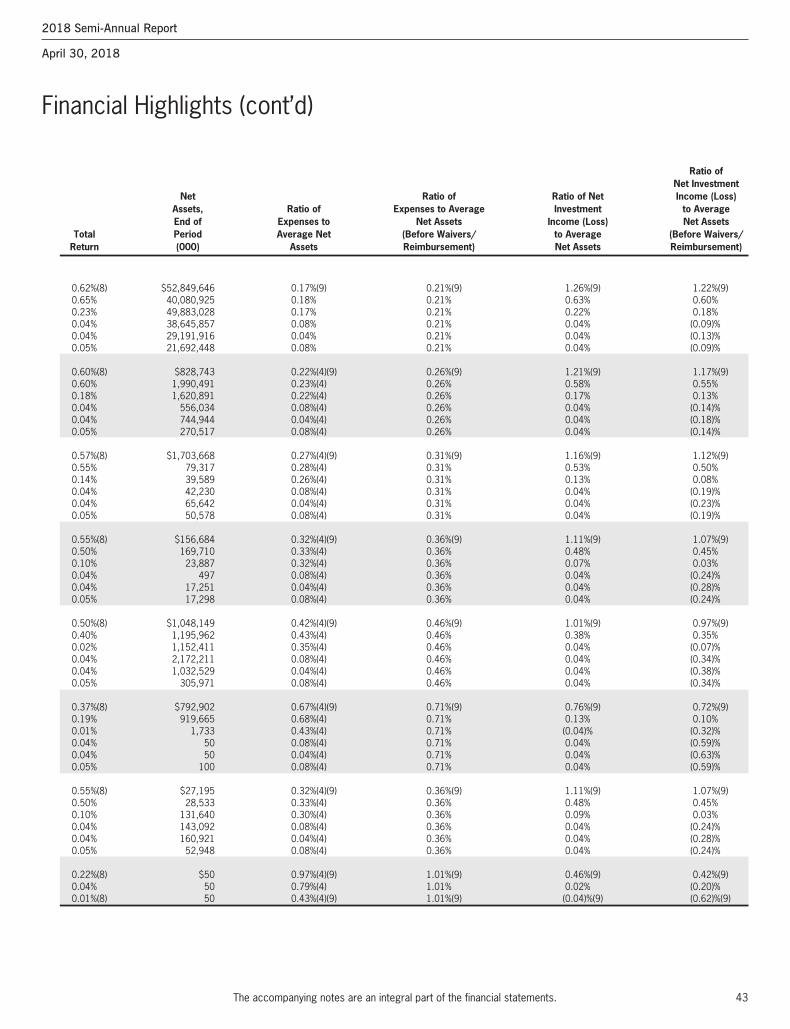
43
Financial Highlights (cont’d)
The accompanying notes are an integral part of the financial statements.
2018 Semi-Annual Report
April 30, 2018
Ratio of Net Investment Net Ratio of Ratio of Net Income (Loss) Assets, Ratio of Expenses to Average Investment to Average End of Expenses to Net Assets Income (Loss) Net Assets Total Period Average Net (Before Waivers/ to Average (Before Waivers/ Return (000) Assets Reimbursement) Net Assets Reimbursement)
0.62%(8) $52,849,646 0.17%(9) 0.21%(9) 1.26%(9) 1.22%(9) 0.65% 40,080,925 0.18% 0.21% 0.63% 0.60% 0.23% 49,883,028 0.17% 0.21% 0.22% 0.18% 0.04% 38,645,857 0.08% 0.21% 0.04% (0.09)% 0.04% 29,191,916 0.04% 0.21% 0.04% (0.13)% 0.05% 21,692,448 0.08% 0.21% 0.04% (0.09)%
0.60%(8) $828,743 0.22%(4)(9) 0.26%(9) 1.21%(9) 1.17%(9) 0.60% 1,990,491 0.23%(4) 0.26% 0.58% 0.55% 0.18% 1,620,891 0.22%(4) 0.26% 0.17% 0.13% 0.04% 556,034 0.08%(4) 0.26% 0.04% (0.14)% 0.04% 744,944 0.04%(4) 0.26% 0.04% (0.18)% 0.05% 270,517 0.08%(4) 0.26% 0.04% (0.14)%
0.57%(8) $1,703,668 0.27%(4)(9) 0.31%(9) 1.16%(9) 1.12%(9) 0.55% 79,317 0.28%(4) 0.31% 0.53% 0.50% 0.14% 39,589 0.26%(4) 0.31% 0.13% 0.08% 0.04% 42,230 0.08%(4) 0.31% 0.04% (0.19)% 0.04% 65,642 0.04%(4) 0.31% 0.04% (0.23)% 0.05% 50,578 0.08%(4) 0.31% 0.04% (0.19)%
0.55%(8) $156,684 0.32%(4)(9) 0.36%(9) 1.11%(9) 1.07%(9) 0.50% 169,710 0.33%(4) 0.36% 0.48% 0.45% 0.10% 23,887 0.32%(4) 0.36% 0.07% 0.03% 0.04% 497 0.08%(4) 0.36% 0.04% (0.24)% 0.04% 17,251 0.04%(4) 0.36% 0.04% (0.28)% 0.05% 17,298 0.08%(4) 0.36% 0.04% (0.24)%
0.50%(8) $1,048,149 0.42%(4)(9) 0.46%(9) 1.01%(9) 0.97%(9) 0.40% 1,195,962 0.43%(4) 0.46% 0.38% 0.35% 0.02% 1,152,411 0.35%(4) 0.46% 0.04% (0.07)% 0.04% 2,172,211 0.08%(4) 0.46% 0.04% (0.34)% 0.04% 1,032,529 0.04%(4) 0.46% 0.04% (0.38)% 0.05% 305,971 0.08%(4) 0.46% 0.04% (0.34)%
0.37%(8) $792,902 0.67%(4)(9) 0.71%(9) 0.76%(9) 0.72%(9) 0.19% 919,665 0.68%(4) 0.71% 0.13% 0.10% 0.01% 1,733 0.43%(4) 0.71% (0.04)% (0.32)% 0.04% 50 0.08%(4) 0.71% 0.04% (0.59)% 0.04% 50 0.04%(4) 0.71% 0.04% (0.63)% 0.05% 100 0.08%(4) 0.71% 0.04% (0.59)%
0.55%(8) $27,195 0.32%(4)(9) 0.36%(9) 1.11%(9) 1.07%(9) 0.50% 28,533 0.33%(4) 0.36% 0.48% 0.45% 0.10% 131,640 0.30%(4) 0.36% 0.09% 0.03% 0.04% 143,092 0.08%(4) 0.36% 0.04% (0.24)% 0.04% 160,921 0.04%(4) 0.36% 0.04% (0.28)% 0.05% 52,948 0.08%(4) 0.36% 0.04% (0.24)%
0.22%(8) $50 0.97%(4)(9) 1.01%(9) 0.46%(9) 0.42%(9) 0.04% 50 0.79%(4) 1.01% 0.02% (0.20)% 0.01%(8) 50 0.43%(4)(9) 1.01%(9) (0.04)%(9) (0.62)%(9)
Merrill Corp - MS ILF Semi-Annual Report [Funds] 04-30-2018 ED [AUX] | thunt | 21-Jun-18 10:26 | 18-13101-10.ea | Sequence: 6CHKSUM Content: 42878 Layout: 24807 Graphics: No Graphics CLEAN
JOB: 18-13101-10 CYCLE#;BL#: 5; 0 TRIM: 8.25" x 10.75" COMPOSITECOLORS: Black, ~note-color 2 GRAPHICS: none V1.5
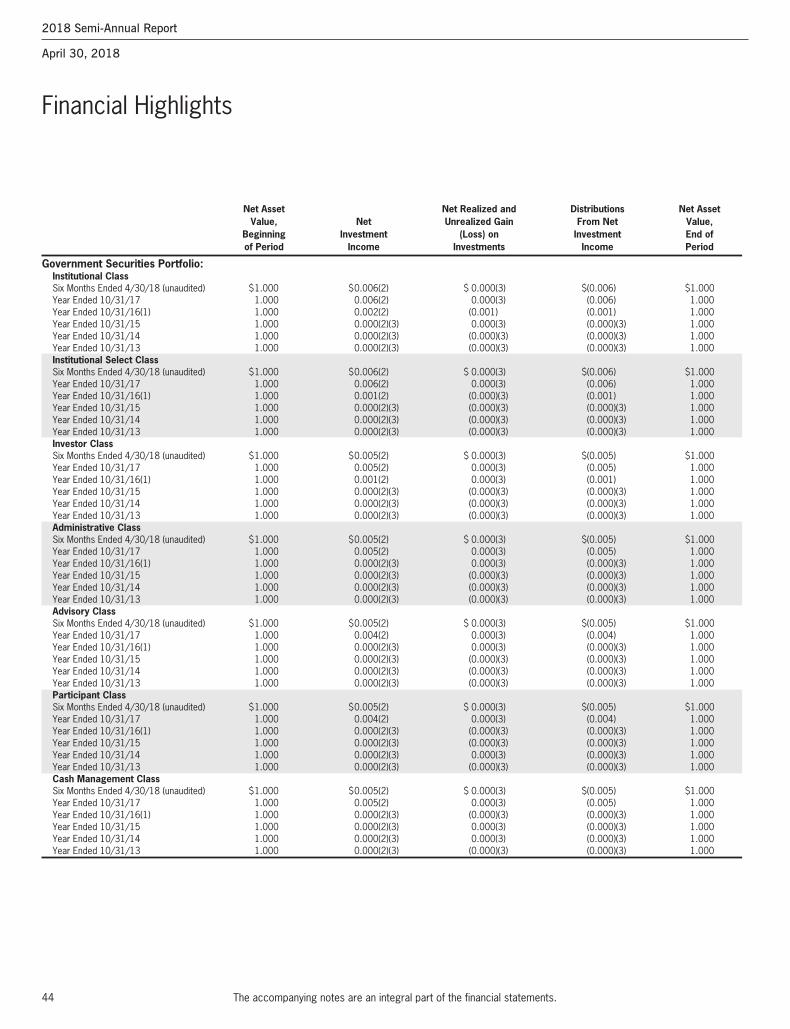
44
Financial Highlights
The accompanying notes are an integral part of the financial statements.
Net Asset Net Realized and Distributions Net Asset Value, Net Unrealized Gain From Net Value, Beginning Investment (Loss) on Investment End of of Period Income Investments Income Period
Government Securities Portfolio:Institutional ClassSix Months Ended 4/30/18 (unaudited) $1.000 $0.006(2) $ 0.000(3) $(0.006) $1.000 Year Ended 10/31/17 1.000 0.006(2) 0.000(3) (0.006) 1.000 Year Ended 10/31/16(1) 1.000 0.002(2) (0.001) (0.001) 1.000 Year Ended 10/31/15 1.000 0.000(2)(3) 0.000(3) (0.000)(3) 1.000 Year Ended 10/31/14 1.000 0.000(2)(3) (0.000)(3) (0.000)(3) 1.000 Year Ended 10/31/13 1.000 0.000(2)(3) (0.000)(3) (0.000)(3) 1.000 Institutional Select ClassSix Months Ended 4/30/18 (unaudited) $1.000 $0.006(2) $ 0.000(3) $(0.006) $1.000 Year Ended 10/31/17 1.000 0.006(2) 0.000(3) (0.006) 1.000 Year Ended 10/31/16(1) 1.000 0.001(2) (0.000)(3) (0.001) 1.000 Year Ended 10/31/15 1.000 0.000(2)(3) (0.000)(3) (0.000)(3) 1.000 Year Ended 10/31/14 1.000 0.000(2)(3) (0.000)(3) (0.000)(3) 1.000 Year Ended 10/31/13 1.000 0.000(2)(3) (0.000)(3) (0.000)(3) 1.000 Investor ClassSix Months Ended 4/30/18 (unaudited) $1.000 $0.005(2) $ 0.000(3) $(0.005) $1.000 Year Ended 10/31/17 1.000 0.005(2) 0.000(3) (0.005) 1.000 Year Ended 10/31/16(1) 1.000 0.001(2) 0.000(3) (0.001) 1.000 Year Ended 10/31/15 1.000 0.000(2)(3) (0.000)(3) (0.000)(3) 1.000 Year Ended 10/31/14 1.000 0.000(2)(3) (0.000)(3) (0.000)(3) 1.000 Year Ended 10/31/13 1.000 0.000(2)(3) (0.000)(3) (0.000)(3) 1.000 Administrative ClassSix Months Ended 4/30/18 (unaudited) $1.000 $0.005(2) $ 0.000(3) $(0.005) $1.000 Year Ended 10/31/17 1.000 0.005(2) 0.000(3) (0.005) 1.000 Year Ended 10/31/16(1) 1.000 0.000(2)(3) 0.000(3) (0.000)(3) 1.000 Year Ended 10/31/15 1.000 0.000(2)(3) (0.000)(3) (0.000)(3) 1.000 Year Ended 10/31/14 1.000 0.000(2)(3) (0.000)(3) (0.000)(3) 1.000 Year Ended 10/31/13 1.000 0.000(2)(3) (0.000)(3) (0.000)(3) 1.000 Advisory ClassSix Months Ended 4/30/18 (unaudited) $1.000 $0.005(2) $ 0.000(3) $(0.005) $1.000 Year Ended 10/31/17 1.000 0.004(2) 0.000(3) (0.004) 1.000 Year Ended 10/31/16(1) 1.000 0.000(2)(3) 0.000(3) (0.000)(3) 1.000 Year Ended 10/31/15 1.000 0.000(2)(3) (0.000)(3) (0.000)(3) 1.000 Year Ended 10/31/14 1.000 0.000(2)(3) (0.000)(3) (0.000)(3) 1.000 Year Ended 10/31/13 1.000 0.000(2)(3) (0.000)(3) (0.000)(3) 1.000 Participant ClassSix Months Ended 4/30/18 (unaudited) $1.000 $0.005(2) $ 0.000(3) $(0.005) $1.000 Year Ended 10/31/17 1.000 0.004(2) 0.000(3) (0.004) 1.000 Year Ended 10/31/16(1) 1.000 0.000(2)(3) (0.000)(3) (0.000)(3) 1.000 Year Ended 10/31/15 1.000 0.000(2)(3) (0.000)(3) (0.000)(3) 1.000 Year Ended 10/31/14 1.000 0.000(2)(3) 0.000(3) (0.000)(3) 1.000 Year Ended 10/31/13 1.000 0.000(2)(3) (0.000)(3) (0.000)(3) 1.000 Cash Management ClassSix Months Ended 4/30/18 (unaudited) $1.000 $0.005(2) $ 0.000(3) $(0.005) $1.000 Year Ended 10/31/17 1.000 0.005(2) 0.000(3) (0.005) 1.000 Year Ended 10/31/16(1) 1.000 0.000(2)(3) (0.000)(3) (0.000)(3) 1.000 Year Ended 10/31/15 1.000 0.000(2)(3) 0.000(3) (0.000)(3) 1.000 Year Ended 10/31/14 1.000 0.000(2)(3) 0.000(3) (0.000)(3) 1.000 Year Ended 10/31/13 1.000 0.000(2)(3) (0.000)(3) (0.000)(3) 1.000
2018 Semi-Annual Report
April 30, 2018
Merrill Corp - MS ILF Semi-Annual Report [Funds] 04-30-2018 ED [AUX] | thunt | 21-Jun-18 10:26 | 18-13101-10.ea | Sequence: 7CHKSUM Content: 20822 Layout: 46710 Graphics: No Graphics CLEAN
JOB: 18-13101-10 CYCLE#;BL#: 5; 0 TRIM: 8.25" x 10.75" COMPOSITECOLORS: Black, ~note-color 2 GRAPHICS: none V1.5
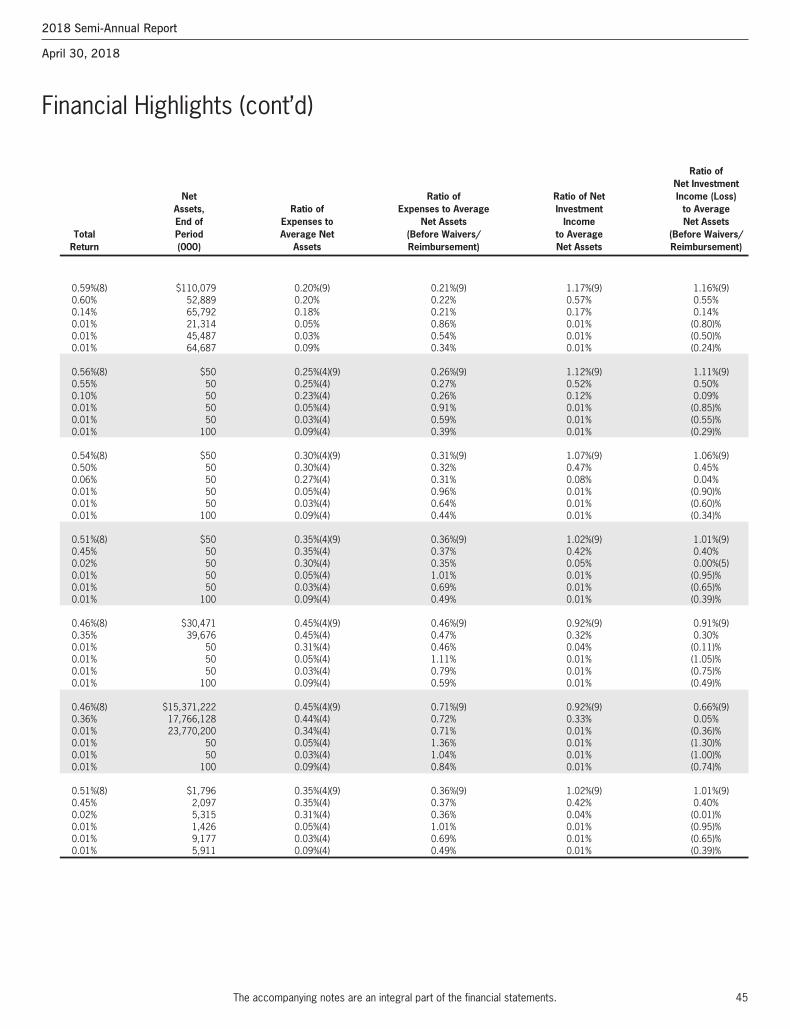
45
Financial Highlights (cont’d)
The accompanying notes are an integral part of the financial statements.
2018 Semi-Annual Report
April 30, 2018
Ratio of Net Investment Net Ratio of Ratio of Net Income (Loss) Assets, Ratio of Expenses to Average Investment to Average End of Expenses to Net Assets Income Net Assets Total Period Average Net (Before Waivers/ to Average (Before Waivers/ Return (000) Assets Reimbursement) Net Assets Reimbursement)
0.59%(8) $110,079 0.20%(9) 0.21%(9) 1.17%(9) 1.16%(9) 0.60% 52,889 0.20% 0.22% 0.57% 0.55% 0.14% 65,792 0.18% 0.21% 0.17% 0.14% 0.01% 21,314 0.05% 0.86% 0.01% (0.80)% 0.01% 45,487 0.03% 0.54% 0.01% (0.50)% 0.01% 64,687 0.09% 0.34% 0.01% (0.24)%
0.56%(8) $50 0.25%(4)(9) 0.26%(9) 1.12%(9) 1.11%(9) 0.55% 50 0.25%(4) 0.27% 0.52% 0.50% 0.10% 50 0.23%(4) 0.26% 0.12% 0.09% 0.01% 50 0.05%(4) 0.91% 0.01% (0.85)% 0.01% 50 0.03%(4) 0.59% 0.01% (0.55)% 0.01% 100 0.09%(4) 0.39% 0.01% (0.29)%
0.54%(8) $50 0.30%(4)(9) 0.31%(9) 1.07%(9) 1.06%(9) 0.50% 50 0.30%(4) 0.32% 0.47% 0.45% 0.06% 50 0.27%(4) 0.31% 0.08% 0.04% 0.01% 50 0.05%(4) 0.96% 0.01% (0.90)% 0.01% 50 0.03%(4) 0.64% 0.01% (0.60)% 0.01% 100 0.09%(4) 0.44% 0.01% (0.34)%
0.51%(8) $50 0.35%(4)(9) 0.36%(9) 1.02%(9) 1.01%(9) 0.45% 50 0.35%(4) 0.37% 0.42% 0.40% 0.02% 50 0.30%(4) 0.35% 0.05% 0.00%(5) 0.01% 50 0.05%(4) 1.01% 0.01% (0.95)% 0.01% 50 0.03%(4) 0.69% 0.01% (0.65)% 0.01% 100 0.09%(4) 0.49% 0.01% (0.39)%
0.46%(8) $30,471 0.45%(4)(9) 0.46%(9) 0.92%(9) 0.91%(9) 0.35% 39,676 0.45%(4) 0.47% 0.32% 0.30% 0.01% 50 0.31%(4) 0.46% 0.04% (0.11)% 0.01% 50 0.05%(4) 1.11% 0.01% (1.05)% 0.01% 50 0.03%(4) 0.79% 0.01% (0.75)% 0.01% 100 0.09%(4) 0.59% 0.01% (0.49)%
0.46%(8) $15,371,222 0.45%(4)(9) 0.71%(9) 0.92%(9) 0.66%(9) 0.36% 17,766,128 0.44%(4) 0.72% 0.33% 0.05% 0.01% 23,770,200 0.34%(4) 0.71% 0.01% (0.36)% 0.01% 50 0.05%(4) 1.36% 0.01% (1.30)% 0.01% 50 0.03%(4) 1.04% 0.01% (1.00)% 0.01% 100 0.09%(4) 0.84% 0.01% (0.74)%
0.51%(8) $1,796 0.35%(4)(9) 0.36%(9) 1.02%(9) 1.01%(9) 0.45% 2,097 0.35%(4) 0.37% 0.42% 0.40% 0.02% 5,315 0.31%(4) 0.36% 0.04% (0.01)% 0.01% 1,426 0.05%(4) 1.01% 0.01% (0.95)% 0.01% 9,177 0.03%(4) 0.69% 0.01% (0.65)% 0.01% 5,911 0.09%(4) 0.49% 0.01% (0.39)%
Merrill Corp - MS ILF Semi-Annual Report [Funds] 04-30-2018 ED [AUX] | thunt | 21-Jun-18 10:26 | 18-13101-10.ea | Sequence: 8CHKSUM Content: 3185 Layout: 62925 Graphics: No Graphics CLEAN
JOB: 18-13101-10 CYCLE#;BL#: 5; 0 TRIM: 8.25" x 10.75" COMPOSITECOLORS: Black, ~note-color 2 GRAPHICS: none V1.5

46
Financial Highlights
The accompanying notes are an integral part of the financial statements.
Net Asset Net Realized and Distributions Net Asset Value, Net Unrealized Gain From Net Value, Beginning Investment (Loss) on Investment End of of Period Income Investments Income Period
Treasury Portfolio:Institutional ClassSix Months Ended 4/30/18 (unaudited) $1.000 $0.006(2) $(0.000)(3) $(0.006) $1.000 Year Ended 10/31/17 1.000 0.006(2) 0.000(3) (0.006) 1.000 Year Ended 10/31/16(1) 1.000 0.002(2) (0.000)(3) (0.002) 1.000 Year Ended 10/31/15 1.000 0.000(2)(3) (0.000)(3) (0.000)(3) 1.000 Year Ended 10/31/14 1.000 0.000(2)(3) (0.000)(3) (0.000)(3) 1.000 Year Ended 10/31/13 1.000 0.000(2)(3) 0.000(3) (0.000)(3) 1.000 Institutional Select ClassSix Months Ended 4/30/18 (unaudited) $1.000 $0.006(2) $ 0.000(3) $(0.006) $1.000 Year Ended 10/31/17 1.000 0.006(2) 0.000(3) (0.006) 1.000 Year Ended 10/31/16(1) 1.000 0.002(2) (0.000)(3) (0.002) 1.000 Year Ended 10/31/15 1.000 0.000(2)(3) (0.000)(3) (0.000)(3) 1.000 Year Ended 10/31/14 1.000 0.000(2)(3) (0.000)(3) (0.000)(3) 1.000 Year Ended 10/31/13 1.000 0.000(2)(3) (0.000)(3) (0.000)(3) 1.000 Investor ClassSix Months Ended 4/30/18 (unaudited) $1.000 $0.006(2) $(0.000)(3) $(0.006) $1.000 Year Ended 10/31/17 1.000 0.005(2) 0.000(3) (0.005) 1.000 Year Ended 10/31/16(1) 1.000 0.001(2) (0.000)(3) (0.001) 1.000 Year Ended 10/31/15 1.000 0.000(2)(3) (0.000)(3) (0.000)(3) 1.000 Year Ended 10/31/14 1.000 0.000(2)(3) 0.000(3) (0.000)(3) 1.000 Year Ended 10/31/13 1.000 0.000(2)(3) (0.000)(3) (0.000)(3) 1.000 Administrative ClassSix Months Ended 4/30/18 (unaudited) $1.000 $0.006(2) $ 0.000(3) $(0.006) $1.000 Year Ended 10/31/17 1.000 0.005(2) 0.000(3) (0.005) 1.000 Year Ended 10/31/16(1) 1.000 0.001(2) 0.000(3) (0.001) 1.000 Year Ended 10/31/15 1.000 0.000(2)(3) (0.000)(3) (0.000)(3) 1.000 Year Ended 10/31/14 1.000 0.000(2)(3) (0.000)(3) (0.000)(3) 1.000 Year Ended 10/31/13 1.000 0.000(2)(3) (0.000)(3) (0.000)(3) 1.000 Advisory ClassSix Months Ended 4/30/18 (unaudited) $1.000 $0.005(2) $(0.000)(3) $(0.005) $1.000 Year Ended 10/31/17 1.000 0.004(2) 0.000(3) (0.004) 1.000 Year Ended 10/31/16(1) 1.000 0.000(2)(3) (0.000)(3) (0.000)(3) 1.000 Year Ended 10/31/15 1.000 0.000(2)(3) (0.000)(3) (0.000)(3) 1.000 Year Ended 10/31/14 1.000 0.000(2)(3) (0.000)(3) (0.000)(3) 1.000 Year Ended 10/31/13 1.000 0.000(2)(3) 0.000(3) (0.000)(3) 1.000 Participant ClassSix Months Ended 4/30/18 (unaudited) $1.000 $0.004(2) $(0.000)(3) $(0.004) $1.000 Year Ended 10/31/17 1.000 0.001(2) 0.001 (0.002) 1.000 Year Ended 10/31/16(1) 1.000 0.000(2)(3) 0.000(3) (0.000)(3) 1.000 Year Ended 10/31/15 1.000 0.000(2)(3) (0.000)(3) (0.000)(3) 1.000 Year Ended 10/31/14 1.000 0.000(2)(3) 0.000(3) (0.000)(3) 1.000 Year Ended 10/31/13 1.000 0.000(2)(3) (0.000)(3) (0.000)(3) 1.000 Cash Management ClassSix Months Ended 4/30/18 (unaudited) $1.000 $0.006(2) $(0.000)(3) $(0.006) $1.000 Year Ended 10/31/17 1.000 0.005(2) 0.000(3) (0.005) 1.000 Year Ended 10/31/16(1) 1.000 0.001(2) (0.000)(3) (0.001) 1.000 Year Ended 10/31/15 1.000 0.000(2)(3) (0.000)(3) (0.000)(3) 1.000 Year Ended 10/31/14 1.000 0.000(2)(3) (0.000)(3) (0.000)(3) 1.000 Year Ended 10/31/13 1.000 0.000(2)(3) 0.000(3) (0.000)(3) 1.000 Select ClassSix Months Ended 4/30/18 (unaudited) $1.000 $0.002(2) $(0.000)(3) $(0.002) $1.000 Year Ended 10/31/17 1.000 0.000(2)(3) 0.000(3) (0.000)(3) 1.000 For the Period Ended 10/31/16(1) 1.000 0.001(2) (0.001) (0.000)(3) 1.000
2018 Semi-Annual Report
April 30, 2018
Merrill Corp - MS ILF Semi-Annual Report [Funds] 04-30-2018 ED [AUX] | thunt | 21-Jun-18 10:26 | 18-13101-10.ea | Sequence: 9CHKSUM Content: 34789 Layout: 7667 Graphics: No Graphics CLEAN
JOB: 18-13101-10 CYCLE#;BL#: 5; 0 TRIM: 8.25" x 10.75" COMPOSITECOLORS: Black, ~note-color 2 GRAPHICS: none V1.5
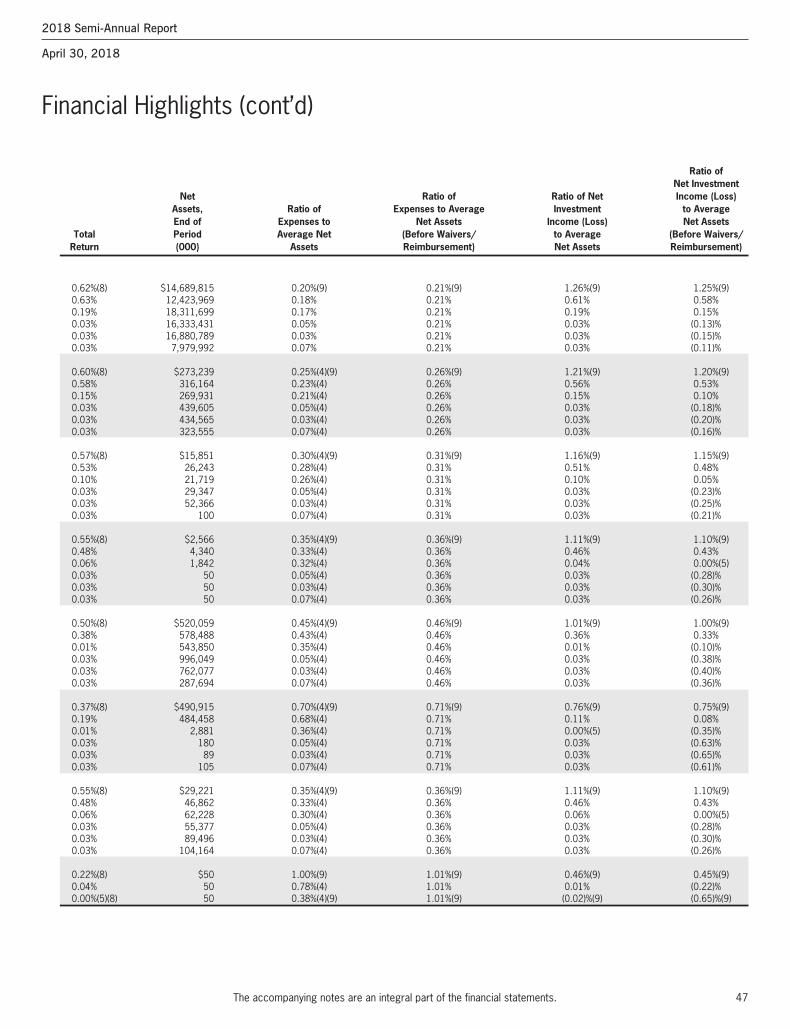
47
Financial Highlights (cont’d)
The accompanying notes are an integral part of the financial statements.
2018 Semi-Annual Report
April 30, 2018
Ratio of Net Investment Net Ratio of Ratio of Net Income (Loss) Assets, Ratio of Expenses to Average Investment to Average End of Expenses to Net Assets Income (Loss) Net Assets Total Period Average Net (Before Waivers/ to Average (Before Waivers/ Return (000) Assets Reimbursement) Net Assets Reimbursement)
0.62%(8) $14,689,815 0.20%(9) 0.21%(9) 1.26%(9) 1.25%(9) 0.63% 12,423,969 0.18% 0.21% 0.61% 0.58% 0.19% 18,311,699 0.17% 0.21% 0.19% 0.15% 0.03% 16,333,431 0.05% 0.21% 0.03% (0.13)% 0.03% 16,880,789 0.03% 0.21% 0.03% (0.15)% 0.03% 7,979,992 0.07% 0.21% 0.03% (0.11)%
0.60%(8) $273,239 0.25%(4)(9) 0.26%(9) 1.21%(9) 1.20%(9) 0.58% 316,164 0.23%(4) 0.26% 0.56% 0.53% 0.15% 269,931 0.21%(4) 0.26% 0.15% 0.10% 0.03% 439,605 0.05%(4) 0.26% 0.03% (0.18)% 0.03% 434,565 0.03%(4) 0.26% 0.03% (0.20)% 0.03% 323,555 0.07%(4) 0.26% 0.03% (0.16)%
0.57%(8) $15,851 0.30%(4)(9) 0.31%(9) 1.16%(9) 1.15%(9) 0.53% 26,243 0.28%(4) 0.31% 0.51% 0.48% 0.10% 21,719 0.26%(4) 0.31% 0.10% 0.05% 0.03% 29,347 0.05%(4) 0.31% 0.03% (0.23)% 0.03% 52,366 0.03%(4) 0.31% 0.03% (0.25)% 0.03% 100 0.07%(4) 0.31% 0.03% (0.21)%
0.55%(8) $2,566 0.35%(4)(9) 0.36%(9) 1.11%(9) 1.10%(9) 0.48% 4,340 0.33%(4) 0.36% 0.46% 0.43% 0.06% 1,842 0.32%(4) 0.36% 0.04% 0.00%(5) 0.03% 50 0.05%(4) 0.36% 0.03% (0.28)% 0.03% 50 0.03%(4) 0.36% 0.03% (0.30)% 0.03% 50 0.07%(4) 0.36% 0.03% (0.26)%
0.50%(8) $520,059 0.45%(4)(9) 0.46%(9) 1.01%(9) 1.00%(9) 0.38% 578,488 0.43%(4) 0.46% 0.36% 0.33% 0.01% 543,850 0.35%(4) 0.46% 0.01% (0.10)% 0.03% 996,049 0.05%(4) 0.46% 0.03% (0.38)% 0.03% 762,077 0.03%(4) 0.46% 0.03% (0.40)% 0.03% 287,694 0.07%(4) 0.46% 0.03% (0.36)%
0.37%(8) $490,915 0.70%(4)(9) 0.71%(9) 0.76%(9) 0.75%(9) 0.19% 484,458 0.68%(4) 0.71% 0.11% 0.08% 0.01% 2,881 0.36%(4) 0.71% 0.00%(5) (0.35)% 0.03% 180 0.05%(4) 0.71% 0.03% (0.63)% 0.03% 89 0.03%(4) 0.71% 0.03% (0.65)% 0.03% 105 0.07%(4) 0.71% 0.03% (0.61)%
0.55%(8) $29,221 0.35%(4)(9) 0.36%(9) 1.11%(9) 1.10%(9) 0.48% 46,862 0.33%(4) 0.36% 0.46% 0.43% 0.06% 62,228 0.30%(4) 0.36% 0.06% 0.00%(5) 0.03% 55,377 0.05%(4) 0.36% 0.03% (0.28)% 0.03% 89,496 0.03%(4) 0.36% 0.03% (0.30)% 0.03% 104,164 0.07%(4) 0.36% 0.03% (0.26)%
0.22%(8) $50 1.00%(9) 1.01%(9) 0.46%(9) 0.45%(9) 0.04% 50 0.78%(4) 1.01% 0.01% (0.22)% 0.00%(5)(8) 50 0.38%(4)(9) 1.01%(9) (0.02)%(9) (0.65)%(9)
Merrill Corp - MS ILF Semi-Annual Report [Funds] 04-30-2018 ED [AUX] | thunt | 21-Jun-18 10:26 | 18-13101-10.ea | Sequence: 10CHKSUM Content: 43823 Layout: 24807 Graphics: No Graphics CLEAN
JOB: 18-13101-10 CYCLE#;BL#: 5; 0 TRIM: 8.25" x 10.75" COMPOSITECOLORS: Black, ~note-color 2 GRAPHICS: none V1.5
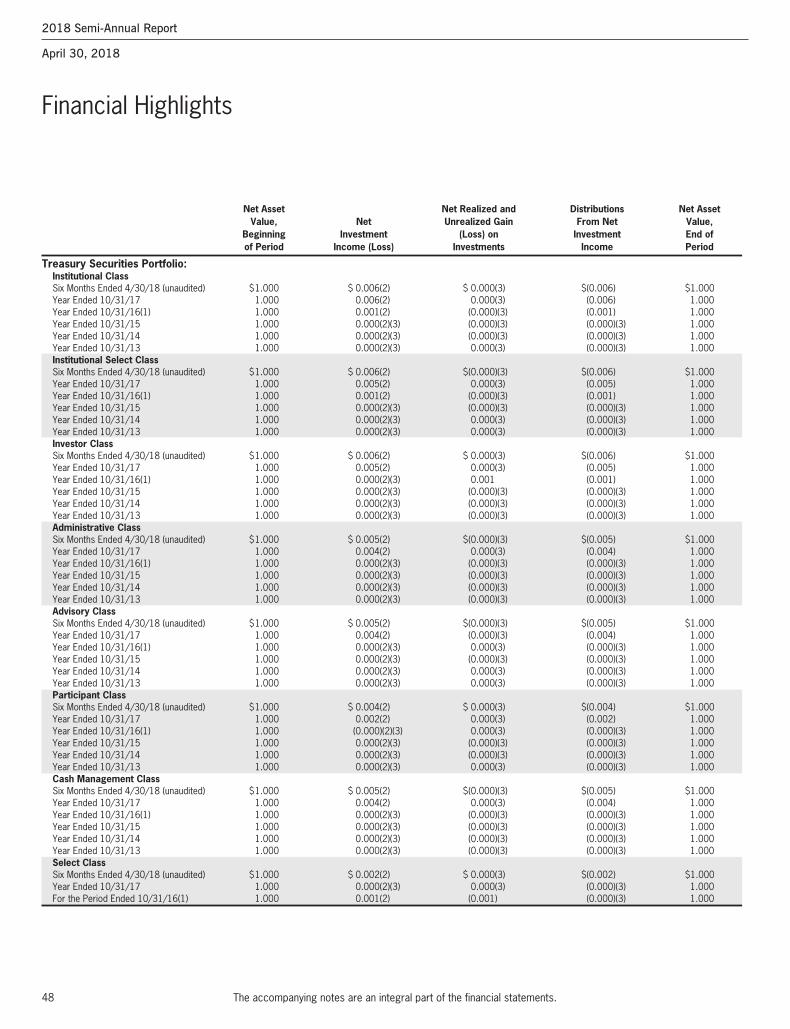
48
Financial Highlights
The accompanying notes are an integral part of the financial statements.
Net Asset Net Realized and Distributions Net Asset Value, Net Unrealized Gain From Net Value, Beginning Investment (Loss) on Investment End of of Period Income (Loss) Investments Income Period
Treasury Securities Portfolio:Institutional ClassSix Months Ended 4/30/18 (unaudited) $1.000 $ 0.006(2) $ 0.000(3) $(0.006) $1.000 Year Ended 10/31/17 1.000 0.006(2) 0.000(3) (0.006) 1.000 Year Ended 10/31/16(1) 1.000 0.001(2) (0.000)(3) (0.001) 1.000 Year Ended 10/31/15 1.000 0.000(2)(3) (0.000)(3) (0.000)(3) 1.000 Year Ended 10/31/14 1.000 0.000(2)(3) (0.000)(3) (0.000)(3) 1.000 Year Ended 10/31/13 1.000 0.000(2)(3) 0.000(3) (0.000)(3) 1.000 Institutional Select ClassSix Months Ended 4/30/18 (unaudited) $1.000 $ 0.006(2) $(0.000)(3) $(0.006) $1.000 Year Ended 10/31/17 1.000 0.005(2) 0.000(3) (0.005) 1.000 Year Ended 10/31/16(1) 1.000 0.001(2) (0.000)(3) (0.001) 1.000 Year Ended 10/31/15 1.000 0.000(2)(3) (0.000)(3) (0.000)(3) 1.000 Year Ended 10/31/14 1.000 0.000(2)(3) 0.000(3) (0.000)(3) 1.000 Year Ended 10/31/13 1.000 0.000(2)(3) 0.000(3) (0.000)(3) 1.000 Investor ClassSix Months Ended 4/30/18 (unaudited) $1.000 $ 0.006(2) $ 0.000(3) $(0.006) $1.000 Year Ended 10/31/17 1.000 0.005(2) 0.000(3) (0.005) 1.000 Year Ended 10/31/16(1) 1.000 0.000(2)(3) 0.001 (0.001) 1.000 Year Ended 10/31/15 1.000 0.000(2)(3) (0.000)(3) (0.000)(3) 1.000 Year Ended 10/31/14 1.000 0.000(2)(3) (0.000)(3) (0.000)(3) 1.000 Year Ended 10/31/13 1.000 0.000(2)(3) (0.000)(3) (0.000)(3) 1.000 Administrative ClassSix Months Ended 4/30/18 (unaudited) $1.000 $ 0.005(2) $(0.000)(3) $(0.005) $1.000 Year Ended 10/31/17 1.000 0.004(2) 0.000(3) (0.004) 1.000 Year Ended 10/31/16(1) 1.000 0.000(2)(3) (0.000)(3) (0.000)(3) 1.000 Year Ended 10/31/15 1.000 0.000(2)(3) (0.000)(3) (0.000)(3) 1.000 Year Ended 10/31/14 1.000 0.000(2)(3) (0.000)(3) (0.000)(3) 1.000 Year Ended 10/31/13 1.000 0.000(2)(3) (0.000)(3) (0.000)(3) 1.000 Advisory ClassSix Months Ended 4/30/18 (unaudited) $1.000 $ 0.005(2) $(0.000)(3) $(0.005) $1.000 Year Ended 10/31/17 1.000 0.004(2) (0.000)(3) (0.004) 1.000 Year Ended 10/31/16(1) 1.000 0.000(2)(3) 0.000(3) (0.000)(3) 1.000 Year Ended 10/31/15 1.000 0.000(2)(3) (0.000)(3) (0.000)(3) 1.000 Year Ended 10/31/14 1.000 0.000(2)(3) 0.000(3) (0.000)(3) 1.000 Year Ended 10/31/13 1.000 0.000(2)(3) 0.000(3) (0.000)(3) 1.000 Participant ClassSix Months Ended 4/30/18 (unaudited) $1.000 $ 0.004(2) $ 0.000(3) $(0.004) $1.000 Year Ended 10/31/17 1.000 0.002(2) 0.000(3) (0.002) 1.000 Year Ended 10/31/16(1) 1.000 (0.000)(2)(3) 0.000(3) (0.000)(3) 1.000 Year Ended 10/31/15 1.000 0.000(2)(3) (0.000)(3) (0.000)(3) 1.000 Year Ended 10/31/14 1.000 0.000(2)(3) (0.000)(3) (0.000)(3) 1.000 Year Ended 10/31/13 1.000 0.000(2)(3) 0.000(3) (0.000)(3) 1.000 Cash Management ClassSix Months Ended 4/30/18 (unaudited) $1.000 $ 0.005(2) $(0.000)(3) $(0.005) $1.000 Year Ended 10/31/17 1.000 0.004(2) 0.000(3) (0.004) 1.000 Year Ended 10/31/16(1) 1.000 0.000(2)(3) (0.000)(3) (0.000)(3) 1.000 Year Ended 10/31/15 1.000 0.000(2)(3) (0.000)(3) (0.000)(3) 1.000 Year Ended 10/31/14 1.000 0.000(2)(3) (0.000)(3) (0.000)(3) 1.000 Year Ended 10/31/13 1.000 0.000(2)(3) (0.000)(3) (0.000)(3) 1.000 Select ClassSix Months Ended 4/30/18 (unaudited) $1.000 $ 0.002(2) $ 0.000(3) $(0.002) $1.000 Year Ended 10/31/17 1.000 0.000(2)(3) 0.000(3) (0.000)(3) 1.000 For the Period Ended 10/31/16(1) 1.000 0.001(2) (0.001) (0.000)(3) 1.000
2018 Semi-Annual Report
April 30, 2018
Merrill Corp - MS ILF Semi-Annual Report [Funds] 04-30-2018 ED [AUX] | thunt | 21-Jun-18 10:26 | 18-13101-10.ea | Sequence: 11CHKSUM Content: 41720 Layout: 30114 Graphics: No Graphics CLEAN
JOB: 18-13101-10 CYCLE#;BL#: 5; 0 TRIM: 8.25" x 10.75" COMPOSITECOLORS: Black, ~note-color 2 GRAPHICS: none V1.5
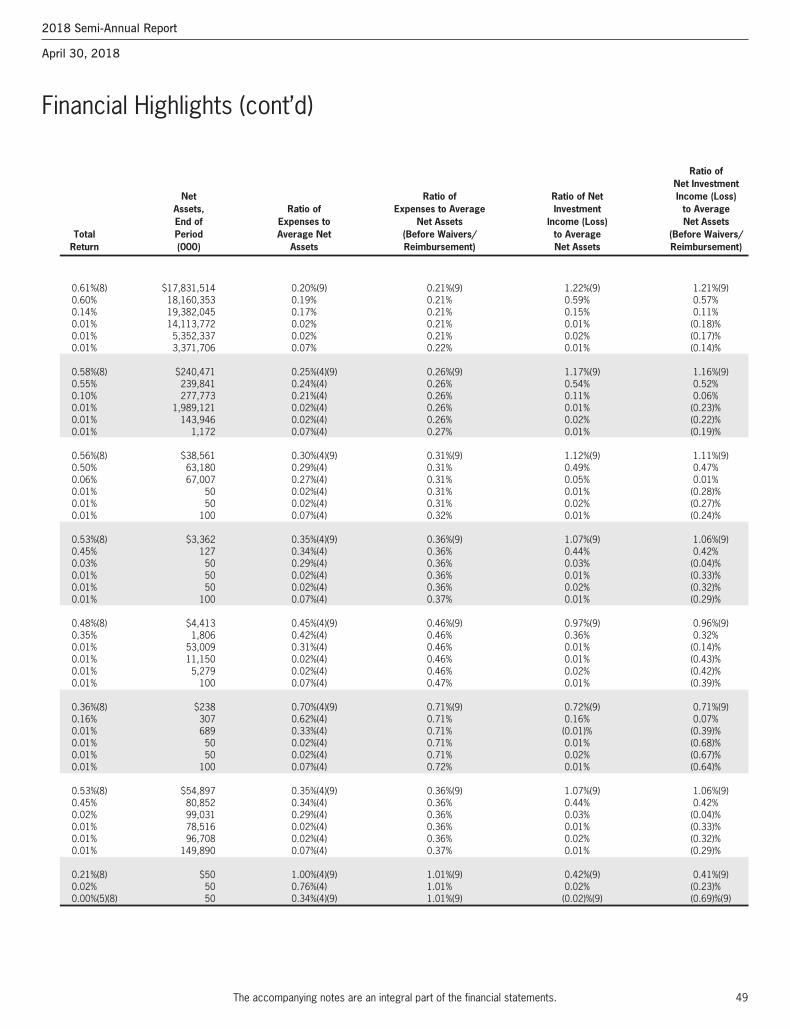
49
Financial Highlights (cont’d)
The accompanying notes are an integral part of the financial statements.
2018 Semi-Annual Report
April 30, 2018
Ratio of Net Investment Net Ratio of Ratio of Net Income (Loss) Assets, Ratio of Expenses to Average Investment to Average End of Expenses to Net Assets Income (Loss) Net Assets Total Period Average Net (Before Waivers/ to Average (Before Waivers/ Return (000) Assets Reimbursement) Net Assets Reimbursement)
0.61%(8) $17,831,514 0.20%(9) 0.21%(9) 1.22%(9) 1.21%(9) 0.60% 18,160,353 0.19% 0.21% 0.59% 0.57% 0.14% 19,382,045 0.17% 0.21% 0.15% 0.11% 0.01% 14,113,772 0.02% 0.21% 0.01% (0.18)% 0.01% 5,352,337 0.02% 0.21% 0.02% (0.17)% 0.01% 3,371,706 0.07% 0.22% 0.01% (0.14)%
0.58%(8) $240,471 0.25%(4)(9) 0.26%(9) 1.17%(9) 1.16%(9) 0.55% 239,841 0.24%(4) 0.26% 0.54% 0.52% 0.10% 277,773 0.21%(4) 0.26% 0.11% 0.06% 0.01% 1,989,121 0.02%(4) 0.26% 0.01% (0.23)% 0.01% 143,946 0.02%(4) 0.26% 0.02% (0.22)% 0.01% 1,172 0.07%(4) 0.27% 0.01% (0.19)%
0.56%(8) $38,561 0.30%(4)(9) 0.31%(9) 1.12%(9) 1.11%(9) 0.50% 63,180 0.29%(4) 0.31% 0.49% 0.47% 0.06% 67,007 0.27%(4) 0.31% 0.05% 0.01% 0.01% 50 0.02%(4) 0.31% 0.01% (0.28)% 0.01% 50 0.02%(4) 0.31% 0.02% (0.27)% 0.01% 100 0.07%(4) 0.32% 0.01% (0.24)%
0.53%(8) $3,362 0.35%(4)(9) 0.36%(9) 1.07%(9) 1.06%(9) 0.45% 127 0.34%(4) 0.36% 0.44% 0.42% 0.03% 50 0.29%(4) 0.36% 0.03% (0.04)% 0.01% 50 0.02%(4) 0.36% 0.01% (0.33)% 0.01% 50 0.02%(4) 0.36% 0.02% (0.32)% 0.01% 100 0.07%(4) 0.37% 0.01% (0.29)%
0.48%(8) $4,413 0.45%(4)(9) 0.46%(9) 0.97%(9) 0.96%(9) 0.35% 1,806 0.42%(4) 0.46% 0.36% 0.32% 0.01% 53,009 0.31%(4) 0.46% 0.01% (0.14)% 0.01% 11,150 0.02%(4) 0.46% 0.01% (0.43)% 0.01% 5,279 0.02%(4) 0.46% 0.02% (0.42)% 0.01% 100 0.07%(4) 0.47% 0.01% (0.39)%
0.36%(8) $238 0.70%(4)(9) 0.71%(9) 0.72%(9) 0.71%(9) 0.16% 307 0.62%(4) 0.71% 0.16% 0.07% 0.01% 689 0.33%(4) 0.71% (0.01)% (0.39)% 0.01% 50 0.02%(4) 0.71% 0.01% (0.68)% 0.01% 50 0.02%(4) 0.71% 0.02% (0.67)% 0.01% 100 0.07%(4) 0.72% 0.01% (0.64)%
0.53%(8) $54,897 0.35%(4)(9) 0.36%(9) 1.07%(9) 1.06%(9) 0.45% 80,852 0.34%(4) 0.36% 0.44% 0.42% 0.02% 99,031 0.29%(4) 0.36% 0.03% (0.04)% 0.01% 78,516 0.02%(4) 0.36% 0.01% (0.33)% 0.01% 96,708 0.02%(4) 0.36% 0.02% (0.32)% 0.01% 149,890 0.07%(4) 0.37% 0.01% (0.29)%
0.21%(8) $50 1.00%(4)(9) 1.01%(9) 0.42%(9) 0.41%(9) 0.02% 50 0.76%(4) 1.01% 0.02% (0.23)% 0.00%(5)(8) 50 0.34%(4)(9) 1.01%(9) (0.02)%(9) (0.69)%(9)
Merrill Corp - MS ILF Semi-Annual Report [Funds] 04-30-2018 ED [AUX] | thunt | 21-Jun-18 10:26 | 18-13101-10.ea | Sequence: 12CHKSUM Content: 25163 Layout: 4477 Graphics: No Graphics CLEAN
JOB: 18-13101-10 CYCLE#;BL#: 5; 0 TRIM: 8.25" x 10.75" COMPOSITECOLORS: Black, ~note-color 2 GRAPHICS: none V1.5
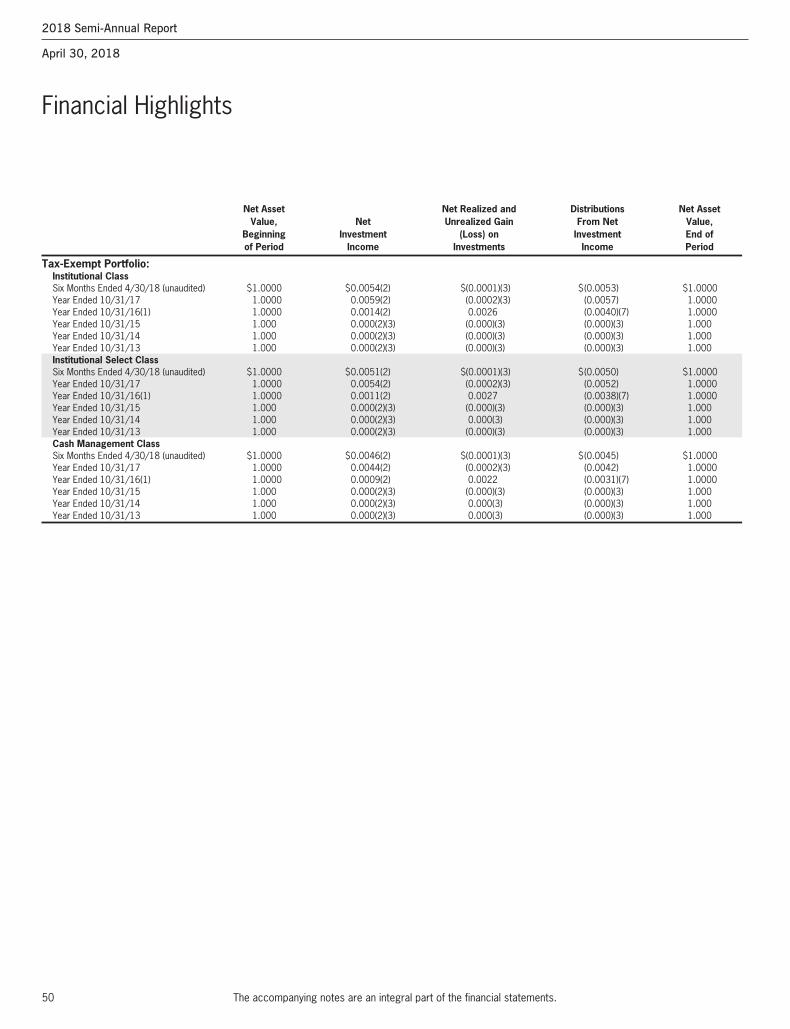
50
Financial Highlights
The accompanying notes are an integral part of the financial statements.
Net Asset Net Realized and Distributions Net Asset Value, Net Unrealized Gain From Net Value, Beginning Investment (Loss) on Investment End of of Period Income Investments Income Period
Tax-Exempt Portfolio:Institutional ClassSix Months Ended 4/30/18 (unaudited) $1.0000 $0.0054(2) $(0.0001)(3) $(0.0053) $1.0000 Year Ended 10/31/17 1.0000 0.0059(2) (0.0002)(3) (0.0057) 1.0000 Year Ended 10/31/16(1) 1.0000 0.0014(2) 0.0026 (0.0040)(7) 1.0000 Year Ended 10/31/15 1.000 0.000(2)(3) (0.000)(3) (0.000)(3) 1.000 Year Ended 10/31/14 1.000 0.000(2)(3) (0.000)(3) (0.000)(3) 1.000 Year Ended 10/31/13 1.000 0.000(2)(3) (0.000)(3) (0.000)(3) 1.000 Institutional Select ClassSix Months Ended 4/30/18 (unaudited) $1.0000 $0.0051(2) $(0.0001)(3) $(0.0050) $1.0000 Year Ended 10/31/17 1.0000 0.0054(2) (0.0002)(3) (0.0052) 1.0000 Year Ended 10/31/16(1) 1.0000 0.0011(2) 0.0027 (0.0038)(7) 1.0000 Year Ended 10/31/15 1.000 0.000(2)(3) (0.000)(3) (0.000)(3) 1.000 Year Ended 10/31/14 1.000 0.000(2)(3) 0.000(3) (0.000)(3) 1.000 Year Ended 10/31/13 1.000 0.000(2)(3) (0.000)(3) (0.000)(3) 1.000 Cash Management ClassSix Months Ended 4/30/18 (unaudited) $1.0000 $0.0046(2) $(0.0001)(3) $(0.0045) $1.0000 Year Ended 10/31/17 1.0000 0.0044(2) (0.0002)(3) (0.0042) 1.0000 Year Ended 10/31/16(1) 1.0000 0.0009(2) 0.0022 (0.0031)(7) 1.0000 Year Ended 10/31/15 1.000 0.000(2)(3) (0.000)(3) (0.000)(3) 1.000 Year Ended 10/31/14 1.000 0.000(2)(3) 0.000(3) (0.000)(3) 1.000 Year Ended 10/31/13 1.000 0.000(2)(3) 0.000(3) (0.000)(3) 1.000
2018 Semi-Annual Report
April 30, 2018
Merrill Corp - MS ILF Semi-Annual Report [Funds] 04-30-2018 ED [AUX] | thunt | 21-Jun-18 10:26 | 18-13101-10.ea | Sequence: 13CHKSUM Content: 11021 Layout: 12867 Graphics: No Graphics CLEAN
JOB: 18-13101-10 CYCLE#;BL#: 5; 0 TRIM: 8.25" x 10.75" COMPOSITECOLORS: Black, ~note-color 2 GRAPHICS: none V1.5
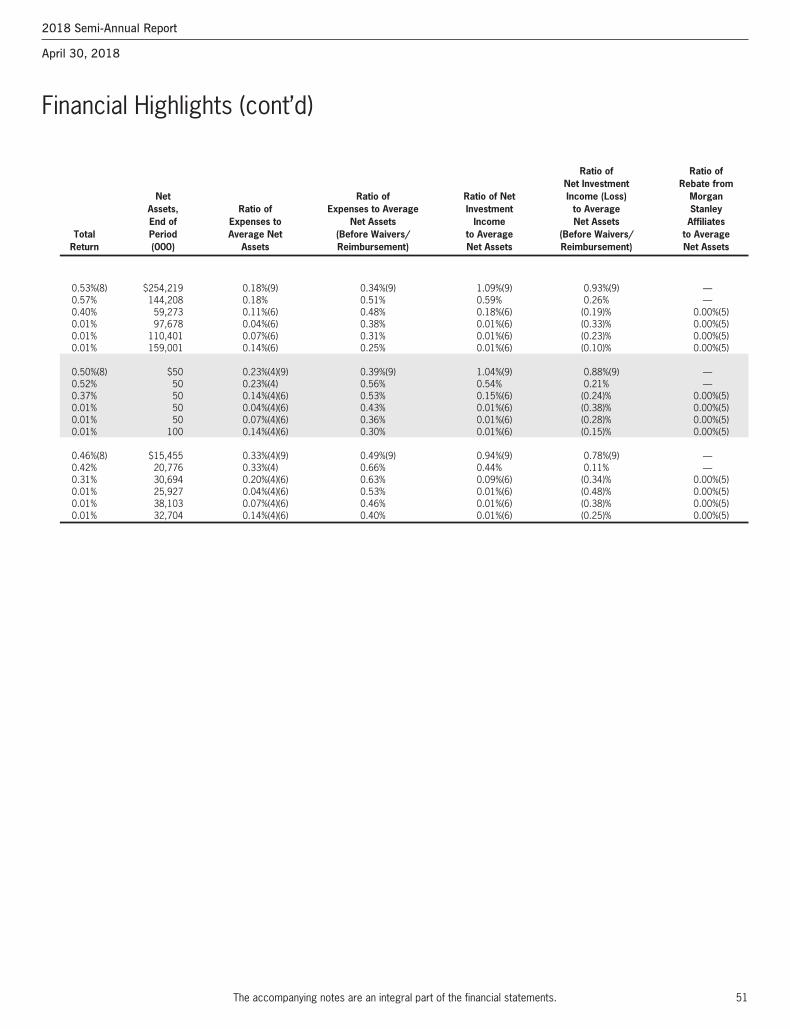
51
Financial Highlights (cont’d)
The accompanying notes are an integral part of the financial statements.
2018 Semi-Annual Report
April 30, 2018
Ratio of Ratio of Net Investment Rebate from Net Ratio of Ratio of Net Income (Loss) Morgan Assets, Ratio of Expenses to Average Investment to Average Stanley End of Expenses to Net Assets Income Net Assets Affiliates Total Period Average Net (Before Waivers/ to Average (Before Waivers/ to Average Return (000) Assets Reimbursement) Net Assets Reimbursement) Net Assets
0.53%(8) $254,219 0.18%(9) 0.34%(9) 1.09%(9) 0.93%(9) — 0.57% 144,208 0.18% 0.51% 0.59% 0.26% — 0.40% 59,273 0.11%(6) 0.48% 0.18%(6) (0.19)% 0.00%(5) 0.01% 97,678 0.04%(6) 0.38% 0.01%(6) (0.33)% 0.00%(5) 0.01% 110,401 0.07%(6) 0.31% 0.01%(6) (0.23)% 0.00%(5) 0.01% 159,001 0.14%(6) 0.25% 0.01%(6) (0.10)% 0.00%(5)
0.50%(8) $50 0.23%(4)(9) 0.39%(9) 1.04%(9) 0.88%(9) — 0.52% 50 0.23%(4) 0.56% 0.54% 0.21% — 0.37% 50 0.14%(4)(6) 0.53% 0.15%(6) (0.24)% 0.00%(5) 0.01% 50 0.04%(4)(6) 0.43% 0.01%(6) (0.38)% 0.00%(5) 0.01% 50 0.07%(4)(6) 0.36% 0.01%(6) (0.28)% 0.00%(5) 0.01% 100 0.14%(4)(6) 0.30% 0.01%(6) (0.15)% 0.00%(5)
0.46%(8) $15,455 0.33%(4)(9) 0.49%(9) 0.94%(9) 0.78%(9) — 0.42% 20,776 0.33%(4) 0.66% 0.44% 0.11% — 0.31% 30,694 0.20%(4)(6) 0.63% 0.09%(6) (0.34)% 0.00%(5) 0.01% 25,927 0.04%(4)(6) 0.53% 0.01%(6) (0.48)% 0.00%(5) 0.01% 38,103 0.07%(4)(6) 0.46% 0.01%(6) (0.38)% 0.00%(5) 0.01% 32,704 0.14%(4)(6) 0.40% 0.01%(6) (0.25)% 0.00%(5)
Merrill Corp - MS ILF Semi-Annual Report [Funds] 04-30-2018 ED [AUX] | thunt | 21-Jun-18 10:26 | 18-13101-10.ea | Sequence: 14CHKSUM Content: 44842 Layout: 24807 Graphics: No Graphics CLEAN
JOB: 18-13101-10 CYCLE#;BL#: 5; 0 TRIM: 8.25" x 10.75" COMPOSITECOLORS: Black, ~note-color 2 GRAPHICS: none V1.5
52
Notes to Financial Highlights
The accompanying notes are an integral part of the financial statements.
(1) Reflects prior period custodian out-of-pocket expenses that were reimbursed in September 2016. The amount of the reimbursement was immaterial on a per sharebasis and did not impact the total return of the Fund. The Ratio of Expenses to Average Net Assets and the Ratio of Net Investment Income (Loss) to Average NetAssets would be unchanged as the reimbursement of custodian fees was offset against expense waivers/reimbursements with no impact to net expenses or netinvestment income (loss).
(2) Per share amount is based on average shares outstanding.(3) Amount is less than $0.0005 per share.(4) Ratios of Expenses to Average Net Assets before and after Maximum Expense Ratios may vary among share classes by more or less than the administration plan,
service and shareholder administration plan, distribution plan and/or shareholder services plan (the “plans”) fees due to either (1) fluctuations in daily net assetamounts, (2) changes in the plans’ fees during the period for each share class, (3) changes in the Funds’ expense cap during the year, (4) waivers to the plans’ feesfor each share class, or (5) a combination of the previous points.
(5) Amount is less than 0.005%.(6) The Ratio of Expenses and Net Investment Income reflect the rebate of certain Fund expenses in connection with the investments in Morgan Stanley affiliates during
the period. The effect of the rebate on the ratios is disclosed in the above table as “Ratios of Rebate from Morgan Stanley Affiliates to Average Net Assets.”(7) Includes paid-in-capital distribution of $0.0022.(8) Not Annualized.(9) Annualized.
2018 Semi-Annual Report
April 30, 2018
Merrill Corp - MS ILF Semi-Annual Report [Funds] 04-30-2018 ED [AUX] | thunt | 21-Jun-18 10:26 | 18-13101-10.ea | Sequence: 15CHKSUM Content: 37504 Layout: 28813 Graphics: No Graphics CLEAN
JOB: 18-13101-10 CYCLE#;BL#: 5; 0 TRIM: 8.25" x 10.75" COMPOSITECOLORS: Black, ~note-color 2 GRAPHICS: none V1.5
53
Morgan Stanley Institutional Liquidity Funds (the “Trust”) isregistered under the Investment Company Act of 1940, asamended (the “Act”), as a Massachusetts business trust. TheTrust is comprised of seven separate, active, diversified portfo-lios (individually referred to as a “Fund”, collectively as the“Funds”). The Trust offers up to eight different classes ofshares for certain Funds. Each Fund offers the InstitutionalClass, Institutional Select Class, Investor Class, AdministrativeClass, Advisory Class, Participant Class and Cash ManagementClass and the Select Class is only offered to Government,Treasury and Treasury Securities Portfolios. The Trust appliesinvestment company accounting and reporting guidance. Allclasses of shares have identical voting rights (except that share-holders of a class have exclusive voting rights regarding anymatter relating solely to that class of shares), dividend, liquida-tion and other rights.The Investor Class and Administrative Class were fully redeemedduring the month of October 2016 from the Money MarketPortfolio, Prime Portfolio and Tax-Exempt Portfolio and therewere no shares outstanding as of April 30, 2018. In addition,during the month of October 2016, the Participant Class wasfully redeemed from the Prime Portfolio and Tax-Exempt Port-folio and there were no shares outstanding as of April 30, 2018.During the month of November 2016, the Advisory Class wasfully redeemed from the Tax-Exempt Portfolio and there were noshares outstanding as of April 30, 2018. Accordingly, no financialhighlights have been presented for these classes.Money Market, Prime and Tax-Exempt Portfolios operate as“institutional money market funds,” which require the Funds tohave a floating NAV, rounded to the fourth decimal place. Inaddition, the Funds are permitted to impose a liquidity fee onredemptions or temporarily restrict redemptions if weekly liquidassets fall below required regulatory thresholds. These changesmay affect the investment strategies, performance and operatingexpenses of the Funds. Government, Government Securities,Treasury and Treasury Securities Portfolios operate as “govern-ment money market funds,” which allow the Funds to continueto seek a stable NAV. The Funds will not impose a liquidity feeor temporarily suspend redemptions in the event that the Funds’weekly liquid assets fall below specified regulatory thresholds.For detailed descriptions of the investment objectives of eachof the Funds and other related information, please refer to theprospectuses of the Trust. Generally, the investment objectiveof the Funds is to seek preservation of capital, daily liquidityand maximum current income (exempt from federal incometax in the case of Tax-Exempt Portfolio).A. Significant Accounting Policies: The following signif-icant accounting policies are in conformity with U.S. generallyaccepted accounting principles (“GAAP”). Such policies are
consistently followed by the Trust in the preparation of its fi-nancial statements. GAAP may require management to makeestimates and assumptions that affect the reported amountsand disclosures in the financial statements. Actual results maydiffer from those estimates.1. Security Valuation: (1) Government, Government Se-
curities, Treasury and Treasury Securities: Portfolio securi-ties are valued at amortized cost which approximates fairvalue, in accordance with Rule 2a-7 under the Act. Theamortized cost of an instrument is determined by valuingit at its original cost and thereafter amortizing any dis-count or premium from its face value at a constant rateuntil maturity; (2) Money Market, Prime and Tax-Exempt:Portfolio securities are valued by an outside pricing service/vendor approved by the Trust’s Board of Trustees (the“Trustees”). The pricing service/vendor may employ apricing model that takes into account, among otherthings, bids, yield spreads and/or other market data andspecific security characteristics; (3) when market quota-tions are not readily available, including circumstances un-der which Morgan Stanley Investment Management Inc.(the “Adviser”) determines that the price is not reflectiveof a security’s market value, portfolio securities are valuedat their fair value as determined in good faith under proce-dures, established by and under the general supervision ofthe Trustees.The Trustees have responsibility for determining in goodfaith the fair value of the investments, and the Trusteesmay appoint others, such as the Trust’s Adviser or a valua-tion committee, to assist the Trustees in determining fairvalue and to make the actual calculations pursuant to thefair valuation methodologies previously approved by theTrustees. Under procedures approved by the Trustees, theTrust’s Adviser has formed a Valuation Committee whosemembers are approved by the Trustees. The ValuationCommittee provides administration and oversight of theTrust’s valuation policies and procedures, which are re-viewed at least annually by the Trustees. These proceduresallow the Trust to utilize independent pricing services,quotations from securities and financial instrument dealersand other market sources to determine fair value.The Trust has procedures to determine the fair value of se-curities and other financial instruments for which marketprices are not readily available. Under these procedures,the Valuation Committee convenes on a regular and adhoc basis to review such securities and considers a numberof factors, including valuation methodologies and significant unobservable valuation inputs, when arriving atfair value. The Valuation Committee may employ a market-based approach which may use related or
Notes to Financial Statements (unaudited)
2018 Semi-Annual Report
April 30, 2018
Merrill Corp - MS ILF Semi-Annual Report [Funds] 04-30-2018 ED [AUX] | thunt | 21-Jun-18 10:27 | 18-13101-10.fa | Sequence: 1CHKSUM Content: 12902 Layout: 32434 Graphics: No Graphics CLEAN
JOB: 18-13101-10 CYCLE#;BL#: 5; 0 TRIM: 8.25" x 10.75" COMPOSITECOLORS: Black, ~note-color 2 GRAPHICS: none V1.5
54
comparable assets or liabilities, recent transactions, marketmultiples, book values and other relevant information forthe investment to determine the fair value of the invest-ment. An income-based valuation approach may also beused in which the anticipated future cash flows of the in-vestment are discounted to calculate fair value. Discountsmay also be applied due to the nature or duration of anyrestrictions on the disposition of the investments. Due tothe inherent uncertainty of valuations of such investments,the fair values may differ significantly from the values thatwould have been used had an active market existed. TheValuation Committee employs various methods for cali-brating these valuation approaches including a regular re-view of valuation methodologies, key inputs andassumptions, transactional back-testing or dispositionanalysis and reviews of any related market activity.
2. Repurchase Agreements: Certain Funds may enterinto repurchase agreements under which a Fund lendscash and takes possession of securities with an agreementthat the counterparty will repurchase such securities. Inconnection with transactions in repurchase agreements, abank, as custodian for the Trust, takes possession of theunderlying securities which are held as collateral, with amarket value at least equal to the amount of the repur-chase transaction, including principal and accrued interest.To the extent that any repurchase transaction exceeds onebusiness day, the value of the collateral is marked-to-marketon a daily basis to determine that the value of the collat-eral does not decrease below the repurchase price plus ac-crued interest as earned. If such a decrease occurs, additionalcollateral will be requested and, when received, will beadded to the account to maintain full collateralization. Inthe event of default on the obligation to repurchase, theTrust has the right to liquidate the collateral and apply theproceeds in satisfaction of the obligation. In the event of de-fault or bankruptcy by the counterparty to the agreement,realization of the collateral proceeds may be subject to costand delays. The Funds, along with other affiliated invest-ment companies, may utilize a joint trading account for thepurpose of entering into repurchase agreements.Certain Funds may enter into repurchase agreements inwhich eligible securities are transferred into joint tradingaccounts maintained by the Trust’s custodian for invest-ment companies advised by the Trust’s Adviser. The Fundwill participate on a pro-rata basis with the other invest-ment companies in its share of the securities transferred un-der such repurchase agreements and in its share of proceedsfrom any repurchase or other disposition of such securities.Certain Fund’s repurchase agreements are subject to Mas-ter Repurchase Agreements which are agreements between
the Fund and its counterparties that typically include pro-visions which provide for the net settlement of all transac-tions and collateral with the Trust, through a singlepayment, in the event of default or termination. Amountspresented on the Portfolio of Investments and Statementsof Assets and Liabilities are not net settlement amountsbut gross. As indicated on the Portfolio of Investments,the cash or securities to be repurchased exceeds the repur-chase price to be paid under the repurchase agreement re-ducing the net settlement amount to zero.
3. Fair Value Measurement: Financial AccountingStandards Board (“FASB”) Accounting Standards Codifi-cationTM (“ASC”) 820, “Fair Value Measurement”(“ASC 820”), defines fair value as the value that the Fundwould receive to sell an investment or pay to transfer a lia-bility in a timely transaction with an independent buyer inthe principal market, or in the absence of a principal mar-ket, the most advantageous market for the investment orliability. ASC 820 establishes a three-tier hierarchy to dis-tinguish between (1) inputs that reflect the assumptionsmarket participants would use in valuing an asset or liabil-ity developed based on market data obtained from sourcesindependent of the reporting entity (observable inputs)and (2) inputs that reflect the reporting entity’s own as-sumptions about the assumptions market participantswould use in valuing an asset or liability developed basedon the best information available in the circumstances(unobservable inputs) and to establish classification of fairvalue measurements for disclosure purposes. Various in-puts are used in determining the value of the Fund’s in-vestments. The inputs are summarized in the three broadlevels listed below:• Level 1 – unadjusted quoted prices in active markets
for identical investments• Level 2 – other significant observable inputs (including
quoted prices for similar investments, inter-est rates, prepayment speeds, credit risk, etc.)
• Level 3 – significant unobservable inputs includingthe Fund’s own assumptions in determiningthe fair value of investments. Factors consid-ered in making this determination may in-clude, but are not limited to, informationobtained by contacting the issuer, analysts,or the appropriate stock exchange (for exchange-traded securities), analysis of theissuer’s financial statements or other avail-able documents and, if necessary, availableinformation concerning other securities insimilar circumstances
Notes to Financial Statements (unaudited) (cont’d)
2018 Semi-Annual Report
April 30, 2018
Merrill Corp - MS ILF Semi-Annual Report [Funds] 04-30-2018 ED [AUX] | thunt | 21-Jun-18 10:27 | 18-13101-10.fa | Sequence: 2CHKSUM Content: 12387 Layout: 45868 Graphics: No Graphics CLEAN
JOB: 18-13101-10 CYCLE#;BL#: 5; 0 TRIM: 8.25" x 10.75" COMPOSITECOLORS: Black, ~note-color 2 GRAPHICS: none V1.5
55
The inputs or methodology used for valuing securities arenot necessarily an indication of the risk associated with in-vesting in those securities and the determination of thesignificance of a particular input to the fair value measure-ment in its entirety requires judgment and considers fac-tors specific to each security.The following is a summary of the inputs used to valueeach Fund’s investments as of April 30, 2018:
Money Market Portfolio Level 2 Level 1 Other Level 3 Unadjusted significant Significant quoted observable unobservable prices inputs inputs TotalInvestment Type (000) (000) (000) (000)Assets:Certificates of
Deposit $— $ 36,607 $— $ 36,607Commercial Paper — 161,202 — 161,202Floating Rate Notes — 287,180 — 287,180Repurchase
Agreements — 309,000 — 309,000Time Deposits — 90,000 — 90,000Total Assets $— $883,989 $— $883,989
Prime Portfolio Level 2 Level 1 Other Level 3 Unadjusted significant Significant quoted observable unobservable prices inputs inputs TotalInvestment Type (000) (000) (000) (000)Assets:Certificates of
Deposit $— $ 232,070 $— $ 232,070Commercial Paper — 656,847 — 656,847Floating Rate Notes — 2,049,169 — 2,049,169Repurchase
Agreements — 1,885,000 — 1,885,000Time Deposits — 876,000 — 876,000Total Assets $— $5,699,086 $— $5,699,086
Government Portfolio Level 2 Level 1 Other Level 3 Unadjusted significant Significant quoted observable unobservable prices inputs inputs TotalInvestment Type (000) (000) (000) (000)Assets:Repurchase
Agreements $— $ 30,351,057 $— $ 30,351,057U.S. Agency
Securities — 22,258,988 — 22,258,988U.S. Treasury
Securities — 5,024,297 — 5,024,297Total Assets $— $57,634,342 $— $57,634,342
Government Securities Portfolio Level 2 Level 1 Other Level 3 Unadjusted significant Significant quoted observable unobservable prices inputs inputs TotalInvestment Type (000) (000) (000) (000)Assets:Repurchase
Agreement $— $ 1,710,000 $— $ 1,710,000U.S. Agency
Securities — 11,932,203 — 11,932,203U.S. Treasury
Securities — 1,872,871 — 1,872,871Total Assets $— $15,515,074 $— $15,515,074
Treasury Portfolio Level 2 Level 1 Other Level 3 Unadjusted significant Significant quoted observable unobservable prices inputs inputs TotalInvestment Type (000) (000) (000) (000)Assets:Repurchase
Agreements $— $ 8,234,892 $— $ 8,234,892U.S. Treasury
Securities — 7,793,692 — 7,793,692Total Assets $— $16,028,584 $— $16,028,584
Treasury Securities Portfolio Level 2 Level 1 Other Level 3 Unadjusted significant Significant quoted observable unobservable prices inputs inputs TotalInvestment Type (000) (000) (000) (000)Assets:U.S. Treasury
Securities $— $ 18,170,586 $— $ 18,170,586Total Assets $— $18,170,586 $— $18,170,586
Tax-Exempt Portfolio Level 2 Level 1 Other Level 3 Unadjusted significant Significant quoted observable unobservable prices inputs inputs TotalInvestment Type (000) (000) (000) (000)Assets:Tax-Exempt
InstrumentsWeekly Variable
Rate Bonds $— $ 162,630 $— $ 162,630Daily Variable
Rate Bonds — 88,075 — 88,075Commercial Paper — 14,900 — 14,900Municipal Bonds &
Notes — 4,168 — 4,168Total Assets $— $269,773 $— $269,773
Notes to Financial Statements (unaudited) (cont’d)
2018 Semi-Annual Report
April 30, 2018
Merrill Corp - MS ILF Semi-Annual Report [Funds] 04-30-2018 ED [AUX] | thunt | 21-Jun-18 10:27 | 18-13101-10.fa | Sequence: 3CHKSUM Content: 42453 Layout: 32434 Graphics: No Graphics CLEAN
JOB: 18-13101-10 CYCLE#;BL#: 5; 0 TRIM: 8.25" x 10.75" COMPOSITECOLORS: Black, ~note-color 2 GRAPHICS: none V1.5
56
Transfers between investment levels may occur as the mar-kets fluctuate and/or the availability of data used in an in-vestment’s valuation changes. The Funds recognizetransfers between the levels as of the end of the period. Asof April 30, 2018, the Funds did not have any investmentstransfer between investment levels.
4. When-Issued/Delayed Delivery Securities: CertainFunds purchase and sell when-issued and delayed deliverysecurities. Securities purchased on a when-issued or de-layed delivery basis are purchased for delivery beyond thenormal settlement date at a stated price and yield, and noincome accrues to the Fund on such securities prior todelivery date. Payment and delivery for when-issued anddelayed delivery securities can take place a month or moreafter the date of the transaction. When the Fund entersinto a purchase transaction on a when-issued or delayeddelivery basis, securities are available for collateral in anamount at least equal in value to the Fund’s commitmentsto purchase such securities. Purchasing securities on awhen-issued or delayed delivery basis may involve a riskthat the market price at the time of delivery may be lowerthan the agreed upon purchase price, in which case therecould be an unrealized loss at the time of delivery. Pur-chasing investments on a when-issued or delayed deliverybasis may be considered a form of leverage which may in-crease the impact that gains (losses) may have on theFund.
5. Indemnifications: The Trust enters into contracts thatcontain a variety of indemnifications. The Trust’s maxi-mum exposure under these arrangements is unknown.However, the Trust has not had prior claims or losses pur-suant to these contracts and expects the risk of loss to beremote.
6. Dividends and Distributions to Shareholders: Dividends are accrued and declared daily and paidmonthly. Net realized capital gains, if any, are distributedat least annually.
7. Security Transactions, Income and Expenses: Security transactions are accounted for on the trade date(date the order to buy or sell is executed). Realized gainsand losses on the sale of investment securities are deter-mined on the specific identified cost method. Interest in-come is recognized on the accrual basis except wherecollection is in doubt. Discounts are accreted and premi-ums are amortized over the life of the respective securities.Most expenses of the Trust can be directly attributed to aparticular Fund. Expenses which cannot be directly attrib-uted are apportioned among the Funds based upon rela-tive net assets or other appropriate methods. Income,expenses (other than class specific expenses) and realized
and unrealized gains or losses are allocated to each class ofshares based upon their relative net assets.
B. Advisory Fees: Morgan Stanley Investment ManagementInc. (the “Adviser”), a wholly-owned subsidiary of MorganStanley, provides the Trust with advisory services under theterms of an Investment Advisory Agreement, paid monthly, atthe annual rates of the average daily net assets indicated below:Fund Advisory FeesMoney Market 0.15%Prime 0.15Government 0.15Government Securities 0.15Treasury 0.15Treasury Securities 0.15Tax-Exempt 0.15
The Adviser has agreed to reduce its advisory, its administra-tion fees and/or reimburse each Fund so that total annual op-erating expenses of each share class, excluding certaininvestment related expenses, taxes, interest and other extraor-dinary expenses (including litigation), will not exceed themaximum expense ratios: Maximum Expense Ratios Money GovernmentClass Market Prime Government SecuritiesInstitutional Class 0.20% 0.20% 0.20% 0.20%Institutional Select Class 0.25 0.25 0.25 0.25Investor Class 0.30 0.30 0.30 0.30Administrative Class 0.35 0.35 0.35 0.35Advisory Class 0.45 0.45 0.45 0.45Participant Class 0.70 0.70 0.70 0.45Cash Management Class 0.35 0.35 0.35 0.35Select Class — — 1.00 —
Maximum Expense Ratios Treasury Class Treasury Securities Tax-ExemptInstitutional Class 0.20% 0.20% 0.20%Institutional Select Class 0.25 0.25 0.25Investor Class 0.30 0.30 0.30Administrative Class 0.35 0.35 0.35Advisory Class 0.45 0.45 0.45Participant Class 0.70 0.70 0.70Cash Management Class 0.35 0.35 0.35Select Class 1.00 1.00 —
The fee waivers and/or expense reimbursements will continuefor at least one year from the date of the Funds’ prospectus oruntil such time as the Trustees act to discontinue all or a por-tion of such waivers and/or expense reimbursements when theydeem such action is appropriate. In addition, the Adviser maymake additional voluntary fee waivers and/or expense reim-bursements. The ratios of expenses to average net assets dis-closed in the Funds’ Financial Highlights may be lower thanthe maximum expense ratios due to these additional feewaivers and/or expense reimbursements. The Adviser may alsowaive additional advisory fees and/or reimburse expenses to en-able a Fund to maintain a minimum level of daily net invest-ment income. For the six months ended April 30, 2018, the
Notes to Financial Statements (unaudited) (cont’d)
2018 Semi-Annual Report
April 30, 2018
Merrill Corp - MS ILF Semi-Annual Report [Funds] 04-30-2018 ED [AUX] | thunt | 21-Jun-18 10:27 | 18-13101-10.fa | Sequence: 4CHKSUM Content: 50747 Layout: 15334 Graphics: No Graphics CLEAN
JOB: 18-13101-10 CYCLE#;BL#: 5; 0 TRIM: 8.25" x 10.75" COMPOSITECOLORS: Black, ~note-color 2 GRAPHICS: none V1.5
57
Funds had advisory fees waived and/or certain expenses reim-bursed as follows: Advisory Fees Waived and/or Reimbursed Fund (000)Money Market $ 444Prime 1,863Government 9,253Government Securities 825Treasury 788Treasury Securities 667Tax-Exempt 163
C. Administration Fees: The Adviser also serves as Adminis-trator to the Trust and provides administrative services pursuantto an Administration Agreement for an annual fee, accrued dailyand paid monthly, of 0.05% of each Fund’s average daily netassets (without giving effect to any fee waivers). Under a Sub-Administration Agreement between the Administrator and StateStreet Bank and Trust Company (“State Street”), State Streetprovides certain administrative services to the Trust. For suchservices, the Administrator pays State Street a portion of the feethe Administrator receives from the Trust. The Administratorhas agreed to reduce its administration fees to enable a Fund tomaintain a minimum level of daily net investment income.For the six months ended April 30, 2018, the Funds had ad-ministration fees waived as follows: Administration Fees Waived Fund (000)Tax-Exempt $15
D. Administration Plan, Service and Shareholder Administration Plan, Distribution Plan and Share-holder Services Plan Fees: Morgan Stanley Distribution,Inc. (“MSDI” or the “Distributor”), a wholly-owned sub-sidiary of the Adviser, and an indirect subsidiary of MorganStanley, serves as the distributor of the Trust.The Trust has entered into an Administration Plan with respectto its Institutional Select Class, Investor Class and AdministrativeClass shares pursuant to which each class of shares will pay theDistributor a monthly fee at an annual rate of up to 0.05%,0.10% and 0.15%, of the average daily net assets of each suchclass of shares, respectively, to compensate certain financial inter-mediaries who provide administrative services to shareholders.The Trust has also entered into a Service and Shareholder Ad-ministration Plan with respect to its Advisory Class shares pur-suant to which its Advisory Class shares pays the Distributor amonthly fee at an annual rate of up to 0.25% of the averagedaily net assets of such class of shares, to compensate certain fi-nancial intermediaries who provide administrative services,personal and account maintenance services to shareholders.The Trust has also entered into a Distribution Plan with re-spect to its Participant Class, Cash Management Class and
Select Class shares pursuant to which each class of shares willpay the Distributor a monthly distribution fee at an annualrate of up to 0.25%, 0.10% and 0.55% of the average daily netassets of such class of shares, respectively, to compensate cer-tain service organizations for providing distribution relatedservices to the Trust. The Distributor has agreed to waive forat least one year the distribution fee on the Participant Class ofthe Government Securities Portfolio to the extent it exceeds0.10% of the average daily net assets on an annualized basis.For the six months ended April 30, 2018, this waiveramounted to approximately $13,684,000.The Trust has also entered into a Shareholder Services Planwith respect to its Participant Class, Cash Management Classand Select Class shares pursuant to which each class of shareswill pay the Distributor a monthly service fee at an annual rateof up to 0.25%, 0.05% and 0.25% of the average daily net as-sets of each such class of shares, respectively, to compensateservice organizations for providing administrative services toshareholders. The Distributor has agreed to waive for at leastone year the shareholder service fee on the Participant Class ofthe Government Securities Portfolio to the extent it exceeds0.15% of the average daily net assets on an annualized basis.For the six months ended April 30, 2018, this waiveramounted to approximately $9,122,000.The Distributor has agreed to reduce its distribution fees to en-able a Fund to maintain a minimum level of daily net invest-ment income for any class of shares in a Fund.E. Dividend Disbursing and Transfer/Co-TransferAgent: The Trust’s Dividend Disbursing and Transfer Agentis Boston Financial Data Services, Inc. (“BFDS”). Pursuant toa Transfer Agency Agreement, the Trust pays BFDS a feebased on the number of classes, accounts and transactions re-lating to the Funds of the Trust. Effective January 1, 2018,BFDS changed its name to DST Asset Manager Solutions, Inc.Morgan Stanley Services Company Inc. serves as Co-TransferAgent and provides certain transfer agency services withoutcompensation to the Trust with respect to certain direct trans-actions with the Trust.F. Custodian Fees: State Street (the “Custodian”) alsoserves as Custodian for the Trust in accordance with a Custo-dian Agreement. The Custodian holds cash, securities andother assets of the Trust as required by the Act. Custody feesare payable monthly based on assets held in custody, invest-ment purchases and sales activity and account maintenancefees, plus reimbursement for certain out-of-pocket expenses.G. Federal Income Taxes: It is each Fund’s intention to con-tinue to qualify as a regulated investment company and distributeall of its taxable and tax-exempt income. Accordingly, no provisionfor federal income taxes is required in the financial statements.
Notes to Financial Statements (unaudited) (cont’d)
2018 Semi-Annual Report
April 30, 2018
Merrill Corp - MS ILF Semi-Annual Report [Funds] 04-30-2018 ED [AUX] | thunt | 21-Jun-18 10:27 | 18-13101-10.fa | Sequence: 5CHKSUM Content: 4903 Layout: 24607 Graphics: No Graphics CLEAN
JOB: 18-13101-10 CYCLE#;BL#: 5; 0 TRIM: 8.25" x 10.75" COMPOSITECOLORS: Black, ~note-color 2 GRAPHICS: none V1.5
58
FASB ASC 740-10 “Income Taxes — Overall” sets forth aminimum threshold for financial statement recognition of thebenefit of a tax position taken or expected to be taken in a taxreturn. Management has concluded there are no significant un-certain tax positions that would require recognition in the fi-nancial statements. If applicable, the Funds recognize interestaccrued related to unrecognized tax benefits in “Interest Ex-pense” and penalties in “Other Expenses” in the Statements ofOperations. The Funds file tax returns with the U.S. InternalRevenue Service, New York and various states. Each of the taxyears in the four-year period ended October 31, 2017 remainssubject to examination by taxing authorities.The tax character of distributions paid may differ from thecharacter of distributions shown in the Statements of Changesin Net Assets due to short-term capital gains being treated asordinary income for tax purposes. The tax character of distri-butions paid during fiscal years 2017 and 2016 was as follows: 2017 2016 Distributions Distributions Paid From: Paid From: Tax- Paid-in- Tax- Paid-in- Ordinary Exempt Capital Ordinary Exempt Capital Income Income Gain Income Income GainFund (000) (000) (000) (000) (000) (000)Money Market $ 4,748 $ — $— $16,286 $ — $ —Prime 37,166 — — 55,736 — —Government 315,824 — — 89,185 — —Government Securities 71,971 — — 1,115 — —Treasury 97,967 — — 36,178 — —Treasury Securities 113,204 — — 26,922 — —Tax-Exempt 1 823 — 1 199 126
The amount and character of income and gains to be distrib-uted are determined in accordance with income tax regulationswhich may differ from GAAP. These book/tax differences areeither considered temporary or permanent in nature.Temporary differences are primarily due to differing book andtax treatments in the timing of the recognition of distributionpayable and/or deferred compensation.Permanent differences are generally due to distribution redesig-nations and/or gain on the sale of deferred compensation as-sets. These resulted in the following reclassifications among theFunds’ components of net assets at October 31, 2017: Accumulated Undistributed (Distributions in Excess of) Accumulated Net Investment Net Realized Paid-in- Income (Loss) Gain (Loss) CapitalFund (000) (000) (000)Money Market $ 30 $(30) $—Prime (15) 15 —Government (14) 14 —Government Securities (1) 1 —Treasury (7) 7 —Treasury Securities (4) 4 —Tax-Exempt (1) 1 —
At October 31, 2017, the components of distributable earn-ings on a tax basis were as follows: Undistributed Tax- Undistributed Ordinary Exempt Long-term Income Income Capital Gain Fund (000) (000) (000)Money Market $ 307 $ — $—Prime 2,696 — 15Government 22,831 — —Government Securities 324 — 2Treasury 7,714 — —Treasury Securities 7,042 — —Tax-Exempt — 17 —
At October 31, 2017, the following Funds had available forfederal income tax purposes unused short term capital lossesthat do not have an expiration date: Short-term Losses (No Expiration) Fund (000)Government $558Treasury 177Treasury Securities 150
In addition, at October 31, 2017, the following Fund hadavailable for federal income tax purposes unused capital losseswhich will expire on the indicated dates: 2018 Fund (000)Tax-Exempt $16
To the extent that capital loss carryforwards are used to offsetany future capital gains realized during the carryover period asprovided by U.S. federal income tax regulations, no capitalgains tax liability will be incurred by the Fund for gains real-ized and not distributed. To the extent that capital gains areoffset, such gains will not be distributed to the shareholders.During the year ended October 31, 2017, the following Fundutilized capital loss carryforwards for U.S. Federal income taxpurposes of approximately: Capital Loss Carryforward UtilizedFund (000)Tax-Exempt $4
H. Transactions with Affiliates: The Funds are permittedto purchase and sell securities (“cross-trade”) from and to otherMorgan Stanley Funds as well as other funds and client ac-counts for which the Adviser or an affiliate of the Adviserserves as investment adviser, pursuant to procedures approvedby the Trustees in compliance with Rule 17a-7 under the Act(the “Rule”). Each cross-trade is executed at the current marketprice in compliance with provisions of the Rule. For the sixmonths ended April 30, 2018, Tax-Exempt Portfolio engagedin cross-trade purchases of approximately $8,860,000 and sales
Notes to Financial Statements (unaudited) (cont’d)
2018 Semi-Annual Report
April 30, 2018
Merrill Corp - MS ILF Semi-Annual Report [Funds] 04-30-2018 ED [AUX] | thunt | 21-Jun-18 10:27 | 18-13101-10.fa | Sequence: 6CHKSUM Content: 60865 Layout: 55315 Graphics: No Graphics CLEAN
JOB: 18-13101-10 CYCLE#;BL#: 5; 0 TRIM: 8.25" x 10.75" COMPOSITECOLORS: Black, ~note-color 2 GRAPHICS: none V1.5
59
of approximately $200,000, which resulted in no net realizedgains or losses.The Trust has an unfunded Deferred Compensation Plan (the“Compensation Plan”), which allows each independentTrustee to defer payment of all, or a portion, of the fees he orshe receives for serving on the Board of Trustees. Each eligibleTrustee generally may elect to have the deferred amounts cred-ited with a return equal to the total return on one or more ofthe Morgan Stanley funds that are offered as investment op-tions under the Compensation Plan. Appreciation/depreciationand distributions received from these investments are recordedwith an offsetting increase/decrease in the deferred compensa-tion obligation and do not affect the net asset value of theFunds.I. Other: At April 30, 2018, certain Funds had otherwise un-affiliated record owners of 10% or greater. Investment activi-ties of these shareholders could have a material impact on theseFunds. These Funds and the aggregate percentage of suchowners were as follows: Percentage of Fund OwnershipMoney Market 74.3%Prime 56.3Government 16.4Government Securities 99.2Treasury 24.6Treasury Securities 26.9Tax-Exempt 91.4
Notes to Financial Statements (unaudited) (cont’d)
2018 Semi-Annual Report
April 30, 2018
Merrill Corp - MS ILF Semi-Annual Report [Funds] 04-30-2018 ED [AUX] | thunt | 21-Jun-18 10:27 | 18-13101-10.fa | Sequence: 7CHKSUM Content: 13729 Layout: 23637 Graphics: No Graphics CLEAN
JOB: 18-13101-10 CYCLE#;BL#: 5; 0 TRIM: 8.25" x 10.75" COMPOSITECOLORS: Black, ~note-color 2 GRAPHICS: none V1.5
60
MORGAN STANLEY INVESTMENT MANAGEMENT INC. AN IMPORTANT NOTICE CONCERNING OUR U.S. PRIVACY POLICYWe are required by federal law to provide you with a copy of our privacy policy annually. This policy applies to current and formerindividual investors in funds managed or sponsored by Morgan Stanley Investment Management Inc. (“MSIM”) as well as currentand former individual clients of MSIM. This policy is not applicable to partnerships, corporations, trusts or other non-individualclients or investors. Please note that we may amend this policy at any time, and will inform you of any changes as required by law.
WE RESPECT YOUR PRIVACYWe appreciate that you have provided us with your personal financial information. We strive to maintain the privacy of suchinformation while we help you achieve your financial objectives. This Notice describes what non-public personal information wecollect about you, why we collect it, when we may share it with others and how certain others may use it. It discusses the steps youmay take to limit our sharing of certain information about you to affiliated companies in the Morgan Stanley family of companies(“other Morgan Stanley companies”). It also discloses how you may limit use of certain shared information for marketing purposesby other Morgan Stanley branded companies. Throughout this policy, we refer to the non-public information that personallyidentifies you or your accounts as “personal information.”
1. WHAT PERSONAL INFORMATION DO WE COLLECT ABOUT YOU?We obtain personal information from applications and other forms you submit to us, from your dealings with us, from consumerreporting agencies, from our Web sites and from third parties and other sources.For example:
• We may collect information such as your name, address, e-mail address, telephone/fax numbers, assets, income and investmentobjectives through subscription documents, applications and other forms you submit to us.
• We may obtain information about account balances, your use of account(s) and the types of products and services you preferto receive from us through your dealings and transactions with us and other sources.
• We may obtain information about your creditworthiness and credit history from consumer reporting agencies.• We may collect background information from and through third-party vendors to verify representations you have made and to
comply with various regulatory requirements.• If you interact with us through our public and private Web sites, we may collect information that you provide directly through
online communications (such as an e-mail address). We may also collect information about your Internet service provider,your domain name, your computer’s operating system and Web browser, your use of our Web sites and your product andservice preferences, through the use of “cookies.” Please consult the Terms of Use of these sites for more details.
2. WHEN DO WE DISCLOSE PERSONAL INFORMATION WE COLLECT ABOUT YOU?We may disclose personal information we collect about you to other Morgan Stanley companies and to non-affiliated third parties.
a. Information We Disclose to Other Morgan Stanley Companies.
We may disclose personal information to other Morgan Stanley companies for a variety of reasons, including to manage youraccount(s) effectively, to service and process your transactions, to let you know about products and services offered by us and otherMorgan Stanley companies, to manage our business, and as otherwise required or permitted by law. Offers for products andservices from other Morgan Stanley companies are developed under conditions designed to safeguard your personal information.
Privacy Notice (unaudited)
2018 Semi-Annual Report
April 30, 2018
Merrill Corp - MS ILF Semi-Annual Report [Funds] 04-30-2018 ED [AUX] | thunt | 21-Jun-18 10:27 | 18-13101-10.fa | Sequence: 8CHKSUM Content: 44230 Layout: 5125 Graphics: No Graphics CLEAN
JOB: 18-13101-10 CYCLE#;BL#: 5; 0 TRIM: 8.25" x 10.75" COMPOSITECOLORS: Black, ~note-color 2 GRAPHICS: none V1.5
61
b. Information We Disclose to Non-affiliated Third Parties.
We do not disclose personal information that we collect about you to non-affiliated third parties except to those who providemarketing services on our behalf, to financial institutions with whom we have joint marketing agreements, and as otherwiserequired or permitted by law. For example, we may disclose personal information to non-affiliated third parties for servicing andprocessing transactions, to offer our own products and services, to protect against fraud, for institutional risk control, to respond tojudicial process or to perform services on our behalf. When we share personal information with a non-affiliated third party, theyare required to limit their use of personal information to the particular purpose for which it was shared and they are not allowed toshare personal information with others except to fulfill that limited purpose or as may be permitted or required by law.
3. HOW DO WE PROTECT THE SECURITY AND CONFIDENTIALITY OF PERSONAL INFORMATION WECOLLECT ABOUT YOU?We maintain physical, electronic and procedural security measures to help safeguard the personal information we collect aboutyou. We have internal policies governing the proper handling of client information. Third parties that provide support ormarketing services on our behalf may also receive personal information, and we require them to adhere to confidentiality standardswith respect to such information.
4. HOW CAN YOU LIMIT THE SHARING OF CERTAIN TYPES OF PERSONAL INFORMATION WITH OTHERMORGAN STANLEY COMPANIES?We offer you choices as to whether we share with other Morgan Stanley companies the personal information that was collected todetermine your eligibility for products and services you request (“eligibility information”). Eligibility information does not includeyour identification information or personal information pertaining to our transactions or experiences with you. Please note that,even if you direct us not to share eligibility information with other Morgan Stanley companies (“opt-out”), we may still sharepersonal information, including eligibility information, with those companies in circumstances excluded from the opt-out underapplicable law, such as to process transactions or to service your account.
5. HOW CAN YOU LIMIT THE USE OF CERTAIN TYPES OF PERSONAL INFORMATION BY OTHER MORGANSTANLEY COMPANIES FOR MARKETING?By following the opt-out instructions in Section 6 below, you may limit other Morgan Stanley branded companies from marketingtheir products or services to you based on personal information we disclose to them. This information may include, for example,your income and account history with us. Please note that, even if you choose to limit Other Morgan Stanley Companies fromusing personal information about you that we may share with them for marketing their products and services to you, OtherMorgan Stanley Companies may use your personal information that they obtain from us to market to you in circumstancespermitted by law, such as if the Other Morgan Stanley Company has its own relationship with you.
6. HOW CAN YOU SEND US AN OPT-OUT INSTRUCTION?If you wish to limit our sharing of eligibility information about you with other Morgan Stanley companies or other MorganStanley companies’ use of personal information for marketing purposes, as described in this notice, you may do so by:
• Calling us at (800) 548-7786Monday–Friday between 8a.m. and 6p.m.(EST)
• Writing to us at the following address:DST Asset Manager Solutions, Inc.c/o Privacy CoordinatorP.O. Box 219804Kansas City, Missouri 64121
Privacy Notice (unaudited) (cont’d)
2018 Semi-Annual Report
April 30, 2018
Merrill Corp - MS ILF Semi-Annual Report [Funds] 04-30-2018 ED [AUX] | thunt | 21-Jun-18 10:27 | 18-13101-10.fa | Sequence: 9CHKSUM Content: 46007 Layout: 12294 Graphics: No Graphics CLEAN
JOB: 18-13101-10 CYCLE#;BL#: 5; 0 TRIM: 8.25" x 10.75" COMPOSITECOLORS: Black, ~note-color 2 GRAPHICS: none V1.5
62
Your written request should include your name, address, telephone number and account number(s) to which the opt-out appliesand whether you are opting out with respect to sharing of eligibility information (Section 4 above), or if information used forMarketing (Section 5 above) or both. Written opt-out requests should not be sent with any other correspondence. In order toprocess your request, we require that the request be provided by you directly and not through a third party.Your opt-out preference will remain in effect with respect to this policy (as it may be amended) until you notify us otherwise. Ifyou have a joint account, your direction for us not to share this information with other Morgan Stanley companies and for thoseother Morgan Stanley companies not to use your personal information for marketing will be applied to all account holders on thataccount. Please understand that if you limit our sharing or our affiliated companies’ use of personal information, you and any jointaccount holder(s) may not receive information about Morgan Stanley products and services, including products or services thatcould help you manage your financial resources and achieve your investment objectives.
7. WHAT IF AN AFFILIATED COMPANY BECOMES A NON-AFFILIATED THIRD PARTY?If, at any time in the future, an affiliated company becomes a non-affiliated third party, further disclosures of personal informationmade to the former affiliated company will be limited to those described in Section 2(b) above relating to non-affiliated thirdparties. If you elected under Section 6 to limit disclosures we make to affiliated companies, or use of personal information byaffiliated companies, your election will not apply to use by any former affiliated company of your personal information in theirpossession once it becomes a non-affiliated third party.
SPECIAL NOTICE TO RESIDENTS OF VERMONTThe following section supplements our policy with respect to our individual clients who have a Vermont address and supersedes anything to the contrary inthe above policy with respect to those clients only.
The state of Vermont requires financial institutions to obtain your consent prior to sharing personal information that they collect about you with affiliated companiesand non-affiliated third parties other than in certain limited circumstances. Except as permitted by law, we will not share personal information we collect about youwith non-affiliated third parties or other Morgan Stanley companies unless you provide us with your written consent to share such information (“opt-in”).
If you wish to receive offers for investment products and services offered by or through other Morgan Stanley companies, please notify us in writing at the followingaddress:
DST Asset Manager Solutions, Inc.c/o Privacy CoordinatorP.O. Box 219804Kansas City, Missouri 64121
Your authorization should include your name, address, telephone number and account number(s) to which the opt-in applies and should not be sent with any othercorrespondence. In order to process your authorization, we require that the authorization be provided by you directly and not through a third party.
SPECIAL NOTICE TO RESIDENTS OF CALIFORNIAThe following section supplements our policy with respect to our individual clients who have a California address and supersedes anything to the contrary inthe above policy with respect to those clients only.
In response to a California law, if your account has a California home address, your personal information will not be disclosed to non-affiliated third parties except aspermitted by applicable California law, and we will limit sharing such information with our affiliates to comply with California privacy laws that apply to us.
Privacy Notice (unaudited) (cont’d)
2018 Semi-Annual Report
April 30, 2018
Merrill Corp - MS ILF Semi-Annual Report [Funds] 04-30-2018 ED [AUX] | thunt | 21-Jun-18 10:27 | 18-13101-10.fa | Sequence: 10CHKSUM Content: 22779 Layout: 51286 Graphics: No Graphics CLEAN
JOB: 18-13101-10 CYCLE#;BL#: 5; 0 TRIM: 8.25" x 10.75" COMPOSITECOLORS: Black, ~note-color 2 GRAPHICS: none V1.5
63
TrusteesFrank L. BowmanKathleen A. DennisNancy C. EverettJakki L. HausslerDr. Manuel H. JohnsonJoseph J. KearnsMichael F. KleinPatricia MaleskiMichael E. Nugent, Chair of the BoardW. Allen ReedFergus Reid
OfficersJohn H. GernonPresident and Principal Executive Officer
Timothy J. KnierimChief Compliance Officer
Mary E. MullinSecretary
Francis J. SmithTreasurer and Principal Financial Officer
Michael J. KeyVice President
Reporting to ShareholdersEach Fund provides a complete schedule of portfolio holdings in its semi-annual and annual reports within 60 days of the end of the Fund’s second and fourth fiscalquarters. The semi-annual and annual reports are filed electronically with the Securities and Exchange Commission (SEC) on Form N-CSRS and Form N-CSR,respectively. Each Fund also delivers the semi-annual and annual reports to shareholders and makes these reports available on its public website,www.morganstanley.com/liquidity. Each Fund also files a complete schedule of portfolio holdings with the SEC for the Trust’s first and third fiscal quarters onForm N-Q and monthly holdings on Form N-MFP. The Funds do not deliver these reports to shareholders, nor are the first and third fiscal quarters posted to theMorgan Stanley public website. However, the holdings for each Fund are posted to the Morgan Stanley public website. You may obtain the Form N-Q filings (as wellas the Form N-CSR, N-CSRS and N-MFP filings) by accessing the SEC’s website, www.sec.gov. You may also review and copy them at the SEC’s Public ReferenceRoom in Washington, DC. Information on the operation of the SEC’s Public Reference Room may be obtained by calling the SEC toll free at 1 (800) SEC-0330. Youcan also request copies of these materials, upon payment of a duplicating fee, by electronic request at the SEC’s email address ([email protected]) or by writingto the SEC’s Public Reference Section, Washington, D.C. 20549-1520.
The Trust’s Statement of Additional Information contains additional information about the Trust, including its Trustees. It is available, without charge, by callingtoll free at 1 (888) 378-1630.
Proxy Voting Policies and Procedures and Proxy Voting RecordYou may obtain a copy of the Trust’s Proxy Voting Policy and Procedures and information regarding how the Trust voted proxies relating to portfolio securitiesduring the most recent twelve-month period ended June 30, without charge, upon request, by calling toll free 1 (888) 378-1630 or by visiting our website atwww.morganstanley.com/liquidity. This information is also available on the SEC’s website at www.sec.gov.
This report is authorized for distribution only when preceded or accompanied by a prospectus or summary prospectus of the applicable Fund of MorganStanley Institutional Liquidity Funds, Inc., which describes in detail the Fund’s investment policies, risks, fees and expenses. Please read the prospectuscarefully before you invest or send money. For additional information, including information regarding the investments comprising the Fund, please visit ourwebsite at www.morganstanley.com/liquidity or call toll free 1 (888) 378-1630.
Trustee and Officer Information (unaudited)
2018 Semi-Annual Report
April 30, 2018
Adviser and AdministratorMorgan Stanley Investment Management Inc.522 Fifth AvenueNew York, New York 10036
DistributorMorgan Stanley Distribution, Inc.522 Fifth AvenueNew York, New York 10036
Dividend Disbursing and Transfer AgentDST Asset Manager Solutions, Inc.2000 Crown Colony DriveQuincy, Massachusetts 02169
Co-Transfer AgentMorgan Stanley Services Company, Inc.522 Fifth AvenueNew York, New York 10036
CustodianState Street Bank and Trust CompanyOne Lincoln StreetBoston, Massachusetts 02111
Legal CounselDechert LLP1095 Avenue of the AmericasNew York, New York 10036
Counsel to the Independent TrusteesPerkins Coie LLP30 Rockefeller PlazaNew York, New York 10112
Independent Registered Public Accounting FirmErnst & Young LLP200 Clarendon StreetBoston, Massachusetts 02116
Merrill Corp - MS ILF Semi-Annual Report [Funds] 04-30-2018 ED [AUX] | thunt | 21-Jun-18 10:27 | 18-13101-10.fa | Sequence: 11CHKSUM Content: 36997 Layout: 966 Graphics: No Graphics CLEAN
JOB: 18-13101-10 CYCLE#;BL#: 5; 0 TRIM: 8.25" x 10.75" COMPOSITECOLORS: Black, ~note-color 2 GRAPHICS: none V1.5

This page intentionally left blank
Merrill Corp - MS Institutional Fund [MSIF] SAI [8.25 x 10.75] ED Style Only | ltolend | 30-Nov-17 17:59 | 12-21693-9.x ILB | Sequence: 1CHKSUM Content: 61848 Layout: 41581 Graphics: No Graphics CLEAN
JOB: 12-21693-9 CYCLE#;BL#: 11; 0 TRIM: 8.25" x 10.75" COMPOSITECOLORS: Black, ~note-color 2 GRAPHICS: none V1.5

Merrill Corp - Merrill Corporation ED True Blanks 7.5x8.75 Prospectus [Funds] Style Only | rradatz | 05-Aug-10 13:03 | 07-28247-18.tb2 | Sequence: 1CHKSUM Content: No Content Layout: 0 Graphics: No Graphics CLEAN
JOB: 07-28247-18 CYCLE#;BL#: 2; 0 TRIM: 7.5" x 8.75" COMPOSITECOLORS: none GRAPHICS: none V1.5
Printed in U.S.A.This Report has been prepared for shareholders and may be distributedto others only if preceded or accompanied by a current prospectus.
Morgan Stanley Investment Management Inc.522 Fifth AvenueNew York, New York 10036
© 2018 Morgan Stanley. Morgan Stanley Distribution, Inc.
MSILFSAN2128853 EXP 06.30.19
Merrill Corp - MS ILF Semi-Annual Report [Funds] 04-30-2018 ED [AUX] | thunt | 21-Jun-18 10:27 | 18-13101-10.za | Sequence: 1CHKSUM Content: 11613 Layout: 19555 Graphics: 8057 CLEAN
JOB: 18-13101-10 CYCLE#;BL#: 5; 0 TRIM: 8.25" x 10.75" COMPOSITECOLORS: Black, ~note-color 2, ~note-color 3 GRAPHICS: ms_new_k_logo.eps V1.5