Embed Size (px)
Citation preview

Purpose-Driven
Performance
Morgan Stanley and
Bank of America Merrill Lynch
Utility Equity Conferences
Barclays Utility Fixed Income
Conference
Feb. 27-28, 2018
| Morgan Stanley, BAML and Barclays Utility Conferences | Feb. 27-28, 2018
Cautionary Statements
Use of Non-GAAP Financial MeasuresIn this presentation, Ameren has presented core earnings per share, which is a non-GAAP measure and may not be comparable to those of other companies. A reconciliation of GAAP
to non-GAAP information is included in this presentation. Generally, core earnings or losses include earnings or losses attributable to Ameren common shareholders and exclude
income or loss from significant discrete items that management does not consider representative of ongoing earnings, such as the third quarter 2017 non-cash charge for the
revaluation of deferred taxes resulting from a July 2017 change in Illinois law that increased the state's corporate income tax rate and the fourth quarter 2017 non-cash charge for the
revaluation of deferred taxes resulting from a December 2017 change in federal law that decreased the federal corporate income tax rate. Ameren uses core earnings internally for
financial planning and for analysis of performance. Ameren also uses core earnings as the primary performance measurement when communicating with analysts and investors
regarding our earnings results and outlook, as the company believes that core earnings allow the company to more accurately compare its ongoing performance across periods. In
providing core earnings guidance, there could be differences between core earnings and earnings prepared in accordance with GAAP as a result of our treatment of certain items, such
as those described above. Ameren is unable to estimate the impact on GAAP earnings of such future items.
Forward-looking Statements Statements in this presentation not based on historical facts are considered "forward-looking" and, accordingly, involve risks and uncertainties that could cause actual results to differ
materially from those discussed. Although such forward-looking statements have been made in good faith and are based on reasonable assumptions, there is no assurance that the
expected results will be achieved. These statements include (without limitation) statements as to future expectations, beliefs, plans, strategies, objectives, events, conditions, and
financial performance. In connection with the "safe harbor" provisions of the Private Securities Litigation Reform Act of 1995, Ameren is providing this cautionary statement to identify
important factors that could cause actual results to differ materially from those anticipated. In addition to factors discussed in this presentation, Ameren’s Annual Report on Form 10-K
for the year ended December 31, 2017, and its other reports filed with the SEC under the Securities Exchange Act of 1934 contain a list of factors and a discussion of risks which could
cause actual results to differ materially from management expectations suggested in such “forward-looking” statements. All “forward-looking” statements included in this presentation are
based upon information presently available, and Ameren, except to the extent required by the federal securities laws, undertakes no obligation to update or revise publicly any “forward-
looking” statements to reflect new information or current events.
Earnings Guidance and Growth Expectations In this presentation, Ameren has presented earnings guidance and growth expectations. The guidance assumes normal temperatures for 2018 and excludes any possible temporary
retention of cash flow and earnings benefits from lower federal corporate income tax rates and, along with the growth expectations, is subject to the effects of, among other things,
changes in 30-year U.S. Treasury bond yields; regulatory, judicial and legislative actions; energy center and energy distribution operations; energy, economic, capital and credit market
conditions; severe storms; unusual or otherwise unexpected gains or losses; and other risks and uncertainties outlined, or referred to, in the Forward-looking Statements section of this
presentation and in Ameren’s periodic reports filed with the SEC.
2
| Morgan Stanley, BAML and Barclays Utility Conferences | Feb. 27-28, 2018| Morgan Stanley, BAML and Barclays Utility Conferences | Feb. 27-28, 2018
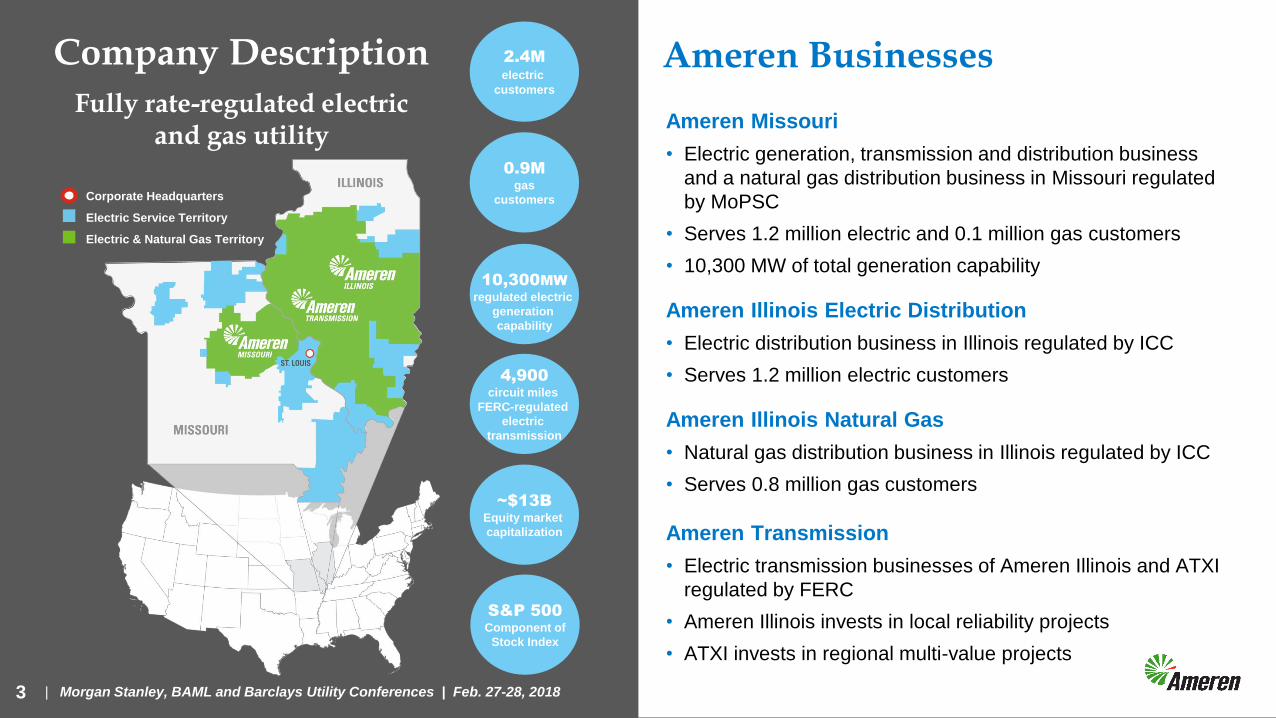
Company Description
3
Fully rate-regulated electric and gas utility
2.4M
electric
customers
0.9M
gas
customers
10,300MW
regulated electric
generation
capability
4,900
circuit miles
FERC-regulated
electric
transmission
Corporate Headquarters
Electric Service Territory
Electric & Natural Gas Territory
Ameren Businesses
~$13B
Equity market
capitalization
S&P 500
Component of
Stock Index
Ameren Missouri
• Electric generation, transmission and distribution business
and a natural gas distribution business in Missouri regulated
by MoPSC
• Serves 1.2 million electric and 0.1 million gas customers
• 10,300 MW of total generation capability
Ameren Illinois Electric Distribution
• Electric distribution business in Illinois regulated by ICC
• Serves 1.2 million electric customers
Ameren Illinois Natural Gas
• Natural gas distribution business in Illinois regulated by ICC
• Serves 0.8 million gas customers
Ameren Transmission
• Electric transmission businesses of Ameren Illinois and ATXI
regulated by FERC
• Ameren Illinois invests in local reliability projects
• ATXI invests in regional multi-value projects
| Morgan Stanley, BAML and Barclays Utility Conferences | Feb. 27-28, 20184
Attractive total return
potential
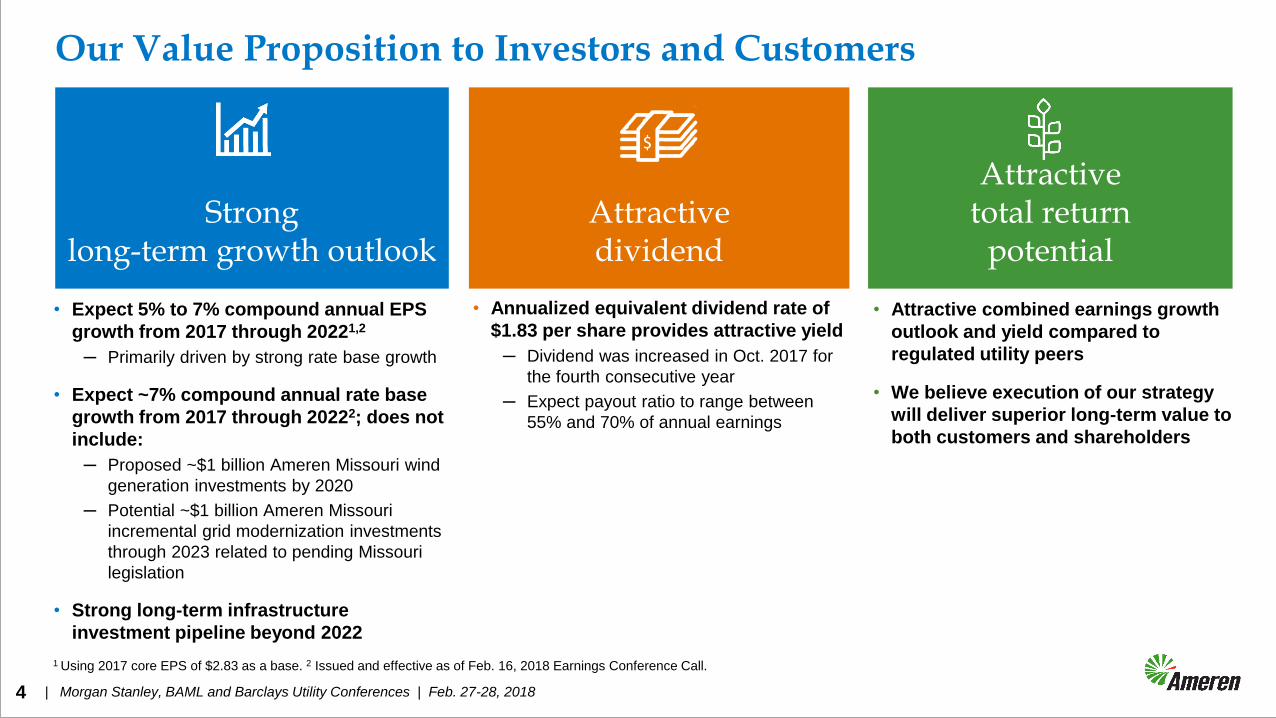
Our Value Proposition to Investors and Customers
• Expect 5% to 7% compound annual EPS
growth from 2017 through 20221,2
─ Primarily driven by strong rate base growth
• Expect ~7% compound annual rate base
growth from 2017 through 20222; does not
include:
─ Proposed ~$1 billion Ameren Missouri wind
generation investments by 2020
─ Potential ~$1 billion Ameren Missouri
incremental grid modernization investments
through 2023 related to pending Missouri
legislation
• Strong long-term infrastructure
investment pipeline beyond 2022
Strong long-term growth outlook
Attractive dividend
• Annualized equivalent dividend rate of
$1.83 per share provides attractive yield
─ Dividend was increased in Oct. 2017 for
the fourth consecutive year
─ Expect payout ratio to range between
55% and 70% of annual earnings
• Attractive combined earnings growth
outlook and yield compared to
regulated utility peers
• We believe execution of our strategy
will deliver superior long-term value to
both customers and shareholders
1 Using 2017 core EPS of $2.83 as a base. 2 Issued and effective as of Feb. 16, 2018 Earnings Conference Call.
| Morgan Stanley, BAML and Barclays Utility Conferences | Feb. 27-28, 20185
• Investing in and operating our utilities in a
manner consistent with existing regulatory
frameworks
• Enhancing regulatory frameworks and
advocating for responsible energy and
economic policies
• Creating and capitalizing on opportunities
for investment for the benefit of our
customers and shareholders
Our Strategic Plan
| Morgan Stanley, BAML and Barclays Utility Conferences | Feb. 27-28, 20186
0
20
40
60
80
100
120
140
0
100
200
300
400
500
600
2001 2004 2007 2010 2013 2016
Recordable Cases
Lost Workday Away Cases
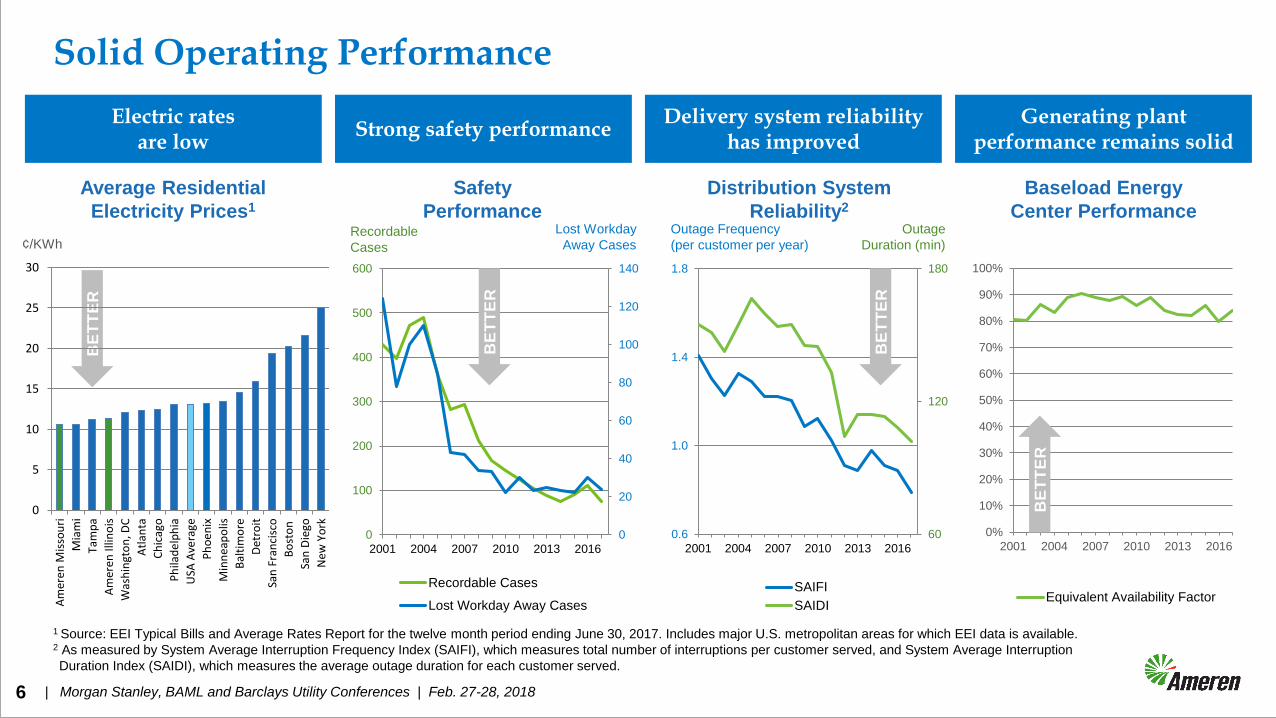
Safety
Performance
Average Residential
Electricity Prices1
BE
TT
ER
60
120
180
0.6
1.0
1.4
1.8
2001 2004 2007 2010 2013 2016
SAIFI
SAIDI
0%
10%
20%
30%
40%
50%
60%
70%
80%
90%
100%
2001 2004 2007 2010 2013 2016
Equivalent Availability Factor
Distribution System
Reliability2
Baseload Energy
Center Performance
¢/KWhRecordable
Cases
Lost Workday
Away Cases
BE
TT
ER
Outage Frequency
(per customer per year)
Outage
Duration (min)
BE
TT
ER
BE
TT
ER
Electric ratesare low
Strong safety performanceDelivery system reliability
has improvedGenerating plant
performance remains solid
1 Source: EEI Typical Bills and Average Rates Report for the twelve month period ending June 30, 2017. Includes major U.S. metropolitan areas for which EEI data is available. 2 As measured by System Average Interruption Frequency Index (SAIFI), which measures total number of interruptions per customer served, and System Average Interruption
Duration Index (SAIDI), which measures the average outage duration for each customer served.
Solid Operating Performance
0
5
10
15
20
25
30
Am
eren
Mis
sou
ri
Mia
mi
Tam
pa
Am
eren
Illin
ois
Was
hin
gto
n, D
C
Atl
anta
Ch
icag
o
Ph
ilad
elp
hia
USA
Ave
rage
Ph
oe
nix
Min
nea
po
lis
Bal
tim
ore
Det
roit
San
Fra
nci
sco
Bo
sto
n
San
Die
go
New
Yo
rk
| Morgan Stanley, BAML and Barclays Utility Conferences | Feb. 27-28, 2018
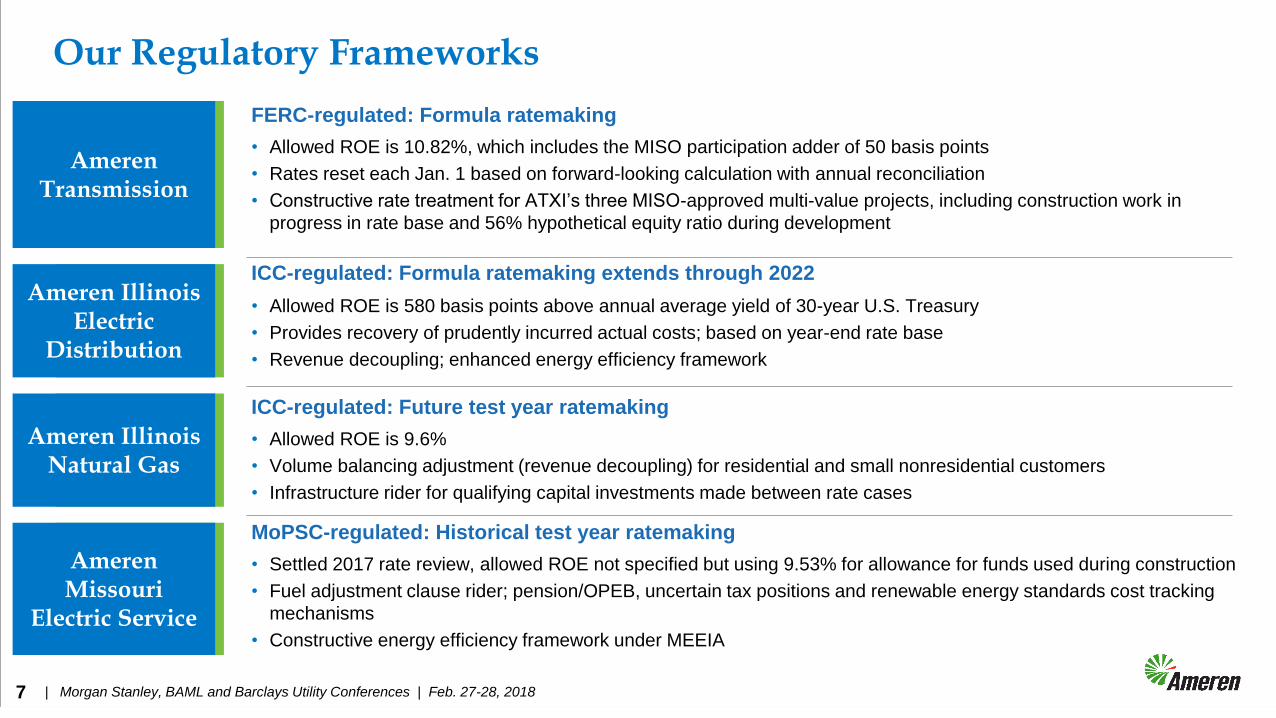
FERC-regulated: Formula ratemaking
• Allowed ROE is 10.82%, which includes the MISO participation adder of 50 basis points
• Rates reset each Jan. 1 based on forward-looking calculation with annual reconciliation
• Constructive rate treatment for ATXI’s three MISO-approved multi-value projects, including construction work in
progress in rate base and 56% hypothetical equity ratio during development
ICC-regulated: Formula ratemaking extends through 2022
• Allowed ROE is 580 basis points above annual average yield of 30-year U.S. Treasury
• Provides recovery of prudently incurred actual costs; based on year-end rate base
• Revenue decoupling; enhanced energy efficiency framework
ICC-regulated: Future test year ratemaking
• Allowed ROE is 9.6%
• Volume balancing adjustment (revenue decoupling) for residential and small nonresidential customers
• Infrastructure rider for qualifying capital investments made between rate cases
MoPSC-regulated: Historical test year ratemaking
• Settled 2017 rate review, allowed ROE not specified but using 9.53% for allowance for funds used during construction
• Fuel adjustment clause rider; pension/OPEB, uncertain tax positions and renewable energy standards cost tracking
mechanisms
• Constructive energy efficiency framework under MEEIA
Our Regulatory Frameworks
Ameren Transmission
Ameren Illinois Natural Gas
Ameren Missouri
Electric Service
7
Ameren Illinois Electric
Distribution
| Morgan Stanley, BAML and Barclays Utility Conferences | Feb. 27-28, 2018
• Key utility provisions included in legislation enacted in Dec. 2017
─ Corporate tax rate reduced to 21% from 35% beginning Jan. 1, 2018
─ End of bonus depreciation for regulated utilities
─ Interest deductibility retained for regulated utilities
─ State and local tax deductibility retained
─ Normalization of income taxes for ratemaking retained, including flow back of excess
deferred taxes
─ Production tax credits for wind generation unchanged
─ Dividend and capital gains tax parity retained
• Impacts on Ameren’s earnings, cash flows and balance sheet
─ Reduces cash flow by ~$1 billion from 2018 through 2022
─ Reduces deferred taxes which increases rate base ~$1 billion from 2018 through 2022
• Lower rate on new deferred taxes; end of bonus depreciation; flow back of excess deferred taxes
─ Expect parent company interest expense to be deductible
─ Reduces tax benefit associated with parent company and other unrecoverable expenses
─ 2017 non-cash, non-core charge of $154 million, primarily at parent company, for
revaluation of deferred taxes
• Bottom Line: Federal income tax reform delivers significant benefits to customers and
supports strong earnings growth outlook
8
Impacts of Federal Income Tax Reform
| Morgan Stanley, BAML and Barclays Utility Conferences | Feb. 27-28, 2018
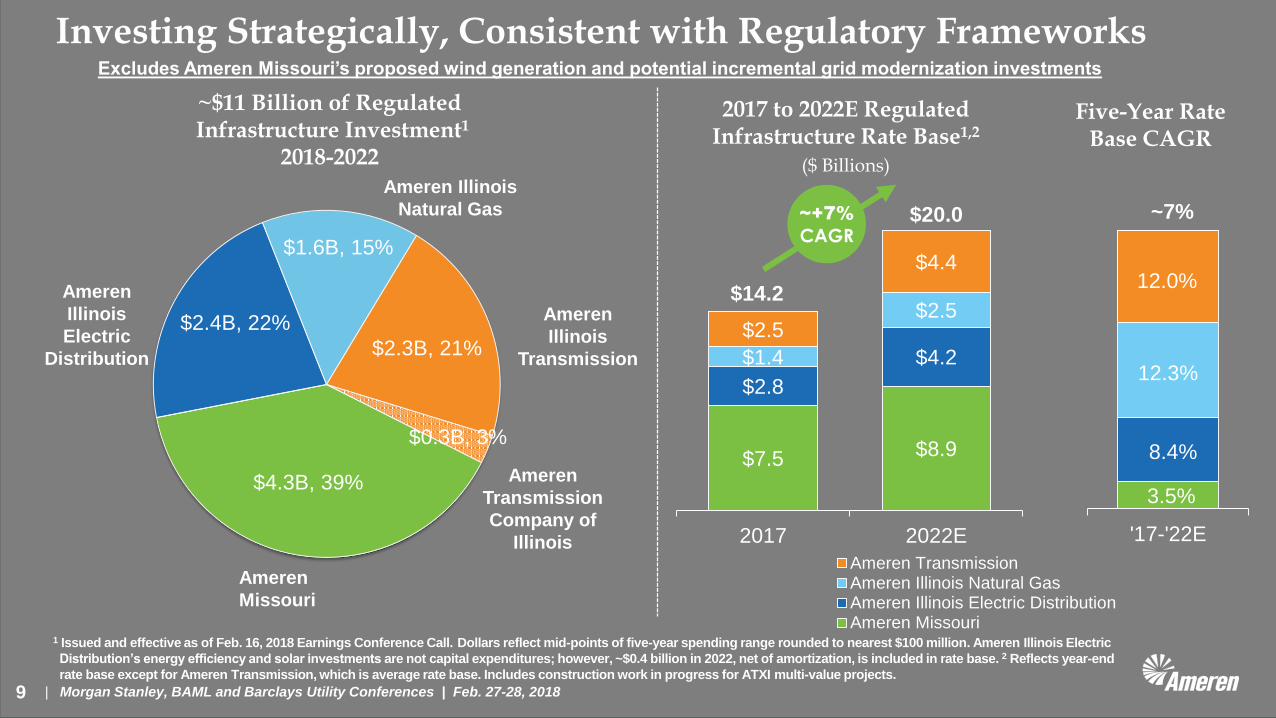
$4.3B, 39%
$2.4B, 22%
$1.6B, 15%
$2.3B, 21%
$0.3B, 3%
2017 to 2022E Regulated Infrastructure Rate Base1,2
($ Billions)
Five-Year Rate Base CAGR
~$11 Billion of RegulatedInfrastructure Investment1
2018-2022
1 Issued and effective as of Feb. 16, 2018 Earnings Conference Call. Dollars reflect mid-points of five-year spending range rounded to nearest $100 million. Ameren Illinois Electric
Distribution’s energy efficiency and solar investments are not capital expenditures; however, ~$0.4 billion in 2022, net of amortization, is included in rate base. 2 Reflects year-end
rate base except for Ameren Transmission, which is average rate base. Includes construction work in progress for ATXI multi-value projects.
9
Investing Strategically, Consistent with Regulatory Frameworks
Ameren
Illinois
Electric
Distribution
Ameren
Illinois
Transmission
Ameren
Transmission
Company of
Illinois
Ameren
Missouri
Ameren Illinois
Natural Gas
$7.5 $8.9
$2.8
$4.2$1.4
$2.5$2.5
$4.4
$14.2
$20.0
2017 2022E
Ameren TransmissionAmeren Illinois Natural GasAmeren Illinois Electric DistributionAmeren Missouri
'17-'22E
12.0%
12.3%
8.4%
3.5%
~7%~+7%
CAGR
Excludes Ameren Missouri’s proposed wind generation and potential incremental grid modernization investments
| Morgan Stanley, BAML and Barclays Utility Conferences | Feb. 27-28, 201810
• Ameren Missouri in advanced negotiations with
multiple wind developers for ownership of at least 700
MWs of generation, ~$1 billion investment
─ Would achieve compliance with Missouri Renewable Energy
Standard
─ Upon reaching agreements with developers, expect to file
CCN requests for projects with MoPSC in first half of 2018
─ CCN filings to include requests to use Renewable Energy
Standard-Rate Adjustment Mechanism for cost recovery
─ RTO interconnection studies are already underway
• Delivers benefits to customers, environment and
communities we serve
─ Advances transition of generation to cleaner, more diverse
energy portfolio
─ Ameren Missouri targeting substantial reductions in CO2
emissions – 35% by 2030, 50% by 2040 and 80% by 20501
Wind Investment Update
1 From 2005 level.
| Morgan Stanley, BAML and Barclays Utility Conferences | Feb. 27-28, 201811
• Senate Bill 564 passed the Missouri Senate on Feb. 15, 2018
─ Bill supports investment to modernize energy grid for the benefit of customers and state of Missouri
─ Next step is consideration by the Missouri House of Representatives
• Key provisions for electric utility service
─ Defer between rate cases 85% of depreciation on capital expenditures1 placed in-service and return on
incremental rate base (plant-in-service accounting)
• Regulatory asset added to rate base in next rate case filing and recovered over 20 years
─ MoPSC authorized to pass savings from lower federal income tax rate to customers2
• Regulatory liability established for amount accumulated from Jan. 1, 2018 to date customer rates adjusted
─ Economic development incentives for customers adding at least 300 kWs
─ Rate cap of 2.85% CAGR to Dec. 31, 2023; extends to Dec. 31, 2028, if utility requests and MoPSC approves3
• Based on April 1, 2017 rates, less half of 2018 federal income tax savings passed on to customers
• Initial base rate freeze through March 31, 20204
─ Continued strong MoPSC oversight and consumer protections
• Would support ability to invest ~$1 billion of incremental capital over 2019 through 2023 period
─ Investments would deliver significant benefits to customers and create good-paying jobs
─ Potential investment not reflected in current 2018-2022 capital expenditure plan
• Legislative session ends May 18; if enacted, legislation effective Aug. 28, 2018
Missouri Legislation Update
Customer and Community Benefits
Enhanced regulatory
framework would enable
greater investment;
create more reliable,
smarter, more secure
grid; better position
Missouri for future; and
create significant number
of quality jobs
1 All rate base additions except new coal-fired, nuclear, and natural gas generating units or service to new customer premises. 2 MoPSC must act within 90 days of
Governor Greitens signing legislation. 3 If average overall rate exceeds cap, Ameren Missouri shall not recover any amount in excess of cap, unless force majeure
event has occurred. Rate cap excludes MEEIA rider. If FAC and RES-RAM riders cause rates to temporarily exceed 2.85% CAGR, overage to be deferred for
future recovery in next general rate case to the extent rate cap is not exceeded. 4 Excludes FAC, MEEIA and RES-RAM rate riders.
| Morgan Stanley, BAML and Barclays Utility Conferences | Feb. 27-28, 2018
Select Regulatory Matters
12
Ameren Transmission • Second complaint case to reduce MISO’s FERC-allowed base ROE pending
─ In June 2016, ALJ recommended a 9.70% base ROE
• If approved by FERC, would result in total allowed ROE of 10.20% vs. current 10.82%, both include 50
basis point adder for MISO participation; reserved for potential refunds
─ In Sept. 2017, MISO transmission owners, including Ameren Illinois and ATXI, filed motion
to dismiss pending complaint case maintaining:
• Base ROE of 10.32% ordered by FERC in first complaint case has not been shown to be unjust and
unreasonable
• Approach used by complainants to assert that base ROE was unjust and unreasonable was rejected by
U.S. Court of Appeals for the D.C. Circuit in New England ROE case
• Ameren Transmission to pass savings from lower federal income tax rate to
customers through formula ratemaking
Ameren Illinois Electric Distribution • In Dec. 2017, ICC approved a rate change, effective Jan. 2018, consistent with our
filing in the annual rate update
─ Each year’s electric distribution service earnings are a function of the rate formula and are
not directly determined by that year’s rate update filing or the current rates charged to
customers
• In Feb. 2018, ICC approved Ameren Illinois’ petition to pass savings from lower
federal income tax rate to customers effective Jan. 1, 2018
─ Amount net of the July 2017 increase in the Illinois state income tax rate
| Morgan Stanley, BAML and Barclays Utility Conferences | Feb. 27-28, 2018
Select Regulatory Matters, Cont’d
Ameren Illinois Natural Gas • In Jan. 2018, requested a $49 million annual natural gas distribution rate increase from
ICC; includes ~$42 million that would otherwise be recovered in 2019 under qualifying
infrastructure plant (QIP) rider
– Based on 10.3% ROE; 50% equity ratio; $1.6 billion rate base; 2019 future test year
• Rate base is year-end 2018 plus estimated average 2019 non-QIP rate base
– Net increase in overall revenues for 2019 is $7 million; excludes 2019 QIP rider revenues
– Incorporates 2018 reduction in federal and 2017 increase in state tax rates
– New base rates reset QIP rider to zero, ensuring rider does not exceed rate impact limitation
– ICC decision required by Dec. 2018; new rates expected to be effective in Jan. 2019
• Ameren Illinois petition to pass savings from lower federal income tax rate to
customers pending at ICC effective Jan. 25, 2018
– Amount net of the July 2017 increase in the Illinois state income tax rate
Ameren Missouri • On Feb. 21, 2018, MoPSC initiated proceeding to determine how to pass savings from
lower federal income tax rate to customers
• If Senate Bill 564 is enacted, would pass savings from lower federal income tax rate to
electric customers retroactive to Jan. 1, 2018
13
| Morgan Stanley, BAML and Barclays Utility Conferences | Feb. 27-28, 2018
Financial Strategy
14
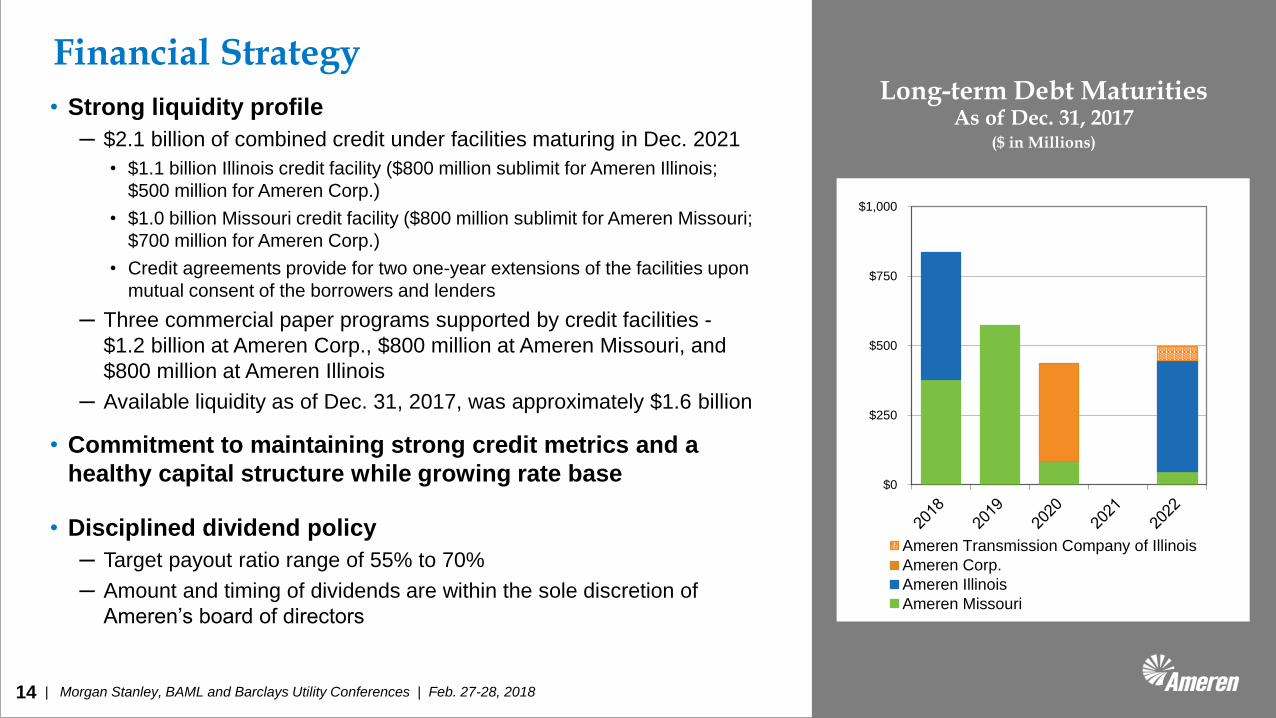
Long-term Debt MaturitiesAs of Dec. 31, 2017
($ in Millions)
$0
$250
$500
$750
$1,000
Ameren Transmission Company of Illinois
Ameren Corp.
Ameren Illinois
Ameren Missouri
• Strong liquidity profile
─ $2.1 billion of combined credit under facilities maturing in Dec. 2021
• $1.1 billion Illinois credit facility ($800 million sublimit for Ameren Illinois;
$500 million for Ameren Corp.)
• $1.0 billion Missouri credit facility ($800 million sublimit for Ameren Missouri;
$700 million for Ameren Corp.)
• Credit agreements provide for two one-year extensions of the facilities upon
mutual consent of the borrowers and lenders
─ Three commercial paper programs supported by credit facilities -
$1.2 billion at Ameren Corp., $800 million at Ameren Missouri, and
$800 million at Ameren Illinois
─ Available liquidity as of Dec. 31, 2017, was approximately $1.6 billion
• Commitment to maintaining strong credit metrics and a
healthy capital structure while growing rate base
• Disciplined dividend policy
─ Target payout ratio range of 55% to 70%
─ Amount and timing of dividends are within the sole discretion of
Ameren’s board of directors
| Morgan Stanley, BAML and Barclays Utility Conferences | Feb. 27-28, 2018
• Return of capital through depreciation in rates
• Return on equity-financed portion of rate base
• ~$1 billion of income tax deferrals and tax asset utilization
─ Income tax deferrals driven primarily by capital expenditures
─ Includes ~$350 million of tax assets at year-end 2017
• Net operating losses and tax credit carryforwards
• ~$250 million of this at parent company
• Expected to be realized through 2020
• Debt financing
• Equity
─ Dividend reinvestment and employee benefit plans
(~$80M/year)
─ Remain committed to maintaining strong credit metrics
• Capitalization target: ~50% equity
Expected 2018-2022 Funding Plan1
15
1 Issued and effective as of Feb. 16, 2018 Earnings Conference Call.
| Morgan Stanley, BAML and Barclays Utility Conferences | Feb. 27-28, 2018
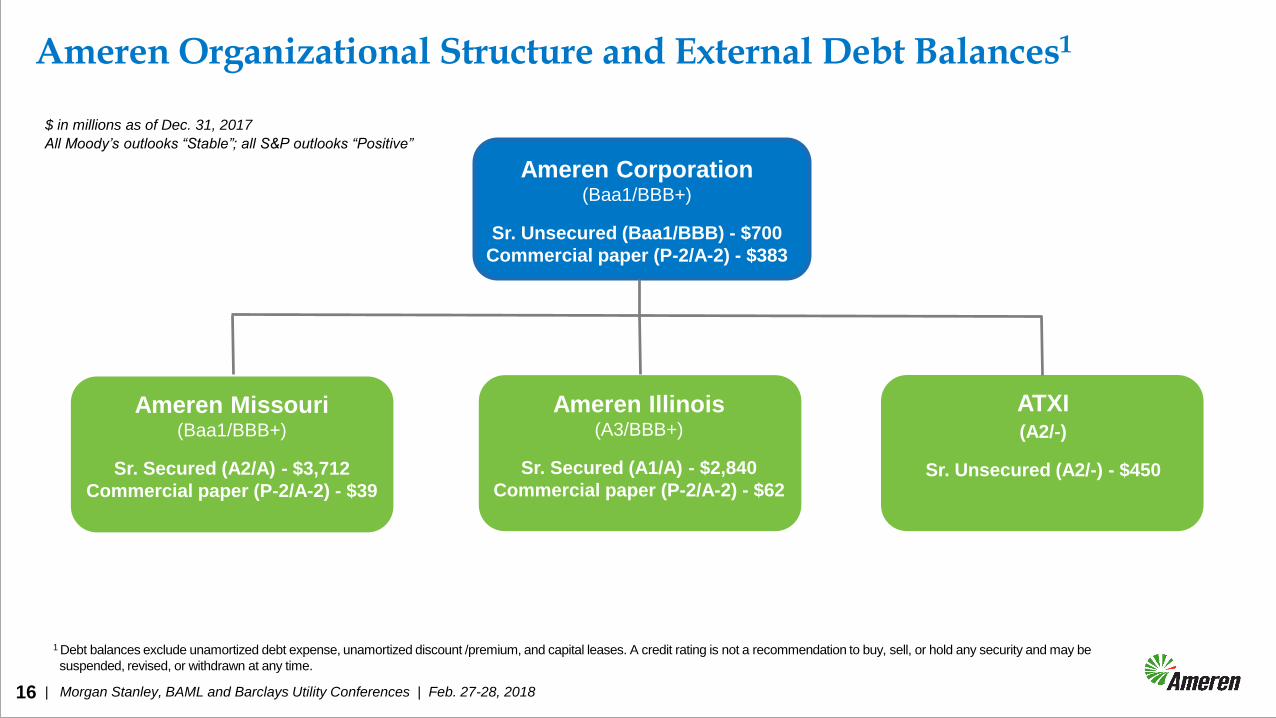
Ameren Organizational Structure and External Debt Balances1
$ in millions as of Dec. 31, 2017
Ameren Corporation(Baa1/BBB+)
Sr. Unsecured (Baa1/BBB) - $700
Commercial paper (P-2/A-2) - $383
Ameren Missouri(Baa1/BBB+)
Sr. Secured (A2/A) - $3,712
Commercial paper (P-2/A-2) - $39
Ameren Illinois(A3/BBB+)
Sr. Secured (A1/A) - $2,840
Commercial paper (P-2/A-2) - $62
ATXI(A2/-)
Sr. Unsecured (A2/-) - $450
16
1 Debt balances exclude unamortized debt expense, unamortized discount /premium, and capital leases. A credit rating is not a recommendation to buy, sell, or hold any security and may be
suspended, revised, or withdrawn at any time.
All Moody’s outlooks “Stable”; all S&P outlooks “Positive”

Appendix
| Morgan Stanley, BAML and Barclays Utility Conferences | Feb. 27-28, 2018
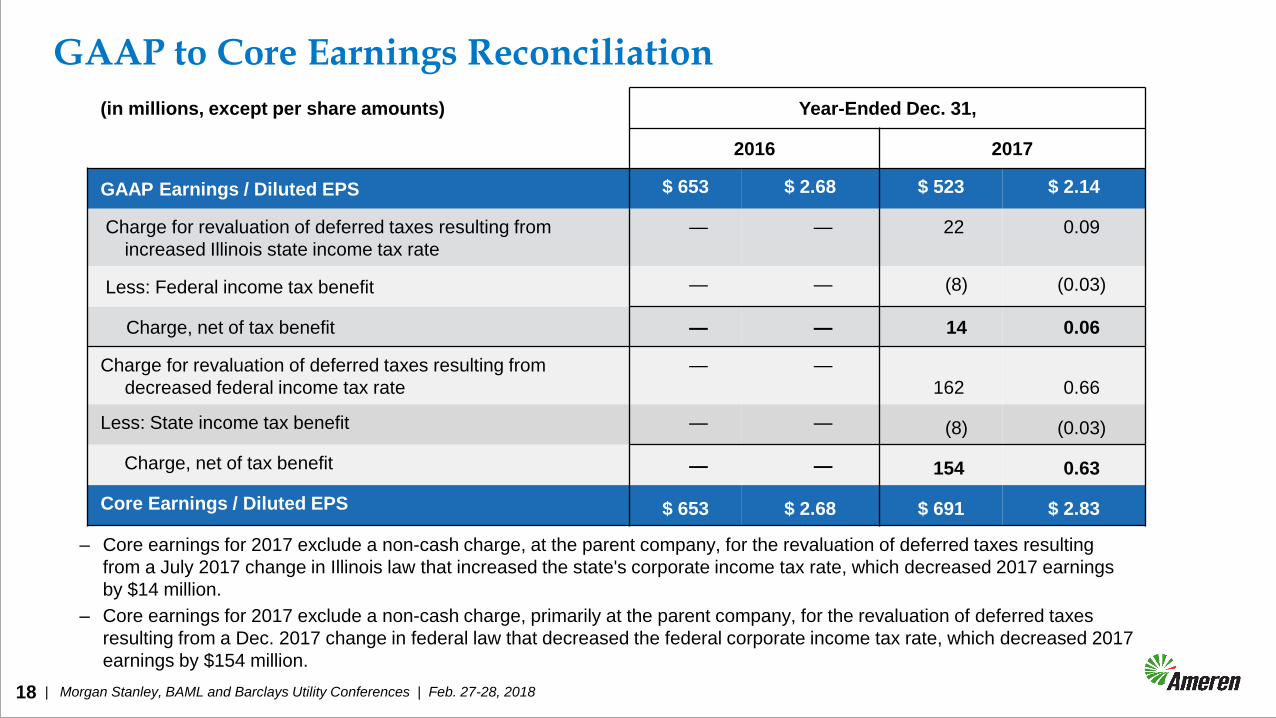
GAAP to Core Earnings Reconciliation
18
(in millions, except per share amounts) Year-Ended Dec. 31,
2016 2017
GAAP Earnings / Diluted EPS $ 653 $ 2.68 $ 523 $ 2.14
Charge for revaluation of deferred taxes resulting from
increased Illinois state income tax rate
— — 22 0.09
Less: Federal income tax benefit — — (8) (0.03)
Charge, net of tax benefit — — 14 0.06
Charge for revaluation of deferred taxes resulting from
decreased federal income tax rate
— —
162 0.66
Less: State income tax benefit — — (8) (0.03)
Charge, net of tax benefit — — 154 0.63
Core Earnings / Diluted EPS $ 653 $ 2.68 $ 691 $ 2.83
– Core earnings for 2017 exclude a non-cash charge, at the parent company, for the revaluation of deferred taxes resulting
from a July 2017 change in Illinois law that increased the state's corporate income tax rate, which decreased 2017 earnings
by $14 million.
– Core earnings for 2017 exclude a non-cash charge, primarily at the parent company, for the revaluation of deferred taxes
resulting from a Dec. 2017 change in federal law that decreased the federal corporate income tax rate, which decreased 2017
earnings by $154 million.
| Morgan Stanley, BAML and Barclays Utility Conferences | Feb. 27-28, 2018
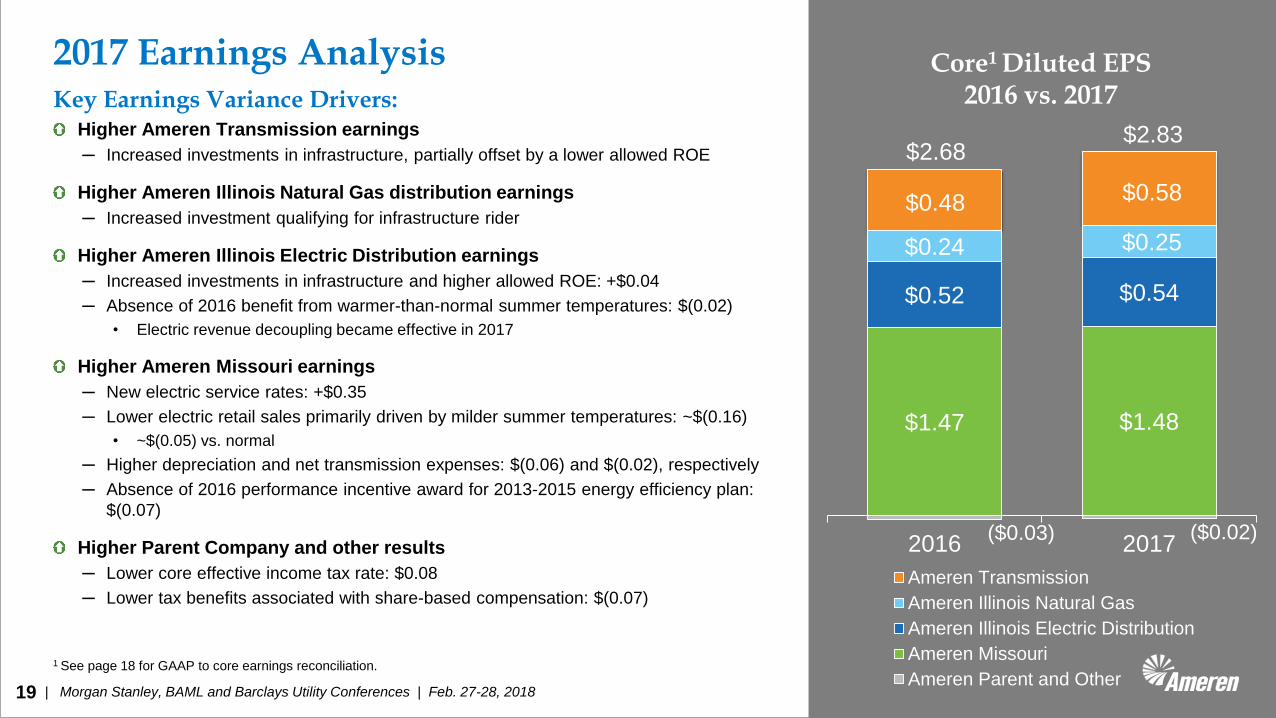
Core1 Diluted EPS2016 vs. 2017Key Earnings Variance Drivers:
Higher Ameren Transmission earnings
─ Increased investments in infrastructure, partially offset by a lower allowed ROE
Higher Ameren Illinois Natural Gas distribution earnings
─ Increased investment qualifying for infrastructure rider
Higher Ameren Illinois Electric Distribution earnings
─ Increased investments in infrastructure and higher allowed ROE: +$0.04
─ Absence of 2016 benefit from warmer-than-normal summer temperatures: $(0.02)
• Electric revenue decoupling became effective in 2017
Higher Ameren Missouri earnings
─ New electric service rates: +$0.35
─ Lower electric retail sales primarily driven by milder summer temperatures: ~$(0.16)
• ~$(0.05) vs. normal
─ Higher depreciation and net transmission expenses: $(0.06) and $(0.02), respectively
─ Absence of 2016 performance incentive award for 2013-2015 energy efficiency plan:
$(0.07)
Higher Parent Company and other results
─ Lower core effective income tax rate: $0.08
─ Lower tax benefits associated with share-based compensation: $(0.07)
2017 Earnings Analysis
19
($0.03) ($0.02)
$1.47 $1.48
$0.52 $0.54
$0.24 $0.25
$0.48 $0.58
2016 2017
Ameren Transmission
Ameren Illinois Natural Gas
Ameren Illinois Electric Distribution
Ameren Missouri
Ameren Parent and Other
$2.68$2.83
1 See page 18 for GAAP to core earnings reconciliation.
| Morgan Stanley, BAML and Barclays Utility Conferences | Feb. 27-28, 201820
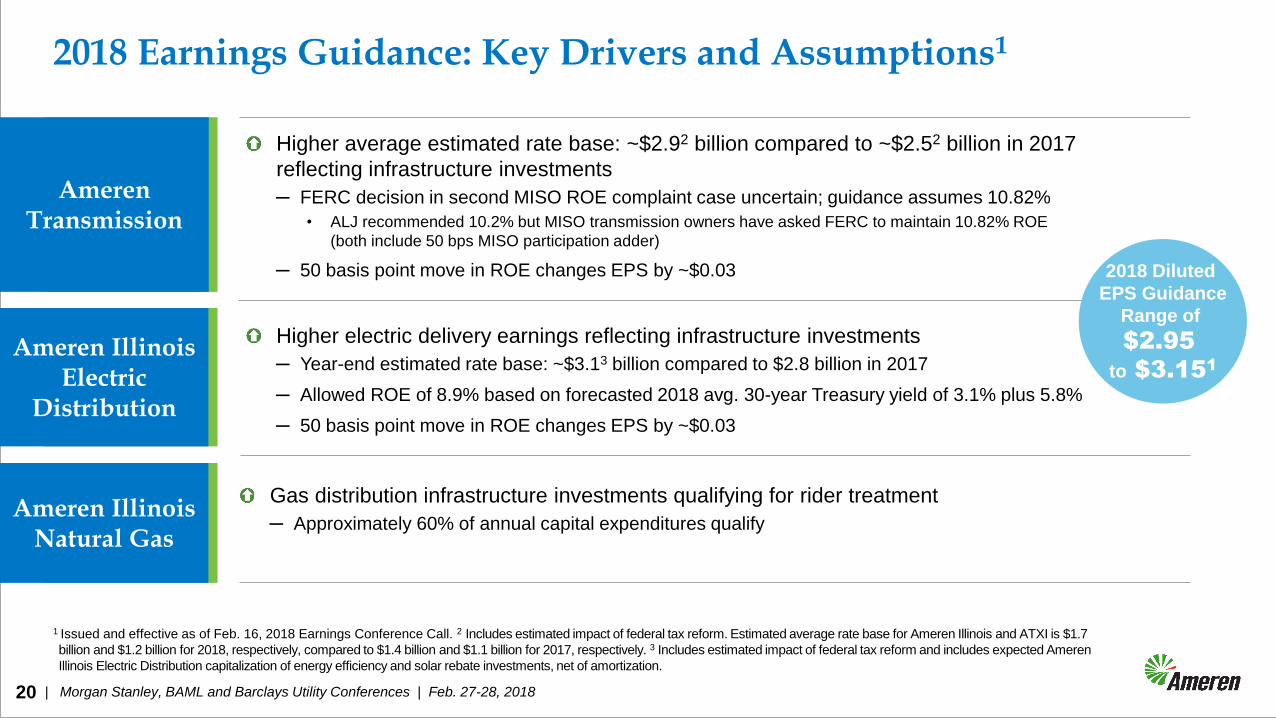
Ameren Transmission
1 Issued and effective as of Feb. 16, 2018 Earnings Conference Call. 2 Includes estimated impact of federal tax reform. Estimated average rate base for Ameren Illinois and ATXI is $1.7
billion and $1.2 billion for 2018, respectively, compared to $1.4 billion and $1.1 billion for 2017, respectively. 3 Includes estimated impact of federal tax reform and includes expected Ameren
Illinois Electric Distribution capitalization of energy efficiency and solar rebate investments, net of amortization.
2018 Earnings Guidance: Key Drivers and Assumptions1
Higher average estimated rate base: ~$2.92 billion compared to ~$2.52 billion in 2017
reflecting infrastructure investments
─ FERC decision in second MISO ROE complaint case uncertain; guidance assumes 10.82%
• ALJ recommended 10.2% but MISO transmission owners have asked FERC to maintain 10.82% ROE
(both include 50 bps MISO participation adder)
─ 50 basis point move in ROE changes EPS by ~$0.03
Higher electric delivery earnings reflecting infrastructure investments
─ Year-end estimated rate base: ~$3.13 billion compared to $2.8 billion in 2017
─ Allowed ROE of 8.9% based on forecasted 2018 avg. 30-year Treasury yield of 3.1% plus 5.8%
─ 50 basis point move in ROE changes EPS by ~$0.03
Ameren Illinois Electric
Distribution
Ameren Illinois Natural Gas
Gas distribution infrastructure investments qualifying for rider treatment
─ Approximately 60% of annual capital expenditures qualify
2018 Diluted
EPS Guidance
Range of
$2.95
to $3.151
| Morgan Stanley, BAML and Barclays Utility Conferences | Feb. 27-28, 201821
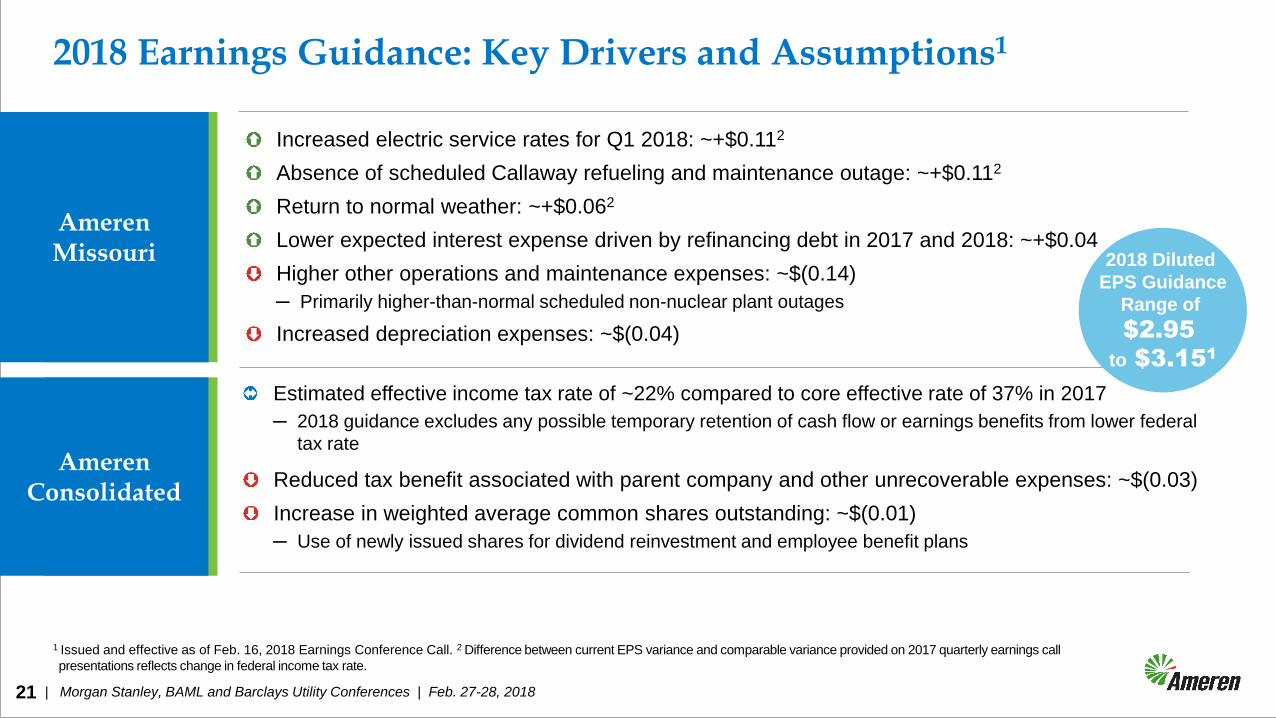
Increased electric service rates for Q1 2018: ~+$0.112
Absence of scheduled Callaway refueling and maintenance outage: ~+$0.112
Return to normal weather: ~+$0.062
Lower expected interest expense driven by refinancing debt in 2017 and 2018: ~+$0.04
Higher other operations and maintenance expenses: ~$(0.14)
─ Primarily higher-than-normal scheduled non-nuclear plant outages
Increased depreciation expenses: ~$(0.04)
2018 Earnings Guidance: Key Drivers and Assumptions1
Ameren Missouri
Estimated effective income tax rate of ~22% compared to core effective rate of 37% in 2017
─ 2018 guidance excludes any possible temporary retention of cash flow or earnings benefits from lower federal
tax rate
Reduced tax benefit associated with parent company and other unrecoverable expenses: ~$(0.03)
Increase in weighted average common shares outstanding: ~$(0.01)
─ Use of newly issued shares for dividend reinvestment and employee benefit plans
Ameren Consolidated
2018 Diluted
EPS Guidance
Range of
$2.95
to $3.151
1 Issued and effective as of Feb. 16, 2018 Earnings Conference Call. 2 Difference between current EPS variance and comparable variance provided on 2017 quarterly earnings call
presentations reflects change in federal income tax rate.
| Morgan Stanley, BAML and Barclays Utility Conferences | Feb. 27-28, 2018
2018 2019 2020 2021 2022 2023 2024 2025 2026 2027 2028 2029 2030 2031 2032 2033 2034 2035 2036 2037
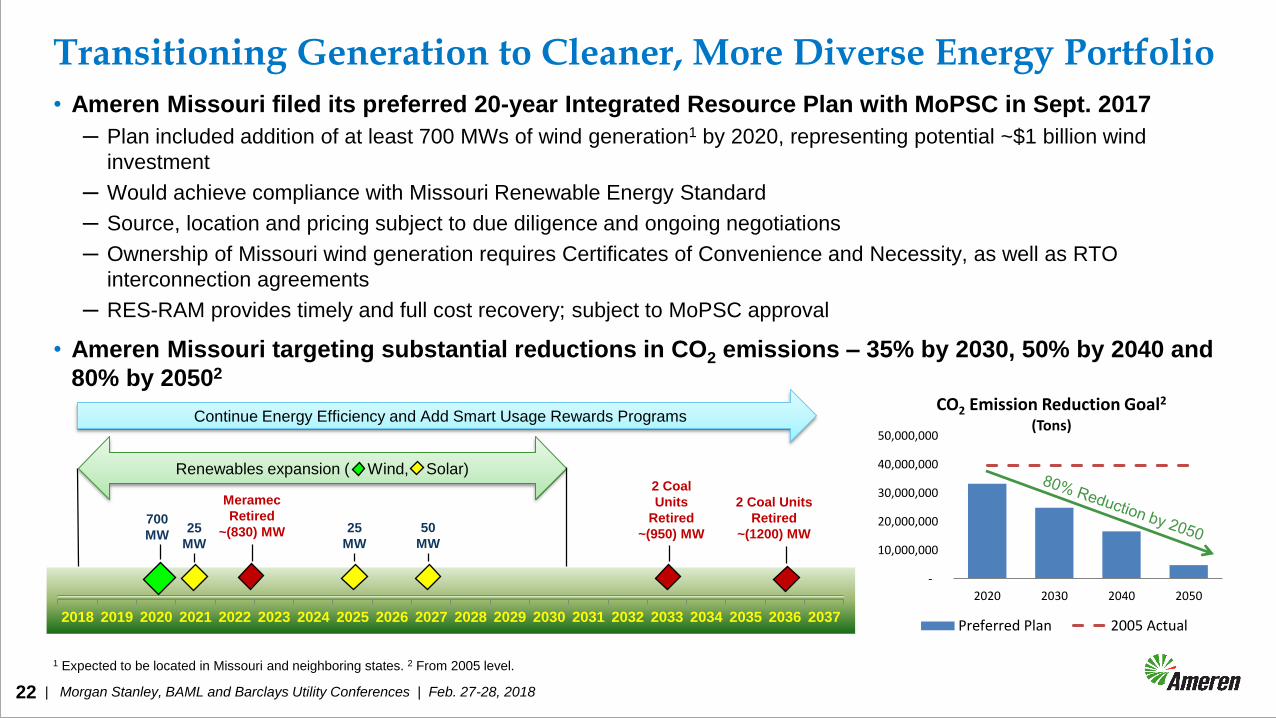
Transitioning Generation to Cleaner, More Diverse Energy Portfolio
• Ameren Missouri filed its preferred 20-year Integrated Resource Plan with MoPSC in Sept. 2017
─ Plan included addition of at least 700 MWs of wind generation1 by 2020, representing potential ~$1 billion wind
investment
─ Would achieve compliance with Missouri Renewable Energy Standard
─ Source, location and pricing subject to due diligence and ongoing negotiations
─ Ownership of Missouri wind generation requires Certificates of Convenience and Necessity, as well as RTO
interconnection agreements
─ RES-RAM provides timely and full cost recovery; subject to MoPSC approval
• Ameren Missouri targeting substantial reductions in CO2 emissions – 35% by 2030, 50% by 2040 and
80% by 20502
22
2 Coal
Units
Retired
~(950) MW
Meramec
Retired
~(830) MW
Renewables expansion ( Wind, Solar)
Continue Energy Efficiency and Add Smart Usage Rewards Programs
2 Coal Units
Retired
~(1200) MW700
MW25
MW
25
MW
50
MW
-
10,000,000
20,000,000
30,000,000
40,000,000
50,000,000
2020 2030 2040 2050
CO2 Emission Reduction Goal2
(Tons)
Preferred Plan 2005 Actual
1 Expected to be located in Missouri and neighboring states. 2 From 2005 level.
| Morgan Stanley, BAML and Barclays Utility Conferences | Feb. 27-28, 201823
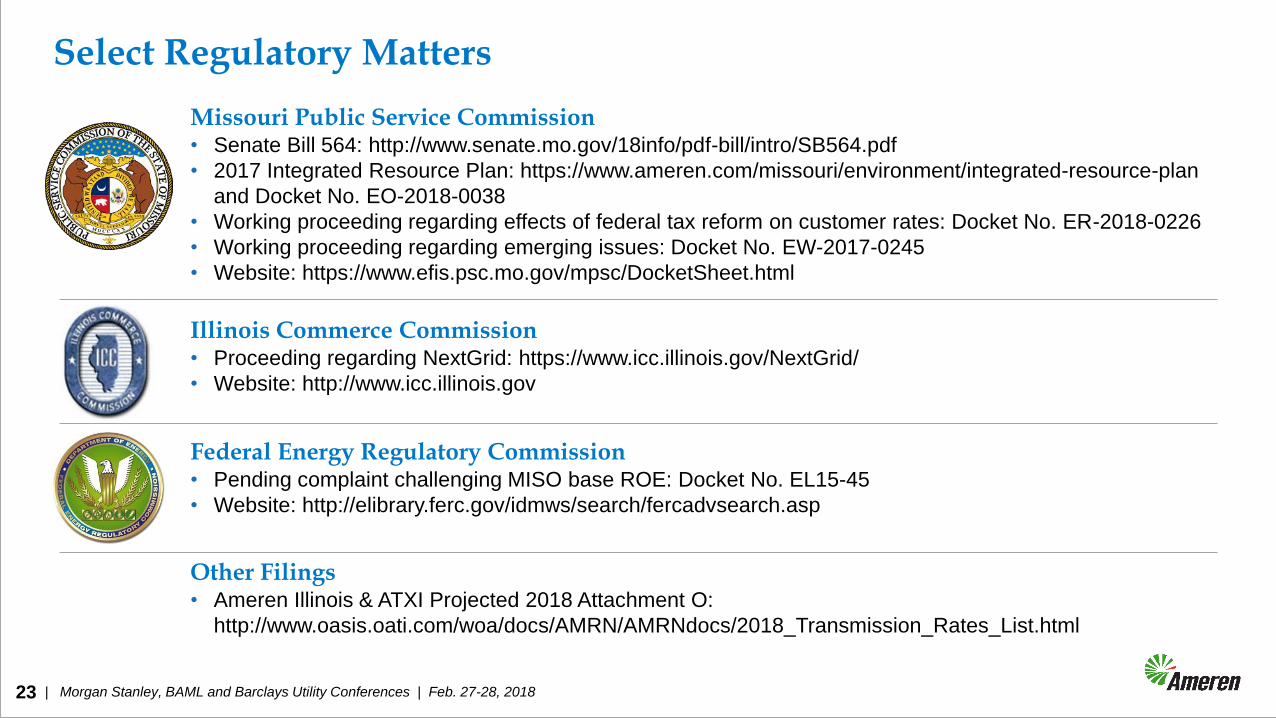
Illinois Commerce Commission• Proceeding regarding NextGrid: https://www.icc.illinois.gov/NextGrid/
• Website: http://www.icc.illinois.gov
Missouri Public Service Commission• Senate Bill 564: http://www.senate.mo.gov/18info/pdf-bill/intro/SB564.pdf
• 2017 Integrated Resource Plan: https://www.ameren.com/missouri/environment/integrated-resource-plan
and Docket No. EO-2018-0038
• Working proceeding regarding effects of federal tax reform on customer rates: Docket No. ER-2018-0226
• Working proceeding regarding emerging issues: Docket No. EW-2017-0245
• Website: https://www.efis.psc.mo.gov/mpsc/DocketSheet.html
Federal Energy Regulatory Commission• Pending complaint challenging MISO base ROE: Docket No. EL15-45
• Website: http://elibrary.ferc.gov/idmws/search/fercadvsearch.asp
Other Filings• Ameren Illinois & ATXI Projected 2018 Attachment O:
http://www.oasis.oati.com/woa/docs/AMRN/AMRNdocs/2018_Transmission_Rates_List.html
Select Regulatory Matters
| Morgan Stanley, BAML and Barclays Utility Conferences | Feb. 27-28, 201824
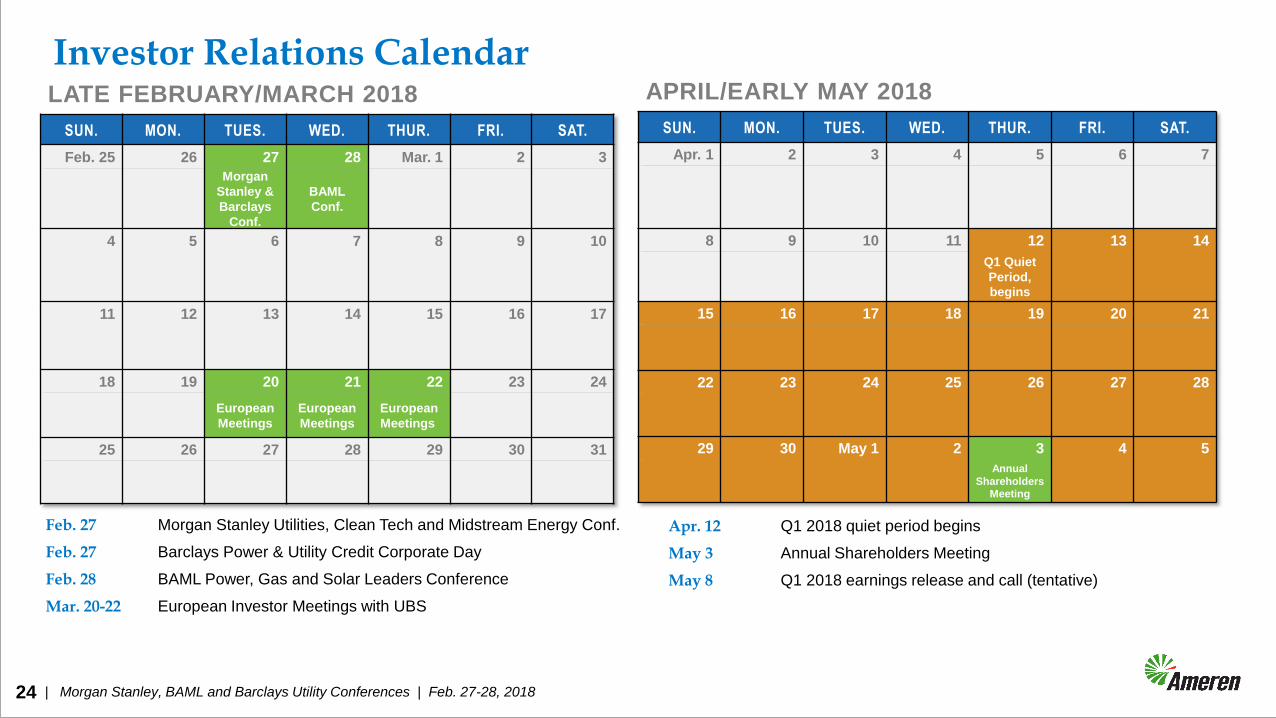
Investor Relations Calendar
Apr. 12 Q1 2018 quiet period begins
May 3 Annual Shareholders Meeting
May 8 Q1 2018 earnings release and call (tentative)
Feb. 27 Morgan Stanley Utilities, Clean Tech and Midstream Energy Conf.
Feb. 27 Barclays Power & Utility Credit Corporate Day
Feb. 28 BAML Power, Gas and Solar Leaders Conference
Mar. 20-22 European Investor Meetings with UBS
LATE FEBRUARY/MARCH 2018
SUN. MON. TUES. WED. THUR. FRI. SAT.
Feb. 25 26 27 28 Mar. 1 2 3
Morgan
Stanley &
Barclays
Conf.
BAML
Conf.
4 5 6 7 8 9 10
11 12 13 14 15 16 17
18 19 20 21 22 23 24
European
Meetings
European
Meetings
European
Meetings
25 26 27 28 29 30 31
APRIL/EARLY MAY 2018
SUN. MON. TUES. WED. THUR. FRI. SAT.
Apr. 1 2 3 4 5 6 7
8 9 10 11 12 13 14
Q1 Quiet
Period,
begins
15 16 17 18 19 20 21
22 23 24 25 26 27 28
29 30 May 1 2 3 4 5
Annual
Shareholders Meeting
| Morgan Stanley, BAML and Barclays Utility Conferences | Feb. 27-28, 201825
ALJ – Administrative Law Judge
ATXI – Ameren Transmission Company of Illinois
B – Billion
CAGR – Compound annual growth rate
CCN – Certificate of Convenience and Necessity
CO2 – Carbon Dioxide
E – Estimated
EPS – Earnings per share
FAC – Fuel Adjustment Clause
FERC – Federal Energy Regulatory Commission
GAAP – General Accepted Accounting Principles
ICC – Illinois Commerce Commission
kW - Kilowatt
M – Million
MEEIA – Missouri Energy Efficiency Investment Act
MISO – Midcontinent Independent System Operator, Inc.
MoPSC – Missouri Public Service Commission
MW – Megawatt
RES-RAM – Renewable Energy Standard-Rate Adjustment
Mechanism
ROE – Return on Equity
RTO – Regional Transmission Organization
Glossary of Terms and Abbreviations


![[Merrill Lynch] Credit Derivatives Handbook](https://img.pdfslide.us/doc/110x75/55cf97e9550346d03394646c/merrill-lynch-credit-derivatives-handbook.jpg)