Embed Size (px)
Citation preview

Morehead State University Campus Diversity Plan
2017 - 2021
Morehead State University
June 21, 2017

1
Introduction MoreheadStateUniversity(MSU)isacomprehensivepublicuniversitywithrobustundergraduateandgraduateprograms,emergingdoctoralprogramsandanemphasisonregionalengagement.MSUaspirestobethebestpublicregionaluniversityintheSouththroughacommitmenttoacademicexcellence,studentsuccess,buildingproductivepartnerships,improvinginfrastructure,enhancingresourcesandimprovingenrollmentandretention.
MSUislocatedinthefoothillsoftheDanielBooneNationalForestinRowanCounty,Kentucky.Foundedin1887asMoreheadNormalSchool,itwasaprivate,church-supportedinstitutionknownas“alighttothemountains.”In1926,itbecamepartofthestate-supportedsystemandwasrenamedMoreheadStateNormalSchoolandTeacher’sCollege.AnincreaseinenrollmentanddegreeprogramsresultedinsuccessiverenamingasMoreheadStateCollege(1948)anditscurrentdesignationasMoreheadStateUniversity(1966).Themissionstatement/purposeofMSUisasfollows:
Asacommunityoflifelonglearners,wewill
• Educatestudentsforsuccessinaglobalenvironment;• Engageinscholarship;• Promotediversityofpeopleandideas;• Fosterinnovation,collaboration,andcreativethinking;and• Serveourcommunitiestoimprovethequalityoflife.
MSUhasaneleven-memberBoardofRegentsthatservesbystatuteasthegoverningbodyoftheUniversity.TheboardisdedicatedtothepromotionofthemissionandgoalsoftheUniversity.TheboardisalsoresponsibleforthecreationordissolutionofdegreesuponapprovaloftheCouncilonPostsecondaryEducation.
MSUhas135undergraduateand70graduatedegreeprogramsinfourcolleges:CaudillCollegeofArts,HumanitiesandSocialSciences;CollegeofBusinessandTechnology;CollegeofEducation;andCollegeofScience.MSUoffersassociate,baccalaureate,masters,specialist,anddoctoraldegreesaswellasundergraduateandgraduatecertificates.

2
Inthefallof2016,MSUemployed408totalfacultymembers:333full-time(76.3%tenuredortenuretrack)and75part-timefacultymembersinadditionto730full-timestaffand127part-timestaff.
MSU’sannualoperatingbudget,approvedbytheBoardofRegentseachJune,isbasedonprojectedfundsfromtuitionandfees,stateappropriation,salesandservicesofeducationalactivities,andauxiliaryenterpriserevenue.TheUniversity’sindependentexternalauditorsconductanannualauditanddiscloseconcernsandrecommendationstotheBoardifneeded.MSUhasreceivednoauditconcernsorrecommendationsinrecenthistory.
MSUispartoftheKentuckypublicpostsecondaryeducationsystem.Ourserviceregionconsistsof22countiesineasternKentucky;however,ouroutreachextendsfarbeyondtheserviceregion.TheUniversity’smaincampusislocatedinMorehead,KentuckywithregionalcampusesinAshland,Mt.Sterling,PrestonsburgandWestLiberty.
DiversityPlanningProcess Inthefallof2016,MSUdevelopedaDiversity,EquityandInclusionTaskForcetodevelopthecampusdiversityplanunderthedirectionoftheChiefDiversityOfficeandtheProvost.Thetaskforcewaschargedwiththefollowing:
• ProposethenewMoreheadStateUniversitydiversity,equityandinclusionplan.
• Developaprocessthatconsidersinputfromcampusandcommunitystakeholdersindevelopingtheplan.
• FollowCPErequirementsassociatedwiththenewplan.• Considerotherelements/metricsforthenewplanuniquetoMoreheadState
thatarenotnecessarilyincludedinCPErequirements.• Proposehowtheplanmightbeimplementedandmaintained(see
Diversity• FollowtheestablishedtimelineprovidedbyCPE.

3
Thefollowingworkingcommitteeswerecreatedandtheirmembershipwaspurposefullydesignedtorepresentacross-sectionofcampusstakeholdersincludingfaculty,staff,andstudents:MSUAdhocCommittee:
StevenRalston,Provost
CharlesHolloway,ChiefDiversityOfficer
Laurie Couch, Interim Associate VP of Academic Affairs/Academic ProgramsChrisMiller,InterimDean,CollegeofEducation
SandraRiegle,AssociateProfessorofEducation
JamieThomas,AssistantDirectorofAthletics,
ShannonColvin,CoordinatorofStudentLeadershipandAdvocacy
JessicaThompson,TechnologyBusinessAnalystII
MSUWorkgroupCommittee:
MSUAdhocCommittee
DoraAdmadi,AssociateProfessorMathematics
BillRedwine,AuxiliaryServices
BernadetteBarton,ProfessorSociology
J.T.Blackledge,AssociateProfessorPsychology
ChristopherBlakely,MinorityRetentionCoordinator
OpheliaChapman,SystemsLibrarian
CoryClark,MinorityAcademicCoordinator
KristinaDurocher,AssociateProfessorHistory
ToriHenderson,Student–SGA
JamiHornbuckle,AssistanttothePresident/ChiefMarketandPublicRelationsOffice

4
MichelleHutchinson,Employment&TrainingManger
RobertSparks,AreaCoordinatorHousing
J.Marshall,ExecutiveDirectorRegionalEngagement
HopeMills,Student–StudentActivities
FatmaMohamed,AssociateProfessorManagement
DonnaMurphy,CommunityandAlumni
ShondrahNash,ProfessorSociology
DavidPeyton,ProfessorBiology
JillRatliff,AssistantVicePresidentforAcademicAffairsandInstitutionalEffect
TimRhodes,AssistantVicePresidentEnrollmentServices
LexiusYarbrough,Student–NPHC
CappYess,AssociateProfessorPhysics
OpportunityMembers:
DoraAdmadi,AssociateProfessorMathematics
OpheliaChapman,SystemsLibrarian
ToriHenderson,Student–SGA
MichelleHutchinson,Employment&TrainingManger
FatmaMohamed,AssociateProfessorManagement
TimRhodes,AssistantVicePresidentEnrollmentServices
ShondrahNash,ProfessorSociology
StudentSuccessMembers:
ChristopherBlakely,MinorityRetentionCoordinator
CoryClark,MinorityAcademicCoordinator
KristinaDurocher,AssociateProfessorHistory
5
HopeMills,Student–StudentActivities
RobertSparks,AreaCoordinatorHousing
CappYess,AssociateProfessorPhysics
ImpactMembers:
J.T.Blackledge,AssociateProfessorPsychology
BernadetteBarton,ProfessorSociology
JamiHornbuckle,AssistanttothePresident/ChiefMarketandPublicRelationsOffice
JillRatliff,AssistantVicePresidentforAcademicAffairsandInstitutionalEffect
J.Marshall,ExecutiveDirectorRegionalEngagement
DonnaMurphy,CommunityandAlumni
DavidPeyton,ProfessorBiology
SandraRiegle,AssociateProfessorofEducation
LexiusYarbrough,Student–NPHC
AfterteamsweredevelopedbytheAdhocCommittee,theVicePresidentofAcademicAffairsandtheChiefDiversityOfficermetwiththecommitteestoinformthemofthenecessarytaskstoassistwithdevelopingthecampusdiversityplan.
Eachsub-committeeheldtheirownindividualmeetingstodiscussanddevelopstrategiesrelatedtodiversity.Eachsub-committeealsohadauthorizationtoengageothercampusconstituentsifneeded.
Afterthesubcommitteeshaddevelopedstrategies,theyreportedtotheentiregroupwiththeirrecommendationsfordevelopingthediversityplan.Thestrategiesforthisplanwasdevelopedbythetaskforce,andtheotherinformationhasbeenprovidedasapartofthecampusstrategicplan.
KeyTermsAsapartofourplandevelopment,MSUbelievesthereisacampuscommunityneedtohaveagreementondefinitionsthatwillbeapartofourdiversityplan.

6
CulturalCompetence-Culturalcompetencerequiresthatorganizations:
• Haveadefinedsetofvaluesandprinciples,anddemonstratebehaviors,attitudes,policiesandstructuresthatenablethemtoworkeffectivelycross-culturally.
• Havethecapacityto(1)valuediversity,(2)conductself-assessment,(3)managethedynamicsofdifference,(4)acquireandinstitutionalizeculturalknowledgeand(5)adapttodiversityandtheculturalcontextsofthecommunitiestheyserve.
• Incorporatetheaboveinallaspectsofpolicymaking,administration,practice,servicedeliveryandinvolvesystematicallyconsumers,keystakeholdersandcommunities.
Culturalcompetenceisadevelopmentalprocessthatevolvesoveranextendedperiod.Bothindividualsandorganizationsareatvariouslevelsofawareness,knowledgeandskillsalongtheculturalcompetencecontinuum.(NationalCenterforCulturalCompetence)Diversity–Individualdifferences(e.g.,personality,learningstyles,andlifeexperiences)andgroup/socialdifferences(e.g.,race/ethnicity,class,gender,sexualorientation,countryoforigin,andabilityaswellascultural,political,religious,orotheraffiliations).(AmericanAssociationofColleges&Universities)
Equity–Appropriateaccessandrighttoneededresources,processes,opportunities,and participation to provide for equal, successful outcomes. The term is oftenconfusedwithequality.Equityaimstoleveltheplayingfield.(Gorski,2013;Gorski&Pothini,2013;Gorski&Swalwell,2015)Equity-Mindedness – A demonstrated awareness of and willingness to addressequity issues among institutional leaders and staff. (Center for Urban Education,UniversityofSouthernCalifornia).Fidelity: Faithfulness in implementing programs or strategies as they weredesigned.Evidenceoffidelitymayinclude,butisnotbelimitedtothefollowing:
• Dedicatedstaff(i.e.,thenumberofstaff,theirlevelofexpertise,andtheamountofprofessionaldevelopment,mentoring,andcoachingprovidedtostaffresponsibleforimplementation).
• Specificexamplesofstudentorstaffparticipation.

7
• Datacollectedonstrategyinputsandoutputs.• Participationrateofstudents.• Dedicatedfunding.• Developmentofimplementationtimetablesandmilestonesachieved.• Narrativedescriptionsoftheimplementationprocess.
Identity - The social and historical construction of the self/individual/person thatcreates a sense of community, belonging, and uniqueness. Identity (-ies) mayintersectoroverlapandmostoftendo.Key facetsof identity include sex,gender,sexualorientation, race,ethnicity,socialclass,age,ability,andreligion/spirituality.(Capper&Young,2014;Gorski,2013;Griffiths,2003;Page,2007;Samuels,2014)
Inclusion – The active, intentional, and ongoing engagementwith diversity in thecurriculum, in the co-curriculum, and in the communities (intellectual, social,cultural,geographical)withwhichindividualsmightconnect–inwaysthatincreaseawareness, content knowledge, cognitive sophistication, and empathicunderstanding of the complex ways individuals interact within systems andinstitutions.(AmericanAssociationofColleges&Universities)InclusiveExcellence–The recognition thata communityor institution’ssuccess isdependentonhowwell it valuesdiversity andengagesdiversity, and includes therich diversity of students, faculty, administrators, and alumni constituents.(UniversityofDenver)Low-Income:Pellrecipientsatentryorduringspecificsemesters(variesdependingonthespecificmetric)Power and privilege –The institutional, systemic, systematic, and cyclical processthat bestow unearned rights, benefits, or privileges on some chosen groups orpopulations while exerting control over and manipulation of marginalized andoppressed groups. (Davis & Harrison, 2013; Irving, 2014; Loewen, 1995; Tochluk,2010)Social justice –The goal of social justice is both full and equal participationof allgroupsinsocietywhereinthatsocietybemutuallyshapedtomeettheneedsofallgroups. Social justice isbothindividualandcollective. Advocatesforsocial justiceworktoprovideaccessandopportunityforeveryone,particularlythoseingreatestneed. (Dantley, Beachum, & McCray, 2008; Davis & Harrison, 2013; Normore &Brooks,2014)

8
UnderrepresentedMinority (URM): – Studentswho categorized themselves asa)HispanicorLatino,b)AmericanIndianorAlaskaNative,c)BlackorAfricanAmerican,d) Native Hawaiian or Other Pacific Islander, or e) Two or more Races ormarginalized.Opportunity
• Inthefallof2015,MSUenrolled10,875students
• MSUretained65%offirst-timefreshmenfromfallof2014tofall2015(58%oftheunderrepresentedminorities).
• First-timefreshmenheadcountdecreasedby3.4%fromthefallof2014to1,461but99.4%ofthesestudentswerefull-time.
• TheaverageACTcompositescoreforfirst-timestudentswas22.4,1.4pointshigherthanthenationalaveragecompositescoreof21.
• Atotalof6,209(63.4%)undergraduatestudentsattendedMSUonafull-timebasiswhile3,574(36.5%)undergraduatestudentsattendedMSUpart-time.
• Themajorityofgraduatestudents,875(80.1%),attendedMSUaspart-timestudentswhile217(19.9%)attendedasfull-timestudents.
• The2015-16undergraduatestudentpopulationwas59.5%female,40.5%male.
• The2015-16graduatestudentpopulationwas64%female,35.7%male.
• Sixty-twopercentofMSU'sundergraduateswerebetweentheagesof18-24while15%ofMSUundergraduateswereolderthan24.
• MSU's22countyserviceregionattracted6,135(56.4%)studentstotheuniversityinthefallof2015,and3,504(32.2%)ofthosestudentscamefromcountiesnotincludedinMSU'sserviceregion.Accordingly,88.6%ofMSUstudentsoriginatedfromthestateofKentucky.
• Under-representedminorities(AmericanIndian,Black,Hispanic,NativeHawaiian/PacificIslander,andtwoormoreraces)represented7%oftheinstitutionalenrollment.

9
• MSUprovidedcommunityoutreachbyofferingasubstantialnumberofdual-creditcoursestohighschoolstudents.Therewere177dual-creditcoursesofferedat48differenthighschoolsacrossthestateofKentucky.
• Duringthe2015-16academicyear,MSUawarded20Doctoraldegrees,291Master'sdegrees,1,331Bachelor'sdegrees,28Specialistdegreesand168Associate'sdegrees.
SupportingDocumentationforMoreheadStateUniversityTargetSettingThetargetsselectedforeachofthemetricsthatfollowwerechosenbasedonextensiveanalysisofMoSUtrenddata,thepipelineforeachmetric,censusdatafortheserviceregionandbenchmarkdatawhenavailable.Tablesofdataalongwithabriefsummarydescribingtheirimpactarefollowedbythefinalselectionofatargetforeachmetric.
1A:FallUndergraduateEnrollmentofAfricanAmericanStudentsasaPercentofTotalFallUndergraduateEnrollment(DiversityPlan)
Recommended target: 2% annual growth
Thefollowingelementsinformedthistarget:
Table1:AfricanAmericanUndergraduateStudentsasPercentofUndergraduatePopulation
Institution 2010 2011 2012 2013 2014 2015 2016 ChangeAfricanAmericanStudents
(UG)3.4% 3.2% 3.3% 3.3% 3.6% 3.4% 3.4% 0.0
• Table1showsthattheproportionofundergraduateAfricanAmericanstudentshasbeenstableovertime.Thisstabilityisdeceptivebecausethedataanalyzedinsuccessivetablesrevealsapictureofgrowthandperformance,despitethedemographicconstraintsofMoSU’sserviceregion.

10
Table2:AfricanAmericanUndergraduateStudentsatMoSUInstitution AfricanAmerican
StudentsTotalUGEnrollment
AfricanAmericanEnrollmentasPercentUG
CensusData
MoSU 330 9,873 3.4% 1.5%
• Table2showsthatMoSUisalreadyout-performing2outof3non-urbanpeerinstitutionsgiventhedemographicsoftherespectiveserviceregions.Inthebaselineyear,CensusdatashowedthatAfricanAmericansare1.5%ofMoSU’sserviceregion.Thebaselinenumberof3.4%revealsthatthecompositionofAfricanAmericanundergraduatestudentsismorethan2timeshigherthanthedemographiccompositionofMoSU’sserviceregion.
Table3:AfricanAmericanUndergraduateStudentsbyClassificationClassification 2010 2011 2012 2013 2014 2015 2016 ChangeSince
2012Freshman 83 94 125 126 114 80 82 -34.4%Sophomore 34 47 51 55 74 61 41 -19.6%Junior 46 42 39 50 43 64 64 64.1%Senior 64 69 62 56 60 59 71 14.5%UGNon-Degree 12 9 12 8 16 24 33 175.0%EarlyCollege 10 34 29 33 45 40 43 48.3%Post-Bac,Degree-Seeking
3 6 7 5 4 1 1 -85.7%
CraftAcademy 0 0 0 0 0 1 1 100%Total 252 301 325 333 356 330 336 3.4%
• AsshowninTable3,theenrollmentoffreshmenAfricanAmericanstudentsdeclinedsubstantiallyinthefallof2015and2016.TheserecruitingshortfallswillweakenenrollmentinthecomingyearsasthelargergroupsofAfricanAmericanstudentsgraduateandleaveMoSU.Thecurrentnumbersofincomingfreshmenarebelowreplacementlevels.Asshownearlier,thedemographicsoftheserviceregionmakeitdifficulttoachieveacriticalmassofAfricanAmericanstudents,whichisachallengeforrecruitmentandretention.Despitethesebarriers,thedatainTable3showthatthenumberofAfricanAmericanstudentsincreasedremarkablysince2010;however,asdisplayedinTable1,thesebignumericalincreasesdidnotproduceasubstantialchangeintheproportionofAfricanAmericanstudents,duetothesmallsizeofthisgrouprelativetotheoverallundergraduatepopulation.

11
• MoSUhasbeencastingawidenettogenerateadditionalenrollment.Thismeansthatevenifthenumeratorincreases,(i.e.thenumberofAfricanAmericanstudents)thedenominatorisalsolikelytoincrease(numberofnon-AfricanAmericanstudents).Ifthedenominatorincreasesfasterthanthenumerator,therewillbelittlechangeintheproportionorevenadecrease.Thus,becausethenumeratorissuchasmallnumber,itwillbeextremelyhardtomove,especiallyifoverallenrollmentincreases.
Table4:FallAfricanAmericanEnrollmentTargetTarget Baseline 2016 2017 2018 2019 2020 %UGEnrollment2%annualincrease 330 336 343 350 357 364 3.8%
AsshowninthetargetcalculationTable4,a2%annualincreasegeneratesanumericaldifferenceeventhoughthepercentagedoesnotincreaseasignificantly.A2%annualincreasewouldproducesubstantialnumericalimprovementandmoderateimprovementintheproportionoftheundergraduatepopulationthatisAfricanAmerican.
1B:FallUndergraduateEnrollmentofHispanicStudentsasaPercentofTotalFallUndergraduateEnrollment(DiversityPlan)
Recommended target: 2% annual growth
Thefollowingelementsinformedthistarget:
Table5:HispanicUndergraduateStudentsasPercentofUndergraduatePopulationInstitution 2010 2011 2012 2013 2014 2015 2016 ChangeHispanic(UG) 0.9% 0.9% 1.2% 1.1% 1.5% 1.4% 1.9% 1.0
Table5demonstratesthatprogresshasbeenslowandsteadywithregardtotheproportionofHispanicstudentsinMoSU’sundergraduatepopulation.Bytheendoftheperiod,itisclearthattwoyears,2014and2016,accountformostofthechangethatoccurredonthismetric.

12
Table6:HispanicUndergraduateStudentsbyClassificationClassification 2010 2011 2012 2013 2014 2015 2016 ChangeSince
2012Freshman 21 25 31 33 38 32 35 12.9%Sophomore 8 10 12 16 18 26 19 58.3%Junior 13 12 12 11 22 15 25 108.3%Senior 14 14 25 18 17 29 32 28.0%UGNon-Degree 0 3 5 2 5 6 5 0.0%EarlyCollege 6 18 31 30 46 31 66 112.9%Post-Bac,Degree-Seeking
2 2 1 3 2 2 2 100.0%
TotalHispanic 64 84 117 113 148 141 184 57.3%TotalNon-URM 7,046 8,960 9,162 9,481 9,282 9,111 9,005 -1.7%
• AsshowninTable6,theenrollmentoffreshmanHispanicstudentsincreased12.9%;however,thislargepercentageincreaseonlyrepresentsfourstudents.Since2012,thenumberofHispanicstudentsincreased57.3%,whichisanexceptionallystronggrowth.Thelargestnumericalincreasehasbeenearlycollegestudents,buttherehasalsobeenrobustgrowthacrossallstudentclassifications.
• Table6providesgreaterinsightintothechangesin2014and2016.In2014,thenumberofnon-URMstudentsdecreasedby2.1%andin2016thenumberofnon-URMstudentsdecreasedfromthe2015numberby1.2%.Concurrentlybetweenfallof2013andfallof2014,undergraduateHispanicstudentsincreasedby30.9%,andasimilarincreaseoccurredbetweenfallof2015andfallof2016.Thispatterndemonstrateshowdifficultitistomoveaproportionalmetricthathasasmallnumeratorandalargedenominator.Thus,thenumerator(undergraduateHispanicstudents)hadtoincreasebyalmost31%ANDthenasignificantportionofthedenominator(Non-URMstudents)hadtodecreasetoproducechangeof0.4%and0.5%for2014and2016.
Table7:HispanicUndergraduateStudentsatMoSUInstitution Hispanic
StudentsTotalUGEnrollment
HispanicEnrollmentasPercentUG
CensusData
MoSU 141 9,783 1.4% 1.0%
• Table7demonstratesthatMoSUiscurrentlyover-performingbasedonthedemographicsoftheserviceregion.Inthebaselineyear,Censusdatashowedthat

13
Hispanicsare1.0%oftheMoSUserviceregion.Thebaselinenumberof1.4%revealsthatthecompositionofHispanicundergraduatestudentsisslightlyhigherthanthedemographiccompositionoftheserviceregion.
• MoSUhasbeencastingawidenettogenerateadditionalenrollment.Thismeansthatevenifthenumeratorincreases(i.e.thenumberofHispanicstudents)thedenominatorisalsolikelytoincrease(numberofnon-Hispanicstudents).Ifthedenominatorincreasesfasterthanthenumerator,therewillbelittlechangeintheproportionorevenadecrease.Thus,becausethenumeratorissuchasmallnumber,itwillbeextremelyhardtomove,especiallyifoverallenrollmentincreases.Thisdynamicmustbetakenintoconsiderationwhensettingtargets.
Table8:FallHispanicEnrollmentTarget,MoreheadStateUniversity
Target 3YearMean
Baseline 2016 2017 2018 2019 2020 %UGEnrollment
2%annualincrease
134 141 184 147 150 153 156 1.6%
*Threeyearaverageincludes2013,2014,and2015.
• AsshowninthetargetcalculationinTable8,a2%annualincreasecreatesquiteanumericaldifferenceeventhoughthepercentagedoesnotincreaseagreatdeal.Thus,inthiscase,a2%annualincreasewouldproducenumericalimprovementandmoderateimprovementintheproportionoftheundergraduatepopulationthatisHispanic.
• Themodeltrendwilllookabitoddbecausethetargetsettingbuildsofftheestablishedbaselineof141ratherthanthecurrentyearnumberof184.Thus,thecalculationofannualincreasesdiscountedthecurrent2016numberbecauseabigpartoftheenrollmentincreaseisduetoearlycollege.Thesestudentsarenotastablesourceofenrollment,soitisunwisetoassumethat2017willmaintainandcontinuethegrowththatwasmodeledin2016.
1C:FallUndergraduateEnrollmentofUnderrepresentedMinorityStudentsasaPercentofTotalFallUndergraduateEnrollment(DiversityPlan)

14
Recommended target: 2% annual growth
Thefollowingelementsinformedthetarget:
Table9:URMUndergraduateStudentsasPercentofUndergraduatePopulationInstitution 2010 2011 2012 2013 2014 2015 2016 ChangeURM(UG) 4.8% 4.9% 5.8% 5.9% 6.7% 6.9% 7.7% 2.9
• Table9revealsthatthepercentageofURMstudentschangedbyalmostthreepercentagepointssince2010,when4.8%oftheundergraduatepopulationwasclassifiedasURM.In2016,7.7%,whichisgrowthof2.9%andrepresentsapercentchangeof60%.
Table10:FallUGEnrollmentTrendData
2010 2011 2012 2013 2014 2015 2016 ChangeSince2012
ChangeSince2010
Black,Non-Hispanic
252 301 325 333 356 330 336 3.4% 33.3%
AmericanIndian
19 23 22 26 18 12 16 -27.3% -15.8%
NativeHawaiian
2 2 5 7 12 11 12 140.0% 500.0%
Hispanic/Latino
64 84 117 113 148 141 184 57.3% 187%
TwoorMoreRaces
16 50 94 116 136 178 201 113.8% 1,156%
URM 353 460 563 595 670 672 749 33.0% 112%
Non-URM 7,046 8,960 9,162 9,481 9,282 9,111 9,005 -1.7% 27.8%
TotalEnrollment
7,399 9,420 9,725 10,076 9,952 9,783 9,754 0.2% 31.8%

15
• Table10showsthatHispanic/LatinostudentswereonedriverofURMgrowth,butthebiggestdriverofURMgrowthistwoormoreraces.2010wasthefirstyearthatthiswasanethnicitycategoryinCPEreporting,soobviouslythegrowthhasbeentremendousduringthisperiod.Evensince2012,thiscategorygrewconsistentlyeveryyearincreasingby114%inthisperiod.
• 2014wastheyearinwhichtheproportionofURMstudentsstartedtoincrease,butthiswasonlypossiblebecausethenumberofnon-URMstudentsdeclinedwhileURMstudentswereincreasingandorstable.Thus,thefallof2014showedadecreaseof2.1%innon-URMstudents,andthedeclinecontinuedinto2015(1.8%)and2016(-1.2%).
Table11:UndergraduateFallURMEnrollmentbyClassificationClassification 2010 2011 2012 2013 2014 2015 2016 ChangeSince
2012Freshman 119 140 194 219 198 177 168 -13.4%Sophomore 44 71 83 91 121 110 96 15.6%Junior 61 60 65 73 88 108 113 73.8%Senior 87 92 101 93 97 116 146 44.6%UGNon-Degree 10 15 20 14 23 31 41 105%EarlyCollege 22 70 87 93 136 122 175 101%Post-BacDegree 10 12 13 12 7 4 5 -61.5%CraftAcademy 0 0 0 0 0 4 5 NATotal 353 460 563 595 670 672 749 33.0%
• Table11showstotalURMenrollmentpeakedinyears2012-2014followedbyadeclinein2015thatcontinuedin2016.TheURMfreshmenpipelineisalsocollapsingsimilartowhatwesawwithAfricanAmericanfreshmen(Table3).Allothercategoriesyieldedincreases,buttheweaknessatthebeginningofthepipelineisaconcernbecausethischangewillreversethepositivetrendswithregardtosophomores,juniors,andseniors.Earlycollegegrowthhasbeenquitestrongandgrowthinthiscategoryisoneofthemainfactorsthatdrovetheincreasebetween2015and2016.

16
Table12:FallUndergraduateURMEnrollmentatMoSU
Institution URMEnrollment
TotalUGEnrollment
URMEnrollmentasPercentofTotal(2015)
CensusData
MoSU 672 9,783 6.9% 3.8%
• Table12showsthatMoSUisoutperformingthedemographicsofitsserviceregion.Inthecurrentyear,2016,MoSUhas7.7%oftheundergraduatepopulationintheURMcategory,whichistwicetherateofunderrepresentedminoritiesintheserviceregion.
Table13:FallURMUndergraduateEnrollmentTargetTarget Baseline 2016 2017 2018 2019 2020 %UGEnrollment2%annualincrease 672 749 699 713 727 742 7.6%
• AsshowninthetargetcalculationinTable13,a2%annualincreaseyieldsarobustnumericaldifferenceeventhoughthepercentagedoesnotincreasesignificantly.A2%annualincreasewouldproducenumericalimprovementandmoderateimprovementintheproportionoftheundergraduatepopulationthatisURM.
1C:FallGraduateandProfessionalEnrollmentofUnderrepresentedMinorityStudentsasaPercentofTotalFallGraduateandProfessionalEnrollment(DiversityPlan)
Recommended target: 1% annual growth
Thefollowingelementsinformedthistarget:
Table14:FallGraduateURMEnrollmentasPercentofTotalFallGraduateEnrollment 2010 2011 2012 2013 2014 2015 2016 ChangeSince
2012URMGrad.andProf. 4.0% 6.2% 5.7% 5.6% 6.8% 8.1% 6.5% 2.5
• AsshownintheTable14,thepercentofURMgraduatestudentsatMoSUrose2.5percentagepointssincefallof2010.2015wasapeakyear,and2016suggestsareturntothemean,whichis6.1%.

17
Table15:FallGraduateEnrollmentTrendData
2010 2011 2012 2013 2014 2015 2016 ChangeSince2012
AfricanAmerican 41 57 49 41 53 48 44 -10.2%
AmericanIndian 5 4 5 5 2 3 2 -60.0%
Hispanic/Latino 9 21 15 16 14 23 12 -20.0%
TwoorMoreRaces 3 14 13 10 6 12 6 -53.8%
NativeHawaiian 0 0 0 0 0 2 1 NA
URM 58 96 82 72 75 88 65 -20.7%
TotalEnrollment 1,443 1,551 1,447 1,282 1,101 1,092 994 -31.3%
• Table15showsthatgraduatestudentenrollmentatMoSUhasdeclinedsubstantiallysince2012decreasing11.4%from2012to2013and14%betweenfall2013andfall2014.Fallof2016wasanotherdeclineof9%.URMgraduatestudentenrollmentshavenotdeclinedasquicklyasthetotalgraduatestudentpopulation,whichaccountsfortherelativelystronggrowthinURMgraduatestudentsasaproportionofthepopulation.However,itisimportanttonotethatURMgraduatestudentenrollmentdiddeclinebyabout1.5percentagepointsin2016.
Table16:FallGraduateURMEnrollmentatMoSU
Institution URMEnrollment
TotalGREnrollment
URMEnrollmentasPercentofTotal
CensusData
MoSU 88 1,092 8.1% 3.8%
• Onceagain,Table16demonstratesthatMoSUisoverperformingwithregardtothedemographicsoftheserviceregion.WehavemorethantwicetheproportionofURMinourgraduatestudentsastheserviceregionasawhole.

18
Table17:FallGraduateURMEnrollmentTargetTarget 3Year
MeanBaseline 2016 2017 2018 2019 2020 %GR
Enrollment1%annualincrease
78 88 65 90 91 92 93 9.4%
3-yearaverageincludes2013,2014,and2015.
• AsshowninthetargetcalculationinTable17,a1%annualincreasecreatesanumericaldifferenceeventhoughthepercentagedoesnotincreaseagreatdeal.Giventhepopulationofourserviceregion,thatthebaselineyear(2015)ishigherthanour3-yearaverage,andwearestartingbehindbecauseourproportionofURMgraduatestudentsdeclinedto6.5%in2016,the1%annualincreaseisrealistic.
StrategiesTactics Measures Lead/
Accountability Internal Collaborators
External Collaborators
Timeline
Strategy 1: Increase First-Time Freshmen Enrollment of Diversity Population. 1.1Focusonhigh-priorityareassuchasLouisville,Lexington,andNorthernKentuckymarket
-Numberofstudentswhoenrollfromyeartoyearincreases
EnrollmentServices
WebMarketingDirector,ChiefDiversityOfficer,EnrollmentCounselors
-Schools,-Alumni-Students,-Community
Fall2017
1.2PromoteDiversityOpportunityScholarshipsandBlackAchieversScholarships
-Numberofstudentswhoenrollfromyeartoyearincreases
EnrollmentServices
WebMarketingDirector,ChiefDiversityOfficer,EnrollmentCounselors
-Schools,-Alumni-Students,-Community
Fall2017-S
Strategy2:Createamorediversecampus,meaningmorediversityamongfacultyandstaff,morediversityamongstudentgroups,andacampusenvironmentthatismore“friendly”todiversity,sothatitbecomeseasiertorecruitandretainamorediversestudentbody.2.1ImplementationofDiversityTrainingfornewemployees
-JoinNAME-UseNAMEresourcesandcurriculuminprogramming
ChiefDiversityOfficer,HumanResources,
AcademicAffairs
-MoreheadCivicOrganizations;
Fall2018

19
Success 6B:Six-yearGraduationRateofFirst-time,Full-timeBaccalaureateDegree-seekingUndergraduateStudents–LowIncome(DiversityPlan)
Recommended target: 1% annual growth
Thefollowingelementsinformedthisselection:Table24:Six-YearGraduationRatesofFirst-Time,Full-TimeBaccalaureateDegree-seekingLowIncomeStudents
2005 2006 2007 2008 2009 2010
LowIncomeCohort
27.8% 33.3% 34.5% 34.7% 31.0% 34.1%
• Table24showsthatMoSUlow-incomecohortgraduationrateshaveincreasedfrom27.8%in2005to34.1%in2010.Theseratesarewhatwouldbeexpectedasthelow-incomecohorthasaconfidenceintervalof29.9-35.3.
Table25:StatusofLowIncomeCohortasofJanuary27,2017
Cohort AdjustedCohort
EnrolledFall2016
RegisteredforSpring2017
CurrentGraduation
Rate
MaximumGradRate
2011 650 6.8%(n=44) 4.6%(n=30) 28.5% 33.1%
2012 791 22.0%(n=174) 14.2%(n=112) 27.3% 41.5%
2013 805 45.0%(n=362) 40.4%(n=325) 2.7% 43.1%
2014 751 44.7%(n=336) 42.1%(n=316) 0.4% 42.5%
2015 698 67.5%(n=471) 57.8%(n=403) 0.0% 57.8%
2016 509 100%(n=509) 85.9%(n=437) 0.0% 85.9%

20
• Table25showsthatthemaximumgraduationrateforallMoSUlowincomecohortsisbelow50%exceptthe2015and2016cohortbaseduponthenumberofstudentscurrentlyenrolledattheendofthelastadvanceregistrationperiod.Retentionofthe2014low-incomestudentswasespeciallypoor.Thepercentageof2013cohortstudentsthatarestillactivelyenrolledintheirfourthyearisaboutthesameasthe2014cohortmidwaythroughtheirthirdyear.
Table26:GraduationProjectionsforBachelor’sGRSCohort,LowIncomeStudents
2007 2009 2010 2011 2012 2013 2014 2015FalltoFall 65.8% 63.3% 68.0% 59.2% 66.8% 66.3% 59.2% 67.5%
Year1toYear3
51.6% 50.3% 52.2% 46.2% 53.4% 51.7% 44.7% 51.4-55.4
Year1toYear4
44.9% 42.8% 47.1% 39.2% 47.1% 45.0% 36.6-39.7 45.3-48.4
4YearGradRate
15.3% 14.7% 18.4% 15.3% 21.6% 15.4-17.9 12.1-14.6 16.5-19.0
5YearGradRate
13.8% 13.2% 11.7% 11.8% 11.3-16.2 11.4-13.2 8.9-10.7 12.1-14.0
6YearGradRate
5.3% 3.1% 4.0% 1.4-4.6 2.8-4.0 3.7-4.3 2.9-3.5 4.0-4.6
TotalGradRate
34.4% 31.0% 34.1% 28.5-33.1 32.9-37.8 30.8-35.7 23.9-28.8 32.6-37.5
• UnliketheMoSUtotalbachelor’scohort,wheretherehasbeenimprovementintimetograduation,therehasnotbeenobservableimprovementwithlow-incomestudents.Theyarenotgraduatingfaster,andMoSUisnotgraduatingmoreofthem.Eventhe2008cohort,whichisnotincludedinthetable,hadextremelyhighfalltofallretentionof72.0%andslightlyhigherfirsttothirdretention(55%),bytheendofthesixyears,the34.7%graduationrateisaverage.
• Aconfidenceintervalwasconstructedanditshowsthattheexpectedgraduationrateforthelow-incomecohortis30-37.5%basedonhistoricalaverages.Basedoncurrentretentionpatternsandusingpastperformanceasaguide,thecurrent

21
cohortsshowthatthetrajectoryhasnotchangedandallprojectedsix-yeargraduationratesfallwithintheconfidenceinterval.
Table27:Six-YearGraduationRateofLowIncomeCohortTarget
Target 3YearAverage
Baseline 2011Cohort
2012Cohort
2013Cohort
2014Cohort
2015Cohort
Cumulativeincrease
1.0%annualincrease
33.2% 34.1% 34.4% 34.7% 35.0% 35.3% 35.7% 4.7%
• Basedonthedatathatisavailable,EKUhasafour-yeargraduationrateforlow-incomestudentsof28.5%.NKU’sfour-yearaverageisabout26.4%,Murray’sgraduationrateis41.2%andWKU’sisabout37.4%.MoSUisperformingslightlybelowMuSUandWKUbutaboveNKUandEKUonthismetric.
• Ourbaselinecomesfromthe2010cohortanditis34.1%.Unfortunately,withthe2011cohort,wewouldnotbeabletomeetthetargetfora1%annualincreasebasedonthestudentswhoremainenrolled.Theremainingcohortsdohavepotential,butthe2014cohorthasbeenanexceptionallypoorperformingcohort.
• A1%annualincreasetargetwassuggested
6B:Six-yearGraduationRateofFirst-time,Full-timeBaccalaureateDegree-seekingUndergraduateStudents–URM(DiversityPlan)
Recommended target: 1% annual growth
Thefollowingelementsinformedthisselection:Table28:Six-YearGraduationRatesofFirst-Time,Full-TimeBaccalaureateDegree-seekingURMStudents
2005 2006 2007 2008 2009 2010
URMCohort
37.7% 32.8% 31.6% 42.9% 22.4% 32.6%
• Table28showsthatMoSUURMcohortgraduationrateshaveexperienced
significantvolatility.Confidenceintervalsforthisgroupare24.7to37.6.Thus,the

22
onlyyearthatexceedsthisthresholdisthe2008URMcohort,whichonlyhad28students.
Table29:StatusofURMCohortasofJanuary27,2017
TotalCohorts
AdjustedCohort
EnrolledFall2016
RegisteredforSpring2017
GradRate
MaximumGradRate
2011 96 7.3%(n=7) 5.2%(n=5) 28.1% 33.3%
2012 141 27.0%(n=38) 17.0%(n=24) 23.4% 40.4%
2013 152 50.0%(n=76) 46.1%(n=70) 0.0% 46.1%
2014 128 49.2%(n=63) 46.1%(n=59) 0.0% 46.1%
2015 121 67.8%(n=82) 58.7%(n=71) 0.0% 58.7%
2016 76 100%(n=76) 82.9%(n=63) 0.0% 82.9%
• Table29documentsthestatusofeachofthecurrentMoSUcohortsattheendofthemostrecentadvanceregistrationperiod.Thisdataenablesustofigurethecohortretentionandthemaximumgraduationrateifeverycurrentlyenrolledstudentgraduatedontime.Forthe2011cohort,thedatasuggestsagraduationrateof33.3%orless.Areviewoftheremainingcohortsindicatesthatnonehasmorethan50%ofthestudentsstillenrolleduntilwegettothe2015and2016cohortsthathave58.7%and82.9%respectivelyofstudentsstillenrolled.
Table30:GraduationProjectionsforBachelor’sGRSCohort,URMStudents
2005 2006 2007 2009 2010 2011 2012 2013 2014 2015FalltoFall 60.0% 56.7% 54.2% 63.8% 66.3% 64.6% 66.2% 69.7% 62.5% 67.8%
Year1toYear3
48.3% 46.7% 37.3% 41.4% 46.5% 44.8% 51.4% 55.3% 49.2% 45.4-57.8%
Year1toYear4
43.3% 40.0% 35.6% 36.2% 40.7% 38.5% 45.8% 50.0% 42.5-47.5% 44.9-49.9%
Year4GradRate
9.7% 9.8% 10.2% 6.9% 12.8% 9.8% 17.7% 12.2-15.2% 10.3-13.2% 11.2-14.1%

23
Year5GradRate
17.9% 19.7% 14.0% 12.1% 17.4% 18.3% 14.3-18.6% 18.3-22.8% 15.7-20.1% 17.0-21.4%
Year6GradRate
9.7% 3.3% 6.8% 3.4% 2.3% 2.3-5.2% 2.6-3.8% 5.7-7.1% 4.9-6.3% 5.3-6.7%
TotalGradRate
37.3% 32.8% 31.6% 22.4% 32.6% 30.4-33.3% 34.6-40.4% 36.2-45.1% 30.9-39.6% 33.5-42.2%
Table31:Six-YearGraduationRateofURMCohortTarget
Target 3YearAverage
Baseline 2011Cohort
2012Cohort
2013Cohort
2014Cohort
2015Cohort
Cumulativeincrease
2.0%annualincrease
32.6% 34.1% 34.8% 35.5% 36.2% 36.9% 37.6% 10.3%
• TherehasbeenapparentvolatilityinthegraduationrateofMoSUURMstudentsbecauseofthesmallnumberofstudents.Duetotheapparentinstability,thereisawideconfidenceintervalof23%to42%usingallvalues,includingtheextremelyhigh2008figureinwhichtherewere28URMstudentsandtheextremelylow2009-graduationrateof22.4%.Thus,theproblemisalargestandarddeviation,whichcreatesawideinterval.
• Becausethisintervalissowide,wecan’tuseaconfidenceintervalasaguidetodefine“improvement”becauseMSUwouldhavetoshowconsistentincreasesofmorethan4%peryear.
• A2.0%annualincreasewasselectedforthismetric.Giventhesmallnumberofstudentsandthesupportstrategiesinplace,wethinkitmaybepossibletoachievethistargetbeginningwiththe2012cohort.
6C:First-toSecond-YearRetention–LowIncome(StrategicAgenda,DiversityPlan)

24
Recommended target: 1% annual growth
Thefollowingelementsinformedthisselection:Table34:First-toSecond-YearRetentionofLowIncomeBachelor’sGRSCohort
CohortType
2009Cohort
2010Cohort
2011Cohort
2012Cohort
2013Cohort
2014Cohort
2015Cohort
LowIncome
62.2% 68.0% 59.2% 66.6% 66.3% 59.2% 67.4%
• Table34demonstratesthattheretentionofMoSUlow-incomestudentshashadquiteabitofvolatility.A95%confidenceintervalwas-calculatedtoassesshowretentionhasbeenandtodeterminewhatnumberswouldyieldastatisticalimprovement.
• Theaverageretentionrateforthelow-incomecohortsis64%.Theconfidenceintervalis60.6-67.4.Usingthesenumbers,wecanseethat2011and2014cohortshadretentiondeclinesthatareoutsidetheconfidenceinterval.Thismeansthedeclinesareunlikelytobetheresultoferrorandgeneralfluctuationinthedata.The2015cohortisnearthetopoftheconfidenceinterval,butitdoesnotfalloutsideit.Thissuggeststherehasnotbeenastatisticalimprovementinretentionforthe2015cohortbecauseitstayedwithintheparametersexpected.
Table35:First-toSecond-YearRetentionofLowIncomeBachelor’sGRSCohortTarget
Target 3YearMean
Baseline
2016-17
2017-18
2018-19
2019-20
2020-21
Cumulativeincrease
1%annualincrease
64.2% 67.4% 68.1% 68.8% 69.5% 70.2% 70.9% 5.1%
• MoSu’sbaselineof67.4%retentionishigherthanthethree-yearmean.Thisispartlybecausethethree-yearmeanispullbytheretentionofthe2014cohort.

25
• A1%annualincreasewasselectedforthismetric.Thiswillbeastatisticalincreasethatwillmovetherateoutsideoftheconfidenceinterval.
6C:First-toSecond-YearRetention–URM(StrategicAgenda,DiversityPlan)
Recommended target: 1% annual growth
Thefollowingelementsinformedthisselection:
Table36:First-toSecond-YearRetentionofURMBachelor’sGRSCohort
CohortType
2009Cohort
2010Cohort
2011Cohort
2012Cohort
2013Cohort
2014Cohort
2015Cohort
URMCohort
63.8% 66.3% 64.6% 66.2% 69.7% 62.5% 67.8%
• Table36showsthatretentionofURMstudenthasbeenmorestablethanretentionoflow-incomestudents(Table34).Theaverageretentionrateacrossthisperiodis65.8%,andthe95%confidenceintervalis63.6%to68.0%.Havingcalculatedtheconfidenceinterval,wecanseethatthe2015cohortiswithinthatinterval,whichsuggeststhatthebaselineofdataisnotanimprovementfrompasthistoricaldata.
• Thecurrentfalltospringretentionispreliminaryforthe2016cohort,andshowsthat82.8%ofthecohortenrolledforthespringsemester.Thisislowerthanfalltospringretentionforboththe2015cohortandthe2013cohort,bothofwhichhadURMfalltospringretentionrateshigherthan90%.Thefalltospringretentionratecloselymatchestheretentionforthefall2014cohort.
Table37:First-toSecond-YearRetentionofURMBachelor’sGRSCohortTarget
Target 3YearMean
Baseline 2016-17 2017-18 2018-19 2019-20 2020-21 Cumulativeincrease
1%annualincrease
66.8% 67.8% 68.5% 69.2% 69.9% 70.6% 71.3% 5.2%

26
• Table37modelsa1%annualincrease.Retentionforthe2016cohortisclosetothefalltospringretentionforthe2014cohort.Ifthistrendcontinues,MoSUwouldnotreachthe16-17goalwitha1%annualincrease.
• Asdiscussedwiththeconfidenceintervals,anythingabove68%wouldbedurableimprovement,butgiventhehighstartingbaseline,evena1%annualincreasewouldresultinaretentionrateinexcessof71%,whichwouldbeasignificantincreasefromourcurrentrate.
9B:Bachelor’sDegreesAwarded–LowIncome(StrategicAgenda,PerformanceFunding,DiversityPlan)
Recommended target: 1% annual growth
Thefollowingelementsinformedthisselection:
Table46:LowIncomeBachelor’sDegrees
2010-11
2011-12 2012-13 2013-14 2014-15 2015-16
LowIncomeBachelor’sDegrees 619 617 666 703 702 779
• Table46showsthatthethree-yearchangesince2012-13variedenormouslyfrom5.5%,0%and11%.Theaverageannualrateofchangeis5.5%.
• 11%annualgrowthisunlikelytocontinue.Historically,2010-11and2011-12showednorateofchangeasdid2013-14and2014-15.8%changeoccurredbetween2011-12and2012-13.
Table47:PipelineofTotalLowIncomeBachelor’sSeekingStudentEnrollment
Year Freshmen Sophomores Juniors Seniors
SeniorsGraduatewithinYear
SeniorsGraduatedTotal*
2009-10 1,198 698 801 1,234438(35.5%)
979(79.3%)

27
2010-11 1,107 734 846 1,355585(43.2%)
1,102(81.3%)
2011-12 1,254 752 900 1,383595(43.1%)
1,129(81.6%)
2012-13 1,376 762 911 1,391611(43.9%)
1,125(80.9%)
2013-14 1,384 827 896 1,387658(47.5%)
1,096(79.0%)
2014-15 1,206 879 938 1,315660(50.5%)
1,000(76.0%)
2015-16 1,002 766 950 1,304703(53.9%)
813(62.3%)
2016-17 786 639 845 1,238638(51.5%)
638(51.5%)
*Includesunofficialgraduatesfromfall2016andwinter2016.Alsoincludesapplicationstograduateinspring2017
• ThepercentageofMoSUseniorsqualifyingaslowincomehasbeendeclining.In2009-10,thepercentagewashigherthan60%.MoSUreachedamaximumof67%ofseniorsin2013-14and2014-15.In2015-16,thenumberofseniorsdeclinedto63%andin2016-17,itdeclinedfurtherto60%.Thus,low-incomestudentsaredeclininginnumberandinpercentageofthestudentpopulation.Thispresentsachallengetogrowthasthedemographicsareshifting.
• ThetrendsaremoreconcerningamongMosulfreshmenwithonly54%of2015-16freshmenbeinglowincomeand49%of2016-17freshmenbeinglowincome.From2007-08to2012-13,therewasrelativelyparityinthepercentageoffreshmenandseniorswhowerelowincome.Forexample,in2011-12,64%offreshmenwerelowincomeand63%ofseniorswerelowincome.Beginningin2013-14,thenumbersbegintodivergewiththepercentageoflow-incomeseniorsrising,andthepercentageoflow-incomefreshmendeclining.In2015-16,54.4%offreshmenwerelowincomewhereas63.2%ofseniorswere.

28
• Table47showsthatMosulhasseensubstantialincreasesinseniorswhograduatewithintheyear.In2009-10only35.5%oflowincomeseniorsgraduatedin2009-10,whereasin2015-16,almost54%did.
• Thenumberoflow-incomeseniorshasbeenaround1300-1400since2010-11,butitbegandecliningin2014-15andreachedanewlowin2016-17.Thepeakwas1,391and1,234isadeclineof11.3%.
Table48:LowIncomeFirst-TimeTransfersbyClassification
Classification 2010-11 2011-12 2012-13 2013-14 2014-15 2015-16 2016-17*
Freshman 74 100 96 89 76 58 49
Sophomore 99 129 117 107 117 109 88
Junior 185 238 242 220 211 184 171
Senior 123 131 100 94 84 82 60
Total 481 598 555 510 488 433 368
*AYisSUR,fall,winter,andspringterm.Datafromspring2017ispreliminaryandtheclassificationnumbersmaychangeastransfercreditisprocessed.Studentsfrom16-17havehadlittleopportunitytogetaPellgrantduringtheirtimeatMSU.Thus,thenumberofPellrecipientsisverylikelytogrowovertime,especiallyforthisgroup.
• Table48showsthetrendswithregardtolow-incometransferstudents.The2016-17numbersarelikelylowbecausesomeofthesestudentswillreceivePellastheycontinueatMoSU.Despitethiscaution,thetrendsuggestsadeclineinthenumberoflow-incometransferstudents.Aswiththetotaltransferstudents,thelow-incometransferstudentsdonotappeartograduatequickly.Fortheseniorswhotransferredin2010-11and2011-12,about50%ofthelow-incometransfersgraduated.Thisisincontrasttothelow-incometransferswhocameduringthoseyears,whohaveanaveragegraduationrateof27%.
• Regardinglowincome,since2010-11,about62%offirst-timetransferstudentsarelowincome.ThisissimilartotheMoSUpopulation,andliketheMoSUpopulation,thepercentageoflow-incomestudentshasdeclinedinrecentyears,particularly2015-16and2016-17.
• Historically,thelargestnumberoflow-incometransfershavecomefromfiveoftheKCTCSinstitutions:BigSandy,Ashland,Maysville,Bluegrass,andHazard.ThisisbothgoodandbadnewsinthattherehavebeenenrollmentdeclinesinAshland,Bluegrass,andMaysville.Hazardshowedsmallincreasesinenrollment,andBigSandyincreasedenrollmentin2015-16byabout600.

29
Table49:LowIncomeBachelor’sDegreesTarget
Target 3YearMean
Baseline
2016-17
2017-18
2018-19
2019-20
2020-21
CumulativeIncrease
1.0%annualincrease
690 779 787 795 803 811 819 5.1%
*3yearmeanincludes2012-13,2013-14,and2014-15
• Giventhedataavailable,thisseemsasifitwillbeahardmetrictomove,especiallywithanewhighbaseline.Thethree-yearmeanof690issubstantiallylowerthanthebaselineof779.Thisisespeciallytruesincethenumberandpercentageoflow-incomestudentsisdeclining.Thenumberoflow-incomeseniors,1,238issmallerthantheprevioustotalof1,304.
• Table49modelsa1%annualincreaseasthetargetforthismetric.
9B:Bachelor’sDegreesAwarded–URM(StrategicAgenda,PerformanceFunding,DiversityPlan)
Recommended target: 4% annual growth
Thefollowingelementsinformedthisselection:
Table50:UnderrepresentedMinorityBachelor’sDegrees
2010-11 2011-12 2012-13 2013-14 2014-15 2015-16
URMBachelor’sDegrees
49 53 46 51 63 69
• Table50showsthatthenumberofMoSU’sbachelor’sdegreesawardedtoURMstudentsincreasedby40.8%since2010-11.However,therehasbeenagoodbitofinstabilityintheseincreases.Forinstance,from2011-12to2012-13,URMdegreeproductiondecreasedby13.2%,whereasin2013-14to2014-15degreeproductionincreasedby23.5%.

30
Table51:PipelineofTotalURMBachelor’sSeekingStudentEnrollment
Year Freshmen Sophomores Juniors SeniorsSeniorsGraduatedwithinYear
SeniorsGraduatedTotal*
2009-10 97 62 51 85 33(38.8%) 73(85.9%)
2010-11 125 40 61 92 43(46.7%) 75(81.5%)
2011-12 145 69 62 105 43(40.9%) 81(77.1%)
2012-13 200 82 62 107 44(41.1%) 76(71.0%)
2013-14 226 96 72 97 45(46.4%) 73(75.3%)
2014-15 203 123 88 97 54(55.7%) 73(75.2%)
2015-16 178 112 111 118 61(51.7%) 77(65.2%)
2016-17 137 98 115 149 58.4%(n=87)* 58.4%(n=87)
*Includesgradapplications
• Table51showsthatthenumberofURMfreshmenatMoSUincreaseddramaticallyreachinganewhighin2013-14,butsincethen,thenumbershavebeendecliningalongasimilartrajectorytotheirrise.Aswithotherbachelor’sdegrees,thepercentageofseniorswhograduateduringtheyearhasbeenrising.Basedonthepreliminarygraduatesandgraduateapplications,itisverylikelythatMoSUwillsurpassthe69URMdegreesproducedin2015-16.ThiswouldalsobeanewhighwithregardtothepercentageofURMseniorswhograduatedduringtheyearwith58.4%
Table52:URMFirst-TimeTransfersbyClassification
Classification 2010-11
2011-12
2012-13
2013-14
2014-15
2015-16
2016-17*
Changefrom2010-11
Freshman 4 16 17 14 7 12 14 250%

31
Sophomore 6 11 15 11 11 15 16 167%
Junior 15 21 14 23 17 16 18 20.0%
Senior 16 14 18 6 8 13 9 -43.7%
Post-Bac 6 6 5 4 1 2 3 -50.0%
Total 47 68 69 58 44 58 60 27.6%
*AYisSUR,fall,winter,andspringterm.Datafromspring2017ispreliminaryandtheclassificationnumbersmaychangeastransfercreditisprocessed.
• Table52showsthatfirst-timetransferstudentsprovideanaverageof58URMstudentsayearandarenotahugesourceofURMstudents.ThesourceforthemostURMtransfersisBluegrassTechnicalCollege,whichprovided53transfersfrom2010-11through2016-17.ThenextclosestsourcesareMaysvillewith25andAshlandwith23.
• Ofthe404URMtransfers,92completedtheirbachelor’sdegreeatMSU,whichisabout22.7%.Areviewoffirsttimetransfersfrom2010-11to2013-14revealsthat81outof242orapproximately33.5%graduatedincludingallclassifications.Freshmenagainhadthelowestrateofgraduationat21.6%andseniorshadthehighestgraduationrateof46.3%.Juniorsgraduatedatabout37%.
Table53:UnderrepresentedMinorityBachelor’sDegreesTarget
Target 3YearMean
Baseline 2016-17 2017-18 2018-19 2019-20 2020-21 CumulativeIncrease
4.0%annualincrease
53 69 72 75 78 81 84 21.7%
*Threeyearmeanincludes2012-13,2013-14,and2014-15.
• Table53showsthatMosulisstartingataveryhighbaseline.ThissubstantialimprovementhasbeenpartiallydrivenbyenrollmentincreasesinURMstudents.Improvementsinthepipelinecanbeseenforjuniorsandseniors;however,thenumberoffreshmanenrolleddeclinedsignificantlyin2015-16and2016-17.ThiswillaffectthepipelinemovingforwardbecauseMoSUwillnothaveanyslackthatwouldallowthelossofstudents.MoSUwillhavetoretainandgraduatetheenrolledstudents,orelsereplenishthenumbersbyenhancingtransferstudents.Inthe

32
currentyear,itlooksasifMoSUissettoestablishanewhighforURMbachelor’sdegrees.
• URMtransferstudentshavebeenrelativelystableoverthisperiodwiththeexceptionsof2010-11and2014-15,whichshowedsubstantialdips.TheotherconcernistheweaknessintheKCTCSpipelinegoingforward,especiallywithregardtodeclinesinenrollmentatBluegrassCommunityandAshland,bothofwhichhavebeenthelargestsourcesofURMfirst-timetransferenrollmentduringthistime.
• Thedataprovidedsuggestsshort-termimprovementandpotentialriskoverthelongterm.Thus,ifallgraduationapplicationswereapprovedMoSUwouldlikelyachievegrowthof33.3%thisyearbyhitting92URMbachelor’sdegrees,whichisthe2020-21targetfor6%annualincrease.However,unlessthepipelineisreplenishedwithtransfersorimprovementsoccurintheretentionandprogressionofthecurrentfreshmenstudents,MoSUwillnotbeabletomaintainthecurrentpaceofdegreeproduction.Thus,ifweexcludethe149seniorsthatwehavein2016-17,MoSU’saveragenumberofURMseniorsisaround100.
• Thetargetselectedforthismetricisa4%annualincrease.
StrategiesWhilemaintainingadiversestudentbodyisessential,institutionsmustcommittohelpingenrolledstudentsbe.Unfortunately,certaindiversestudentpopulationshistoricallyhaveexhibitedlowergraduationandretentionratesthantheoverallstudentpopulation.Inordertoimprovethesuccessofthesestudents,MSUwillimplementstrategiesdesignedtoaddresstheissues.
Tactics Measures Lead/ Accountability
Internal Collaborators
External Collaborators
Timeline
Strategy 1: TheplanutilizeshighimpactpracticestocreatestrategiesdesignedtosupportincreasedstudentsuccessforBlack/AfricanAmerican,Hispanic,low-income,andunderrepresentedminoritystudents. 1.1InstitutionalizetheEagleDiversityEducationCenter(EDEC)programsandservices
-CreationofCommunityConversations-Numberofstudentprogramscreatedforstudents
MinorityAcademicServicesCoordinator,MinorityRetentionCoordinator
ChiefDiversityOfficer,OfficeofStudentActivities,Inclusion&Leadership,Counseling&HealthServices,CareerServices,AcademicAffairs,Undergraduate
Fall2017

33
Research,CenterforRegionalEngagement
Strategy2:Identifyannualgoalsforunderrepresentedminoritystudentsandlowincomeforthestudentsuccessmetricof1stto2ndyearretention.
2.1TheDedicationtoRetention,Education,andAcademicSuccessatMoreheadStateprogram(DREAMS)isacomprehensiveacademicsupportandretentionprogramcenteredonfirstyeartransition,mentoring,andleadership.
-Providedirectandsupplementalacademicsupporttostudentswhoareinjeopardyconcerningacademicperformanceandheightenedrenditionrisk.
DirectorofAcademicAdvising&Retention
MinorityAcademicServicesCoordinator,MinorityRetentionCoordinator,ChiefDiversityOfficer
Fall2017
Strategy3:Identifyannualgoalsforunderrepresentedminorityandlowincomestudentsforthestudentsuccessmetricofgraduationrates(6yearforfouryearinstitutions)3.1CreateaplantoidentifyunderrepresentedminoritystudentswhohaveleftMSUandattempttore-enrollthemtocompletetheirprograms
-Numberofstudentsreclaimed
EnrollmentServicesDeanGraduateSchool
EnrollmentCounselors,AcademicAdvisors,ProgramCoordinator
Fall2017
3.2Createandimplementplantoincreasediverseinternationalstudentenrollment,especiallytargetingBlackandHispanicpopulation
-Numbersofinternationalstudentsenrolledandmaintained
EnrollmentServices,AcademicAffairs
EnrollmentCounselors,AcademicDepartments,FirstYearExperience
-SACAM-ForeignCountries
Fall2018
Strategy4:Identifyannualgoalsforunderrepresentedminorityandlow-incomestudentsandforthestudentsuccessmetricofdegreesconferred.4.1Assessincreaseinpercentageofdegreesawarded
-Compareratesfromyeartoyear
DirectorofAcademicAdvising&Retention
UndergraduateResearchFellowshipProgram
Fall2018

34
4.2HavetheappropriateunitswithinAcademicAffairsandStudentSuccessreviewthedataannuallyanddevelopstrategiestoaddressareasofconcern
-Reviewgraduationmetrics
VicePresidentofAcademicAffairs/VicePresidentofStudentSuccess
AcademicAdvising&Retention,InstitutionalResearch,ChiefDiversityOfficerAcademicAffairs
Fall2018
Impact WorkforceDiversity:URMTenuredandTenureTrackFaculty(DiversityPlan)
Recommended target: 2% annual growth
Thefollowingelementsinformedthisselection:
Table61:WorkforceDiversity-URMTenuredandAllTenure-TrackFacultyincludingAcademicChairsandProgramDirectorsInstitution 2013 2014 2015 2016 CensusData Change
MoSU 7.7% 7.2% 7.0% 7.5% 3.8% -0.2
*InformationfromIPEDSHRreportandincludestenuredandtenure-trackfacultymembers.
• Table61showsthatMoSUhasexperiencedaslightdeclineof.2%since2013,butcontinuestooutperformthedemographicsoftheserviceregionwithregardtothepercentageofURMtenuredandtenure-trackfacultyemployed.ThepercentageofURMtenuredandtenure-trackfacultyatMoSUin2016isalmosttwicethatoftheserviceregiondemographicsbaseduponCensusdata.
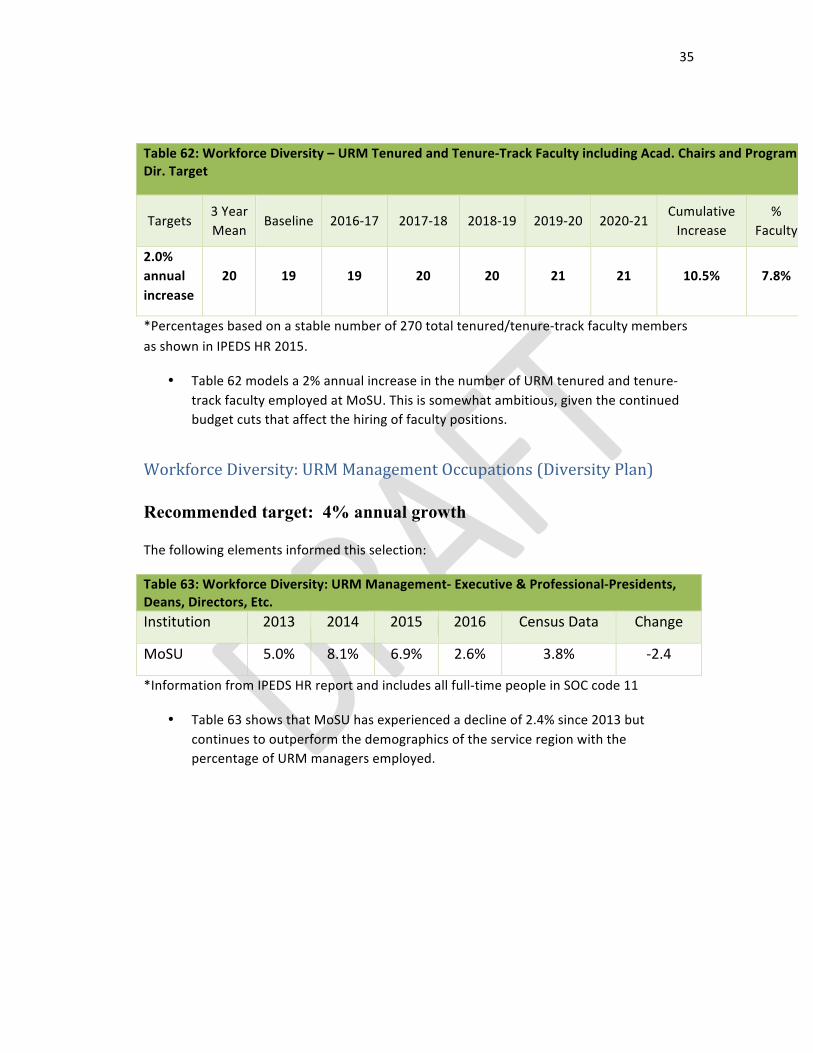
35
Table62:WorkforceDiversity–URMTenuredandTenure-TrackFacultyincludingAcad.ChairsandProgramDir.Target
Targets3YearMean
Baseline 2016-17 2017-18 2018-19 2019-20 2020-21CumulativeIncrease
%Faculty
2.0%annualincrease
20 19 19 20 20 21 21 10.5% 7.8%
*Percentagesbasedonastablenumberof270totaltenured/tenure-trackfacultymembersasshowninIPEDSHR2015.
• Table62modelsa2%annualincreaseinthenumberofURMtenuredandtenure-trackfacultyemployedatMoSU.Thisissomewhatambitious,giventhecontinuedbudgetcutsthataffectthehiringoffacultypositions.
WorkforceDiversity:URMManagementOccupations(DiversityPlan)
Recommended target: 4% annual growth
Thefollowingelementsinformedthisselection:
Table63:WorkforceDiversity:URMManagement-Executive&Professional-Presidents,Deans,Directors,Etc.Institution 2013 2014 2015 2016 CensusData Change
MoSU 5.0% 8.1% 6.9% 2.6% 3.8% -2.4
*InformationfromIPEDSHRreportandincludesallfull-timepeopleinSOCcode11
• Table63showsthatMoSUhasexperiencedadeclineof2.4%since2013butcontinuestooutperformthedemographicsoftheserviceregionwiththepercentageofURMmanagersemployed.

36
Table64:WorkforceDiversity:URMManagementTarget
Target3YearMean
Base-line
2016-17
2017-18
2018-19
2019-20
2020-21
CumulativeIncrease
%Management
4.0%annualincrease
5 5 5 5 5 5 6 20.00% 8.30%
*Percentagesbasedonastablenumberof72totalfull-timemanagementpositionsasshowninIPEDSHR2015.
AsshowninthetargetcalculationTable64,4%annualincreasewillresultinanincreaseinthenumberofURMmanagersbyone.Inordertorealizethepositiveeffectsofdiversity,Kentucky’spublicinstitutionsmustbecomecommunitiesthatprovideaninclusiveandsupportiveenvironmentforadiversegroupofstudents.Campusclimaterepresentsthecurrentattitudes,behaviorsandstandardsoffaculty,staff,administratorsandstudentsconcerningthelevelofrespectforindividualneeds,abilitiesandpotential.1Inorderforstudentstobesuccessfulandreceivethefullbenefitsofdiversity,thecampusclimatemustbeonethatissupportiveandrespectfulofallpeople.Furthermore,inordertoliveandthriveonadiversecampusandinanincreasinglydiverseworld,studentsmustbecomemoreculturallycompetent.If“diversity”referstothevariationinpopulationsasdefinedinthispolicy,then“competency”referstotheabilitytounderstandandappropriatelyaddressthesevariations.Culturalcompetencyprovidesindividualswiththeknowledge,skills,andattitudestoincreasetheireffectivenessinrelatingacrossculturaldifferencesandpreparesthemforlifeinincreasinglydiversedomesticandinternationalenvironments.Becauseoftheknowledgeandskillsobtained,studentswillgainanappreciationoftheirownculturalidentitiesandbecomecriticallyself-reflectiveintheirorientationtowarddifferencesintheidentitiesofothers.

37
Strategies
Tactics Measures Lead/
Accountability Internal Collaborators
External Collaborators
Timeline
Strategy 1: Establishabaselineofcommunitymembers’perceptionsofdiversity,equity,inclusionandculturalcompetenceatMoreheadStateUniversityanddeterminehowtheinstitutionmayadvanceitsgoalsfordiversityandinclusion. 1.1Createabiasreportingandresponsemechanismforstudents,staffandfacultytoaddressissuesthatmayaffecttheenvironmentoratmospherenegatively.
-Creationofbiasreportingandresponsemechanism/system-Numberofincidentsreported-Natureofincidents(populationsimpacted)reported
CoordinatorStudentLeadershipandAdvocacy
WebMarketingDirector,MSUPolice;DeanofStudents,ChiefDiversityOfficer,OfficeofStudentActivities,Inclusion&Leadership,Counseling&HealthServices,HumanResources
MoreheadPolice;RowanCountySheriff;Pathways(othercommunitymentalhealthagencies)
Fall2017
1.2Developanexpandedinstitutionaldefinitionofdiversityandinclusionthatacknowledgesandsupportsintersectionalityi.e.supportandadvocacyforequityregardlessofrace,ethnicity,veteranstatus,orientation,identity,genderexpressionorsocio-economicstatus
-Establishexpandeddefinition-Receiveinstitutionalapprovalthroughsharedgovernance-Distributetocampuscommunity-Replaceinprinted/electronicplans,publications,etc.
ChiefDiversityOfficer
HumanResources,GeneralCounsel,StudentActivities,Inclusion&Leadership,StudentGovernmentAssociation,FacultySenate,StaffCongress
Fall2017-Spring2018
1.3Systematicallyadminister,analyze,andusefeedbackfromacampusclimate
-Assessmentinstrumentselected-Surveyadministered
OfficeofInstitutionalResearch&Analysis
HumanResources;GeneralCounsel;Student
AdministeredinFall2017toestablishbaseline;administered

38
survey. tofaculty,staffandstudents-Feedbackanalyzedandutilizedtoimprovecampusclimate
Activities,Inclusion&Leadership;ChiefDiversityOfficer
everythreeyearsthereafter
Strategy2:Createandsupportanemphasisthatwouldserveasacross-divisional,interdisciplinaryorganizationtofacilitateadvocacy,education,andresearchrelatedtosocialjustice,diversity,inclusion,equality,andequity.
2.1JoinNationalAssociationofMulticulturalEducationandrenewasaninstitutiononanannualbasis
-JoinNAME-UseNAMEresourcesandcurriculuminprogramming
ChiefDiversityOfficer
Fall2018
2.2Createadatabaseofinformationaboutofficesandindividualswhoaredoingprogramming,education,advocacy,andresearchrelatedtodiversityandinclusiononcampus.
-Creationofdatabase-Numberofprograms-Typesofprogramsoffered-Programsofferedperpopulation-Alignmentofprograms/researchtocampusclimatesurveyfeedback
ChiefDiversityOfficer
OfficeofStudentActivities,Inclusion&Leadership;ChiefDiversityOfficer;EagleEducationDiversityCenter,AcademicAffairs
Spring2019
Strategy3:Increaserepresentationofdiversefaculty,professionalstaff,andadministratorsthroughstrategicrecruitmentandretentionefforts.3.1UtilizerecruitmentnetworkssuchasKentuckyAssociationofBlacksinHigherEducation,BlacksinHigherEducation,SREB,DiverseEducation,etc.
-Jobsadvertisedin/withdiversityrecruitmentnetworks/publications
HumanResources
Hiringsupervisors,AcademicAffairs
ProfessionalAssociations
Ongoing

39
3.2Facilitatethedevelopmentofandprovidesupportforfaculty/staffassociationsbasedondiversebackgrounds;andembedmentorshipdimensionswithinthemforknowledgedevelopmentandorganizationaleffectiveness.
-Creationofassociations-Numberoffaculty/staffparticipatingcomparedtonumberemployed-Surveytoalldiversefaculty/stafftodeterminewhytheywere/werenotinvolved
HumanResources
VicePresidents;Facultyandstaffofdiversebackgrounds;FacultySenate;StaffCongress
ProfessionalAssociations
Fall2018
Strategy4:Identifyvarioussettings(integratingartworkandsignageincommonareas)thatreflectthediversityofthecampuscommunity.Developcommunicationinvenuesthatpromotediversity,inclusion,culturalcompetence,andDiversityPlanactionstepsinwaysthatmotivatethecommunitytoengageinimplementingtheactions(e.g.,thewebsite,socialmedia,on-andoff-campuscommunityforums,blogs,printedpublications,exhibits,TVandradiointerviews,presentationsatconferences).4.5ConceptualizeanddevelopavideoduringNewStudentDayshighlightingthediversityandcommonalitiesamongtheincomingfreshmanclass–"WhatWeShare"
-Completionofvideo-Distributionofvideoonwebandsocialmedia
ChiefMarketingandPublicRelationsOfficer
VicePresidentforStudentSuccess;FirstYearPrograms;ChiefDiversityOfficer;WebMarketingDirector;Videographer;Students
Fall2017;Updatedannually
BarriersInorderfortheDiversityPlantobesuccessful,theappropriateresourcesneedtobeinplace,relatedtostudentsuccessandemployment.Theinternalandexternalcollaboratorswillneedtoworktogethertoensurethatpropercommunicationchannelsareinplaceandthateachgroupunderstandstheexpectationsortherequirementsneededtoadvancetheplanforward.Ifresourcesareremoved(otherprojectsorleaveforotherjobs),therewillneedtobeotherstostepinandcompleteorimplementthestrategiesthatareapartoftheplan.Theinformationneededtomakedecisionswillneedtobeaccurateandavailableinatimelymannertoadjusttotheplanifneeded.

40
PlanAssessmentAssessmentoftheplanwillbeperformedannually,withprogressionandfeedbackconducted.InstitutionalResearchwillcoordinatethedatacollectionandanalysis.Thetargetsthatareapartofthestrategicagendaandcontainedinthediversityplanwillneedtobereviewedconcurrently.Anyadjustmentstotheplanwillbedoneaftercarefulreview.Moreover,theefficacyofthestrategiesoutlineintheproposaltoachievesuccessarecurrentlybeingdeveloped.ConclusionMoreheadStateUniversityhasanunwaveringcommitmenttopromotingdiversityandinclusiononcampus,andintheRegion,weserve.Accordingly,theplanproposediscompletewithcampus-wideenthusiasmandsupport.WelookforwardtocollaboratingwiththeKentuckyCouncilforPostsecondaryEducationtoimprove,implementandassesthisimportantplan
ImplementationPlanOnceapprovedtheMSUDiversityPlanwillbesubjecttotwosequentialcommittees.First,animplementationcommitteewillensurethattheplanisplaceandadjustmentsmadeasnecessarythroughoutthecomingyear.Followinginitialimplementation,anoversightcommitteethereaftertoensureannualreviewandupdatesasnecessary.

41
ReferencesAmericanAssociationofColleges&Universities
Capper,C.,&Young,M.(2014).Ironiesandlimitationsofeducationalleadershipforsocialjustice:Acalltosocialjusticeeducators.TheoryintoPractice,53(2),158-164.
CenterforUrbanEducation,UniversityofSouthernCalifornia
Dantley,M.E.,Beachum,F.D.,&McCray,C.R.(2008).Exploringtheintersectionalityofmultiplecenterswithinnotionsofsocialjustice.JournalofSchoolLeadership,18(2),124-133.
Davis,T.L.,&Harrison,L.M.(2013).Advancingsocialjustice:Tools,pedagogies,andstrategiestotransformyourcampus.SanFrancisco,CA:JohnWiley&Sons.
Gorski,P.C.(2013).Reachingandteachingstudentsinpoverty:Strategiesforerasingtheopportunitygap.NewYork,NY:TeachersCollegePress.
Gorski,P.C.,&Pothini,S.G.(2013).Casestudiesondiversityandsocialjusticeeducation.NewYork,NY:Routledge.Gorski,P.C.,&Swalwell,K.(2015).Equityliteracyforall.EducationalLeadership,72(6),34-40.
Griffiths,M.(2003).Actionforsocialjusticeineducation:FairlyDifferent.Maidenhead,England:OpenUniversityPress.
Irving,D.(2014).Wakingupwhite,andfindingmyselfinthestoryofrace.Cambridge,MA:ElephantRoomPress.
Loewen,J.W.(1995).Liesmyteachertoldme.NewYork,NY:Touchstone.
NationalCenterforCulturalCompetence
Normore,A.H.,&Brooks,J.S.(Eds.).(2014).Educationalleadershipforethicsandsocialjustice:Viewsfromthesocialsciences.Charlotte,NC:InformationAge.
Page,S.E.(2007).Thedifference:Howthepowerofdiversitycreatesbettergroups,firms,schools,andsocieties(3rdEd.).Princeton,NJ:UniversityPress.
Samuels,D.R.(2014).Theculturallyinclusiveeducator:PreparingforaMulticultural
42
world.NewYork,NY:TeachersCollegePress.
Tochluk,S.(2010).Witnessingwhiteness:Theneedtotalkaboutraceandhowtodoit.Lanham,MD:Rowman&Littlefield.nbcvxUniversityofDenver