Embed Size (px)
Citation preview

b
Marcello Milman (55 21 3212 3202) [email protected]
MORE THAN JUST A CYCLE
SWING…
BRAZIL
Espí
rito
Sant
o R
esea
rch
February, 2006 SECTOR: PETROCHEMICAL
Enticing valuations, but sluggish spreads’s improvment
and BRL strengh suggest caution in the short term
1
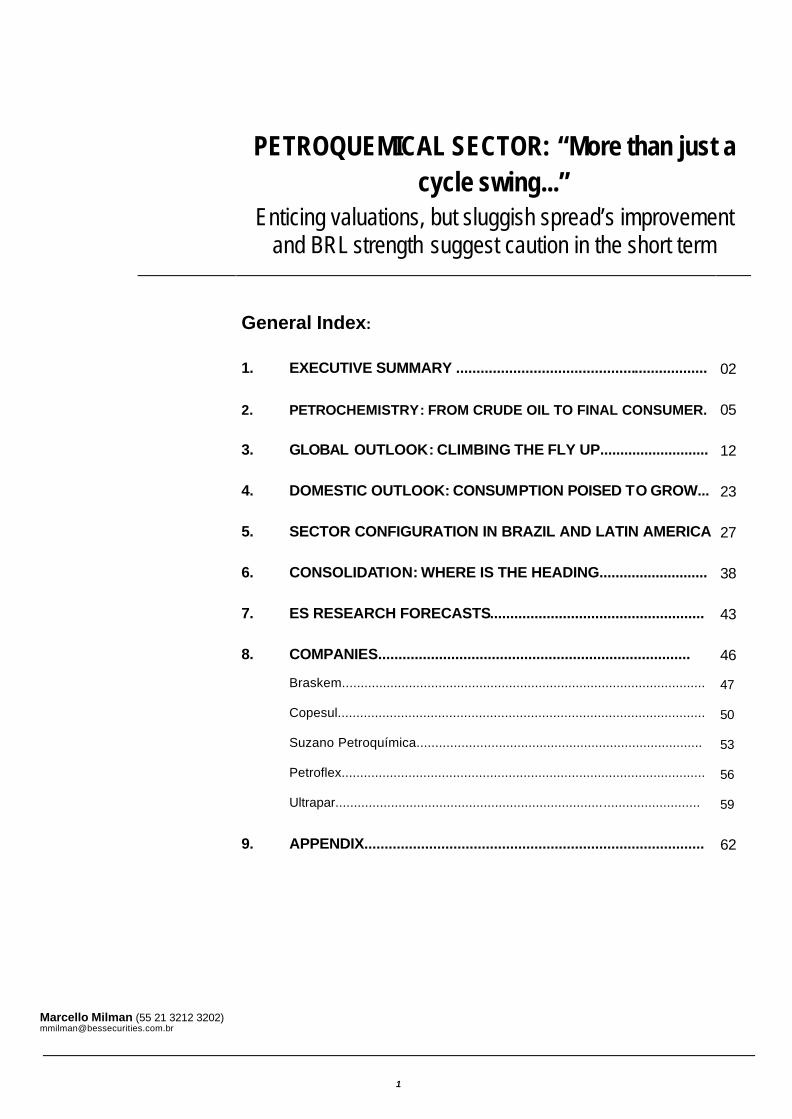
PETROQUEMICAL SECTOR: “More than just a cycle swing...”
Enticing valuations, but sluggish spread’s improvement and BRL strength suggest caution in the short term
General Index:
1. EXECUTIVE SUMMARY .............................................................. 02
2. PETROCHEMISTRY: FROM CRUDE OIL TO FINAL CONSUMER. 05
3. GLOBAL OUTLOOK: CLIMBING THE FLY UP........................... 12
4. DOMESTIC OUTLOOK: CONSUMPTION POISED TO GROW... 23
5. SECTOR CONFIGURATION IN BRAZIL AND LATIN AMERICA 27
6. CONSOLIDATION: WHERE IS THE HEADING........................... 38
7. ES RESEARCH FORECASTS..................................................... 43
8. COMPANIES............................................................................. 46
Braskem.................................................................................................. 47
Copesul................................................................................................... 50
Suzano Petroquímica............................................................................. 53
Petroflex.................................................................................................. 56
Ultrapar........................................................................ .......................... 59
9. APPENDIX.................................................................................... 62
Marcello Milman (55 21 3212 3202) [email protected]

2
Petrochemical Sector, Feb-06
1. EXECUTIVE SUMMARY In this report we try to provide investors, whether they have minimal or extensive previous knowledge of the sector, with an overall view of the petrochemical industry. It goes beyond a simple discussion of the cycle in order to enrich our industry’s coverage. We emphasize the sector’s key features in Brazil, such as: leading companies, corporate structures, growth strategies, production capacities, and market stance on each of main products. We reckon the sector to have an increased relevance on investors’ radars in the coming years. Therefore, the time is ripe to present our views on the consolidation process that the industry may (and should) undergo, as well as our assessment of the cycle, given rencent numerous diverging arguments surrounding the fly-up, which have been impacting the performance of the sector’s shares.
Over the course of our analysis, we elaborate the following issues:
♦ The cyclical nature of the industry, with peaks (denominated fly-ups) influenced by escalations in global capacity utilization rates, and duration of 7-10 years. Our estimates indicate that operating rates remain north of 90% until 2008E, supporting a extended upcycle view, in part propelled by China’s continued net importer position. We thus look for PE/naphtha spreads over the US$600/ton mark by 2008E (vs. US$448/ton in 2003) and for those of PP to inch even higher;
♦ The profitability peak of this current cycle will likely be less pronounced due to the high price of crude oil, which raises end-product prices (suppressing demand), to the structural reduction in the industry’s average cash cost (greater role of Asian producers), and to the (ill a bit unknown) expansion of the secondary market, also indirectly benefited by soaring crude prices;
♦ This positive global scenario shall be magnified in the domes tic market, where economic development and the still low penetration of resin consumption set the stage for robust sales growth potential. As price takers, domestic companies tend to align their prices in the medium term, charging a 15-20% premium on import parity that helps them make up for higher costs of capital. An unrelenting appetite for expansion is one of key the risks (especially in the PE market) as of 2008E, if most of the planned investment is carried out;
♦ In section 5, we present a description of the sector in Brazil (and in Latin America), listing the major players in each market, commercial trade flows, and details of the leading companies.
♦ It is important to highlight that, particularly in second generation, the domestic industry is still very fragmented, as a legacy of its inception (and privatization). However, consolidation is widely expected, and its first steps have already been taken. We identify Braskem as a leader in this shift: it could take the wheels at Politeno (by severing cross-held ownership with Suzano Petroquímica), and, even more importantly, the Southern Complex could be consolidated if setbacks with Ipiranga can be solved. Suzano Petroquímica is also poised to take a solid role in this process, after having incorporated Polibrasil, possibly stablishing its postion in Petroflex, as well as negotiate with Unipar;
♦ The final part of our report presents a summary of our estimates for the companies covered and discusses some key drivers for the equity markets, as well as specific risks for each business;
♦ Additionally, we have elaborated charts and tables (on page 4 and in the annex), aimed to serve as consultancy base by those seeking to follow the sector more closely.
In terms of trading ideas, we recommend that investors a market weight positions, owing chiefly to the appreciating currency. The BRL rise should continue to impact the companies overall during 2006 (particularly in 1H06), offsetting the benefits of the pick-up in international margins. Beginning in the second half of the year (possibly a little sooner), shares should start reacting to the gradual slide of oil prices, stronger domestic sales volumes, and stabilization of the FX curve.
For those willing to invest in the sector, our top pick is Suzano Petroquímica. We also
3
Petrochemical Sector, Feb-06
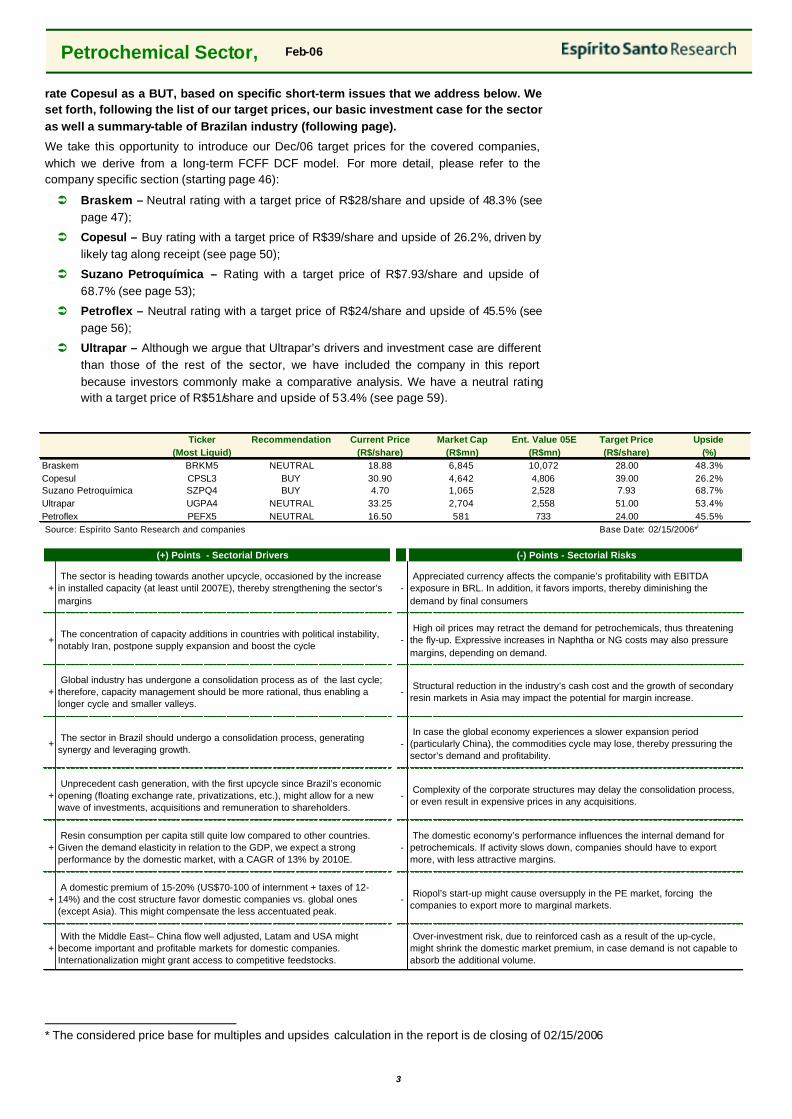
rate Copesul as a BUT, based on specific short-term issues that we address below. We set forth, following the list of our target prices, our basic investment case for the sector as well a summary-table of Brazilan industry (following page).
We take this opportunity to introduce our Dec/06 target prices for the covered companies, which we derive from a long-term FCFF DCF model. For more detail, please refer to the company specific section (starting page 46):
Ü Braskem – Neutral rating with a target price of R$28/share and upside of 48.3% (see page 47);
Ü Copesul – Buy rating with a target price of R$39/share and upside of 26.2%, driven by likely tag along receipt (see page 50);
Ü Suzano Petroquímica – Rating with a target price of R$7.93/share and upside of 68.7% (see page 53);
Ü Petroflex – Neutral rating with a target price of R$24/share and upside of 45.5% (see page 56);
Ü Ultrapar – Although we argue that Ultrapar’s drivers and investment case are different than those of the rest of the sector, we have included the company in this report because investors commonly make a comparative analysis. We have a neutral rating with a target price of R$51/share and upside of 53.4% (see page 59).
Ticker Recommendation Current Price Market Cap Ent. Value 05E Target Price Upside(Most Liquid) (R$/share) (R$mn) (R$mn) (R$/share) (%)
Braskem BRKM5 NEUTRAL 18.88 6,845 10,072 28.00 48.3%Copesul CPSL3 BUY 30.90 4,642 4,806 39.00 26.2%Suzano Petroquímica SZPQ4 BUY 4.70 1,065 2,528 7.93 68.7%Ultrapar UGPA4 NEUTRAL 33.25 2,704 2,558 51.00 53.4%Petroflex PEFX5 NEUTRAL 16.50 581 733 24.00 45.5%Source: Espírito Santo Research and companies Base Date: 02/15/2006*i
(+) Points - Sectorial Drivers (-) Points - Sectorial Risks
+ The sector is heading towards another upcycle, occasioned by the increase in installed capacity (at least until 2007E), thereby strengthening the sector’s margins
- Appreciated currency affects the companie’s profitability with EBITDA exposure in BRL. In addition, it favors imports, thereby diminishing the demand by final consumers
+ The concentration of capacity additions in countries with political instability, notably Iran, postpone supply expansion and boost the cycle
- High oil prices may retract the demand for petrochemicals, thus threatening the fly-up. Expressive increases in Naphtha or NG costs may also pressure margins, depending on demand.
+ Global industry has undergone a consolidation process as of the last cycle; therefore, capacity management should be more rational, thus enabling a longer cycle and smaller valleys.
- Structural reduction in the industry’s cash cost and the growth of secondary resin markets in Asia may impact the potential for margin increase.
+ The sector in Brazil should undergo a consolidation process, generating synergy and leveraging growth.
- In case the global economy experiences a slower expansion period (particularly China), the commodities cycle may lose, thereby pressuring the sector’s demand and profitability.
+ Unprecedent cash generation, with the first upcycle since Brazil’s economic opening (floating exchange rate, privatizations, etc.), might allow for a new wave of investments, acquisitions and remuneration to shareholders.
- Complexity of the corporate structures may delay the consolidation process, or even result in expensive prices in any acquisitions.
+ Resin consumption per capita still quite low compared to other countries. Given the demand elasticity in relation to the GDP, we expect a strong performance by the domestic market, with a CAGR of 13% by 2010E.
- The domestic economy’s performance influences the internal demand for petrochemicals. If activity slows down, companies should have to export more, with less attractive margins.
+ A domestic premium of 15-20% (US$70-100 of internment + taxes of 12-14%) and the cost structure favor domestic companies vs. global ones (except Asia). This might compensate the less accentuated peak.
- Riopol’s start-up might cause oversupply in the PE market, forcing the companies to export more to marginal markets.
+ With the Middle East– China flow well adjusted, Latam and USA might become important and profitable markets for domestic companies. Internationalization might grant access to competitive feedstocks.
Over-investment risk, due to reinforced cash as a result of the up-cycle, might shrink the domestic market premium, in case demand is not capable to absorb the additional volume.
* The considered price base for multiples and upsides calculation in the report is de closing of 02/15/2006

4
Petrochemical Sector, Feb-06
VALUATION
Ticker (most liquid) BRKM5 SZPQ4 UNIP6 CPSL3 PQUN4 UGPA4 PTIP4 PLTO6 (2) PEFX5 Not listed
Market Cap (R$mn) 6,845 1,065 1,243 4,642 1,012 2,704 1,804 331 581 na.
Actual EV (R$mn) 10,072 2,528 1,673 4,806 1,242 2,558 1,804 383 733 na.
Target Price ES Research (R$/share or thousand shares)
28.00 7.93 na. 39.00 na. 51.00 na. 8.70 24.00 na.
Upside 48% 69% na. 26% na. 53% na. 74% 45% na.
EV/EBITDA 2004 5.1 8.8 6.0 4.8 5.3 4.7 na. 2.5 2.0 na.
EV/EBITDA 2005E 4.4 15.4 na. 4.6 na. 4.6 na. 3.0 3.8 na.
CORPORATE DATA
ControllersOdebretch, Norquisa
Suzano Holding (Feffer family)
Geyer family BRKM and IpirangaUnipar, Dow
Chemical, Unigel, Ultrapar, SZPQ
Ultra SA Grupo IpirangaSZPQ, BRKM,
Sumitomo, ItochuSZPQ, BRKM,
UniparSZPQ, Unipar,
Petrobras, BNDES
Relevant ParticipationsPetroflex, Copesul,
Politeno,RioPol, Politeno,
Petroflex
Polietilenos União, Petroflex, RioPol,
PQU and etc.na. Polibutenos Norquisa Copesul Norquisa Norquisa na.
ACTIVITY SUMMARY
ScopeFirst and Second
GenerationsFirst and Second
GenerationsFirst and Second
GenerationsFirst Generation First Generation Second Generation Second Generation Second Generation Second Generation
First and Second Generations
Key ProductsEthylene,
Prophylene, PE, PP, PVC and etc.
PP Several (holding)Ethylene,
Prophylene and etc.Ethylene,
Prophylene and etc.Glicol Ethylene,
SpecialtiesPE, PP PE SBR PE, Prophylene
Chief Inst. Capacities (kton/year)Ethylene = 1.280 Prophylene = 550
Resins = 2.040PP = 625 Several (holding)
Ethylene = 1.135 Prophylene = 585
Ethylene = 500 Prophylene = 250
EO = 312 EG = 310
PE = 550 PP = 150
PE = 360 SBR = 411Ethylene = 520
PE = 540
Main Feedstocks Naphtha Prophylene Several (holding)Naphtha,
CondensedNaphtha Ethylene
Ethylene, Prophylene
EthyleneButadiene and
StyreneEthane and Propane
(Natural Gas)
Center where Performed NE and S All All S SE All S NE All SE
Main SuppliersPetrobras and
CopesulPetrobras and
CrackersPetrobras and
CrackersPetrobras Petrobras Braskem and PQU Copesul Braskem Braskem, Copesul Petrobras
OPERATING HIGHLIGHTS
Volumes 2004 (R$mn) 4,331 490 1,387 2,811 1,536 518 606 336 365 46
Volumes 2005E (R$mn) 4,522 597 na. 2,690 na. 539 na. 359 325 61
Revenues 2004 (R$mn) 11,043 1,610 2,180 5,440 2,700 1,663 1,839 1,119 1,306 149
Revenues 2005E (R$mn) 11,435 1,977 na. 5,449 na. 1,623 na. 1,156 1,349 185
EBITDA 2004 (R$mn) 2,549 238 396 1,070 349 421 323 165 183 2
EBITDA 2005E (R$mn) 1,990 168 na. 1,053 na. 305 na. 126 193 3
Unitary Revenue 2004 (R$/ton) 2,550 3,284 1,572 1,935 1,758 3,209 3,037 3,333 3,578 3,267
Unitary EBITDA 2004 (R$/ton) 589 485 286 380 227 812 533 492 500 43
EBITDA Margin 2004 (%) 23% 15% 18% 20% 13% 25% 18% 15% 14% 1%
CAGR EBITDA 05-08E 9% 37% na. 6% na. 6% na. 3% 1% >100%
ROIC (EBIT) 2004 (%) 27% 12% na. 44% na. 61% na. 22% 26% 0%
For a further detailed operational analyses, please go to the section “ES RESEARCH FORECASTS” (1) We used Ox iteno’s operating data for comparison (2) More liquid shares are of PNB class, with fixed dividends

5
Setor Petroquímico, Feb-06
2. PETROCHEMISTRY: FROM CRUDE OIL TO FINAL CONSUMER *** This chapter presents an introduction to the sector. Those already familiar and/or interested only in the investment recommendations can go directly to page 12 ***
The petrochemical industry derives from the oil and natural gas exploration activity and came out of the economic need of oil companies to amplify the usage of refining process by-products. The procedure comprised by the petrochemical industry is summarized below:
The petrochemical industry derives from the oil...
CHART 01: Petrochemical Production Flow
Source: Espírito Santo Research
The petrochemical inputs derived from oil or natural gas are taken to reactors, which, through the action of heat and pressure, convert the materials into basic petrochemicals, such as Olefins (Ethylene, Propane, Butadiene etc.) and Aromatics (Benzene, Toluene, Xylene, etc.). This process is called cracking and this stage the 1st generation. Ethylene is the building block of the 1st generation, being the most widely produced and consumed product on a global basis.
These basic products have little direct use and are basically inputed as raw materials for the so-called 2nd generation, that processes the Olefins and/or Aromatics through processes such as the Polymerization, yielding thermoplastic resins (such as Polyethylene, Polypropylene and PVC) and chemical by-products such as solvents and rubbers.
Not only internationally speaking but also on a domestic level, the sector players tend to constitute centers (or complexes) to reap logistics synergies, infra-structure and operational integration, thus minimizing costs. It is worth remembering that basic petrochemicals (particularly Ethylene) are normally volatile, of difficult to transportation and storage. The units comprising the Petrochemical Center are, mainly, of the first and second generation and might or migh not by tied in corporate terms. A model very embraced, around the world, is the integrated (such as Braskem, for example, as we shall comment further ahead), so as to capture most part of the chain margins, increasing operational flexibility.
The petrochemical industry is globalized and the majority of its products are traded as commodities, with a great flow of international commerce and the presence of some global players acting in several countries. These agents can be divided into:
♦ Global diversified chemical corporations (BASF, Bayer, DuPont, Dow Chemical etc.) whose petrochemical production is an important line of their portfolios without, however representing their sole businesses;
♦ Petrochemical arms of integrated oil giants’ downstream operations, (Exxon Mobil, BP, Amoco, Royal Dutch/Shell, etc.), including some state-owned companies such as PDVSA (which was recently spun off from Pequiven) and Saudi Aramco (Sabic) among others;
♦ Companies focused on the segment, with regional presence, such as Braskem and some Asian companies
..and its .input is converted into basic petrochemical in the 1st generation. These products are used in the 2nd generation The characteristics of the process tend to agglomerate companies into Petrochemical Centers.
OIL INDUSTRY
Oil and Natural GasExploration
Oil Refining
Processing of Natural Gas
Heavy Cracking
Light Cracking
Production of Resinsand Chemical by-
Products
FIRST GENERATION SECOND GENERATION
Transformationof Products
THIRD GENERATIONOIL INDUSTRY
Oil and Natural GasExploration
Oil Refining
Processing of Natural Gas
Heavy Cracking
Light Cracking
Production of Resinsand Chemical by-
Products
FIRST GENERATION SECOND GENERATION
Transformationof Products
THIRD GENERATION
6
Petrochemical Sector, Feb-06
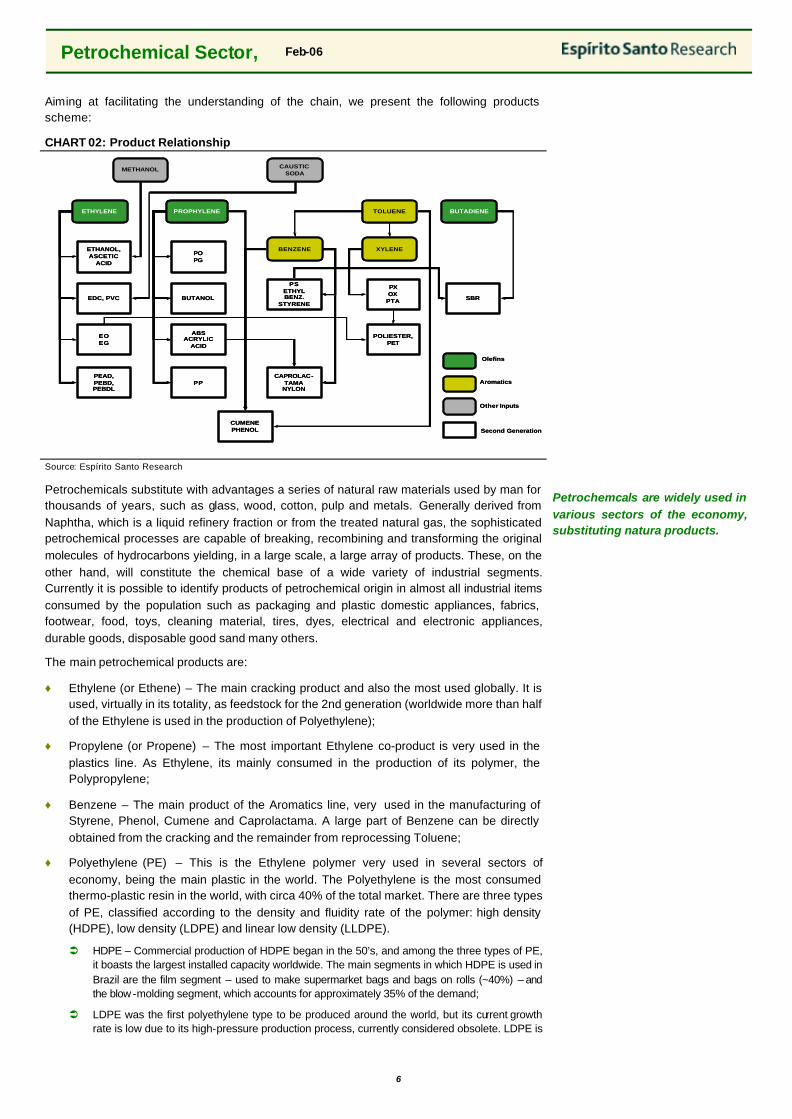
Aiming at facilitating the understanding of the chain, we present the following products scheme:
CHART 02: Product Relationship
Source: Espírito Santo Research
Petrochemicals substitute with advantages a series of natural raw materials used by man for thousands of years, such as glass, wood, cotton, pulp and metals. Generally derived from Naphtha, which is a liquid refinery fraction or from the treated natural gas, the sophisticated petrochemical processes are capable of breaking, recombining and transforming the original molecules of hydrocarbons yielding, in a large scale, a large array of products. These, on the other hand, will constitute the chemical base of a wide variety of industrial segments. Currently it is possible to identify products of petrochemical origin in almost all industrial items consumed by the population such as packaging and plastic domestic appliances, fabrics, footwear, food, toys, cleaning material, tires, dyes, electrical and electronic appliances, durable goods, disposable good sand many others.
The main petrochemical products are:
♦ Ethylene (or Ethene) – The main cracking product and also the most used globally. It is used, virtually in its totality, as feedstock for the 2nd generation (worldwide more than half of the Ethylene is used in the production of Polyethylene);
♦ Propylene (or Propene) – The most important Ethylene co-product is very used in the plastics line. As Ethylene, its mainly consumed in the production of its polymer, the Polypropylene;
♦ Benzene – The main product of the Aromatics line, very used in the manufacturing of Styrene, Phenol, Cumene and Caprolactama. A large part of Benzene can be directly obtained from the cracking and the remainder from reprocessing Toluene;
♦ Polyethylene (PE) – This is the Ethylene polymer very used in several sectors of economy, being the main plastic in the world. The Polyethylene is the most consumed thermo-plastic resin in the world, with circa 40% of the total market. There are three types of PE, classified according to the density and fluidity rate of the polymer: high density (HDPE), low density (LDPE) and linear low density (LLDPE).
Ü HDPE – Commercial production of HDPE began in the 50’s, and among the three types of PE, it boasts the largest installed capacity worldwide. The main segments in which HDPE is used in Brazil are the film segment – used to make supermarket bags and bags on rolls (~40%) – and the blow -molding segment, which accounts for approximately 35% of the demand;
Ü LDPE was the first polyethylene type to be produced around the world, but its current growth rate is low due to its high-pressure production process, currently considered obsolete. LDPE is
Petrochemcals are widely used in various sectors of the economy, substituting natura products.
ETHYLENE PROPHYLENE
CAUSTIC SODA
PEAD, PEBD, PEBDL
BENZENE
BUTADIENE
XYLENE
METHANOL
EOEG
EDC, PVC
ETHANOL, ASCETIC
ACID
PP
ABS ACRYLIC
ACID
BUTANOL
POPG
CUMENE PHENOL
PSETHYL BENZ.
STYRENE
CAPROLAC-TAMA
NYLON
TOLUENE
PXOX
PTA
POLIESTER, PET
SBR
Olefins
Aromatics
Other Inputs
Second Generation
ETHYLENE PROPHYLENE
CAUSTIC SODA
PEAD, PEBD, PEBDL
BENZENE
BUTADIENE
XYLENE
METHANOL
EOEG
EDC, PVC
ETHANOL, ASCETIC
ACID
PP
ABS ACRYLIC
ACID
BUTANOL
POPG
CUMENE PHENOL
PSETHYL BENZ.
STYRENE
CAPROLAC-TAMA
NYLON
TOLUENE
PXOX
PTA
POLIESTER, PET
SBR
Olefins
Aromatics
Other Inputs
Second Generation

7
Petrochemical Sector, Feb-06
generally processed mixed together with LLDPE to produce flexible films for packaging;
Ü LLDPE is a newer product that has a higher demand growth rate than the other Polyethylene. It is very frequently used in the food industry;
♦ Polypropylene (PP) – PP, the Propylene polymer, is the fastest-growing resin around the world due to its diversity of applications, its physical-chemical resistance, easy processing and low density, which is why it is widely used to make plastic films and metal substitutes;
♦ Polyvinyl Chloride (PVC) – PVC is the MVC (monovinyl chloride) polymer that contains EDC (dichloroethane) in its composition. The main difference between PVC and other plastics is that PVC is 55% chlorine (not from the hydrocarbon chain) and only 45% Ethylene. The chlorine is obtained from marine salts, in electrointensive units that separate the chlorine from the caustic soda. PVC is used in rigid installations such as pipes, or in flexible lines;
♦ Polyethylene Terephthalate (PET) – Generated through a combination of other derivatives, such as Paraxylene (PX) and Polyester, PET is widely used to form bottles and packaging material. Initially, the Polyethylene Terephthalate (PET) resin was only used in the textile industry. It was only in the late 70’s that the resin began being used on an industrial scale to produce bottles for the packaging industry in view of several of its characteristics, such as its high mechanical and chemical resistance and its capacity as a barrier against gases and odors, as well as its excellent transparency;
♦ Polystyrene (PS) – Made from Styrene, which is an internationally traded commodity and a intermediate-petrochemical. It is the oldest thermoplastic and is used to make disposable cups, pots and boxes, rigid expanded polystyrene foam (known as Styrofoam) and in electric and electronic appliances. Demand for this product grows at a slower rate than the majority of this chain’s products, and in many cases, it is being replaced by other resins, such as in disposable cups where PP provides a much better solution.
CHART 03: Applications of Petrochemical Products (Brazilian Economy)
Source: Espírito Santo Research and Braskem
The Influence of Feedstocks
It is essential to address the issue of raw materials in order to achieve a better understanding of the sector and the relative attractiveness of the several development opportunities. The following are the principle feedstocks used around the world, the two chief materials being Naphtha and Ethane:
♦ Naphtha – Derived from the refinement of crude oil, it is basically a preliminary fraction of gasoline;
♦ Gasoil – Also a petroleum derivative, gasoil is a intermediary type that is heavier than Naphtha, and can also produce fuels (ex. Diesel);
♦ Condensate – The liquid fraction of the exploration of associated gas, comprised of
The main raw materials can be obtained from crude oil or natural gas...
PEBDL
PEAD
PVC
PP
Food Packings27%
Consumer Goods25%
Civil Construction
19%
PersonalHygiene
11%
Agriculture5%
Autoparts3%
Industrial Utilities2% Others
8%
PEBDL
PEAD
PVC
PP
Food Packings27%
Consumer Goods25%
Civil Construction
19%
PersonalHygiene
11%
Agriculture5%
Autoparts3%
Industrial Utilities2% Others
8%

8
Petrochemical Sector, Feb-06
Oil
Fractioning Tower
Refinary Gas
Naphtha
Gasoline
Kerosene
Diesel and Gasoil
Lubrificants
Oil Fuel
Residue Asphalt
DISTILLED FRACTION:
ATOMS OF C PER
MAIN UTILITIES
1-4
5-9
5-10
10-16
14-20
20-50
30-70
>50
LPG
Petrochemistry
Vehicles
Spurts
Engines of High Power
Waxes
Industrial and Thermogeneration
Asphalt
Pentane, one of the Natural Gas Liquids (NGL’s);
♦ Ethane – One of the components of natural gas, it is the so-called “wet” part that is separated in the processing of the gas;
♦ Propane – Also associated to "wet“ gas, Propane is also a component of LPG. For petrochemical, a mixture containing Ethane and Propane is normally used.
CHART 04: Refining Product Slate
Source: Espírito Santo Research
The range of inputs processed yield a different product slate; however, if we consider the production of Ethylene alone, the natural gas -based crackers provide a better yield, as shown below:
... thereby generating different cost structures and product mixes.
CHART 05: Cracking Mix per Feedstock CHART 06: Ethylene Yield per Feedstock
30% 23%
41%
16%14%
17%24%
20%
7 %
10%
11%7 %
20%13%
31% 27%
81%
2%1%
3%
0 %
20%
40%
60%
80%
100%
Naphtha Ethane (NG) Gasoil LPG (Propane:Butane)
Ethylene Prophylene BTX Butadiene Others
Source: Espírito Santo Research and Suzano Petroquímica Source: Espírito Santo Research
A barrel of oil is equivalent in energy to approximately 5,82mmBTUs or the equivalent in volume to 0,159m3. Therefore, we could assess the competitiveness of each type of cracker (specially Naphtha and Gas), by monitoring that ratio and the relativa price movement. However, this comparison shortcoming is that it does not take into account the output differences, and the additional revenue of rendered by the co-products, that compensate for the higher input-per-unit-of-Ethylene cost.
Gauging this competitiveness along time, strictly regarding Ethylene, the gas cracker will always have the upper hand. However, analyzing the other Naphtha processing coproducts (Propylene, Benzene, Butadiene, etc.), which generate importante incomes to its producers, we empirically include that for rations around/little under 7, the heavy are actually more profitable. This relationship is a simplified way to express the Naphtha-Ethane comparison, which, on the other hand, tends to indicate the relative profitability advantage of the processes.
0.8 tonEteno
Lig
ht
Cra
ckin
g 1.3 tonEthane (70%) + Propane (30%)
Hea
vyC
rack
ing
3.3 tonNaphtha
1.0 tonEthylene
0.2 tonProphylene (principal)
2.3 tonOther Basics
0.8 tonEteno
Lig
ht
Cra
ckin
g 1.3 tonEthane (70%) + Propane (30%)
Hea
vyC
rack
ing
3.3 tonNaphtha
1.0 tonEthylene
0.2 tonProphylene (principal)
2.3 tonOther Basics

9
Petrochemical Sector, Feb-06
CHART 07: Oil vs. Natural Gas CHART 08: Ratio Oil – Natural Gas
0
10
20
30
40
50
60
70
Jul-0
2
Oct
-02
Jan-
03
Apr
-03
Jul-0
3
Oct
-03
Jan-
04
Apr
-04
Jul-0
4
Oct
-04
Jan-
05
Apr
-05
Jul-0
5
Oct
-05
Jan-
06
Oil
- B
ren
t (U
S$/
ton
)
0
2
4
6
8
10
12
14
16
Nat
ura
l Gas
- H
enry
Hu
b
(US
$/M
NB
tu)
Brent Henry Hub
0
1
2
3
4
5
6
7
8
9
10
Jul-0
2
Oct
-02
Jan-
03
Apr
-03
Jul-0
3
Oct
-03
Jan-
04
Apr
-04
Jul-0
4
Oct
-04
Jan-
05
Apr
-05
Jul-0
5
Oct
-05
Jan-
06
Rat
io B
ren
t/H
enry
Hu
b
Source: Espírito Santo Research and Bloomberg Source: Espírito Santo Research and Bloomberg
A competitivity comparison among the 2 main feedstocks should take into account, in addition to profitability, the kinds of returns each cracker can give. As previously mentioned, the petrochemical industry is a capital intensive one, particularly with regards to its 1st generation plants. The investment needed to install an industrial plant easily exceeds US$1bn, not counting secondary investments in the required infrastructure.
Furthermore, the capex to build a Naphtha (heavy) cracker tends to be greater than the cost related to a light one. Therefore, in terms of return on invested capital, a heavy cracker tends to be less efficient despite having, given market conditions (but very often), potentially higher margins.
The investment is close to US$1bn
CHART 09: Investment per Cracker Type (USD per 100kton/year)
200
140
67 70
0
50
100
150
200
250
Naphtha Cracker Gas Cracker PE Plant PP Plant
Source: Espírito Santo Research and Suzano Petroquímica
Based on the previously shown data, we set forth below the theoretical typical cracker FC equations for each type – based on gas and Naphtha – at the current prices in the Asian market. Note that these equations are dynamic and vary constantly according to the behavior of the various commodities involved; however, the analysis we have provided, helps to understand the relative advantages of each process. The analysis shows that at the current price level (1st generation products and inputs), the Naphtha-based cracker has the edge over Gas, even in terms of profitability (ROIC).
Usually, a Naphtha crackers have higher EBITDA margin...
... whereas NG crackers usually achieve a higher EBIT
Currently, heavy crackers have the advantage.
TABLE 01: Cracker Equations Per Type (Nov/05 Base date) –Theoretical EBITDA Margin (per 1ton Input)

10
Petrochemical Sector, Feb-06
Equation Inputs:Prices: Ethane 517 Naphtha 477 Ethylene 731 Prophylene 850 BTX Avg. 639 Butadiene 1,045 Fuel and Utilities Avg. 500
NG Cracker (Ethane)PRODUCTS YIELDS PRICES UNIT PRICE/COST RESULT
Ethylene 81% 731 590Prophylene 2% 850 21BTX 1% 639 5C4 (Butadiene) 3% 1,045 34Fuel and Utilities 13% 500 64REVENUE 714
Revenue Taxes (@2%) (14)
Ethane 100% 517 (517)Other Costs - - (75) CASH COST (592)
GROSS PROFIT (CASH) 107 Gross Margin (Cash) 15%
Operating Expenses (@3% of Revenue) (21)
EBITDA 86 EBITDA Margin 12%
Necessary Investment* 1,400ROIC EBITDA (before taxes) 6%
Naphtha CrackerPRODUCTS YIELDS PRICES UNIT PRICE/COST RESULT
Ethylene 30% 731 222Prophylene 16% 850 137BTX 24% 639 151C4 (Butadiene) 10% 1,045 105Fuel and Utilities 20% 500 100REVENUE 714
Revenue Taxes (@2%) (14)
Naphtha 100% (477) (477)Other Costs - - (70)CASH COST (547)
GROSS PROFIT (CASH) 152 Gross Margin (Cash) 21%
Operating Expenses (@3% of Revenue) (21)
EBITDA 131 EBITDA Margin 18%
Necessary Investment* 2,000ROIC EBITDA (before taxes) 7%
Source: Espírito Santo Research, Unipar and Bloomberg * US$ per ton/year for competitive scale project
CHART 10: Theoretical EBITDA Margins Evolution CHART 11: Competitiveness vs. Oil/Gas Ratio
-20%
-10%
0%
10%
20%
30%
40%
50%
60%
70%
Jul-0
2
Oct
-02
Jan-
03
Apr
-03
Jul-0
3
Oct
-03
Jan-
04
Apr
-04
Jul-0
4
Oct
-04
Jan-
05
Apr
-05
Jul-0
5
Oct
-05
Jan-
06
Naphtha Margin Gas Margin
(2.0)
(1.5)
(1.0)
(0.5)
0.0
0.5
1.0
jul-0
2
out-0
2
jan-
03
abr-
03
jul-0
3
out-0
3
jan-
04
abr-
04
jul-0
4
out-0
4
jan-
05
abr-
05
jul-0
5
out-0
5
jan-
06
0
2
4
6
8
10
12
Cash Margin Differential Ratio Oil/Gas (rig.)
Source: Espírito Santo Research and Bloomberg Source: Espírito Santo Research and Bloomberg

11
Petrochemical Sector, Feb-06
The charts above demonstrate that, in fact, for ratios under 7x, the heavy cracker usually achieves higher margins. Moreover, it is interesting to note the low level of returns obtained in both cases. Note that we considered the results to be consistent with cracker investments in developed markets, where centrals, despite not producing extraordinary returns, tend to achieve or exceed capital costs. Companies turn to integration and synergy to increase profitability (processing cheaper feedstocks at times). In the Brazilian market, in addition to these tools, companies also rely upon premiums (via margin share agreements as demonstrated farther ahead), given that our calculations show that for a premium of close to 10%, the ROICs tend toward an adequate WACC for the sector.
Eyeing Naphtha, the Brazilian industry’s main input, we note that historically the price of the primary international benchmark, the ARA (Amsterdam, Rotterdam and Antwerp) followed a mark-up of 9-10x the price of the Brent barrel. Recently, the overwhelming advance of crude oil, has given rise to comments from industry players that this 9x correlation would have been broken, as it currently hovers close to 8x, softening the effects of oil price increases on the sector.
In reality, this rate is a simplistic representation of what we call the Naphtha refining spread. By multiplying the oil barrel price by 7.33, in order to convert US$/bbl into US$/ton, we derive the margin/ton for Naphtha, which historically has been between US$30-100/ton, and generally close to US$70/ton. The maintenance of that 9-10x ratio would necessarily entail in an increase in the Naphtha refinement margin, simply due to the increase in oil prices, at a proportion of approximately US$9/ton for every US$1 in the price of a barrel, which does not appear very reasonable. The supply-demand for the derivative, as well as the behavior of substitutes, are the factors that govern this spread (US$/ton). This spread has remained relatively constant, when not in decline, partly due to the fact that the demand for Naphtha hasn’t grown as much as the demand for other derivatives, as well as the fact that the cracking capacity has not been expanding significantly. Nevertheless, with crude oil prices nearing US$70/bbl (or US$513/ton), the Naphtha margin tends to represent proportionally less, hence the Brent/ARA ratio also tends to ease. The recent contraction of this ratio coincides with the compression of light oil refining margins around the world, and we do not see much room for this ratio to drop any further.
The ARA Naphtha has been detaching itself from Brent crude oil, since the refining spread does not follow rising oil prices...
The margin/ton for Naphtha tends towards USD70/ton
CHART 12: Naphtha (ARA) vs. Oil (Brent)
0
100
200
300
400
500
600
700
jan-
98
jul-9
8
jan-
99
jul-9
9
jan-
00
jul-0
0
jan-
01
jul-0
1
jan-
02
jul-0
2
jan-
03
jul-0
3
jan-
04
jul-0
4
jan-
05
jul-0
5
jan-
06
Oil
and
Nap
hth
a (U
S$/
ton
)
0
2
4
6
8
10
12
14
Rat
io B
ren
t/A
RA
ARA Brent Ratio (x)
Source: Espírito Santo Research and Bloomberg

12
Petrochemical Sector, Feb-06
3. GLOBAL OUTLOOK: CLIMBING THE FLY UP ? Cyclicality
The industry is cyclical in nature as it is influenced by the global economy’s expansion cycles and because of its investment-profitability dynamics. Petrochemical plants are complex facilities that take approximately 4-5 years to start-up and require a massive amount of investments. During the high-profitability phase, normally on the back of upbeat global economies, large capacity additions are made, which for times had been delayed until market conditions allowed for the proper cash generation and the required stimulus for such investments to occur. These investments are sometimes sizable enough to alter the supply/demand balance, thus causing prices to drop when they coincide in terms of becoming operational.
The petrochemical sector has historically been marled by distinct phases of profitability, or cycles, which usually last from 7 to 10 years.
♦ Peaks: Such peaks are marked by elevated use rates, with demand driven by global growth, attaining the effective installed capacity (discounting the portion out of operations). The Ethylene-Naphtha spread can reach the US$700/ton or more mark in accentuated peak periods;
♦ Throughs: With the start-up of newly-constructed plants, coinciding or not with periods of subdued GDP growth, prices dwindle, tightening margins, which converge to production costs. Such level is historically close to US$100/ton over Naphtha for Ethylene, but could potentially reach levels even lower than that, as more low-cost producers enter the market (ex. United Arab Emirates), as we’ll explore further ahead.
The industry is cyclical in nature as it is influenced by the global economy’s cycles, and the dynamic of profitability and investments.
CHART 13: Historic Cash Margin of the American Petrochemical Industry - Index
100
– 82
Bas
e In
dex
= 10
0
Source: Espírito Santo Research and Braskem (orig. Nexant)
Demand
The global economy has demonstrated its resiliency over recent years, with global growth reaching 5.1% in 2004, the highest level in 3 decades. According to its latest global study, released in a recent report, the IMF expects a reasonably healthy rate of growth in 2005 and 2006, despite increasing risks, with the oil crisis and global payment imbalances. In the better part of the industrialized world, inflation once again appears to be under control, despite rising fuel prices, not to mention the beneficial conditions of the capital markets, which support the idea that global growth is well sustained. For the upcoming years, beyond 2006, the IMF expects world GDP growth rate to remain stable at around 4.0-4.5% until 2010, sustained by China, India, Japan, and possibly the US, and maybe even Brazil (?). In our projections, we conservatively consider a lower pace of growth, closer to the inferior band of this range.
This recent recovery of global expansion, with above-average GDP growth, and primarily, the booming Chinese economy, has caused the demand for various commodities (illustrated in
The global economy has grown in recent years (+5.1% in 2004) The IMF estimates that the world GDP’s evolution will continues to be ~ 4.0-4.5% up to 2010, The demand for commodities has increased...
450
400
350
300
250
200
150
100
50
0 1975
1980 1985 1990 1995 2000 2005
9 years 7 years 10 years

13
Petrochemical Sector, Feb-06
chart 15 below), such as several metals, ore and oil, including petrochemicals, to pick up. This demand boost has driven global capacity utilization rates up, and hence spreads and prices.
CHART 14: GDP Growth in Various Regions CHART 15: Global GDP vs. Commodities*
World
Indust.
GEM
USA
China&India
Latam
-4%
-2%
0%
2%
4%
6%
8%
10%
12%
1Q96
3Q96
1Q97
3Q97
1Q98
3Q98
1Q99
3Q99
1Q00
3Q00
1Q01
3Q01
1Q02
3Q02
1Q03
3Q03
1Q04
3Q04
1Q05
3Q05
1Q06
3Q06
World Indust. GEM USA China&India Latam
0%
1%
2%
3%
4%
5%
6%
7%
1Q97
3Q97
1Q98
3Q98
1Q99
3Q99
1Q00
3Q00
1Q01
3Q01
1Q02
3Q02
1Q03
3Q03
1Q04
3Q04
1Q05
3Q05
-70%
-50%
-30%
-10%
10%
30%
50%
70%
90%
110%
130%
150%
Global GDP (left) Ind. Commodities Index Brent
Source: Espírito Santo Research and IMF Source: Espírito Santo Research, IMF and Bloomberg * Goldman Sachs Index
In this scenario, we expect that the demand for petrochemical products will evolve steadily, even without major increases in the level of consumption per capita. Assuming an elasticity of around 1.1x (below the recent historic average of ~1.3x), we estimate that the global Ethylene market, driven by the demand for its derivatives (the primary derivative being PE), will grow 4.6%p.a. until 2010E (the same average witnessed since 1986), or the equivalent to 5,000 kton/year. In our assessment, we mostly refer to Ethylene as it is the product most produced and used, and is the industry’s building block on a global scale.
We expect the demand for Ethylene will have a CAGR of 4,6% by 2010E
CHART 16: GDP Evolution vs. Ethylene Demand CHART 17: Ethylene and PE Demand – HDPE+LDPE+LLDPE (mn tons)
0%
1%
2%
3%
4%
5%
6%
7%
8%
9%
10%
1987
1989
1991
1993
1995
1997
1999
2001
2003
2005
E
2007
E
2009
E
-
0.2
0.4
0.6
0.8
1.0
1.2
1.4
Global GDP Ethylene Demand Avg. Elasticity
-
20
40
60
80
100
120
140
160
1996
1997
1998
1999
2000
2001
2002
2003
2004
2005
E
2006
E
2007
E
2008
E
2009
E
2010
E45%
47%
49%
51%
53%
55%
57%
59%
61%
63%
65%
Ethylene Polyethylene % Consumed
Source: Espírito Santo Research and IMF Source: Espírito Santo Research, IMF and Bloomberg
Supply
The global Ethylene capacity as of 2004 was of approximately 112mm ton (in 2005E should close at 116mm ton). According to a CMAI consultants (Chemical Markets Associates Inc.) survey, which maps capacity expansion projects throughout the world, in 2006E around 7mm tons (or ~6%) should be added. As for 2007E and 2008E, the expansions should be respectively 5% and 3%, and in the period between 04-10E, the expansions CAGR should reach 5%, leading up to 150mm tons of installed capacity
Most part of the capacity additions are expected in Asia, more precisely in the Middle East, which should respond for approximately half the new capacity. China, destination of most part of this additional Ethylene, with its buoyant consumer market, should also contribute with a good part of the expansions. The rationale behind this clear change in the axle of the global petrochemical industry is to take advantage of attractive raw materials, supplied by the Middle East (for e.g. while in the USA natural gas used to obtain Ethylene is sold at US$7-9/MMBtu, in the Middle East it costs some US$2/MMBtu), apart from lower production costs and the
The global capacity was ~112mn tons in 2004 and should end at 116mn tons in 2005E CAGR 04-10E estimated at 5%, attaining 150mn tons More of the additions are in Asia... ... seeking Middle-Eastern raw materials to supply Chinese growth

14
Petrochemical Sector, Feb-06
proximity with a fast growing market.
In the Middle East, we consider Iran to be case of its own. According to CMAI’s projections, more than 7mm tons of additional Ethylene capacity are expected in the country. In the past, there were significant delays in the effective start-up in relation to what had been initially planned, even regarding small plants in the country. Additionally it is worth reminding that a new government took the country in 2005, which can affect the schedule of these investments in two fronts: (i) radical religious positions which increases the perception of investments risk by western partners; (ii) a more nationalist policy, favoring social investments and demanding a greater level of national (less skilled) participation in the projects.
Another important datum is that the majority of the planned expansion project contemplates the use of natural gas as illustrated in chart 19. With that in mind, the trend is for the Propylene market and its by-products seems even more upbeat than that of Ethylene.
Part of the capacity, from Ira, may be delayed The greater part of the expansions should be in NG crackers
Table 02: Installed Capacity Worldwide– Per Region Region Ethylene PE PP PE/EthyleneMiddle East 10.9 7.2 2.5 66%SE Asia 31.1 21.4 16.9 69%Latam 6.2 4.0 2.4 64%Europe 29.8 19.0 12.0 64%North of America 32.3 19.0 9.1 59%Africa/ Others 1.3 0.8 0.7 64%Total 111.6 71.3 43.6 64%
Source: Espírito Santo Research, CMAI and Polymerupdate
CHART 18: Worldwide Distribution of Ethylene Production (% and mn tons)
13 13 11 12 14 14 15 16 17 16 17 18 19 19 20 21 22 23 27 25 26 23 24 23 25
11 1110 12 13
12 13 14 15 14 14 15 16 16 17 18 18 1819
19 2020 20 21 21
4 44 4 4
4 4 5 5 6 6 6 6 6 6 7 77
78 7
7 7 7 8
8 9 9 11 12 13 15 16 18 18 19 19 21 22 24 24 26 29 2934 37
41 44 47 49
0%
20%
40%
60%
80%
100%
1980 1982 1984 1986 1988 1990 1992 1994 1996 1998 2000 2002 2004
USA Western Europe Japan Rest of the World
The industry’s central axis is shifting to Asia...
Source: Espírito Santo Research and SRI
Chart 19: Global Cracking Capacity Additions – Up to 2010E (000 tons/year)
-
5,000
10,000
15,000
20,000
25,000
Africa Europe America Asia Others Middle Eastern
Naphtha/ Other Liquid Loads Ethane/ Other Gaseous Loads
Source: Suzano Petroquímica (orig. Nexant)
15
Petrochemical Sector, Feb-06
Projection Model for the Operating Rates
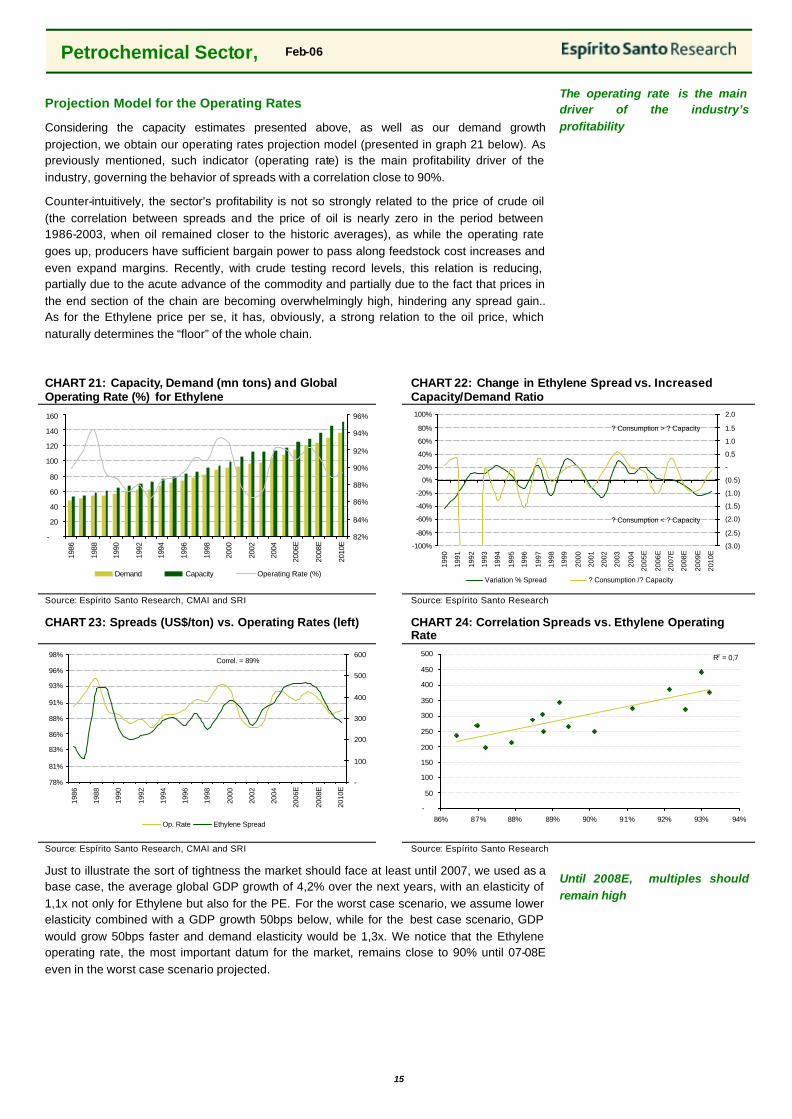
Considering the capacity estimates presented above, as well as our demand growth projection, we obtain our operating rates projection model (presented in graph 21 below). As previously mentioned, such indicator (operating rate) is the main profitability driver of the industry, governing the behavior of spreads with a correlation close to 90%.
Counter-intuitively, the sector’s profitability is not so strongly related to the price of crude oil (the correlation between spreads and the price of oil is nearly zero in the period between 1986-2003, when oil remained closer to the historic averages), as while the operating rate goes up, producers have sufficient bargain power to pass along feedstock cost increases and even expand margins. Recently, with crude testing record levels, this relation is reducing, partially due to the acute advance of the commodity and partially due to the fact that prices in the end section of the chain are becoming overwhelmingly high, hindering any spread gain.. As for the Ethylene price per se, it has, obviously, a strong relation to the oil price, which naturally determines the “floor” of the whole chain.
The operating rate is the main driver of the industry’s profitability
CHART 21: Capacity, Demand (mn tons) and Global Operating Rate (%) for Ethylene
CHART 22: Change in Ethylene Spread vs. Increased Capacity/Demand Ratio
-
20
40
60
80
100
120
140
160
1986
1988
1990
1992
1994
1996
1998
2000
2002
2004
2006
E
2008
E
2010
E
82%
84%
86%
88%
90%
92%
94%
96%
Demand Capacity Operating Rate (%)
-100%
-80%
-60%
-40%
-20%
0%
20%
40%
60%
80%
100%
1990
1991
1992
1993
1994
1995
1996
1997
1998
1999
2000
2001
2002
2003
2004
2005
E
2006
E
2007
E
2008
E
2009
E
2010
E
(3.0)
(2.5)
(2.0)
(1.5)
(1.0)
(0.5)
-
0.5
1.0
1.5
2.0
Variation % Spread ? Consumption /? Capacity
? Consumption > ? Capacity
? Consumption < ? Capacity
Source: Espírito Santo Research, CMAI and SRI Source: Espírito Santo Research
CHART 23: Spreads (US$/ton) vs. Operating Rates (left) CHART 24: Correlation Spreads vs. Ethylene Operating Rate
78%
81%
83%
86%
88%
91%
93%
96%
98%
1986
1988
1990
1992
1994
1996
1998
2000
2002
2004
2006
E
2008
E
2010
E
-
100
200
300
400
500
600
Op. Rate Ethylene Spread
Correl. = 89%
R2 = 0,7
-
50
100
150
200
250
300
350
400
450
500
86% 87% 88% 89% 90% 91% 92% 93% 94%
Source: Espírito Santo Research, CMAI and SRI Source: Espírito Santo Research
Just to illustrate the sort of tightness the market should face at least until 2007, we used as a base case, the average global GDP growth of 4,2% over the next years, with an elasticity of 1,1x not only for Ethylene but also for the PE. For the worst case scenario, we assume lower elasticity combined with a GDP growth 50bps below, while for the best case scenario, GDP would grow 50bps faster and demand elasticity would be 1,3x. We notice that the Ethylene operating rate, the most important datum for the market, remains close to 90% until 07-08E even in the worst case scenario projected.
Until 2008E, multiples should remain high

16
Petrochemical Sector, Feb-06
Chart 25: Evolution of Global Installed Ethylene Capacity (mn tons) vs. Operating Rate (%)
Chart 26: Evolution of Global Installed Polyethylene Capacity (mn tons) vs. Operating Rate (%)
80%
82%
84%
86%
88%
90%
92%
94%
96%
1999 2000 2001 2002 2003 2004 2005E 2006E 2007E 2008E
Ope
ratin
g Ra
te (%
)
-
20
40
60
80
100
120
140
160
Capa
city
(mn
ton)
Capacity Base Case Best Case Worst Case
78%
81%
83%
86%
88%
91%
93%
96%
98%
1999 2000 2001 2002 2003 2004 2005E 2006E 2007E 2008E
Op
erat
ing
Rat
e (%
)
-
10
20
30
40
50
60
70
80
90
100
Cap
acit
y (m
ton
)
Capacity Base Case Best Case Worst Case
Source: Espírito Santo Research and CMAI Source: Espírito Santo Research and CMAI
The start of the cyclical downturn is expected for 2008E, and should last until 2010-2011E, but this will depend on the intensity of the new investments being made, particularly in the Middle East, and the performance of the Asian and US economies. Geo-political uncertainties in the Middle East (such as the election of the new Iranian Government) may delay the investment schedule considerably.
A few global consulting firms that focus on the sector are projecting that in this upcycle, as opposed to previous ones, capital discipline will be stronger, which may result in a less pronounced margin downturn as of 2008-2010E. One of the main reasons for this discipline belief is the fact that the worldwide petrochemical sector has consolidated considerably, which, albeit makes sense, might be a little premature (and aggressive) to include in our projections.
The general impression we get is that the excessive supply, on a global scale, shouldn’t pose a threat to a fly-up, since capacity increases, at least until 2008E, appear to be (at least) adjusted to the expected increase in demand. Therefore, operating rates should remain high, starting from an already quite strong level in 2004. Based on the figures set forth previously, we envision a sound upswing in margins in 2004-2008E (with spreads over USD400/ton for Ethylene and USD600/ton for PE throughout the period), which, despite not representing an overly sharp peak (slightly lower than the 2H04 level), it may hold steady (and quite profitable) for a relatively prolonged period of time.
Does this mean we are extremely optimistic regarding the sector worldwide in the medium term? No. Although our calculations indicate that the hypothesis of a plateau is feasible, we indeed include a through from 2009E. One of the reasons for this is the small degree of predictability regarding future capacity increases from 08E on, particularly in Middle East and China. Historically, the industry has underestimated capacity increases, and as a result, has consistently over-invested.
Below, we present our outlook for the price of the principal commodities of importance to the sector’s assessment, including resins, basic products and raw materials:
The start of the cyclical downturn is expected for 2009-2011E, but this will depend of made investments intensity
The cyclical downturn may be blander...
Supply excess is not a real threat to the fly-up...
... the spread should remain above US$400/ton until 2008E
The plateau is feasible. However, the sector historically underestimated the capacity additions over the medium term

17
Petrochemical Sector, Feb-06
TABLE 03: ES Research Petrochemical Product Forecasts Annual Averages 2002 2003 2004 2005E 2006E 2007E 2008E 2009E 2010E 2011E 2012E 2013E 2014E 2015EOil - Brent (US$/bbl) 25.01 28.55 38.00 54.88 53.00 45.00 40.00 33.00 32.00 32.00 32.00 32.00 32.00 32.00 Naphtha - ARA 223 280 382 470 452 395 358 307 300 300 300 300 300 300 Ethane - US Gulf 192 292 373 434 425 364 329 282 275 275 275 275 275 275 Ethylene* 450 548 811 923 915 863 790 642 577 570 574 605 632 640 Prophylene* 425 506 742 899 913 879 815 665 598 590 594 626 655 662 Polyethylene (Avg.) 613 727 1,024 1,113 1,100 1,047 958 800 732 724 728 761 790 798 PEAD* 549 686 947 1,044 1,041 990 906 757 692 685 688 720 747 755 PEBD* 749 868 1,172 1,278 1,215 1,156 1,057 883 808 799 803 840 872 881 PEBDL* 541 628 951 1,017 1,046 995 910 761 696 688 692 723 751 758 PolyProphylene* 598 704 952 1,085 1,108 1,097 1,015 863 799 792 798 833 865 874 Spreads (Cash Margins) 2002 2003 2004 2005E 2006E 2007E 2008E 2009E 2010E 2011E 2012E 2013E 2014E 2015EEthylene-Naphtha (1st. Generation) 227 269 428 453 463 468 431 335 278 270 274 305 333 340 Prophylene-Naphtha (1st. Generation) 203 226 360 430 461 484 457 358 298 290 294 327 355 363 PE-Ethylene 163 179 213 191 186 185 168 158 154 154 154 156 158 158 PP-Prophylene 172 198 209 186 195 218 200 198 202 202 204 207 210 212 PE-Naphtha 390 448 641 644 648 652 599 493 432 424 428 461 490 498 PP-Naphtha 375 424 569 616 656 702 657 556 500 493 498 534 565 575 Ratios 2002 2003 2004 2005E 2006E 2007E 2008E 2009E 2010E 2011E 2012E 2013E 2014E 2015EEthylene/Prophylene 1.06 1.08 1.09 1.03 1.00 0.98 0.97 0.97 0.97 0.97 0.97 0.97 0.97 0.97 Naphtha/Ethane 1.16 0.96 1.02 1.08 1.06 1.08 1.09 1.09 1.09 1.09 1.09 1.09 1.09 1.09 Source: Espírito Santo Research and Bloomberg * Average of Asian, American and European markets, when available
CHART 27: Basic Products Price (USD/ton) CHART 28: Thermoplastic Resins Price (US$/ton)
-
200
400
600
800
1,000
1,200
1Q02
4Q02
3Q03
2Q04
1Q05
4Q05
E
3Q06
E
2Q07
E
1Q08
E
4Q08
E
3Q09
E
2Q10
E
1Q11
E
4Q11
E
3Q12
E
2Q13
E
1Q14
E
4Q14
E
3Q15
E
Naphtha - ARA Ethylene Prophylene
-
200
400
600
800
1,000
1,200
1,400
1,6001Q
02
4Q02
3Q03
2Q04
1Q05
4Q05
E
3Q06
E
2Q07
E
1Q08
E
4Q08
E
3Q09
E
2Q10
E
1Q11
E
4Q11
E
3Q12
E
2Q13
E
1Q14
E
4Q14
E
3Q15
E
PEAD PEBD PEBDL PP
Source: Espírito Santo Research Source: Espírito Santo Research
CHART 29: Basic Products Spreads (USD/ton) CHART 30: Resins’ Spreads (USD/ton)
-
100
200
300
400
500
600
1Q02
3Q02
1Q03
3Q03
1Q04
3Q04
1Q05
3Q05
E
1Q06
E
3Q06
E
1Q07
E
3Q07
E
1Q08
E
3Q08
E
1Q09
E
3Q09
E
1Q10
E
3Q10
E
1Q11
E
3Q11
E
1Q12
E
3Q12
E
1Q13
E
3Q13
E
1Q14
E
3Q14
E
1Q15
E
3Q15
E
Prophylene - Naphtha Ethylene - Naphtha
-
100
200
300
400
500
600
700
800
1Q02
3Q02
1Q03
3Q03
1Q04
3Q04
1Q05
3Q05
E
1Q06
E
3Q06
E
1Q07
E
3Q07
E
1Q08
E
3Q08
E
1Q09
E
3Q09
E
1Q10
E
3Q10
E
1Q11
E
3Q11
E
1Q12
E
3Q12
E
1Q13
E
3Q13
E
1Q14
E
3Q14
E
1Q15
E
3Q15
E
PE - Naphtha PP - Naphtha Source: Espírito Santo Research Source: Espírito Santo Research
Risks
If oil prices remain at current soaring levels for a prolonged period of time, it may halt global growth, as the most part of consumer income is spent in fuel-related expenditures (transportation, energy, and heating, etc.), in addition to favoring the implementation of substitutes for plastics. Therefore, the demand for such products would be smaller, which would reduce the potential for margin expansion, thereby reducing operating rates, this being
The high in oil prices may decrease the world demand, thus creating a risk to the fly up.

18
Petrochemical Sector, Feb-06
the biggest threat to a fly-up. Current market conditions, which we’ll discuss later on, suggest that the all-time high level of feedstock prices has prevented a more substantial expansion of margins, even though the simple S/D imbalance could ustifiy bigger spreads.
Another issue that hovers over the sector, and more specifically over the prospect of favorable prices for producers, is the trajectory of global growth and especially the rate of China’s landing. China is currently the major driver of the global petrochemical commodities market (responsible for 50-60% of global resin imports), and, if it begins to show sign of slowing down (including any changes in economic policy) or if it implements policies that entail in inventory buying schedule oscillations (which it does for times), it may hamper the sector’s level of profitability. Specifically in Brazil, the “Chinese Threat” comes in another form: producers in that region, as previously mentioned, benefit from almost unmatchable competitiveness, and the appreciated exchange rate facilitates further the local market’s supply of such products, thereby affecting end demand. We will discuss the Chinese industry in greater detail further on.
As previously mentioned, the global petrochemical gameboard is currently being rearranged, with a clear shift towards Asia. This being the case, it is expected that the cash cost will fall, since the proportion of low-cost producers, like the Middle Eastern and Chinese, will increase. The effect of such trend may be the shrinkage of average global spreads, when gauged for those producers that run less competitive inputs (such as Naphtha ARA, for example) in their plants. In terms of cash cost, Brazil is on a similar level to that of the more competitive European producers (still better than global average); therefore, it is in a better shape than more than half the worldwide aggregated capacity. In any case, this is another aspect that will probably reduce the intensity of the margin peak in this high cycle.
Global and China’s growth can threaten resins’ demand In Brazil, the threat is the overwhelming influx of transformed products from China The global average cash cost is falling and can reduce the spreads for less competitive producers
CHART 31: Global Ethylene Production Costs - Geographical Comparison
0
100
200
300
400
500
600
Middle Eastern SE of Asia Latam Europe North of America
0%
20%
40%
60%
80%
100%
120%
Cash Cost/ton % of World Capacity (rig.)
Source: Espírito Santo Research and SRI
Lastly, we must point out one final risk that has largely escaped the market’s radar: the growth in the plastic recycling market (secondary). This market is still relatively small, focusing primarily on PET and HDPE, due to certain technical difficulties involving the separation and cleansing of less rigid plastics. Collecting recycled products (including plastics and paper, among others) is quite developed in Asia, taking advantage of a vast network of collectors among the poorer populations. PE recycling has also increased substantially and may cause a fall in the demand for PE products, especially when the end prices are throguh the roof
The proportion of recyclable plastics is considerably less today than those found for aluminum or glass, due mainly to a lesser range of uses for the product. As a result, the price for secondary products tends to be less than for primary products. However, when elevated oil prices force price increases along the petrochemical chain, a proliferation in the plastics market then becomes more economically viable.
Growth of secondary market: recycling

19
Petrochemical Sector, Feb-06
Why Has This Scenario Remained Elusive?
Since the beginning of 2004, all projections appeared fairly upbeat on the worldwide petrochemical front, despite the fact that the primary raw material (oil) continued to be a worrisome point. This belief was finally corroborated with the rise in prices and margins in the main products at the end of that year.
During 2H04, there were heavy stock build-ups in China in anticipation of higher crude prices and derivatives that propelled prices upwards and created expectations (to some extent unrealistic) that the petrochemical market was heading for exceptionally strong margins sooner than the most optimistic of fly-up projections had initially indicated, as we can see in table 34. In reality, the oscillations in Asian transformer inventories were the one variable overlooked. Just as the spread widening was overly sharp during 2H04, the correction (as we will explain below) was also markedly exaggerated, alarm ing the international community that soon began to dispute the notion that the sector would actually undergo a fly-up at all. Along the same line, investors began contemplating that the fly-up, with respect to margin peaks, would take place in 2004 rather than the inittally-expected 2006.
In the 2H04, there was a process of stock-buildup which increased demand and elevated prices... ... giving the impression that the fly-up would be greater and would occur sooner
CHART 32: Petrochemical Prices in SE of Asia (US D/ton)
CHART 33: Spreads in SE of Asia (USD/ton)
CHART 34: Recent Trend – PEBD Spread in Asia (US D/ton)
-
200
400
600
800
1,000
1,200
1,400
1,600
Jan-
02
May
-02
Sep
-02
Jan-
03
May
-03
Sep
-03
Jan-
04
May
-04
Sep
-04
Jan-
05
May
-05
Sep
-05
Jan-
06
HDPE LDPE PP Ethylene Prophylene
-
200
400
600
800
1,000
1,200
Jan-
02
May
-02
Sep
-02
Jan-
03
May
-03
Sep
-03
Jan-
04
May
-04
Sep
-04
Jan-
05
May
-05
Sep
-05
Jan-
06
HDPE LDPE Ethylene Prophylene PP
-
200
400
600
800
1,000
1,200
Jul-0
3
Sep
-03
Nov
-03
Jan-
04
Mar
-04
May
-04
Jul-0
4
Sep
-04
Nov
-04
Jan-
05
Mar
-05
May
-05
Jul-0
5
Sep
-05
Nov
-05
Jan-
06
Source: Espírito Santo Research and Bloomberg Source: Espírito Santo Research and Bloomberg Source: Espírito Santo Research
With the end of the stock build-up phase in November of 2004, the first inventory correction movement began, significantly pressuring the price of resins and affecting the 4Q04 results in the sector. Prices, however, did eventually begin to recover their upward trend at the end of Jan/05 with the return of the Chinese to the market, once again carrying inventories beyond the normal.
In Mar/05 Chinese traders began a second, and more marked stock correction (or rather clearance) that resulted in a profound reduction in the apparent Ethylene consumption of that country, turning China to a net exporter status. Such movement initially took Ethylene prices back to Jun/04 lows, with thermoplastic resins to follow suit soon after. That effect was magnified by the start-up of two plants in the region, adding capacity of 1,600 ktons/year. Though in itself not a significant number when compared to the total global capacity of approximately 112-114mn tons per year, it did contribute to the deterioration of the market and consequently had an effect on the results of 2Q05 as well as the sector’s shares pricing around the world.
In summary, it seems clear to us that the implosion of petrochemical prices, particularly in Asia, was a combination of an unforeseen variation in Chinese demand coupled with an erroneous reading of the market on the part of producers in the region who lapsed in their production discipline and kept their output elevated.
In the 1H05, China there was heavy inventory clearances, causing China to become a net exporter of Ethylene, thereby reducing prices and margins in Asia Weak 1H05 prices = stock correction + little production discipline +weak primary demand
20
Petrochemical Sector, Feb-06
CHART 35: Net Imports vs. Ethylene Spread – China Effect
CHART 36: Apparent Resin Consumption and Ethylene Consumption in China (ktons)
0
100
200
300
400
500
600
700
800
900
Dec
-03
Jan-
04
Feb
-04
Mar
-04
Apr
-04
May
-04
Jun-
04
Jul-0
4
Aug
-04
Sep
-04
Oct
-04
Nov
-04
Dec
-04
Jan-
05
Feb
-05
Mar
-05
Apr
-05
May
-05
Jun-
05
Jul-0
5
Aug
-05
Sep
-05
US
$/to
n
(25)
(20)
(15)
(10)
(5)
0
5
10
15
20
25
kto
ns
Net Importations (rig.) Korean Ethylene Price
810 8 2 3 883742 739724 778 775788 7716 8 6 758 7767947029 2 7 828 7789591,0031,0229 9 1
6 6 8 6 2 9660
6 8 96 3 65966 4 16076 2 76 2 5
6 3 5649 618 5 8 7
556
672639 641
708 735 751 7 6 0
510 557627
6 0 36 0 2560
572 5 6 8 5 6 5593545
614 5 9 9 5 8 56 3 2
6 9 0623 5 9 4
6 0 06 3 5 6 9 5 719
0
500
1,000
1,500
2,000
2,500
3,000
Dec
-03
Jan-
04
Feb
-04
Mar
-04
Apr
-04
May
-04
Jun-
04
Jul-0
4
Aug
-04
Sep
-04
Oct
-04
Nov
-04
Dec
-04
Jan-
05
Feb
-05
Mar
-05
Apr
-05
May
-05
Jun-
05
Jul-0
5A
ug-0
5
Sep
-05
0
125
250
375
500
625
750
PE PP PVC Ethylene Production (rig.)
Source: Espírito Santo Research and ISI Source: Espírito Santo Research and ISI
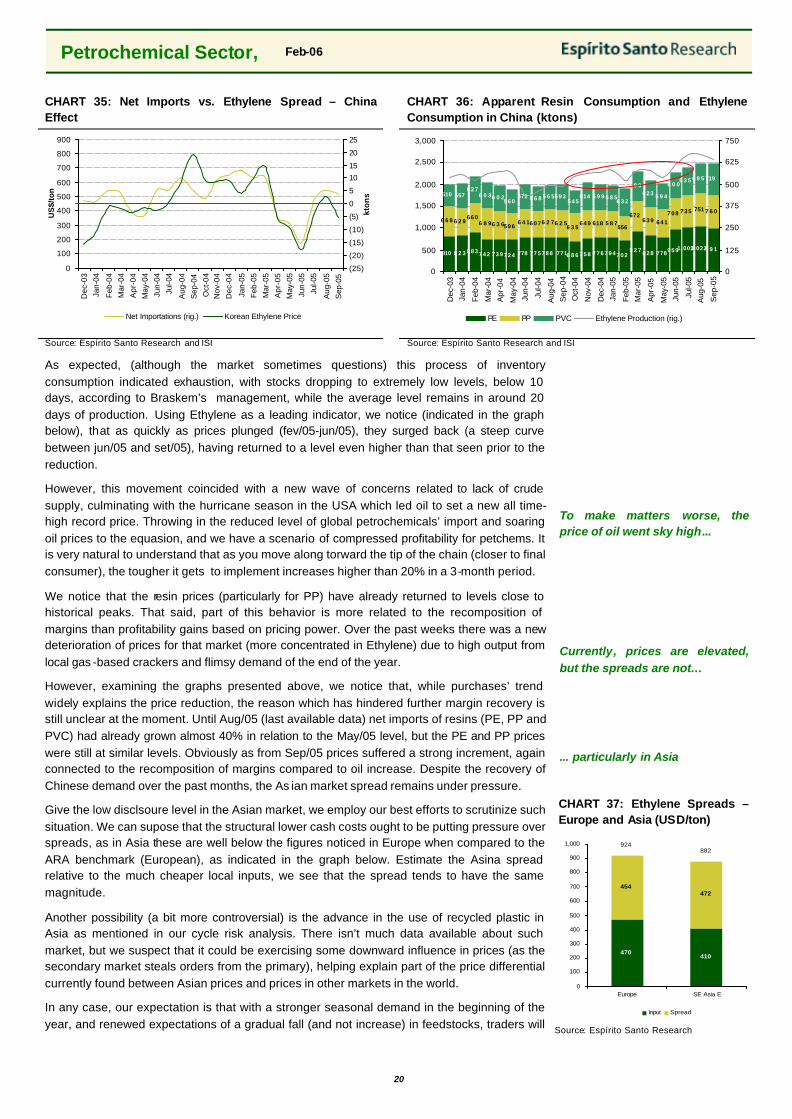
As expected, (although the market sometimes questions) this process of inventory consumption indicated exhaustion, with stocks dropping to extremely low levels, below 10 days, according to Braskem’s management, while the average level remains in around 20 days of production. Using Ethylene as a leading indicator, we notice (indicated in the graph below), that as quickly as prices plunged (fev/05-jun/05), they surged back (a steep curve between jun/05 and set/05), having returned to a level even higher than that seen prior to the reduction.
However, this movement coincided with a new wave of concerns related to lack of crude supply, culminating with the hurricane season in the USA which led oil to set a new all time-high record price. Throwing in the reduced level of global petrochemicals’ import and soaring oil prices to the equasion, and we have a scenario of compressed profitability for petchems. It is very natural to understand that as you move along torward the tip of the chain (closer to final consumer), the tougher it gets to implement increases higher than 20% in a 3-month period.
We notice that the resin prices (particularly for PP) have already returned to levels close to historical peaks. That said, part of this behavior is more related to the recomposition of margins than profitability gains based on pricing power. Over the past weeks there was a new deterioration of prices for that market (more concentrated in Ethylene) due to high output from local gas -based crackers and flimsy demand of the end of the year.
However, examining the graphs presented above, we notice that, while purchases’ trend widely explains the price reduction, the reason which has hindered further margin recovery is still unclear at the moment. Until Aug/05 (last available data) net imports of resins (PE, PP and PVC) had already grown almost 40% in relation to the May/05 level, but the PE and PP prices were still at similar levels. Obviously as from Sep/05 prices suffered a strong increment, again connected to the recomposition of margins compared to oil increase. Despite the recovery of Chinese demand over the past months, the As ian market spread remains under pressure.
Give the low disclsoure level in the Asian market, we employ our best efforts to scrutinize such situation. We can supose that the structural lower cash costs ought to be putting pressure over spreads, as in Asia these are well below the figures noticed in Europe when compared to the ARA benchmark (European), as indicated in the graph below. Estimate the Asina spread relative to the much cheaper local inputs, we see that the spread tends to have the same magnitude.
Another possibility (a bit more controversial) is the advance in the use of recycled plastic in Asia as mentioned in our cycle risk analysis. There isn’t much data available about such market, but we suspect that it could be exercising some downward influence in prices (as the secondary market steals orders from the primary), helping explain part of the price differential currently found between Asian prices and prices in other markets in the world.
In any case, our expectation is that with a stronger seasonal demand in the beginning of the year, and renewed expectations of a gradual fall (and not increase) in feedstocks, traders will
To make matters worse, the price of oil went sky high...
Currently, prices are elevated, but the spreads are not...
... particularly in Asia
CHART 37: Ethylene Spreads – Europe and Asia (USD/ton)
470410
454472
924882
0
100
200
300
400
500
600
700
800
900
1,000
Europe SE Asia E
Input Spread
Source: Espírito Santo Research

21
Petrochemical Sector, Feb-06
return to the market - purchasing, which could bring sounder figures for the spreads.
And what about China?
Due to the growing importance of China in the world commodities market (it wouldn’t be any different for resins), we deem relevant to include a specific section on the country in our discussion.
CMAI estimates the Chinese market demands in Ethylene equivalent terms of around 18 mm ton/year in the form of polymers. The resins production capacity (including PE, PP and PVC) adds to something close to 9mn tons/year and the PE alone is responsible for almost 5mm ton/year. As for Ethylene, these figures are a bit below 8 mm ton/year, so that we estimate China should be self-sufficient in less than 40% of its needs of derivatives, importing the remaining amount.
This imported volume has been presenting a considerable evolution, continuously increasing the country’s presence in the international market of resins, for which it is estimated that China is responsible for 50-60% of purchases despite having only 7% and 9% global capacity of PE and PP. For PE, in 2004 China’s net importing needs was of 4,8mm tons, considering the total world exports close to 9mm tons of equivalent Ethylene (~53%).
China requires ~18mn tons/year of equivalent Ethylene and needs to import more than 60% of it Representing 50-60% of the global importations
CHART 38: PE Production, NAC and Imports CHART 39: PP Production, NAC and Imports
0
100
200
300
400
500
600
700
800
Dec
-03
Jan-
04
Feb-
04
Mar
-04
Apr
-04
May
-04
Jun-
04
Jul-0
4
Aug
-04
Sep
-04
Oct
-04
Nov
-04
Dec
-04
Jan-
05
Feb-
05
Mar
-05
Apr
-05
May
-05
Jun-
05
Jul-0
5
Aug
-05
Sep
-05
050
100150
200
250300
350
400450
500550
Production CAN Net ImportationsNAC
Source: Espírito Santo Research and ISI Source: Espírito Santo Research and ISI
The main petrochemicals suppliers to China are the neighboring countries, namely South Korea, Taiwan, Thailand and Japan apart from shipments from the Middle East.
CHART 40: Ethylene Equivalent Chinese Market (mn tons) CHART 41: China’s Imports Market Share (2004)
-
2
4
6
8
10
12
14
1995 1996 1997 1998 1999 2000 2001 2002 2003 2004 2005E0%
5%
10%
15%
20%
25%
30%
35%
40%
45%
50%
Domestic Production Consumption Net Import. % Auto sufficiency
South Korea
20%
Taiwan14%
Middle Eastern12%
Tailand11%
Japan10%
Cingapura9%
USA8%
Malasia6%
India4%
Russia4%
Others2%
Source: Espírito Santo Research and CMAI
Source: Espírito Santo Research and Polymerupdate
0
200
400
600
800
1,000
1,200
Dec
-03
Jan-
04
Feb
-04
Mar
-04
Apr
-04
May
-04
Jun-
04
Jul-0
4
Aug
-04
Sep
-04
Oct
-04
Nov
-04
Dec
-04
Jan-
05
Feb
-05
Mar
-05
Apr
-05
May
-05
Jun-
05
Jul-0
5
Aug
-05
050
100
150200
250
300350400
450
500550
Production CAN Net ImportationsNAC

22
Petrochemical Sector, Feb-06
Table 04: Capacity - Chinese vs. Global Capacity per Product China World China Part. Production 04 Utilization 04
Ethylene 7.4 1.116 6.6% 6.3 85.6%
PE 4.8 71.3 6.7% 4.5 92.8%
PP 5.2 43.6 11.9% 4.7 90.4%PVC 5.3 34.2 15.6% 5.2 96.8%
Source: Espírito Santo Research, CMAI and Polymerupdate
As previously mentioned, the region should receive sizeable amounts of investments aiming at supplying the growth of local demand (mainly Chinese). We estimate that the total capacity to be added from China should reach +8mn tons/year until 2010, or 20% of the global expansion. In the current decade, the Chinese petrochemicals demand has been pilling up at an approximate rate of 12% p.a., or 1.2x the GDP’s CAGR of ~9.5%. If we assume a GDP growth rate of 7.0%-8.5% we could project an increase in Chinese demand of 8.5 -10% over the coming years.
Thus despite all the investment in additional offer (which reaches 70% of the total if we include the Middle East), we understand that the country will still be a net importer for the foreseeable time (even if on a proportional), which bodes well for global overall demand.
Therefore, we can infer that albeit demand coming from China should remain considerably robust, virtually nothing of these additional volumes should be addressed by Latin American producers. On the other hand, increments of Asian offering should be at least consumed within the region without deteriorating the local market in LatAm. Regarding China, we consider it to be more important to monitor the inflow of transformed products (3rd generation) which tends to flood markets of several countries around the globe as previously mentioned.
Even with all the investment in additional offer... ... China might remain as a liquid importer

23
Petrochemical Sector, Feb-06
4. DOMESTIC OUTLOOK: CONSUMPTION POISED TO GROW... Petrochemical is included in the segment called Industrial Chemistry. The total income of this segment in Brazil was around of US$33b in 2004, and it has been growing at a CAGR of 4,0% since 1990. Between 1990 and 2004, the apparent national consumption of chemicals increased 83,3% (4,6% annually), the production of 49,7% (2,9% annually).
Between 1990-2004, apparent national consumption rose 83,3% (4,6% o.y.) and production 2,9% o.y.
CHART 42: Sales of General - Chemistry in Brazil– USD59.4bn (2004)
CHART 43: Sales of Industrial – Chemistry in Brazil – USD33bn (2004)
Pharma
11%
CFT
7%
Fertilizers
9%Soap and Detergents
4%
Industrial Use
Chemicals
56%
Agricultural Denfense
Products
7%
Inks , Varnishes
3%
Other
3%
Basic
Petrochemicals
15%
Other Organic
15%
Pre-preps
20%
Other General
19%
Chlor-Alcalys
3%Industrial Gases
5%Fertilizers
6%
Thermoplastic
Resins
17%
Source: Espírito Santo Research and Abiquim
Source: Espírito Santo Research and Abiquim
CHART 44: Sales CAGR 1990-2004 (US$) per Segment
4.0%
6.8% 6.6% 6.6%
1.9%
10.0%
0.9% -
1.8%
4.6%
0.9%
Gen
eral
Use
Chem
icals
Phar
ma
CFT
Ferti
lizer
s
Soap
and
Dete
rgen
ts
Agric
ultu
ral
Denf
ense
Prod
ucts
Inks
,Va
rnis
hes
Oth
er
TOTA
L
PIB
GD
P
Source: Espírito Santo Research and Abiquim
With a GDP’s solid growth, consumption should grow ~15% p.y.
As we can notice, over the last 15 years the chemical industry has been able to maintain a consistent level of growth despite the virtually stagnant GDP. We have been witnessing considerable growth in the majority of segments, with the exception of the paint, enamel, and varnish segments, which happen to correlate very closely with the development of public works projects, which have been performing rather poorly for some time now. GDP elasticity reached approximately 5x on the aggregate figure, responding to the explosive performance in the agricultural segment, while remaining relatively stable at 4x for the industrial sector.
According to estimates from our macroeconomists, the Brazilian GDP should grow approximately 4.0%-4.5% annually over the coming years, which, assuming the same elasticity held in the last 10 years, could yield a 15%-17% annual growth. Even if we are to consider growth of this magnitude unlikely, the prevailing prospects for the industry are promising regardless of a substantial decrease in elasticity. Such a decrease is expected as Brazil is transformed from being heavily reliant on basic industry to a more developed economy, focused on products and services.

24
Petrochemical Sector, Feb-06
The chemical industry and, in particular, the petrochemical industry, are dynamic economic activities that react quite correlated to increases in income; when the GDP increases, theses sectors tend to increase to above average. Particularly in Brazil where the economy is still in its preliminary stages of development, the level of elasticity continues to remain considerably inflated, comparable only with those posted in China and India. According to industry experts, including various companies, the GDP elasticity in Brazilian sector is approximately 3.0x- 3.5x. Using data accumulated over the last 12 years yield an even higher rate of 4.7x (which we refrain from using in our company-specific projections), that is in line with the factor observed for the whole chemical sector above.
With regards to petchems usage in the economy relative to income levels, Brazil ranks favorably in a global comparion. Domestic consumption is still lower on an income-adjusted basis than that of China’s, even though the higher upside for the Chinese demand comes from a per-capita-income increase.
For the Petrochemical company, elasticity was steady between 3,0-4,5x.
CHART 45: Elasticity: Demand for Resins x GDP CHART 46: Per Country Consumption x Per Capita Income
R2 = 0.95
-
10.0
20.0
30.0
40.0
50.0
60.0
70.0
80.0
90.0
100.0
- 10,000 20,000 30,000 40,000
Per Capita Avaiable Income (US$)
Per
Cap
ita C
onsu
mptio
n o
f
Ther
mopla
stic
Res
ins
(Kg)
Brazil
Mexico
Western Europe
USA
China
Korea
Argentina
Source: Espírito Santo Research, IBGE and Braskem Source: Espírito Santo Research, IBGE and Braskem
Seasonality
Traditionally, the second and third quarters mark the highest levels of petrochemical sales in the Brazilian market. The increase during this six-month period is due, in part, to the production of consumer goods that are to be sold during the holiday season at the end of the year.
3Q and 2Q are the strongest in terms of demand
CHART 47: Seasonality in Demand for Basic Petrochemicals (2002 = 100)
CHART 48: Seasonality in Demand for Resins (2002 = 100)
Source: Espírito Santo Research and IPEA Source: Espírito Santo Research and IPEA
Supply vs. Demand on Internal Market
In this section of our analysis we used a 2004 study elaborated by Abiquim/Coplast that attempted to demonstrate the demand potential for seeral petrochemicals, and how such incremental demand would relate to existing supply and installed capacity. The reckons a GDP CAGR 05-13E of 4.4%, which is fairly in line with the 4.3% projected by our macroeconomists, increasing its relevance within the scope of our analysis.
y = 4.70 x - 4.121
1,000
1,500
2,000
2,500
3,000
3,500
4,000
1,000 1,100 1,200 1,300 1,400 1,500 1,600 1,700
Real Brazilian GDP (R$bn)
Ther
mopla
stic
Res
in C
onsu
mptio
n
(000
ton)
R2 = 0.96
80
85
90
95
100
105
110
115
120
1T 2T 3T 4T
Média 91-05 2004 2005Avg.
Q Q Q Q
80
85
90
95
100
105
110
115
120
1T 2T 3T 4T
Média 91-05 2004 2005Avg.
Q Q Q Q

25
Petrochemical Sector, Feb-06
Comparing the projection of demand displayed in table 05 with the petrochemical industry's current installed capacity, disregarding any future expansion project (with the exception of production by Riopol, which is already included), the capacity surplus/deficit is demonstrated below:
TABLE 05: Demand Forecasts for Main Thermoplastic Resins (kton) Demand PEAD PEBD PEBDL Total PE PP PET PVC PS Total Resins
2006 838 643 454 1,935 1,331 560 766 331 4,923 2007 944 698 522 2,163 1,528 631 848 359 5,530 2008 1,064 757 599 2,419 1,755 711 939 390 6,214 2009 1,207 825 693 2,724 2,030 807 1,046 425 7,031 2010 1,378 903 808 3,088 2,366 922 1,171 465 8,012 2011 1,572 987 940 3,500 2,755 1,052 1,311 508 9,126 2012 1,794 1,080 1,095 3,969 3,208 1,200 1,467 556 10,400 2013 2,047 1,182 1,275 4,503 3,735 1,369 1,642 608 11,858
CAGR Demand 06-13 13.6% 9.1% 15.9% 12.8% 15.9% 13.6% 11.5% 9.1% 13.4%CAGR GDP ES Research 4.3% 4.3% 4.3% 4.3% 4.3% 4.3% 4.3% 4.3% 4.3%Used Elasticities 3.0 2.0 3.5 3.0 3.5 3.0 2.5 2.0 3.1
Deficit/Superavit PEAD PEBD PEBDL Total PE PP PET PVC PS Total Resins2006 244 141 676 1,061 94 (167) 20 289 1,297 2007 138 86 608 833 (103) (238) (62) 261 690 2008 18 27 531 577 (330) (318) (153) 230 6 2009 (125) (41) 437 272 (605) (414) (260) 195 (811) 2010 (296) (119) 322 (92) (941) (529) (385) 155 (1,792) 2011 (490) (203) 190 (504) (1,330) (659) (525) 112 (2,906) 2012 (712) (296) 35 (973) (1,783) (807) (681) 64 (4,180) 2013 (965) (398) (145) (1,507) (2,310) (976) (856) 12 (5,638)
Used Capacity PEAD PEBD PEBDL Total PE PP PET PVC PS Total Resins2006-2013 1,082 784 1,130 2,996 1,425 393 786 620 6,220
Source: Espírito Santo Research and Abiquim * Adapted from the year – beginning Abiquim/Coplast study
CHART 49: (Deficit)/Surplus for Thermoplastic Resins (kton)
(8,000)
(6,000)
(4,000)
(2,000)
-
2,000
4,000
6,000
8,000
10,000
12,000
14,000
2006 2007 2008 2009 2010 2011 2012 2013
Capacity Demand for Resins Superavit/(Deficit)
Projects suggest a product deficit at the end of the decade.... ... If consumption continues to rise.
Source: Espírito Santo Research and Abiquim
This exercise shows that, in fact, investments are necessary to guarantee the resin supply in the national market over the long-haul, but also, before 2007, it seems highly unlikely that any additional capacity would be properly absorbed. One of the main risks, given this scenario, is the large number of investments currently being planned by companies, in order to capitalize on the sector sound prospects globally and on the rise in internal demand. In table 06 we highlight the chief projects being currently discussed. We would like to make it very clear that we are basing our projections on available information, and our aim is to provide an accurate estimate of the possible capacity addition flow.
Moreover, stepped-up exports of manufactured products from Asia (plastics, shoes, etc.) may hurt local demand in the Southern Cone, representing another significant risk to Brazilian companies in the sector. A deterioration in the domestic consumption scenario in general might cause demand for end products to lag, which ultimately would reduce that projected deficit.
Investments are necessary but not in the short term... ... especially if demand is supplied through imports

26
Petrochemical Sector, Feb-06
TABLE 06: List of Probable and/or Possible Expansion Projects – Second Generation Project kton/year Product USD (mn) Investors OperationPolibrasil 250 PP 70 Suzano Petroquimica 2006-2007Braskem 50 PE 13 Braskem 2006Paulínea 300 PP 240 Braskem 2007Polietilenos União 200 PE 140 Unipar 2007Expansão RioPol 160-260 PE 100 Suzano, Unipar, Petrobras 2007-2008Petroquímica Triunfo 160 PE na Petrobras naPoliteno 40 PE 25 Suzano, Braskem 2007Innova na Styrene 150 Petrobras (PEPSA) 2008Rhodia Ster na PET 450 Rhodia Ster 2009Venezuela 400 PP 250 Braskem, Pequiven 2008GasBol 600-700 PE 1,200 Braskem, Petrobras 2009Unidade Petroquímica Básica 3300-3500 Several 3,000 (2nd Gen.) Petrobras, Ultrapar (others) 2010+
Source: Espírito Santo Research, Suzano Petroquímica and Abiquim
Those projects already released and soundly underway should be able to fully meet growing resin and intermediates expected demand until 2008 without the implementation of any new plants (also because much of the anticipated expansions consider a increasing direct usage of refining product slate). For PE, the internal market will most likely not be able to rightly accomodate the projected expansions as, according to our calculations, the deficit in 2005 (already taking into account the expansion of Polietilenos União) is already lower than the total capacity to be added. For PP, however, the market appears to be more adjusted in 2010E, even with all the additions to capacity, laying a more confortable track for its producers.
In the case of PE, one option would be to capture a larger portion of the US market, which appears to be a long-term plan of many national companies. Such strategy would be to exploit the greater competitiveness in production costs vis-à-vis North American manufacturers, and lower transportation costs vs. Asian competitors. In South America, local companies already hold a substantial portion of the market, which renders sound margins (premium). However, the region, in aggregate, is currently well supplied, and, any output frenzy, would most likely not be absorbed regionally without sacrificing its premiums.
However, there is speculation surrounding the construction of 2 crackers: the GasBol and by the Ultra group. Despite being appealing projects,on paper, their viability relies heavily on the demand market development, in order to guarantee profitability. Despite our referring to the GasBol plant as a cracker, it would be in the Riopol’s molds, totally integrated with PE manufacturing .
As for Petrobras' project (UPB), alongside the local Ultra group, it is particularly important that its planning is carried out responsably, as it is an an undertaking of somewhat larger proportions, possibly with an Ethylene production capacity similar to that of Braskem and Copesul. Given the project's complexity, chances are that it would be a “next decade” theme. Being that the case, it would provide sufficient time for the extra volume to be absorbed by the domestic market. Notwithstanding, there’s a pretty big chance that it would still result in excess production in the case of PE. Obviously, everything depends on the capital discipline of the other national and South American players.
Available press buzz on the venture comments that the overall capacity of the UPB project (refinery and 1st generation), budgeted at around USD3bn, would ammount: 1,200kton/year of Ethylene, 750-800kton/year or Propylene, 300-400kton/year of Benzene, and approximately 700kton/year of other basic products, not to mention 860kton/year of Diesel. For the so-called 2nd generation of the project, it is speculated that there will be involvement from Suzano Petroquímica, Unipar, and Dow Chemical. The required investment in that stage would be another USD3bn, adding an additional 1,000kton/year of PE and 600kton/year off PP, not to mention 1,500-1,800kton/year of other products. Finally, the last step of the mega-project, without the participation of any of the listed companies, would be the setting of the plastic and transformer industries complexes, which, according to reports from Globo, would entail another USD3bn. As such, the entire undertaking could be worth astonishin USD9bn, hence the extended timeframe.
Present capacity should be able to fully meet the whole foreseen demand until 08-09E without the implementation of any new plant... The answer to PE market may lie in the US UPB is a case worth considering cautiously...

27
Petrochemical Sector, Feb-06
5. SECTOR CONFIGURATION IN BRASIL AND LATIN AMERICA Context
In Brazil, the the petrochemical industry is based on the oil industry, its main raw material supplier. Petrobras, through numerous furnaces and fractioning towers, refines crude oil into a series of products that range from asphalt to Liquefied Petroleum Gas (LPG). Among these products is Naphtha, the primary feedstock for the country’s petrochemical industry. Approximately 70% of apparent domes tic consumption is supplied by the state-owned company and the rest is imported directly by the companies (crackers).
Close to 70% of consumed Naphtha is supplied by Petrobras
CHART 50: Domestic Naphtha Production and Importation (ktons)
Source: Espírito Santo Research and ANP
Petrobras steered the design of the domestic petrochemical industry, from its inception, promoting investments in partnership with international players, who entered with their know-how, and private Brazilian investors, who handled management. Petrobras (through Petroquisa) was the minority shareholders and supplier of raw materials, thus ensuring an important market for another part of its refining product slate.
In the 60’s and 70’s, three crackers were built, making up the production complexes where the petrochemical production take place: PQU in Cubatão – SP (1968), Copene (currently known as Braskem) in Camaçari – BA (1978) and Copesul, in Triunfo – RS (1982).
In 1992, the government initiated a privatization program in order to significantly reduce its stake in the sector, in the aim of increasing private capital interest in the industry. Petrobras, however, maintained a small minority interest in a vast range 1st and 2nd generation companies, much of which it still holds presently. The sector became a tangled knot of cross-held ownership, which can be found in the attached Diagram at the end of this report.
Currently in Brazil, there are four 1st generation companies (Braskem, Copesul, PQU and Riopol), more than fifty 2nd generation and close to 6,000 companies that operate in 3rd generation, converting the materials into consumer goods.
Petrobras + national private groups + foreign companies steered the design of the domestic petrochemical industry. The privatization program was initiated in 1992.
TABLE 07: Privatization of the Brazilian Crackers... Privatization
Petrochemical Center Date Petroquisa Others Petroquisa Others
Copesul May-15-92 67.2% 32.8% 15.6% 84.4%Braskem Aug-15-95 48.2% 51.8% 11.1% 88.9%PQU Jan-24-94 67.8% 32.2% 17.5% 82.5%
Composition before Privatization Composition after Privatization
Source: Espírito Santo Research and companies
0%
10%
20%
30%
40%
50%
Jan-
01
Apr
-01
Jul-0
1
Oct
-01
Jan-
02
Apr
-02
Jul-0
2
Oct
-02
Jan-
03
Apr
-03
Jul-0
3
Oct
-03
Jan-
04
Apr
-04
Jul-0
4
Oct
-04
Jan-
05
Apr
-05
Jul-0
5-
200
400
600
800
1,000
1,200
1,400
1,600
1,800
2,000
CAN Importation External Dependence Avg. (since 2001)CAN

28
Petrochemical Sector, Feb-06
TABLE 08: Brazilian 1 st Generation Installed Capacity Braskem % Copesul % PQU % Riopol %
Ethylene 1,280 37% 1,135 38% 500 30% 520 85%Prophylene 550 16% 585 20% 250 15% 75 12%Benzene 430 12% 265 9% 200 12% - 0%Butadiene 175 5% 105 4% 80 5% - 0%Toluene 40 1% 91 3% 75 4% - 0%Xilenes 305 9% 66 2% 130 8% - 0%Others 710 20% 753 25% 450 27% 20 3%Total 3,490 100% 3,000 100% 1,685 100% 615 100%
Source: Espírito Santo Research and Abiquim * Capacities may vary depending on the cracker input mix
CHART 51: Share in Domestic Ethylene and Prophylene Capacity (%)
ETHYLENE
Braskem
37%
PQU
15%
RioPol*
15%Copesul
33%
PROPHYLENE
*RioPol4%
Refinarias14%
Braskem
32%
PQU15%
Copesul
35%
Source: Espírito Santo Research and Abiquim * As of 4Q05
As of 4Q05 (after a few months delay), with the start of operations at Rio Polímeros, Brazil will gain another cracker focused on Ethylene (and Polyethylene) production in Rio de Janeiro. This unit, unlike the others, uses natural gas -derived Propane and Ethylene, extracted by Petrobras from the Cam pos Basin, as feedstocks.
In the Southern Cone, there is also the Bahía Blanca Petrochemical Center in Argentina, with a gas -based Ethylene capacity of 700kton/year, controlled by Dow Chemical, which supplies input to 2nd generation companies (Petroken and Solvay), with a PE capacity of 600kton/year de PE, and PVC capacity of 210kton/year. In Venezuela, Pequiven (which will be called Corporación Petroquímica Venezoelana after the spin off), the petrochemical arm of the state-owned PDVSA, operates two plants (Complexo de Tablazo) with a total Ethylene capacity of approximately 390kton/year. There are also cracker plants in Mexico, and recently, news has circulated that Chile also plans to build a new basic Naphtha-based petrochemical undertaking (ENAP), which would produce approximately 400kton of Ethylene per year, not to mention possible greenfield projects in Venezuela (in fact, Braskem is seeking to form partnerships in that country).
We should always take into account the Southern Cone market as a whole instead of focusing on the analysis of each individual country, as the continent is more and more integrated, with in increasing flow of petrochemicals between them. In the attachment hereof we present a map of the second generation productive units in Latin America, separated country by country and per company, which we deem to be very useful to those interested in understanding the wider picture of this puzzle.
Another source of basic products, particularly Propylene and in a smaller scale Ethylene, is through the use of gaseous refinery’s streams, not yet fully used (PQU will use in its expansion as commented ahead). For Propylene, in turn, Petrobras’ refineries contribute with some 14% of the national capacity.
At this point, we fell it is important to recall that the price charged for Ethylene in the domestic market is set through margin share agreements, which establishes that the total margin of the

29
Petrochemical Sector, Feb-06
2nd generation over fixed and input costs is distributed along the chain (crackers and 2nd generation clients), according to the capital employed in the industry. There are negotiations under way to extinguish this sharing mechanism which would give place to the international prices parity.
As for the Propylene, the price is obtained through the application of the ratio observed in the international market between the product and Ethylene to the Ethylene price calculated by margin share. For the vast majority of other products, the price follows importing parity to the American and European market prices.
Taxes charged on the sale of basic petrochemicals in Brazil are around 2% of the Gross Sales, slightly higher than last year.
CHART 52: South Cone Crackers...
In Latam there are still crackers - Argentina (Dow), Venezuela (PDVSA) and Mexico (Pemex)
Source: Espírito Santo Research
The First Generation
We will now provide a brief characterization of each of the crackers in Brazil, indicating the main issues refering to its competitiveness:
PETROQUÍMICA UNIÃO (PQU) AND THE SP PETROCHEMICAL COMPLEX
Located in the Greater São Paulo, the PQU was, until the beginning of Rio Polimeros’ operations, the sole Brazilian petchem center in the Southeast region, the core of the country’s consumer market.. The lack of corporate integration with its 2nd generation client companies, more obsolete plants and the relative difficulty in expanding its scale are important hindrances to the PQU’s competitiveness. The fusion of this company with other 2nd generation ones of the São Paulo Petrochemical Complex is a possibility we will discuss in Section 6 – “Consolidation: what are the next steps?”.
The proximity of the consumer market is undoubtedly the main advantage of the complex, which do not need to incur in transport and storage costs. However they suffer losses due to the lack of scale and a certain technological obsolescence of the plants as the majority is more than 30 years old. The location close to the country’s main refineries allows PQU to receive all its raw materials from Petrobras through pipelines. On the other hand, the company does not have its own terminal to import Naphtha, (as Copesul and Braskem have), which is restrictive for expansion projects, and increases its dependence on the government-owned company. The next investment which will increase the productive capacity by 200kton/year of Ethylene with 120kton/year of Basic Associated Products, will be based on refinery gas, reaching 700kton/year for Ethylene.
Another of PQU’s obstacle is the dispute among the participants and their shareholders
PQU was the first national cracker. The control is divided among
Dow Chemical(700kton/year)
Copesul(1135kton/year)
Rio Polímeros (520kton/year)
PQU (500 kton/year)
Braskem (1200kton/year )
Pequiven(600kton/year)
Braskem -GasBol (Project) (650-750kton/year)
Ultra Project –Marlim’s oil(1200kton/year)
PQU Expansion -Refinary Gas + Coke(200 kton/year)
Naphtha Cracker(Heavy)
Natural Gas Cracker(Light)
Other Input Crackers
Pemex(600kton/year)
Pemex(600kton/year)

30
Petrochemical Sector, Feb-06
greement (Unipar, Dow Chemical, Unigel, Ultrapar and Suzano Petroquímica). several privatized groups
TABLE 09: PQU Shareholder Structure Shareholders Voting Capital Total Capital Unipar 37.5% 37.2%Union Carbide (Dow Chemical) 13.0% 13.0%Polibrasil (Suzano Petroquímica) 6.8% 6.7%Grupo Unigel 3.0% 3.3%Oxiteno (Ultrapar) 1.9% 1.9%Petroquisa (Petrobras) 17.5% 17.4%Employees 10.0% 6.6%Others 10.3% 13.8%Source: Espírito Santo Research and PQU
The most relevant 2nd generation companies of the SP Center are:
♦ Dow Chemical – Following the 1999 acquisition of Union Carbide, Dow (the largest petrochemical company in the world) merged the LDPE plant with its rubber factory. Installed capacity of 144kton/year of LDPE;
♦ Polietilenos União – Wholly owned subsidiary of Unipar, with a 120kton/year capacity of LDPE and EVA, currently programming an expansion of 200kton/year of LLDPE and HDPE, counting on the PQU expansion for the beginning of 2007 and estimated in USD160mm;
♦ Oxiteno – Wholly owned subsidiary of Ultrapar, with a local capacity of 52kton/year of EO, for the production of EG and specialties;
♦ Suzano Petroquímica (Polibrasil) – Local capacity of 300kton/year of PP, which will be expanded to 450kton/year by 2007;
♦ Solvay – Brazilian unit of the Belgian company of the same name, with a local capacity of 82kton/year of HDPE and PVC with 236kton/year;
♦ Unipar Chemical Division – Local capacity of 265kton/year of Cumene, Isoparaffins and Propene by-products;
♦ Petroflex – Manufacturer of SBR and Latex with local installed capacity of 210kton/year, controlled by Braskem and Suzano Petroquímica;
♦ Polibutenos – Controlled by Unipar, PQU and Chevron, with a 16kton/year capacity to produce Polybutenes;
♦ CBE – Wholly owned subsidiary of Unigel, with capacity of 120kton/year of Styrene.
2nd generation of SP Center...
CHART 53: Main Commercial Flows in SP Petrochemical Center
Source: Espírito Santo Research and PQU
Agreement of Shareholders
PETROQUÍMICA UNIÃO (PQU)
ETHYLENE (500kton)
BENZENE (200kton)
GASOLINE, GLP AND MTBE
(200kton)
BUTADIENE (80kton)
U. Carbide/Dow(PEBD)
Polietilenos União (PEBD, EVA)
Oxiteno(EG, EO,
Specialties)
Carbocloro(DCE)
CBE (Styrene)
Petroflex(SBR)
PROPHYLENE (250kton)
TOLUENE (75kton)
Distribuitorsand Gasoline
Traders
THIRD GENERATION
Solvay Indupa(PEAD, PVC, MVC) Elekeiroz
(Plasticizers)
BAYER (Aniline)
Dow/IQT/Nitrif. (Latex)
Unipar Div. Química
(Cumene)
Polibrasil (PP)
AROMATICS (120kton)
OTHERS
BUTENE (99kton)
Polibutenos(PIB)
Rhodia (Nylon, Phenol)
BASF (PS)

31
Petrochemical Sector, Feb-06
BRASKEM AND THE NE PETROCHEMICAL CENTER
In Camaçari, in the state of BA, lies the former Copene, the Northeast Petrochemical Complex’s cracker which is now called Braskem, and belongs to the Odebrecht Group. The privatization of the NE Complex spurred a pulverization of the control, creating a truncated network of (sometimes) conflicting cross-held stakes and interests in the sector. The Odebrecht-Mariani consortium won the liquidation auction and the soon implemented a vertical (between 1st and 2nd generations) integration process, creating Braskem. Apart from stakes in companies in the NE Center, Braskem has productive units in the other complexes, highlighting the shared control of Copesul (see below). Braskem is currently the largest LatAm petchem co, with an annual Gross Revenue north of US$6b and market value close to US$3,3bn.
Despite detaining a strong position in the Camaçari 1st generation Center, Braskem has its main 2nd generation plants in the Triunfo Center (part also in Maceió). Only two Polyethylene plants and one PVC plant are actually located in Camaçari. Therefore, Braskem, actually has some integration gains combined with large scale, capturing a bigger chunk of the chain’s margins, but it does reap the full operational synergies arsing from integrations, as does Riopol (albeit with a much inferior scale). Integration can improve further if Braskem fully consolidates Politeno, not to mention the possibilities in the Copesul history, as we shall discuss in Section 6 – Consolidation: What are the Next Steps.
The company’s control block, in addition to Odebrecht and Norquisa, includes Petroquisa and some pension funds. Petroquisa has a call option, maturing in Mar/06, to increase its stake in Braskem up to 30% of the voting capital. For more information check the appendix in the Control Diagram of the national petrochemical groups.
Braskem integrated 2nd generation assets with Copene, in the BA Center. Control of Braskem is held by Oderbrecht
TABLE 10: Braskem Shareholder Structure Shareholders Voting Capital Total Capital
Odebrecht 48.0% 31.7%Norquisa 25.4% 9.1%Petroquisa 10.0% 8.4%Previ 2.5% 2.6%Petros 2.4% 1.5%Others 11.7% 46.7% Source: Espírito Santo Research and Braskem
The main 2nd generation companies of the Camaçari Center are: ♦ Polialden –Braskem’s own company with installed capacity of 130kton/year of HDPE and
PE of Ultra High Density;
♦ Politeno – Controlled by Braskem and Suzano Petroquímica with capacity of 150kton of LDPE and 210kton of HDPE/LLDPE;
♦ Oxiteno – Wholly owned subsidiary of Ultrapar, with local installed capacity of 260kton/year of EO, and 285kton/year of EG;
♦ Suzano Petroquímica (Polibrasil) – Local installed Capacity of 125kton/year of PP;
♦ Petroflex – Plant located in Cabo in PE, with capacity of 125kton/year of SBR. The largest shareholders of the company are Braskem and Suzano Petroquímica;
♦ Dow Chemical – Local installed capacity of 160kton/year of Styrene and190kton/year of PS;
♦ Acrinor – Producer of Acrynonitrile with productive capacity of 80kton/year, of the Unigel group;
♦ Deten – Company controlled by the Spanish Petresa (72%), with participation of Petroquisa. Its main products are the Linear and sulfonated Alkybenzene and the total
2nd generation of BA Center...
Agreement of Shareholders

32
Petrochemical Sector, Feb-06
capacity is of 300kton/year;
♦ Elekeiroz – National private group with a total capacity of 730kton/year of several chemicals, including 250kton/year of Sulfuric Acid;
♦ Proquigel – Part of the Unigel group, manufacturer of Acetone Cyanhydrine (40kton/year), Methyl and ethyl methacrylate, Acrylates and Ammonium Sulfate, among others;
♦ Basf – A branch of the German multinational of the same name, producer of several chemicals;
CHART 54: Key Commercial Flows of Camaçari Petrochemical Complex
Source: Espírito Santo Research and Braskem
COPESUL AND THE SOUTHERN PETROCHEMICAL COMPLEX
Sited in the city of Triunfo, Companhia Petroquímica do Sul (Copesul) is the petrochemical center responsible for supplying basic petrochemicals for the Southern Petrochemical Complex’s companies. The company operates two plants, with a total capacity of 3.0mn tons of basic products, including Olefins and Aromatics.
Copesul is actually the largest producer (and seller) of Bas ic Petrochemicals, with a market share of almost 41% for Ethylene and 45% for Propylene, despite being the #2 in terms of capacity, due to the capability of maintaining high operating rates owing to its modern facilities. The Southern complex is characterized by a high level of integration, given that 80% of its basic products are sold internally, as well as by its greater exposure to exports, due to its favorable location.
Furthermore, the company possesses greater operational flexibility as it can process a larger proportion of condensate (and even LPG) mixed into the Naphtha chain, not only managing to achieve the best processing mix, but also managing to obtain the best yield for Ethylene (or any other by-product), adjusting processed loads to market dem and. We consider this an important competitive advantage for Copesul.
Copesul is joint-controlled by Braskem and the Ipiranga Group, through a shareholder’s agreement that grants their mutual preemptive right (see Section 6). Both parent companies are also its main clients, consuming most of the Olefins produced. The disadvantages of being owned by two separate groups, which are, in the end of the day, competitors, associated with the alleged indefinition as to whether the Ipiranga Group will continue to operate in the petrochemical sector, are the weak points that inhibit any increase in the
Copesul is the most modern cracker and is located in Triunfo, in Rio Grande do Sul State. Copesul is joint-controlled by Braskem and the Ipiranga Group.
BRASKEM
ETHYLENE (1280kton)
PROPHYLENE(537kton)
GASOLINE. DIESEL, GLP AND MTBE
BUTADIENE (180kton)
Polialden - Braskem (PEAD)
Politeno(PEBD)
Oxiteno(EO, EG)
Dow / Isopol(Styrene, TDI)
Petroflex(SBR)
BENZENE (432kton) OTHERSTOLUENE
(40kton)
Distribuitorsand Gasoline
Traders
THIRD GENERATION
Acrinor(Acrilonitrile)
Braskem (PEAD, PEBDL)
Polbrasil(PP)

33
Petrochemical Sector, Feb-06
company’s competitiveness and hinder growth.
TABLE 11: Copesul Shareholder Structure Shareholders Voting Capital Total Capital
Ipiranga Petroquímica 29.5% 29.5%Braskem 29.5% 29.5%
Petroquisa 15.6% 15.6%Others 25.4% 25.4%
Source: Espírito Santo Research and Copesul
The Triunfo Petrochemical center’s main 2nd generation companies are:
♦ Ipiranga Petroquímica – A closed company controlled by the Ipiranga Group, with a flexible installed capacity of 550ktons between HDPE/LLDPE;
♦ Braskem – The company’s full PP capacity, 550ktons/year, is located at the Southern Petrochemical Center, as well as a sizable part of its PE capacity, being 210ktons/year of LDPE, 300ktons/year flexible HDPE/LLDPE;
♦ Oxiteno – An Ultrapar plant, with a total installed capacity of 260ktons EO, for producing EG and special products;
♦ Innova – A subsidiary of Petrobras Energia, in turn controlled by Petrobras in Argentina. Its installed capacity is 250ktons/year of Styrene and 120ktons/year of PS;
♦ Petroquímica Triunfo – Controlled by Petrobras, with an installed capacity of 160ktons/year HDPE and EVA;
♦ Petroflex – Controlled by Braskem and Suzano Petroquímica, with an installed capacity of 76ktons/year SBR;
♦ DSM – A subsidiary of the Dutch company DSM, which produces the synthetic elastomers used in the automotive industry and civil construction;
2nd generation in RS Center...
CHART 55: Commercial Flows in Triunfo Complex
Source: Espírito Santo Research and Copesul
RIO POLÍMEROS (RIOPOL)
After 8 years of investments, totaling USD1.1bn, the Rio Polímeros S.A. integrated gas -chemical complex began its operations in Sep/05. Riopol is currently installed near the Duque de Caxias Refinery (Reduc), and, when running full, will be one of the largest producers of Polyethylene in Brazil, with a capacity of 540ktons/year. Its location is also favorable, pinned
Riopol, the first gas-based cracker, with start-up in 4Q05
Agreement of Shareholders
COPESUL
ETHYLENE (1135kton)
PROPHYLENE (585kton)
GASOLINE. DIESEL, GLP AND MTBE
BUTADIENE (105kton)
Ipiranga Petroquímica
(PEAD, PEBDL, PP)
Braskem (PEBD, PEBDL, PP)
Petroquímica Triunfo
(PEBD, EVA)
DSM (EDPM Rubber)
Innova(Styreneand PS)
Petroflex(SBR)
BENZENE (265kton) OTHERSTOLUENE
(91kton)
Distributorsand Gasoline
Traders
Oxiteno(Specialties)
THIRD GENERATION

34
Petrochemical Sector, Feb-06
in the heart of the consumer market in São Paulo, and the country’s main natural gas reserves.
Controlling interest of Riopol is divided between the private Brazilian groups Unipar (33.3%) and Suzano Petroquímica (33.3%), in addition to the state-owned companies Petroquisa (16.7%) and BNDESPAR (16.7%).
Rio Polímeros employs modern technologies to produce thermoplastic resins on a global scale, including the implementation of a fully integrated industrial complex, comprised of two industrial plants that will operate using natural derivatives to be supplied by Petrobras. The following chart indicates the main processes involved in Rio Polímeros’ production:
Riopol is shared among Unipar (33.3%) and Suzano Petroquímica (33.3%), in addition to Petroquisa (16.7%) and BNDESPAR (16.7%).
CHART 56: Riopol Production
Source: Espírito Santo Research and Unipar
Comparison between the Crackers
Cracking capacity is widespread throughout the country, and Braskem (BA) and Copesul (RS) are clearly ahead of PQU (SP) in terms of production capacity. Copesul is, among the 3 operational crackers of the region, the most modern one, with potential to run closer to capacity, as ti has being doing for the past 3 years. Additionally, the company has more operational flexibility, with a capacity to process a great amount of condensate and even LPG mixed to the Naphtha stream, managing not only to arbitrate between the best processing mix, but also obtain the best Ethylene yield (or any other given by-product), adjusting its product slate to market demand. We consider this an important competitive advantage for Copesul, which can be noticed through the analysis of graph 57, indicating the sales evolution for each cracker.
Copesul is the most efficient if compared to the local crackers
CHART 57: Ethylene Sales (ktons and market share) CHART 58: Evolution of Ethylene Market Share (%)
929 1019 1086 1119
1065 995 1047 1098
450 412 455 486
0%
20%
40%
60%
80%
100%
2001 2002 2003 2004Copesul Braskem PQU
-
200
400
600
800
1,000
1,200
2001 2002 2003 2004
Copesul Braskem PQU
Source: Espírito Santo Research, Copesul and Abiquim
Source: Espírito Santo Research and companies
540kton/year520kton/year
391kton/year
395kton/year75kton/year
market
Prophylene (co-product )
Natural Gas
Petrobras Exploration& Processing
Ethane
Propane
Petrobras RefineryRIO POLÍMEROS Project
Campos Basin
EthaneExtracting
Unit
Propane/EthaneExtracting
Unit
EthyleneCracking
PE Production
Return Streamsto REDUC
Natural Gas 540kton/year520kton/year
391kton/year
395kton/year75kton/year
market
Prophylene (co-product )
Natural Gas
Petrobras Exploration& Processing
Ethane
Propane
Petrobras RefineryRIO POLÍMEROS Project
Campos Basin
EthaneExtracting
Unit
Propane/EthaneExtracting
Unit
EthyleneCracking
PE Production
Return Streamsto REDUC
Natural Gas
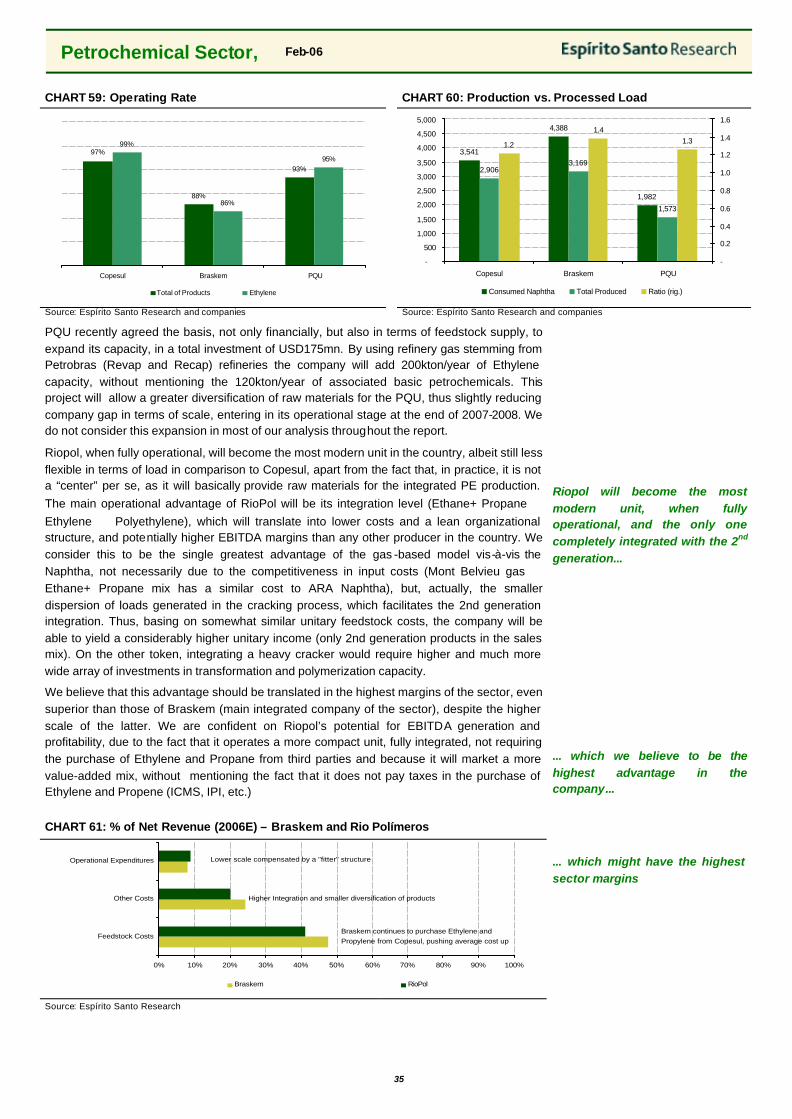
35
Petrochemical Sector, Feb-06
CHART 59: Operating Rate CHART 60: Production vs. Processed Load
97%
88%
93%
99%
86%
95%
Copesul Braskem PQU
Total of Products Ethylene
3,541
4,388
1,982
2,9063,169
1,573
1.2
1.41.3
-
500
1,000
1,500
2,000
2,500
3,000
3,500
4,000
4,500
5,000
Copesul Braskem PQU
-
0.2
0.4
0.6
0.8
1.0
1.2
1.4
1.6
Consumed Naphtha Total Produced Ratio (rig.)
Source: Espírito Santo Research and companies Source: Espírito Santo Research and companies
PQU recently agreed the basis, not only financially, but also in terms of feedstock supply, to expand its capacity, in a total investment of USD175mn. By using refinery gas stemming from Petrobras (Revap and Recap) refineries the company will add 200kton/year of Ethylene capacity, without mentioning the 120kton/year of associated basic petrochemicals. This project will allow a greater diversification of raw materials for the PQU, thus slightly reducing company gap in terms of scale, entering in its operational stage at the end of 2007-2008. We do not consider this expansion in most of our analysis throughout the report.
Riopol, when fully operational, will become the most modern unit in the country, albeit still less flexible in terms of load in comparison to Copesul, apart from the fact that, in practice, it is not a “center” per se, as it will basically provide raw materials for the integrated PE production. The main operational advantage of RioPol will be its integration level (Ethane+ Propane ⇒ Ethylene ⇒ Polyethylene), which will translate into lower costs and a lean organizational structure, and potentially higher EBITDA margins than any other producer in the country. We consider this to be the single greatest advantage of the gas -based model vis-à-vis the Naphtha, not necessarily due to the competitiveness in input costs (Mont Belvieu gas ⇒ Ethane+ Propane mix has a similar cost to ARA Naphtha), but, actually, the smaller dispersion of loads generated in the cracking process, which facilitates the 2nd generation integration. Thus, basing on somewhat similar unitary feedstock costs, the company will be able to yield a considerably higher unitary income (only 2nd generation products in the sales mix). On the other token, integrating a heavy cracker would require higher and much more wide array of investments in transformation and polymerization capacity.
We believe that this advantage should be translated in the highest margins of the sector, even superior than those of Braskem (main integrated company of the sector), despite the higher scale of the latter. We are confident on Riopol’s potential for EBITDA generation and profitability, due to the fact that it operates a more compact unit, fully integrated, not requiring the purchase of Ethylene and Propane from third parties and because it will market a more value-added mix, without mentioning the fact that it does not pay taxes in the purchase of Ethylene and Propene (ICMS, IPI, etc.)
Riopol will become the most modern unit, when fully operational, and the only one completely integrated with the 2nd generation... ... which we believe to be the highest advantage in the company...
CHART 61: % of Net Revenue (2006E) – Braskem and Rio Polímeros
0% 10% 20% 30% 40% 50% 60% 70% 80% 90% 100%
Feedstock Costs
Other Costs
Operational Expenditures
Braskem RioPol
Lower scale compensated by a "fitter" structure
Higher Integration and smaller diversification of products
Braskem continues to purchase Ethylene and Propylene from Copesul, pushing average cost up
... which might have the highest sector margins
Source: Espírito Santo Research

36
Petrochemical Sector, Feb-06
Second Generation
In this section we try to map out the productive structure of second generation petrochemicals, responsible for the production of the main thermoplastic resins and petrochemical intermediaries: Polyethylene (HDPE, LDPE and LLDPE), Polypropylene (PP), Pet, PVC and Styrene/ Polystyrene (PS).
Polyethylene (PE)
Domestically, eight companies produce PE, with highlights to Braskem, the market leader with a share of ~35% and Ipiranga Petroquímica and Politeno, with approximately 20% each. Riopol starts operating at the end of 2005 with a fully integrated 540kton/year capacity, with the possibility of reaching a market share of 20% until 2007E. Its arrival promises to trouble the market, possibly reducing the premium level exercised by the producing companies at around 15%-20%.
TABLE 12: Domestic Capacity of Polyethylene (PEAD, PEBD and PEBDL) Companies PEAD PEBD PEBDL Total %Braskem* 250 210 380 840 28.0%Ipiranga* 275 - 275 550 18.4%Rio Polímeros* ** 270 - 270 540 18.0%Dow Chemical (Brazil) - 144 - 144 4.8%Politeno* 105 150 105 360 12.0%Petroquímica Triunfo - 160 - 160 5.3%Polietilenos União *** 100 120 100 320 10.7%Solvay 82 - - 82 2.7%Total 1,082 784 1,130 2,996 100.0%
Source: Espírito Santo Research , Abiquim and companies * Flexible capacities in 50% PEAD and 50% PEBDL ** 4Q05 *** Inc . expansion of 200kton/year of PEAD/PEBDL
Polyprophylene PP
Three national companies produce PP and the dispute over the PP market is concentrated between Polibrasil (currently a PP division of Suzano) and Braskem, with 47% and 41% share respectively, in addition to IPQ's 12% interest.
Polibrasil's largest and most modern plants are located in Mauá (São Paulo State), Duque de Caxias (Rio de Janeiro State) and Camaçari (Bahia State). The Braskem plants are located in Triunfo (Rio Grande do Sul State), where the Ipiranga plant is also located.
Corporate consolidation and scale are the weapons used in this competition and new projects are presently being announced by Braskem and Polibrasil in an effort to meet growing market demand. The projects, which are primarily concentrated in the Southeast of the country, have been established to take advantage of the Propylene currents available at the Petrobras refineries and local demand.
TABLE 13: Domestic Capacity of Polyprophylene Companies Total (recent) % Total (exp.)* %
Suzano Petroquímica (Polibrasil) 625 47.2% 875 47.2%Braskem 550 41.5% 830 44.7%Ipiranga 150 11.3% 150 8.1%
Total 1,325 100.0% 1,855 100.0%
Source: Espírito Santo Research , Abiquim and companies
Polyvinyl Chloride (PVC)
Braskem and the multinational Solvay Indupa are the only producers of PVC in Brazil, the former being the market leader in the sector with a market share reaching the 70% mark. Slovay's two plants are located in São Paulo State and are therefore closer to the product's consumer market. Despite their proximity, the Braskem plants remain competitive due its scale in Ethylene, EDC, and MVC production in integrated plants. Braskem has already announced a 50kton/year expansion that should become operational in 2H05, with a potential additional increase of 100kton/year.

37
Petrochemical Sector, Feb-06
TABLE 14: Domestic Capacity of PVC Companies Total %Braskem* 550 70.0%Solvay 236 30.0%Total 786 100.0%
Source: Espírito Santo Research , Abiquim and companies * Considering expansion of 50kton/year in the 2H05
Polyethylene Terephthalate (PET)
The national installed capacity for PET production is not competitive on a global scale, nor to meet the current internal demand which stands at approximately 400-450kton/year for use of the resin in bottle production. The resulting supply scarcity on the national market has led to an increase in the resin’s imports, in addition to the development of a particularly strong secondary resin market (recycling), also related to a huge network of poor people collecting waste. For a petrochemical company such as Braskem, PET production tends not to be a particularly attractive activity. It is not a central focus for the company, and as a result there is a lack of investment for additional installed capacity.
TABLE 15: Domestic Capacity of PET Companies Total %Rhodia-Ster (Mossi&Ghisolfi) 290 73.6%Braskem 70 17.8%Vicunha Têxtil 24 6.1%Ledervin 10 2.5%Total 394 100.0%
Source: Espírito Santo Research , Abiquim and companies * Considering expansion of 50kton/year in the 2H05
Polystyrene (PS)
In Brazil, the substitution process of PS for other, more modern resins remains in a less advanced stage of development. Investments are meager and capacity is concentrated in the hands of large foreign companies that have been around since the sector's inception. Dow and Innova, an indirect subsidiary of Petrobras (through PEPSA), are integrated resin manufacturers.
TABLE 16: Domestic Capacity of Styrene and Polystyrene Companies Styrene PS Total %Basf - 190 190 16.5%Dow Chemical (Brazil) 160 190 350 30.4%Innova (Petrobras Energia) 250 120 370 32.2%CBE 120 - 120 10.4%Videolar - 120 120 10.4%Total 530 620 1,150 100.0%Source: Espírito Santo Research , Abiquim and companies * Considering expansion of 50kton/year in the 2H05

38
Petrochemical Sector, Feb-06
6. CONSOLIDATION: WHAT ARE THE NEXT STEPS?
Although it remains a challenging task to anticipate what exactly should be the next steps in the consolidation process, a prediction for which the market eagerly waits in anticipation, we will attempt to discuss some of the possible scenarios in this section, as we believe it to be an key trigger for the sector's shares. It is important to remember that any discussion surrounding consolidation must involve an analysis of new ventures, given that they affect the appetite for a M&A spree.
The consolidation process in the sector has been widely antecipated by the market.
Initially, Petrobras' role in the sector must be taken into account, due to its position as the largest materials’ supplier in the sector, a goliath in the internal crude oil chain, and one that has stated firmly that it does not intend to take on a secondary role in the sector any longer.
TABLE 17: Petroquisa’s investments
Companies Total C. (%) Voting C. (%) Investment(R$mn) Products StatusBraskem 8.5% 10.0% 378.1 General Petrochemicals OperationalCopesul 15.6% 15.6% 215.0 Basic Petroquemicals OperationalPQU 17.4% 17.5% 114.1 Basic Petroquemicals OperationalMetanor 34.3% 49.5% 35.8 Methanol OperationalF. Carioca de Catalisadores 50.0% 50.0% 69.4 OperationalPetrocoque 35.0% 35.0% 28.8 Calcined Coke OperationalDeten 27.7% 28.6% 62.4 LAB Operational
Petroquímica Triunfo 85.0% 70.5% 196.1 PEBD OperationalInnova 100.0% 100.0% 74.6 Styrene and PS OperationalPetroRIO 100.0% 100.0% 41.6 Basic Petroquemicals Paralysed Proj.
Rio Polímeros 16.7% 16.7% 197.7 Polyethylenes + Prophylene Start-up Source: Espírito Santo Research and Petrobras
We believe that future plans for expansion in the petrochemical sector depend heavily on the availability of raw materials, as much in the first generation where crackers process either Naphtha or Natural Gas, as in the second generation, since the plants are running at their production limits and importing basic petrochemical products is not so easily accomplished. Hence the importance of strategic partnerships with Petrobras, virtually the only national supplier of crude oil and Natural Gas, and holder of the transport infrastructure.
The projects currently under discussion in the sector (at least those that have been publicly broadcasted) deal primarily with the usage of Natural Gas, the source of Ethane, to be transformed into Ethylene. This trend bodes well with Petrobras' alleged intention to monetize its Natural Gas reserves as well as find an end-use for the importation of Bolivian gas (less clear now).
The chief projects involving the state-owned company, are UPB and the GasBol project. In addition to these greenfield projects we would like to reiterate that there is a firm possibility that Petrobras will increase its stake in Riopol, buying BNDES out, matching Suzano’s and Unipar’s 33.3% stake each. Due to our belief that BNDES’s primary role has been met on this project, and that Petrobras would be interested in a higher petrochemical exposure, we feel that the state–held company's increase in the venture makes sense because, as the company has enough funds. Our reading of the broader scenario is that Petrobras would give preference to greenfield projects and leave consolidation of the sector on the hands of the private players.
We believe that the petrochemical sector in Brazil, specially the 2nd generation, is considerably fragmented and riddled with a complex web single-product companies, that lack adequate production scale to be competitive and attractive for the future investments that are necessary for the industry. We therefore support the logic behind sectorial consolidation, and we shall provide more details on the main possibilities.
♦ Braskem acquiring Copesul The first possibility that comes to our mind, is the acquisition of Copesul by Braskem. It could be brought about by the unfolding of Petroquisa’s (Petrobras’ petchem arm) call option has to increase its voting stake in Braskem from the current 10% to 30%. Petrobras would subscribe
Strategic partnerships with Petrobras are important. Projects currently under discussion in the sector deal primarily with the usage of Natural Gas. We feel that Petrobras will exercise its right to increase its stake in Riopol. We judge consolidation to be logical step in the sector due to its severe fragmentation, particularly with 2nd generation In Apr/06, Petrobras will exercise its call option in order to increase its stake in Braskem.

39
Petrochemical Sector, Feb-06
this capital increase by capitalizing some of its petrochemical assets into Braskem. In Sep/05, both companies agreed to include the 3 most interesting assets (in Braskem’s standpoint) in the valuation process to take place by Apr/06: 15.63% of Copesul, 85.04% of Petroquímica União, and the 40% interest Petroquisa holds in Petroquímica Paulínia (a company that is still in the pre-implementation stages).
Basing on our valuations of Copesul and Braskem, we gauge that the 15.6% stake in the plant held by the state-run company would be worth nearly R$916mn, which is close to the R$966mn equioty increase to occur in Braskem. That being the case, it would be possible for Petrobras to also capitalize its stake in Petroquímica Paulínia, whose equity would be in the neighborhood of R$260mn (or R$100mn proportionally), and receive PNA shares for any excess.
We undesrtand that this movement is quite desirable for Braskem, given the high degree of integration and synergy potential and the fact that a large portion of Braskem's 2nd generation assets are sited in the Southern Complex. However, it is important to point out that wwhole nin-yards in terms of sinergy would only be captured if Braskem could purchase all of Copesul’s shares, merging it into Braskem, eliminating any fiscal inefficiencies.
If that step (Petroquisa’s exercise) were to take place (our base case), it would only be the first one. According to the shareholders agreement in force at Copesul, between Braskem and Ipiranga Petroquímica, each of the parties is guaranteed the right to match the other party's interest, allowing Ipiranga to acquire half of the interest received by Braskem, and therefore maintaining equality in the controlling block.
There has been speculation for some time that the Ipiranga Group would be interested in selling out of their petrochemical arm , Ipiranga Petroquímica (IPQ). In addition to its interest in Copesul, Ipiranga Petroquímica holds also a production capacity of 550ktons of PE and 150ktons of PP. One of the more relevant issues that involves the Ipiranga Group is the complexity of its control structure. With several families clashing for control, strategic decisions are sometimes very har to be agreed upon. In this context we cannot guarantee that the Ipiranga Group would be able to bring together the resources in order to make the approximately R$460mn investment referent to Braskem's half in Copesul’s exchanged stake. Moreover, we believe Ipiranga must put in the necessary effort to exercise its right to the additional 7.8% in Copesul, if nothing else, to increase its value in the case of disposal. In any case, it seems highly unlikely that the Ipiranga Group would accept selling its interest in Copesul separately, while settling with its other petrochemical assets, as CBPI's (the most liquid of the group's shares) interest in Copesul, at market prices is equivalent to 1/3 of its own equity value. Therefore, the full sale of IPQ, in our opinion, would be feasible and would be of interest to Braskem.
Going on our hypothesis of the option’s exercise, it is quite likely, according to the Bras kem’s and Copesul’s understanding, that the buyers of Petrobras's stake would have to extend their offer to Copesul’s minority shareholders, as Braskem would have acquired more than 1/3 of the float. This would imply, according to our calculations, an additional joint outlay of approximately R$1.2bn. Totaling half of that amount, together with half of Petrobras's 15.6% (R$458mn), Braskem and Ipiranga would have to spend at least respectively R$120mn (net of the R$458mn) and R$1bn on the operation. We believe it to be rather unlikely that Ipiranga is prepared to pay such an amount. Braskem, on the other hand, could easily bear the expenditure. However, if Ipiranga were not up for it, Braskem would possibly have to expend R$2.6bn (to acquire Copesul in its entirety), thus requiring further access to the capital market (debt or equity). Having said that, we believe that if the opportunity arises, Braskem would most likely take it because the full acquisition of Copesul is Braskem’s A-game.
We feel that from Braskem's point of view, the best option would be the total acquisition and subsequent delisting and merger of Copesul, which would bring about enormous fiscal and operational synergies, similar to those obtained during Braskem's initial creation process. The move would lay the groundwork for the company's continued growth.
It is important to point out that we consider premature to assume that the simple Petroquisa‘s
TABLE 18: Petroquisa’s Call Petroquisa's Stake (before)
k shares %Braskem ON 12,111 10.0%Copesul ON 23,482 15.6%
Stakes involved in transactionk shares R$mn*
Braskem ON 34,496 966Copesul ON 23,482 916In excess value 50
Petroquisa´s Stakek shares %
Braskem ON 46,607 30.0%
Relative Value: (BRKM/CPSL)Market Cap. 0.62Fair Equity Value 0.76Upside/(Downside) 23%
Source: Espírito Santo Research *Target
Just in case of exercise, it only be the first of many steps... CHART 62: IPQ Structure
Refinaria Ipiranga
(RIPI)
Distribuidora Ipiranga
(DPPI)
Petróleo Ipiranga
(CBPI)
Ipiranga Com, Química
(ICQ)
Ipiranga Petroquímica
(IPQ)
58,5%41,5%
11,4%
21,0%
7,64%
58,5%
88,5%
29,5%
Others7,9%
Dresdner3,6%
29,5%* 15,6%
25,4%
Refinaria Ipiranga
(RIPI)
Distribuidora Ipiranga
(DPPI)
Petróleo Ipiranga
(CBPI)
Ipiranga Com, Química
(ICQ)
Ipiranga Petroquímica
(IPQ)
58,5%41,5%
11,4%
21,0%
7,64%
58,5%
88,5%
29,5%
Outros7,9%
Dresdner3,6%
29,5%* 15,6%
25,4%Free Float
Source: Espírito Santo Research
... that would lead to Braskem purchasing all of Cosesul’s capital for approximately R$2,4bn. The process, as a result, would add value to Braskem.
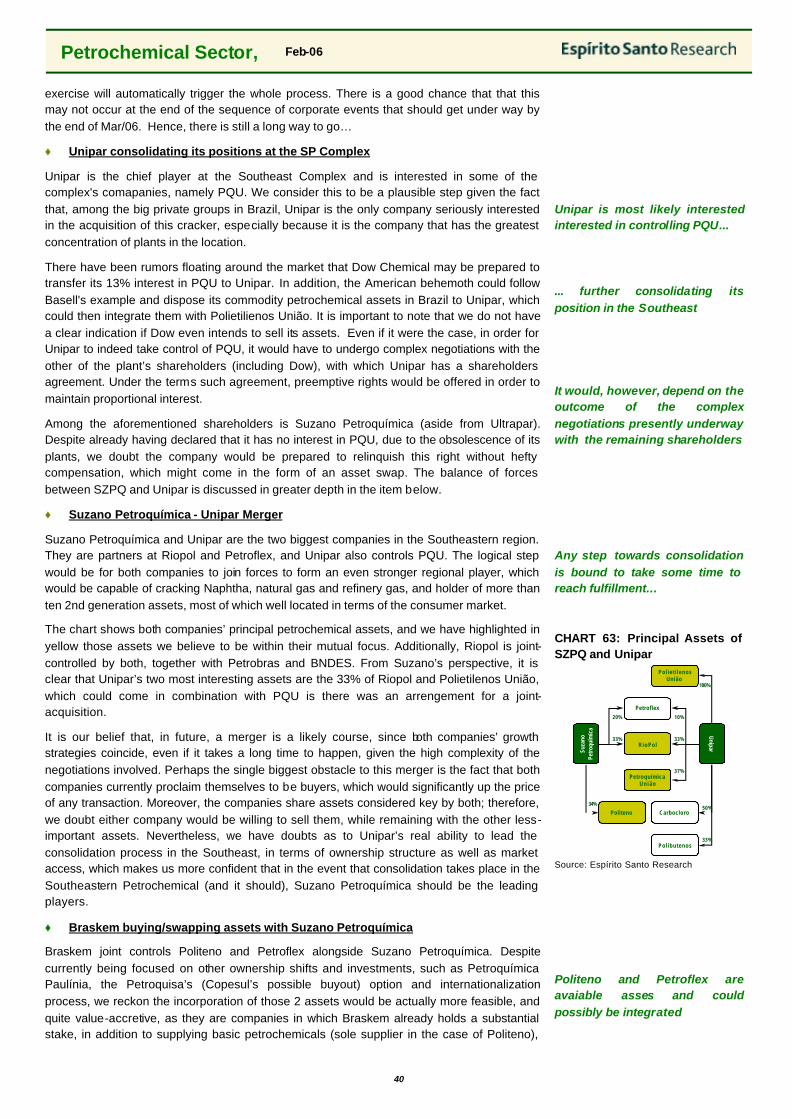
40
Petrochemical Sector, Feb-06
exercise will automatically trigger the whole process. There is a good chance that that this may not occur at the end of the sequence of corporate events that should get under way by the end of Mar/06. Hence, there is still a long way to go…
♦ Unipar consolidating its positions at the SP Complex
Unipar is the chief player at the Southeast Complex and is interested in some of the complex's comapanies, namely PQU. We consider this to be a plausible step given the fact that, among the big private groups in Brazil, Unipar is the only company seriously interested in the acquisition of this cracker, especially because it is the company that has the greatest concentration of plants in the location.
There have been rumors floating around the market that Dow Chemical may be prepared to transfer its 13% interest in PQU to Unipar. In addition, the American behemoth could follow Basell's example and dispose its commodity petrochemical assets in Brazil to Unipar, which could then integrate them with Polietilienos União. It is important to note that we do not have a clear indication if Dow even intends to sell its assets. Even if it were the case, in order for Unipar to indeed take control of PQU, it would have to undergo complex negotiations with the other of the plant’s shareholders (including Dow), with which Unipar has a shareholders agreement. Under the terms such agreement, preemptive rights would be offered in order to maintain proportional interest.
Among the aforementioned shareholders is Suzano Petroquímica (aside from Ultrapar). Despite already having declared that it has no interest in PQU, due to the obsolescence of its plants, we doubt the company would be prepared to relinquish this right without hefty compensation, which might come in the form of an asset swap. The balance of forces between SZPQ and Unipar is discussed in greater depth in the item below.
♦ Suzano Petroquímica - Unipar Merger
Suzano Petroquímica and Unipar are the two biggest companies in the Southeastern region. They are partners at Riopol and Petroflex, and Unipar also controls PQU. The logical step would be for both companies to join forces to form an even stronger regional player, which would be capable of cracking Naphtha, natural gas and refinery gas, and holder of more than ten 2nd generation assets, most of which well located in terms of the consumer market.
The chart shows both companies’ principal petrochemical assets, and we have highlighted in yellow those assets we believe to be within their mutual focus. Additionally, Riopol is joint-controlled by both, together with Petrobras and BNDES. From Suzano’s perspective, it is clear that Unipar’s two most interesting assets are the 33% of Riopol and Polietilenos União, which could come in combination with PQU is there was an arrengement for a joint-acquisition.
It is our belief that, in future, a merger is a likely course, since both companies’ growth strategies coincide, even if it takes a long time to happen, given the high complexity of the negotiations involved. Perhaps the single biggest obstacle to this merger is the fact that both companies currently proclaim themselves to be buyers, which would significantly up the price of any transaction. Moreover, the companies share assets considered key by both; therefore, we doubt either company would be willing to sell them, while remaining with the other less-important assets. Nevertheless, we have doubts as to Unipar’s real ability to lead the consolidation process in the Southeast, in terms of ownership structure as well as market access, which makes us more confident that in the event that consolidation takes place in the Southeastern Petrochemical (and it should), Suzano Petroquímica should be the leading players.
♦ Braskem buying/swapping assets with Suzano Petroquímica
Braskem joint controls Politeno and Petroflex alongside Suzano Petroquímica. Despite currently being focused on other ownership shifts and investments, such as Petroquímica Paulínia, the Petroquisa’s (Copesul’s possible buyout) option and internationalization process, we reckon the incorporation of those 2 assets would be actually more feasible, and quite value-accretive, as they are companies in which Braskem already holds a substantial stake, in addition to supplying basic petrochemicals (sole supplier in the case of Politeno),
Unipar is most likely interested interested in controlling PQU... ... further consolidating its position in the Southeast It would, however, depend on the outcome of the complex negotiations presently underway with the remaining shareholders Any step towards consolidation is bound to take some time to reach fulfillment...
CHART 63: Principal Assets of SZPQ and Unipar
RioPol
Carbocloro
Petroflex
PetroquímicaUnião
Polibutenos
Poliet i lenosUnião
37%
10%
33%33%
20%
50%
33%
100%
Suza
noPe
troq
uím
ica
Unipar
Politeno34%
Source: Espírito Santo Research Politeno and Petroflex are avaiable asses and could possibly be integrated

41
Petrochemical Sector, Feb-06
which could yield substantial synergies. Furthermore, the other co-controller in those enterprises is quite likely willing to negociate them.
In Politeno’s case, the sale to Braskem would be a natural step, since it fully converges with the latter’s strategy for integrating 1st and 2nd generation. In fact, in 2006E, Braskem should supply 360ktons of Ethylene, representing a cost of ~R$670mn for Politeno. If Braskem were to incorporate Politeno, it could rather than sell raw Ethylene, market R$1bn worth of PE, thereby incurring R$120mn in additional costs, not to mention the potential tax gains and administrative synergy.
Longliving the current control structure, in our opinion, would be a setback in terms of that company’ long-term growth, since Braskem would tend to privilege, in its investment plan, enterprises in which it holds a bigger stake (and control), instead of committing capital and/or supplying additional Ethylene (arising from de-bottleneckings). Therefore, such assets, despite being appealing, efficient and within Suzano Petroquímica’s focus, appears destined for sale to Braskem, which has recently been giving signs that it might implement this movement as early as in 2006.
The case of Petroflex is a bit more complex because just as Suzano Petroquímica’s strategic focus is away from the company’s core operations, its remaining shareholders also follow suit. Therefore, it’s a company with plenty of potential sellers and no potential buyers, unless some international player showed up willing to do so, regardless of the local market’s shortage of Butadiene.
Does this mean that Petroflex is an unattractive asset? No. It’s a global scale producer, with a quasi monopoly over the domestic market, a solid balance sheet structure and is far off in its learning curve, having accumulated efficiency gains. In our assessment, despite the fact that it doesn’t actually produce thermoplastic resins, Petroflex is a sound asset for one to hold within a business portfolio context, and represents an interesting and more stable diversification than the chief focus of its parent companies.
Taking all these factors into consideration, we believe a feasible solution to the current situation would be an asset swap, in which Braskem would get SZPQ’s stake in Politeno (achieving 70% of the total), which would thereby double its stake in Petroflex to 40%. Thus, Suzano would enlarge its strategic focus to encompass the production of elastomers, as the alternative to divest simultaneously from both companies would totally conflict with its intentions to grow and establish itself as the 2nd domestic player.
According to our calculations, Braskem would have to pay a net amount of roughly R$88mn in this swap, which could involve assets as a compliment.
Ü Buyout of Polialden – Braskem is postponing its adherence to Level 2 due to the uncertainties in relation to the arbitration court’s performance in the court dispute with a few minority Polialden shareholders regarding its past dividend policy. We believe Braskem will resolve these pending issues and delist Polialden in order to migrate to Level 2 of Bovespa, what could happen in the short term;
Ü PDVSA acquiring PTIP – If speculations were confirmed, we believe the Venezuelan government-owned company might be mostly interested in the fuel distribution assets, spinning off IPQ. Thus, Braskem might endeavor to acquire the petrochemical assets, which include Copesul, possibly through a share swap. We view this to be a highly remote possibility in terms of the sale of PTIP, as well as the possible willingness of the Ipiranga group to reach an agreement with terms favorable to Braskem. In any case, one must doubt the rationality of any move by PDVSA, under the command of Hugo Chavez, and PDVSA could come spending big;
Ü Entry of a new foreign player – We don’t foresse any global corporation (such as Dow Chemical, for example) that would be interested in making substantiial investments in the domestic market, where regional players predominate. Not to mention the fact that such international companies are eyeing other regions, such as Asia; therefore, there wouldn’t be any particular advantage or rationale to acquire a
TABLE 19: Possible Asset Swap
% R$mn*Braskem 35.0% 234Suzano Pet. 35.0% 234
Participations in Petroflex (before)% R$mn*
Braskem 20.1% 146Suzano Pet. 20.1% 146
Participations in Politeno (after)% R$mn*
Braskem 70.0% 468Suzano Pet. 0.0% 0
Participations in Petroflex (after)% R$mn*
Braskem 0.0% 0Suzano Pet. 40.2% 292
Added Value to be Received/(Paid)R$mn*
Braskem (88)Suzano Pet. 88
Source: Espírito Santo Research *Target BRKM could take Politeno and SZPQ, Petroflex There have been reports for some time of PDVSA’s interest in Ipiranga

42
Petrochemical Sector, Feb-06
local group with little synergy to offer;
Ü Internationalization – As mentioned in section 4, we believe certain Brazilian companies, notably Braskem and Suzano Petroquímica, to name a few, would be interested in undertaking a process of geographical expansion. In addition to the obvious candidate projects, such as JVs in Bolivia and Venezuela, we believe the companies may be interested in Petroken (Basell may be looking to divest as it did with other commodity-resin assets such as Polibrasil), Petrobras Energia’s Petroquímica Cuyo or even its assets in Colombia. Ultrapar has also indicated to be on the verge of an acquisition abroad, possibly in the specialty chemical segment;

43
Petrochemical Sector, Feb-06
7. ES RESEARCH PROJECTIONS
In this section, we set forth the main assumptions and projections that support our sector views, recommendations and estimates.
TABLE 20: ES Research Macroeconomic Premises Premises 2004 2005E 2006E 2007E 2008E 2009E 2010E 2011E 2012E 2013E 2014E 2015E
GDP Growth (%) 4,9% 2,7% 3,9% 4,2% 4,2% 4,5% 4,7% 4,7% 4,7% 4,7% 4,7% 4,7%Inflation, ACPI 12m (%) 7,6% 5,2% 4,2% 4,3% 4,3% 4,3% 4,4% 4,4% 4,4% 4,4% 4,4% 4,4%Currency, final (R$/ US$) 2,65 2,23 2,29 2,44 2,61 2,73 2,82 2,88 2,94 3,00 3,06 3,12 --Change (%) -8,1% -15,9% 2,6% 6,5% 6,9% 4,6% 3,6% 2,0% 2,0% 2,0% 2,0% 2,0%Currency, avg. (R$/ US$) 2,92 2,43 2,26 2,36 2,52 2,67 2,78 2,85 2,89 2,97 3,03 3,09 --Change (%) -4,7% -16,8% -6,9% 4,5% 6,7% 5,7% 4,1% 2,8% 1,3% 2,8% 2,0% 2,0%Selic, avg. (%) 16,3% 19,1% 15,3% 13,5% 12,1% 11,2% 11,2% 11,2% 11,2% 11,2% 11,2% 11,2%
Source: Espírito Santo Research
In terms of investment recommendations, we have rated Copesul and Suzano Petroquímica as BUY. Despite displaying the smallest upside of all the stock covered herein, our positive recommendation in relation to CPSL3 is based on the expectation of the materialization of such upside sooner than 12 months, since the Petroquisa’s call option expires on 03/31/2006, and its shareholders should be entitled to receive a sum close to the fair value in the offer’s extension to the remaining float. Our call on Suzano Petroquímica is a value-play, indicated via DCF, and betting on the “new” qualitative level, achieved with the complete integration of Polibrasil, shareholder restructuring and the start-up of the sector’s premium asset, Riopol.
Meanwhile, with regards to the remaining companies – Braskem, Ultrapar and Petroflex – we recommend a more NEUTRAL position. In the case of the first two, our recommendation is basically due to negative momentum, as we believe both companies represent solid cases in the long term; whereas, with respect to Petroflex, we consider the lack of short-term catalysts and the competition from imported goods must diminish the stock’s attractiveness. Concerning Braskem, it is our opinion that, in the absence of additional specific drivers (mainly consolidation), the cos t pressures and Riopol’s market entry should continue to pressure its results in 2006E,leaving 2007E as the only good year of the cycle. In terms of Ultrapar, the more negative cycle for MEG prices, as well as the effects of the slower recovery of revenues and the greater competition in the LPG segment should result in a negative moment for the stock in the short term.
Buy: Copesul and Suzano Petroquímica Neutral: Braskem, Ultrapar and Petroflex
TABLE 21: Valuation Highlights (1/2)
Ticker Recommendation Current Price Market Cap Ent. Value 05E Target Price Upside(Most líquid) (R$/share) (R$mn) (R$mn) (R$/share) (%)
Braskem BRKM5 NEUTRAL 18.88 6,845 10,072 28.00 48.3%Copesul CPSL3 BUY 30.90 4,642 4,806 39.00 26.2%Suzano Petroquímica SZPQ4 BUY 4.70 1,065 2,528 7.93 68.7%Ultrapar UGPA4 NEUTRAL 33.25 2,704 2,558 51.00 53.4%Petroflex PEFX5 NEUTRAL 16.50 581 733 24.00 45.5%Source: Espírito Santo Research and companies
TABLE 22: Valuation Highlights (2/2) – Estimates per Company/ Asset
Calculated Capacity EV/Capacity CAGR EBITDA ND/Equity EBITDA(US$/ton)Fair EV (kton/year) (R$/ton) 05-08E 2005E 2006E
Braskem* 14,043 5,159 2,722 9% 69% 227Copesul 5,223 3,000 1,741 6% 15% 161Politeno 720 360 1,999 3% 10% 182Suzano Pet. (Polibrasil) 1,643 625 2,628 27% 83% 195RioPol 2,653 635 4,178 nm 126% 251Petroflex 917 411 2,232 1% 45% 210Suzano Petroquimica (pro-form) 3,269 1,045 3,127 37% 146% 193Oxiteno** 1,779 850 2,093 6% -22% 221Source: Espírito Santo Research and companies * estimated capacity (ex. internal transferences) ** Valuation and exclusive financial data of Oxiteno and in this analysis we consider a estimate capacity that could vary depending on sales mix
In addition to those investment thesis above, we present below a operational discussion regarding the companies. The following table contains the key forecasts for the sector’s ES Research covered companies:

44
Petrochemical Sector, Feb-06
TABLE 23: Income and Valuation Evolution of Brazilian Companies
2004 2005E 2006E 2007E 2008E 2009E 2010EBraskem P/CE (inc. participations)** 8.5 5.5 7.0 5.1 4.5 5.7 6.8 EV/EBITDA (inc. participations)** 5.1 4.4 4.3 3.6 3.4 4.0 4.6 EBITDA Margin 23.1% 17.4% 18.1% 21.7% 22.5% 19.8% 17.5% ROIC (EBIT) 26.9% 19.3% 19.9% 25.1% 27.9% 21.6% 18.1% Dividend yield ** 1.7% 3.3% 1.5% 11.4% 14.5% 8.7% 6.0% FCFE yield ** -0.8% 8.3% 6.3% 16.0% 18.7% 12.9% 9.7%Copesul P/CE 7.6 6.2 6.6 6.0 5.5 7.3 9.6 EV/EBITDA 5.4 4.6 4.5 4.1 3.7 4.8 6.2 EBITDA Margin 19.7% 19.3% 19.9% 23.0% 24.1% 20.9% 17.3% ROIC (EBIT) 44.1% 66.2% 70.0% 92.1% 118.1% 97.9% 77.3% Dividend yield 9.5% 13.9% 11.9% 13.7% 15.7% 10.2% 7.1% FCFE yield 3.3% 12.4% 17.0% 16.9% 16.1% 11.5% 8.0%Suzano Petroquímica P/CE 9.3 9.9 4.3 3.0 2.9 3.5 3.9 EV/EBITDA 8.8 15.4 6.0 4.1 3.9 4.4 4.7 EBITDA Margin 14.8% 8.5% 14.1% 17.5% 16.5% 13.6% 12.0% ROIC (EBIT) 12.0% 4.3% 9.1% 15.8% 16.7% 12.4% 11.0% Dividend yield 2.8% 1.4% 4.5% 13.6% 14.8% 10.4% 8.1% FCFE yield -0.5% 29.0% 8.7% 25.8% 20.6% 22.7% 11.9%Ultrapar P/CE 6.0 5.4 5.5 5.3 4.9 4.6 4.6 EV/EBITDA 4.7 4.6 4.9 4.3 3.8 3.5 3.3 EBITDA Margin 15.4% 12.1% 11.7% 12.9% 13.7% 14.6% 14.6% ROIC (EBIT) 32.8% 24.0% 21.1% 22.9% 25.9% 28.1% 28.9% Dividend yield 4.8% 5.9% 8.5% 8.8% 10.6% 11.5% 12.0% FCFE yield 9.8% 10.1% 6.0% 11.3% 11.0% 13.9% 14.5%Petroflex P/CE 4.4 4.9 4.8 4.5 3.9 3.7 3.6 EV/EBITDA 2.1 3.7 4.3 3.9 3.4 3.2 3.1 EBITDA Margin 14.0% 14.3% 13.1% 13.5% 14.3% 14.9% 15.0% ROIC (EBIT)*** 26.7% 28.4% 21.5% 22.2% 24.4% 24.8% 25.6% Dividend yield 10.2% 5.6% 15.7% 17.0% 19.9% 21.1% 22.2% FCFE yield 34.6% 30.9% 16.6% 20.5% 24.0% 23.1% 23.3% Source: Espírito Santo Research and companies ** Adjusted for dilution *** Adjusted for IPI outlay (2004 and 2005E) CHART 64: EV/EBITDA 2006E vs. CAGR EBITDA 05-08E CHART 65: PE/BV 2006E vs. FCFE Yield 2006E *
-
1.0
2.0
3.0
4.0
5.0
6.0
7.0
-20% -10% 0% 10% 20% 30% 40% 50% 60%
EBITDA - CAGR 05-08E
EV
/EB
TID
A -
200
6E
PEFX5BRKM5
UGPA4CPSL3
SZPQ4
-
1.0
2.0
3.0
4.0
5.0
6.0
0.0% 5.0% 10.0% 15.0% 20.0% 25.0% 30.0%
Free Cash Flow to Equity Yield - 2006E
PE
/BV
- 20
06E
SZPQ4
BRKM5
UGPA4
PEFX5
CPSL3
Source: Espírito Santo Research Source: Espírito Santo Research * Adjusted for IPI contingency
In the following charts, we have highlighted certain operating figures, on which our estimates for each company are based, in order to better represent the specifics of each asset:
♦ Among PE producers, Politeno stands out due to the fact that it achieves higher average prices (as it has historically), selling a bigger portion in the domestic market, and greater participation of LDPE in its sales mix, as this product has higher prices;
♦ Among PP producers, we observed that Polibrasil has been achieving a slightly higher average price than Braskem, taking advantage of its strong position in the market, and favorable location close to clients. Therefore we estimate that this situation should persist;
♦ Observing the unit revenue chart for Copesul alongside Braskem’s basic petrochemicals business division, we noted considerable price alignment between those two crackers;
Integral contingency outlay of IPI already in 2006E, conv erting the company into Net Debt
Increasing EBITDA Margin, due to specialties increase in the Oxiteno mix and improvement in GLP segments (Ultragaz) and Logistic (Ultracargo)
Riopol’s phase-in, balancing EBITDA generation with Net Debt, and resulting in strong cash flow generation
After debenture conversion in 2007E, we assumed Braskem will become a solid dividend payer, in order to maintain a good capital structure
High dividend yields are one of the main attractives of the shares

45
Petrochemical Sector, Feb-06
♦ Observing chart 67, where the Unitary Revenue of all companies is shown, we take in that the exclusively 2nd generation companies naturally rank higher. Petroflex’s sales portfolio is quite different from the rest, obtaining a higher average income. As Copesul only operates in 1st generation, its unitary revenue is the lowest; whereas, Braskem’s unit revenue is mid range as it combines the sale of Polymers with Olefins (exactly Riopol’s strength for it doesn’t sell basic products);
♦ We refer to price differential the companies managed to charge their products above its respective feedstock as to unitary spread. Among the companies that post the highest spreads are Rio Polímeros and Petroflex. In Riopol’s case, this is due to the fact that the company is fully integrated, selling only 2nd generation products, while its principal raw material is Ethane (similar price to that of a cracker’s input). Whereas, in terms of Petroflex, this fact is more related to its favorable market position and its high value added mix;
♦ In terms of the EBITDA/ton, which we consider to be the sector’s best operating indicator, the highlights are Riopol, for the same reasons provided above, and Braskem as it also integrates 1st and 2nd generation, produces at a singular scale and is remarkably focused on efficiency and synergy gains. Copesul, on the other hand, shows the lowers figures for this indicator.
CHART 66: Unitary Revenue – PE Producers (USD/ton)
CHART 67: Unitary Revenue – PP Producers (USD/ton)
CHART 68: Unitary Revenue – Crackers (USD/ton)
400
600
800
1,000
1,200
1,400
1,600
2004
2005
E
2006
E
2007
E
2008
E
2009
E
2010
E
2011
E
2012
E
2013
E
2014
E
2015
E
PE - Braskem PE - RioPol
PE - Politeno PE (international market)
400
600
800
1,000
1,200
1,400
1,600
2004
2005
E
2006
E
2007
E
2008
E
2009
E
2010
E
2011
E
2012
E
2013
E
2014
E
2015
E
PP - Suzano Pet (Polibrasil) PP - Braskem
PP (international market)
250
350
450
550
650
750
850
950
2004
2005
E
2006
E
2007
E
2008
E
2009
E
2010
E
2011
E
2012
E
2013
E
2014
E
2015
E
Braskem (Basics) Copesul
Ethylene Prophylene
Source: Espírito Santo Research Source: Espírito Santo Research Source: Espírito Santo Research
CHART 69: Unitary Revenue – General (USD/ton)
CHART 70: Unitary Margin or Spread on Input* (US$/ton)
CHART 71: Unitary EBITDA (US$/ton)
-
200
400
600
800
1,000
1,200
1,400
1,600
1,800
2,000
2004
2005
E
2006
E
2007
E
2008
E
2009
E
2010
E
2011
E
2012
E
2013
E
2014
E
2015
E
Braskem CopesulPoliteno Suzano Pet (Polibrasil)RioPol PetroflexOxiteno
-
100
200
300
400
500
600
700
800
900
1,000
2004
2005
E
2006
E
2007
E
2008
E
2009
E
2010
E
2011
E
2012
E
2013
E
2014
E
2015
E
Braskem CopesulPoliteno Suzano Pet (Polibrasil)RioPol PetroflexOxiteno
-
50
100
150
200
250
300
350
400
2004
2005
E
2006
E
2007
E
2008
E
2009
E
2010
E
2011
E
2012
E
2013
E
2014
E
2015
E
Braskem CopesulPoliteno Suzano Pet (Polibrasil)RioPol PetroflexOxiteno
Source: Espírito Santo Research Source: Espírito Santo Research
* Difference between Unitary Revenue and cost of the main input for each company .
Source: Espírito Santo Research

46
Petrochemical Sector, Feb-06
COMPANIES

47
Petrochemical Sector, Feb-06
BRASKEM: CONSOLIDATION MAY PROVE TO BE A
CATALYST…
NNEEUUTTRRAALL TTPP:: 2288//sshhaarree ((4455%% uuppssiiddee))
Braskem is the largest company and the most liquid stock in the sector. For this reason, its shares tend to more sensitive to changes in the industry outlook, which justifies the strong depreciation in the shares have undergone since Mar/05. In terms of valuation, our DCF model indicates an upside of 45%, albeit current, fully diluted EV/EBITDA of 4.4x for 2006FY seems unappealing. Despite our positive opinion for long-term investment, we are lowering our recommendation to Neutral in the hopes of a more appealing entry point for the shares, enphisizing that M&A should be its key trigger.
Potential Drivers:
♦ M&A: Braskem is the most solidly positioned company to lead the process, with 2 potential value-creation fronts: Politeno, with its more feasible execution and strong synergetic potential; and the Southern Complex (possibly incorporating CPSL and Pt. Triunfo), in the event it reaches a favorable terms with Ipiranga (please see section 6 of the report);
♦ New advantageous investments: There are interesting internationalization opportunities available that could provide Braskem with access to competitive raw materials and allow expansion to profitable consumer markets, like the US and Latin America;
♦ Improvements is profitability: In addition to integrating 1st and 2nd generations, Braskem possesses the most diversified product portfolio in the sector with the potential to reach elevated EBITDA/ton values and soften its volatility. The company has plans to develop its aromatics line with new investments, increasing integration and generating value. This step bodes well with profitabilty. In addition, efficiency programs (Braskem+ and Fórmula Braskem) and its larger scale may assist the company in mitigating the downside effects more significantly than the market has projected;
♦ Novel uses for its funds: The financial de-leveraging process, with the amortization of more expensive debts, provides for a better cost of capital and increasing potential for shareholder remuneration (dividends, buybacks, etc.), which is a good novelty for Braskem. Its focus has shifted from the management of its past high-indebtedness to finding value-accretive uses for its growing resources, such as investments and/or M&A;
TThe company's specific negative points and/or risks: ♦ Deterioration of the PE market: The profitability of the company's PE market and,
consequently its Ethylene stream, may suffer from more intense competition (mainly from Riopol’s start-up) in addition to the possibilty of an excess supplu, which might be added in the coming years;
♦ Less flexibility for raw materials: Its dependence on Petrobras for its supply of Naphtha (approximately 70% is supplied by Petrobras), which has been historically expensive, 10-15% above the average ARA bechmark, has had adverse effects on the company. In the event of any changes in price policy or supply, Braskem would be directly affected;
♦ Overhangs and dilution: Events such as the conversion of BNDES debentures (included in the model) and verdicts in financial litigations may cause some impact in the short-term;
♦ Acquisitions could reach elevated multiples: Due to the fact that there are other players with consolidation-ambitions, eventual mergers may be done with peak-valuations, possibly leaving some investors uncomfortable;
Data and Estimates
Market Cap (R$mn) 6,845
Ent. Value 05E (R$mn) 10,072
Div. Yield 05E 3.3%
Pay Out 05E 38.1%
CAGR EBITDA (05-08E) 9.0%
ND/E 05E 68.9%
Free-Float 50.4%
Avg. Daily Volume R$m 29.0
Max/Min - 52 weeks (R$) 33,48/ 16,99
Shares # (mn) 363
Index Weight 2.7%
Valuation
Target Price Dec/06 29.00
Upside -42.5%
WACC 14.3%
Shareholders
Odebrecth 32.0%
Norquisa 9.1%
Petroquisa 8.5%
Others 50.4% Source: Espírito Santo Research and company
Relative Performance – BRKM5 (52 weeks)
50
6070
8090
100
110
120130
140150
Feb-05 Apr-05 Jul-05 Sep-05 Nov-05 Jan-06
B R K M 5
Ibov
Source: Economática
Proftability (%)
0%
5%
10%
15%
20%
25%
30%
2003 2004 2005E 2006EEBITDA Margin Liquid MarginROE ROIC
Source: Espírito Santo Research
Net EBITDA EPS* ∆ EPS P/E P/BV EV/ Dividend ROE EBITDA Capex/ FCFE
Income (%) EBITDA Yield (%) (%) Margin (%) EBITDA Yield (%)2004 691 2.549 1,90 - 17,3x 2,8x 5,1x 1,7% 21,9% 23,1% 0,1x -0,8%2005E 709 1.990 1,79 -6,2% 11,5x 1,7x 4,4x 3,3% 16,0% 17,4% 0,3x 8,3%2006E 405 2.036 0,93 -47,9% 20,5x 1,7x 4,3x 1,5% 8,4% 18,1% 0,3x 6,3%2007E 870 2.431 1,97 111,9% 9,6x 1,4x 3,6x 11,4% 15,6% 21,7% 0,2x 16,0%Source: Espírito Santo Research * Fully diluted BRKM5 Closing price: R$19,37/share in 12/06/2006

48
Petrochemical Sector, Feb-06
Braskem – Projection Table
Results (R$mn) 2004 2005E 2006E 2007E 2008E 2009E 2010E 2011E 2012E 2013E 2014E 2015ENet Revenues 11,043 11,435 11,246 11,184 11,478 10,643 10,581 11,030 11,546 12,333 13,065 13,518COGS (8,315) (9,238) (9,012) (8,518) (8,626) (8,243) (8,409) (8,760) (9,067) (9,432) (9,712) (10,044)
Gross Result 2,728 2,197 2,233 2,667 2,852 2,400 2,172 2,270 2,479 2,902 3,353 3,474 Gross Margin (%) 24.7% 19.2% 19.9% 23.8% 24.8% 22.6% 20.5% 20.6% 21.5% 23.5% 25.7% 25.7%Operating Expenses (894) (982) (977) (1,003) (1,026) (1,029) (1,043) (1,065) (1,089) (1,119) (1,149) (1,205)
EBITDA 2,549 1,990 2,036 2,431 2,580 2,107 1,850 1,911 2,081 2,459 2,865 2,984 EBITDA Margin (%) 23.1% 17.4% 18.1% 21.7% 22.5% 19.8% 17.5% 17.3% 18.0% 19.9% 21.9% 22.1%
Financial Result (1,180) (442) (790) (673) (584) (520) (495) (468) (464) (463) (461) (459)EBT 702 831 499 1,060 1,339 888 628 742 929 1,370 1,830 1,901Taxes 12 (122) (97) (193) (242) (168) (127) (147) (185) (260) (343) (432)
-- Taxes (%) -1.7% 14.7% 19.4% 18.2% 18.1% 18.9% 20.2% 19.8% 19.9% 19.0% 18.8% 22.7%Net Income 691 709 405 870 1,100 724 505 599 749 1,115 1,492 1,476
Liquid Margin (%) 6.3% 6.2% 3.6% 7.8% 9.6% 6.8% 4.8% 5.4% 6.5% 9.0% 11.4% 10.9%Depreciation&Amortization 715 775 779 768 754 736 721 705 690 676 662 715Cash Earnings 1,406 1,484 1,184 1,637 1,854 1,459 1,226 1,305 1,440 1,791 2,154 2,190
Dividend+IOE 204 270 121 957 1,210 724 505 599 749 1,115 1,343 1,328 Payout (%) 29.5% 38.1% 30.0% 110.0% 110.0% 100.0% 100.0% 100.0% 100.0% 100.0% 90.0% 90.0%
Balance Sheet (R$mn) 2004 2005E 2006E 2007E 2008E 2009E 2010E 2011E 2012E 2013E 2014E 2015ECurrent Assets 5,140 4,822 4,744 4,183 4,384 4,154 4,232 4,297 4,384 4,405 4,544 4,684 Cash&Equivalents 1,783 1,722 1,695 1,583 1,473 1,454 1,438 1,392 1,334 1,179 1,163 1,191 Accounts Receivables 1,293 1,282 1,322 1,166 1,314 1,189 1,238 1,297 1,376 1,491 1,583 1,626 Inventories 1,384 1,360 1,330 1,104 1,272 1,212 1,269 1,316 1,375 1,426 1,481 1,529LT Assets 773 946 907 831 835 837 852 888 929 976 1,026 1,078Fixed Assets 8,636 8,627 8,562 8,540 8,447 8,341 8,190 8,054 7,919 7,834 7,789 7,725Total Assets 14,549 14,395 14,212 13,554 13,666 13,332 13,275 13,239 13,232 13,215 13,358 13,487Current Liabilities 4,329 3,703 3,775 3,436 3,792 3,639 3,722 3,788 3,875 3,945 4,020 4,298 ST Debt 1,522 875 950 1,038 1,003 974 939 908 874 837 800 982 Suppliers 2,179 2,534 2,529 2,141 2,517 2,399 2,512 2,604 2,720 2,822 2,930 3,026 Taxes 201 157 162 143 143 143 143 143 143 143 143 143 Others 427 137 134 114 129 124 129 133 138 142 147 147LT Liabilities 5,864 5,829 5,256 3,820 3,652 3,470 3,330 3,228 3,135 3,048 2,966 2,670Shareholders Equity 4,188 4,693 5,010 6,127 6,051 6,051 6,051 6,051 6,051 6,051 6,201 6,348Total Liabilities 14,549 14,395 14,212 13,554 13,666 13,332 13,275 13,239 13,232 13,215 13,358 13,487Total Debt 5,799 4,939 4,852 3,504 3,301 3,090 2,915 2,782 2,655 2,531 2,412 2,298 Net Debt (Cash) 4,016 3,217 3,157 1,921 1,829 1,636 1,477 1,391 1,321 1,353 1,249 1,107 Invested Capital 8,469 8,133 8,396 8,292 8,141 7,960 7,811 7,730 7,666 7,704 7,756 7,767 Ratios 2004 2005E 2006E 2007E 2008E 2009E 2010E 2011E 2012E 2013E 2014E 2015E
Debt/Equity 138.5% 105.3% 96.8% 57.2% 54.6% 51.1% 48.2% 46.0% 43.9% 41.8% 38.9% 36.2%Net Debt/Equity 95.9% 68.6% 63.0% 31.4% 30.2% 27.0% 24.4% 23.0% 21.8% 22.4% 20.2% 17.4%Net Debt/EBITDA (x) 1.4 1.4 1.3 0.7 0.6 0.7 0.7 0.6 0.6 0.5 0.4 0.3 ROE 21.9% 14.4% 8.4% 15.6% 18.1% 12.0% 8.4% 9.9% 12.4% 18.4% 24.4% 23.5%ROIC (EBIT) 26.9% 19.3% 19.9% 25.1% 27.9% 21.6% 18.1% 19.4% 21.9% 27.9% 33.8% 34.7%Asset Turnover (x) 0.8 0.8 0.8 0.8 0.8 0.8 0.8 0.8 0.9 0.9 1.0 1.0 Operating Data 2004 2005E 2006E 2007E 2008E 2009E 2010E 2011E 2012E 2013E 2014E 2015E
Volumes (ktons) 4,331 4,522 4,712 4,681 4,856 4,931 5,004 5,073 5,130 5,179 5,217 5,254 Volume Growth 5.2% 4.4% 4.2% -0.7% 3.7% 1.5% 1.5% 1.4% 1.1% 1.0% 0.7% 0.7%Basic Petrochemicals 1,879 1,971 2,100 2,044 2,119 2,125 2,137 2,152 2,166 2,178 2,190 2,202 Ethylene 562 594 631 620 629 632 639 647 655 663 669 676 Prophylene 501 489 523 502 534 534 534 534 534 534 534 534 Thermoplastic Resins 1,166 1,303 1,372 1,370 1,441 1,493 1,544 1,588 1,621 1,646 1,661 1,678 Polyethylene 705 784 823 815 846 858 864 864 864 864 864 873 Polyprophylene 461 519 549 555 595 635 680 724 757 782 797 805 Vynils 1,163 1,123 1,114 1,141 1,171 1,188 1,198 1,209 1,219 1,230 1,241 1,249 Net Revenues (R$mn) 11,043 11,435 11,246 11,184 11,478 10,643 10,581 11,030 11,546 12,333 13,065 13,518 Basic Petrochemicals 3,603 3,987 3,927 3,725 3,811 3,446 3,387 3,482 3,584 3,768 3,946 4,070 Ethylene 1,154 1,249 1,176 1,140 1,141 1,025 1,001 1,035 1,072 1,141 1,208 1,254 Prophylene 889 1,005 1,007 973 1,034 927 897 914 936 986 1,033 1,061 Thermoplastic Resins 3,504 3,879 3,814 3,871 4,035 3,740 3,720 3,914 4,118 4,465 4,775 4,975 Polyethylene 2,064 2,244 2,120 2,134 2,210 1,987 1,904 1,935 1,985 2,117 2,242 2,333 Polyprophylene 1,440 1,634 1,693 1,737 1,826 1,754 1,816 1,979 2,133 2,349 2,534 2,641 Vynils 1,837 1,726 1,715 1,767 1,783 1,735 1,763 1,845 1,961 2,080 2,175 2,238 Business Development 537 545 512 517 507 460 450 464 485 516 541 556 Others 1,562 1,298 1,279 1,304 1,342 1,261 1,262 1,324 1,397 1,504 1,627 1,680 US$/ton 874 1,041 1,056 1,011 937 809 762 762 774 802 827 833 Basic Petrochemicals 657 833 827 771 713 608 571 567 569 583 595 599 Ethylene 704 865 824 778 719 608 565 560 563 580 596 601 Prophylene 608 846 853 820 769 652 606 601 603 622 639 644 Thermoplastic Resins 1,030 1,226 1,229 1,195 1,110 940 868 864 873 914 950 960 Polyethylene 1,004 1,179 1,139 1,107 1,035 868 794 785 790 826 857 866 Polyprophylene 1,070 1,297 1,364 1,324 1,217 1,036 963 958 969 1,012 1,051 1,063 Vynils 541 633 680 655 604 548 530 535 553 570 579 580 Avg. Input Cost (U$/ton) 434 618 625 554 493 416 394 393 392 396 395 394 Unitary Spread (US$/ton) 439 423 431 457 444 393 368 370 381 406 433 440 Unitary EBITDA (US$/ton) 234 217 227 258 249 188 154 153 159 184 208 210

49
Petrochemical Sector, Feb-06
Free Cash Flow 2004 2005E 2006E 2007E 2008E 2009E 2010E 2011E 2012E 2013E 2014E 2015ENOPLAT 1,376 911 943 1,248 1,369 1,028 847 904 1,043 1,337 1,653 1,588Depreciation&Amortization 715 775 779 768 754 736 721 705 690 676 662 715Asset Turnover Var. 358 278 48 21 79 88 23 (14) (24) (70) (42) (17) Capex (374) (751) (681) (676) (564) (592) (577) (564) (552) (541) (529) (560) Fiscal Contingency - - (450) - - - - - - - - - Fiscal Credits - 8 34 34 34 - - - - - - - Free Cash Flow to Firm 2,075 1,221 673 1,394 1,673 1,260 1,015 1,031 1,157 1,402 1,743 1,726 Net Interests (853) (649) (541) (414) (372) (358) (356) (357) (358) (361) (364) (365) Debt Fiscal Gain 470 106 183 189 180 175 155 154 163 185 208 248 Increase (Decrease) in Equity - - - 1,171 - - - - - - - - Increase (Decrease) in Debt (1,786) (73) 205 (1,001) 87 - - - - - - - Free Cash Flow to Equity (94) 605 520 1,338 1,569 1,077 814 828 962 1,227 1,587 1,609
Sales Volume Breakdown (kton) Volumes and Operating Rate (%)
1799 1879 1971 2100 2 0 4 4 2119 2125 2137 2152 2166 2178 2190
1109 11661303
1372 1370 1441 1493 1544 1588 1621 1646 1 6 6 1 1678
11011163
11231114 1141
1171 1188 1198 1209 1219 1230 1 2 4 1 1249
107123
125125 125
125 125 125 125 125 125 125 125
2 2 0 2
0
1,000
2,000
3,000
4,000
5,000
6,000
2003
2004
2005
E
2006
E
2007
E
2008
E
2009
E
2010
E
2011
E
2012
E
2013
E
2014
E
2015
E
Basics Thermoplastic Resins Vynils Business Develpment
0
1,000
2,000
3,000
4,000
5,000
6,000
2003
2004
2005
E
2006
E
2007
E
2008
E
2009
E
2010
E
2011
E
2012
E
2013
E
2014
E
2015
E
70%
75%
80%
85%
90%
95%
100%
Sales Volumes (total) Ethylene+Produced ProphyleneEthylene Capacity+Prophylene Operating Rate
Source: Espírito Santo Research Source: Espírito Santo Research
Average Prices per Product Type (US D/ton) Unitary Price, Spread and EBITDA (US D/ton)
300
400
500
600
700
800
900
1,000
1,100
1,200
1,300
2003
2004
2005
E
2006
E
2007
E
2008
E
2009
E
2010
E
2011
E
2012
E
2013
E
2014
E
2015
E
Basics Thermoplastic Resins Vynils
0
200
400
600
800
1,000
1,200
2003
2004
2005
E
2006
E
2007
E
2008
E
2009
E
2010
E
2011
E
2012
E
2013
E
2014
E
2015
E
Average Price Spread over Input EBITDA
Source: Espírito Santo Research Source: Espírito Santo Research
CGS Breakdown (R$mn) Margins (%)
5 0 5 5 5 4 4 4
2 0 7 5
2 4 0 5 4 2 0 7 4 0 3 5 3 0 7 92 8 0 5
2 7 0 6 2 9 4 43 0 5 9
3 0 3 32 8 4 9
2550 2554
2 3 4
358
3 8 7 3 9 03 8 4 377
3 6 8 3 6 03 5 3
3 4 53 3 8
3 3 13 5 7
4 6 4 35032 55524 5 8 8
6 2 4 55 6 8 8
5105 5 3 4 8
71326 8 3 1
5169
0
2,000
4,000
6,000
8,000
10,000
12,000
2003
2004
2005
E
2006
E
2007
E
2008
E
2009
E
2010
E
2011
E
2012
E
2013
E
2014
E
2015
E
Equivalent Naphtha Other Cash-Costs Depreciation
0%
5%
10%
15%
20%
25%
30%
2003
2004
2005
E
2006
E
2007
E
2008
E
2009
E
2010
E
2011
E
2012
E
2013
E
2014
E
2015
E
Gross EBITDA Liquid
Source: Espírito Santo Research Source: Espírito Santo Research

50
Petrochemical Sector, Feb-06
COPESUL: A GOOD SHORT-TERM PLAY… BBUUYY TTPP:: 3399//sshhaarree ((2255%% uuppssiiddee))
We reckon Copesul’s shares the best play to invest in the event of Petroquisa's call option on Braskem. Not so much as a cheaper entry vehicle on Braskem, but because it offers exposure to the possibility of cashing in the upside on a shorter timeframe. While one could argue whether or not BRKM5 will indeed converge to our PT over the next 12 months, it is quite likely that the valuation attributed to Copesul implies on gains c20% by February 31, 2006, resulting in an annual gain of nearly 80%!! Therefore, a we suggest a tactical overweight position on Copesul’s shares, for which our target price R$39/share (Dec/06) yields upside of 25%.
Potential Drivers:
♦ Tag along: According to what we mentioned previously, we believe that Copesul’s shareholders (100% ON) should benefit by receiving fair valuation on their shares, in the event Petroquisa exercises the option. In our opinion there is little or no incentive for the sub-evaluation of CPSL in the valuation process since, even Braskem would be interested on raising the bar for Ipirange, which would have to pay in cash;
♦ Defensive tilt: Solid dividend yields (12-14%), due to cash generation and an unleveraged capital structure, adds a more defensive tilt to the story. This is attractive in the event the cycle is not as favorable as imagined;
♦ Greater operational efficiency: Copesul has greater feedstock-flexibility, and has been able to realize lower average raw materials costs than other crackers, in addition to being able to optimize its product slate. Also, it is capable of reach higher levels of utilization, diluting fixed costs and mitigating its BRL exposure in COGS;
TThe company's specific negative points and/or risks:
♦ Lowest upside in our coverage universe: Given current valuation, we feel that there are more attractive upsides and multiples in the market. We therefore would recommend other buy-and-hold investment options;
♦ Low growth level; The company presently operates close its installed capacity limit, and its own control structure hinders new expansion projects. The company, therefore, has extremely low growth potential. When the company performs maintenance stoppages, it tends to present a more significant drop in its sales volume;
♦ Excessively unleveraged capital structure: The substantial net cash position keeps the WACC off from the optimal point despite potentially favoring shareholders remuneration through dividends, which is actually the 2 owners’ goal on Copesul;
♦ More exposed to smaller exportation margins: Due to its location, Copesul is the cracker with the greatest participation in exports among 2nd generation Southern Complex companies, where margins are often smaller.
Data and Estimates
Market Cap (R$mn) 4,627
Ent. Value 05E (R$mn) 4,791
Div. Yield 05E 13.9%
Pay Out 05E 120.0%
CAGR EBITDA (05-08E) 5.8%
ND/E 05E 14.6%
Free-Float 25.5%
Avg. Daily Volume R$m 0.9
Max/Min - 52 weeks (R$) 37,32/ 25,49
Shares # (mn) 150
Index Weight na
Valuation
Target Price Dec/06 39.00
Upside 26.6%
WACC 15.1%
Shareholders
Braskem 29.5%
Ipiranga Petroquímica 29.5%
Petroquisa 15.6%
Others 25.5% Source: Espírito Santo Research and company
Relative Performance – CPSL3 (52 weeks)
506070
8090
100
110120130140150
Feb-05 Apr-05 Jul-05 Sep-05 Nov-05 Jan-06
Ibov
CPSL3
Source: Economática
Proftability (%)
0%10%20%30%40%50%60%70%80%90%
2003 2004 2005E 2006EEBITDA Margin Liquid MarginROE ROIC
Source: Espírito Santo Research
Net EBITDA EPS ∆ EPS P/E P/BV EV/ Dividend ROE EBITDA Capex/ FCFE
Income (%) EBITDA Yield (%) (%) Margin (%) EBITDA Yield (%)2004 547 1.070 0,36 225,7% 10,4x 4,9x 5,4x 9,5% 48,8% 19,7% 0,1x 3,3%2005E 536 1.053 0,36 -2,0% 8,6x 4,1x 4,6x 13,9% 46,9% 19,3% 0,1x 12,4%2006E 499 1.039 0,33 -6,8% 9,3x 4,5x 4,5x 11,9% 46,2% 19,9% 0,1x 17,0%2007E 577 1.139 0,38 15,5% 8,0x 4,9x 4,1x 13,7% 58,3% 23,0% 0,1x 16,9%Source: Espírito Santo Research CPSL3 Closing price: R$31,17/ thousand shares in 12/06/2005

51
Petrochemical Sector, Feb-06
Copesul – Projection Table
Results (R$mn) 2004 2005E 2006E 2007E 2008E 2009E 2010E 2011E 2012E 2013E 2014E 2015ENet Revenues 5,440 5,449 5,233 4,957 5,169 4,627 4,272 4,589 4,518 4,969 5,217 5,375COGS (4,418) (4,399) (4,191) (3,808) (3,885) (3,627) (3,501) (3,765) (3,713) (3,941) (4,039) (4,139)Gross Result 1,023 1,050 1,043 1,150 1,285 1,000 771 824 804 1,028 1,178 1,235 Gross Margin (%) 18.8% 19.3% 19.9% 23.2% 24.8% 21.6% 18.0% 17.9% 17.8% 20.7% 22.6% 23.0%Operating Expenses (159) (207) (206) (203) (214) (195) (182) (195) (194) (215) (227) (235)EBITDA 1,070 1,053 1,039 1,139 1,247 967 741 773 746 943 1,076 1,121 EBITDA Margin (%) 19.7% 19.3% 19.9% 23.0% 24.1% 20.9% 17.3% 16.8% 16.5% 19.0% 20.6% 20.9%Financial Result (75) (74) (121) (106) (97) (107) (107) (100) (94) (85) (75) (70)EBT 789 775 716 841 973 697 482 529 516 728 876 930Taxes (242) (240) (216) (265) (314) (225) (153) (169) (164) (236) (285) (303) -- Tax Rate (%) 30.7% 30.9% 30.2% 31.5% 32.2% 32.2% 31.7% 31.9% 31.8% 32.4% 32.5% 32.6%Net Income 547 536 499 577 660 473 329 360 352 493 591 627 Net Margin (%) 10.0% 9.8% 9.5% 11.6% 12.8% 10.2% 7.7% 7.8% 7.8% 9.9% 11.3% 11.7%Depreciation&Amortization 206 209 203 192 176 163 152 144 136 130 125 121Cash Earnings 752 745 702 768 836 635 481 504 488 623 716 748Dividends+IOE 544 643 549 634 726 473 329 360 352 493 591 627 Payout (%) 99.6% 120.0% 110.0% 110.0% 110.0% 100.0% 100.0% 100.0% 100.0% 100.0% 100.0% 100.0%
Balance Sheet (R$mn) 2004 2005E 2006E 2007E 2008E 2009E 2010E 2011E 2012E 2013E 2014E 2015ECurrent Assets 934 851 908 853 899 937 954 1,099 1,112 1,239 1,299 1,352 Cash&Equivalents 403 289 408 478 474 550 623 694 756 813 867 912 Accounts Receivables 49 61 71 57 70 60 50 63 54 69 72 74 Inventories 426 303 337 263 315 293 250 309 271 324 332 340 Others 56 198 91 55 41 34 31 33 31 33 28 26LT Assets 137 148 134 118 112 105 98 92 85 80 82 85Fixed Assets 1,159 1,092 998 901 825 769 728 687 655 629 604 586Total Assets 2,230 2,091 2,040 1,872 1,837 1,811 1,780 1,878 1,853 1,948 1,985 2,023Current Liabilities 762 751 767 694 748 690 640 721 680 760 781 858 ST Debt 257 305 275 293 280 253 257 262 269 277 286 352 Suppliers 148 101 112 88 106 100 86 107 95 115 119 123 Taxes 68 55 64 51 63 54 45 56 49 62 65 66 Others 289 291 316 262 300 283 252 295 267 306 312 318LT Liabilities 307 216 235 239 277 326 345 362 378 394 410 370Shareholders Equity 1,161 1,124 1,038 939 812 795 795 795 795 795 795 795Total Liabilities 2,230 2,091 2,040 1,872 1,837 1,811 1,780 1,878 1,853 1,948 1,985 2,023Total Debt 503 453 472 495 519 542 565 587 609 633 658 684 Net Debt (Cash) 100 164 64 17 45 (8) (59) (108) (147) (180) (209) (228) Invested Capital 1,262 1,289 1,102 956 857 787 736 687 648 615 586 566 Ratios 2004 2005E 2006E 2007E 2008E 2009E 2010E 2011E 2012E 2013E 2014E 2015E
Debt/Equity 43.4% 40.3% 45.5% 52.7% 63.9% 68.2% 71.0% 73.8% 76.7% 79.7% 82.8% 86.0%Net Debt/Equity 8.6% 14.6% 6.2% 1.8% 5.6% -1.0% -7.4% -13.5% -18.4% -22.6% -26.3% -28.7%Net Debt/EBITDA (x) 0.1 0.2 0.1 0.0 0.0 (0.0) (0.1) (0.1) (0.2) (0.2) (0.2) (0.2) ROE 48.8% 46.9% 46.2% 58.3% 75.4% 58.8% 41.4% 45.3% 44.3% 62.0% 74.3% 78.9%ROIC (EBIT) 44.1% 66.2% 70.0% 92.1% 118.1% 97.9% 77.3% 88.3% 91.3% 128.7% 158.4% 173.6%Asset Turnover (x) 2.1 2.5 2.5 2.5 2.8 2.5 2.4 2.5 2.4 2.6 2.7 2.7
Operating Data 2004 2005E 2006E 2007E 2008E 2009E 2010E 2011E 2012E 2013E 2014E 2015EVolumes (ktons) 2,811 2,690 2,858 2,743 2,896 2,898 2,763 2,908 2,802 2,927 2,937 2,947 Volume Growth 0.0% -4.3% 6.3% -4.0% 5.6% 0.1% -4.6% 5.2% -3.7% 4.5% 0.3% 0.3% Ethylene 1,119 1,058 1,130 1,070 1,135 1,135 1,078 1,135 1,078 1,135 1,135 1,135 Prophylene 592 569 598 566 597 597 565 597 565 597 597 597 Butadiene 104 100 107 101 107 107 101 107 101 107 107 107 Benzene 311 277 292 272 292 292 272 292 272 292 292 292 Toluene 55 62 65 68 69 71 72 73 73 76 78 80 Other basics 630 624 666 666 696 696 676 704 713 721 729 737 Total Production (kt) 2,906 2,732 2,858 2,743 2,896 2,898 2,763 2,908 2,802 2,927 2,937 2,947 Operating Rate 96.9% 91.1% 95.3% 91.4% 96.5% 96.6% 92.1% 96.9% 93.4% 97.6% 97.9% 98.2%Processed Load 3,541 3,357 3,581 3,437 3,628 3,630 3,462 3,643 3,510 3,667 3,680 3,692 Net Revenues (R$mn) 5,440 5,449 5,233 4,957 5,169 4,627 4,272 4,589 4,518 4,969 5,217 5,375 Ethylene 2,279 2,230 2,106 1,967 2,059 1,840 1,689 1,814 1,764 1,955 2,049 2,105 Prophylene 1,042 1,169 1,154 1,098 1,157 1,037 948 1,023 990 1,102 1,155 1,186 Butadiene 186 221 237 221 230 206 188 203 197 219 229 236 Benzene 727 571 524 456 473 424 388 426 406 454 472 484 Toluene 91 100 98 101 102 94 91 95 97 107 114 120 Other basics 1,115 1,104 1,115 1,114 1,148 1,027 966 1,028 1,065 1,132 1,197 1,243 Avg. Price (US$/ton) 663 834 810 765 708 599 557 553 558 572 587 591 Ethylene 698 868 824 778 719 608 565 560 566 581 596 601 Prophylene 603 846 853 821 769 652 605 601 607 622 639 644 Butadiene 612 909 978 923 853 721 670 665 672 689 707 712 Benzene 801 849 795 710 644 545 515 512 517 525 535 538 Toluene 569 663 669 630 583 493 458 455 460 471 484 487 Other basics 606 729 740 707 654 553 515 512 517 529 543 546 Avg. Input Cost (U$/ton) 456 569 553 491 442 382 368 368 370 368 368 368 Unitary Spread(US$/ton) 207 265 257 273 266 217 189 185 188 204 219 223 Unitary EBITDA (US$/ton) 130 161 161 176 171 125 97 93 92 109 121 123

52
Petrochemical Sector, Feb-06
Free Cash Flow 2004 2005E 2006E 2007E 2008E 2009E 2010E 2011E 2012E 2013E 2014E 2015ENOPLAT 570 557 552 625 706 531 388 415 403 537 628 660Depreciation&Amortization 206 209 203 192 176 163 152 144 136 130 125 121Asset Turnover Var. 572 (90) 108 33 17 7 2 2 1 2 7 3 Capex (135) (147) (109) (95) (101) (107) (111) (103) (105) (104) (100) (102) Fiscal Credits 92 84 84 80 - - - - - - - - Free Cash Flow to Firm 1,304 614 839 835 799 594 432 459 435 564 660 682 Net Interests (95) (86) (122) (109) (102) (111) (111) (107) (102) (96) (90) (86) Taxes (Fin. Res.) 52 47 68 57 50 49 48 45 43 41 38 37 Increase (Decrease) in Debt (1,072) - - - - - - - - - - - Free Cash Flow to Equity 188 575 786 784 747 532 368 397 375 509 608 633
Sales Volume Breakdown (kton) Volumes (kton) vs. Operating Rate (%)
1119 1058 1130 1070 1135 1135 1078 1135 1078 1135 1135 1135
573 5 9 2 5 6 9 5 9 8 5 6 6 5 9 7 5 9 7 5 6 5 5 9 7 5 6 5 5 9 7 5 9 7 5 9 7
1152 11001063
11301107
1164 11661120
11761159
1196 1206 1216
1086
0
500
1,000
1,500
2,000
2,500
3,000
3,500
2003
2004
2005
E
2006
E
2007
E
2008
E
2009
E
2010
E
2011
E
2012
E
2013
E
2014
E
2015
E
Ethylene Prophylene Other Basics
2,000
2,200
2,400
2,600
2,800
3,000
3,200
3,400
3,600
3,800
2003
2004
2005
E
2006
E
2007
E
2008
E
2009
E
2010
E
2011
E
2012
E
2013
E
2014
E
2015
E
70%
75%
80%
85%
90%
95%
100%
Sales Volumes Processed load Operating Rate
Source: Espírito Santo Research Source: Espírito Santo Research
Average Prices per Product (USD/ton) Unitary Price, Spread and EBITDA (US D/ton)
300
400
500
600
700
800
900
2003
2004
2005
E
2006
E
2007
E
2008
E
2009
E
2010
E
2011
E
2012
E
2013
E
2014
E
2015
E
Ethylene Prophylene Other Basics
0
100
200
300
400
500
600
700
800
900
2003
2004
2005
E
2006
E
2007
E
2008
E
2009
E
2010
E
2011
E
2012
E
2013
E
2014
E
2015
EAverage Price Spread over Input EBITDA
Source: Espírito Santo Research Source: Espírito Santo Research
CGS Breakdown (R$mn) Margins (%)
3 0 3 0
3 7 3 8 3716 35713184 3 2 3 0
2 9 4 8 28193051 2 9 9 7 3 1 9 5 3270 3 3 4 7
5 4 7
4 7 4 4 7 4417
4 3 1 478
516 530571 5 8 0
616 6 4 3 672196
2 0 6 2 0 92 0 3
192 176163
152144 136
130125 121
0
500
1,000
1,500
2,000
2,500
3,000
3,500
4,000
4,500
5,000
2003
2004
2005
E
2006
E
2007
E
2008
E
2009
E
2010
E
2011
E
2012
E
2013
E
2014
E
2015
E
Equivalent Naphtha Other Cash-Costs Depreciation
0%
5%
10%
15%
20%
25%
30%
2003
2004
2005
E
2006
E
2007
E
2008
E
2009
E
2010
E
2011
E
2012
E
2013
E
2014
E
2015
E
Gross EBITDA Liquid
Source: Espírito Santo Research Source: Espírito Santo Research

53
Petrochemical Sector, Feb-06
SUZANO PETROQUÍMICA: TOP P ICK BBUUYY TTPP:: 77,,9933//sshhaarree ((6600 %%uuppssiiddee))
We believe the company's shares aren’t fully pricing in "new" Suzano Petroquímica, after the incorporation of Polibrasil’s assets, wich will turn the company from a holding company to an operational producer. On top of that, Suzano offest desarable exposure to the cash flw stream of Riopol, which we consider the top piece in the national petrochemical puzzle. Therefore, we consider Suzano Petroquímica an excellent investment case in profitability gains and sales growth (it is in fact the fastest growing company in the sector). As a result, it has been chosen as our preferred pick in the sector for those who wish to take on the exposure to the commodity chemical segment.
Potential Drivers:
♦ Sound exposure to the upbeat PP cycle: The company is the LatAm leader in PP production, and should benefit from the growing scarcity of the Propylene line globally, coupled with the resin’s faster growth rate due to its increasing usage. The risks of excess local demand are also smaller in terms of this resin. We calculate that ~60% of the company’s Fair Equity Value and its EBITDA 06E derives from its PP asset;
♦ Riopol’s start-up: We believe that as Riopol delivers the expected solid results, the market will begin to better price it into SZPQ. Note that Riopol is an asset with a singular degree of integration, a “lean” structure and competitive WACC;
♦ Sale of Politeno: In view of Politeno’s tremendous suitability for Braskem’s portfolio, the valuation paid in a probable sale could well be beneficial to Suzano, because Politeno will continue to be an under-used asset until its control issue of is defined. Through this transaction, SZPQ might takeover Petroflex, which we consider to be an interesting asset;
♦ Increasing liquidity and visibility: The company’s shares have been gaining liquidity (currently at R$3mn/day vs. R$0.6mn/day in 2004), which, combined with its recent ownership reorganization should increase their presence in investors’ portfolios;
Negative aspects and/or specific risks of the company:
♦ Concentrated on 2nd generation: Until Riopol is able to achieve a high operating rate, which should only occur by 2007E, the company will only operate in the 2nd generation, and should be affected by the margin transfer taking place in the sector, which disfavor resin producers;
♦ Supply dependency: The company is still extremely dependent upon third parties for its feedstock needs; third parties that are often its competitors in the resin market;
♦ Uncertainties concerning Riopol: Despite its excellent potential, projections for Riopol bear an elevated degree of uncertainty. Moreover, throughout 2006E, the company will be climbing its learning curve with possibly below-potential margins, thereby reducing its estimated earnings;
♦ Acquisitions may occur at high valuations: As there are other players that wish to consolidate, any acquisitions may occur at elevated multiples, thus creating a negative sentiment among investors;
Data and Estimates
Market Cap (R$mn) 1,065
Ent. Value 05E (R$mn) 2,528
Div. Yield 05E 1.4%
Pay Out 05E 50.0%
CAGR EBITDA (05-08E) 37.4%
ND/E 05E 146.0%
Free-Float 20.4%
Avg. Daily Volume R$m 3.0
Max/Min - 52 weeks (R$) 6,89 / 4,05
Shares # (mn) 227
Index Weight na
Valuation
Target Price Dec/06 7.97
Upside 69.5%
WACC 13.1%
Shareholders
Grupo Suzano 73.5%
PREVI 3.0%
IGF Fund 3.1%
Others 20.4% Source: Espírito Santo Research and company
Relative Performance – SZPQ4 (52 weeks)
506070
8090
100
110120130140150
Feb-05 Apr-05 Jul-05 Sep-05 Nov-05 Jan-06
I b o v
S Z P Q 4
Source: Economática
Proftability (%)
0%2%
4%6%8%
10%12%14%
16%
2003 2004 2005E 2006EEBITDA Margin Liquid MarginROE ROIC
Source: Espírito Santo Research
Net EBITDA EPS ∆ EPS P/E P/BV EV/ Dividend ROE EBITDA Capex/ FCFE
Income (%) EBITDA Yield (%) (%) Margin (%) EBITDA Yield (%)
2004 109 238 0.49 - 13.8x 1.6x 8.8x 2.8% 12.0% 14.8% 0.7x -0.5%
2005E 32 168 0.14 -70.8% 34.6x 1.1x 15.4x 1.4% 3.3% 8.5% 0.5x 29.0%
2006E 56 430 0.25 74.0% 19.9x 1.1x 6.0x 4.5% 5.6% 14.1% 0.3x 8.7%
2007E 169 584 0.75 199.5% 6.6x 1.1x 4.1x 13.6% 16.6% 17.5% 0.1x 25.8%Source: Espírito Santo Research SZPQ4 Closing price: R$4,95/ thousand shares in 12/06/2005

54
Petrochemical Sector, Feb-06
Suzano Petroquímica – Projection Table
Results (R$mn) 2004 2005E 2006E 2007E 2008E 2009E 2010E 2011E 2012E 2013E 2014E 2015ENet Revenues 1,610 1,977 3,038 3,337 3,505 3,340 3,356 3,488 3,639 3,904 4,141 4,301COGS (1,269) (1,684) (2,508) (2,638) (2,796) (2,759) (2,825) (2,935) (3,042) (3,191) (3,313) (3,434)Gross Result 341 294 531 699 709 581 532 553 597 713 828 867 Gross Margin (%) 21.2% 14.9% 17.5% 20.9% 20.2% 17.4% 15.8% 15.8% 16.4% 18.3% 20.0% 20.2%Operating Expenses (157) (207) (308) (323) (336) (327) (327) (338) (348) (367) (385) (398)EBITDA 238 168 430 584 578 455 402 409 443 538 634 660 EBITDA Margin (%) 14.8% 8.5% 14.1% 17.5% 16.5% 13.6% 12.0% 11.7% 12.2% 13.8% 15.3% 15.3%Financial Result (28) (30) (140) (132) (109) (85) (73) (64) (55) (45) (34) (25)EBT 157 50 82 243 265 169 131 150 195 301 409 444Taxes (47) (17) (25) (73) (79) (51) (39) (45) (58) (90) (123) (133) -- Tax Rate (%) 29.7% 33.5% 30.0% 30.0% 30.0% 30.0% 30.0% 30.0% 30.0% 30.0% 30.0% 30.0%Net Income 109 32 56 169 184 117 91 104 135 210 285 310 Net Margin (%) 6.8% 1.6% 1.9% 5.1% 5.3% 3.5% 2.7% 3.0% 3.7% 5.4% 6.9% 7.2%Depreciation&Amortization 54 81 207 209 204 200 197 195 193 192 191 191Cash Earnings 163 114 264 378 388 317 288 299 329 402 476 500Dividends+IOE 42 16 51 152 166 117 91 104 135 210 285 279 Payout (%) 38.6% 50.0% 90.0% 90.0% 90.0% 100.0% 100.0% 100.0% 100.0% 100.0% 100.0% 90.0% Balance Sheet (R$mn) 2004 2005E 2006E 2007E 2008E 2009E 2010E 2011E 2012E 2013E 2014E 2015E
Current Assets 520 854 1,022 1,212 1,342 1,442 1,531 1,646 1,760 1,891 2,008 2,046 Cash&Equivalents 169 214 250 395 479 632 685 775 862 936 1,013 1,030 Accounts Receivables 155 284 356 378 396 364 381 393 407 437 458 468 Inventories 141 278 319 334 358 345 360 369 379 397 410 419LT Assets 131 219 221 223 226 228 231 234 237 239 243 246Fixed Assets 1,354 2,178 2,109 1,951 1,799 1,653 1,513 1,376 1,241 1,109 981 933Total Assets 2,005 3,251 3,353 3,387 3,367 3,323 3,275 3,255 3,238 3,239 3,231 3,224Current Liabilities 276 1,194 1,275 1,291 1,278 1,262 1,242 1,234 1,227 1,238 1,239 1,219 ST Debt 138 853 858 850 813 774 732 709 685 662 638 606 Suppliers 58 213 267 284 297 273 286 295 305 328 343 351LT Liabilities 766 1,042 1,057 1,058 1,034 1,006 977 966 956 946 936 919Shareholders Equity 956 1,002 1,007 1,024 1,043 1,042 1,042 1,042 1,042 1,042 1,042 1,073Total Liabilities 2,006 3,251 3,353 3,387 3,367 3,323 3,275 3,255 3,238 3,239 3,231 3,224Total Debt 748 1,677 1,688 1,670 1,599 1,521 1,440 1,393 1,347 1,301 1,255 1,190 Net Debt/ (Cash) 579 1,463 1,438 1,275 1,120 889 755 618 485 365 241 160 Invested Capital 1,535 2,465 2,446 2,300 2,162 1,932 1,797 1,661 1,527 1,407 1,283 1,233 Ratios 2004 2005E 2006E 2007E 2008E 2009E 2010E 2011E 2012E 2013E 2014E 2015E
Debt/Equity 78.3% 167.4% 167.5% 163.1% 153.4% 145.9% 138.1% 133.7% 129.2% 124.8% 120.4% 110.9%Net Debt/Equity 60.6% 146.0% 142.8% 124.5% 107.4% 85.3% 72.4% 59.3% 46.6% 35.0% 23.1% 14.9%Net Debt/EBITDA (x) 2.4 8.7 3.3 2.2 1.9 2.0 1.9 1.5 1.1 0.7 0.4 0.2 ROE 12.0% 3.3% 5.6% 16.6% 17.8% 11.2% 8.7% 10.0% 13.0% 20.1% 27.3% 29.3%ROIC (EBIT) 12.0% 4.3% 9.1% 15.8% 16.7% 12.4% 11.0% 12.4% 15.7% 23.6% 32.9% 37.3%Asset Turnover (x) 0.8 0.8 0.9 1.0 1.0 1.0 1.0 1.1 1.1 1.2 1.3 1.3 Investments Info 2004 2005E 2006E 2007E 2008E 2009E 2010E 2011E 2012E 2013E 2014E 2015E
Net Revenues 1,610 1,977 3,038 3,337 3,505 3,340 3,356 3,488 3,639 3,904 4,141 4,301 Polibrasil 906 1,237 1,935 2,143 2,287 2,222 2,273 2,380 2,501 2,702 2,873 2,998 Politeno 392 404 360 373 372 332 316 322 330 352 372 384 Petroflex 263 274 276 287 304 302 305 317 326 338 353 362 RioPol 50 62 467 534 542 483 462 469 481 512 542 558EBITDA 238 168 430 584 578 455 402 409 443 538 634 660 Polibrasil 164 106 271 344 326 255 241 253 283 351 419 437 Politeno 58 44 51 65 63 47 36 34 35 42 49 51 Petroflex 37 37 28 30 35 40 41 43 43 44 47 48 RioPol 1 1 99 165 174 135 107 104 107 128 146 153 Holding (21) (21) (19) (20) (21) (22) (23) (24) (25) (26) (28) (29)EBITDA Growth 60.6% -29.3% 155.5% 35.9% -1.1% -21.3% -11.6% 1.9% 8.2% 21.5% 17.8% 4.1%EBITDA Margin (%) 14.8% 8.5% 14.1% 17.5% 16.5% 13.6% 12.0% 11.7% 12.2% 13.8% 15.3% 15.3% Polibrasil 18.1% 8.6% 14.0% 16.1% 14.3% 11.5% 10.6% 10.6% 11.3% 13.0% 14.6% 14.6% Politeno 14.8% 10.9% 14.1% 17.5% 17.1% 14.2% 11.3% 10.7% 10.6% 12.0% 13.2% 13.3% Petroflex 14.0% 13.6% 10.2% 10.4% 11.5% 13.2% 13.5% 13.5% 13.3% 12.9% 13.4% 13.2% RioPol 1.3% 1.7% 21.2% 30.8% 32.1% 27.9% 23.1% 22.1% 22.2% 24.9% 27.0% 27.4%Volumes 490 597 985 1,058 1,122 1,186 1,223 1,243 1,259 1,269 1,269 1,282 Polibrasil 284 386 614 664 718 777 814 832 847 858 858 871 Politeno 118 125 123 123 123 123 123 123 123 123 123 123 Petroflex 73 65 73 76 79 82 83 85 85 85 85 85 RioPol 15 20 174 194 201 203 203 203 203 203 203 203Added Capacity 518 729 1,097 1,255 1,305 1,305 1,305 1,305 1,305 1,305 1,305 1,305Utilization Rate (%) 94.7% 81.8% 89.8% 84.3% 86.0% 90.9% 93.8% 95.3% 96.5% 97.3% 97.3% 98.3%
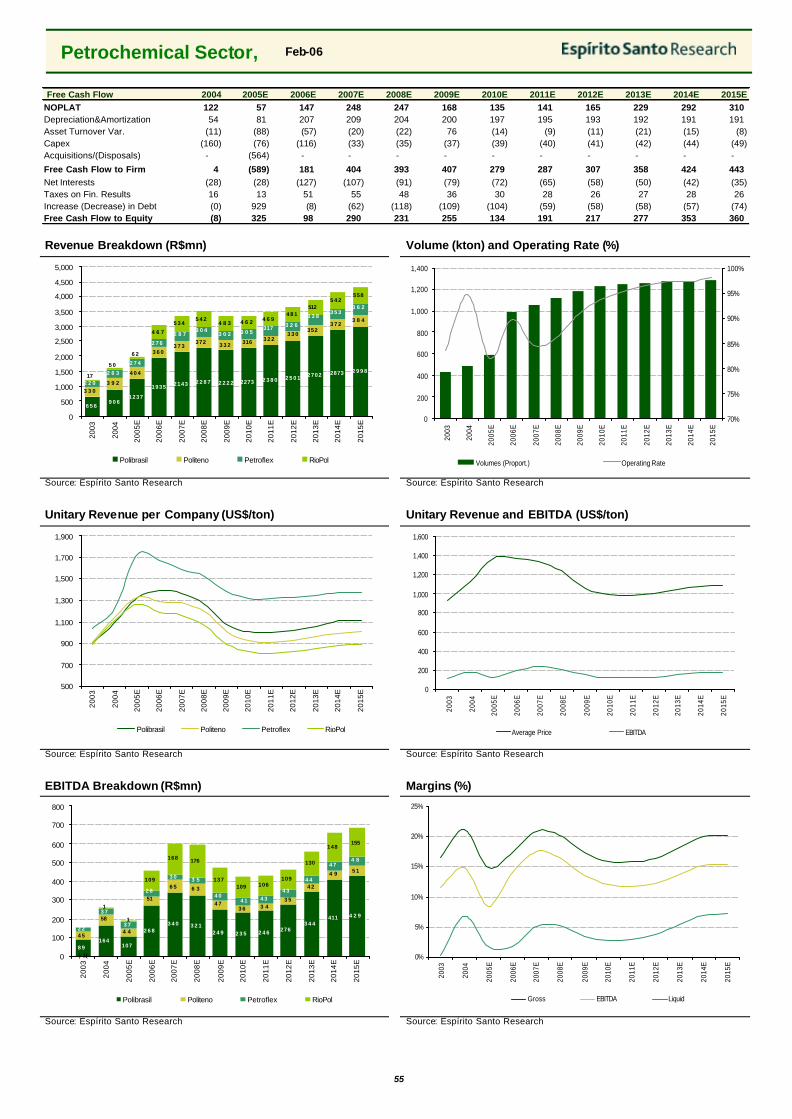
55
Petrochemical Sector, Feb-06
Free Cash Flow 2004 2005E 2006E 2007E 2008E 2009E 2010E 2011E 2012E 2013E 2014E 2015ENOPLAT 122 57 147 248 247 168 135 141 165 229 292 310 Depreciation&Amortization 54 81 207 209 204 200 197 195 193 192 191 191 Asset Turnover Var. (11) (88) (57) (20) (22) 76 (14) (9) (11) (21) (15) (8) Capex (160) (76) (116) (33) (35) (37) (39) (40) (41) (42) (44) (49) Acquisitions/(Disposals) - (564) - - - - - - - - - -
Free Cash Flow to Firm 4 (589) 181 404 393 407 279 287 307 358 424 443 Net Interests (28) (28) (127) (107) (91) (79) (72) (65) (58) (50) (42) (35) Taxes on Fin. Results 16 13 51 55 48 36 30 28 26 27 28 26 Increase (Decrease) in Debt (0) 929 (8) (62) (118) (109) (104) (59) (58) (58) (57) (74) Free Cash Flow to Equity (8) 325 98 290 231 255 134 191 217 277 353 360
Revenue Breakdown (R$mn) Volume (kton) and Operating Rate (%)
6 5 69 0 6
1237
1935 2143 2 2 8 7 2 2 2 2 2273 2 3 8 0 2 5 0 1 2702 2873 2 9 9 8
3 3 03 9 2
372
3523 7 2
3 8 4
2 2 0
2 6 3
4 6 7
5 3 45 4 2
4 8 3 4 6 2 4 6 94 8 1
5125 4 2
558
4 0 4
3 6 03 7 3 3 3 2
3 3 03 2 2316
2 7 4
2 7 6
2 8 73 0 4
3 0 2
3 6 23 5 3
3 3 8
3 2 63 0 5
317
17
5 0
6 2
0
500
1,000
1,500
2,000
2,500
3,000
3,500
4,000
4,500
5,000
2003
2004
2005
E
2006
E
2007
E
2008
E
2009
E
2010
E
2011
E
2012
E
2013
E
2014
E
2015
E
Polibrasil Politeno Petroflex RioPol
0
200
400
600
800
1,000
1,200
1,400
2003
2004
2005
E
2006
E
2007
E
2008
E
2009
E
2010
E
2011
E
2012
E
2013
E
2014
E
2015
E
70%
75%
80%
85%
90%
95%
100%
Volumes (Proport.) Operating Rate
Source: Espírito Santo Research Source: Espírito Santo Research
Unitary Revenue per Company (US$/ton) Unitary Revenue and EBITDA (US$/ton)
500
700
900
1,100
1,300
1,500
1,700
1,900
2003
2004
2005
E
2006
E
2007
E
2008
E
2009
E
2010
E
2011
E
2012
E
2013
E
2014
E
2015
E
Polibrasil Politeno Petroflex RioPol
0
200
400
600
800
1,000
1,200
1,400
1,600
2003
2004
2005
E
2006
E
2007
E
2008
E
2009
E
2010
E
2011
E
2012
E
2013
E
2014
E
2015
EAverage Price EBITDA
Source: Espírito Santo Research Source: Espírito Santo Research
EBITDA Breakdown (R$mn) Margins (%)
8 9164
107
2 6 83 4 0 3 2 1
2 4 9 2 3 5 2 4 6 2763 4 4
411 4 2 9
4 52 2
3 7
) 1(
1
109
168 176
137109 106
109
130
148155
5 14 9
4 2
3 53 43 6
4 7
6 36 5
51
4 4
58
4 84 7
4 4
4 34 34 1
4 0
3 53 0
2 8
3 71
0
100
200
300
400
500
600
700
800
2003
2004
2005
E
2006
E
2007
E
2008
E
2009
E
2010
E
2011
E
2012
E
2013
E
2014
E
2015
E
Polibrasil Politeno Petroflex RioPol
0%
5%
10%
15%
20%
25%
2003
2004
2005
E
2006
E
2007
E
2008
E
2009
E
2010
E
2011
E
2012
E
2013
E
2014
E
2015
E
Gross EBITDA Liquid
Source: Espírito Santo Research Source: Espírito Santo Research

56
Petrochemical Sector, Feb-06
PETROFLEX: VALUE WITHOUT A CATAL YST... NNEEUUTTRRAALL TTPP:: 2244//sshhaarree ((5522%% uuppssiiddee))
Despite being the biggest elastomers’ producer in LatAm and the 5th in world, Petroflex is, in our view, little known to investors, especially considering its operational and financial solidity, which grants a rather defensive angle to its stocks (resembling Ultrapar in this sense). In terms of valuation, based on a DCF model, we see high upside potential (+52%), with a target price of R$25/share, for which the risks points to the upside in terms of profitability.
Potential Drivers:
♦ Continued profitability increases: With its sales mix concentrated on performance and special rubbers, Petroflex may be able to achieve significantly higher than expected unitary spreads, thereby expanding margins further;
♦ More expressive decrease in Butadiene and Styrene prices: Due to its favorable position as the only domestic SBR factory, the company possesses envious market conditions, and it may even be able to capture a greater chunk of the margin if input prices fall in the international market, despite their tendency to rise in the long term;
♦ Potential for substantial payment of dividends: Despite its solid and stable operating results, the company’s cash position is substantial. This coupled with its “cheap” valuation, render attractive dividend yields;
Negative aspects and/or specific risks of the company:
♦ Potential Growth Slowdown: Petroflex’s markets (particularly tires due to advances in remolds) demonstrated (and should continue to do so) a more modest growth than that of resins, due to the fact that access to SBR raw materials (Butadiene and Styrene) is locally and globally restricted;
♦ Cost pressure: With the concentration of gas -based cracker expansions, Benzene and Butadiene are expected to rise, and, pending on market conditions and the ability to pass through, can compress margins
♦ Chinese threat: The appreciated exchange rate tends to favor imported Chinese footwear and other transformed products, which may reduce the local primary demand for Petroflex‘ products;
♦ Low liquidity: Although the liquidity of its shares have improved considerably since the beginning of 2004, it is still quite low, traded at an average of R$100 thousand/day
Data and Estimates
Market Cap (R$mn) 563
Ent. Value 05E (R$mn) 715
Div. Yield 05E 5.6%
Pay Out 05E 31.8%
CAGR EBITDA (05-08E) 1.0%
ND/E 05E 44.9%
Free-Float 24.2%
Avg. Daily Volume R$m 0.6
Max/Min - 52 weeks (R$) 20,65/ 13,04
Shares # (mn) 35.2
Index Weight na
Valuation
Target Price Dec/06 26.00
Upside 62.5%
WACC 16.4%
Shareholders
Braskem 20.1%
Suzano Petroquímica 20.1%
Unipar 10.1%
Resitec Participações 11.9%
Fundações 13.6%
Others 24.2% Source: Espírito Santo Research and company
Relative Performance – PEFX5 (52 weeks)
5060708090
100110120130140150160170
Feb-05 May-05 Jul-05 Oct-05 Jan-06
PEFX5
Ibov
Source: Economática
Proftability (%)
0%5%
10%15%20%25%30%35%40%45%
2003 2004 2005E 2006E
EBITDA Margin Liquid MarginROE ROIC (adjust.)
Source: Espírito Santo Research
Net EBITDA EPS ∆ EPS P/E P/BV EV/ Dividend ROE EBITDA Capex/ FCFE
Income (%) EBITDA Yield (%) (%) Margin (%) EBITDA Yield (%)
2004 98 183 2.79 62.4% 5.1x 2.0x 2.1x 10.2% 42.7% 20.1% 0.3x 33.6%
2005E 88 186 2.51 -10.1% 6.6x 1.8x 2.0x 4.4% 30.0% 21.6% 0.3x 4.6%
2006E 67 139 1.90 -24.3% 8.8x 1.5x 5.0x 4.8% 18.8% 17.6% 0.1x -22.0%
2007E 82 149 2.34 23.1% 7.1x 1.5x 4.7x 14.0% 21.4% 17.8% 0.1x 15.2%Source: Espírito Santo Research PEFX5 Closing price: R$16,69/ thousand shares in 12/06/2005

57
Petrochemical Sector, Feb-06
Petroflex – Projection Table Results (R$mn) 2004 2005E 2006E 2007E 2008E 2009E 2010E 2011E 2012E 2013E 2014E 2015E
Net Revenues 1,306 1,364 1,372 1,427 1,511 1,500 1,517 1,575 1,620 1,680 1,756 1,798COGS (1,044) (1,070) (1,130) (1,173) (1,228) (1,192) (1,199) (1,243) (1,281) (1,334) (1,386) (1,421)Gross Result 262 294 242 253 283 308 318 331 339 345 370 377 Gross Margin (%) 20.1% 21.6% 17.6% 17.8% 18.7% 20.6% 21.0% 21.0% 20.9% 20.6% 21.1% 21.0%Operating Expenses (96) (125) (120) (122) (126) (128) (131) (136) (141) (146) (152) (157)EBITDA 183 186 139 149 174 198 204 212 215 217 235 237 EBITDA Margin (%) 14.0% 13.6% 10.2% 10.4% 11.5% 13.2% 13.5% 13.5% 13.3% 12.9% 13.4% 13.2%Financial Result (38) (48) (35) (20) (18) (15) (13) (11) (10) (8) (7) (5)EBT 129 123 87 111 139 166 174 184 188 191 211 215Taxes (31) (34) (20) (29) (38) (48) (50) (53) (54) (54) (61) (61) -- Tax Rate (%) 23.7% 27.9% 22.9% 25.9% 27.7% 28.9% 28.8% 28.8% 28.6% 28.4% 28.6% 28.4%Net Income 98 88 67 82 100 118 124 131 134 137 151 154 Net Margin (%) 7.5% 6.5% 4.9% 5.8% 6.6% 7.8% 8.1% 8.3% 8.3% 8.1% 8.6% 8.5%Depreciation&Amortization 16 16 18 18 18 18 18 17 17 17 17 18Cash Earnings 115 105 84 100 118 135 141 148 152 154 168 171Dividends+IOE 51 26 28 82 90 94 99 105 107 109 121 123 Payout (%) 52.0% 29.4% 42.3% 100.0% 90.0% 80.0% 80.0% 80.0% 80.0% 80.0% 80.0% 80.0%
Balance Sheet (R$mn) 2004 2005E 2006E 2007E 2008E 2009E 2010E 2011E 2012E 2013E 2014E 2015ECurrent Assets 480 520 414 436 485 511 553 594 634 678 723 759 Cash&Equivalents 210 275 158 169 204 242 272 303 336 368 402 432 Accounts Receivables 108 70 74 77 82 80 84 87 89 93 97 98 Inventories 131 145 153 159 167 158 165 171 176 184 191 194 Other 31 29 30 31 31 31 32 32 33 34 34 35LT Assets 36 51 52 52 52 53 53 54 54 55 55 56Fixed Assets 365 405 405 407 404 402 402 401 401 402 402 402Total Asset 881 976 871 895 941 966 1,008 1,049 1,089 1,135 1,180 1,217Current Liabilities 268 165 236 264 287 288 302 314 324 337 348 356 ST Debt 51 16 79 101 115 125 132 138 143 147 152 156 Suppliers 138 110 116 121 127 120 126 130 134 140 145 148 Taxes 25 22 23 24 25 24 25 26 26 28 28 29 Other 53 18 18 19 20 19 20 21 21 22 23 23LT Liabilities 358 477 256 240 239 240 243 246 251 255 260 259Shareholders Equity 255 333 379 390 415 438 463 488 515 542 572 602TOTAL LIABILITIES 881 976 871 895 941 966 1,008 1,049 1,089 1,135 1,180 1,217Total Debt 93 69 270 276 289 300 310 319 329 338 348 350 Net Debt/(Cash) (117) (206) 112 107 85 58 38 16 (8) (30) (54) (82) Invested Capital 388 486 491 497 501 496 501 504 507 512 518 521 Ratios 2004 2005E 2006E 2007E 2008E 2009E 2010E 2011E 2012E 2013E 2014E 2015E
Debt/Equity 36.5% 20.8% 71.3% 70.8% 69.6% 68.4% 67.1% 65.4% 63.8% 62.4% 60.8% 58.1%Net Debt/Equity -45.7% -62.0% 29.5% 27.4% 20.6% 13.2% 8.2% 3.3% -1.5% -5.5% -9.4% -13.5%Net Debt/EBITDA (x) (0.6) (1.1) 0.8 0.7 0.5 0.3 0.2 0.1 (0.0) (0.1) (0.2) (0.3) ROE 42.7% 30.0% 18.8% 21.4% 24.9% 27.6% 27.4% 27.5% 26.8% 25.9% 27.1% 26.2%ROIC (EBIT) 38.6% 38.8% 24.9% 26.6% 31.4% 36.2% 37.4% 38.8% 39.1% 39.1% 42.3% 42.3%Asset Turnover 0.7 0.7 0.7 0.6 0.6 0.6 0.7 0.7 0.7 0.7 0.7 0.7 Operating Data 2004 2005E 2006E 2007E 2008E 2009E 2010E 2011E 2012E 2013E 2014E 2015E
Volumes (ktons) 365 325 364 378 394 408 415 421 423 423 423 423 Domestic Market 259 210 238 250 262 276 289 303 317 332 348 361 Export Market 106 115 126 129 131 132 125 118 106 91 75 62 Volume Growth 6.7% -10.9% 11.9% 4.0% 4.0% 3.6% 1.6% 1.4% 0.6% 0.0% 0.0% 0.0%Net Revenues (R$mn) 1,306 1,364 1,372 1,427 1,511 1,500 1,517 1,575 1,620 1,680 1,756 1,798 Domestic Market 919 869 873 917 981 989 1,031 1,106 1,186 1,289 1,412 1,497 Export Market 360 470 474 484 503 483 458 440 404 359 311 266 Utilities 27 25 25 26 28 28 28 29 30 32 34 35Avg Price (R$/ton) 3,578 4,193 3,768 3,769 3,838 3,677 3,658 3,744 3,831 3,971 4,153 4,250 Avg Price (US$/ton) 1,226 1,726 1,666 1,595 1,522 1,379 1,318 1,313 1,317 1,338 1,372 1,377 Domestic Market 1,215 1,704 1,622 1,552 1,481 1,342 1,284 1,279 1,284 1,306 1,340 1,345 Export Market 1,164 1,679 1,662 1,591 1,519 1,377 1,316 1,312 1,316 1,338 1,373 1,379 Inst. Capacity (kton/year) 394 411 425 436 436 436 436 436 436 436 436 436 Operating Rate (%) 92.8% 79.2% 85.7% 86.8% 90.3% 93.6% 95.1% 96.5% 97.0% 97.0% 97.0% 97.0%Feedstock Costs (US$/ton) 637 988 1,031 972 899 759 706 702 707 729 749 754 Unitary Margin (US$/ton) 589 739 635 623 623 620 611 611 610 609 623 622 EBITDA/ton (US$) 171 236 169 166 176 182 177 177 175 173 184 182

58
Petrochemical Sector, Feb-06
Free Cash Flow 2004 2005E 2006E 2007E 2008E 2009E 2010E 2011E 2012E 2013E 2014E 2015ENOPLAT 110 112 80 87 103 119 123 129 131 132 144 145Depreciation&Amortization 16 16 18 18 18 18 18 17 17 17 17 18NWC Change 117 (41) (4) (4) (6) 3 (5) (4) (2) (4) (4) (2) Capex (49) (58) (18) (19) (15) (16) (17) (17) (17) (18) (18) (18) Tax Contingencies - - (400) - - - - - - - - - Fiscal Benefits 3 15 8 11 15 - - - - - - - Free Cash Flow to Firm 197 44 (316) 93 116 124 119 125 128 127 139 143
Net Interest (54) (41) (35) (19) (17) (14) (12) (11) (9) (8) (6) (4) Taxes on Fin. Results 26 24 21 16 15 14 13 13 13 13 14 14 Increase (Decrease) in Debt - - 200 - 6 6 7 7 7 7 7 - Free Cash Flow to Equity 169 27 (129) 89 120 130 127 135 140 140 154 152
Sales Volume Breakdown (kton) Volumes and Operating Rate (%)
2 2 4259
2102 3 8 2 5 0 2 6 2 276 2 8 9 3 0 3 317 3 3 2 3 4 8 3 6 1
118
106
115
126129
131132
125 118 1 0 6 9 1 7 5 6 2
0
50
100
150
200
250
300
350
400
450
2003
2004
2005
E
2006
E
2007
E
2008
E
2009
E
2010
E
2011
E
2012
E
2013
E
2014
E
2015
E
Domestic Market Exports
0
50
100
150
200
250
300
350
400
450
500
2003
2004
2005
E
2006
E
2007
E
2008
E
2009
E
2010
E
2011
E
2012
E
2013
E
2014
E
2015
E
70%
75%
80%
85%
90%
95%
100%
Sales Volumes Capacity Operating Rate
Source: Espírito Santo Research Source: Espírito Santo Research
Avg. Prices per Market (USD/ton) Unitary Price, Spread and EBITDA (US D/ton)
300
500
700
900
1,100
1,300
1,500
1,700
1,900
2003
2004
2005
E
2006
E
2007
E
2008
E
2009
E
2010
E
2011
E
2012
E
2013
E
2014
E
2015
E
Domestic Market Exports
0
200
400
600
800
1,000
1,200
1,400
1,600
1,800
2,000
2003
2004
2005
E
2006
E
2007
E
2008
E
2009
E
2010
E
2011
E
2012
E
2013
E
2014
E
2015
EAvg. Price Spread over Input EBITDA
Source: Espírito Santo Research Source: Espírito Santo Research
CGS Breakdown (R$mn) Margins (%)
5 9 8 6 7 87 8 0
8 4 9 813 8 4 2 8709 5 9
3 3 4
3 4 92 7 3
2 6 3 2 8 6318
3 4 8 3 6 83 8 4 3 9 4
4 0 2410 418
9158 2 68 6 9 8 9 3
9 8 5
16
16 1618
1818
181717
17171818
0
200
400
600
800
1,000
1,200
1,400
1,600
2003
2004
2005
E
2006
E
2007
E
2008
E
2009
E
2010
E
2011
E
2012
E
2013
E
2014
E
2015
E
Inputs Other Cash-Costs Depreciation
0%
5%
10%
15%
20%
25%
2003
2004
2005
E
2006
E
2007
E
2008
E
2009
E
2010
E
2011
E
2012
E
2013
E
2014
E
2015
E
Gross EBITDA Liquid
Source: Espírito Santo Research Source: Espírito Santo Research
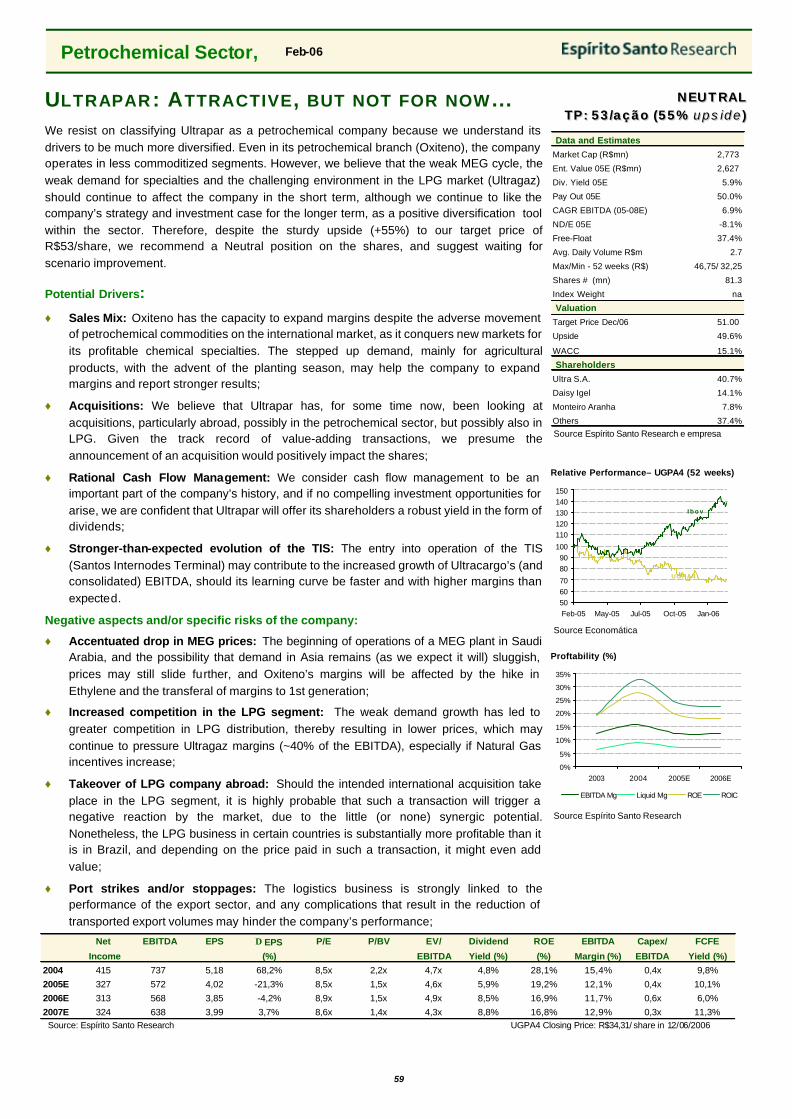
59
Petrochemical Sector, Feb-06
ULTRAPAR : ATTRACTIVE, BUT NOT FOR NOW ... NNEEUUTTRRAALL TTPP:: 5533//aaççããoo ((5555%% uuppss iiddee))
We resist on classifying Ultrapar as a petrochemical company because we understand its drivers to be much more diversified. Even in its petrochemical branch (Oxiteno), the company operates in less commoditized segments. However, we believe that the weak MEG cycle, the weak demand for specialties and the challenging environment in the LPG market (Ultragaz) should continue to affect the company in the short term, although we continue to like the company’s strategy and investment case for the longer term, as a positive diversification tool within the sector. Therefore, despite the sturdy upside (+55%) to our target price of R$53/share, we recommend a Neutral position on the shares, and suggest waiting for scenario improvement.
Potential Drivers: ♦ Sales Mix: Oxiteno has the capacity to expand margins despite the adverse movement
of petrochemical commodities on the international market, as it conquers new markets for its profitable chemical specialties. The stepped up demand, mainly for agricultural products, with the advent of the planting season, may help the company to expand margins and report stronger results;
♦ Acquisitions: We believe that Ultrapar has, for some time now, been looking at acquisitions, particularly abroad, possibly in the petrochemical sector, but possibly also in LPG. Given the track record of value-adding transactions, we presume the announcement of an acquisition would positively impact the shares;
♦ Rational Cash Flow Management: We consider cash flow management to be an important part of the company’s history, and if no compelling investment opportunities for arise, we are confident that Ultrapar will offer its shareholders a robust yield in the form of dividends;
♦ Stronger-than-expected evolution of the TIS: The entry into operation of the TIS (Santos Internodes Terminal) may contribute to the increased growth of Ultracargo’s (and consolidated) EBITDA, should its learning curve be faster and with higher margins than expected.
Negative aspects and/or specific risks of the company:
♦ Accentuated drop in MEG prices: The beginning of operations of a MEG plant in Saudi Arabia, and the possibility that demand in Asia remains (as we expect it will) sluggish, prices may still slide further, and Oxiteno’s margins will be affected by the hike in Ethylene and the transferal of margins to 1st generation;
♦ Increased competition in the LPG segment: The weak demand growth has led to greater competition in LPG distribution, thereby resulting in lower prices, which may continue to pressure Ultragaz margins (~40% of the EBITDA), especially if Natural Gas incentives increase;
♦ Takeover of LPG company abroad: Should the intended international acquisition take place in the LPG segment, it is highly probable that such a transaction will trigger a negative reaction by the market, due to the little (or none) synergic potential. Nonetheless, the LPG business in certain countries is substantially more profitable than it is in Brazil, and depending on the price paid in such a transaction, it might even add value;
♦ Port strikes and/or stoppages: The logistics business is strongly linked to the performance of the export sector, and any complications that result in the reduction of transported export volumes may hinder the company’s performance;
Data and Estimates
Market Cap (R$mn) 2,773
Ent. Value 05E (R$mn) 2,627
Div. Yield 05E 5.9%
Pay Out 05E 50.0%
CAGR EBITDA (05-08E) 6.9%
ND/E 05E -8.1%
Free-Float 37.4%
Avg. Daily Volume R$m 2.7
Max/Min - 52 weeks (R$) 46,75/ 32,25
Shares # (mn) 81.3
Index Weight na
Valuation
Target Price Dec/06 51.00
Upside 49.6%
WACC 15.1%
Shareholders
Ultra S.A. 40.7%
Daisy Igel 14.1%
Monteiro Aranha 7.8%
Others 37.4% Source: Espírito Santo Research e empresa
Relative Performance– UGPA4 (52 weeks)
506070
8090
100
110120130140150
Feb-05 May-05 Jul-05 Oct-05 Jan-06
I b o v
UGPA4
Source: Economática
Proftability (%)
0%
5%
10%
15%
20%
25%
30%
35%
2003 2004 2005E 2006E
EBITDA Mg Liquid Mg ROE ROIC
Source: Espírito Santo Research
Net EBITDA EPS ∆ EPS P/E P/BV EV/ Dividend ROE EBITDA Capex/ FCFE
Income (%) EBITDA Yield (%) (%) Margin (%) EBITDA Yield (%)
2004 415 737 5,18 68,2% 8,5x 2,2x 4,7x 4,8% 28,1% 15,4% 0,4x 9,8%
2005E 327 572 4,02 -21,3% 8,5x 1,5x 4,6x 5,9% 19,2% 12,1% 0,4x 10,1%
2006E 313 568 3,85 -4,2% 8,9x 1,5x 4,9x 8,5% 16,9% 11,7% 0,6x 6,0%
2007E 324 638 3,99 3,7% 8,6x 1,4x 4,3x 8,8% 16,8% 12,9% 0,3x 11,3% Source: Espírito Santo Research UGPA4 Closing Price: R$34,31/ share in 12/06/2006

60
Petrochemical Sector, Feb-06
Ultrapar – Projection Table Results Summary (R$mn) 2004 2005E 2006E 2007E 2008E 2009E 2010E 2011E 2012E 2013E 2014E 2015E
Net Revenues 4,784 4,712 4,822 4,913 5,095 5,054 5,094 5,288 5,530 5,816 6,106 6,353 UltraGaz 2,968 2,910 2,997 2,986 2,997 2,926 2,981 3,108 3,229 3,356 3,488 3,614 Oxiteno 1,663 1,623 1,624 1,700 1,848 1,852 1,807 1,844 1,932 2,055 2,174 2,252 UltraCargo 197 232 257 286 314 345 380 416 454 496 542 592CGS (3,670) (3,775) (3,871) (3,889) (3,990) (3,897) (3,916) (4,052) (4,196) (4,371) (4,548) (4,704)Gross Result 1,114 937 952 1,024 1,105 1,157 1,179 1,236 1,333 1,445 1,558 1,650 Gross Margin (%) 23.3% 19.9% 19.7% 20.8% 21.7% 22.9% 23.1% 23.4% 24.1% 24.8% 25.5% 26.0% UltraGaz 15.1% 13.3% 13.6% 14.4% 15.1% 16.2% 16.6% 16.6% 16.6% 16.6% 16.6% 16.6% Oxiteno 35.7% 28.8% 27.8% 28.9% 29.1% 29.9% 29.9% 30.4% 32.1% 33.6% 34.9% 35.8% UltraCargo 36.6% 34.9% 35.5% 35.9% 36.5% 37.2% 37.9% 38.6% 39.2% 39.8% 40.3% 40.8%EBITDA 737 573 582 646 709 750 757 792 864 946 1,030 1,092 UltraGaz 269 213 229 247 266 286 301 313 326 339 353 365 Oxiteno 421 305 294 332 368 380 363 377 426 484 541 578 UltraCargo 40 49 59 67 75 83 92 101 112 123 135 149 EBITDA Margin (%) 15.4% 12.2% 12.1% 13.2% 13.9% 14.8% 14.9% 15.0% 15.6% 16.3% 16.9% 17.2% UltraGaz 9.1% 7.3% 7.6% 8.3% 8.9% 9.8% 10.1% 10.1% 10.1% 10.1% 10.1% 10.1% Oxiteno 25.3% 18.8% 18.1% 19.5% 19.9% 20.5% 20.1% 20.4% 22.0% 23.5% 24.9% 25.7% UltraCargo 20.5% 21.1% 22.8% 23.5% 23.7% 24.0% 24.2% 24.4% 24.6% 24.7% 24.9% 25.1%Financial Result (45) (37) (36) (40) (38) (31) (24) (18) (12) (5) 2 13EBT 503 348 355 413 480 531 549 593 674 766 859 934Taxes (177) (82) (72) (97) (122) (142) (147) (160) (185) (214) (244) (267)Fiscal Benefits 94 64 51 31 31 33 33 35 40 15 17 0 -- Effective tax rate (%) 16.5% 5.3% 5.9% 16.1% 19.1% 20.5% 20.7% 21.0% 21.5% 26.0% 26.4% 28.5%Net Income 415 326 330 342 384 418 432 465 525 563 629 663 Net Margin (%) 8.7% 6.9% 6.8% 7.0% 7.5% 8.3% 8.5% 8.8% 9.5% 9.7% 10.3% 10.4%Depreciation&Amortization 173 186 191 194 191 187 184 181 178 175 173 171Cash Earnings 588 513 521 536 575 605 615 646 703 738 801 834Dividends+IOE 170 196 264 274 307 334 345 372 420 450 503 531 Payout (%) 41.0% 60.0% 80.0% 80.0% 80.0% 80.0% 80.0% 80.0% 80.0% 80.0% 80.0% 80.0% Balance Sheet (R$mn) 2004 2005E 2006E 2007E 2008E 2009E 2010E 2011E 2012E 2013E 2014E 2015E
Current Assets 1,295 1,596 1,648 1,737 1,846 1,945 2,079 2,221 2,376 2,541 2,719 2,841 Cash&Equivalents 597 957 965 1,045 1,113 1,228 1,345 1,460 1,580 1,702 1,841 1,934 Accounts Receivables 369 343 370 377 398 392 402 419 441 466 491 509 Inventories 206 184 194 196 211 204 206 211 218 228 235 240 Long-term Assets 105 127 135 136 141 139 143 149 156 165 173 179 Fixed Assets 1,179 1,210 1,292 1,309 1,301 1,290 1,281 1,273 1,266 1,260 1,255 1,251 Total Assets 2,579 2,933 3,076 3,181 3,288 3,374 3,504 3,643 3,799 3,965 4,146 4,270 Current Liabilities 597 366 381 398 420 423 436 451 467 486 505 592 Debt 293 171 192 210 223 231 237 245 253 262 271 351 Suppliers 102 87 76 77 83 81 83 86 90 94 99 102 Long-term Liabilities 353 759 822 843 852 852 884 916 951 987 1,024 928 Shareholder Equity 1,600 1,778 1,843 1,910 1,986 2,069 2,154 2,247 2,351 2,463 2,588 2,720 Total Liabilities 2,579 2,933 3,076 3,181 3,288 3,374 3,504 3,643 3,799 3,965 4,146 4,270 Total Gross Debt 551 842 920 959 977 987 1,022 1,058 1,096 1,135 1,175 1,155 Net Debt (Cash) (46) (115) (45) (86) (136) (241) (323) (402) (484) (567) (665) (779) Invested Capital 1,554 1,663 1,798 1,824 1,850 1,828 1,831 1,844 1,867 1,895 1,922 1,941 Ratios (%) 2004 2005E 2006E 2007E 2008E 2009E 2010E 2011E 2012E 2013E 2014E 2015E
Debt/Equity 34.4% 47.4% 49.9% 50.2% 49.2% 47.7% 47.4% 47.1% 46.6% 46.1% 45.4% 42.5%Net Debt/Equity -2.9% -6.5% -2.4% -4.5% -6.9% -11.7% -15.0% -17.9% -20.6% -23.0% -25.7% -28.6%Net Debt/EBITDA (x) (0.1) (0.2) (0.1) (0.1) (0.2) (0.3) (0.4) (0.5) (0.6) (0.6) (0.6) (0.7) ROE 28.1% 19.3% 18.2% 18.2% 19.7% 20.6% 20.4% 21.1% 22.9% 23.4% 24.9% 25.0%ROIC (EBIT) 32.8% 24.0% 22.6% 25.0% 28.2% 30.6% 31.3% 33.3% 37.0% 41.0% 44.9% 47.7%Asset Turnover (x) 1.9 1.7 1.6 1.6 1.6 1.5 1.5 1.5 1.5 1.5 1.5 1.5
Operating Data 2004 2005E 2006E 2007E 2008E 2009E 2010E 2011E 2012E 2013E 2014E 2015EVol. Ultragaz - LPG (kton) 1,549 1,540 1,565 1,592 1,619 1,643 1,657 1,671 1,685 1,699 1,713 1,722 Residential Segment 1,052 1,047 1,063 1,079 1,095 1,112 1,123 1,134 1,145 1,157 1,168 1,174 Bulk Segment 497 492 502 513 524 531 534 537 539 542 545 548 -- Growth YoY (%) 13.7% -0.6% 1.7% 1.7% 1.7% 1.5% 0.8% 0.8% 0.8% 0.8% 0.8% 0.5%Revenue/ton - Ultragaz (R$/ton) 1,917 1,890 1,915 1,876 1,851 1,781 1,799 1,860 1,917 1,975 2,036 2,099ex-Refinery LPG Cost 1,051 1,051 1,051 979 917 810 788 810 826 842 859 877EBITDA/ton - Ultragaz (R$/ton) 174 139 146 155 164 174 181 188 194 200 206 212EBITDA/ton - Ultragaz (US$) 59 57 65 66 65 65 65 66 67 67 68 69Volumes Oxiteno - Petroch. (000ton) 518 539 560 583 607 626 640 655 664 672 679 686 Glycol, Domestic 83 93 95 97 99 101 103 105 106 107 108 109 Specialties, Domestic 258 274 290 309 328 343 353 364 369 375 378 382 Glycol, Exports 83 86 88 89 91 92 94 95 96 97 98 99 Specialties, Exports 94 87 87 88 89 90 91 92 93 94 95 96Revenue/ton - Oxiteno (R$/ton) 1,099 1,239 1,282 1,234 1,208 1,110 1,017 987 1,000 1,030 1,058 1,063Feedstock Cost (US$/ton) 325 403 389 365 337 283 262 259 259 266 272 273EBITDA/ton - Oxiteno (R$) 812 566 524 569 607 607 567 575 641 719 796 843EBITDA/ton - Oxiteno (US$) 278 233 232 241 241 228 204 202 220 242 263 273Storage - Ultracargo (000m 3) 204 226 277 333 361 381 397 409 421 434 447 460Operating Rate (%) 98.5% 91.4% 96.3% 98.1% 98.5% 98.5% 98.5% 98.5% 98.5% 98.5% 98.5% 98.5%Transportation-Ultracargo(km) 50,206 53,221 56,330 59,907 62,949 66,335 70,104 73,422 76,898 80,539 84,352 88,345

61
Petrochemical Sector, Feb-06
Free Cash Flow 2004 2005E 2006E 2007E 2008E 2009E 2010E 2011E 2012E 2013E 2014E 2015ENOPLAT 384 264 268 310 354 384 390 416 467 526 585 629Depreciation&Amortization 173 186 191 194 191 187 184 181 178 175 173 171NWC Change (35) (50) (50) (9) (32) 10 (11) (20) (27) (32) (30) (21) Capex (268) (220) (273) (210) (184) (176) (175) (173) (171) (169) (167) (167) Fiscal Benefits 94 56 51 31 31 33 33 35 40 15 17 - Free Cash Flow to Firm 347 237 187 315 360 438 422 440 488 515 577 612 Net Interest Paid (7) 1 (5) (7) (4) 3 11 18 26 34 43 54 Debt Tax Break 90 23 1 14 (11) (3) (3) (0) 7 (16) 11 26 Increase (decrease) in Debt (81) 20 47 5 (15) (25) - - - - - - Free Cash Flow to Equity 349 281 230 328 330 413 429 458 521 533 631 691
Revenue Breakdown (R$mn) Sales Volume (ktons)
2 6 2 32 9 6 8 2910 2 9 9 7 2 9 8 6 2 9 9 7 2 9 2 6 2 9 8 1 3 1 0 8 3 2 2 9 3356 3 4 8 8 3614
1,238
1,663 1,848
2,0552,174
2,252
177
197
1,623 1,624 1,700 1,852
1,9321 , 8 4 41,807
2 3 2 2 5 72 8 6
314 3 4 5
5 9 25 4 2
4 9 64 5 4
3 8 0416
0
1,000
2,000
3,000
4,000
5,000
6,000
7,000
2003
2004
2005
E
2006
E
2007
E
2008
E
2009
E
2010
E
2011
E
2012
E
2013
E
2014
E
2015
E
Ultragaz Oxiteno Ultracargo
0
200
400
600
800
1,000
1,200
1,400
1,600
1,800
2,000
2003
2004
2005
E
2006
E
2007
E
2008
E
2009
E
2010
E
2011
E
2012
E
2013
E
2014
E
2015
E
0
100
200
300
400
500
600
700
800
Ultragaz Oxiteno (rig.)
Source: Espírito Santo Research Source: Espírito Santo Research
Avg. Prices per Unit (BRL/ton) Margens EBITDA per Unit (%)
0%
5%
10%
15%
20%
25%
30%
2003
2004
2005
E
2006
E
2007
E
2008
E
2009
E
2010
E
2011
E
2012
E
2013
E
2014
E
2015
EUltragaz Oxiteno Ultracargo
Source: Espírito Santo Research Source: Espírito Santo Research
EBITDA Breakdown (R$mn) Margins (%)
2 0 82 6 9
213 2 2 8 2 4 6 2 6 5 2 8 6 3 0 2 316 3 2 9 3 4 2 3 5 6 3 6 8
2 4 3
4 0
4 05 6 95 3 2
475418
3 6 93 5 53723 6 0
3 2 32 8 03 0 5
4 2 1
149135
123112
1019 28 3
756 7
5 94 9
0
200
400
600
800
1,000
1,200
2003
2004
2005
E
2006
E
2007
E
2008
E
2009
E
2010
E
2011
E
2012
E
2013
E
2014
E
2015
E
Ultragaz Oxiteno Ultracargo
0%
5%
10%
15%
20%
25%
30%
2003
2004
2005
E
2006
E
2007
E
2008
E
2009
E
2010
E
2011
E
2012
E
2013
E
2014
E
2015
E
Gross EBITDA Liquid
Source: Espírito Santo Research Source: Espírito Santo Research
1.200
1.700
2.200
2.700
3.200
3.700
2003
2004
2005
E
2006
E
2007
E
2008
E
2009
E
2010
E
2011
E
2012
E
2013
E
2014
E
2015
E
Ultragaz Oxiteno (dir.)

59
Setor Petroquímico, Feb-06
Mexico: 1,690
HDPE/LLDPE 200 Venezuela: 389
Pemex 200 HDPE/LLDPE 100
LDPE 290 Polinter 100
Pemex 290 LDPE 85
PP 200 Polinter 85
Indelpro 200 PP 84
PVC 500 Pequiven 84 Brasil: 6,341
Primex 300 PVC 120 HDPE/LLDPE 2,012 PVC 786 Policyd 130 Colombia: 845 Pequiven 120 Braskem 630 Braskem 550
Mexichem 70 LDPE 57 Ipiranga 550 Solvay 236
PS 500 Ecopetrol 57 Riopol 540 PET 394 Basf 160 PP 320 Politeno 210 M&S 290
Resirene 150 Propilco 320 Solvay 82 Braskem 70
Polidesa 190 PVC 325 LDPE 1,204 Vicunha 24
Petco 325 Braskem 630 Ledervin 10
PET 45 Dow 144 PS 620 Enka 45 Politeno 150 Dow 190
PS 98 Triunfo 160 Basf 190
Dow 70 PE União 120 Innova 120
Dexton 28 PP 1,325 Videolar 120
Braskem 550
Chile: 178 Polibrasil 625
LDPE 46 Ipiranga 150
Dow 46
PP 120 Petroquim 120 Argentina: 1,378
PS 12 HDPE/LLDPE 510 PVC 259 Basf 12 Dow 510 Solvay 210
LDPE 116 Imextrade 49
ICI 20 PET 130 Dow 96 Voridian 130
PP 280 PS 83 Cuyo 100 PEPSA 66
Petroken 180 Plast 11
Resigum 6
Setor Petroquímico, 7-Dez-05Setor Petroquímico, 7-Dez-05
9. A PÊNDICE9. A PÊNDICE9. APPENDIX
Brazil:
Petrochemical Sector, Feb-06

60
Petrochemical Sector, Feb-06
Odebretch
Pronor(Mariani)
NorquisaPensionFunds OthersPetrobras
DowChemical
Suzano Pet. (Polibrasil)
Politeno
Braskem
16%
50%
13%
12%
25%10% 48% 5% 12%
35%
Pet. Bahia (Mariani)
38%
Petroflex Polialden
20%
100%
Copesul
29%
Ref. Ipiranga (RIPI)
Pet. Ipiranga (CBPI)
Dist. Ipiranga (DPPI)
Ipiranga Quím. (ICQ)
Ipiranga Petroq (IPQ)
11%
8%
59%
21%
88%
Float
Others12%
25%
29%
Petrobras
16%
35%
Sumitomo e Itochu
30%
Suzano Holding
100%
20%
Polipropileno Part .
87%
9%
Rio Polímeros
33%
Unipar
33%10%
PQU
37%
13%
Petrobras
17%
7%Others
20%
PolietilenosUnião
100% Polibutenos
33%
Carbocloro 50%Occidental 50%33%
ChevronTexaco
33%
33%
Petrobras
33%
Itausa
Elekeiroz
93%
Others50%
42%
Others
13%
Petroq. Triunfo
Others
85%
15%
Petrobras 1st generation Holdings Petroq. Assets of 2nd generation
Petrobras Energia
Innova
100%
59%
Unigel
CBE
100%
3%
Ultrapar
Oxiteno
100%
2%
Acrinor
100%
Others
7%
Pet. Paulínia(before-oper.)
60%
40%
DSM Brasil
Acrinor
100%
SolvayBrasilBASF Brasil
Petrochemical Sector, Feb-06

Equ i ty I b e r i a - B r a z i l
Espírito Santo Research has issued this report for information purposes only. All the information contained in this report is based upon information available to the public and has been obtained from sources believed to be reliable, but Espírito Santo Research does not guarantee its accuracy or completeness. The opinions expressed herein are our present opinions only, and are subject to change without prior notice. Espírito Santo Research is not under any obligation to update or keep current the information and the opinions expressed herein. This report is not, and should not be construed as, an offer or a solicitation to buy or sell any securities or related financial instruments. The investment discussed or recommended in this report may be unsuitable for investors depending on their specific investment objectives and financial position. Where an investment is denominated in a currency other than the investor's currency, changes in rates of exchange may have an adverse effect on the value, price of, or income derived from the investment. Past performance is not necessarily a guide to future performance. Income from investments may fluctuate. The price or value of the investments to which this report relates, either directly or indirectly, may fall or rise against the interest of investors. The securities mentioned in this publication may not be eligible for sale in some states or countries. Espírito Santo Research does not accept any kind of liability for losses or damages which may arise from the use of this report. This report cannot be reproduced, in whole or in part, in any form or by any means, without Espírito Santo. The Espírito Santo Research is a trademark and aggregates the teams of analysis from Banco Espírito Santo, S.A. (Portugal) and its affiliates Banco Espírito Santo de Investimento, S.A. (Portugal), BES Securities do Brasil, S.A - Corretora de Câmbio e Valores Mobiliários, (Brazil) and Espírito Santo Investment, S.A.U., Sociedad de Valores (Spain). Until the date of publication of the present report, none of these institutions held business relations with the company object of this analysis, with the possibility however, of establishing one due to its activities.
Not disregarding provision stated in the “disclaimer” above, the analyst(s) of investment responsible for this report declare the following:
_ the analysis(es)/recommendation(s) herewith described reflect only and exclusively his(their) individual opinion(s), being developed independently and autonomously, even as far as BES Securities is concerned; _the BES Securities does not hold direct or indirect stake in the capital of the company(companies) object of analysis(es)/recommendation(s) in this report, but the Grupo Banco Espírito Santo in which it takes part, holds direct shareholding stake, and in some cases indirect, in the capital of the companies: Bradesco, Bradespar and its associated companies CVRD and CPFL Energia; and Brasilcel and its associated companies Telesp Celular Participações, Celular CRT Participações, Tele Sudeste Celular Participações, Tele Centro Oeste Participações and Tele Leste Celular Participações. Bradesco is a direct shareholder of BES Securities’ parent company. BES Securities participated in the public offerings of CPFL Energia, in September 2004, and Ultrapar, in April 2005, and was remunerated for this participation. With the exception of the companies mentioned before, the BES Securities does not hold direct or indirect stake in the capital of the other companies object of analysis(es/recommendations in this report, as well as it was not involved in the acquisition alienation and intermediation of securities issue by these companies in the market; _the analyst(s) does(do) not maintain relationship with any individual working for the company(companies) which securities was(were) target of analysis(es)/recommendation(s) in this report; _ the analyst(s) does(do) not hold, directly or indirectly, securities issued by the company(companies) object of analysis(es)/recommendation(s) in this report, which correspond to 5% (five percent) or more of the individual assets, not even until the date of publication, or is(are) involved in the acquisition, alienation and intermediation of securities issued by the company(companies) in the market; _ the analyst(s) does(do) not receive, nor does BES Securities, payment for services provided, nor maintain commercial relations with company object of analysis(es)/recommendation(s), or with individual or legal entity, fund or universality of rights that act on the behalf of company’s interest; _ the fixed compensation(s) and eventual variable compensation(s) are not related to pricing of securities issued by the company object of analysis(es)/recommendation(s) in this report. The variable compensation, eventually received, is conditioned to the fulfilment of qualitative and quantitative premises established by the BES Securities board, among which, net result of activities.

GLOBAL EQUITY RESEARCH Miguel Frasquilho [email protected] +351 21 310 6457
EQUITY RESEARCH IBERIA & BRAZIL Rodrigo Pinheiro, CFA Strategy
[email protected] +34 91 400 5270
BES SECURITIES DO BRASIL
Mônica Araújo Strategy, Oil & Gas, Pulp & Paper
+55 21 3212 3214
Elaine de La Rocque Steel, Mining, Aviation
+55 21 3212 3205
Luciana Leocadio Telecom
+55 21 3212 3203
Victor Pereira Energy, Banks
+55 21 3212 3215
Marcello Milman Consumer Goods, Petrochemical
+55 21 3212 3202
Yutaro Nagae
+55 21 3212 3229
Bernardo Bressane
[email protected] +55 21 3212 3232
Antonio Quirino [email protected] +55 21 3212 3225
MACROECONOMIA RESEARCH
Carlos Almeida Andrade Research
+351 21 310 6493
Sandra Utsumi
+55 11 3074 7359
SALES BRASIL - EQUITY
Rodrigo Campos [email protected]
+55 11 3074 7381
Juvenal das Neves Neto [email protected] +55 11 3074 7100
Rodrigo Carvalho (Europe)
[email protected] +351 21 319 9707
TRADING BRASIL - EQUITY AND BM&F
Trading Desk Rio de Janeiro [email protected] +55 21 3212 3200
Trading Desk São Paulo [email protected] +55 11 3074 7400
FIXED INCOME BRAZIL
Alberto Sansiviero Sales & Trading
[email protected] +55 11 3074 7384
Luz Felipe Fleury Sales & Trading
[email protected] +55 11 3074 7370
Flavia Nazaré Souza Corporate Desk
[email protected] +55 11 3074 7368
FIXED INCOME EUROPE
Carlos Pinto
[email protected] +351 21 310 95 81
Pedro Veiga Sales & Trading
[email protected] +351 21 310 95 82
Filipe Worsdell Sales & Trading
[email protected] +351 21 310 95 83
Henrique Anjos Corporate Desk
[email protected] +351 21 310 95 66
Bárbara Braamcamp Corporate Desk
[email protected] +351 21 310 95 69
BANCO ESPÍRITO SANTO Av. da Liberdade, 195 1250 - 142 Lisboa PORTUGAL
ESPIRITO SANTO DE INVESTIMENTO Rua Alexandre Herculano, 38 1269 - 161 Lisboa PORTUGAL
ESPIRITO SANTO INVESTMENT Calle Serrano, 88 28006 Madrid SPAIN
BES SECURITIES DO BRASIL Av. Rio Branco, 110 – 33º 20040 - 001 Rio de Janeiro BRAZIL
ESPÍRITO SANTO INVESTMENT Av. Brigadeiro Faria Lima,3729 – 8º 04538-905 São Paulo BRAZIL