Embed Size (px)
Citation preview
More necessary and less sufficient: an age-period-cohortapproach to overeducation from a comparative perspective
Eyal Bar-Haim1 & Louis Chauvel1 & Anne Hartung1
# The Author(s) 2019
AbstractIn many countries, the skilled labor market has lagged educational expansion. As a result ofincreased competition, younger cohorts of the highly educated face decreasing returns toeducation or overeducation. Surprisingly, decreasing occupational outcomes do not coincideempirically with the economic returns among those with tertiary education. Regarding theprocess of changes in economic returns to education based on cohort transformations, weexpect that the expansion of tertiary education affects specific cohorts, which find themselvesfacing more labor market competition. As a result, the economic returns to education shoulddecrease among younger cohorts even when the overall returns to education remain stable overtime. To study this process, we model economic returns with a new age-period-cohort-trendedlag (APCTLAG) method, which allows us to compare the gap in economic returns betweentertiary and less than tertiary education over cohorts. Using the Luxembourg Income Study(LIS), we analyze trends over three decades in 12 countries. Our results confirm thateducational returns for tertiary education have declined over time, even though the gapbetween the educated and the less educated has remained similar in most of the countries.For younger cohorts, tertiary education has become more necessary to survive in the compet-itive labor market, but the actual economic returns have decreased—making tertiary educationless sufficient than before.
Keywords Overeducation . Returns to education . Educational expansion . Skill-biasedtechnological change . Age-period-cohort model
Higher Educationhttps://doi.org/10.1007/s10734-018-0353-z
Authors share equal contribution.
* Eyal [email protected]
Louis [email protected]
Anne [email protected]
1 Institute for Research on Socio-Economic Inequality (IRSEI), University of Luxembourg, 11, Portedes Sciences, L-4366 Esch-sur-Alzette, Luxembourg
Introduction
This paper provides new evidence on the variation of returns to education cohorts andcountries in light of educational expansion and changes in the labor market. Economic returnsto higher education have an important role in determining the individuals’ chances later in life.Moreover, changes in the returns to education might affect social inequality, especially if theyare associated with changes in inequality of educational opportunities. The massive expansionof higher education at the second half of the twentieth century and especially since the 1990sled to concerns about a possible decline in returns to education due to the expansion, and if thelabor market demand for workers with higher education would be sufficient to meet the supplyof such workers (Mills 1953; Smith 1986). This is known in the literature as the prediction of“overeducation” (Freeman 1976; Sicherman 1991) or “educational inflation” (Collins 1979).Overeducation occurs when attainment of higher levels of education increases, due to educa-tional expansion, at a faster pace than the demand for educated workers in the labor market.Consequently, younger, better-educated cohorts face more competition in the labor market thanearlier cohorts, forcing them to settle for less prestigious jobs with lower wages.
The fear of declines in the returns to education has gained much political and academicattention (Ioakimidis 2018; Mateos-Romero and del Mar Salinas-Jiménez 2018; Knight et al.2017). However, the empirical results are somewhat contradicting: educational expansioncoincided in many countries with a decrease in occupational outcomes of tertiary educationholders, whereas economic returns increased at the same time (Bernardi and Ballarino 2016).Furthermore, the gap in economic returns between those with tertiary and non-tertiaryeducation has widened (Bernardi and Ballarino 2016). This may be driven by increasingdifficulties of people with postsecondary education to attain the same level of occupationalstatus as previous cohorts, although they still earn more than people with a lower level ofeducation. In their recent book, Bernardi and Ballarino (2016) report that in eight countries, theoccupational level of the highly educated relative to those with lower levels of education hasdecreased over time, while economic returns decreased only in three countries.
In this paper, we focus on the cohort transformations in the economic returns to education.To date, cohort and period trends have only rarely been separated in studies on returns toeducation. Economic returns tend to be sensitive to age and period effects, as bonusescomplementing earnings vary according to an employee’s experience as well as the economicperformance of a company (or, more generally, with the economic cycle). However, notaccounting for period effects may result in the overestimation of economic returns to educa-tion. For instance, in times of overall economic prosperity, economic returns to education areexpected to increase, even if the occupational returns are low. Therefore, structural andtemporal economic changes can affect the measurement of economic returns to education.
We also distinguish between absolute and relative economic returns to education (Rotmanet al. 2016). Relative returns refer to the income gap between those with tertiary and non-tertiary educational attainment, whereas absolute returns indicate returns to higher education ofcurrent cohorts relative to the returns in previous times or of older cohorts. Both types ofreturns do not necessarily covary over time. For instance, absolute returns to education mightdecrease over time and cohorts, and relative returns might increase due to the crowding outeffect of those with lower levels of education (Ben-David 2009). This situation illustrates agrim scenario, in which tertiary education becomes crucial for preventing downward mobility(i.e., it becomes more necessary), but is unable to provide better chances for upward mobility(less sufficient).
Higher Education
The paper is divided into three parts. First, we review previous findings regarding educa-tional expansion and returns to education. Next, we estimate the educational expansion and thechanges across cohorts in the returns to tertiary education for a number of countries. To do so,we use recent developments of age-period-cohort models that are able to account for cohortstrends in the dependent variable (APCTLAG). We then estimate, using linear regression, theeffect of educational expansion and skill-biased technological change (SBTC) on the returns toeducation, for a smaller sample of 10 countries. Finally, we discuss the results and claim that,overall, the educational expansion decreased the economic returns to education, even thoughthe trend is not identical in all countries.
Returns to education
Returns to education are usually regarded as the individual economic advantages based on aperson’s level of education (Card 1999; Tomlinson 2017). These returns may diverge acrosseducational levels due to labor market mechanisms that assign high-paying jobs to people withhigher education and lower-paying jobs to those with less education. Some scholars haveargued that this process is due to specific skills that are acquired in the process of education(Mincer 1958)—students learn important skills that might help them later in their work and arecompensated for their newly acquired skills (Becker 1962; García-Aracil and Van der Velden2008). Others claim that education is merely a sorting mechanism that students employ todemonstrate their skills (Spence 1973; Assaad et al. 2017) or other attributes that employersare willing to pay for (Bruin 1999).
Hence, returns to education are strongly affected by the supply and demand in the labormarket (Machin 2009). According to a simple model of supply and demand, with an increasein the demand for highly skilled workers, returns for education are expected to increase.Similarly, when there is a rise in the supply of highly skilled workers (i.e., more peopleattaining higher education), returns for education are expected, ceteris paribus, to decline. Inthe last few decades, a rise in the supply of highly skilled workers was a very commonsituation, usually referred to in the literature as “educational expansion” (Brown 2001).However, its consequences turned out to be more complicated than the theoretical modelhad implied.
Educational expansion
The expansion of tertiary education is one of the major societal changes of the twentiethcentury (Calderon 2012; Sarrico 2017), for which several non-exhaustive explanations havebeen suggested. According to Schofer and Meyer (2005), the rate of enrollment in highereducation (as the share of relevant cohort) has globally increased by more than 200% over thepast century. The major part of the expansion occurred in the second half of the century andhas continued until today. While post-secondary education was once a privilege reserved onlyfor the elite, it is common among young cohorts today, even in less-developed countries(Hannum and Buchmann 2005; Sarrico 2017).
Economic theory suggests that the expansion of tertiary education is a result of an increasein the demand for skilled labor (Keep and Mayhew 1996; Béduwé and Planas 2003). Duringthe last few decades, the labor market has become increasingly dependent on skilled workers.
Higher Education
New industries and occupations emerged based on the development of informationtechnology, and thus the need for professional occupations has increased (Berman andMachin 2000; Goldin and Katz 2009; Kristal 2013). This process is known as skill-biased technological change (SBTC). At the same time, the professionalization ofmanagement has augmented the demand for educated managers (Shenhav 1995).According to this explanatory framework, educational expansion thus is, in part, aresult of labor market demand in new and developing occupations (Konstantinovskiy2017). However, even after the demand for these occupations decreased, the supply ofhighly skilled workers persisted to increase (Beaudry et al. 2014, 2016), due toadaptive expectations (Giannini 2003).
In contrast, sociological theories have traditionally put a higher weight on non-economicfactors, and three distinct strands of literature focus on public policy, political negotiation andinstitutional change as the forces behind educational expansion. One strand of literature claimsthat the expansion of tertiary education was driven in most countries by direct public policyrather than by the free market. With a few exceptions, governments especially in Europe wereable to accelerate the development of tertiary education institutions through increasing thenumber of available higher education opportunities and encouraging student enrollment.Similarly, tuition fees also decreased in many Western countries, despite important exceptionssuch as the UK.
In some cases, the public policy related to educational expansion focused not only on theeducational supply, but also on the degree structure. In most European countries, the Bolognaprocess (Witte 2006) has made (directly and indirectly) changes easier and created new typesof tertiary education degrees, sometimes transforming former post-secondary education di-plomas into academic degrees, or creating new academic intuitions, usually with less prestigethan the former ones. In Germany, for example, post-secondary (Berufsakademien) were ableto grant bachelor’s degrees (Witte 2006). In Finland, the process has led to the introduction ofthe bachelor’s degree, whereas before only the master’s degree existed. As a result, bachelor’sstudents who were formerly considered dropouts are now considered tertiary-educated(Välimaa et al. 2007). In other countries, such as the Netherlands, the UK and France, theprocess has enabled less prestigious institutions to gain more prestige and to attract morestudents (Witte 2006).
A second strand of literature suggests that this expansion was a result of a political strugglebetween groups (such as classes, strata and other social groups) who wanted to ensure bettermobility chances for their children (Collins 1971). Such groups fought to expand educationalopportunities, regardless of market conditions and needs. A third aspect of the literature, alsosuggesting that educational expansion is not a result of labor market demand, focuses oninstitutional change. Schofer and Meyer (2005) explained the expansion of tertiary educationas a result of four global institutional changes: (1) democratization, which increased demandsfor tertiary education as a civil right; (2) the scientization of society that magnified theimportance of the role of schooling and science in society; (3) the rise of national developmentlogics, which perceived educational expansion as a means of progression; and (4) the rise ofthe global diffusion of pro-educational cultural models. All of these explanations underminethe role of the market in the expansion of education. Thus, in the subordination of labor marketrationales, educational expansion may result in a mismatch between highly skilled laborsupply and demand, which we refer to here as “overeducation” (Collins 1979; Sicherman1991). In contrast, some scholars only refer to overeducation as a mismatch between the levelof education needed for a specific job and the actual level of education utilized in the job (Di
Higher Education
Stasio et al. 2016). However, this definition implies that the skills required for each job areorthogonal to the market demands.
Expansion and changes in returns to education
Collins (1979) claimed that the expansion of tertiary education would lead to “credentialinflation.” He argues that tertiary education would become the modal education, with insuf-ficient high-skill jobs added to the labor market to meet the resulting demand. Competitionover jobs would increase, leading to higher requirements for each job. Collins predicted that, inthe future, even a technical position would require a doctorate degree. Collins’s argument alsoimplies that educational expansion will lead to decreasing returns to tertiary education.
Halaby (1994) noted that overeducation could manifest itself in various forms. First, theresult of competition could lead to fewer economic returns to skilled jobs, such as reducedwages for professional occupations. In this scenario, the relative economic returns, as the ratioof the wages of the tertiary-educated to the less-than-tertiary-educated, may actually increase,namely in cases where lower-educated workers are crowded out of their jobs by their better-educated counterparts.
Second, it is also possible that, similar to Collins’ (1979) prediction, the occupationalreturns to education decrease: under the condition that there are fewer possibilities for tertiaryeducation holders to acquire a (prestigious) job that fits their skills. In this scenario, absoluteeconomic returns to education, as well as the gap between those with low and high educationallevels, should remain stable or even decrease, in cases where the highly skilled cannot competefor low-skill jobs (Sakamoto and Powers 1995).
Therefore, it is necessary to distinguish between absolute and relative returns. Since adecrease in the occupational standing of the tertiary-educated may, in the long run, lead to acrowding out of those with lower levels of education, the latter might find themselves pushedout of the labor force or into precarious jobs due to competition with the former group.Consequently, this will lead to an increasing gap between the two groups, and for maintainingthe economic status quo, education will become “more necessary.” Further, returns to tertiaryeducation holders should diminish over cohorts, with returns to non-tertiary-educated individ-uals diminishing even more rapidly, resulting in education to be “less sufficient.” In that case,tertiary education will become more necessary but less sufficient to succeed in the labor marketthan before. Accordingly, regarding returns to education, we hypothesize:
H1: Tertiary education becomes more necessary: Educational expansion increases returnsto higher educational levels relative to those with less education.H2: Tertiary education becomes less sufficient: Educational expansion decreases returns tohigher educational levels relative to those of older cohorts.
The distinct results obtained for the two types of returns stems from common problems inmeasuring overeducation. First, cohort trends in returns to education have often been ignored.Most studies analyze the differences between two or more time points in the associationbetween education and income or occupational score. However, while educational attainmentremains fairly stable across time, occupational attainment does not. In other words, educationalexpansion concerns mostly younger cohorts, namely those at the age of graduation from theirlast educational level. Second, temporary changes in the labor market might affect returns to
Higher Education
education for a short period, without really influencing them in the long run. Therefore,ignoring cohort trends in measuring returns to education might lead to biased results.
SBTC and changes in returns to education
As noted, empirical studies on overeducation have not yielded conclusive results to date. Inmany countries, there is strong evidence supporting overeducation, regarding occupationalreturns, but much less in terms of economic returns. That is, while tertiary-educated personstend to be more often employed in occupations that do not match their credentials, theireconomic returns from education do not decrease. Recent studies (Bernardi and Ballarino2016) have found that occupational returns to post-secondary education holders decreased inSpain, Italy, Sweden, Israel, the Netherlands, Russia, France and Japan. However, economicreturns to education only decreased in Sweden, France and Norway. In contrast, economicreturns to education actually increased in Hungary, the Netherlands, Russia and Israel. Thesetrends seem to be due to an increase in the demand for highly skilled workers (SBTC), whichoccurred in parallel to the education expansion.
Crivellaro (2016) used an IV strategy to study the effect of supply and demand for highereducation on the returns to education in 12 European countries. He finds that the increase inthe demand (which is usually related to SBTC) had only a non-significant positive effect on thereturns for education, once the educational expansion was controlled for. Hence, according tohis findings, the effect of SBTC is mediated by the educational expansion.
Davia et al. (2016) found similar results in an international comparison of 25 Europeancountries. They discovered that, while educational expansion is associated with occupationalovereducation, the ratio of supply to demand for highly skilled labor has an important role inincreasing overeducation. Countries that experience SBTC (which increased the demand forhighly skilled labor) face lower levels of overeducation. Unfortunately, Davia and colleagues,as well as Crivellaro, did not directly measure overeducation in terms of economic returns.
In sum, regarding the effect of educational expansion, we hypothesize:
H3: Barring SBTC, educational expansion will decrease returns to education over cohorts.H4: In cases when substantial SBTC occurs, educational expansion will increase returns toeducation over cohorts.
Data, variables and methods
Data
Our analysis is based on data of the Luxembourg Income Study (LIS), which to our knowledgeis the best available cross-nationally comparable data source providing harmonized demo-graphic and economic information across a time span of more than three decades (Gornick2014). The data contain detailed information on the respondents’ household income as well asother important demographic variables such as age, education and gender. We construct 5-yearcohorts based on the year of birth from 1940 to 1980 and follow them over the period from1980 until 2010. The data are structured in a pseudo panel design, similar to the one suggestedby Deaton (1985), Deaton and Paxson (1994) and Verbeek and Vella (2005). In the pseudo
Higher Education
panel cohort design, which is also referred to as a Lexis table (Carstensen 2007), it is possibleto follow different cohorts over their life course, even if the individual respondents are drawnfrom different samples.
To increase our standard of harmonization, we limit our comparison to the 12 industrializedcountries for which all the data regarding education and income were available for all thewaves. Because of a lack of consistent, detailed occupational information and thus the inabilityto construct the SBTC measure, we exclude Norway and Italy from the last part of the analysis.Consequently, the overall sample consisted of 100 country-cohort data points in 10 countries.
Variables
Returns to education We use two different measures of the economic returns to education.The first is the household disposable income (PPP adjusted) equivalised per standard adult(DPI).1 To obtain our second measure, we transformed the DPI into logitranks (Chauvel 2016;Rotman et al. 2016; Tam 2013) (Eq. 1) for each cohort (c) in each time period (p) to createincome-based ranks that are indifferent to both cohort and period. In other words, educationalreturns are calculated at different stages of one’s life, but individuals of one cohort are onlycompared to those of other cohorts in the same age group. This standardization strategyenabled us to more accurately compare the economic returns over time and across countries.Because of the limited representativeness of survey data in the tails of the distribution, wetrimmed the data to the range between −4 (pertains to approximately the bottom 2% of theincome distribution) and 4 (the top 2%). A logitrank of zero refers to the median income.
logit rið Þc;p ¼ lnri
1−ri
� �c;p
ð1Þ
ri ∈ ]0, 1[ - rank order of income quantilesThe returns to education are not bound to individual labor income alone. We adopt here a
wider view, taking into account that labor market decisions are made jointly in the household,and that there are tradeoffs between household members that individual earnings are not ableto reflect. In addition, inequalities in educational returns may be magnified in households.Studies of assortative mating repeatedly found homogamy in terms of education (Mare 1991;Schwartz and Mare 2017). In other words, having tertiary education increases the likelihood ofmarriage to a spouse with tertiary education. At least in recent decades, this seems to haveimportant economic consequences: As the male breadwinner model declines (Blossfeld andBuchholz 2009), marital educational homogamy is assumed to increase the household incomeof the tertiary education owners and thus widen inequality in educational returns between thelow- and highly educated. Empirical studies, however, found little evidence of the effect ofmarital homogamy on overall income inequality (Breen and Salazar 2009, 2011; Breen andAndersen 2012). The reason put forward is that the increased employment gap betweenindividuals with tertiary and non-tertiary education accounted for most of the inequality ratherthan the gap based on marriage composition (Breen and Salazar 2009). Nevertheless, thehousehold income gap between tertiary- and non-tertiary-educated persons is higher than thegap in individual income from labor, implying that the returns to education are also evident inhousehold income (Yang 2004).
1 Household income, compared to wages or earnings, is a richer source of information as it summarizes thecombined effects of the spouses (Hout 2012).
Higher Education
Moreover, the tendency to exchange tertiary education with other forms of capital in themarriage market (i.e. tertiary-educated as documented by Schwartz et al. 2016) suggests thatindividual income in fact underestimates the actual economic returns to education. People usetheir tertiary education to marry partners with less education, but with higher social origin. Hence,the gains from tertiary education are arguably broader than mere individual earnings suggest.
One must note, however, that the household approach might overestimate the disadvantage ofsingles in the labor market. This is especially true for women, who are generally more educatedthan men but earn less income (Kim and Sakamoto 2015; Bar-Haim et al. 2018). In this study, wecontrol for gender in order to minimize this bias.2 Moreover, using a composite measure makes itmore difficult to disentangle the causes. Yet, our aim here is less to focus on the precise underlyingprocess rather but rather to estimate the total amount of inequality between the groups.
Education We dichotomized the highest level of education achieved, as calculated by the LIS,into tertiary vs. non-tertiary. Tertiary education pertains to ISCED level 5 or 6. Non-tertiaryeducation pertains to ISCED levels from 0 to 4.
Skill-biased technological change (SBTC) In order to measure this variable at the cohortlevel, we first identified high-skill occupations based on the 1-digit ISCO88 classificationprovided by LIS. Following the results of Goos et al. (2014), we considered all professional(category 2) and technical (category 3) occupations as high-skill occupations. The proportionof people in high-skill occupations serves as an indicator for SBTC.3
Method
We develop two new features of age-period-cohort (APC) models in order to observe cohortlevel changes in the returns to education, and in the factors that are driving the changes. Westart by shortly reviewing traditional APC models: The purpose of APC models is to explain adependent variable, y, observed in a series of cross-sectional surveys assembled in a Lexistable (Age x Period) through its decomposition in effects of age a (αa), period p (πp) and cohortmembership c (γc), as can be seen in Eq. 2.
yapc ¼ μþ αa þ πp þ γc APCð Þ ð2ÞIn an APC model, the dependent variable is affected by the age of the respondent, the period inwhich he or she lives and the generation, or birth cohort to which he or she belongs to.However, since cohort is a linear combination of age and period c = p − a, the basic modelsuffers from an identification problem, which has been extensively discussed and reviewed(Mason and Wolfinger 2001).
2 For a more detailed analysis of the effect of gender on the returns to education over cohorts, see Bar-Haim et al.(2018).3 In an unreported analysis, we used the level computerization in each country and year to obtain a proxy forSBTC (taken from the CNTS databank). However, using a year-based instead of a cohort-based measurementleads to arbitrary decisions regarding the proper year to be analyzed with regard to the relevant cohort. See Yaishand Andersen (2012) and Bar-Haim (2018) for further discussion of this problem. We also tested anothermeasurement, in which we included category 1 (Managers) as part of the SBTC definition. The results weresimilar due to the high correlation between the two measurements.
Higher Education
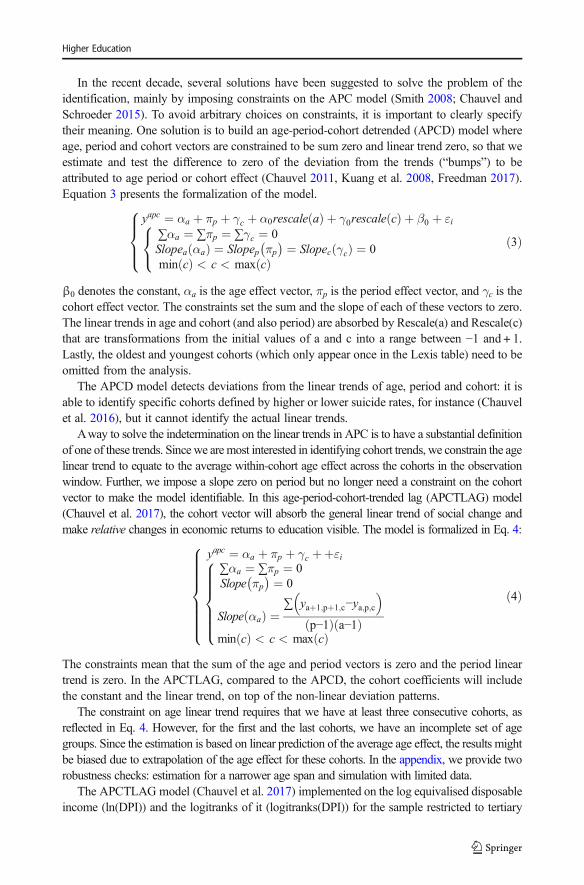
In the recent decade, several solutions have been suggested to solve the problem of theidentification, mainly by imposing constraints on the APC model (Smith 2008; Chauvel andSchroeder 2015). To avoid arbitrary choices on constraints, it is important to clearly specifytheir meaning. One solution is to build an age-period-cohort detrended (APCD) model whereage, period and cohort vectors are constrained to be sum zero and linear trend zero, so that weestimate and test the difference to zero of the deviation from the trends (“bumps”) to beattributed to age period or cohort effect (Chauvel 2011, Kuang et al. 2008, Freedman 2017).Equation 3 presents the formalization of the model.
yapc ¼ αa þ πp þ γc þ α0rescale að Þ þ γ0rescale cð Þ þ β0 þ εi∑αa ¼ ∑πp ¼ ∑γc ¼ 0Slopea αað Þ ¼ Slopep πp
� � ¼ Slopec γcð Þ ¼ 0min cð Þ < c < max cð Þ
8<:
8>><>>:
ð3Þ
β0 denotes the constant, αa is the age effect vector, πp is the period effect vector, and γc is thecohort effect vector. The constraints set the sum and the slope of each of these vectors to zero.The linear trends in age and cohort (and also period) are absorbed by Rescale(a) and Rescale(c)that are transformations from the initial values of a and c into a range between −1 and + 1.Lastly, the oldest and youngest cohorts (which only appear once in the Lexis table) need to beomitted from the analysis.
The APCD model detects deviations from the linear trends of age, period and cohort: it isable to identify specific cohorts defined by higher or lower suicide rates, for instance (Chauvelet al. 2016), but it cannot identify the actual linear trends.
Away to solve the indetermination on the linear trends in APC is to have a substantial definitionof one of these trends. Since we aremost interested in identifying cohort trends, we constrain the agelinear trend to equate to the average within-cohort age effect across the cohorts in the observationwindow. Further, we impose a slope zero on period but no longer need a constraint on the cohortvector to make the model identifiable. In this age-period-cohort-trended lag (APCTLAG) model(Chauvel et al. 2017), the cohort vector will absorb the general linear trend of social change andmake relative changes in economic returns to education visible. The model is formalized in Eq. 4:
yapc ¼ αa þ πp þ γc þþεi∑αa ¼ ∑πp ¼ 0Slope πp
� � ¼ 0
Slope αað Þ ¼∑ yaþ1;pþ1;c−ya;p;c� �
p−1ð Þ a−1ð Þmin cð Þ < c < max cð Þ
8>>>>><>>>>>:
8>>>>>>><>>>>>>>:
ð4Þ
The constraints mean that the sum of the age and period vectors is zero and the period lineartrend is zero. In the APCTLAG, compared to the APCD, the cohort coefficients will includethe constant and the linear trend, on top of the non-linear deviation patterns.
The constraint on age linear trend requires that we have at least three consecutive cohorts, asreflected in Eq. 4. However, for the first and the last cohorts, we have an incomplete set of agegroups. Since the estimation is based on linear prediction of the average age effect, the results mightbe biased due to extrapolation of the age effect for these cohorts. In the appendix, we provide tworobustness checks: estimation for a narrower age span and simulation with limited data.
The APCTLAG model (Chauvel et al. 2017) implemented on the log equivalised disposableincome (ln(DPI)) and the logitranks of it (logitranks(DPI)) for the sample restricted to tertiary
Higher Education
education holders only estimates the cohort variations of absolute returns to tertiary education.The estimation of the relative cohort returns of tertiary diploma holders relative to the non-tertiary-educated population, we first calculate the differences in the average ln(DPI) andlogitranks(DPI) between tertiary and non-tertiary education holders on the Lexis table. We thenestimate the cohort effect using the APCTLAG for the differences as the dependent variable.
The last part of the analysis is a linear regression in which the cases are country-cohort datapoints to predict the returns to education, aiming at assessing the extent to which educationalexpansion, SBTC, and their interaction impact returns to education. Our assumption underly-ing this is that there is an interaction between expansion and SBTC, i.e. the expansion oftertiary education affects its returns depending on the extent to which the market is able toabsorb the newly educated, i.e. the extent to which there is SBTC. Both expansion and SBTCenter the equation as independent variables in a linear model. The model is described in Eq. 5:
Y ¼ β0 þ β1Expansionþ β2SBTC þ β3Expansion*SBTC ð5Þwhere Y are the returns to education at the cohort by country level, based on the cohortcoefficients obtained from the previous models. The same method of acquiring the data pointswas used for expansion and SBTC, which are the independent variables in the model.
Results
Educational expansion
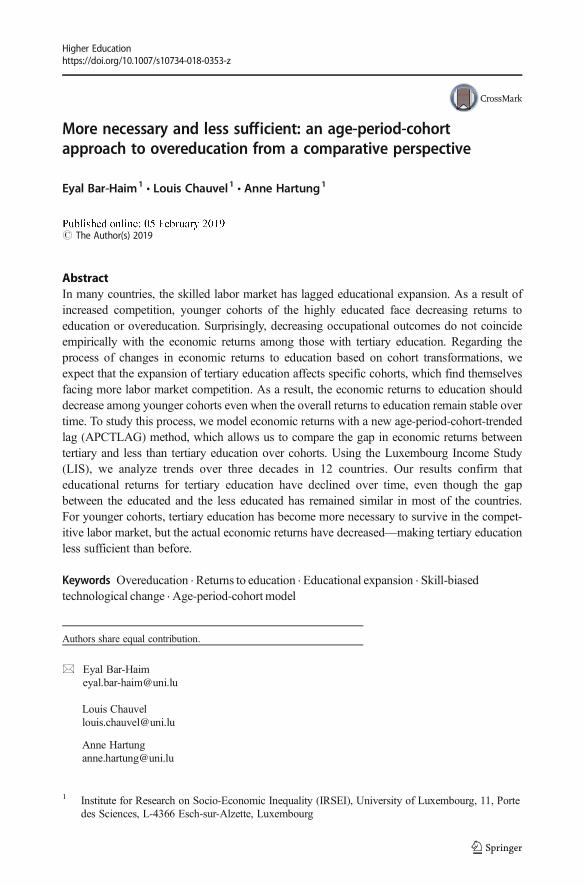
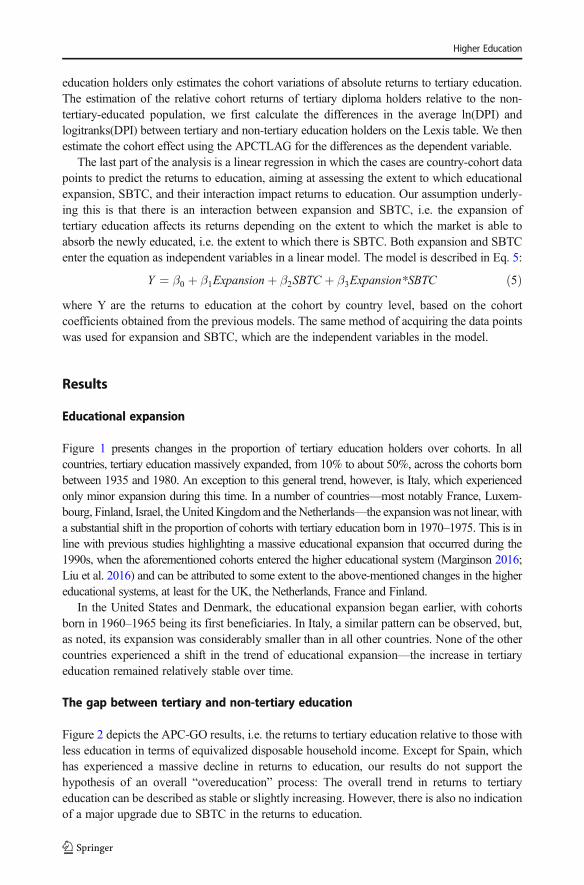
Figure 1 presents changes in the proportion of tertiary education holders over cohorts. In allcountries, tertiary education massively expanded, from 10% to about 50%, across the cohorts bornbetween 1935 and 1980. An exception to this general trend, however, is Italy, which experiencedonly minor expansion during this time. In a number of countries—most notably France, Luxem-bourg, Finland, Israel, theUnitedKingdom and theNetherlands—the expansionwas not linear, witha substantial shift in the proportion of cohorts with tertiary education born in 1970–1975. This is inline with previous studies highlighting a massive educational expansion that occurred during the1990s, when the aforementioned cohorts entered the higher educational system (Marginson 2016;Liu et al. 2016) and can be attributed to some extent to the above-mentioned changes in the highereducational systems, at least for the UK, the Netherlands, France and Finland.
In the United States and Denmark, the educational expansion began earlier, with cohortsborn in 1960–1965 being its first beneficiaries. In Italy, a similar pattern can be observed, but,as noted, its expansion was considerably smaller than in all other countries. None of the othercountries experienced a shift in the trend of educational expansion—the increase in tertiaryeducation remained relatively stable over time.
The gap between tertiary and non-tertiary education
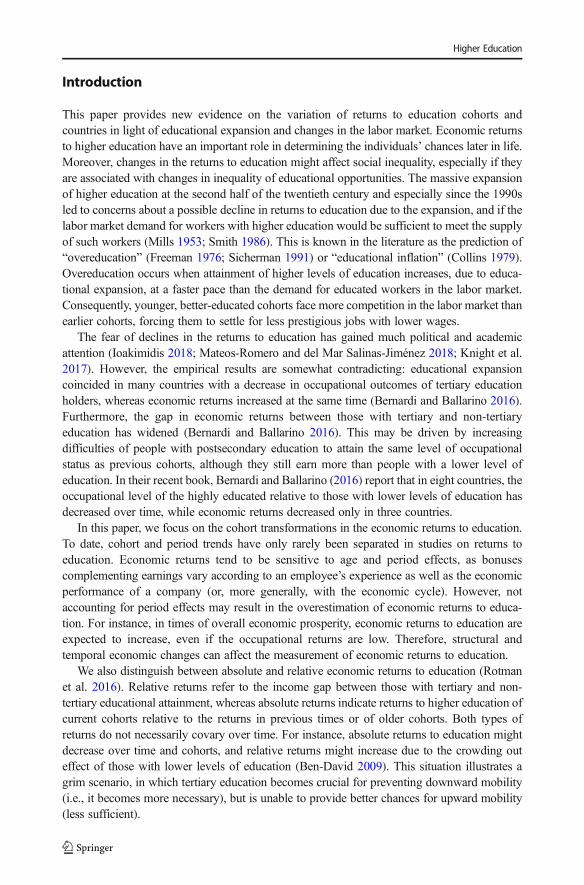
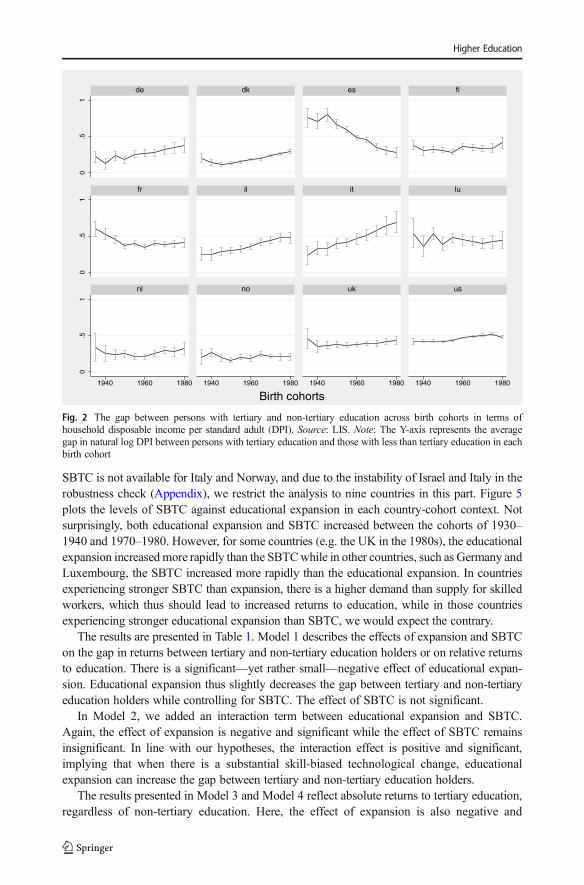
Figure 2 depicts the APC-GO results, i.e. the returns to tertiary education relative to those withless education in terms of equivalized disposable household income. Except for Spain, whichhas experienced a massive decline in returns to education, our results do not support thehypothesis of an overall “overeducation” process: The overall trend in returns to tertiaryeducation can be described as stable or slightly increasing. However, there is also no indicationof a major upgrade due to SBTC in the returns to education.
Higher Education
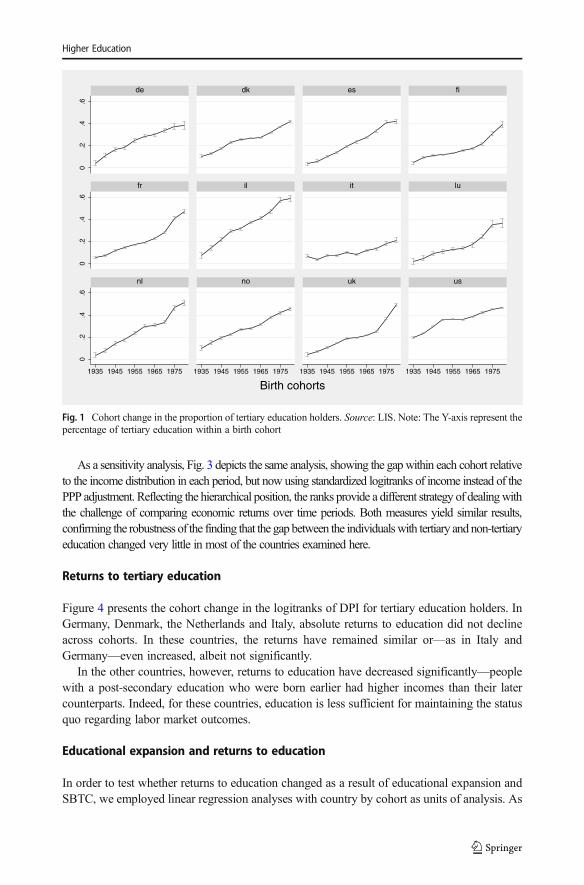
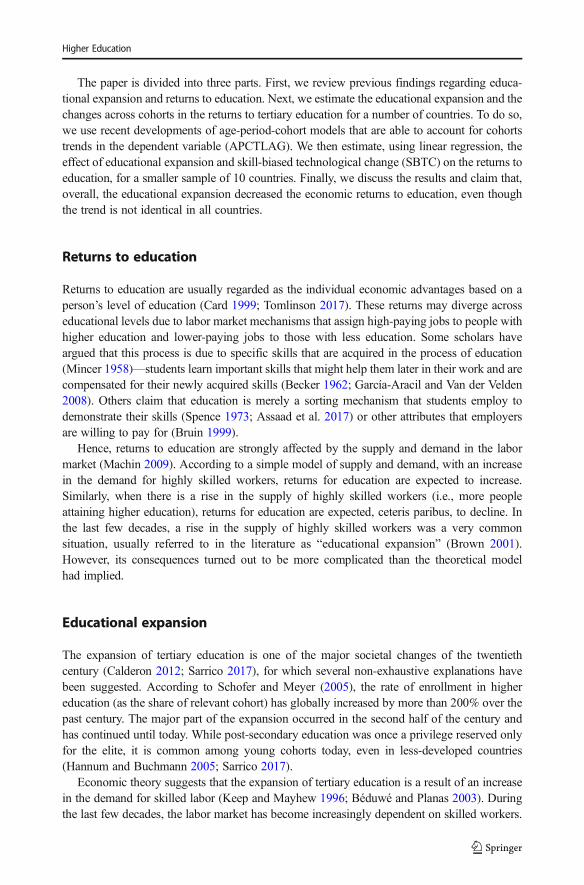
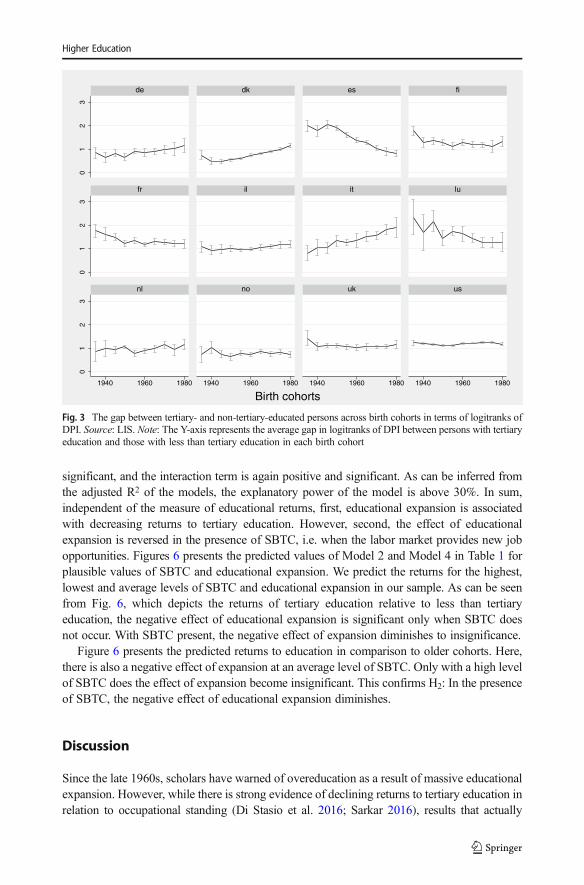
As a sensitivity analysis, Fig. 3 depicts the same analysis, showing the gapwithin each cohort relativeto the income distribution in each period, but now using standardized logitranks of income instead of thePPP adjustment. Reflecting the hierarchical position, the ranks provide a different strategy of dealingwiththe challenge of comparing economic returns over time periods. Both measures yield similar results,confirming the robustness of the finding that the gap between the individualswith tertiary andnon-tertiaryeducation changed very little in most of the countries examined here.
Returns to tertiary education
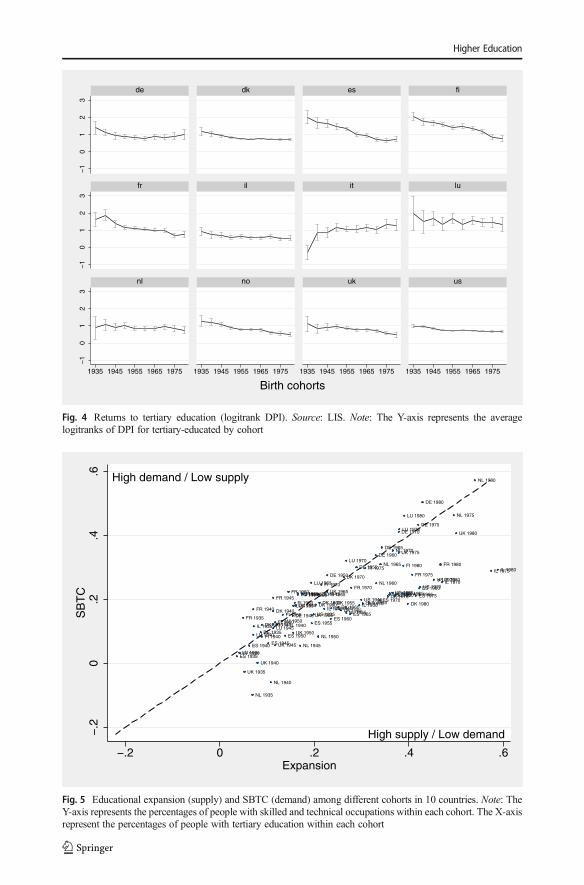
Figure 4 presents the cohort change in the logitranks of DPI for tertiary education holders. InGermany, Denmark, the Netherlands and Italy, absolute returns to education did not declineacross cohorts. In these countries, the returns have remained similar or—as in Italy andGermany—even increased, albeit not significantly.
In the other countries, however, returns to education have decreased significantly—peoplewith a post-secondary education who were born earlier had higher incomes than their latercounterparts. Indeed, for these countries, education is less sufficient for maintaining the statusquo regarding labor market outcomes.
Educational expansion and returns to education
In order to test whether returns to education changed as a result of educational expansion andSBTC, we employed linear regression analyses with country by cohort as units of analysis. As
0.2
.4.6
0.2
.4.6
0.2
.4.6
1935 1945 1955 1965 1975 1935 1945 1955 1965 1975 1935 1945 1955 1965 1975 1935 1945 1955 1965 1975
de dk es fi
fr il it lu
nl no uk us
Birth cohorts
Fig. 1 Cohort change in the proportion of tertiary education holders. Source: LIS. Note: The Y-axis represent thepercentage of tertiary education within a birth cohort
Higher Education
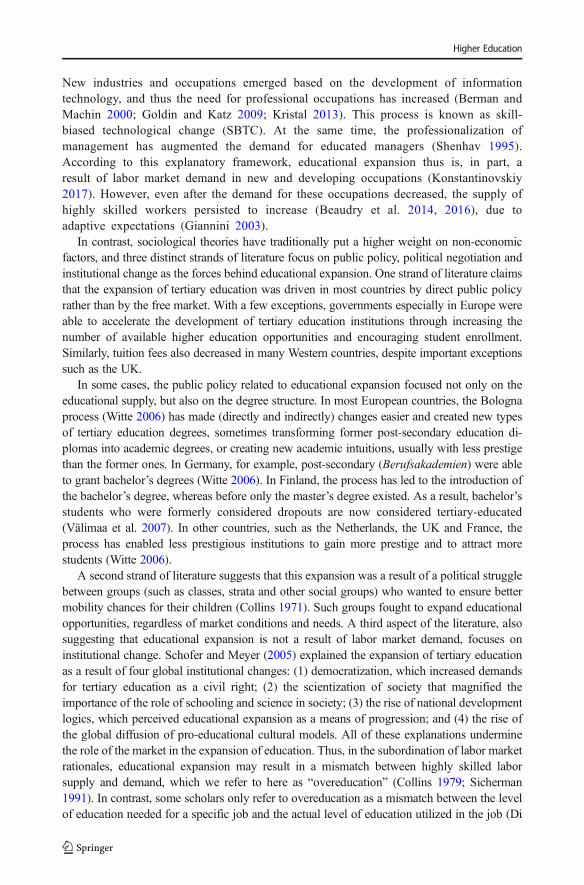
SBTC is not available for Italy and Norway, and due to the instability of Israel and Italy in therobustness check (Appendix), we restrict the analysis to nine countries in this part. Figure 5plots the levels of SBTC against educational expansion in each country-cohort context. Notsurprisingly, both educational expansion and SBTC increased between the cohorts of 1930–1940 and 1970–1980. However, for some countries (e.g. the UK in the 1980s), the educationalexpansion increasedmore rapidly than the SBTCwhile in other countries, such as Germany andLuxembourg, the SBTC increased more rapidly than the educational expansion. In countriesexperiencing stronger SBTC than expansion, there is a higher demand than supply for skilledworkers, which thus should lead to increased returns to education, while in those countriesexperiencing stronger educational expansion than SBTC, we would expect the contrary.
The results are presented in Table 1. Model 1 describes the effects of expansion and SBTCon the gap in returns between tertiary and non-tertiary education holders or on relative returnsto education. There is a significant—yet rather small—negative effect of educational expan-sion. Educational expansion thus slightly decreases the gap between tertiary and non-tertiaryeducation holders while controlling for SBTC. The effect of SBTC is not significant.
In Model 2, we added an interaction term between educational expansion and SBTC.Again, the effect of expansion is negative and significant while the effect of SBTC remainsinsignificant. In line with our hypotheses, the interaction effect is positive and significant,implying that when there is a substantial skill-biased technological change, educationalexpansion can increase the gap between tertiary and non-tertiary education holders.
The results presented in Model 3 and Model 4 reflect absolute returns to tertiary education,regardless of non-tertiary education. Here, the effect of expansion is also negative and
0.5
10
.51
0.5
1
1940 1960 1980 1940 1960 1980 1940 1960 1980 1940 1960 1980
de dk es fi
fr il it lu
nl no uk us
Birth cohorts
Fig. 2 The gap between persons with tertiary and non-tertiary education across birth cohorts in terms ofhousehold disposable income per standard adult (DPI). Source: LIS. Note: The Y-axis represents the averagegap in natural log DPI between persons with tertiary education and those with less than tertiary education in eachbirth cohort
Higher Education
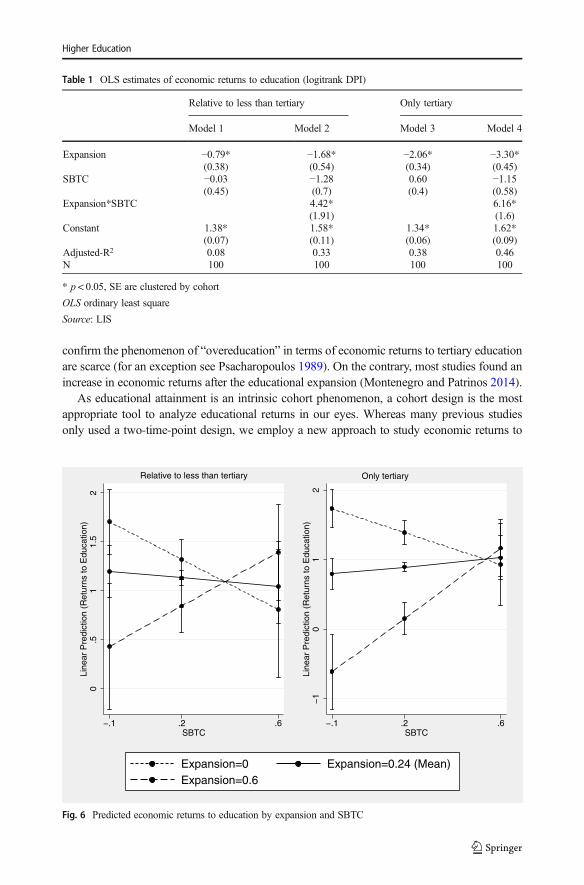
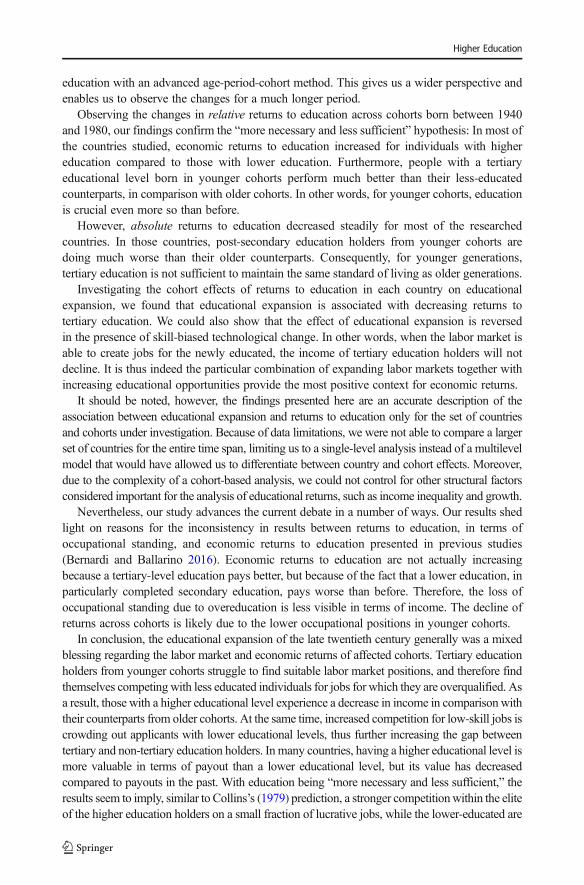
significant, and the interaction term is again positive and significant. As can be inferred fromthe adjusted R2 of the models, the explanatory power of the model is above 30%. In sum,independent of the measure of educational returns, first, educational expansion is associatedwith decreasing returns to tertiary education. However, second, the effect of educationalexpansion is reversed in the presence of SBTC, i.e. when the labor market provides new jobopportunities. Figures 6 presents the predicted values of Model 2 and Model 4 in Table 1 forplausible values of SBTC and educational expansion. We predict the returns for the highest,lowest and average levels of SBTC and educational expansion in our sample. As can be seenfrom Fig. 6, which depicts the returns of tertiary education relative to less than tertiaryeducation, the negative effect of educational expansion is significant only when SBTC doesnot occur. With SBTC present, the negative effect of expansion diminishes to insignificance.
Figure 6 presents the predicted returns to education in comparison to older cohorts. Here,there is also a negative effect of expansion at an average level of SBTC. Only with a high levelof SBTC does the effect of expansion become insignificant. This confirms H2: In the presenceof SBTC, the negative effect of educational expansion diminishes.
Discussion
Since the late 1960s, scholars have warned of overeducation as a result of massive educationalexpansion. However, while there is strong evidence of declining returns to tertiary education inrelation to occupational standing (Di Stasio et al. 2016; Sarkar 2016), results that actually
01
23
01
23
01
23
1940 1960 1980 1940 1960 1980 1940 1960 1980 1940 1960 1980
de dk es fi
fr il it lu
nl no uk us
Birth cohorts
Fig. 3 The gap between tertiary- and non-tertiary-educated persons across birth cohorts in terms of logitranks ofDPI. Source: LIS. Note: The Y-axis represents the average gap in logitranks of DPI between persons with tertiaryeducation and those with less than tertiary education in each birth cohort
Higher Education
DE 1935
DE 1940
DE 1945
DE 1950
DE 1955
DE 1960
DE 1965
DE 1970
DE 1975
DE 1980
DK 1935
DK 1940DK 1945
DK 1950DK 1955DK 1960DK 1965
DK 1970
DK 1975
DK 1980
ES 1935
ES 1940 ES 1945
ES 1950
ES 1955ES 1960
ES 1965
ES 1970ES 1975
ES 1980
FI 1935
FI 1940
FI 1945FI 1950
FI 1955
FI 1960
FI 1965
FI 1970
FI 1975 FI 1980
FR 1935
FR 1940
FR 1945FR 1950FR 1955FR 1960FR 1965
FR 1970
FR 1975
FR 1980
IL 1935 IL 1940
IL 1945IL 1950IL 1955
IL 1960 IL 1965
IL 1970
IL 1975IL 1980
LU 1935
LU 1940
LU 1945
LU 1950
LU 1955
LU 1960
LU 1965
LU 1970
LU 1975
LU 1980
NL 1935
NL 1940
NL 1945
NL 1950
NL 1955
NL 1960
NL 1965
NL 1970
NL 1975
NL 1980
UK 1935
UK 1940
UK 1945
UK 1950
UK 1955
UK 1960
UK 1965
UK 1970
UK 1975
UK 1980
US 1935US 1940
US 1945US 1950US 1955US 1960US 1965
US 1970
US 1975US 1980
High demand / Low supply
High supply / Low demand−.2
0.2
.4.6
SB
TC
−.2 0 .2 .4 .6Expansion
Fig. 5 Educational expansion (supply) and SBTC (demand) among different cohorts in 10 countries. Note: TheY-axis represents the percentages of people with skilled and technical occupations within each cohort. The X-axisrepresent the percentages of people with tertiary education within each cohort
−1
01
23
−1
01
23
−1
01
23
1935 1945 1955 1965 1975 1935 1945 1955 1965 1975 1935 1945 1955 1965 1975 1935 1945 1955 1965 1975
de dk es fi
fr il it lu
nl no uk us
Birth cohorts
Fig. 4 Returns to tertiary education (logitrank DPI). Source: LIS. Note: The Y-axis represents the averagelogitranks of DPI for tertiary-educated by cohort
Higher Education
confirm the phenomenon of “overeducation” in terms of economic returns to tertiary educationare scarce (for an exception see Psacharopoulos 1989). On the contrary, most studies found anincrease in economic returns after the educational expansion (Montenegro and Patrinos 2014).
As educational attainment is an intrinsic cohort phenomenon, a cohort design is the mostappropriate tool to analyze educational returns in our eyes. Whereas many previous studiesonly used a two-time-point design, we employ a new approach to study economic returns to
0.5
11.
52
Line
ar P
redi
ctio
n (R
etur
ns to
Edu
catio
n)
−.1 .2 .6SBTC
Relative to less than tertiary
−1
01
2Li
near
Pre
dict
ion
(Ret
urns
to E
duca
tion)
−.1 .2 .6SBTC
Only tertiary
Expansion=0 Expansion=0.24 (Mean)Expansion=0.6
Fig. 6 Predicted economic returns to education by expansion and SBTC
Table 1 OLS estimates of economic returns to education (logitrank DPI)
Relative to less than tertiary Only tertiary
Model 1 Model 2 Model 3 Model 4
Expansion −0.79* −1.68* −2.06* −3.30*(0.38) (0.54) (0.34) (0.45)
SBTC −0.03 −1.28 0.60 −1.15(0.45) (0.7) (0.4) (0.58)
Expansion*SBTC 4.42* 6.16*(1.91) (1.6)
Constant 1.38* 1.58* 1.34* 1.62*(0.07) (0.11) (0.06) (0.09)
Adjusted-R2 0.08 0.33 0.38 0.46N 100 100 100 100
* p < 0.05, SE are clustered by cohort
OLS ordinary least square
Source: LIS
Higher Education
education with an advanced age-period-cohort method. This gives us a wider perspective andenables us to observe the changes for a much longer period.
Observing the changes in relative returns to education across cohorts born between 1940and 1980, our findings confirm the “more necessary and less sufficient” hypothesis: In most ofthe countries studied, economic returns to education increased for individuals with highereducation compared to those with lower education. Furthermore, people with a tertiaryeducational level born in younger cohorts perform much better than their less-educatedcounterparts, in comparison with older cohorts. In other words, for younger cohorts, educationis crucial even more so than before.
However, absolute returns to education decreased steadily for most of the researchedcountries. In those countries, post-secondary education holders from younger cohorts aredoing much worse than their older counterparts. Consequently, for younger generations,tertiary education is not sufficient to maintain the same standard of living as older generations.
Investigating the cohort effects of returns to education in each country on educationalexpansion, we found that educational expansion is associated with decreasing returns totertiary education. We could also show that the effect of educational expansion is reversedin the presence of skill-biased technological change. In other words, when the labor market isable to create jobs for the newly educated, the income of tertiary education holders will notdecline. It is thus indeed the particular combination of expanding labor markets together withincreasing educational opportunities provide the most positive context for economic returns.
It should be noted, however, the findings presented here are an accurate description of theassociation between educational expansion and returns to education only for the set of countriesand cohorts under investigation. Because of data limitations, we were not able to compare a largerset of countries for the entire time span, limiting us to a single-level analysis instead of a multilevelmodel that would have allowed us to differentiate between country and cohort effects. Moreover,due to the complexity of a cohort-based analysis, we could not control for other structural factorsconsidered important for the analysis of educational returns, such as income inequality and growth.
Nevertheless, our study advances the current debate in a number of ways. Our results shedlight on reasons for the inconsistency in results between returns to education, in terms ofoccupational standing, and economic returns to education presented in previous studies(Bernardi and Ballarino 2016). Economic returns to education are not actually increasingbecause a tertiary-level education pays better, but because of the fact that a lower education, inparticularly completed secondary education, pays worse than before. Therefore, the loss ofoccupational standing due to overeducation is less visible in terms of income. The decline ofreturns across cohorts is likely due to the lower occupational positions in younger cohorts.
In conclusion, the educational expansion of the late twentieth century generally was a mixedblessing regarding the labor market and economic returns of affected cohorts. Tertiary educationholders from younger cohorts struggle to find suitable labor market positions, and therefore findthemselves competing with less educated individuals for jobs for which they are overqualified. Asa result, those with a higher educational level experience a decrease in income in comparison withtheir counterparts from older cohorts. At the same time, increased competition for low-skill jobs iscrowding out applicants with lower educational levels, thus further increasing the gap betweentertiary and non-tertiary education holders. Inmany countries, having a higher educational level ismore valuable in terms of payout than a lower educational level, but its value has decreasedcompared to payouts in the past. With education being “more necessary and less sufficient,” theresults seem to imply, similar to Collins’s (1979) prediction, a stronger competitionwithin the eliteof the higher education holders on a small fraction of lucrative jobs, while the lower-educated are
Higher Education
competing for getting a job, no matter which one. This scenario is direful for the sustainability ofthe higher educational system as well as for the entire society.
Acknowledgements This study was supported by the National Research Fund, Luxembourg, in the frame of thePEARL Chair project FNR/P11/05 and of the NORFACE-DIAL project “The impact of childhood circumstancesover the life-course, IMCHILD, project INTER/NORFACE/16/11333934. We would like to thank DanieleChecchi and Anja Leist for their useful comments. Earlier versions of this paper were presented at the firstLIS user conference, Esch-sur-Alzette (2017), RC28 meeting, Cologne (2017) and the ISA forum, Vienna(2016), and the authors wish to thank the participants for their insights.
Appendix: Robustness checks
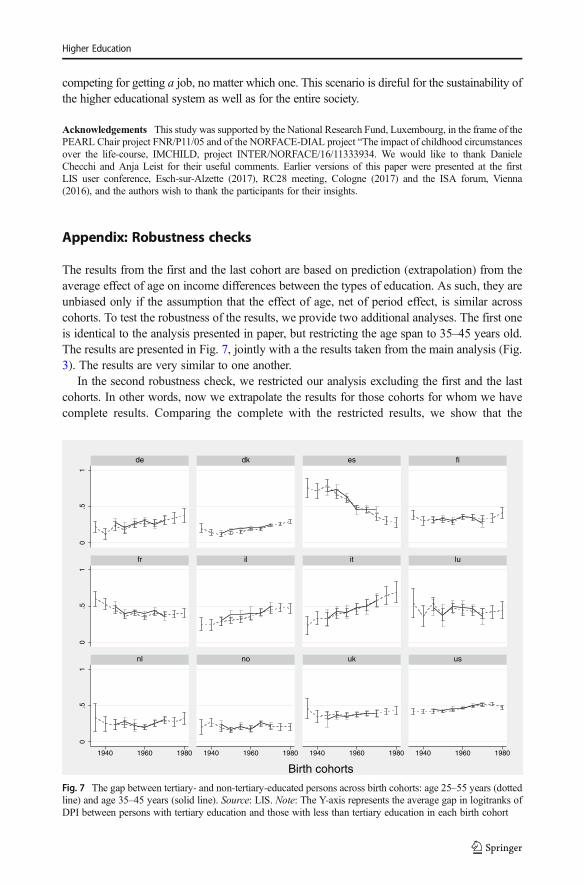
The results from the first and the last cohort are based on prediction (extrapolation) from theaverage effect of age on income differences between the types of education. As such, they areunbiased only if the assumption that the effect of age, net of period effect, is similar acrosscohorts. To test the robustness of the results, we provide two additional analyses. The first oneis identical to the analysis presented in paper, but restricting the age span to 35–45 years old.The results are presented in Fig. 7, jointly with a the results taken from the main analysis (Fig.3). The results are very similar to one another.
In the second robustness check, we restricted our analysis excluding the first and the lastcohorts. In other words, now we extrapolate the results for those cohorts for whom we havecomplete results. Comparing the complete with the restricted results, we show that the
0.5
10
.51
0.5
1
1940 1960 1980 1940 1960 1980 1940 1960 1980 1940 1960 1980
de dk es fi
fr il it lu
nl no uk us
Birth cohorts
Fig. 7 The gap between tertiary- and non-tertiary-educated persons across birth cohorts: age 25–55 years (dottedline) and age 35–45 years (solid line). Source: LIS. Note: The Y-axis represents the average gap in logitranks ofDPI between persons with tertiary education and those with less than tertiary education in each birth cohort
Higher Education
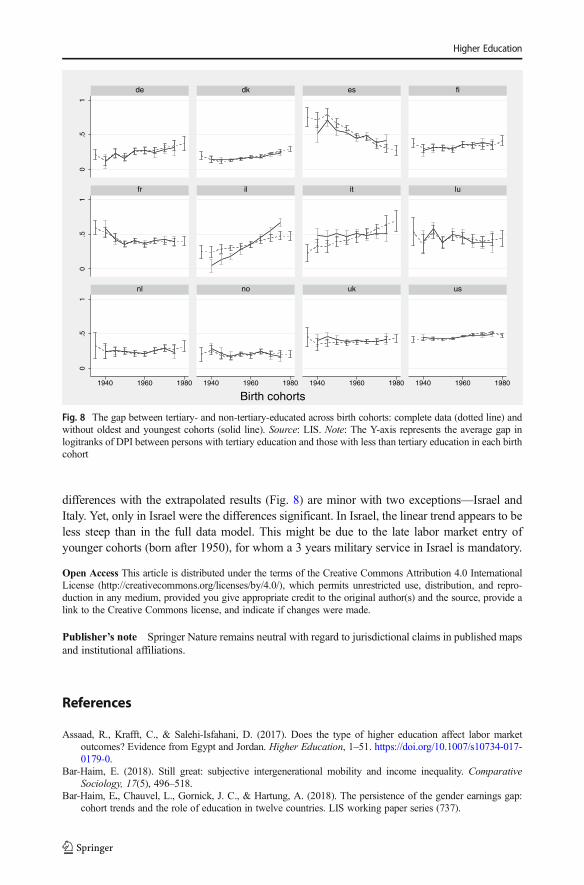
differences with the extrapolated results (Fig. 8) are minor with two exceptions—Israel andItaly. Yet, only in Israel were the differences significant. In Israel, the linear trend appears to beless steep than in the full data model. This might be due to the late labor market entry ofyounger cohorts (born after 1950), for whom a 3 years military service in Israel is mandatory.
Open Access This article is distributed under the terms of the Creative Commons Attribution 4.0 InternationalLicense (http://creativecommons.org/licenses/by/4.0/), which permits unrestricted use, distribution, and repro-duction in any medium, provided you give appropriate credit to the original author(s) and the source, provide alink to the Creative Commons license, and indicate if changes were made.
References
Assaad, R., Krafft, C., & Salehi-Isfahani, D. (2017). Does the type of higher education affect labor marketoutcomes? Evidence from Egypt and Jordan. Higher Education, 1–51. https://doi.org/10.1007/s10734-017-0179-0.
Bar-Haim, E. (2018). Still great: subjective intergenerational mobility and income inequality. ComparativeSociology, 17(5), 496–518.
Bar-Haim, E., Chauvel, L., Gornick, J. C., & Hartung, A. (2018). The persistence of the gender earnings gap:cohort trends and the role of education in twelve countries. LIS working paper series (737).
0.5
10
.51
0.5
1
1940 1960 1980 1940 1960 1980 1940 1960 1980 1940 1960 1980
de dk es fi
fr il it lu
nl no uk us
Birth cohorts
Fig. 8 The gap between tertiary- and non-tertiary-educated across birth cohorts: complete data (dotted line) andwithout oldest and youngest cohorts (solid line). Source: LIS. Note: The Y-axis represents the average gap inlogitranks of DPI between persons with tertiary education and those with less than tertiary education in each birthcohort
Publisher’s note Springer Nature remains neutral with regard to jurisdictional claims in published mapsand institutional affiliations.
Higher Education
Beaudry, P., Green, D. A., & Sand, B. M. (2014). In search of labor demand (No. w20568). National Bureau ofEconomic Research.
Beaudry, P., Green, D. A., Sand, B. M. (2016). The Great Reversal in the Demand for Skill and Cognitive Tasks.Journal of Labor Economics, 34(S1), S199–S247.
Becker, G. S. (1962). Investment in human capital: a theoretical analysis. Journal of Political Economy, 70(5,Part 2), 9–49.
Béduwé, C., & Planas, J. (2003). Educational expansion and labour market. CEDEFOP-Office for officialPublications of the European Communities. Luxembourg.
Ben-David, D. (2009). Israel’s labor market: Today, in the past and in comparison with the west. In D. Ben-David(Ed.), State of the nation report: Society, economy and policy in Israel (pp. 213–275). Jerusalem: TaubCenter for Social Policy Studies in Israel.
Berman, E., &Machin, S. (2000). Skill-biased technology transfer around the world.Oxford Review of EconomicPolicy, 16(3), 12–22.
Bernardi, F., & Ballarino, G. (Eds.). (2016). Education, occupation and social origin: A comparative analysis ofthe transmission of socio-economic inequalities. Cheltenham: Edward Elgar Publishing.
Blossfeld, H. P., & Buchholz, S. (2009). Increasing resource inequality among families in modern societies: themechanisms of growing educational homogamy, changes in the division of work in the family and thedecline of the male breadwinner model. Journal of Comparative Family Studies, 603–616.
Breen, R., & Andersen, S. H. (2012). Educational assortative mating and income inequality in Denmark.Demography, 49(3), 867–887.
Breen, R., & Salazar, L. (2009). Has increased women’s educational attainment led to greater earnings inequalityin the United Kingdom? A multivariate decomposition analysis. European Sociological Review, 26(2), 143–157.
Breen, R., & Salazar, L. (2011). Educational assortative mating and earnings inequality in the United States.American Journal of Sociology, 117(3), 808–843.
Brown, D. K. (2001). The social sources of educational credentialism: status cultures, labor markets, andorganizations. Sociology of Education, 74, 19–34.
Bruin, A. D. (1999). Towards extending the concept of human capital: a note on cultural capital. Journal ofInterdisciplinary Economics, 10(1), 59–70.
Calderon, A. (2012). High education in 2035–the ongoing massification. Melbourne: RMIT.Card, D. (1999). The causal effect of education on earnings. Handbook of Labor Economics, 3, 1801–1863.Carstensen, B. (2007). Age–period–cohort models for the Lexis diagram. Statistics in Medicine, 26(15), 3018–
3045.Chauvel, L. (2011). Age-Period-Cohort with hysteresis APC-H model/A method.Chauvel, L. (2016). The intensity and shape of inequality: the ABG method of distributional analysis. Review of
Income and Wealth, 62(1), 52–68.Chauvel, L., & Schroeder, M. (2015). The impact of cohort membership on disposable incomes in West
Germany, France, and the United States. European Sociological Review, 31(3), 298–311.Chauvel, L., Hartung, A., & Bar-Haim, E. (2017). APCGO: Stata module to calculate age-period-cohort effects
for the gap between two groups (based on a Blinder-Oaxaca decomposition), including trends for eachparameter.
Chauvel, L., Leist, A. K., & Ponomarenko, V. (2016). Testing persistence of cohort effects in the epidemiology ofsuicide: an age-period-cohort hysteresis model. PLoS One, 11(7), e0158538.
Collins, R. (1971). Functional and conflict theories of educational stratification. American Sociological Review,1002-1019.
Collins, R. (1979). The credential society: An historical sociology of education and stratification. New York:Academic Press.
Crivellaro, E. (2016). The College Wage premium over time: Trends in Europe in the last 15 years. In Inequality:Causes and Consequences (pp. 287-328). Emerald Group Publishing Limited.
Davia, M. A., McGuinness, S., & O’Connell, P. J. (2016). Determinants of regional differences in rates ofovereducation in Europe. Social Science Research, 63, 67–80.
Deaton, A. (1985). Panel data from time series of cross-sections. Journal of Econometrics, 30(1-2), 109–126.Deaton, A., & Paxson, C. (1994). Intertemporal choice and inequality. Journal of Political Economy, 102(3),
437–467.Di Stasio, V., Bol, T., & Van de Werfhorst, H. G. (2016). What makes education positional? Institutions,
overeducation and the competition for jobs. Research in Social Stratification and Mobility, 43, 53–63.Freedman, M. (2017). Are recent generations catching up or falling behind? Trends in inter-generational
inequality (No. 689). LIS Working Paper Series. Retrieved from http://hdl.handle.net/10419/169249Freeman, R. (1976). The overeducated American. New-York: Academic Press.
Higher Education
García-Aracil, A., & Van der Velden, R. (2008). Competencies for young European higher education graduates:labor market mismatches and their payoffs. Higher Education, 55(2), 219–239.
Giannini, M. (2003). Accumulation and distribution of human capital: the interaction between individual andaggregate variables. Economic Modelling, 20(6), 1053–1081.
Goldin, C. D., & Katz, L. F. (2009). The race between education and technology. Cambridge: Harvard UniversityPress.
Goos, M., Manning, A., & Salomons, A. (2014). Explaining job polarization: routine-biased technologicalchange and offshoring. American Economic Review, 104(8), 2509–2526.
Gornick, J. C. (2014). Luxembourg income study. In A. C. Michalos (Ed.), Encyclopedia of quality of life andwell-being research (pp. 3734–3736). Dordrecht: Springer Netherlands.
Halaby, C. N. (1994). Overeducation and skill mismatch. Sociology of Education, 67(1), 47–59.Hannum, E., & Buchmann, C. (2005). Global educational expansion and socio-economic development: an
assessment of findings from the social sciences. World Development, 33(3), 333–354.Hout, M. (2012). Social and Economic Returns to College Education in the United States. Annual Review of
Sociology, 38(1):379–400.Ioakimidis, M. (2018). Returns to education: a review of classical literature. Journal of Research in Educational
Sciences, 8(10), 5–13.Keep, E., & Mayhew, K. (1996). Economic demand for higher education—a sound foundation for further
expansion? Higher Education Quarterly, 50(2), 89–109.Kim, C., & Sakamoto, A. (2015). Women’s progress for men’s gain? Gender-Specific Changes in the Return to
Higher Education as Measured by Family Standard-of-Living, 1990 to 2010.Knight, J., Deng, Q., & Li, S. (2017). China’s expansion of higher education: the labour market consequences of
a supply shock. China Economic Review, 43, 127–141.Konstantinovskiy, D. L. (2017). Expansion of higher education and consequences for social inequality (the case
of Russia). Higher Education, 74(2), 201–220.Kristal, T. (2013). The capitalist machine: computerization, workers’ power, and the decline in labor’s share
within US industries. American Sociological Review, 78(3), 361–389.Kuang, D., Nielsen, B., & Nielsen, J. P. (2008). Identification of the age-period-cohort model and the extended
chain-ladder model. Biometrika, 95(4), 979–986.Liu, Y., Green, A., & Pensiero, N. (2016). Expansion of higher education and inequality of opportunities: a cross-
national analysis. Journal of Higher Education Policy and Management, 38(3), 242–263.Machin, S. (2009). Education and inequality. In W. Salverda, B. Nolan, & T. M. Smeeding (Eds.), The Oxford
handbook of economic inequality (pp. 406–434). Oxford: Oxford University Press.Mare, R. D. (1991). Five decades of educational assortative mating. American Sociological Review, 56(1), 15–32.Marginson, S. (2016). The worldwide trend to high participation higher education: dynamics of social stratifi-
cation in inclusive systems. Higher Education, 72(4), 413–434.Mason, W. M., & Wolfinger, N. H. (2001). Cohort analysis, International Encyclopedia of the Social &
Behavioral Sciences (pp. 2189–2194). Oxford: Pergamon.Mateos-Romero, L., & del Mar Salinas-Jiménez, M. (2018). Labor mismatches: effects on wages and on job
satisfaction in 17 OECD countries. Social Indicators Research, 1–23.Mills, C. W. (1953). 1953 white collar the Amencan middle classes. New York: Oxford University Press.Mincer, J. (1958). Investment in human capital and personal income distribution. Journal of Political Economy,
66(4), 281–302.Montenegro, C. E., & Patrinos, H. A. (2014). Comparable estimates of returns to schooling around the world.
Policy Research Working Paper 7020. Washington, DC: World Bank Group. Retrieved fromhttp://documents.worldbank.org/curated/en/830831468147839247/Comparable-estimates-of-returns-to-schooling-around-the-world
Psacharopoulos, G. (1989). Time trends of the returns to education: cross-national evidence. Economics ofEducation Review, 8(3), 225–231.
Rotman, A., Shavit, Y., & Shalev, M. (2016). Nominal and positional perspectives on educational stratification inIsrael. Research in Social Stratification and Mobility, 43, 17–24.
Sakamoto, A., & Powers, D. A. (1995). Education and the dual labor market for Japanese men. AmericanSociological Review, 60(2), 222–246.
Sarkar, S. (2016). Is employment polarization creating more over-educated workers? Evidence from Germany,Spain, Sweden and UK. Available at SSRN: https://ssrn.com/abstract=2843173 or https://doi.org/10.2139/ssrn.2843173
Sarrico, C. (2017). Higher education today. In: Sarrico, C., McQueen, A. and Samuelson, S. (eds.), State ofHigher Education 2015-16. OECD, Paris, pp. 3-16.
Schofer, E., & Meyer, J. W. (2005). The worldwide expansion of higher education in the twentieth century.American Sociological Review, 70(6), 898–920.
Higher Education
Schwartz, C. R., & Mare, R. D. (2017). The proximate determinants of educational homogamy. UCLA CCPRPopulation Working Papers.
Schwartz, C. R., Zeng, Z., & Xie, Y. (2016). Marrying up by marrying down: status exchange between socialorigin and education in the United States. Sociological Science, 3, 1003–1027.
Shenhav, Y. (1995). From chaos to systems: the engineering foundations of organization theory, 1879-1932.Administrative Science Quarterly, 40(4), 557–585.
Sicherman, N. (1991). “Overeducation” in the labor market. Journal of Labor Economics, 9(2), 101–122.Smith, H. L. (1986). Overeducation and underemployment: an agnostic review. Sociology of Education, 85–99.Smith, H. L. (2008). Advances in age–period–cohort analysis. Sociological Methods & Research, 36(3), 287–
296.Spence, M. (1973). Job market signaling. The Quarterly Journal of Economics, 87(3), 355–374.Tam, T. (2013, October). Analyzing education as a positional good: Categorical regression without arbitrary
identification. In The European Consortium for Sociological Research’s 2013 Conference, TilburgUniversity.
Tomlinson, M. (2017). Conceptions of the value of higher education in a measured market. Higher Education, 1-17. Retrieved from https://doi.org/10.1007/s10734-017-0165-6.
Välimaa, J., Hoffman, D., & Huusko, M. (2007). The Bologna process in Finland. In Creating the European areaof higher education (pp. 43–68). Dordrecht: Springer.
Verbeek, M., & Vella, F. (2005). Estimating dynamic models from repeated cross-sections. Journal ofEconometrics, 127(1), 83–102.
Witte, J. K. (2006). Change of degrees and degrees of change: Comparing adaptations of European highereducation systems in the context of the Bologna process.
Yaish, M., & Andersen, R. (2012). Social mobility in 20 modern societies: the role of economic and politicalcontext. Social Science Research, 41(3), 527–538.
Yang, D. T. (2004). Education and allocative efficiency: household income growth during rural reforms in China.Journal of Development Economics, 74(1), 137–162.
Higher Education