Embed Size (px)
Citation preview
More GeoProcessing
Matthew RosencransTom DiLiberto
Outline
• What else can we do in QGIS?• Geoprocessing– Within the GUI

Geoprocessing
• Operations that can be done on and to GIS data– Analysis methods that are possible because of the
geospatial nature of the data– Raster/Vector
• Bulk Statistics• Zonal Statistics
– Vector• Intersections• Dissolves, Clips, Buffers• Joins (Spatial, non-Spatial)

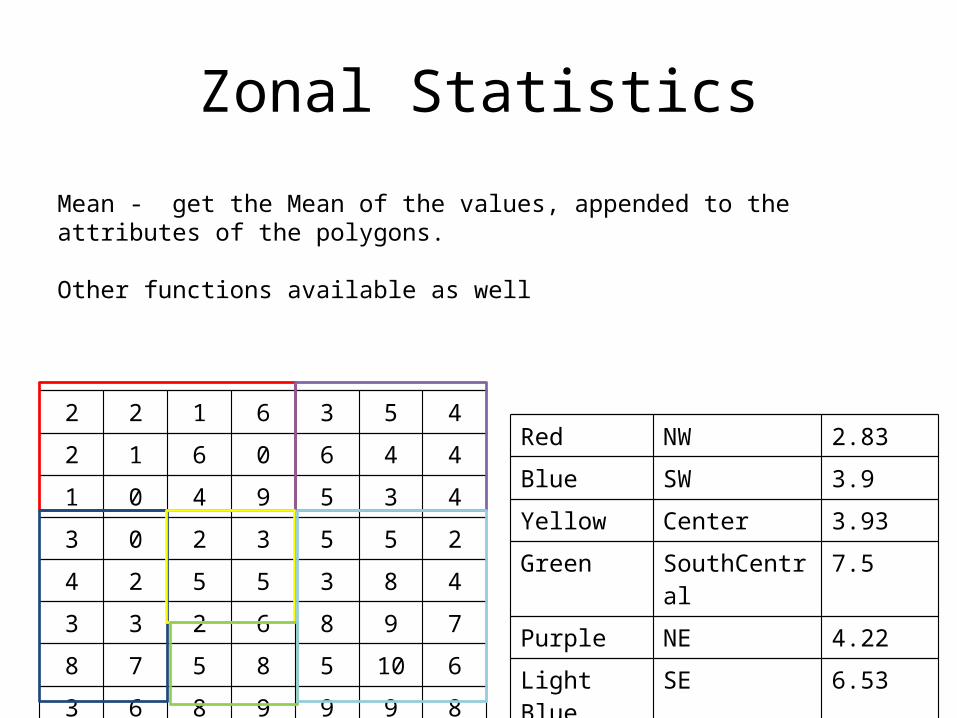
• Zonal Statistics– Statistics of a raster over each zone in a vector• How much rain fell in each province?• Gridded precipitation + Maps Provinces
Zonal Statistics
2 2 1 6 3 5 4
2 1 6 0 6 4 4
1 0 4 9 5 3 4
3 0 2 3 5 5 2
4 2 5 5 3 8 4
3 3 2 6 8 9 7
8 7 5 8 5 10 6
3 6 8 9 9 9 8
Red NW
Blue SW
Yellow Center
Green SouthCentral
Purple NE
Light Blue SE
Zonal Statistics
2 2 1 6 3 5 4
2 1 6 0 6 4 4
1 0 4 9 5 3 4
3 0 2 3 5 5 2
4 2 5 5 3 8 4
3 3 2 6 8 9 7
8 7 5 8 5 10 6
3 6 8 9 9 9 8
Red NW 2.83
Blue SW 3.9
Yellow Center 3.93
Green SouthCentral 7.5
Purple NE 4.22
Light Blue SE 6.53
Mean - get the Mean of the values, appended to the attributes of the polygons.
Other functions available as well

Geoprocessing
• Intersections– Deal with areas where spatial data overlap• Roads intersect with Counties• Forecasts intersect with counties/provinces
– Can help with impacted facilities, populations
• Spatial Join– Joins attributes, based on colocation

Intersections
• Determines the spatial reference. Also the spatial reference of the output feature class. Input features are projected into this spatial reference.
• Cracks and clusters. Cracking inserts vertices at the intersection of feature edges; clustering snaps together vertices that are within the xy tolerance.
• Discovers geometric relationships (intersections) between features from all the feature classes or layers.
• Writes these intersections as features (point, line, or polygon) to the output.• Attributes from both input data sources are mapped to the retained features

Intersections• Menu Bar• Vector• Geoprocessing Tools• Intersect
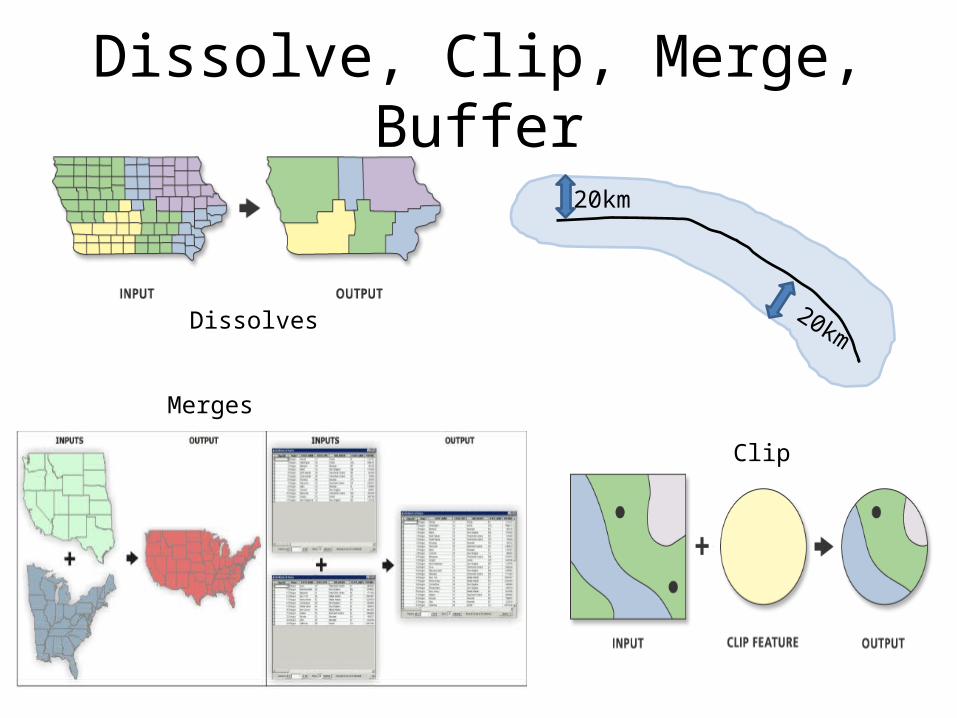
Dissolve, Clip, Merge, Buffer
Dissolves
Merges
20km
20km
Clip
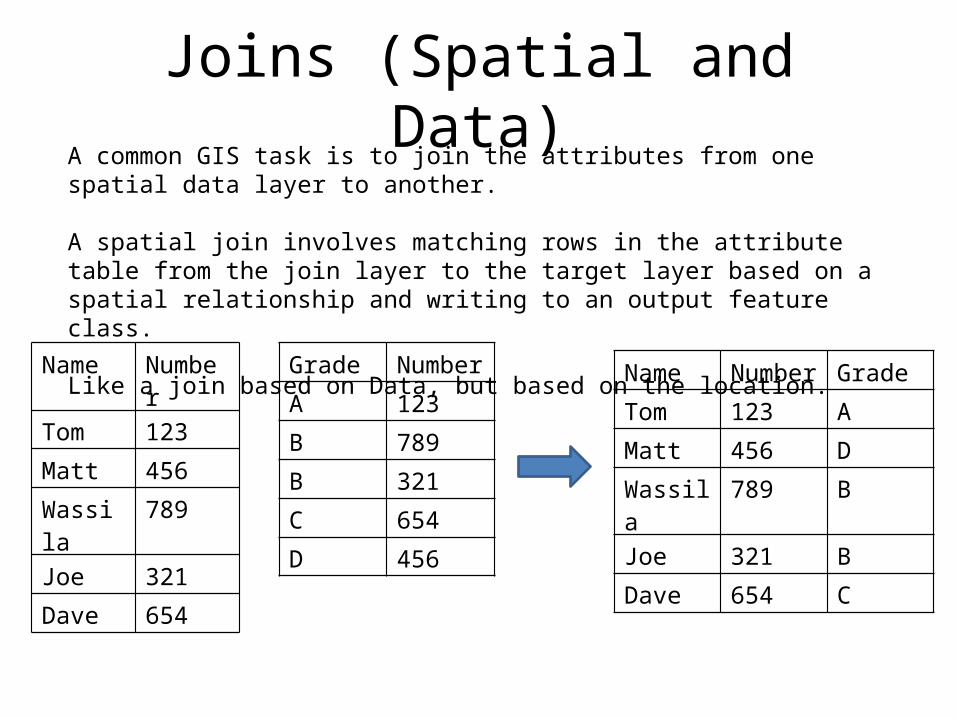
Joins (Spatial and Data)A common GIS task is to join the attributes from one spatial data layer to another.
A spatial join involves matching rows in the attribute table from the join layer to the target layer based on a spatial relationship and writing to an output feature class.
Like a join based on Data, but based on the location.
Name Number
Tom 123
Matt 456
Wassila 789
Joe 321
Dave 654
Grade Number
A 123
B 789
B 321
C 654
D 456
Name Number Grade
Tom 123 A
Matt 456 D
Wassila 789 B
Joe 321 B
Dave 654 C

Joins (Spatial and Data)GIS data has an inherent spatial attribute, so it can join on that.Coincident points, lines, or polygons inherent the attributes from things that are spatially coincident.
Point Value
1 0.9
2 1.5
3 0.5
4 1.5
5 1.1
Polygon Hazard
1 TSTM
12
345
Point Value Hazard
1 0.9 NULL
2 1.5 TSTM
3 0.5 TSTM
4 1.5 TSTM
5 1.1 NULL
Coding for Geoprocessing
• QGIS– Wasn’t able to get QGIS to work.
• ArcGIS is more familiar to me, and has scripting.– Will demo with that.
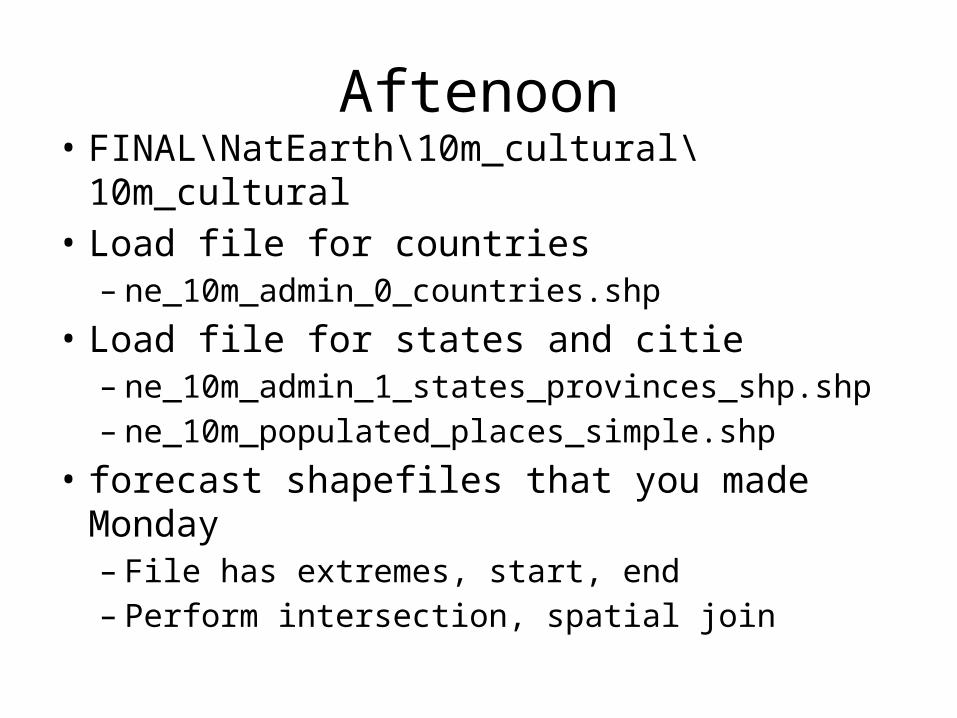
Aftenoon• FINAL\NatEarth\10m_cultural\10m_cultural• Load file for countries– ne_10m_admin_0_countries.shp
• Load file for states and citie– ne_10m_admin_1_states_provinces_shp.shp– ne_10m_populated_places_simple.shp
• forecast shapefiles that you made Monday– File has extremes, start, end– Perform intersection, spatial join

Country Climate Outlook• Load shapefile of country– Extract your own country if you wish
• Load shapefile of states• Create a new shapefile to contain your climate
outlook• Draw a climate outlook– Above Average Precipitation– Below Average Precipitation– Above Average Temperatures– Below Average Temperatures