Embed Size (px)
Citation preview
More Durable, Cost-Effective, & Sustainable Pavement
John Harvey, PEUniversity of California Pavement Research Center
City and County Pavement Improvement CenterUC Davis
Alameda CountyGreen Purchasing Roundtable10 December, 2019
www.ucprc.ucdavis.edu/ccpic
• Sponsored by League of California Cities, County Engineers of California, and California State Association of Counties
• Chartered 28 September 2018
CCPIC Mission and Vision
• Mission– CCPIC works with local governments to increase
pavement technical capability through timely, relevant, and practical support, training, outreach and research
• Vision– Making local government-managed pavement last
longer, cost less, and be more sustainable
CCPIC Organization
• University of California Partners – University of California Pavement Research Center (lead), administered and funded
by ITS Davis– UC Berkeley ITS Tech Transfer, administered and funded by ITS Berkeley
• California State University Partners – CSU-Chico, CSU-Long Beach, Cal Poly San Luis Obispo– Funding partner: Mineta Transportation Institute, San Jose State University
CCPIC Organization
• Governance:– Chartered by League of California Cities, California State Association of
Counties, County Engineers Association of California, also provide staff support
– Governance Board consisting of 6 city and 6 county transportation professionals
• Current Funding– Seed funding for CCPIC set up and initial activities from SB1 funding
through the ITS at UC Davis and UC Berkeley, and Mineta Transportation Institute at San Jose State University
CCPIC Scope
• Provide technology transfer through on-line and in-person training, peer-to-peer exchanges, and dissemination of research results and best practices in a variety of formats for a variety of audiences (e.g., policy makers, engineers, planners, community members)
• Develop technical briefs, guidance, sample specifications, tools, and other resources based on the latest scientific findings and tested engineering solutions for local government pavement engineers, managers, and the consultants who support them
CCPIC Scope
• Establish a pavement engineering and management certificate program for working professionals through UC Berkeley ITS Tech Transfer
• Serve as a resource center for up-to-date information, regional in-person training, pilot study documentation, and forensic investigations
• Conduct research and development that produces technical solutions that respond to the pavement needs of both urban and rural local governments
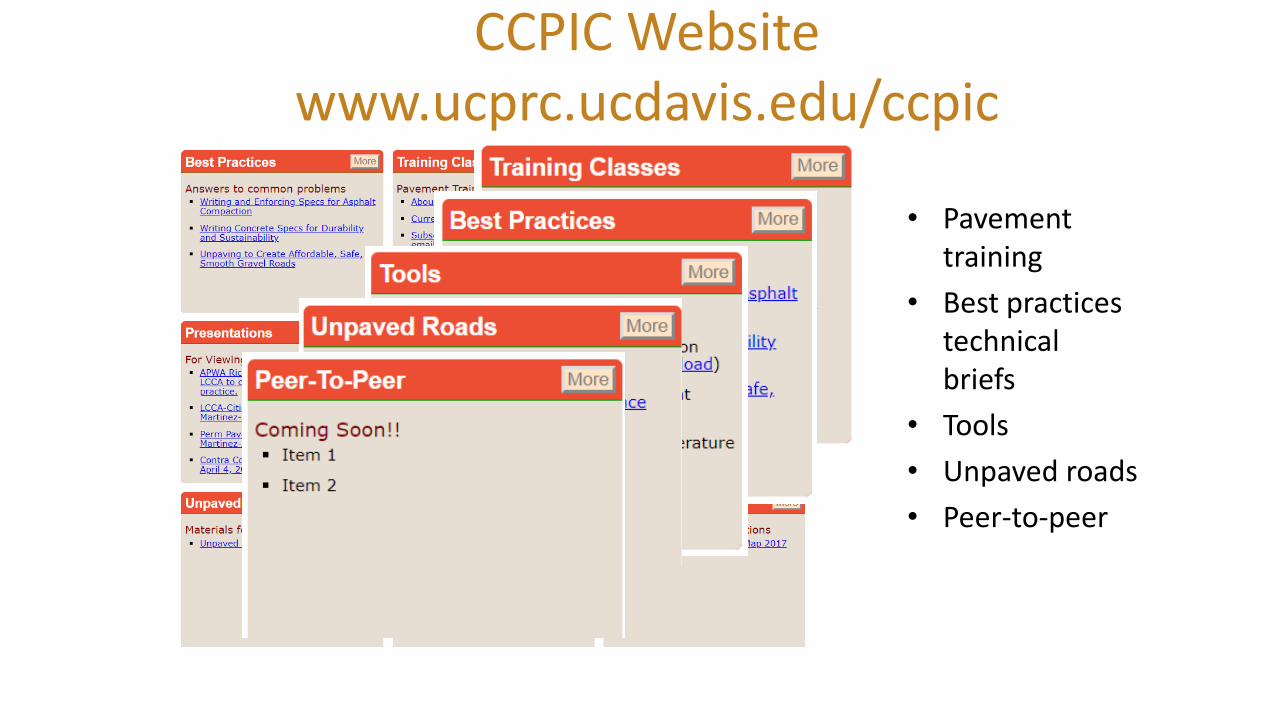
CCPIC Websitewww.ucprc.ucdavis.edu/ccpic
• Pavement training
• Best practices technical briefs
• Tools• Unpaved roads• Peer-to-peer

How to get involved in CCPIC activities?
• Get training• Get your organization to take training• Host in-person training classes• Read the tech briefs and see if your agency can make improvements
– See the draft specification language– We can support you
• Get involved with governance board• Start a peer-to-peer chat group• Take a look at the tools on the website
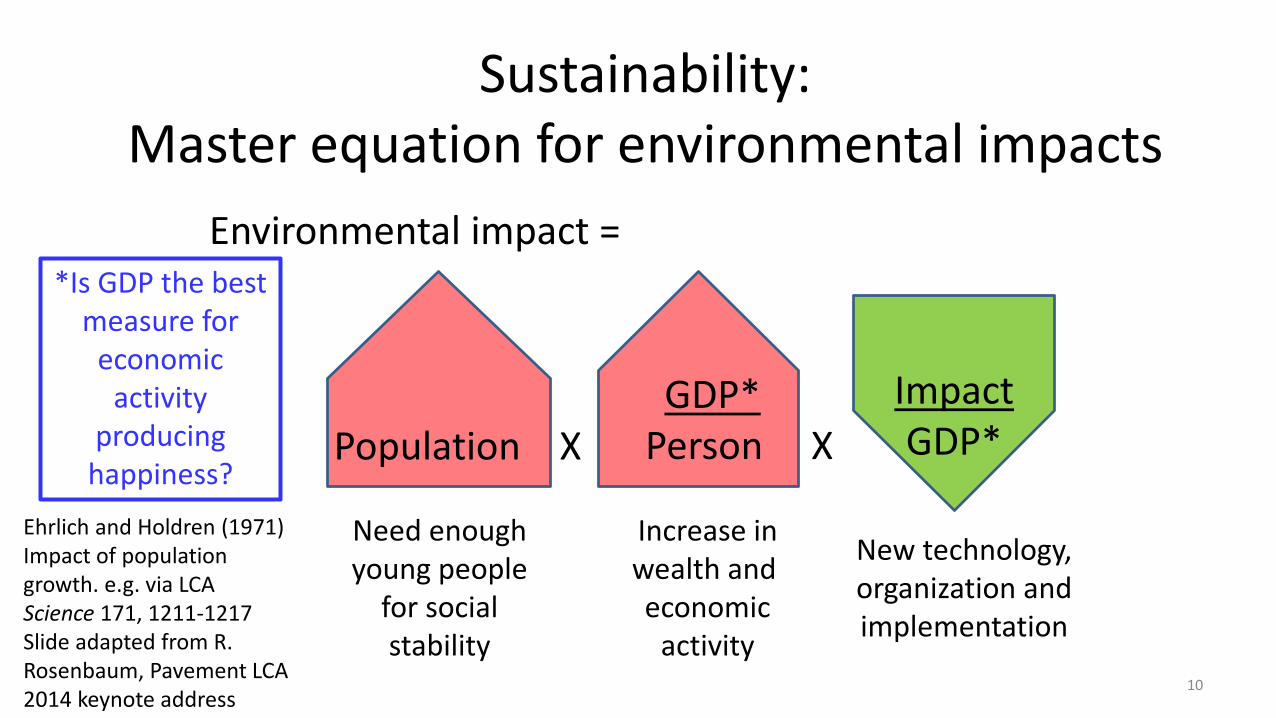
Environmental impact =
Sustainability:Master equation for environmental impacts
10
Ehrlich and Holdren (1971) Impact of population growth. e.g. via LCAScience 171, 1211-1217Slide adapted from R. Rosenbaum, Pavement LCA 2014 keynote address
Population XGDP*
Person XImpactGDP*
Increase inwealth and economic
activity
New technology, organization and implementation
Need enough young people
for social stability
*Is GDP the best measure for
economic activity
producing happiness?
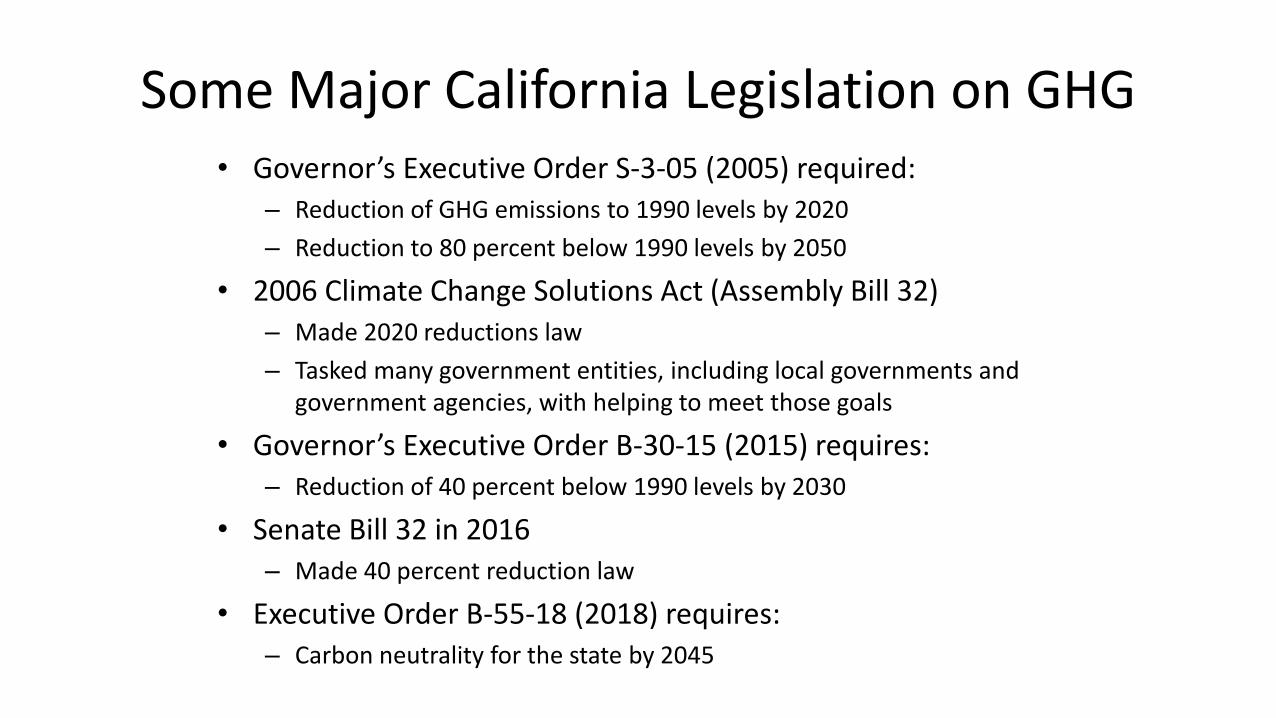
Some Major California Legislation on GHG• Governor’s Executive Order S-3-05 (2005) required:
– Reduction of GHG emissions to 1990 levels by 2020– Reduction to 80 percent below 1990 levels by 2050
• 2006 Climate Change Solutions Act (Assembly Bill 32)– Made 2020 reductions law– Tasked many government entities, including local governments and
government agencies, with helping to meet those goals
• Governor’s Executive Order B-30-15 (2015) requires:– Reduction of 40 percent below 1990 levels by 2030
• Senate Bill 32 in 2016– Made 40 percent reduction law
• Executive Order B-55-18 (2018) requires:– Carbon neutrality for the state by 2045
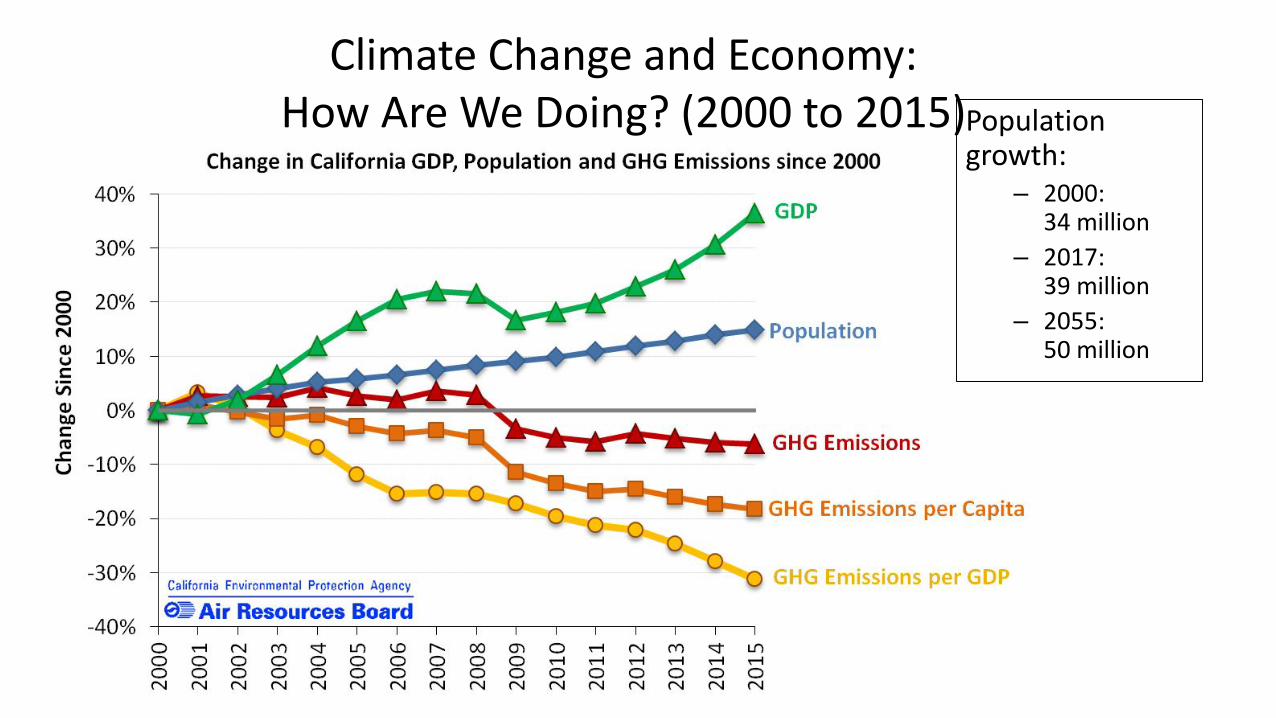
Climate Change and Economy: How Are We Doing? (2000 to 2015)Population
growth:– 2000:
34 million– 2017:
39 million – 2055:
50 million
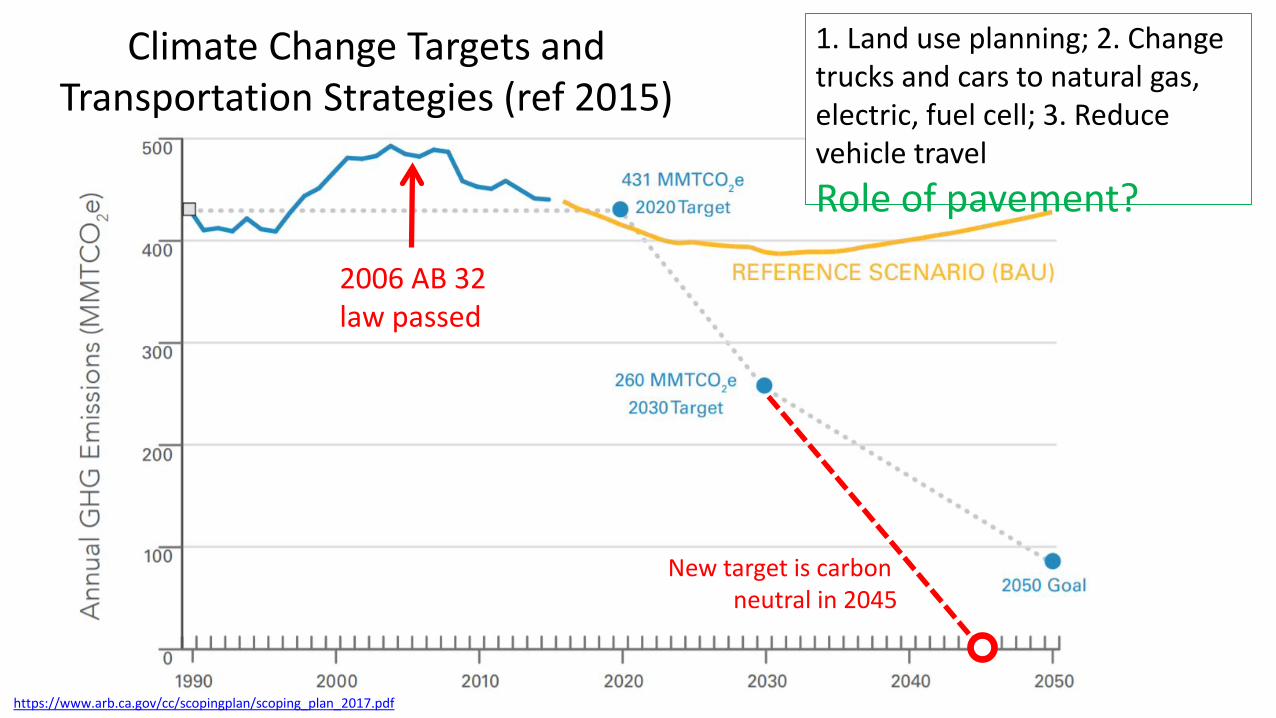
Climate Change Targets and Transportation Strategies (ref 2015)
1. Land use planning; 2. Change trucks and cars to natural gas, electric, fuel cell; 3. Reduce vehicle travelRole of pavement?
https://www.arb.ca.gov/cc/scopingplan/scoping_plan_2017.pdf
2006 AB 32 law passed
New target is carbon neutral in 2045
14
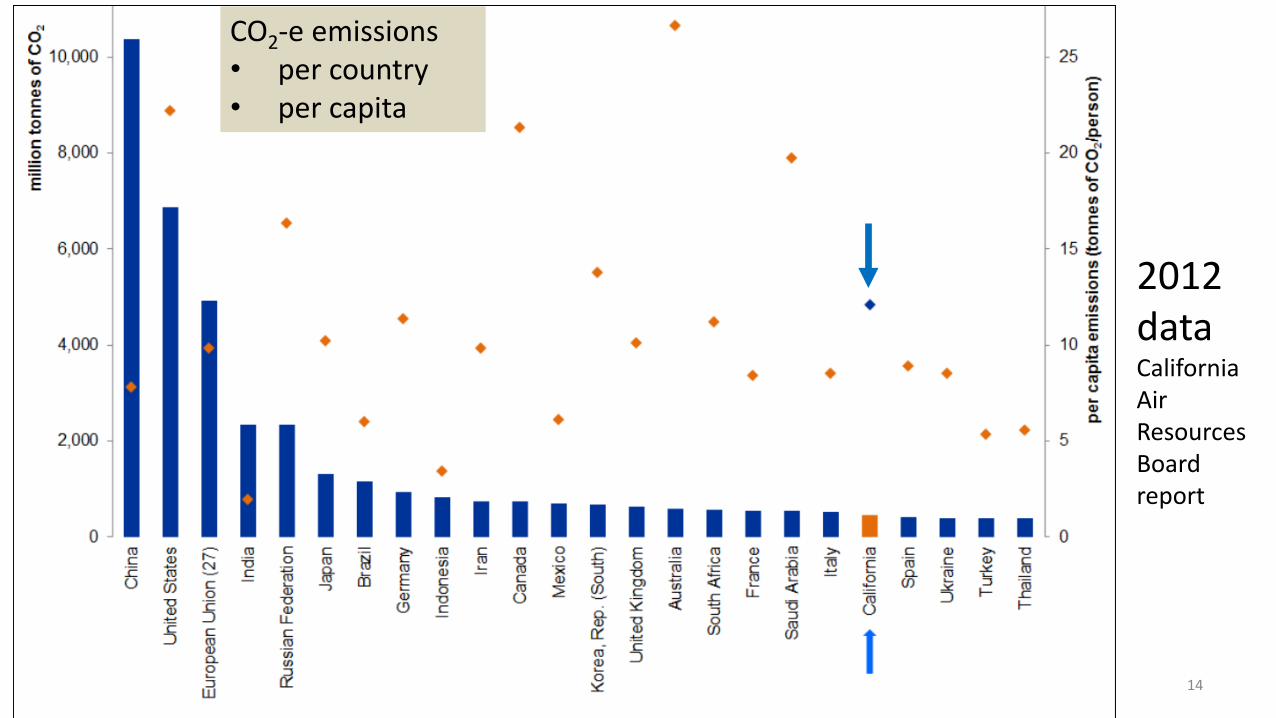
2012 data California Air Resources Board report
CO2-e emissions • per country• per capita
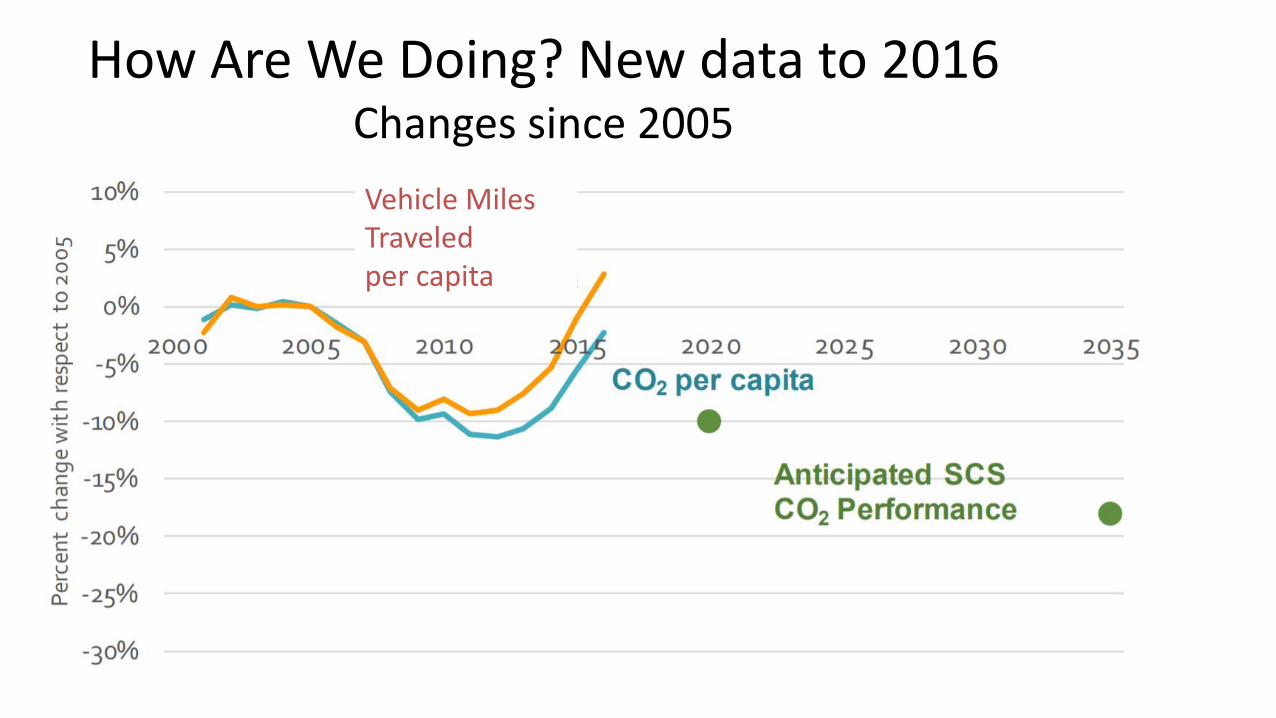
How Are We Doing? New data to 2016Changes since 2005Vehicle Miles Traveledper capita
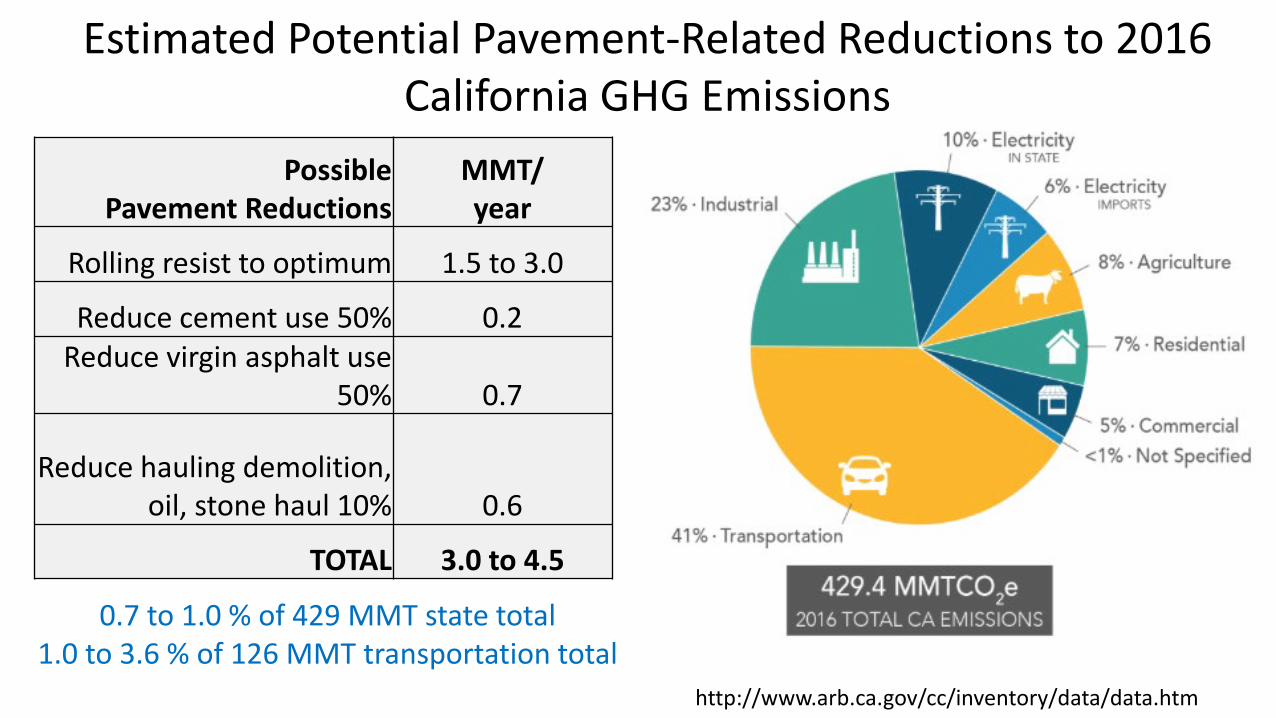
Estimated Potential Pavement-Related Reductions to 2016 California GHG Emissions
http://www.arb.ca.gov/cc/inventory/data/data.htm
PossiblePavement Reductions
MMT/year
Rolling resist to optimum 1.5 to 3.0
Reduce cement use 50% 0.2Reduce virgin asphalt use
50% 0.7
Reduce hauling demolition, oil, stone haul 10% 0.6
TOTAL 3.0 to 4.5
0.7 to 1.0 % of 429 MMT state total1.0 to 3.6 % of 126 MMT transportation total
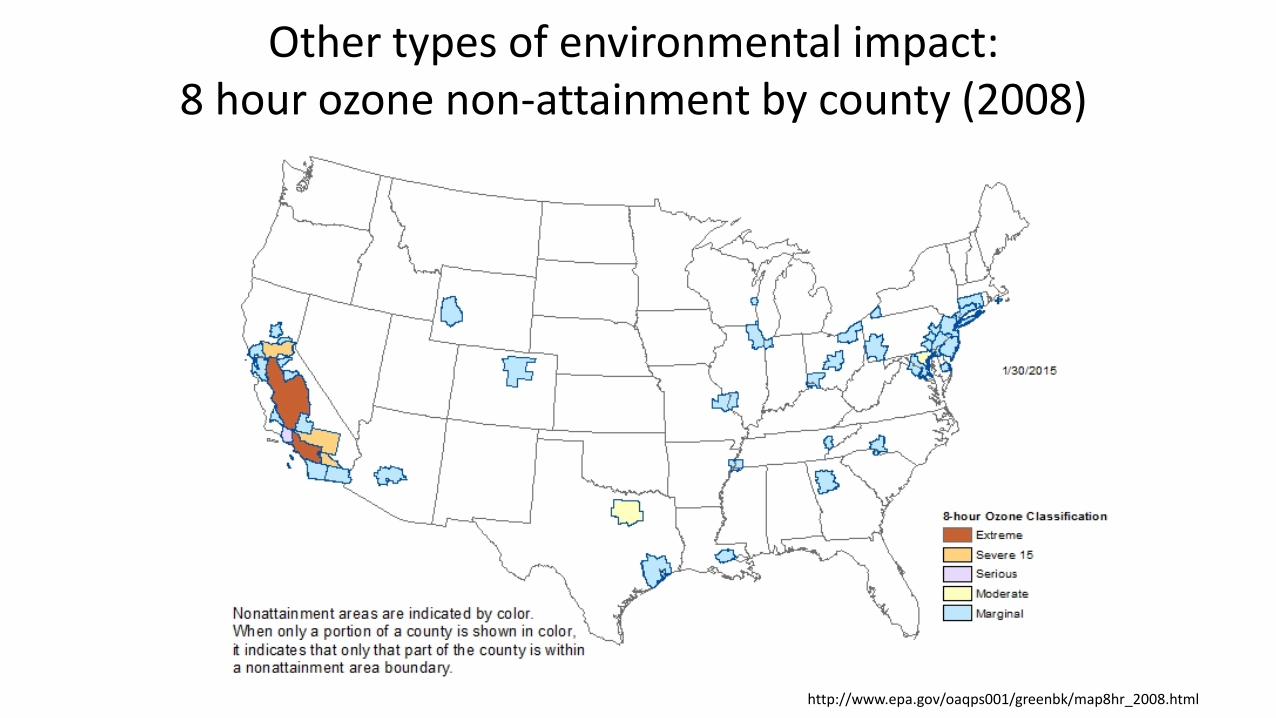
Other types of environmental impact:8 hour ozone non-attainment by county (2008)
http://www.epa.gov/oaqps001/greenbk/map8hr_2008.html
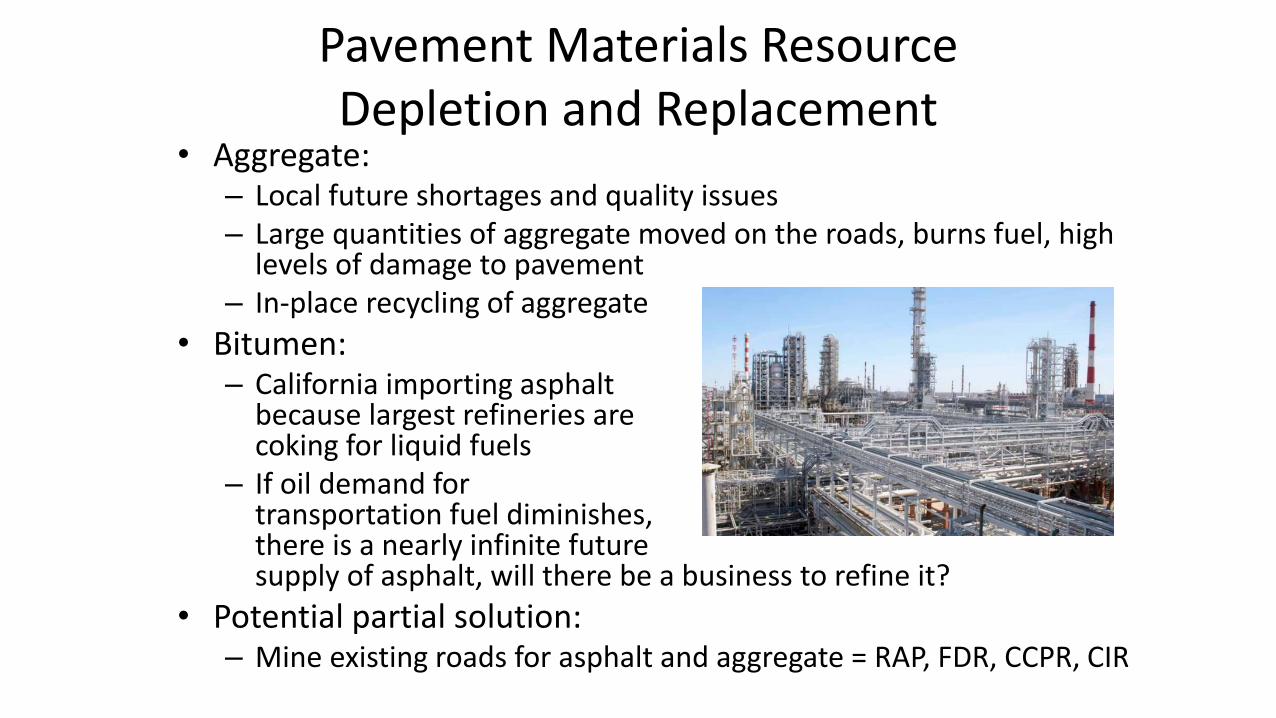
Pavement Materials Resource Depletion and Replacement
• Aggregate:– Local future shortages and quality issues– Large quantities of aggregate moved on the roads, burns fuel, high
levels of damage to pavement– In-place recycling of aggregate
• Bitumen:– California importing asphalt
because largest refineries are coking for liquid fuels
– If oil demand for transportation fuel diminishes, there is a nearly infinite future supply of asphalt, will there be a business to refine it?
• Potential partial solution:– Mine existing roads for asphalt and aggregate = RAP, FDR, CCPR, CIR
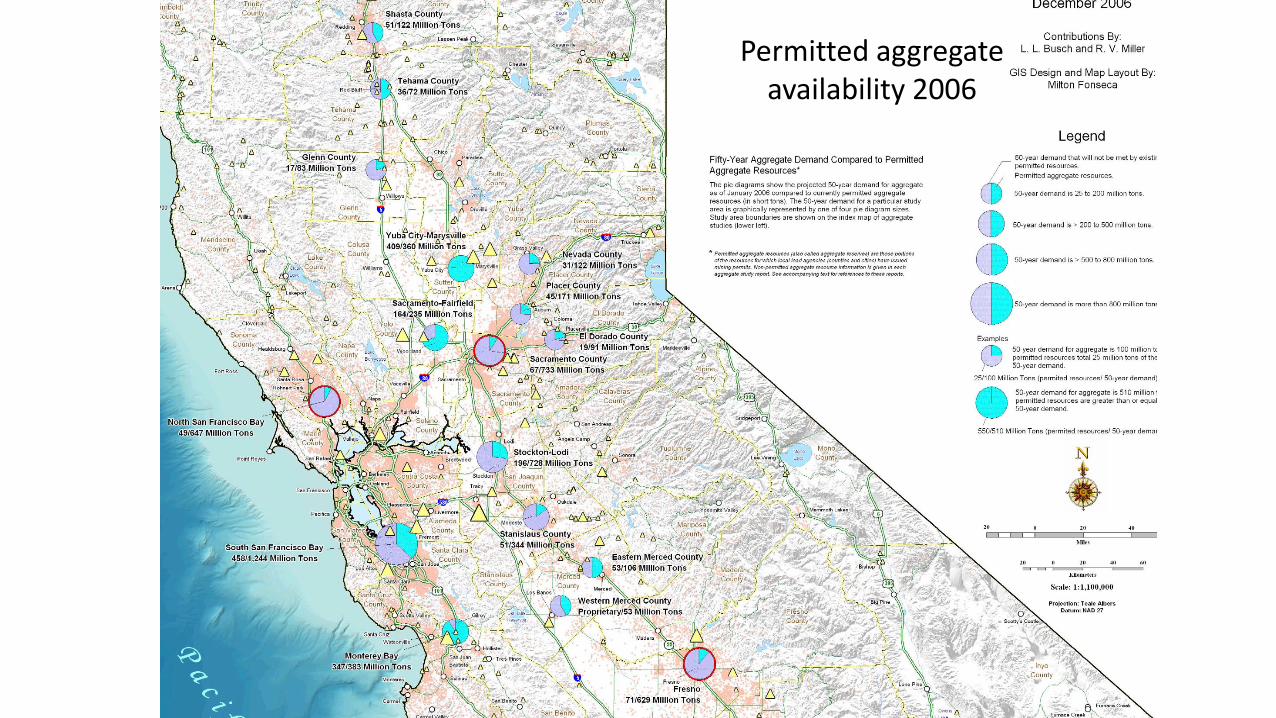
Permitted aggregate availability 2006
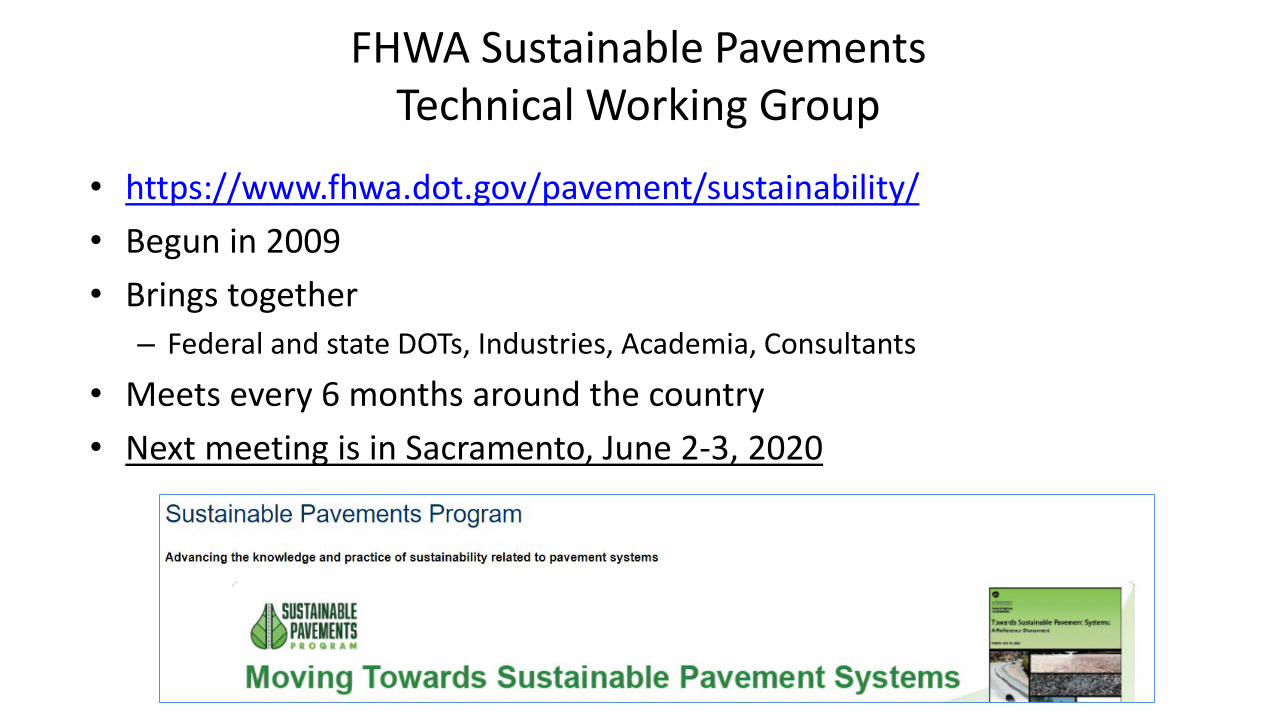
• https://www.fhwa.dot.gov/pavement/sustainability/• Begun in 2009• Brings together
– Federal and state DOTs, Industries, Academia, Consultants
• Meets every 6 months around the country• Next meeting is in Sacramento, June 2-3, 2020
FHWA Sustainable Pavements Technical Working Group
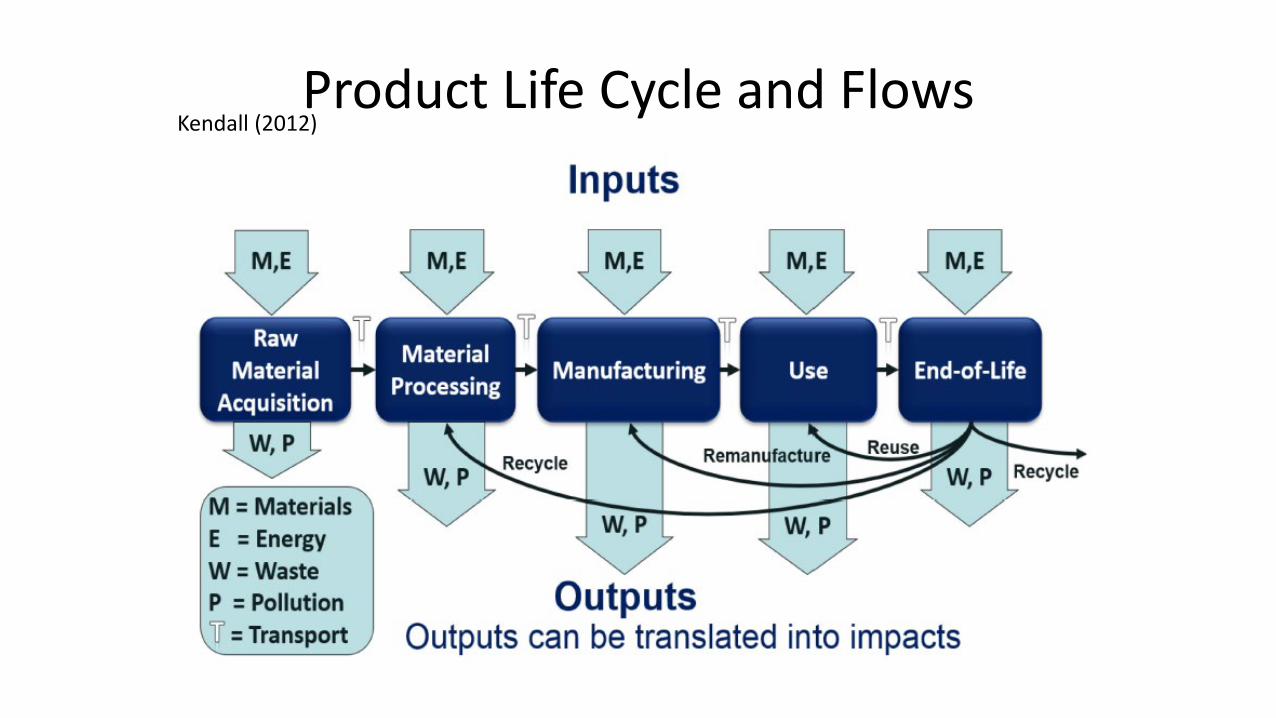
Product Life Cycle and FlowsKendall (2012)
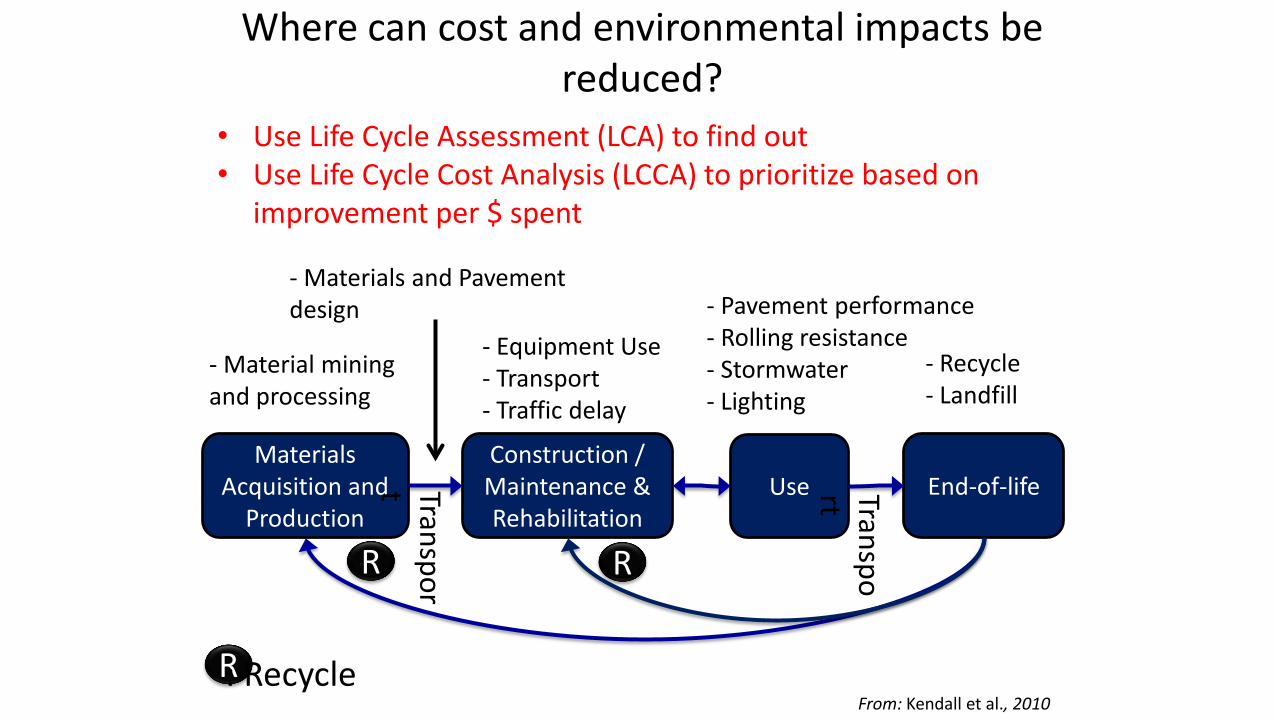
- Pavement performance- Rolling resistance- Stormwater- Lighting
Where can cost and environmental impacts be reduced?
Materials Acquisition and
Production
Construction / Maintenance & Rehabilitation
Use End-of-life
- Material mining and processing
Transport
- Equipment Use- Transport- Traffic delay
R R
- Recycle- Landfill
From: Kendall et al., 2010
R: Recycle
Transport
• Use Life Cycle Assessment (LCA) to find out • Use Life Cycle Cost Analysis (LCCA) to prioritize based on
improvement per $ spent
- Materials and Pavement design
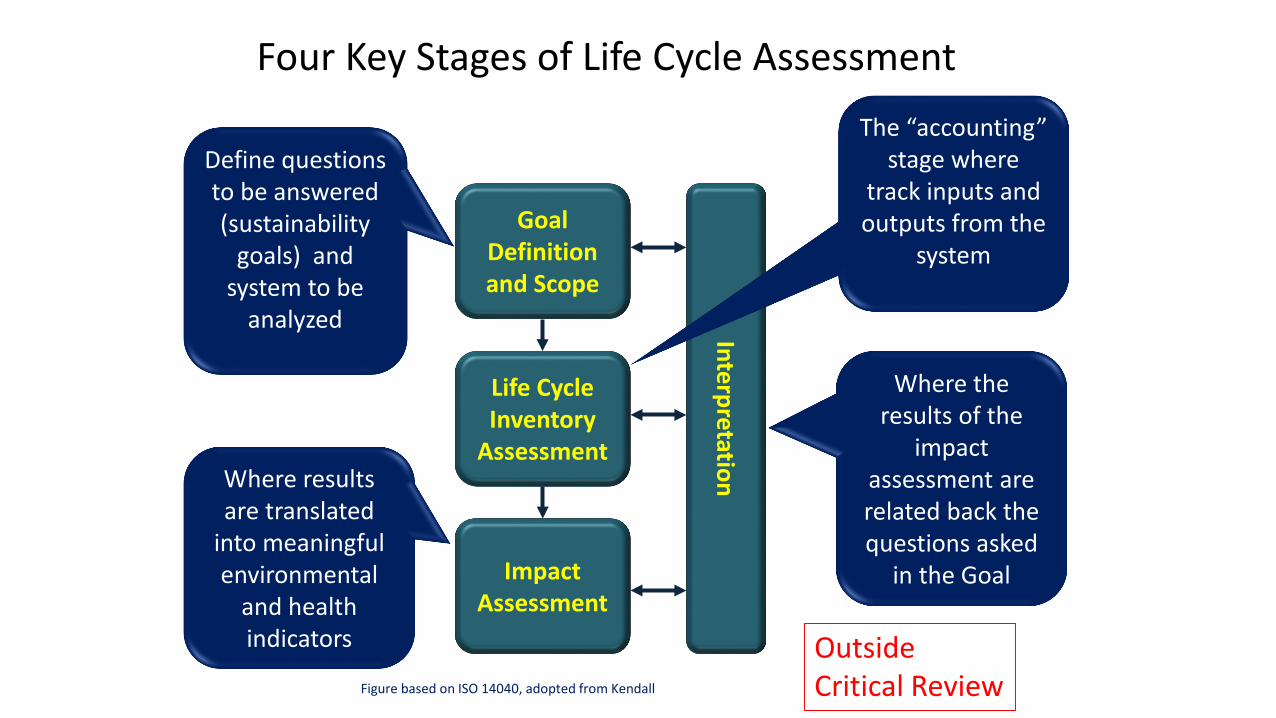
Four Key Stages of Life Cycle Assessment
Interpretation
Goal Definition and Scope
Life Cycle Inventory
Assessment
Impact Assessment
Define questions to be answered (sustainability
goals) and system to be
analyzed
The “accounting” stage where
track inputs and outputs from the
system
Where results are translated
into meaningful environmental
and health indicators
Figure based on ISO 14040, adopted from Kendall
Where the results of the
impact assessment are related back the questions asked
in the Goal
Outside Critical Review
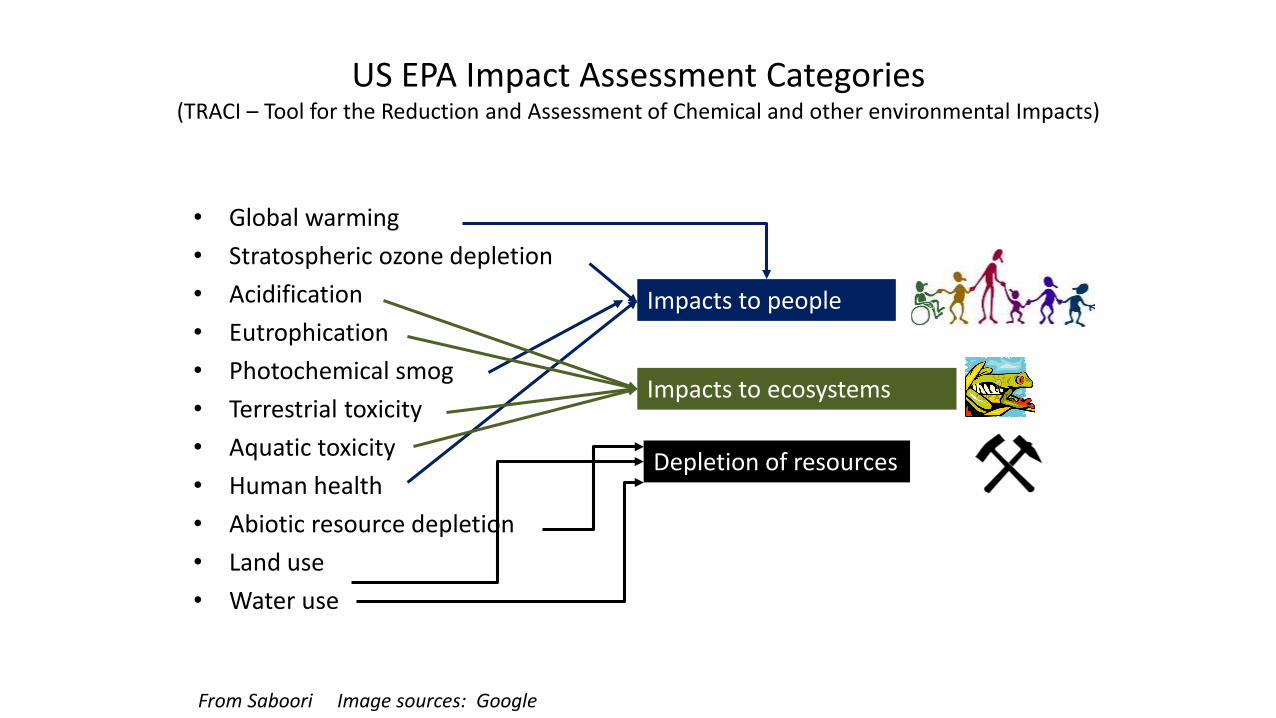
• Global warming• Stratospheric ozone depletion• Acidification• Eutrophication• Photochemical smog• Terrestrial toxicity• Aquatic toxicity• Human health• Abiotic resource depletion• Land use• Water use
US EPA Impact Assessment Categories (TRACI – Tool for the Reduction and Assessment of Chemical and other environmental Impacts)
Impacts to people
From Saboori Image sources: Google
Impacts to ecosystems
Depletion of resources
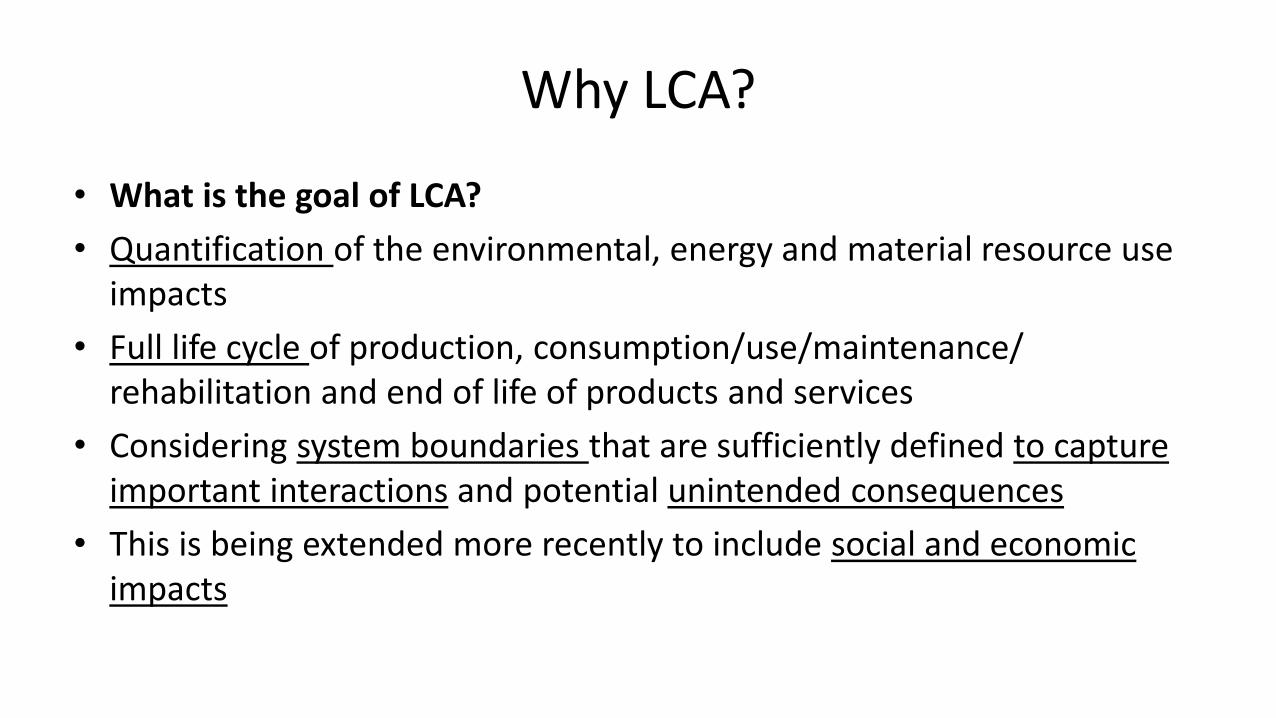
Why LCA?
• What is the goal of LCA?• Quantification of the environmental, energy and material resource use
impacts• Full life cycle of production, consumption/use/maintenance/
rehabilitation and end of life of products and services• Considering system boundaries that are sufficiently defined to capture
important interactions and potential unintended consequences• This is being extended more recently to include social and economic
impacts
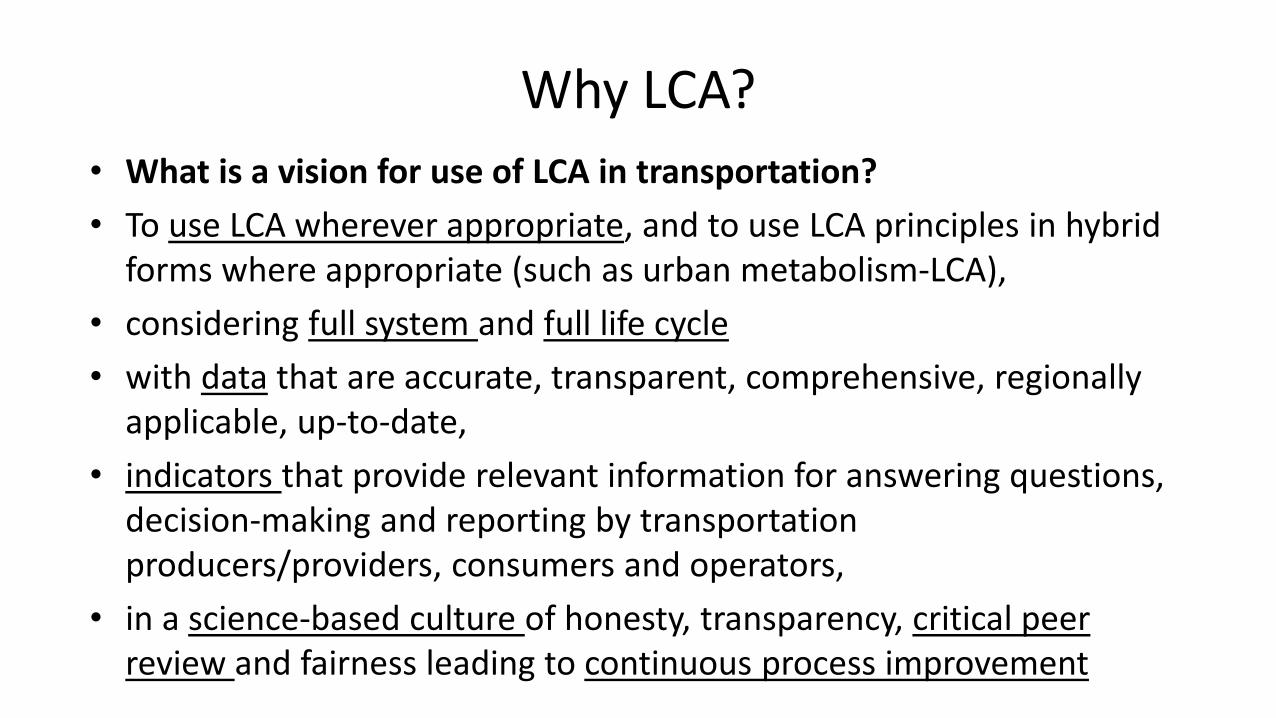
Why LCA?• What is a vision for use of LCA in transportation? • To use LCA wherever appropriate, and to use LCA principles in hybrid
forms where appropriate (such as urban metabolism-LCA), • considering full system and full life cycle• with data that are accurate, transparent, comprehensive, regionally
applicable, up-to-date, • indicators that provide relevant information for answering questions,
decision-making and reporting by transportation producers/providers, consumers and operators,
• in a science-based culture of honesty, transparency, critical peer review and fairness leading to continuous process improvement
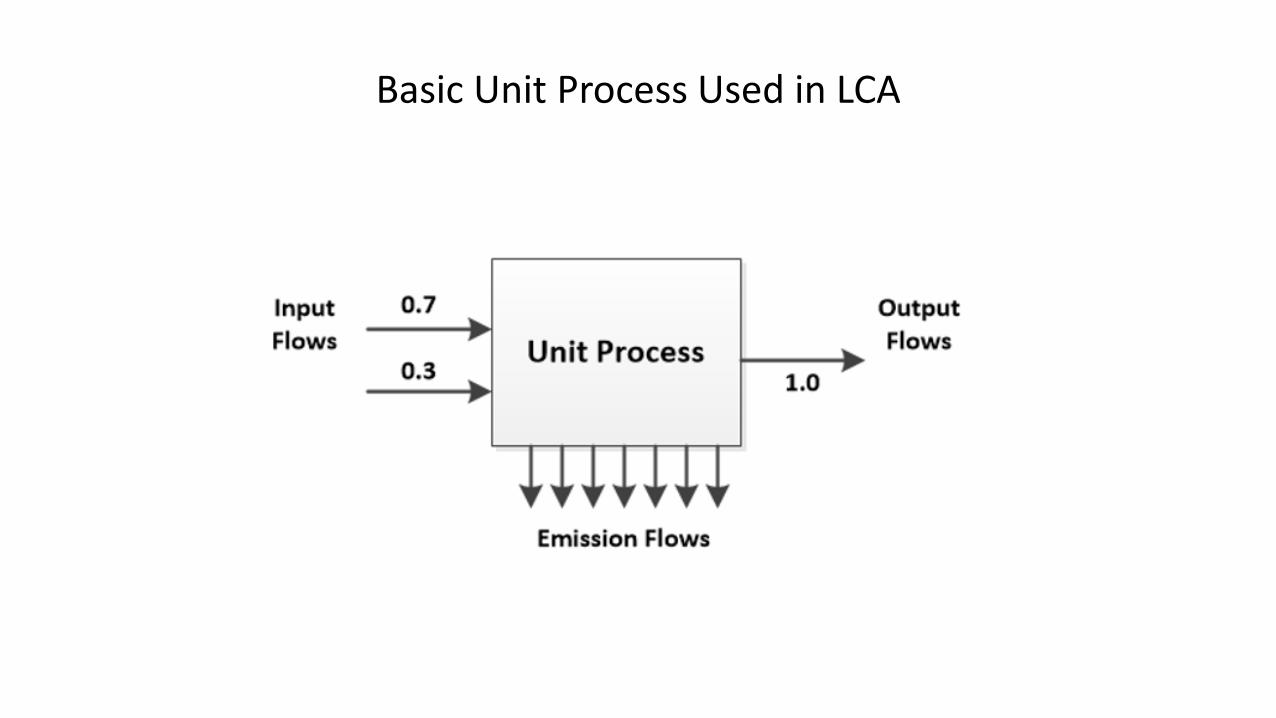
Basic Unit Process Used in LCA
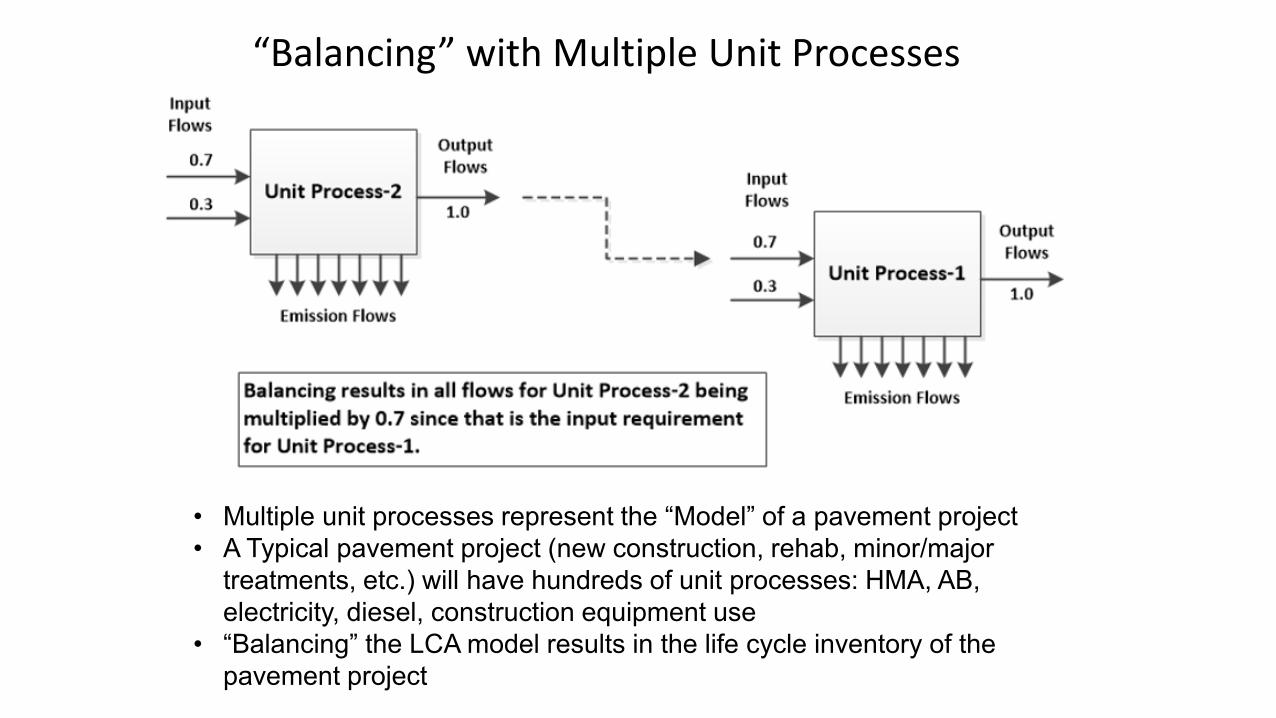
“Balancing” with Multiple Unit Processes
• Multiple unit processes represent the “Model” of a pavement project• A Typical pavement project (new construction, rehab, minor/major
treatments, etc.) will have hundreds of unit processes: HMA, AB, electricity, diesel, construction equipment use
• “Balancing” the LCA model results in the life cycle inventory of the pavement project
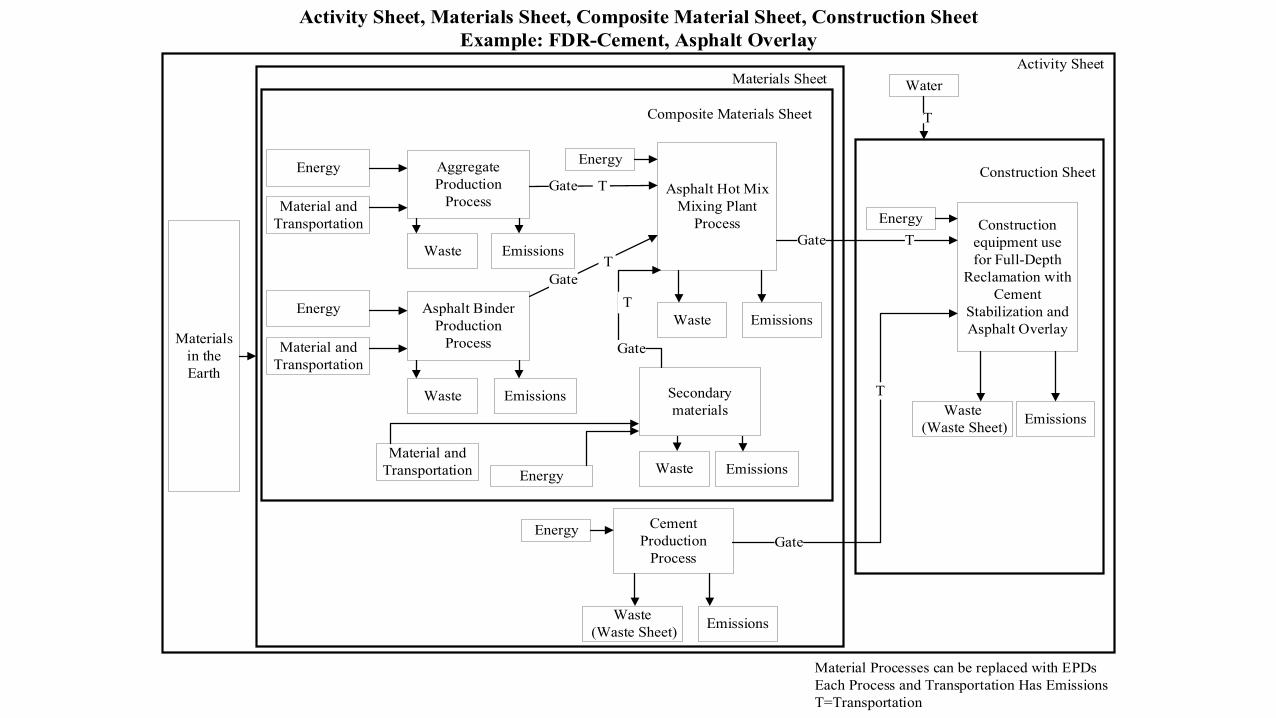
Asphalt Hot Mix Mixing Plant
Process
Waste Emissions
Cement Production
Process
Waste (Waste Sheet) Emissions
Material Processes can be replaced with EPDsEach Process and Transportation Has EmissionsT=Transportation
Gate
Construction equipment use for Full-Depth
Reclamation with Cement
Stabilization and Asphalt Overlay
Waste (Waste Sheet) Emissions
T
GateEnergy
Energy
EnergyAggregate Production
Process
Waste Emissions
Energy
Asphalt Binder Production
Process
Waste Emissions
Energy
Material and Transportation
Material and Transportation
Materials in the Earth
Gate
Gate
T
TT
Materials Sheet
Composite Materials Sheet
Activity Sheet, Materials Sheet, Composite Material Sheet, Construction SheetExample: FDR-Cement, Asphalt Overlay
Construction Sheet
Activity Sheet
Secondary materials
Gate
Waste Emissions
T
Water
T
EnergyMaterial and
Transportation
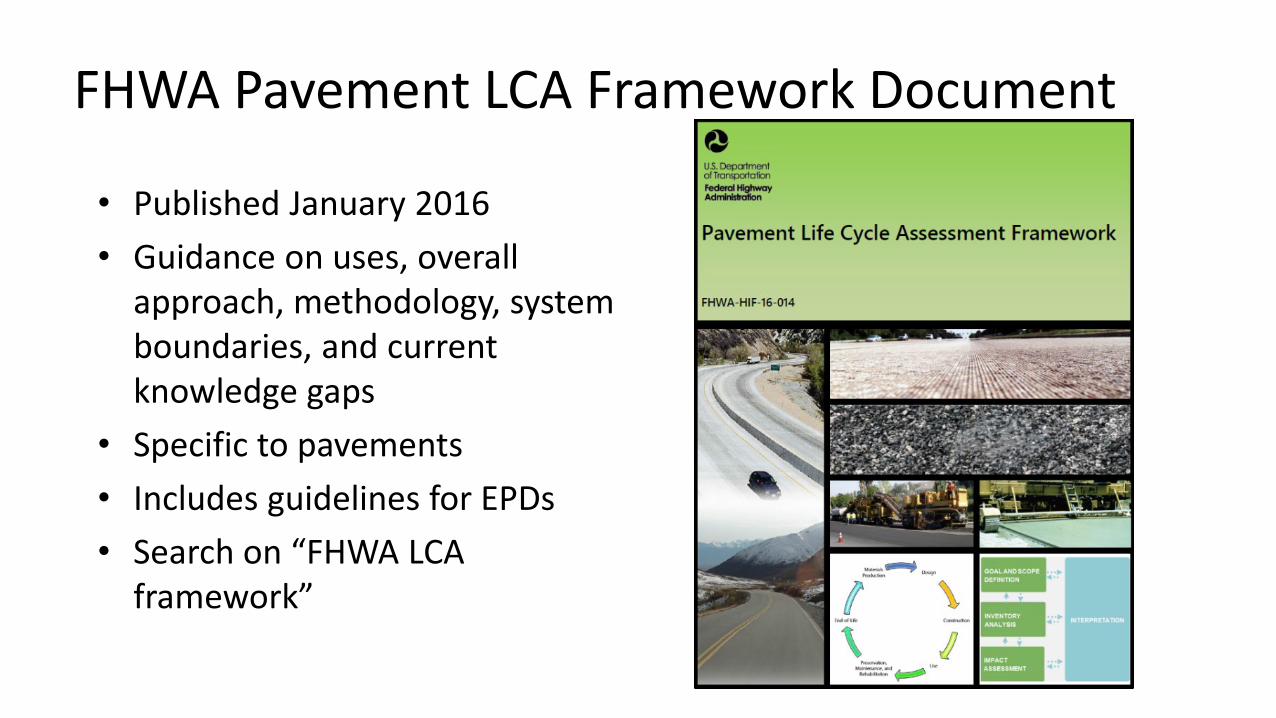
FHWA Pavement LCA Framework Document
• Published January 2016• Guidance on uses, overall
approach, methodology, system boundaries, and current knowledge gaps
• Specific to pavements• Includes guidelines for EPDs• Search on “FHWA LCA
framework”
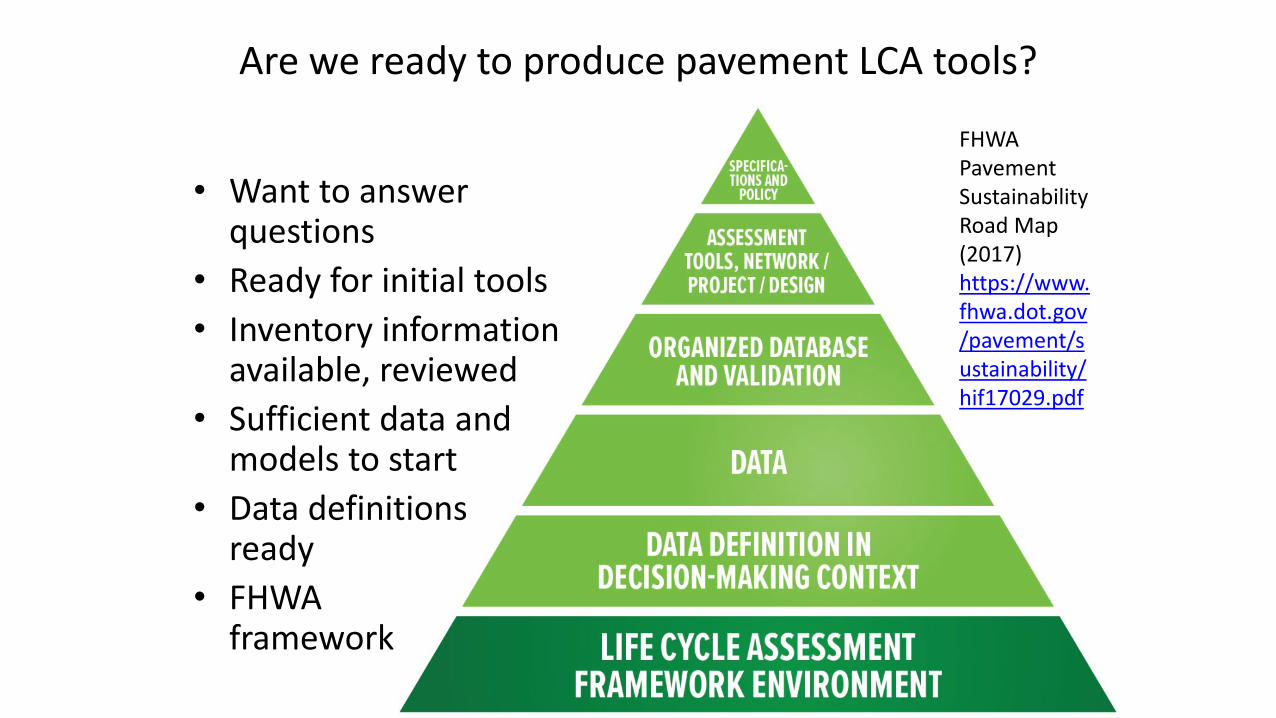
Are we ready to produce pavement LCA tools?
• Want to answer questions
• Ready for initial tools• Inventory information
available, reviewed• Sufficient data and
models to start• Data definitions
ready• FHWA
framework
FHWA Pavement Sustainability Road Map (2017)https://www.fhwa.dot.gov/pavement/sustainability/hif17029.pdf
Using LCA, soon• At state level
– LCA has been implemented in the Caltrans PMS– Used to assess GHG for different state-wide network master work plans– Used to evaluate new policies, specifications, designs
• Tools for everyday use by local agencies under development– UCPRC is working on both of these– eLCAP, developed for Caltrans
• Web based• Currently being updated and user interface converted to local government use
– Should be available in summer 2020
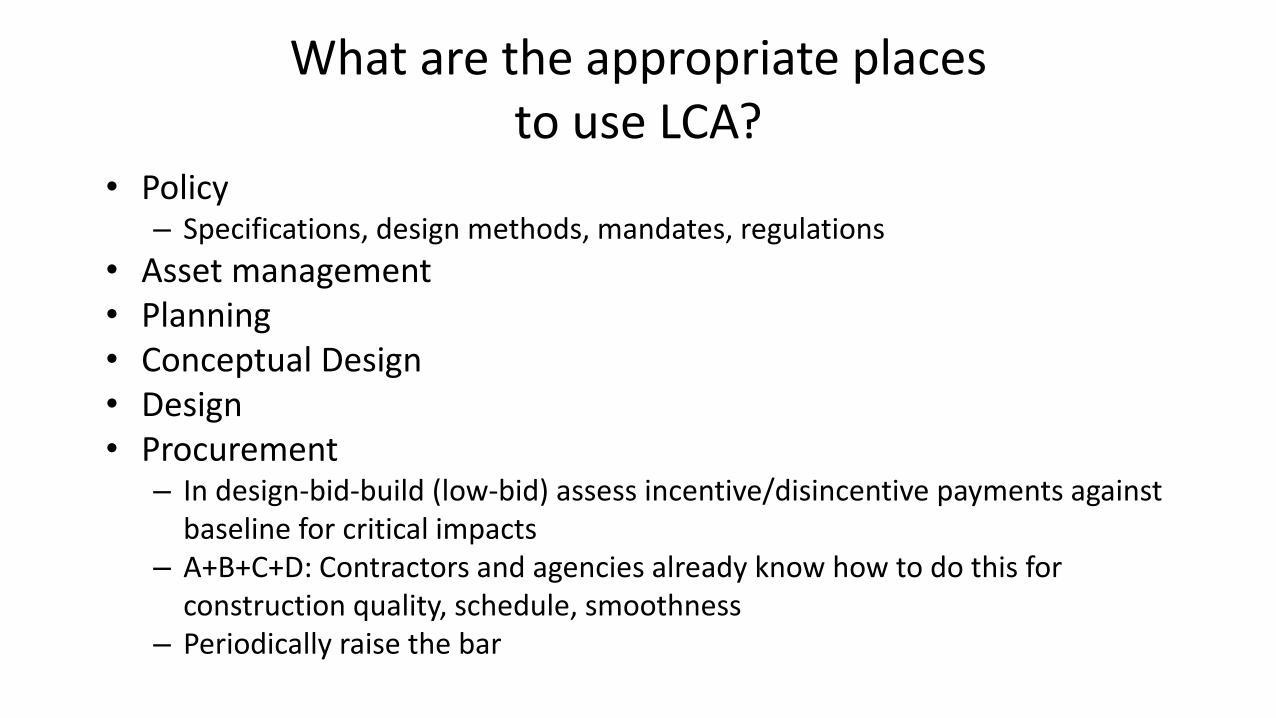
What are the appropriate places to use LCA?
• Policy– Specifications, design methods, mandates, regulations
• Asset management• Planning• Conceptual Design• Design• Procurement
– In design-bid-build (low-bid) assess incentive/disincentive payments against baseline for critical impacts
– A+B+C+D: Contractors and agencies already know how to do this for construction quality, schedule, smoothness
– Periodically raise the bar
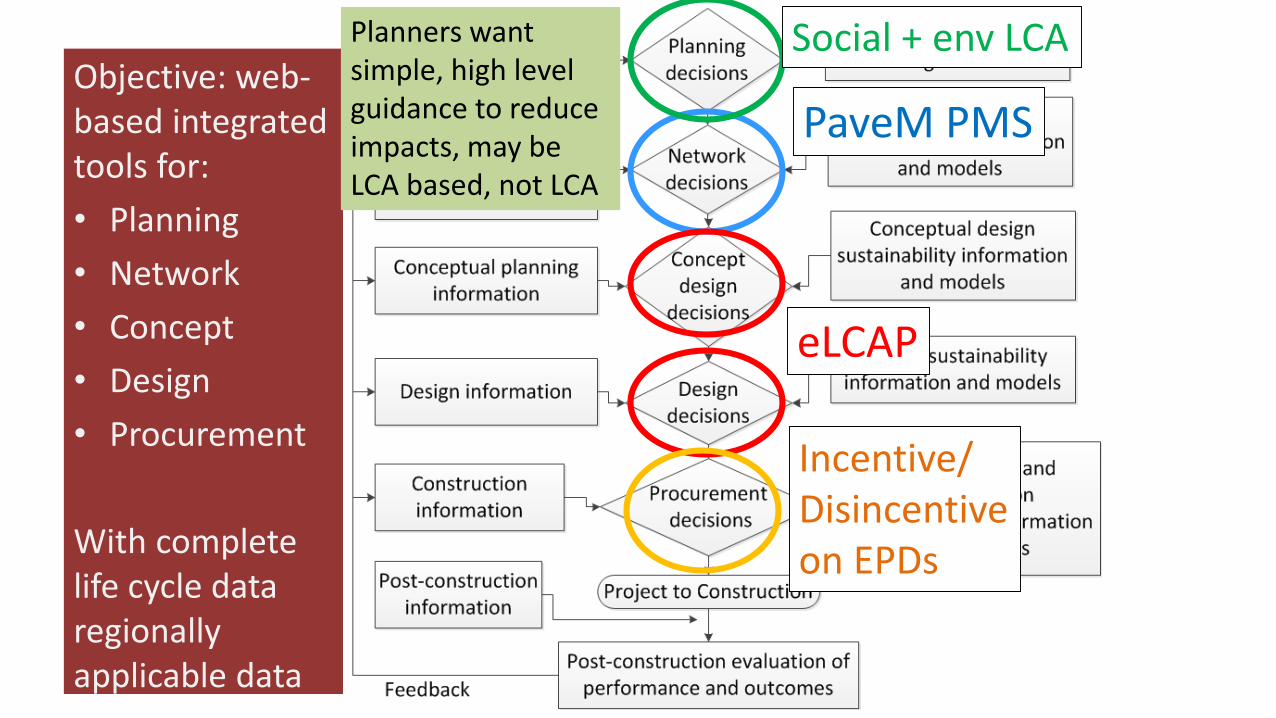
Objective: web-based integrated tools for:• Planning• Network• Concept• Design• Procurement
With complete life cycle data regionally applicable data
PaveM PMS
eLCAP
Social + env LCA
Incentive/Disincentiveon EPDs
Planners want simple, high level guidance to reduce impacts, may be LCA based, not LCA
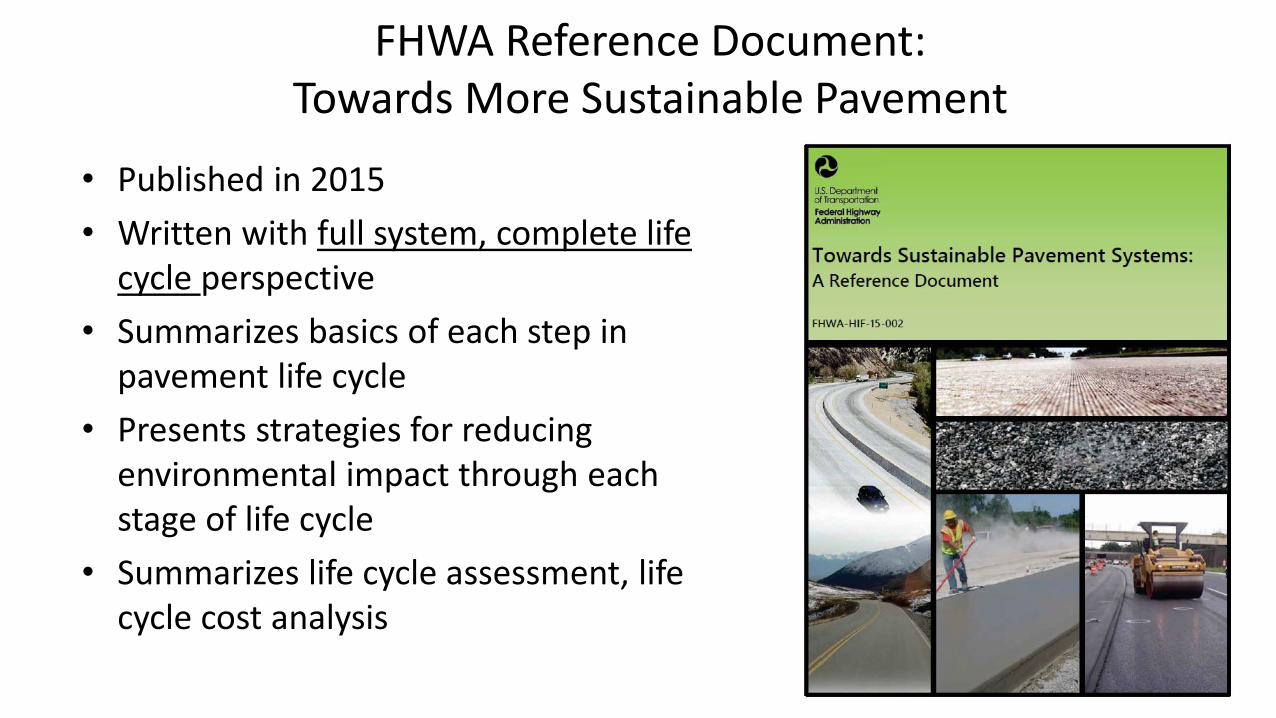
• Published in 2015• Written with full system, complete life
cycle perspective• Summarizes basics of each step in
pavement life cycle• Presents strategies for reducing
environmental impact through each stage of life cycle
• Summarizes life cycle assessment, life cycle cost analysis
FHWA Reference Document: Towards More Sustainable Pavement
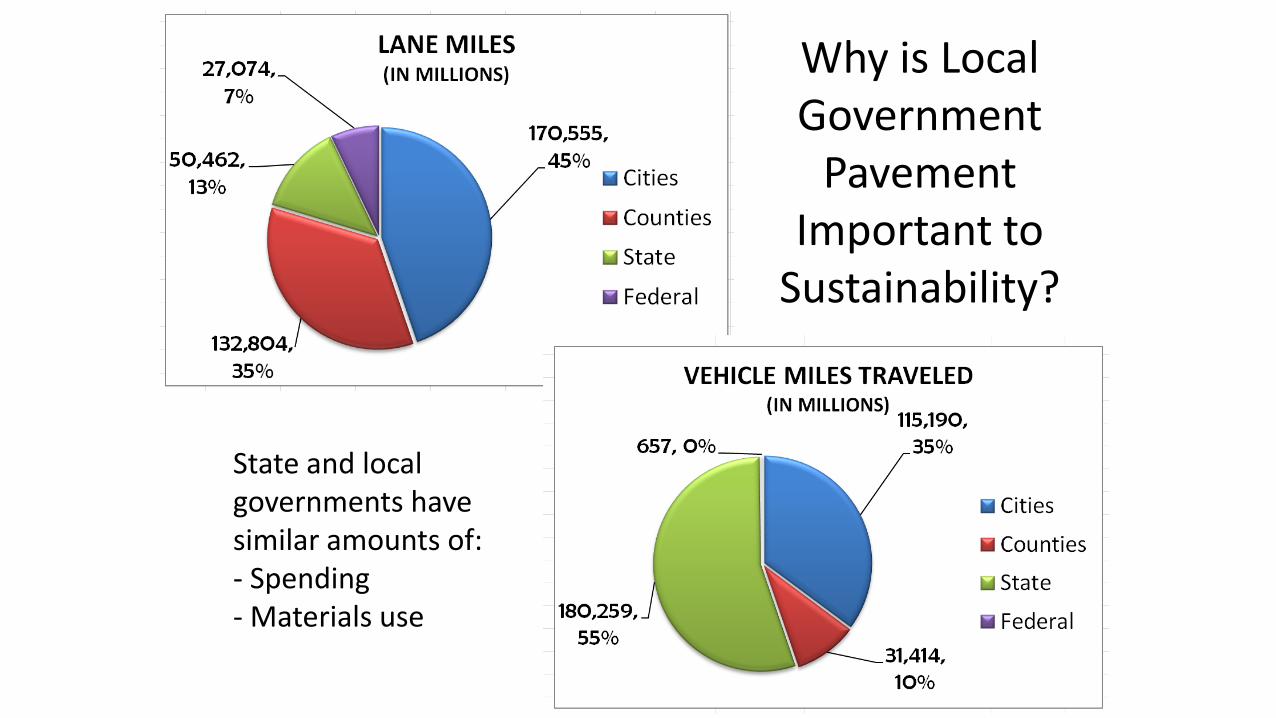
Why is Local Government
Pavement Important to
Sustainability?
State and local governments have similar amounts of:- Spending- Materials use
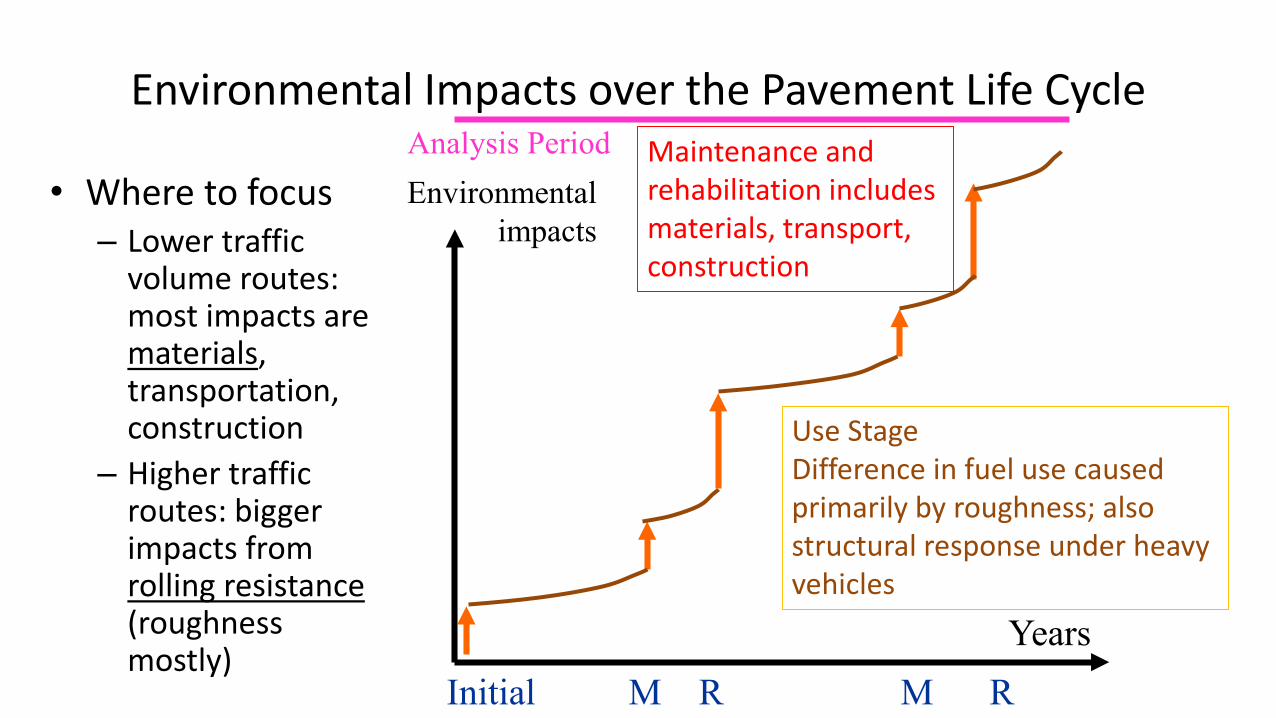
Environmental Impacts over the Pavement Life Cycle
• Where to focus– Lower traffic
volume routes: most impacts are materials, transportation, construction
– Higher traffic routes: bigger impacts from rolling resistance (roughness mostly)
Environmentalimpacts
YearsInitial M R M R
Analysis Period
Use StageDifference in fuel use caused primarily by roughness; also structural response under heavy vehicles
Maintenance and rehabilitation includes materials, transport, construction
0
20
40
60
80
100
0 5 10 15 20 25 30
g
Age(years)
y g
A, severeA, mildB, severeB, mildC, severeC, mild
0
20
40
60
80
100
0 5 10 15 20 25 30
Age(years)
y g
A, severeA, mildB, severeB, mildC, severeC, mild
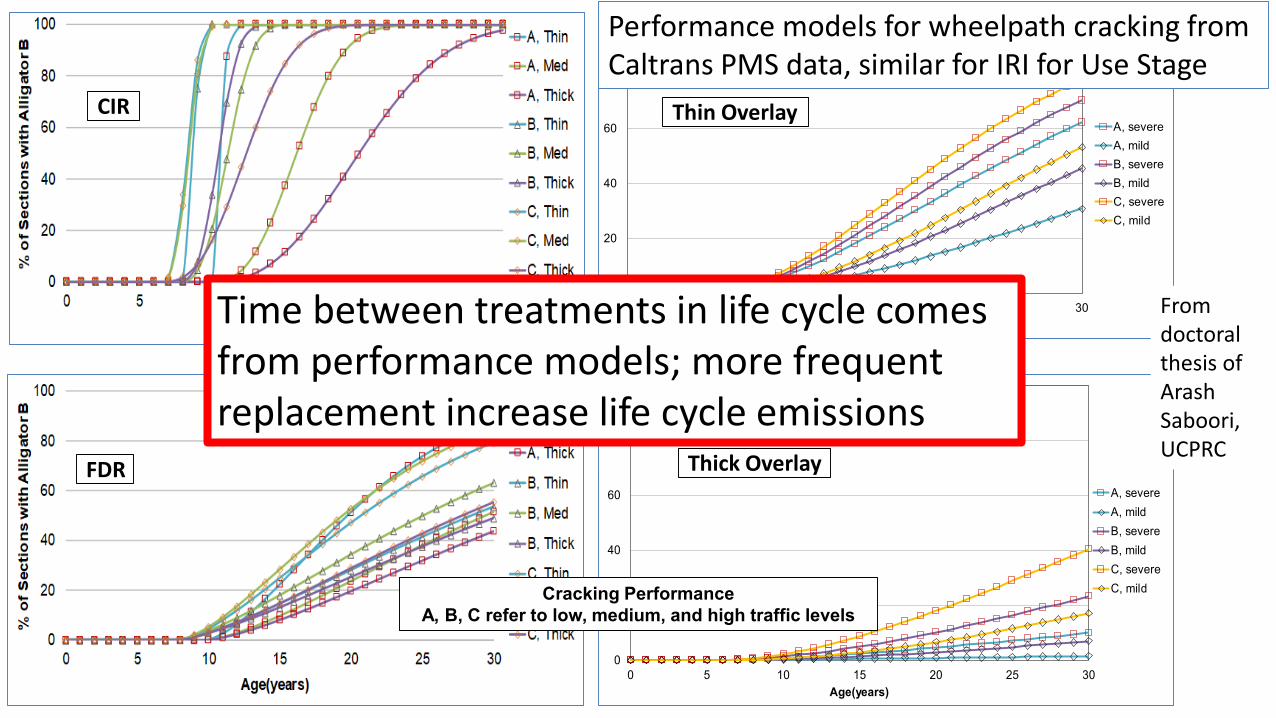
CIR
FDR Thick Overlay
Thin Overlay
Cracking PerformanceA, B, C refer to low, medium, and high traffic levels
From doctoralthesis of ArashSaboori, UCPRC
Performance models for wheelpath cracking from Caltrans PMS data, similar for IRI for Use Stage
Time between treatments in life cycle comes from performance models; more frequent replacement increase life cycle emissions
6.6E
+31.
4E+4
2.1E
+44.
2E+4
3.6E
+41.
0E+5
8.7E
+47.
5E+4
1.1E
+51.
5E+5
3.5E
+4 4.6E
+44.
8E+2
2.8E
+36.
2E+2
3.3E
+36.
6E+3
8.0E
+37.
8E+3
7.2E
+37.
8E+3
8.3E
+38.
3E+3
1.1E
+43.
5E+3
4.5E
+33.
7E+3
4.6E
+35.
4E+3
5.4E
+35.
4E+3
5.4E
+35.
4E+3
5.4E
+33.
4E+3
2.1E
+3
Case
1
Case
3
Case
5
Case
7
Case
9
Case
11
Case
1
Case
3
Case
5
Case
7
Case
9
Case
11
Case
1
Case
3
Case
5
Case
7
Case
9
Case
11
Material Transport Construction
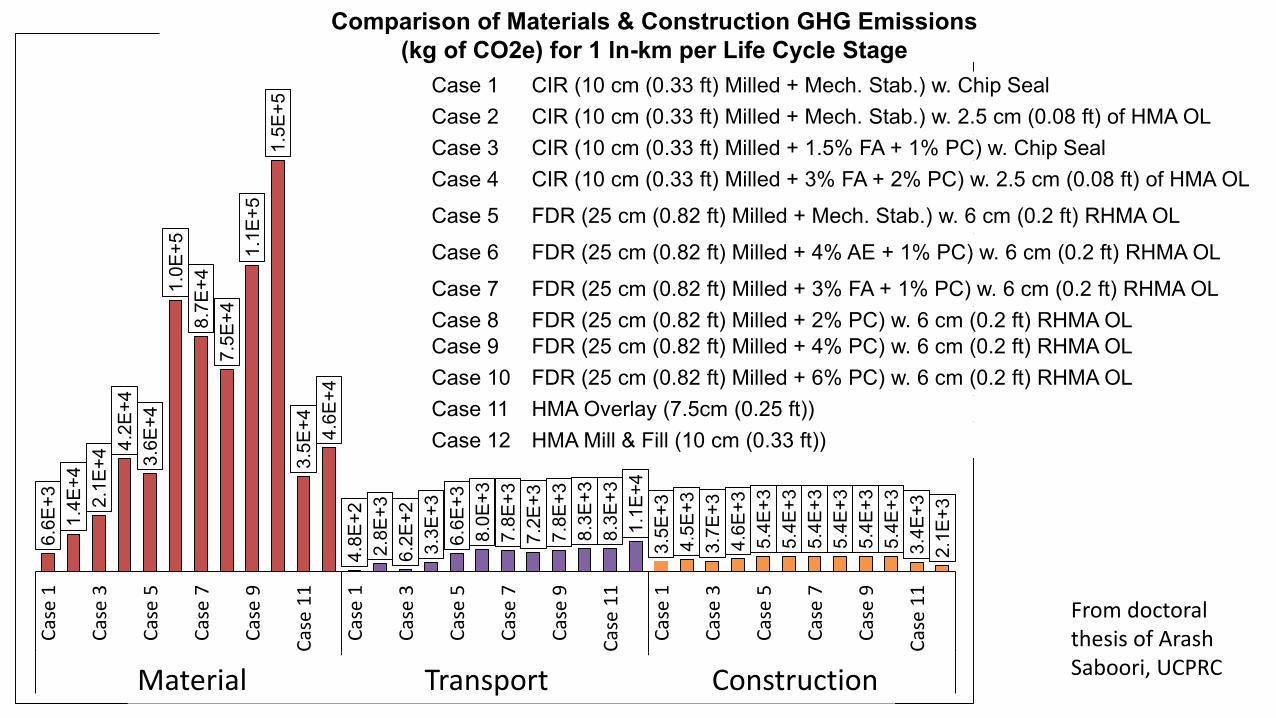
Comparison of Materials & Construction GHG Emissions (kg of CO2e) for 1 ln-km per Life Cycle Stage
Case 1 CIR (10 cm (0.33 ft) Milled + Mech. Stab.) w. Chip SealCase 2 CIR (10 cm (0.33 ft) Milled + Mech. Stab.) w. 2.5 cm (0.08 ft) of HMA OLCase 3 CIR (10 cm (0.33 ft) Milled + 1.5% FA + 1% PC) w. Chip SealCase 4 CIR (10 cm (0.33 ft) Milled + 3% FA + 2% PC) w. 2.5 cm (0.08 ft) of HMA OL
Case 5 FDR (25 cm (0.82 ft) Milled + Mech. Stab.) w. 6 cm (0.2 ft) RHMA OL
Case 6 FDR (25 cm (0.82 ft) Milled + 4% AE + 1% PC) w. 6 cm (0.2 ft) RHMA OL
Case 7 FDR (25 cm (0.82 ft) Milled + 3% FA + 1% PC) w. 6 cm (0.2 ft) RHMA OLCase 8 FDR (25 cm (0.82 ft) Milled + 2% PC) w. 6 cm (0.2 ft) RHMA OLCase 9 FDR (25 cm (0.82 ft) Milled + 4% PC) w. 6 cm (0.2 ft) RHMA OLCase 10 FDR (25 cm (0.82 ft) Milled + 6% PC) w. 6 cm (0.2 ft) RHMA OLCase 11 HMA Overlay (7.5cm (0.25 ft))Case 12 HMA Mill & Fill (10 cm (0.33 ft))
From doctoralthesis of ArashSaboori, UCPRCMaterial Transport Construction
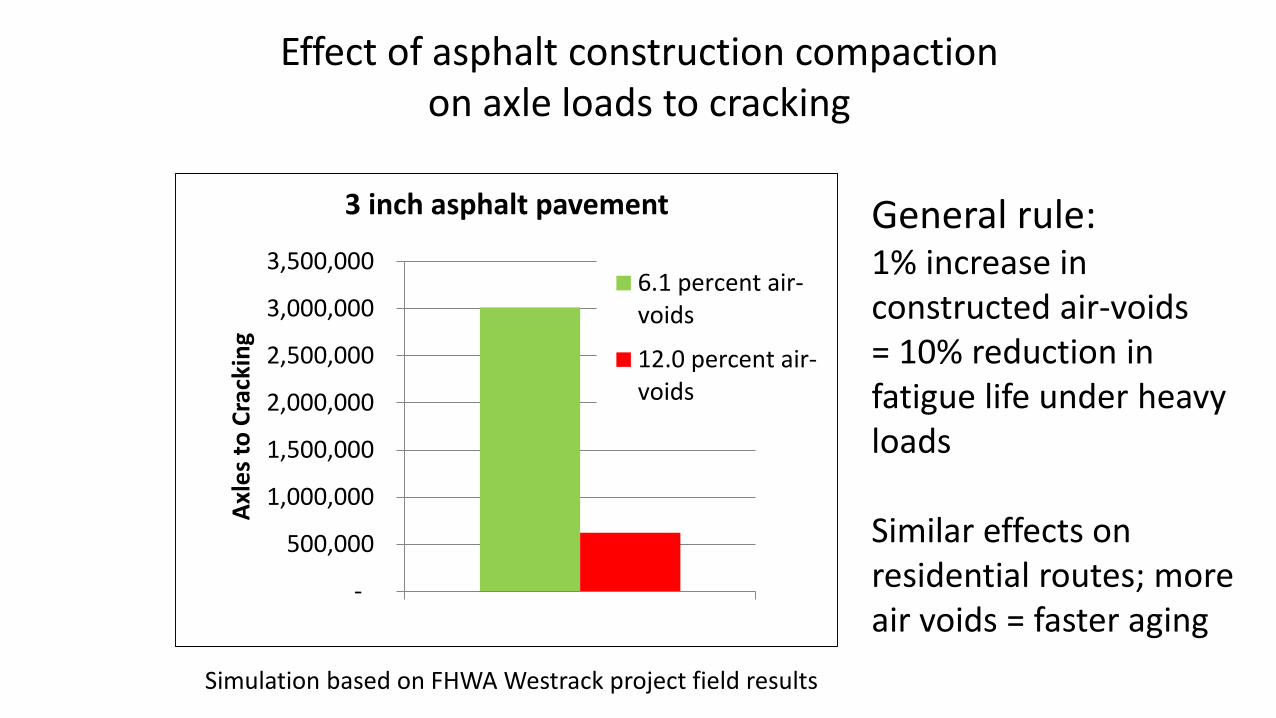
Simulation based on FHWA Westrack project field results
Effect of asphalt construction compaction on axle loads to cracking
-
500,000
1,000,000
1,500,000
2,000,000
2,500,000
3,000,000
3,500,000Ax
les t
o Cr
acki
ng3 inch asphalt pavement
6.1 percent air-voids
12.0 percent air-voids
General rule:1% increase in constructed air-voids = 10% reduction in fatigue life under heavy loads
Similar effects on residential routes; more air voids = faster aging
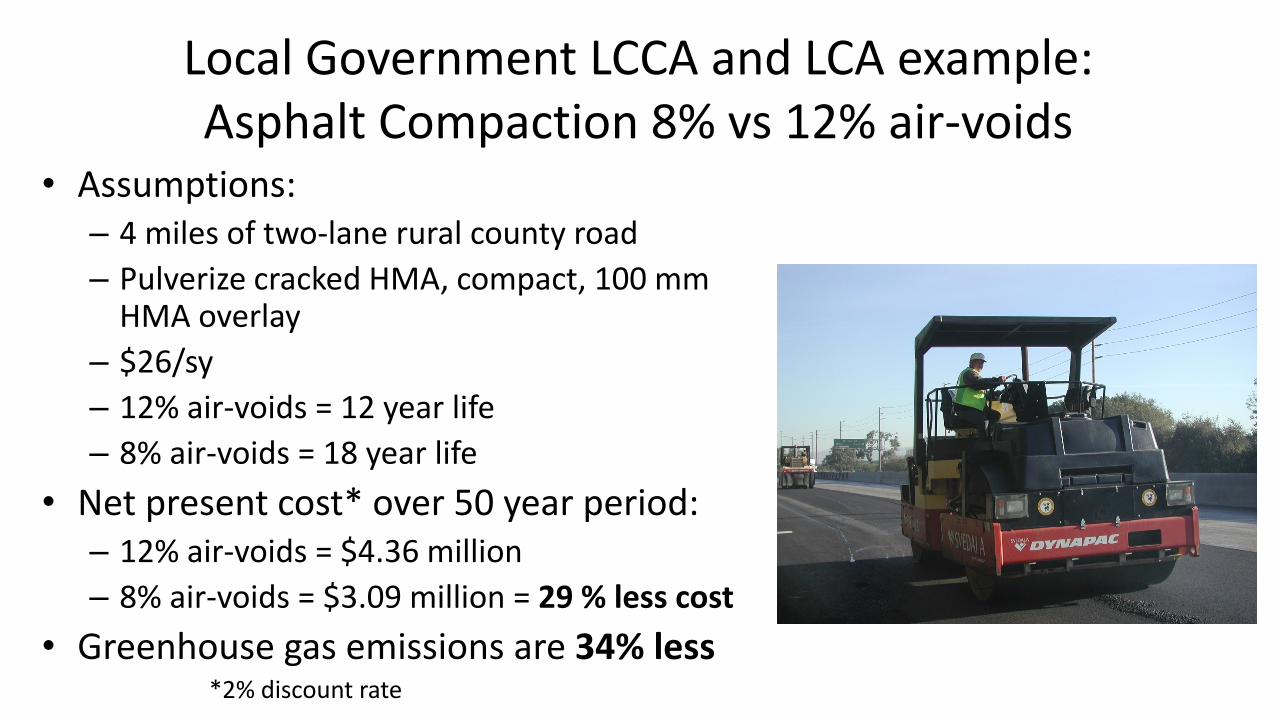
Local Government LCCA and LCA example: Asphalt Compaction 8% vs 12% air-voids
• Assumptions:– 4 miles of two-lane rural county road– Pulverize cracked HMA, compact, 100 mm
HMA overlay– $26/sy– 12% air-voids = 12 year life– 8% air-voids = 18 year life
• Net present cost* over 50 year period:– 12% air-voids = $4.36 million– 8% air-voids = $3.09 million = 29 % less cost
• Greenhouse gas emissions are 34% less*2% discount rate
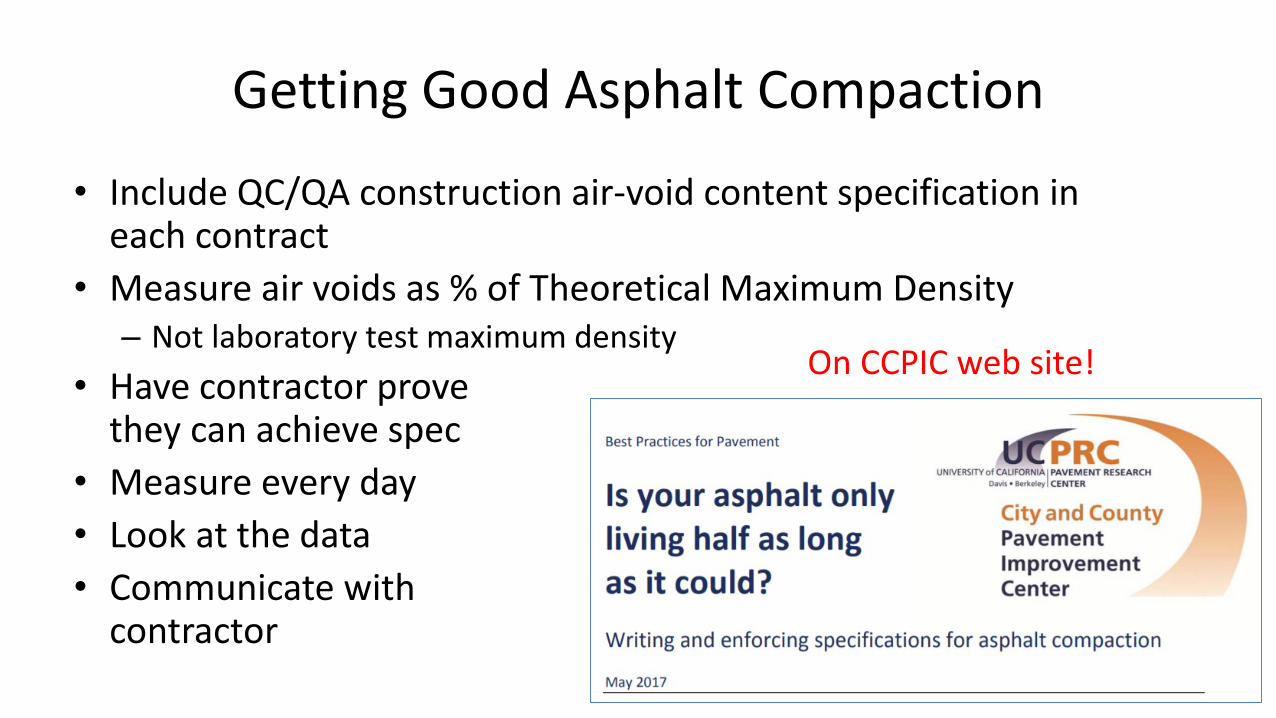
Getting Good Asphalt Compaction
• Include QC/QA construction air-void content specification in each contract
• Measure air voids as % of Theoretical Maximum Density– Not laboratory test maximum density
• Have contractor provethey can achieve spec
• Measure every day• Look at the data• Communicate with
contractor
On CCPIC web site!
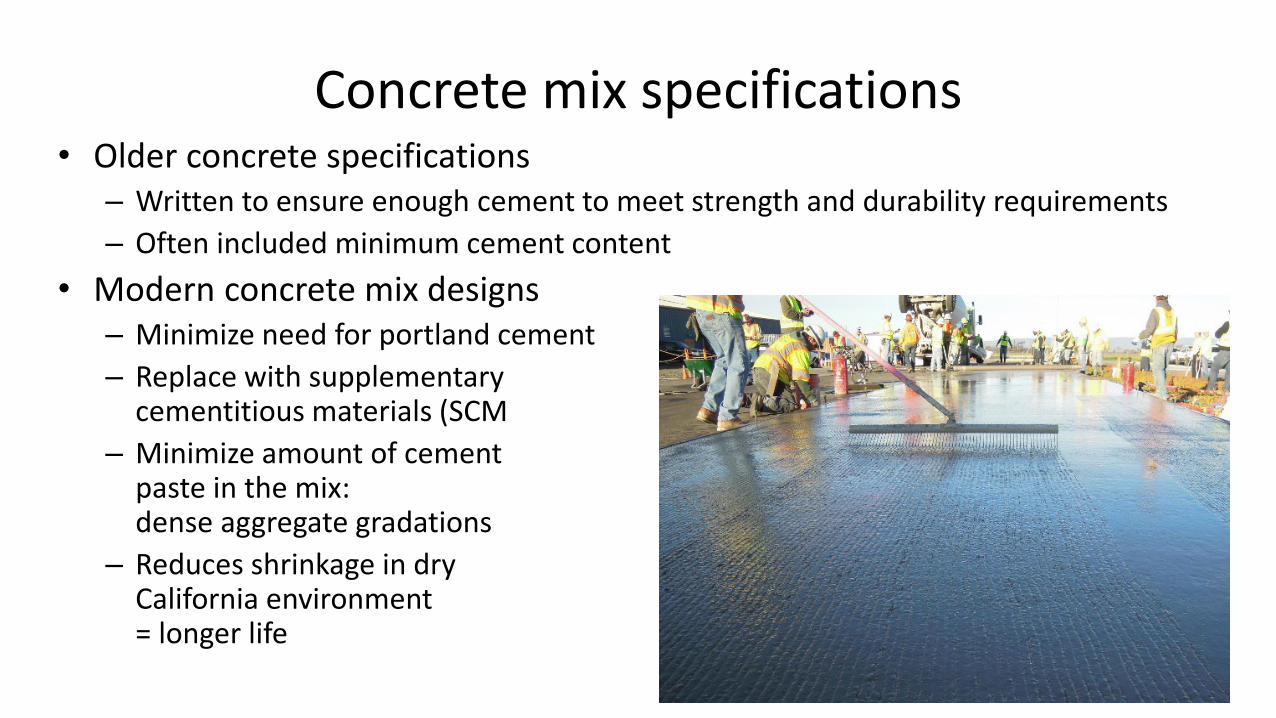
Concrete mix specifications• Older concrete specifications
– Written to ensure enough cement to meet strength and durability requirements– Often included minimum cement content
• Modern concrete mix designs– Minimize need for portland cement– Replace with supplementary
cementitious materials (SCM– Minimize amount of cement
paste in the mix: dense aggregate gradations
– Reduces shrinkage in dry California environment= longer life
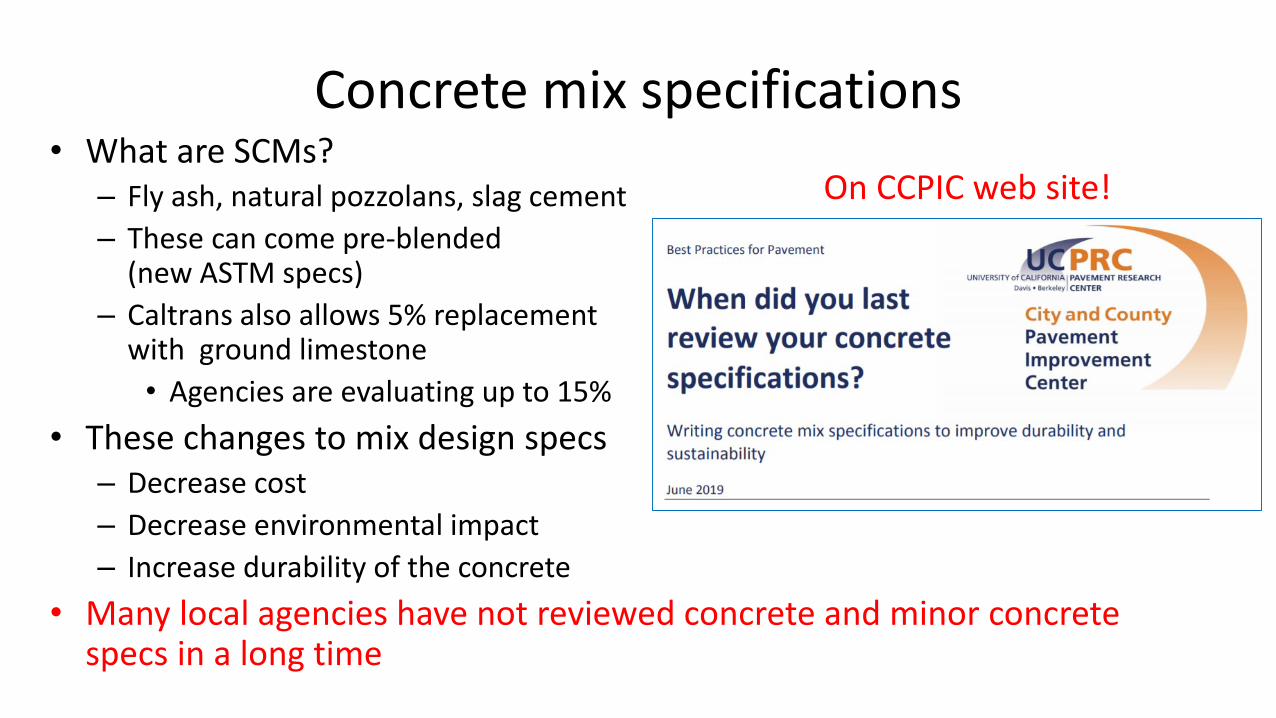
Concrete mix specifications• What are SCMs?
– Fly ash, natural pozzolans, slag cement– These can come pre-blended
(new ASTM specs)– Caltrans also allows 5% replacement
with ground limestone• Agencies are evaluating up to 15%
• These changes to mix design specs– Decrease cost– Decrease environmental impact– Increase durability of the concrete
• Many local agencies have not reviewed concrete and minor concrete specs in a long time
On CCPIC web site!
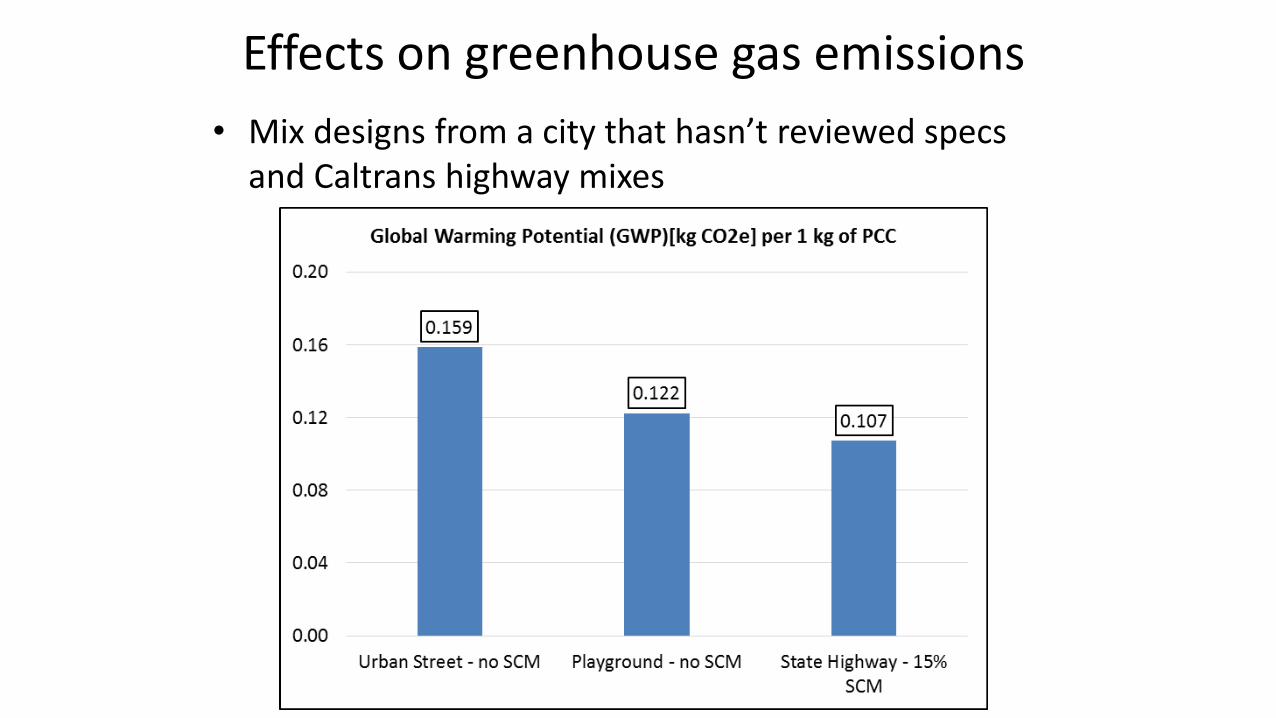
Effects on greenhouse gas emissions• Mix designs from a city that hasn’t reviewed specs
and Caltrans highway mixes
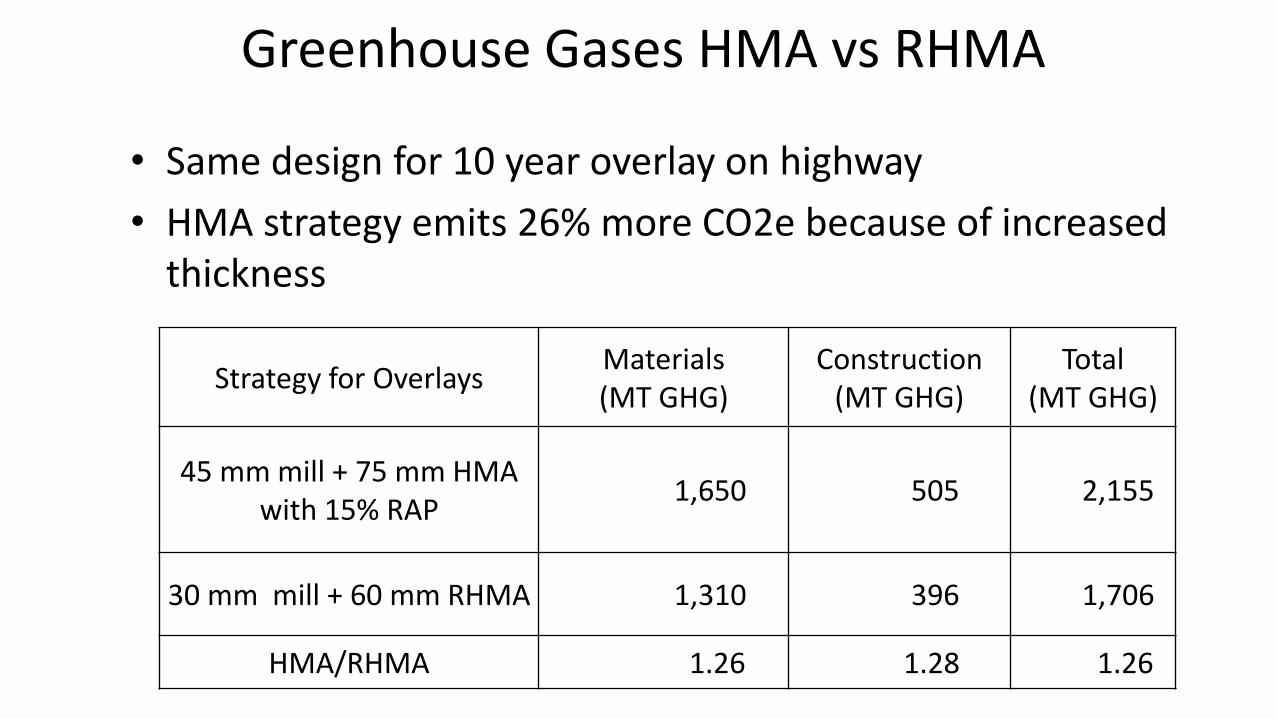
Greenhouse Gases HMA vs RHMA
• Same design for 10 year overlay on highway• HMA strategy emits 26% more CO2e because of increased
thickness
Strategy for Overlays Materials (MT GHG)
Construction(MT GHG)
Total(MT GHG)
45 mm mill + 75 mm HMA with 15% RAP 1,650 505 2,155
30 mm mill + 60 mm RHMA 1,310 396 1,706
HMA/RHMA 1.26 1.28 1.26
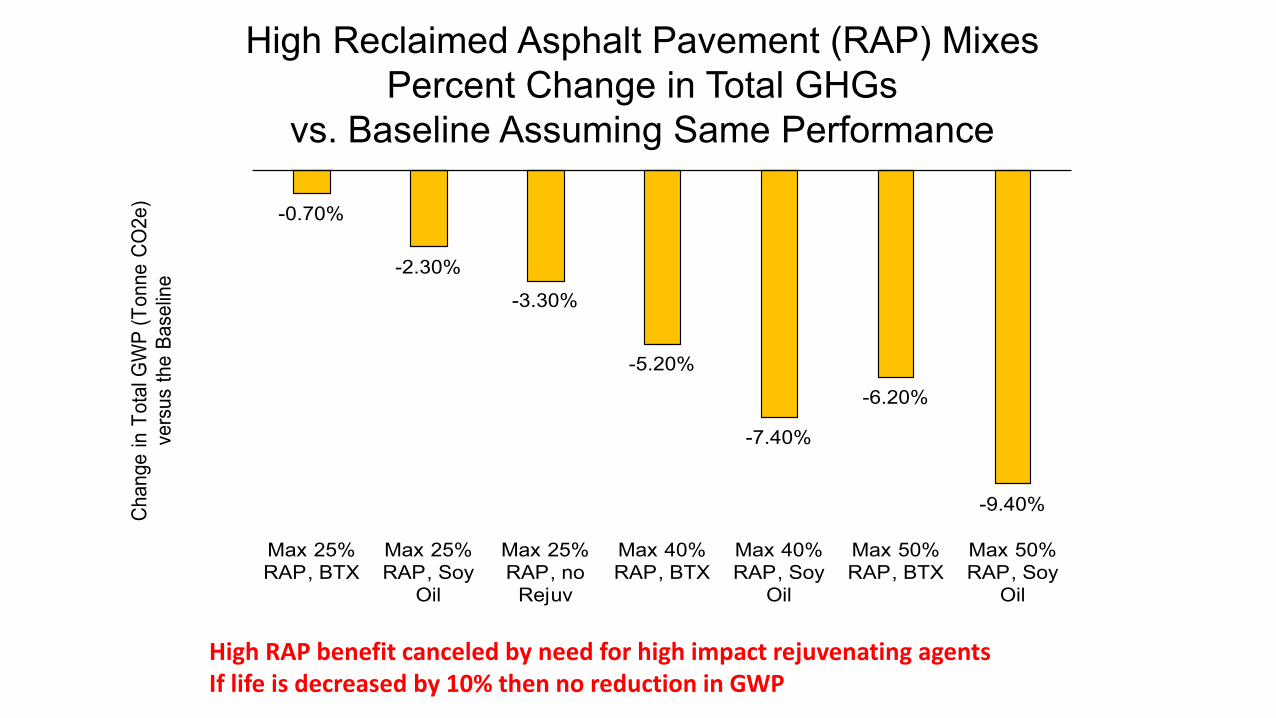
High Reclaimed Asphalt Pavement (RAP) MixesPercent Change in Total GHGs
vs. Baseline Assuming Same Performance
-0.70%
-2.30%
-3.30%
-5.20%
-7.40%
-6.20%
-9.40%
Max 25%RAP, BTX
Max 25%RAP, Soy
Oil
Max 25%RAP, no
Rejuv
Max 40%RAP, BTX
Max 40%RAP, Soy
Oil
Max 50%RAP, BTX
Max 50%RAP, Soy
Oil
Chan
ge in
Tot
al G
WP
(Ton
ne C
O2e
) ve
rsus
the
Base
line
High RAP benefit canceled by need for high impact rejuvenating agentsIf life is decreased by 10% then no reduction in GWP
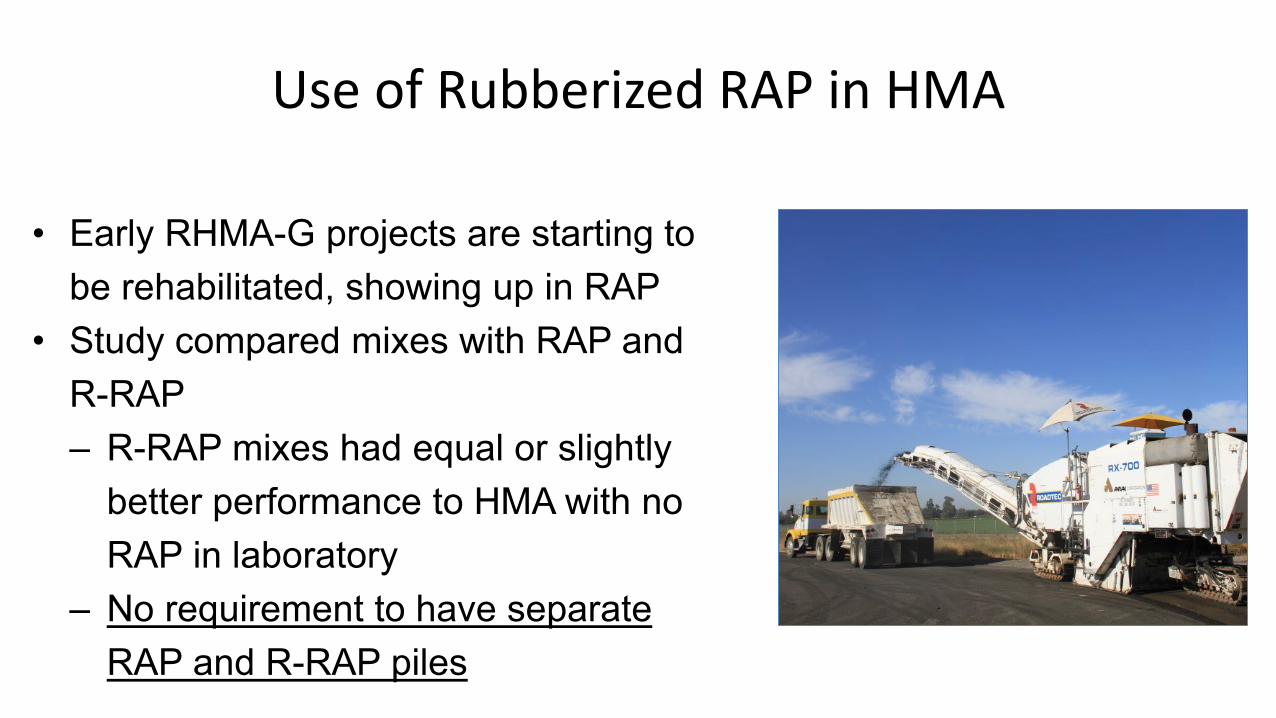
Use of Rubberized RAP in HMA
• Early RHMA-G projects are starting to be rehabilitated, showing up in RAP
• Study compared mixes with RAP and R-RAP – R-RAP mixes had equal or slightly
better performance to HMA with no RAP in laboratory
– No requirement to have separate RAP and R-RAP piles
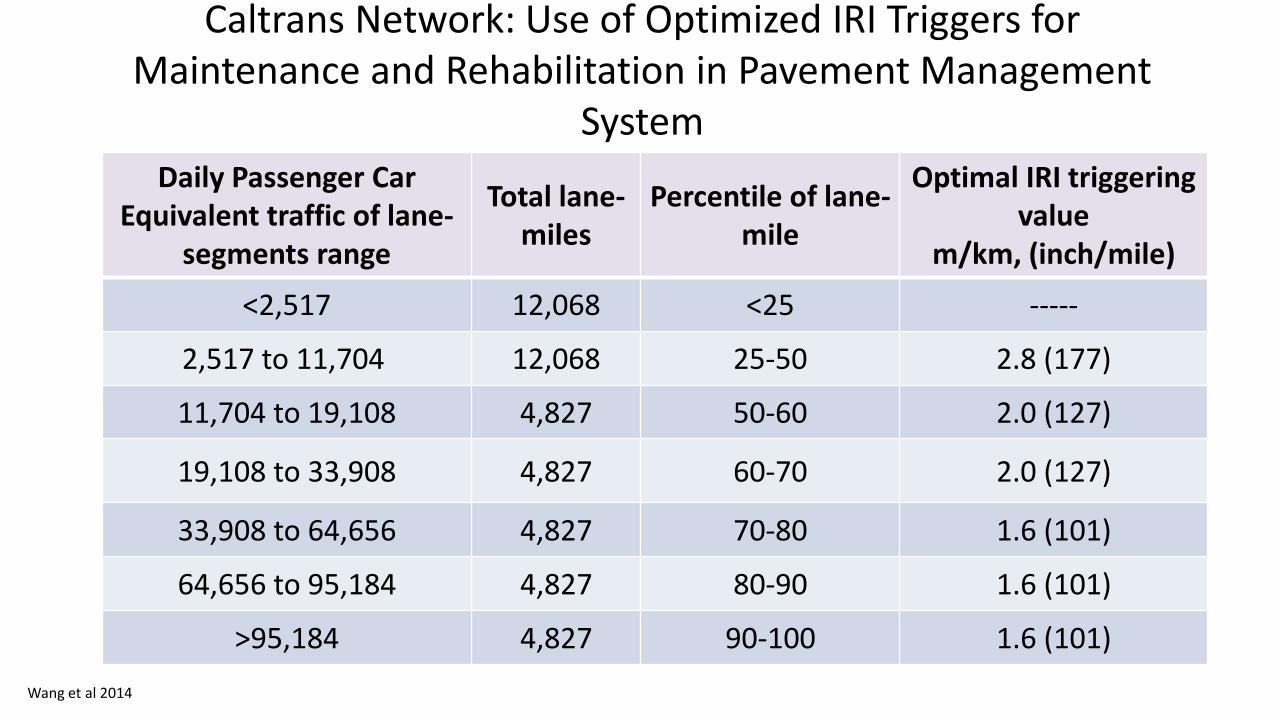
Caltrans Network: Use of Optimized IRI Triggers for Maintenance and Rehabilitation in Pavement Management
SystemDaily Passenger Car
Equivalent traffic of lane-segments range
Total lane-miles
Percentile of lane-mile
Optimal IRI triggering value
m/km, (inch/mile)
<2,517 12,068 <25 -----
2,517 to 11,704 12,068 25-50 2.8 (177)
11,704 to 19,108 4,827 50-60 2.0 (127)
19,108 to 33,908 4,827 60-70 2.0 (127)
33,908 to 64,656 4,827 70-80 1.6 (101)
64,656 to 95,184 4,827 80-90 1.6 (101)
>95,184 4,827 90-100 1.6 (101)Wang et al 2014
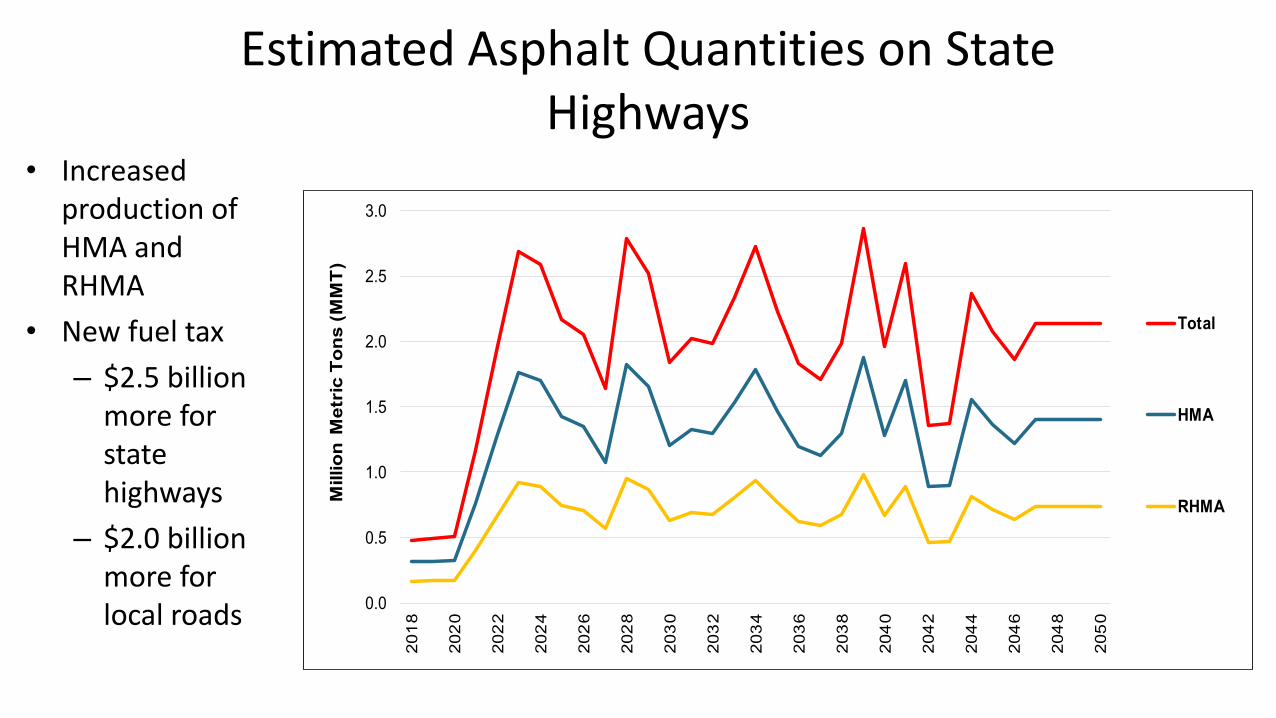
Estimated Asphalt Quantities on State Highways
• Increased production of HMA and RHMA
• New fuel tax– $2.5 billion
more for state highways
– $2.0 billion more for local roads 0.0
0.5
1.0
1.5
2.0
2.5
3.0
201
8
202
0
202
2
202
4
202
6
202
8
203
0
203
2
203
4
203
6
203
8
204
0
204
2
204
4
204
6
204
8
205
0
Mill
ion
Met
ric
Tons
(MM
T)
Total
HMA
RHMA
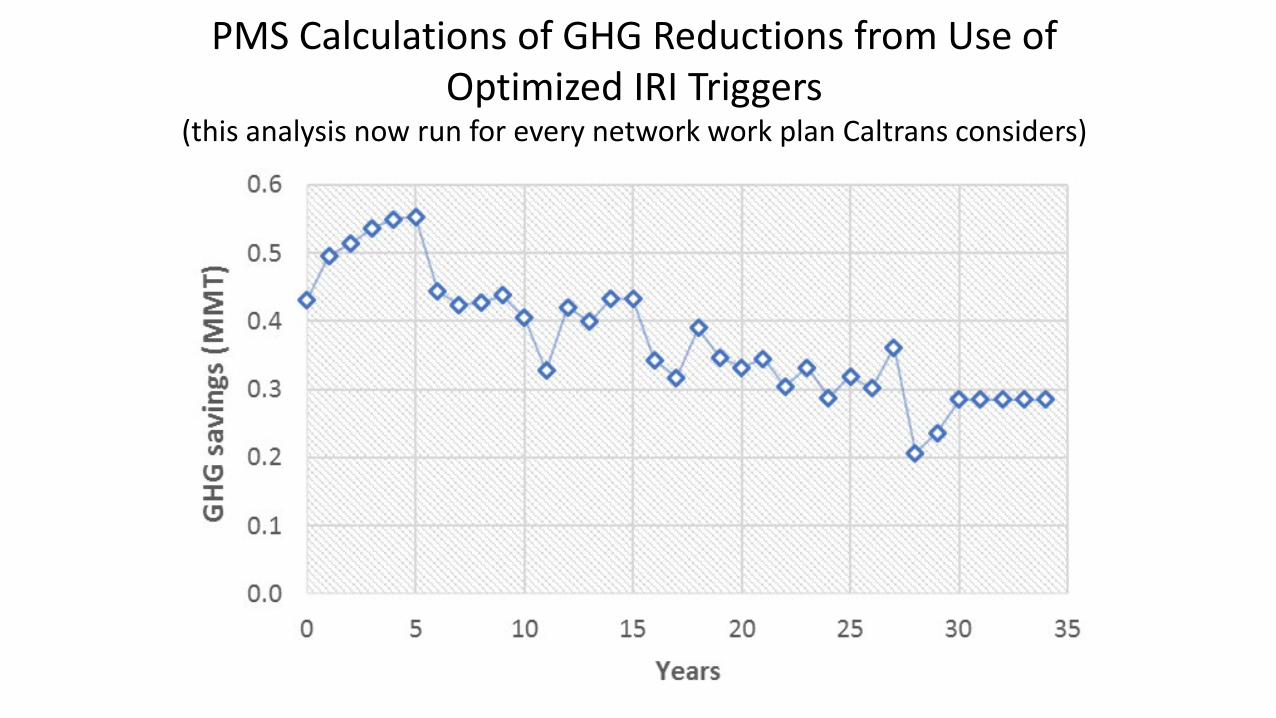
PMS Calculations of GHG Reductions from Use of Optimized IRI Triggers
(this analysis now run for every network work plan Caltrans considers)
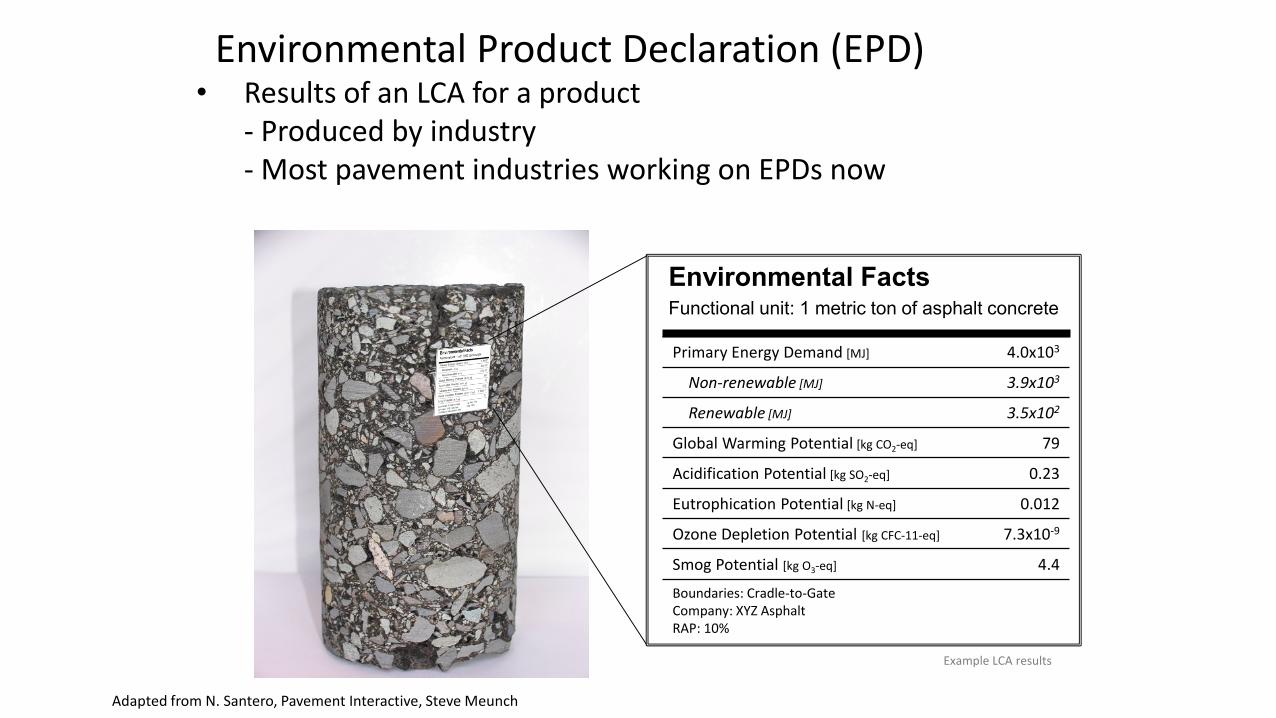
Environmental FactsFunctional unit: 1 metric ton of asphalt concrete
Primary Energy Demand [MJ] 4.0x10³
Non-renewable [MJ] 3.9x10³
Renewable [MJ] 3.5x10²
Global Warming Potential [kg CO2-eq] 79
Acidification Potential [kg SO2-eq] 0.23
Eutrophication Potential [kg N-eq] 0.012
Ozone Depletion Potential [kg CFC-11-eq] 7.3x10⁻⁹
Smog Potential [kg O3-eq] 4.4
Boundaries: Cradle-to-GateCompany: XYZ AsphaltRAP: 10%
Adapted from N. Santero, Pavement Interactive, Steve Meunch
Example LCA results
Environmental Product Declaration (EPD)• Results of an LCA for a product
- Produced by industry - Most pavement industries working on EPDs now
• EPDs are produced by industry and provide LCA results for their product from “cradle to gate” of their plant
• EPDs provide a means for agencies to quantify their emissions and impacts
• Materials EPDs do not account for how long the material will last in a given application
• Asphalt and concrete producers have set up systems to produce verifiable EPDs
Why Would a Local Government Ask for EPDs? Can Industry Deliver Them?
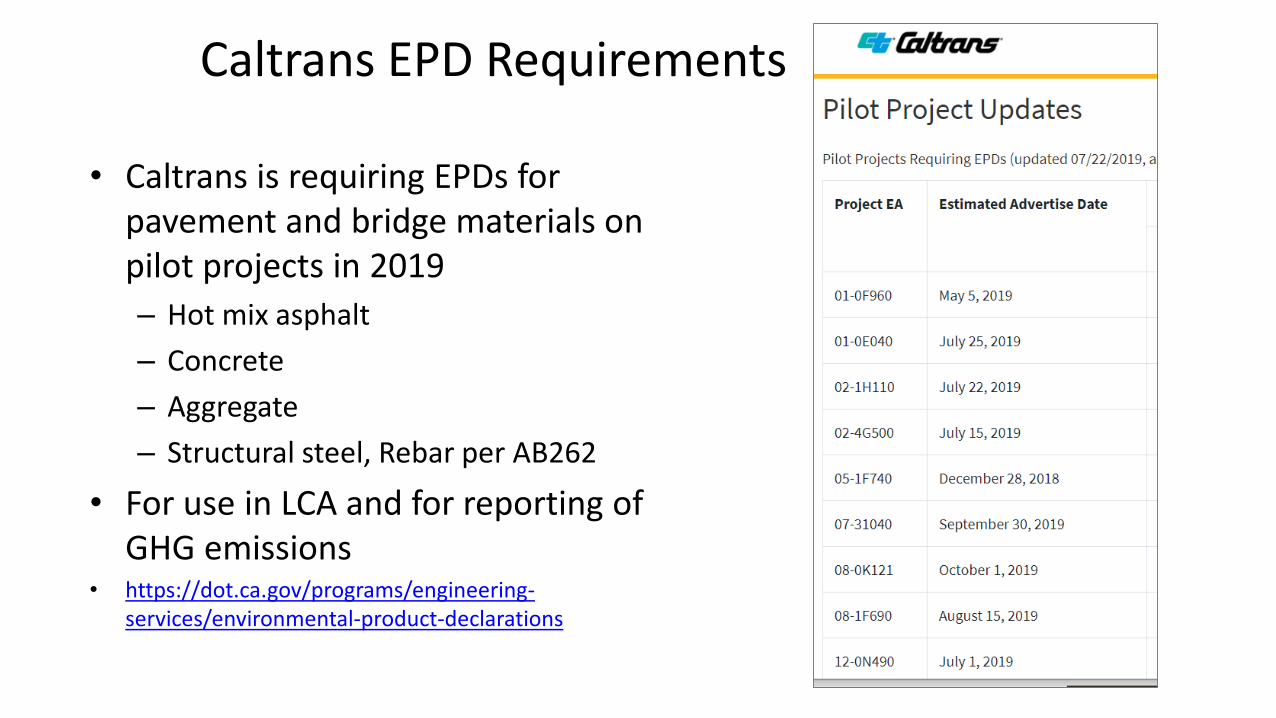
Caltrans EPD Requirements
• Caltrans is requiring EPDs for pavement and bridge materials on pilot projects in 2019– Hot mix asphalt– Concrete– Aggregate– Structural steel, Rebar per AB262
• For use in LCA and for reporting of GHG emissions
• https://dot.ca.gov/programs/engineering-services/environmental-product-declarations
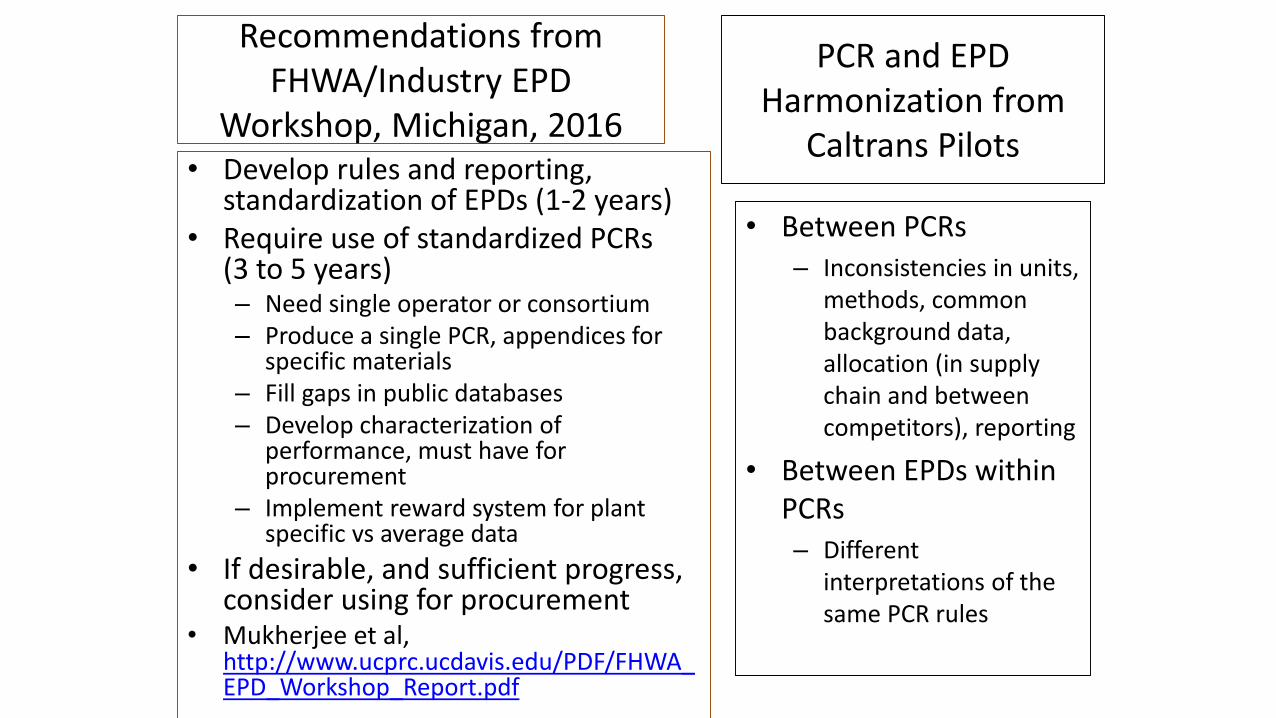
• Between PCRs– Inconsistencies in units,
methods, common background data, allocation (in supply chain and between competitors), reporting
• Between EPDs within PCRs– Different
interpretations of the same PCR rules
PCR and EPD Harmonization from
Caltrans Pilots• Develop rules and reporting,
standardization of EPDs (1-2 years)• Require use of standardized PCRs
(3 to 5 years)– Need single operator or consortium– Produce a single PCR, appendices for
specific materials– Fill gaps in public databases– Develop characterization of
performance, must have for procurement
– Implement reward system for plant specific vs average data
• If desirable, and sufficient progress, consider using for procurement
• Mukherjee et al, http://www.ucprc.ucdavis.edu/PDF/FHWA_EPD_Workshop_Report.pdf
Recommendations from FHWA/Industry EPD
Workshop, Michigan, 2016
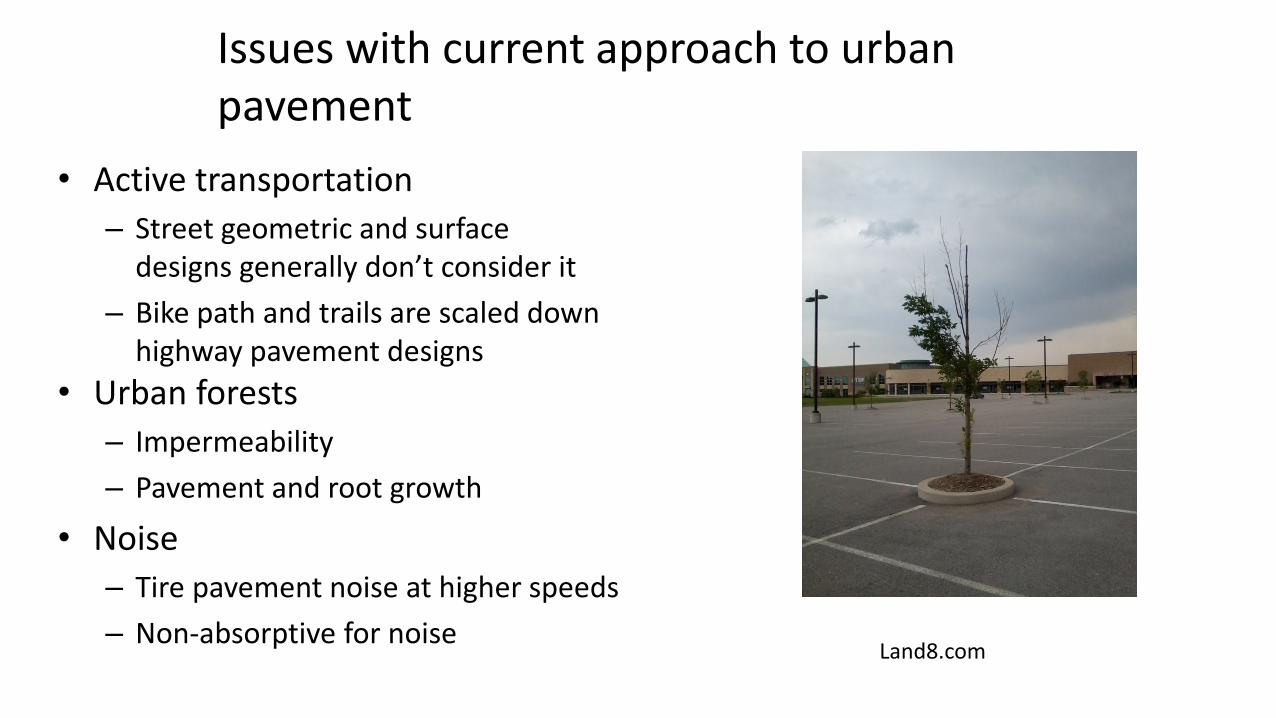
Issues with current approach to urban pavement
• Active transportation– Street geometric and surface
designs generally don’t consider it– Bike path and trails are scaled down
highway pavement designs• Urban forests
– Impermeability– Pavement and root growth
• Noise– Tire pavement noise at higher speeds– Non-absorptive for noise
Land8.com
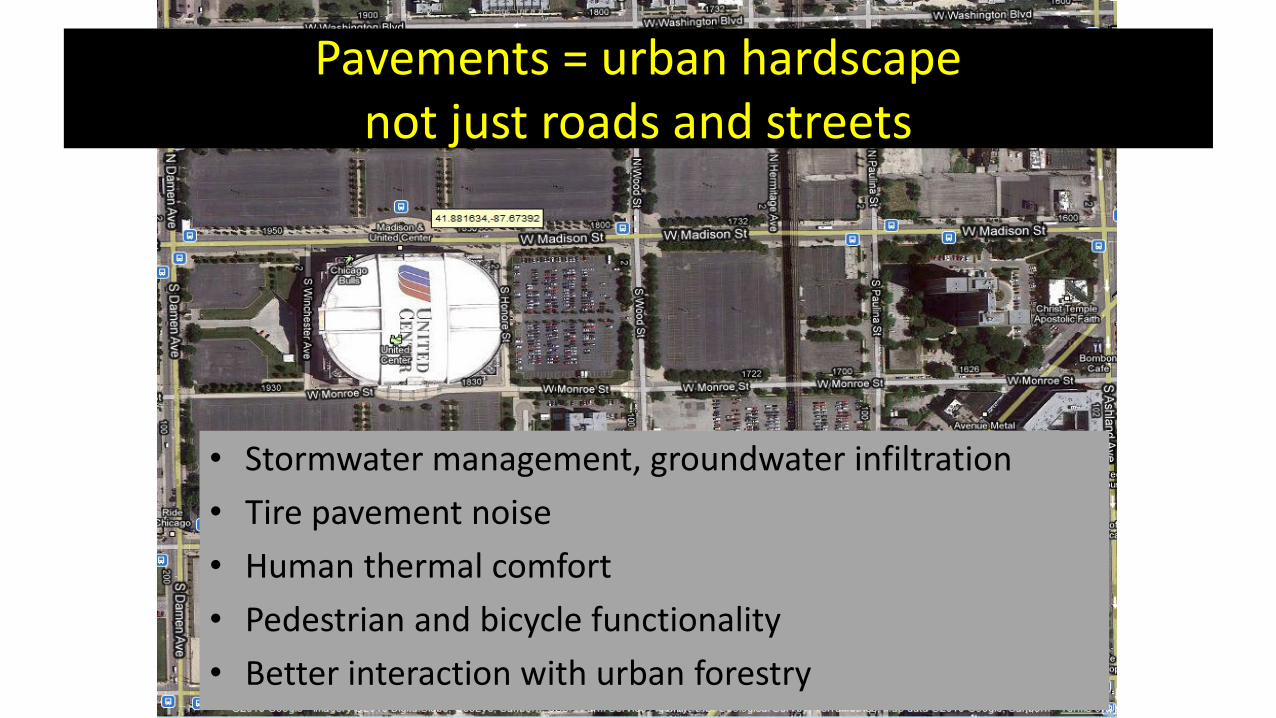
Pavements = urban hardscapenot just roads and streets
• Stormwater management, groundwater infiltration• Tire pavement noise• Human thermal comfort• Pedestrian and bicycle functionality• Better interaction with urban forestry
Life-Cycle Assessment and Co-benefits of Cool Pavements
CalAPA, Sacramento, 25 Oct 2017Abridged from
ARB Research SeminarMay 3, 2017
Sacramento, CA
Lawrence Berkeley National LaboratoryUniversity of California Pavement Research Center
University of Southern Californiathinkstep, Inc.
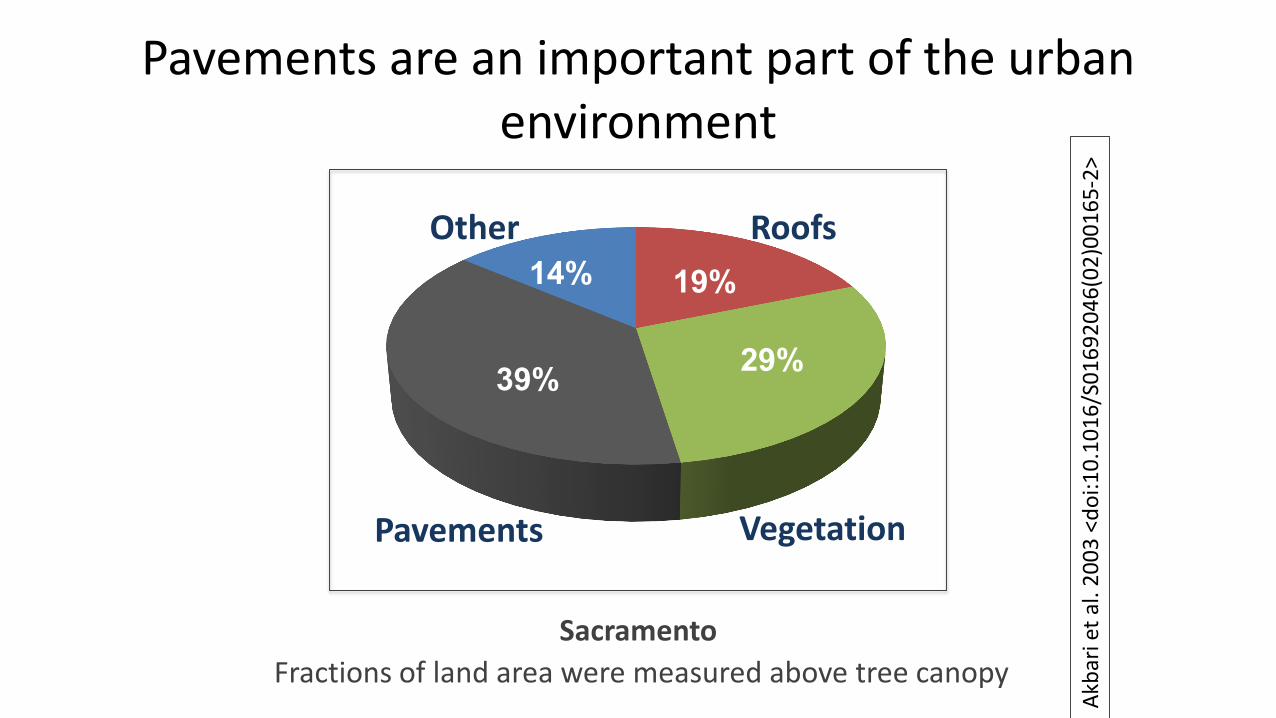
Pavements are an important part of the urban environment
39%
19%
29%
Pavements
Roofs
Vegetation
14%Other
Fractions of land area were measured above tree canopySacramento
Akba
riet
al.
2003
<do
i:10.
1016
/S01
6920
46(0
2)00
165-
2>
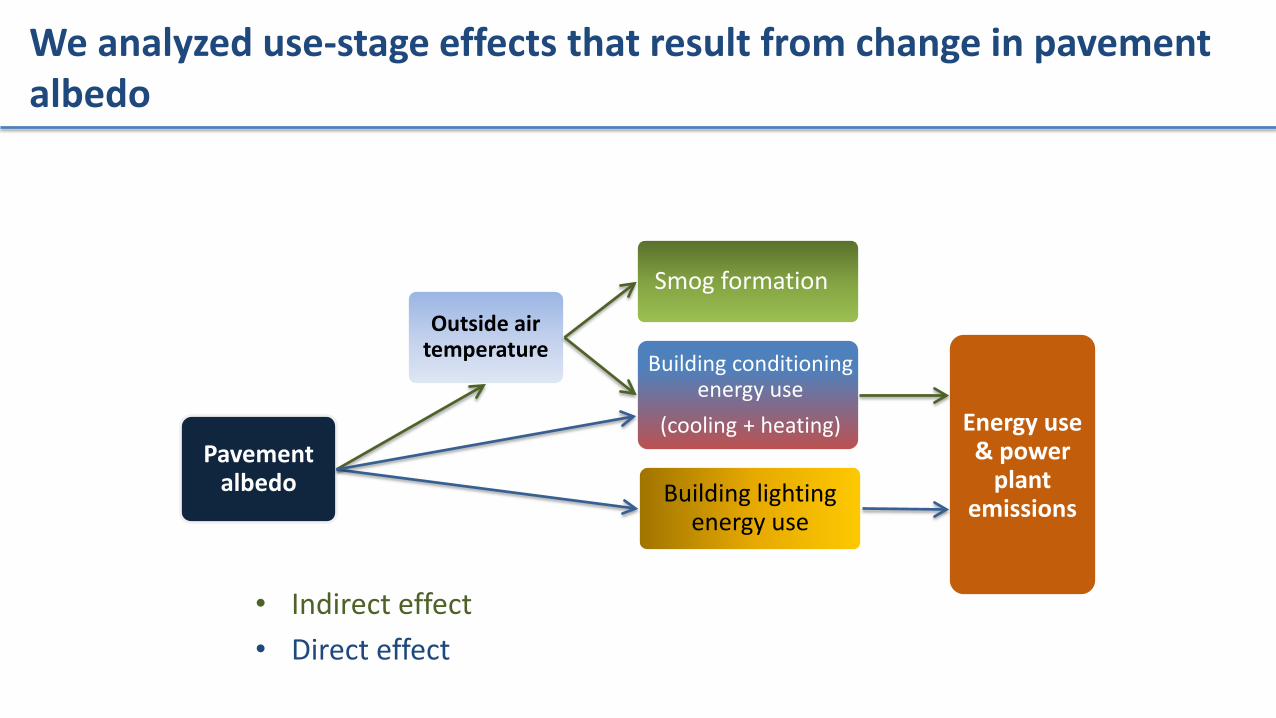
We analyzed use-stage effects that result from change in pavement albedo
Energy use & power
plant emissions
Pavement albedo
Outside air temperature
Smog formation
Building conditioning energy use
(cooling + heating)
Building lighting energy use
• Indirect effect • Direct effect
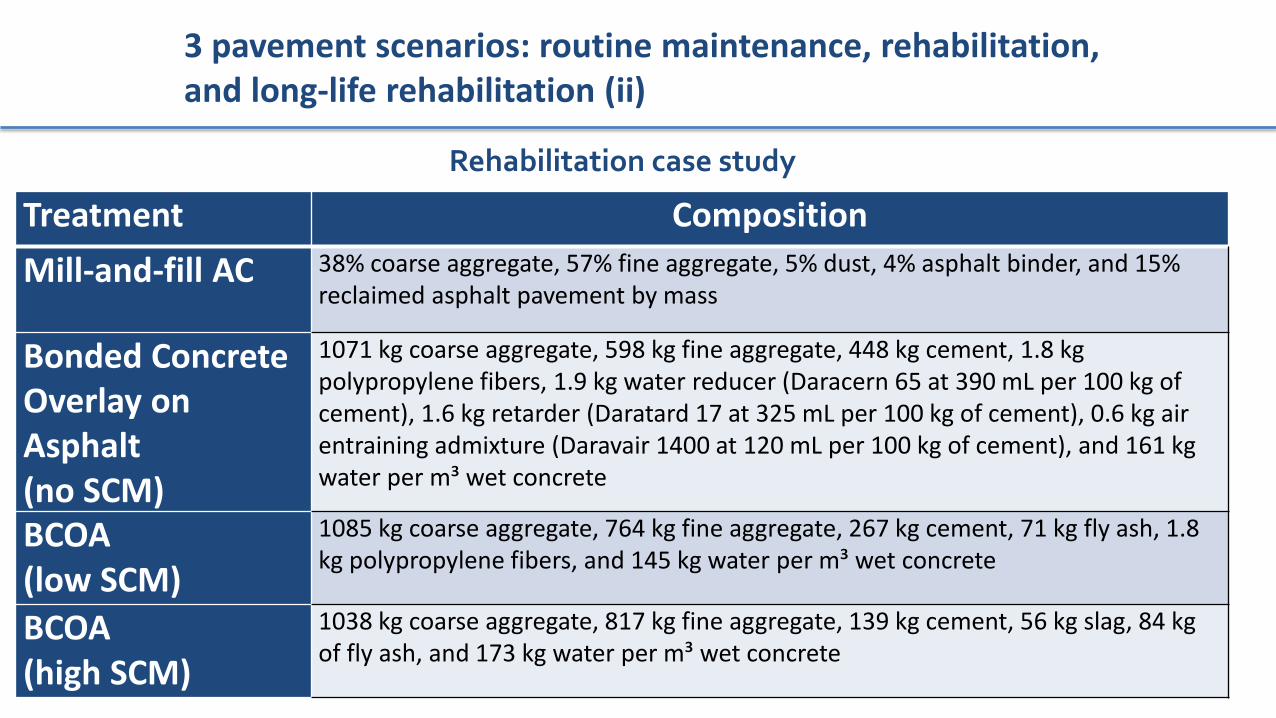
3 pavement scenarios: routine maintenance, rehabilitation, and long-life rehabilitation (ii)
Rehabilitation case study
Treatment CompositionMill-and-fill AC 38% coarse aggregate, 57% fine aggregate, 5% dust, 4% asphalt binder, and 15%
reclaimed asphalt pavement by mass
Bonded Concrete Overlay on Asphalt (no SCM)
1071 kg coarse aggregate, 598 kg fine aggregate, 448 kg cement, 1.8 kg polypropylene fibers, 1.9 kg water reducer (Daracern 65 at 390 mL per 100 kg of cement), 1.6 kg retarder (Daratard 17 at 325 mL per 100 kg of cement), 0.6 kg air entraining admixture (Daravair 1400 at 120 mL per 100 kg of cement), and 161 kg water per m³ wet concrete
BCOA (low SCM)
1085 kg coarse aggregate, 764 kg fine aggregate, 267 kg cement, 71 kg fly ash, 1.8 kg polypropylene fibers, and 145 kg water per m³ wet concrete
BCOA (high SCM)
1038 kg coarse aggregate, 817 kg fine aggregate, 139 kg cement, 56 kg slag, 84 kg of fly ash, and 173 kg water per m³ wet concrete
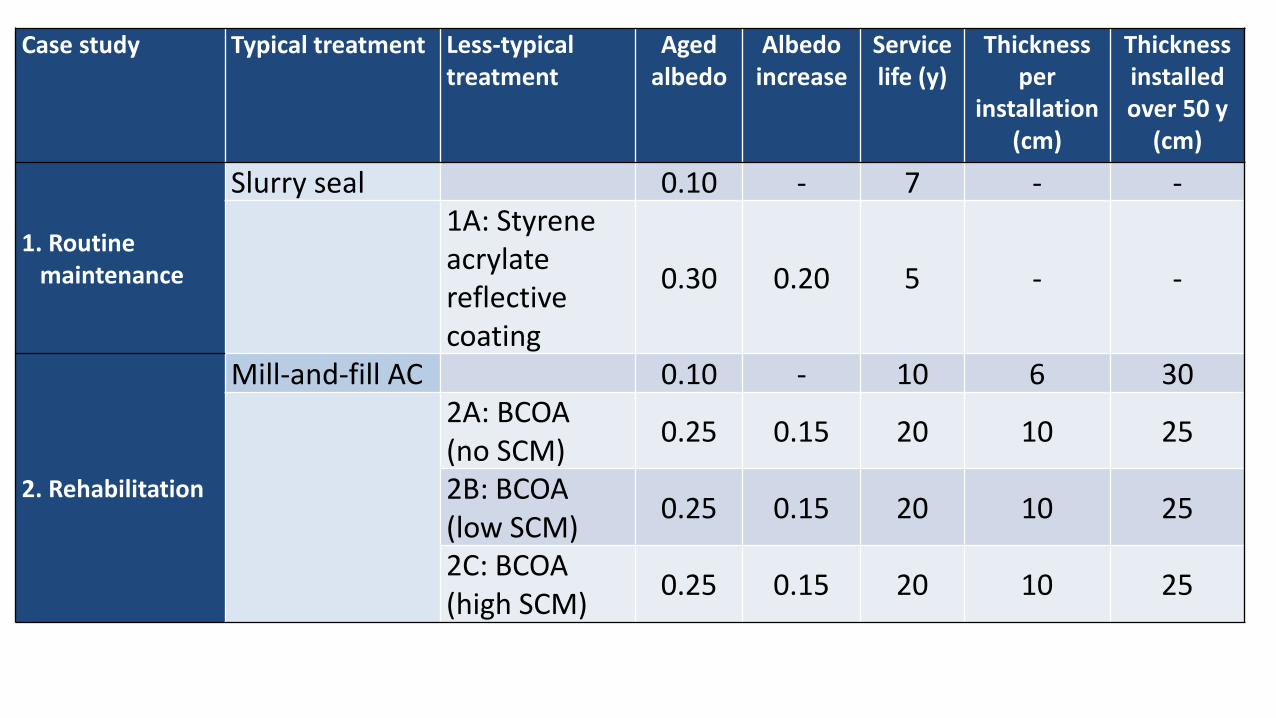
Case study Typical treatment Less-typical treatment
Aged albedo
Albedo increase
Service life (y)
Thickness per
installation (cm)
Thickness installed over 50 y
(cm)
1. Routine maintenance
Slurry seal 0.10 - 7 - -1A: Styrene acrylate reflective coating
0.30 0.20 5 - -
2. Rehabilitation
Mill-and-fill AC 0.10 - 10 6 302A: BCOA (no SCM) 0.25 0.15 20 10 25
2B: BCOA (low SCM) 0.25 0.15 20 10 25
2C: BCOA (high SCM) 0.25 0.15 20 10 25
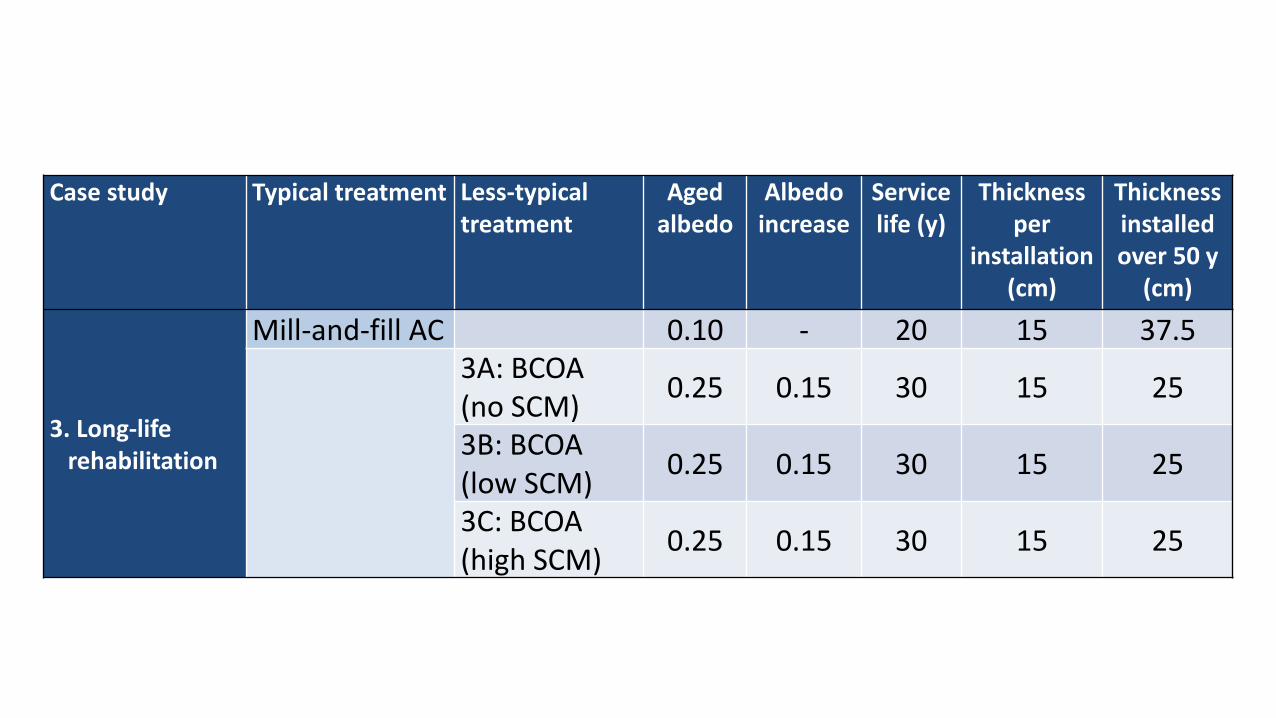
Case study Typical treatment Less-typical treatment
Aged albedo
Albedo increase
Service life (y)
Thickness per
installation (cm)
Thickness installed over 50 y
(cm)
3. Long-liferehabilitation
Mill-and-fill AC 0.10 - 20 15 37.53A: BCOA (no SCM) 0.25 0.15 30 15 25
3B: BCOA (low SCM) 0.25 0.15 30 15 25
3C: BCOA (high SCM) 0.25 0.15 30 15 25
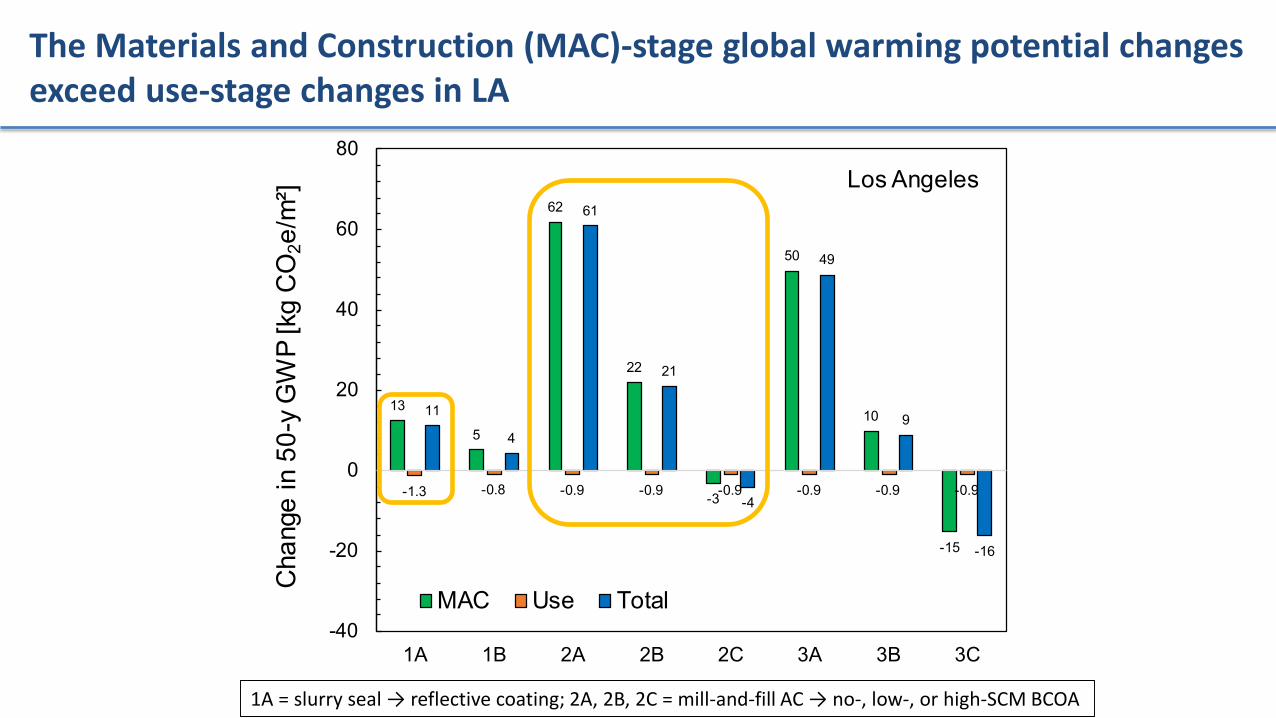
The Materials and Construction (MAC)-stage global warming potential changes exceed use-stage changes in LA
13
5
62
22
-3
50
10
-15
-1.3 -0.8 -0.9 -0.9 -0.9 -0.9 -0.9 -0.9
11
4
61
21
-4
49
9
-16
-40
-20
0
20
40
60
80
1A 1B 2A 2B 2C 3A 3B 3C
Cha
nge
in 5
0-y
GW
P [k
g C
O2e
/m²]
MAC Use Total
Los Angeles
1A = slurry seal → reflective coating; 2A, 2B, 2C = mill-and-fill AC → no-, low-, or high-SCM BCOA
65
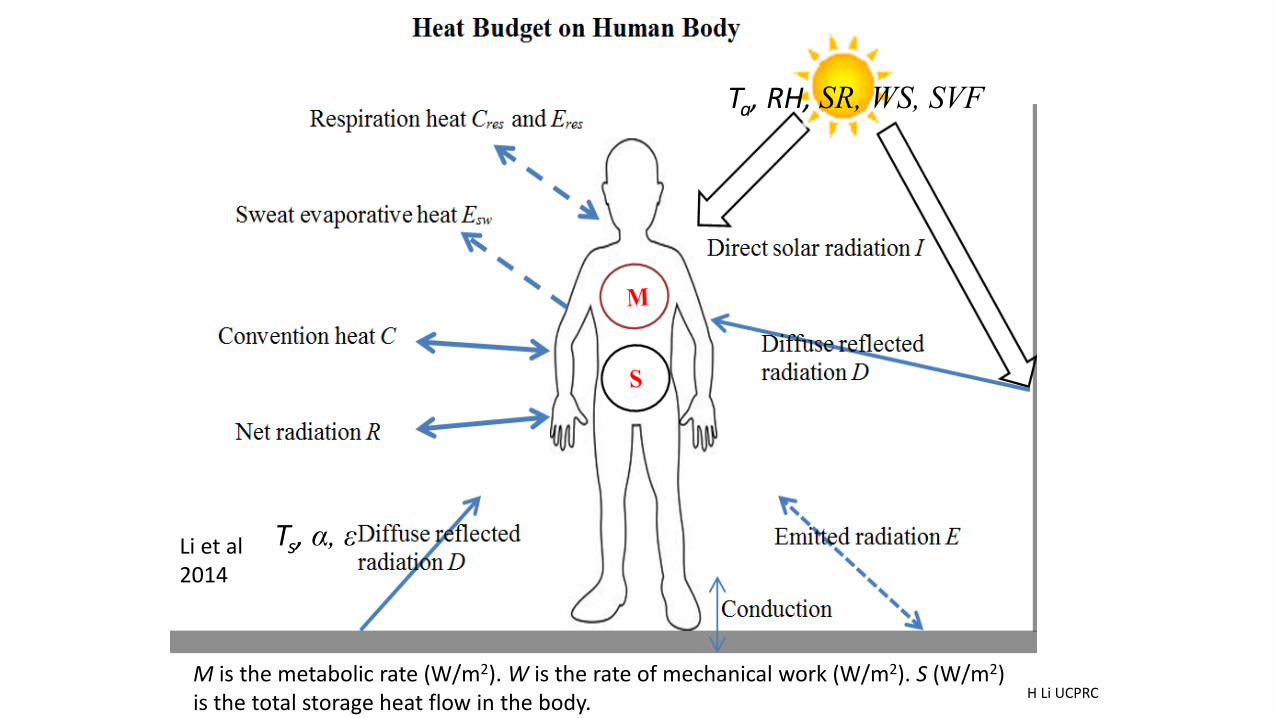
Ts, α, ε
Ta, RH, SR, WS, SVF
Li et al2014
M is the metabolic rate (W/m2). W is the rate of mechanical work (W/m2). S (W/m2) is the total storage heat flow in the body. H Li UCPRC
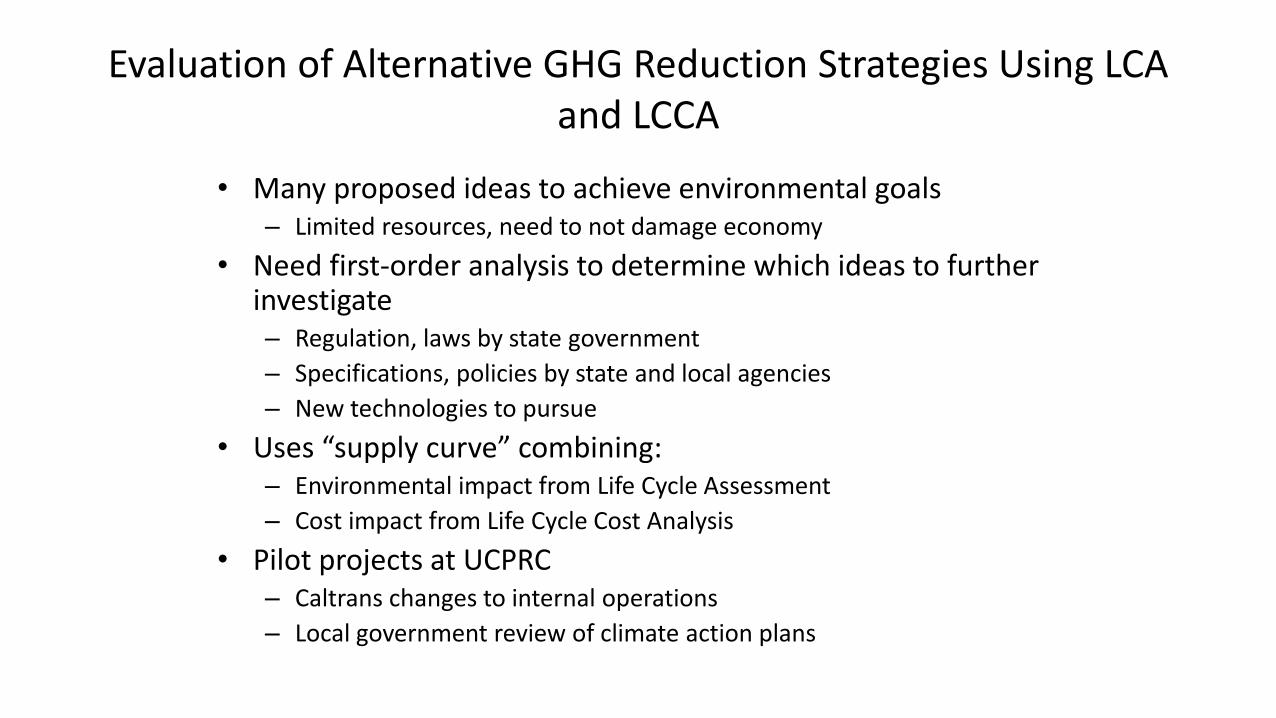
Evaluation of Alternative GHG Reduction Strategies Using LCA and LCCA
• Many proposed ideas to achieve environmental goals– Limited resources, need to not damage economy
• Need first-order analysis to determine which ideas to further investigate– Regulation, laws by state government– Specifications, policies by state and local agencies– New technologies to pursue
• Uses “supply curve” combining:– Environmental impact from Life Cycle Assessment– Cost impact from Life Cycle Cost Analysis
• Pilot projects at UCPRC– Caltrans changes to internal operations– Local government review of climate action plans
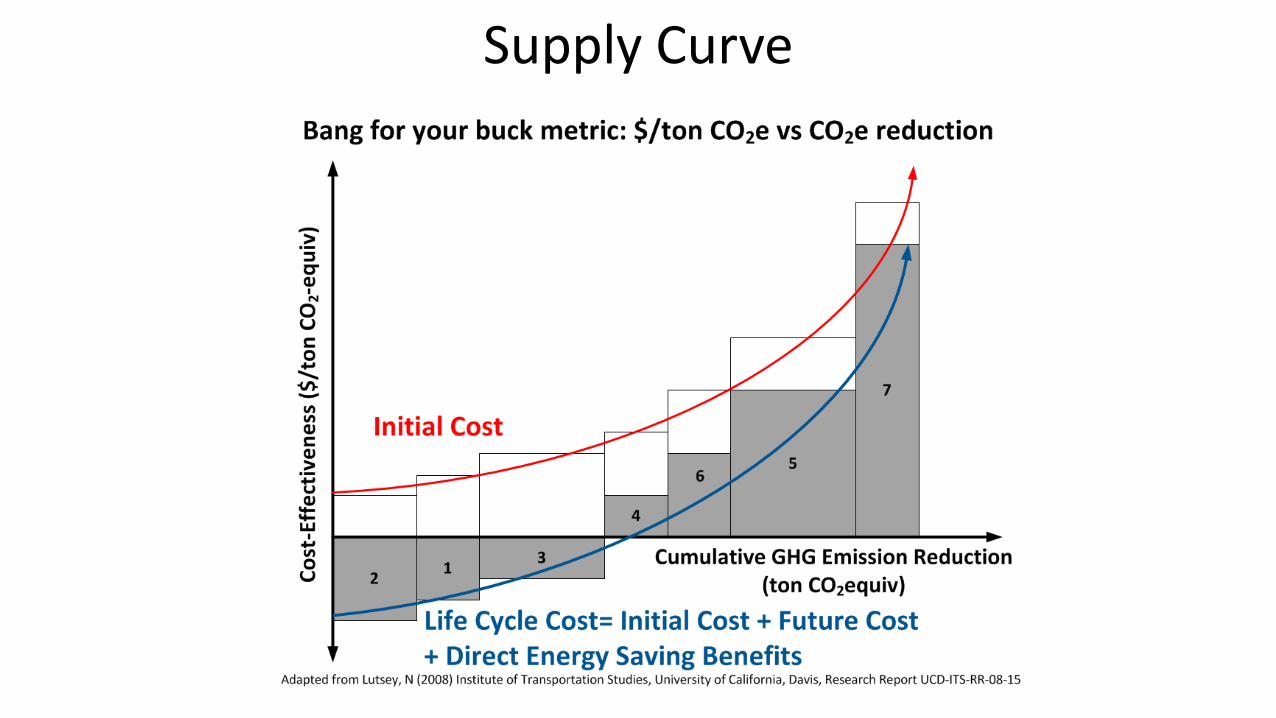
Supply Curve
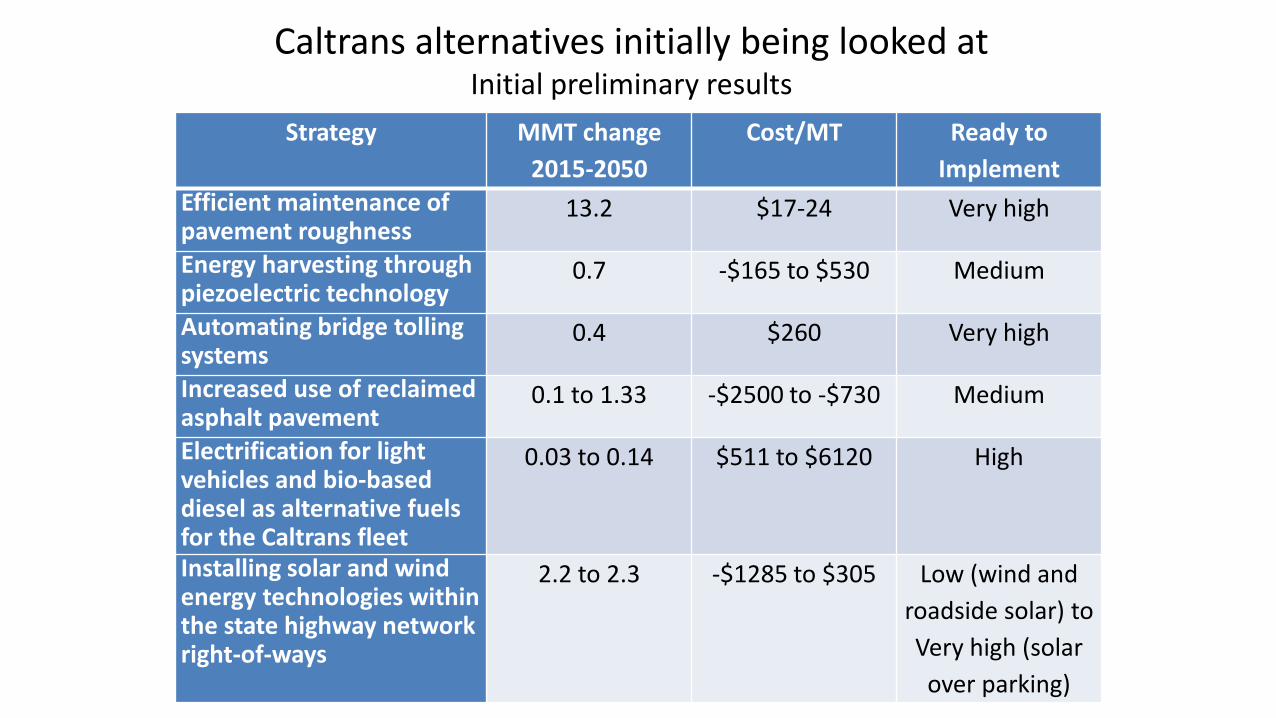
Caltrans alternatives initially being looked atInitial preliminary results
Strategy MMT change 2015-2050
Cost/MT Ready to Implement
Efficient maintenance of pavement roughness
13.2 $17-24 Very high
Energy harvesting through piezoelectric technology
0.7 -$165 to $530 Medium
Automating bridge tolling systems
0.4 $260 Very high
Increased use of reclaimed asphalt pavement
0.1 to 1.33 -$2500 to -$730 Medium
Electrification for light vehicles and bio-based diesel as alternative fuels for the Caltrans fleet
0.03 to 0.14 $511 to $6120 High
Installing solar and wind energy technologies within the state highway network right-of-ways
2.2 to 2.3 -$1285 to $305 Low (wind and roadside solar) to Very high (solar
over parking)
Conclusions
• Pavement can play its role in reducing climate change, and often also reduce cost
• LCA and LCCA are tools to be used to quantify and prioritize• There are no magic bullets, every sector needs to prioritize
what it can do to both reduce environmental damage and cost
• Think full system and life cycle• There are strategies that you can be implementing now!
Recommendations for What You Can Do Now
• Improve asphalt pavement life– Include asphalt compaction specifications
• % of Theoretical Maximum Density, not % of Laboratory Test Max Density
– Enforce asphalt compaction specifications• Review and communicate with contractor daily
– Consider use of rubberized hot mix
• Improve concrete specifications– Use strength and shrinkage specifications– Remove minimum cement contents– Allow use of supplementary cementitious materials
• Keep heavy traffic routes smooth
Recommendations for What You Can Do Now• Practice timely pavement preservation
– Seal coats before cracks and signficiant aging occur, especially for routes without heavy traffic
– Optimize decision trees• Consider full-depth reclamation where pavements have severe full-
depth cracking• Minimize trucking of materials in construction projects • Get ready to use LCA in design and to evaluate other questions• Consider asking for Environmental Product Declarations
– Monitor steps Caltrans is taking towards using for procurement– Consider use of EPDs in future procurement for materials meeting same
specification
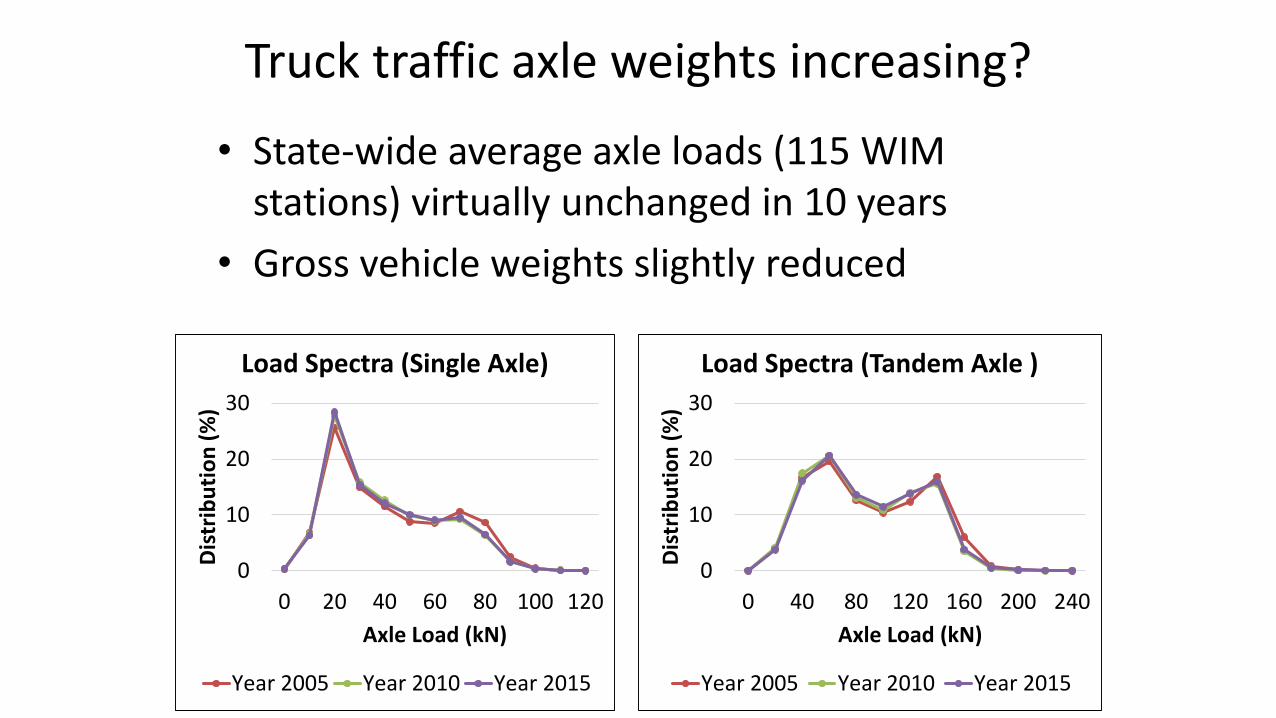
Truck traffic axle weights increasing?
• State-wide average axle loads (115 WIM stations) virtually unchanged in 10 years
• Gross vehicle weights slightly reduced
0
10
20
30
0 20 40 60 80 100 120
Dis
trib
utio
n (%
)
Axle Load (kN)
Load Spectra (Single Axle)
Year 2005 Year 2010 Year 2015
0
10
20
30
0 40 80 120 160 200 240
Dis
trib
utio
n (%
)Axle Load (kN)
Load Spectra (Tandem Axle )
Year 2005 Year 2010 Year 2015
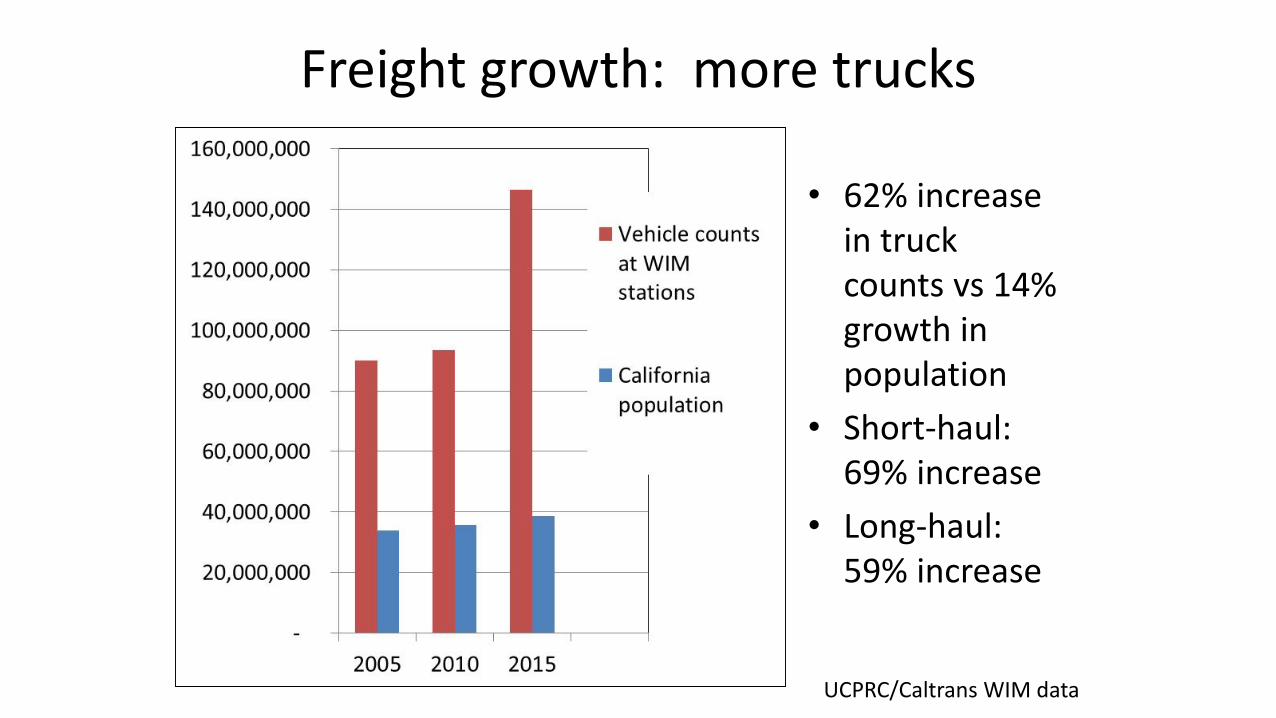
Freight growth: more trucks
• 62% increase in truck counts vs 14% growth in population
• Short-haul: 69% increase
• Long-haul: 59% increase
UCPRC/Caltrans WIM data
Thank You!
www.ucprc.ucdavis.edu/lca2020Search on “pavement LCA 2020”