Embed Size (px)
Citation preview

More Accurate Racial and Ethnic Codes for Medicare Administrative Data
Celia Eicheldinger, M.S. and Arthur Bonito, Ph.D.
Analyses of health care disparities in Medicare using administrative race and ethnicity data have typically been limited to Black and White beneficiaries. This is in part due to the small size of the other categories, inaccuracies in the race and ethnicity codes, and caveats that more extensive analyses would produce biased results. While previous Medicare efforts certainly improved the accuracy of race and ethnicity coding, we have developed an imputation algorithm that dramatically improves the accuracy of coding for Hispanic and Asian or Pacific Islander beneficiaries. When compared with self-reported race and ethnicity, sensitivity increased from 29.5 to 76.6 percent for Hispanic and from 54.7 to 79.2 percent for Asian and Pacific Islander beneficiaries, with no loss of specificity, and Kappa coefficients reaching 0.80. As a result, 2,245,792 beneficiaries were recoded to Hispanic and 336,363 to Asian or Pacific Islander.
introduCtion
Medicare administrative data should be an ideal resource to examine the extent of racial and ethnic disparities in the program. However, small population size and recognized inaccuracies in the coding of race/ ethnicity in the Medicare enrollment database (EDB) have led health policy analysts to be wary of making comparisons that go beyond White and Black beneficiaries.
The authors are with RTI International. The research in this article was supported by the Centers for Medicare & Medicaid Services (CMS) under Contract Number 500-00-0024 (TO8). The statements expressed in this article are those of the authors and do not necessarily reflect the views or policies of RTI International, or CMS.
Some have advised against the analysis of data for Hispanic, Asian/Pacific Islander, and American Indian/Alaska Native beneficiaries because of potential bias in analyses when large proportions of these relatively small racial/ethnic groups are not correctly identified, and they differ in important ways from those who are (Lauderdale and Goldberg, 1996; Arday et al., 2000).
Historically, the Medicare Program has received its race/ethnicity code for beneficiaries from the Social Security Administration’s (SSA’s) master beneficiary record (MBR). From 1935 to 1980, the Social Security application form (SS-5) incorporated into the MBR only allowed classification of an applicant’s race into White, Black, or Other. “Unknown” was used to classify persons who did not report any race. In 1980, the number of race/ethnicity categories on the form was expanded to six responding to Office of Management and Budget (OMB) Directive 15: (1) White (non-Hispanic); (2) Black (non-Hispanic); (3) Hispanic; (4) Asian, Asian American, or Pacific Islander; (5) American Indian or Alaska Native; and (6) Unknown. In 1989, SSA began to enroll new participants at birth, extracting data from birth certificates rather than requiring applicants to file Form SS-5; however, the race/ethnicity information on the birth certificate was not included in the data extraction because it was considered unnecessary for administration of the SSA program. Since 1989, the only persons filing an SS-5 form have been those requesting a new number or a name change (Scott, 1999).
HealtH Care FinanCing review/Spring 2008/Volume 29, Number 3 27
In 1994, race data from the SS-5 forms with the expanded race/ethnicity codes were integrated into the EDB directly to correct erroneous and missing codes. This changed the race/ethnicity coding for more than 2.5 million beneficiaries (Lauderdale and Goldberg, 1996). This update using the SS-5 form was repeated in 1997 and 2000, and is now conducted annually. The Medicare Program has also worked with the Indian Health Service to improve the coding of American Indians/ Alaska Natives.
In 1997, to correct miscoded data and reduce the amount of missing race/ethnicity information, the Health Care Financing Administration (now CMS) conducted a postcard survey of nearly 2.2 million beneficiaries. The survey included beneficiaries with Hispanic surnames or Hispanic countries of birth and beneficiaries coded as “Other” or “Missing” race/ethnicity data. The survey resulted in changes for approximately 858,000 beneficiaries (Arday et al., 2000). These efforts clearly improved the EDB’s race/ethnicity data. Nonetheless, comparisons of the EDB race/ ethnicity codes with self-reported race/ ethnicity data from the Medicare Current Beneficiary Survey (MCBS) indicated that identification of Hispanics, Asians/Pacific Islanders, and American Indians/Alaska Natives was still quite incomplete and might result in biased analyses (Arday et al., 2000). An analysis comparing the distribution of race/ethnicity for Medicare beneficiaries age 65 or over in the EDB to that of U.S. Census estimates of similar aged persons produced similar results (Eggers and Greenberg, 2000). A recent analysis comparing EDB to MCBS race/ethnicity codes continues to find large proportions of these same groups to be misclassified in the EDB (Waldo, 2004-2005).
MetHodS
This work was conducted to identify health care disparities among Medicare beneficiaries, including Hispanics and Asians/Pacific Islanders. We first assessed the accuracy of the race/ethnicity coding on the EDB, then developed and validated an imputation algorithm to improve the accuracy of the EDB race/ethnicity code, applying it to the EDB.
data
We conducted multiple analyses in the process of assessing and improving the race/ethnicity coding on the EDB. The data we used included: • Separate Hispanic/Latino and Asian/
Pacific Islander surname lists from the 1990 and 2000 U.S. Census.
• Separate Hispanic/Latino and Asian/ Pacific Islander first-name lists compiled from multiple Web sites.
• Self-reported race/ethnicity of 830,728 Medicare beneficiary respondents from three different Consumer Assessment of Health Care Providers Survey (CAHPS®) conducted from 2000 to 2002, including: Medicare fee-for-service, Medicare managed care enrollee, and Medicare managed care disenrollee. We henceforth refer to these as the CAHPS® data. The self-reported race/ ethnicity codes from these data are the SELFRACE variable and constitute the gold standard.
• Several variables found on the Medicare EDB, including: Race/ethnicity1, henceforth referred to as EDBRACE, has eight values and allows beneficiaries only one value each. The eight values are: (1) 0 = Unknown, (2) 1 = White (non-Hispanic), (3) 2 = Black (non-Hispanic), (4) 3 =
1 The definitions of the values we have listed for EDBRACE are what we believe to have been intended by the codes.
HealtH Care FinanCing review/Spring 2008/Volume 29, Number 3 28

Other, (5) 4 = Asian/Pacific Islander, (6) 5 = Hispanic/Latino, (7) 6 = American Indian/Alaska Native, and (8) Blank = Temporary record.
• Other variables that identified language, source of beneficiaries’ race/ethnicity code, and State from the beneficiary’s mailing address.
variable Creation
Prior to making comparisons, we created a self-reported race variable, SELFRACE, from the following two CAHPS® questions on race and ethnicity: • Are you of Hispanic or Latino origin
or descent? — Yes, Hispanic or Latino — No, not Hispanic or Latino
• What is your race2? Please mark one or more. — White — Black or African-American — Asian — Native Hawaiian or other Pacific
Islander — American Indian or Alaska Native To make meaningful comparisons, SEL
FRACE was created with similar logic and the same codes as EDBRACE. We did the following to make SELFRACE comparable with EDBRACE: • If a CAHPS® respondent reported being
Hispanic/Latino, SELFRACE was set to Hispanic/Latino.
• Otherwise, if a CAHPS® respondent reported not being Hispanic/Latino (or the response was missing) and only chose one race, SELFRACE was set to the value of the race chosen. For example, if a respondent chose Asian or Native Hawaiian or other Pacific Islander, SELFRACE was set to Asian/ Pacific Islander.
2 In 2000, CAHPS® included an option for beneficiaries to select “Other” as a race.
• If a CAHPS® respondent reported not being Hispanic/Latino (or the response was missing) and reported more than one race, SELFRACE was set to two or more.3
• If a respondent’s answer was missing for both questions, SELFRACE was set to unknown.
• If the respondent reported not being Hispanic/Latino (or the answer was missing), and did not indicate a race, SELFRACE was set to unknown. We then compared SELFRACE with ED
BRACE for all of the CAHPS® respondents.
Statistical Methods
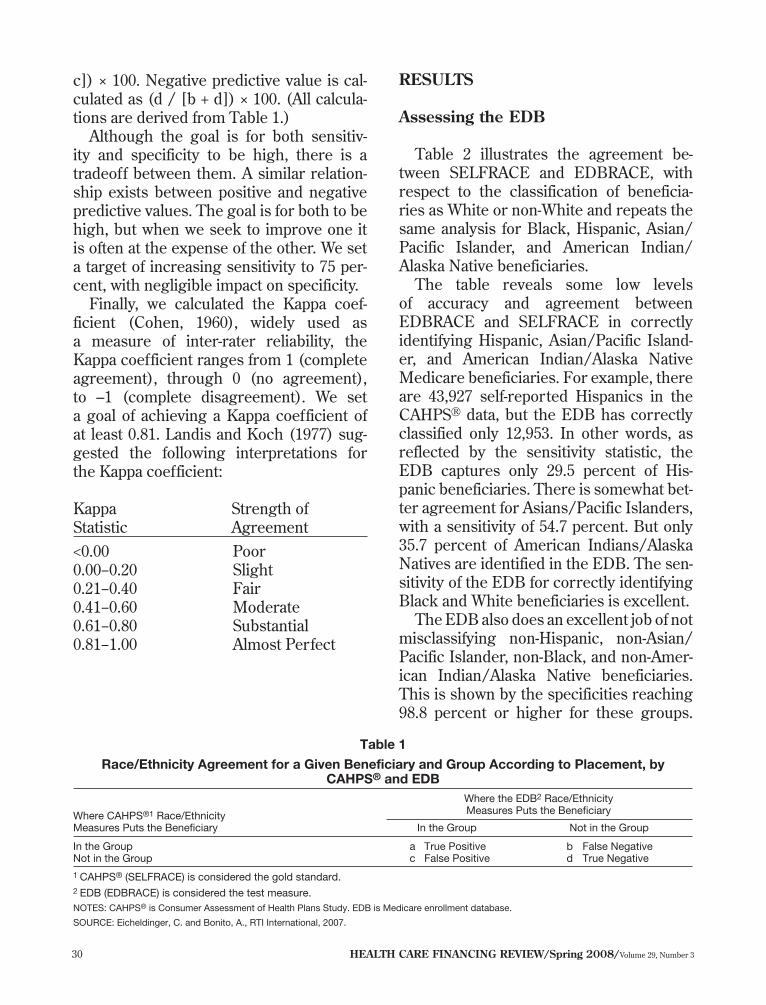
Using SELFRACE, we assessed EDBRACE using accuracy and agreement statistics (i.e., sensitivity, specificity, positive predictive value, negative predictive value, and the Kappa coefficient). Table 1 shows the association between EDBRACE and SELFRACE by measuring true positive (a)—EDBRACE and SELFRACE agree on the beneficiary’s race/ethnicity, false negative (b)—EDBRACE disagrees with SELFRACE on what the beneficiary’s race/ethnicity is not, false positive (c)EDBRACE disagrees with SELFRACE on what the beneficiary’s race/ethnicity is, and true negative (d)—EDBRACE and SELFRACE agree on what the beneficiary’s race/ethnicity is not.
Sensitivity represents how successful EDBRACE was at correctly identifying a beneficiary’s race/ethnicity and is calculated as (a / [a + b]) × 100. Specificity indicates how often the EDBRACE variable correctly identified persons who are not in a given racial/ethnic group and is calculated as (d / [c + d]) × 100. Positive predictive value is calculated as (a / [a +
3 Since the EDB did not have an equivalent category, we did not include the small number of beneficiaries coded this way in our analyses.
HealtH Care FinanCing review/Spring 2008/Volume 29, Number 3 29
Where CAHPS®1 Race/Ethnicity
Where the EDB2 Race/Ethnicity Measures Puts the Beneficiary
Measures Puts the Beneficiary
In the Group
I
a
n the Group
True Positive
N
b
ot in the Group
False Negative� Not in the Group c False Positive d True Negative�
HealtH Care FinanCing review/Spring 2008/Volume 29, Number 3 30
c]) × 100. Negative predictive value is calculated as (d / [b + d]) × 100. (All calculations are derived from Table 1.)
Although the goal is for both sensitivity and specificity to be high, there is a tradeoff between them. A similar relationship exists between positive and negative predictive values. The goal is for both to be high, but when we seek to improve one it is often at the expense of the other. We set a target of increasing sensitivity to 75 percent, with negligible impact on specificity.
Finally, we calculated the Kappa coefficient (Cohen, 1960), widely used as a measure of inter-rater reliability, the Kappa coefficient ranges from 1 (complete agreement), through 0 (no agreement), to –1 (complete disagreement). We set a goal of achieving a Kappa coefficient of at least 0.81. Landis and Koch (1977) suggested the following interpretations for the Kappa coefficient:
Kappa Statistic
Strength of Agreement
<0.00 Poor 0.00−0.20 Slight 0.21−0.40 Fair 0.41−0.60 Moderate 0.61−0.80 Substantial 0.81−1.00 Almost Perfect
reSultS
assessing the edB
Table 2 illustrates the agreement between SELFRACE and EDBRACE, with respect to the classification of beneficiaries as White or non-White and repeats the same analysis for Black, Hispanic, Asian/ Pacific Islander, and American Indian/ Alaska Native beneficiaries.
The table reveals some low levels of accuracy and agreement between EDBRACE and SELFRACE in correctly identifying Hispanic, Asian/Pacific Islander, and American Indian/Alaska Native Medicare beneficiaries. For example, there are 43,927 self-reported Hispanics in the CAHPS® data, but the EDB has correctly classified only 12,953. In other words, as reflected by the sensitivity statistic, the EDB captures only 29.5 percent of Hispanic beneficiaries. There is somewhat better agreement for Asians/Pacific Islanders, with a sensitivity of 54.7 percent. But only 35.7 percent of American Indians/Alaska Natives are identified in the EDB. The sensitivity of the EDB for correctly identifying Black and White beneficiaries is excellent.
The EDB also does an excellent job of not misclassifying non-Hispanic, non-Asian/ Pacific Islander, non-Black, and non-American Indian/Alaska Native beneficiaries. This is shown by the specificities reaching 98.8 percent or higher for these groups.
Table 1
Race/Ethnicity Agreement for a Given Beneficiary and Group According to Placement, by CAHPS® and EDB�
1 CAHPS® (SELFRACE) is considered the gold standard. 2 EDB (EDBRACE) is considered the test measure. NOTES: CAHPS® is Consumer Assessment of Health Plans Study. EDB is Medicare enrollment database.
SOURCE: Eicheldinger, C. and Bonito, A., RTI International, 2007.

Table 2�
Accuracy and Agreement Between SELFRACE and EDBRACE�
Accuracy and Agreement Measures for EDBRACE
Reference Group SELFRACE Assignment
EDBRACE Assignment
Yes No Sensitivity Specificity
Positive Predictive Value
Negative Predictive Value Kappa
Percent
White Yes No
667,573 60,794
4,420 97,941
99.3 61.7 91.7 95.7 0.71
Black Yes No
57,867 9,209
1,515 762,137
97.4 98.8 86.3 99.8 0.91
Hispanic Yes No
12,953 1,025
30,974 785,776
29.5 99.9 92.7 96.2 0.43
Asian/Pacific Islander Yes No
8,008 1,469
6,626 814,625
54.7 99.8 84.5 99.2 0.66
American Indian/ Alaska Native
Yes No
1,194 799
2,150 826,585
35.7 99.9 59.9 99.7 0.45
Other/Unknown Yes No
478 9,357
27,158 793,735
1.7 98.8 4.9 96.7 0.01
NOTES: EDBRACE is the unadjusted variable from the mid-July 2003 Medicare EDB for beneficiaries responding to the CAPHS® fee-for-service, managed care enrollee, and disenrollee surveys for 2000-2002. SELFRACE is the variable for respondents from the CAHPS® fee-for-service, managed care enrollee, and disenrollee surveys for 2000-2002.
SOURCE: Eicheldinger, C. and Bonito, A., RTI International, 2007.
However, the specificity is considerably lower for White beneficiaries, only 61.7 percent indicating 60,794 of the 158,735 non-White beneficiaries are mistakenly identified as White in the EDB. This supports the suggestion that many beneficiaries classified as White in the EDB actually belong in another category.
The overall level of agreement, reflected in the Kappa coefficients, is only moderate for Hispanics, Asians/Pacific Islanders, and American Indians/Alaska Natives—0.43, 0.66, and 0.45, respectively. We speculate that many Hispanic, Asian/Pacific Islander, and American Indian/Alaska Native beneficiaries were coded as White because the appropriate categories were unavailable until relatively recently. While the Kappa for White beneficiaries is substantial (0.71), it is not as high as we would like, undoubtedly reflecting their rather low specificity.
improving the Coding on the edB
In light of the low sensitivity for Hispanics and Asians/Pacific Islanders in the
EDB, we developed separate Hispanic and Asian/Pacific Islander imputation algorithms. These algorithms used the following pieces of EDB information: • LANGPREF or the language a benefi
ciary prefers CMS use when sending the Medicare Handbook. Allowed values are English, Spanish, and blank (no preference specified).
• LANGCD or the language a beneficiary has requested SSA use when sending beneficiary notices. This variable is used by CMS for Medicare premium bills. English, Spanish, and blank are the allowed values.
• RACESRC or the source of a beneficiary’s EDB race/ethnicity code. Three values are allowed: A = Response from a one-time survey that
was mailed to 2.2 million in 1997. B = Data from the Indian Health Service. Blank = Data from the SSA’s—Master
Beneficiary Record (SSA-MBR), SS-5 form (NUMIDENT), or Railroad Retirement Board (RRB).
HealtH Care FinanCing review/Spring 2008/Volume 29, Number 3 31

• The State in which a beneficiary resides so we could identify beneficiaries living in Hawaii and Puerto Rico. At the core of the algorithm were His
panic (Word and Perkins, 1996) and Asian/ Pacific Islander (Falkenstein and Word, 2002) surname lists developed at the U.S. Census Bureau. Associated with each name on the list was the proportion of times a household headed by a person with a particular surname was indeed a Hispanic (or Asian/Pacific Islander) household, as reported to the U.S. Census. In addition to the surname lists we also included in the algorithm a list of common Hispanic and Asian/Pacific Islander first names.
We incorporated these pieces of information into a SAS® program that, through an iterative process, created two new variables for every beneficiary. The first, NEWHISPANIC, identified each beneficiary as Hispanic or not. The second, NEWAPI, identified each beneficiary as Asian/Pacific Islander or not. The logic of the algorithm used to create NEWHISPANIC follows as well as a description of how NEWAPI was created and how the two were combined to create NEWRACE.
NEWHISPANIC was turned on if any of the following criteria were met: • The beneficiary’s surname matched the
Hispanic surname list and the assigned percentage from the list was at least 70 percent.
• The EDB coded the beneficiary as Hispanic.
• The person was living in Puerto Rico. • The variable LANGCD indicated Spanish. • The beneficiary’s first name had
Hispanic origins, and the beneficiary’s surname matched the Hispanic surname list with the assigned percentage of at least 50 percent.
NEWHISPANIC was turned off if any of the following criteria were met4: • The beneficiary was not identified as
Hispanic in the previously mentioned steps.
• LANGPREF indicated English. • RACESRC indicated the race code came
from the 1995 survey, and that race code was not Hispanic.
• RACESRC indicated the beneficiary’s race code came from the Indian Health Service. Similar logic was used to set the value of
NEWAPI with the exception that the EDB variables LANGCD and LANGPREF were not used because they did not contain an Asian/Pacific Islander language indicator.
Using the self-reported race/ethnicity data from the CAHPS® survey as the gold standard, we assessed the results of applying the algorithm to create the NEWHISPANIC and NEWAPI variables for the CAHPS® respondents. We found the algorithms significantly improved the EDB race/ethnicity categorization of Hispanic and Asian/Pacific Islander beneficiaries. Among Hispanic beneficiaries, sensitivity improved from 29.5 to 76.6 percent, the Kappa coefficient rose from 0.43 to 0.79, and the other measures (specificity and predictive values) remained virtually unchanged. The amount of improvement for Asian/Pacific Islander beneficiaries was not as dramatic but still impressive— sensitivity rose from 54.7 to 79.2 percent, Kappa increased from 0.66 to 0.80, and the other measures were not materially changed. Analysis of the improvements indicated that among both groups there were somewhat more males correctly identified than females (possibly because of intermarriage and surname changes for ethnic females), and more 65 to 74 year
4 The last three criteria listed for identifying whether a beneficiary was non-Hispanic had the effect of changing some beneficiaries identified by the first half of the algorithm as Hispanic back to non-Hispanic.
HealtH Care FinanCing review/Spring 2008/Volume 29, Number 3 32

EDBRACE NEWRACE SELFRACE
Race/Ethnicity Number Percent Number Percent Number Percent
White 728,367 87.7 704,185 84.8 671,993 80.9 Black 67,076 8.1 66,328 8.0 59,382 7.2 Hispanic 13,978 1.7 39,862 4.8 43,927 5.9
Asian/Pacific Islander 9,477 1.1 13,812 1.7 14,634 1.8 American Indian/Alaska Native 1,993 0.2 1,977 0.2 3,344 0.4
Other/Unknown 9,835 1.2 4,563 0.6 27,636 3.3
Table 3�
Comparison of EDBRACE, NEWRACE, and SELFRACE (CAHPS®) Distributions of Race/Ethnicity�Persons for
NOTES: EDBRACE is the unadjusted variable from the mid-July 2003 Medicare EDB for beneficiaries responding to the CAPHS® fee-for-service, managed care enrollee, and disenrollee surveys for 2000-2002. SELFRACE is the variable for respondents from the CAHPS® fee-for-service, man-aged care enrollee, and disenrollee surveys for 2000-2002. NEWRACE is the result of applying the race/ethnicity recoding algorithm to the Medicare EDB variable from mid-July 2003.
SOURCE: Eicheldinger, C. and Bonito, A., RTI International, 2007.
olds were correctly identified than those age 74 or over (probably because there are more beneficiaries in the younger age group).
Before merging the NEWHISPANIC and NEWAPI variables together we used the CAHPS® survey data to investigate the extent of possible overlap. We examined whether the same beneficiary was considered Hispanic by one algorithm and Asian/Pacific Islander by the other. Out of 830,728 beneficiaries, only 433 (0.05 percent) were labeled both Hispanic and Asian/Pacific Islander5. Because the overlap involved barely five-one-hundredths of 1 percent of CAHPS® respondents, we decided that it was not large enough to cause great concern when combining the two algorithms. The logic of combining the two surname algorithms used to create NEWRACE follows: • If the Hispanic algorithm identified
the beneficiary as Hispanic, then the NEWRACE variable was set to Hispanic.
• Otherwise6, if the Asian/Pacific Islander surname algorithm identified the beneficiary as Asian/Pacific Islander, then the
5 The overlap is due to surnames (likely Filipino) appearing on both the Hispanic and Asian/Pacific Islander surname lists. No overlap occurred on the first name lists. 6 If a beneficiary was identified as Hispanic and Asian or Pacific Islander, the beneficiary was considered Hispanic.
NEWRACE variable was set to Asian/ Pacific Islander. • Otherwise, NEWRACE was set equal to
the race/ethnicity coding of the original EDB race/ethnicity variable, EDBRACE. Table 3 presents a comparison of the
distribution of the three race/ethnicity variables—EDBRACE, SELFRACE, and NEWRACE—reported for the combined 2000-2002 pool of CAHPS® respondents. As expected, the numbers for NEWRACE are much closer to the self-reported gold standard of SELFRACE than for EDBRACE for Hispanics and Asians/Pacific Islanders. For White, the NEWRACE numbers also are closer to the SELFRACE numbers, probably because the EDB mislabeled a large proportion of Hispanic beneficiaries as White. As expected, the distribution of American Indians/Alaska Natives and Black beneficiaries changed little from one race/ethnicity variable to another because no direct effort was made to alter how they were coded.
Table 4 presents more detail on how the NEWRACE variable compares to EDBRACE and SELFRACE by sex and age group for Hispanics and Asians/Pacific Islanders. The EDBRACE/SELFRACE ratio shows that the EDB only represents a relatively small proportion of both males and females of all ages correctly for Hispanics (29.5 percent) and Asians/
HealtH Care FinanCing review/Spring 2008/Volume 29, Number 3 33
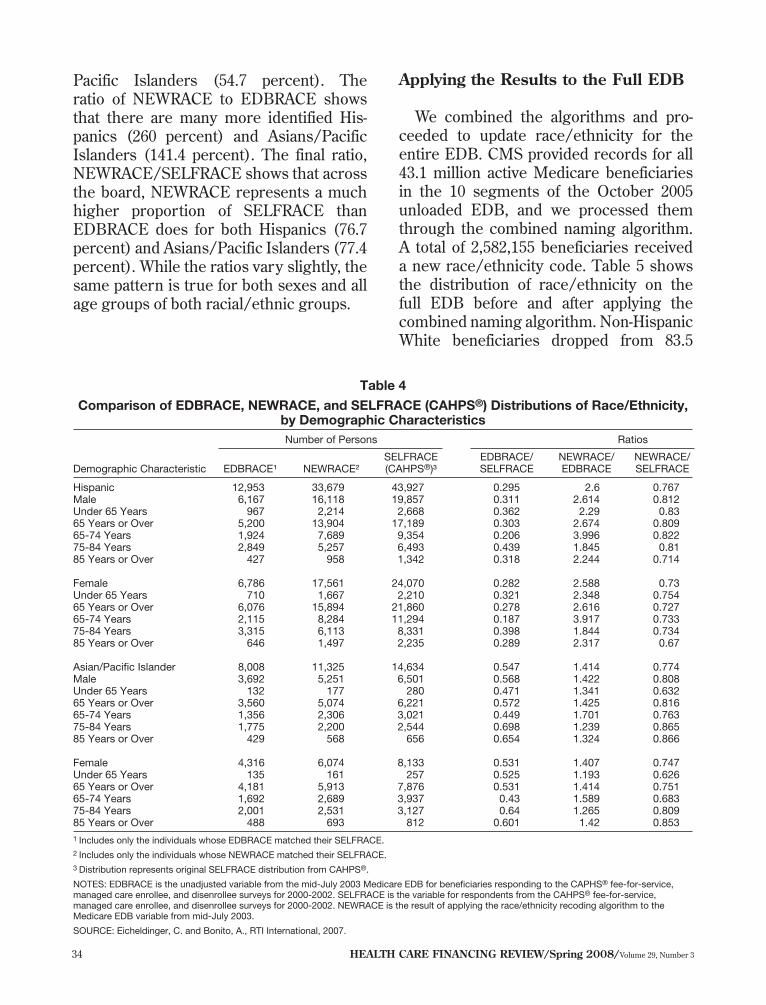
Pacific Islanders (54.7 percent). The ratio of NEWRACE to EDBRACE shows that there are many more identified Hispanics (260 percent) and Asians/Pacific Islanders (141.4 percent). The final ratio, NEWRACE/SELFRACE shows that across the board, NEWRACE represents a much higher proportion of SELFRACE than EDBRACE does for both Hispanics (76.7 percent) and Asians/Pacific Islanders (77.4 percent). While the ratios vary slightly, the same pattern is true for both sexes and all age groups of both racial/ethnic groups.
applying the results to the Full edB
We combined the algorithms and proceeded to update race/ethnicity for the entire EDB. CMS provided records for all 43.1 million active Medicare beneficiaries in the 10 segments of the October 2005 unloaded EDB, and we processed them through the combined naming algorithm. A total of 2,582,155 beneficiaries received a new race/ethnicity code. Table 5 shows the distribution of race/ethnicity on the full EDB before and after applying the combined naming algorithm. Non-Hispanic White beneficiaries dropped from 83.5
Table 4
Comparison of EDBRACE, NEWRACE, and SELFRACE (CAHPS®) Distributions of Race/Ethnicity, by Demographic Characteristics Number of Persons Ratios
SELFRACE (CAHPS®)³
EDBRACE/ SELFRACE
NEWRACE/ EDBRACE
NEWRACE/ SELFRACE Demographic Characteristic EDBRACE¹ NEWRACE²
Hispanic 12,953 33,679 43,927 0.295 2.6 0.767 Male 6,167 16,118 19,857 0.311 2.614 0.812 Under 65 Years 967 2,214 2,668 0.362 2.29 0.83 65 Years or Over 5,200 13,904 17,189 0.303 2.674 0.809 65-74 Years 1,924 7,689 9,354 0.206 3.996 0.822 75-84 Years 2,849 5,257 6,493 0.439 1.845 0.81 85 Years or Over 427 958 1,342 0.318 2.244 0.714
Female 6,786 17,561 24,070 0.282 2.588 0.73 Under 65 Years 710 1,667 2,210 0.321 2.348 0.754 65 Years or Over 6,076 15,894 21,860 0.278 2.616 0.727 65-74 Years 2,115 8,284 11,294 0.187 3.917 0.733 75-84 Years 3,315 6,113 8,331 0.398 1.844 0.734 85 Years or Over 646 1,497 2,235 0.289 2.317 0.67
Asian/Pacific Islander 8,008 11,325 14,634 0.547 1.414 0.774 Male 3,692 5,251 6,501 0.568 1.422 0.808 Under 65 Years 132 177 280 0.471 1.341 0.632 65 Years or Over 3,560 5,074 6,221 0.572 1.425 0.816 65-74 Years 1,356 2,306 3,021 0.449 1.701 0.763 75-84 Years 1,775 2,200 2,544 0.698 1.239 0.865 85 Years or Over 429 568 656 0.654 1.324 0.866
Female 4,316 6,074 8,133 0.531 1.407 0.747 Under 65 Years 135 161 257 0.525 1.193 0.626 65 Years or Over 4,181 5,913 7,876 0.531 1.414 0.751 65-74 Years 1,692 2,689 3,937 0.43 1.589 0.683 75-84 Years 2,001 2,531 3,127 0.64 1.265 0.809 85 Years or Over 488 693 812 0.601 1.42 0.853 1 Includes only the individuals whose EDBRACE matched their SELFRACE.�2 Includes only the individuals whose NEWRACE matched their SELFRACE.�3 Distribution represents original SELFRACE distribution from CAHPS®.�
NOTES: EDBRACE is the unadjusted variable from the mid-July 2003 Medicare EDB for beneficiaries responding to the CAPHS® fee-for-service, managed care enrollee, and disenrollee surveys for 2000-2002. SELFRACE is the variable for respondents from the CAHPS® fee-for-service, managed care enrollee, and disenrollee surveys for 2000-2002. NEWRACE is the result of applying the race/ethnicity recoding algorithm to the Medicare EDB variable from mid-July 2003.�
SOURCE: Eicheldinger, C. and Bonito, A., RTI International, 2007.�
HealtH Care FinanCing review/Spring 2008/Volume 29, Number 3 34
HealtH Care FinanCing review/Spring 2008/Volume 29, Number 3 35
Original EDB Race Variable (EDBRACE)
New EDB Race Variable (NEWRACE) Race/Ethnicity
Frequency Percent Frequency Percent White 35,994,152 83.5 34,088,099 79.1
Black 4,233,394 9.8 4,143,584 9.6
Hispanic 946,731 2.2 3,192,523 7.4
Asian/Pacific Islander 656,408 1.5 956,513 2.2
American Indian/Alaska Native 169,557 0.4 167,852 0.4
Other 980,040 2.3 455,328 1.1
Unknown 130,608 0.3 107,209 0.2
Missing 1,135 0 917 0
Total 43,112,025 100 43,112,025 100
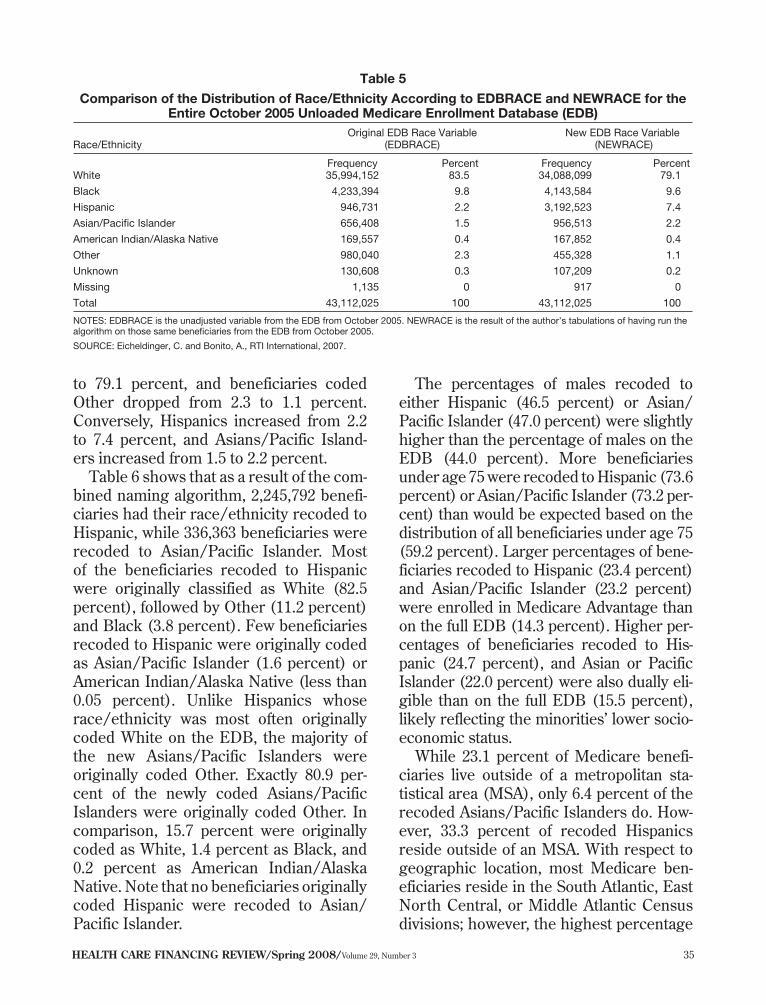
Table 5�
Comparison of the Distribution of Race/Ethnicity According to EDBRACE and NEWRACE for the Entire October 2005 Unloaded Medicare Enrollment Database (EDB)�
NOTES: EDBRACE is the unadjusted variable from the EDB from October 2005. NEWRACE is the result of the author’s tabulations of having run the algorithm on those same beneficiaries from the EDB from October 2005.
SOURCE: Eicheldinger, C. and Bonito, A., RTI International, 2007.
to 79.1 percent, and beneficiaries coded Other dropped from 2.3 to 1.1 percent. Conversely, Hispanics increased from 2.2 to 7.4 percent, and Asians/Pacific Islanders increased from 1.5 to 2.2 percent.
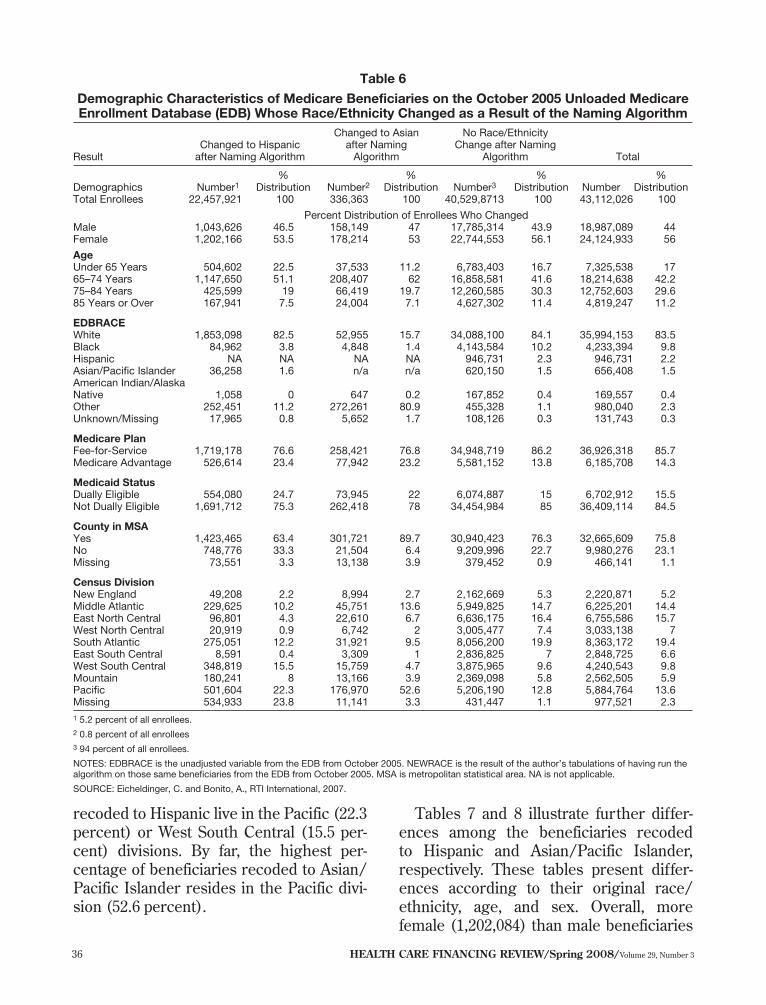
Table 6 shows that as a result of the combined naming algorithm, 2,245,792 beneficiaries had their race/ethnicity recoded to Hispanic, while 336,363 beneficiaries were recoded to Asian/Pacific Islander. Most of the beneficiaries recoded to Hispanic were originally classified as White (82.5 percent), followed by Other (11.2 percent) and Black (3.8 percent). Few beneficiaries recoded to Hispanic were originally coded as Asian/Pacific Islander (1.6 percent) or American Indian/Alaska Native (less than 0.05 percent). Unlike Hispanics whose race/ethnicity was most often originally coded White on the EDB, the majority of the new Asians/Pacific Islanders were originally coded Other. Exactly 80.9 percent of the newly coded Asians/Pacific Islanders were originally coded Other. In comparison, 15.7 percent were originally coded as White, 1.4 percent as Black, and 0.2 percent as American Indian/Alaska Native. Note that no beneficiaries originally coded Hispanic were recoded to Asian/ Pacific Islander.
The percentages of males recoded to either Hispanic (46.5 percent) or Asian/ Pacific Islander (47.0 percent) were slightly higher than the percentage of males on the EDB (44.0 percent). More beneficiaries under age 75 were recoded to Hispanic (73.6 percent) or Asian/Pacific Islander (73.2 percent) than would be expected based on the distribution of all beneficiaries under age 75 (59.2 percent). Larger percentages of beneficiaries recoded to Hispanic (23.4 percent) and Asian/Pacific Islander (23.2 percent) were enrolled in Medicare Advantage than on the full EDB (14.3 percent). Higher percentages of beneficiaries recoded to Hispanic (24.7 percent), and Asian or Pacific Islander (22.0 percent) were also dually eligible than on the full EDB (15.5 percent), likely reflecting the minorities’ lower socioeconomic status.
While 23.1 percent of Medicare beneficiaries live outside of a metropolitan statistical area (MSA), only 6.4 percent of the recoded Asians/Pacific Islanders do. However, 33.3 percent of recoded Hispanics reside outside of an MSA. With respect to geographic location, most Medicare beneficiaries reside in the South Atlantic, East North Central, or Middle Atlantic Census divisions; however, the highest percentage
HealtH Care FinanCing review/Spring 2008/Volume 29, Number 3 36
Percent Distribution of Enrollees Who Changed
Result Changed to Hispanic after Naming Algorithm
Changed to Asian after Naming Algorithm
No Race/Ethnicity Change after Naming
Algorithm Total
Demographics Number1 %
Distribution Number2 %
Distribution Number3 %
Distribution Number %
Distribution Total Enrollees 22,457,921 100 336,363 100 40,529,8713 100 43,112,026 100
Male 1,043,626 46.5 158,149 47 17,785,314 43.9 18,987,089 44 Female 1,202,166 53.5 178,214 53 22,744,553 56.1 24,124,933 56
Age Under 65 Years 504,602 22.5 37,533 11.2 6,783,403 16.7 7,325,538 17
65–74 Years 1,147,650 51.1 208,407 62 16,858,581 41.6 18,214,638 42.2 75–84 Years 425,599 19 66,419 19.7 12,260,585 30.3 12,752,603 29.6 85 Years or Over 167,941 7.5 24,004 7.1 4,627,302 11.4 4,819,247 11.2
EDBRACE White 1,853,098 82.5 52,955 15.7 34,088,100 84.1 35,994,153 83.5 Black 84,962 3.8 4,848 1.4 4,143,584 10.2 4,233,394 9.8 Hispanic NA NA NA NA 946,731 2.3 946,731 2.2
Asian/Pacific Islander 36,258 1.6 n/a n/a 620,150 1.5 656,408 1.5 American Indian/Alaska
Native 1,058 0 647 0.2 167,852 0.4 169,557 0.4 Other 252,451 11.2 272,261 80.9 455,328 1.1 980,040 2.3
Unknown/Missing 17,965 0.8 5,652 1.7 108,126 0.3 131,743 0.3
Medicare Plan Fee-for-Service 1,719,178 76.6 258,421 76.8 34,948,719 86.2 36,926,318 85.7
Medicare Advantage 526,614 23.4 77,942 23.2 5,581,152 13.8 6,185,708 14.3
Medicaid Status Dually Eligible 554,080 24.7 73,945 22 6,074,887 15 6,702,912 15.5 Not Dually Eligible 1,691,712 75.3 262,418 78 34,454,984 85 36,409,114 84.5
County in MSA Yes 1,423,465 63.4 301,721 89.7 30,940,423 76.3 32,665,609 75.8
No 748,776 33.3 21,504 6.4 9,209,996 22.7 9,980,276 23.1 Missing 73,551 3.3 13,138 3.9 379,452 0.9 466,141 1.1
Census Division New England 49,208 2.2 8,994 2.7 2,162,669 5.3 2,220,871 5.2 Middle Atlantic 229,625 10.2 45,751 13.6 5,949,825 14.7 6,225,201 14.4 East North Central 96,801 4.3 22,610 6.7 6,636,175 16.4 6,755,586 15.7 West North Central 20,919 0.9 6,742 2 3,005,477 7.4 3,033,138 7
South Atlantic 275,051 12.2 31,921 9.5 8,056,200 19.9 8,363,172 19.4 East South Central 8,591 0.4 3,309 1 2,836,825 7 2,848,725 6.6 West South Central 348,819 15.5 15,759 4.7 3,875,965 9.6 4,240,543 9.8
Mountain 180,241 8 13,166 3.9 2,369,098 5.8 2,562,505 5.9 Pacific 501,604 22.3 176,970 52.6 5,206,190 12.8 5,884,764 13.6 Missing 534,933 23.8 11,141 3.3 431,447 1.1 977,521 2.3
Table 6�
Demographic Characteristics of Medicare Beneficiaries on the October 2005 Unloaded Medicare Enrollment Database (EDB) Whose Race/Ethnicity Changed as a Result of the Naming Algorithm�
1 5.2 percent of all enrollees. 2 0.8 percent of all enrollees 3 94 percent of all enrollees.
NOTES: EDBRACE is the unadjusted variable from the EDB from October 2005. NEWRACE is the result of the author’s tabulations of having run the algorithm on those same beneficiaries from the EDB from October 2005. MSA is metropolitan statistical area. NA is not applicable.
SOURCE: Eicheldinger, C. and Bonito, A., RTI International, 2007.
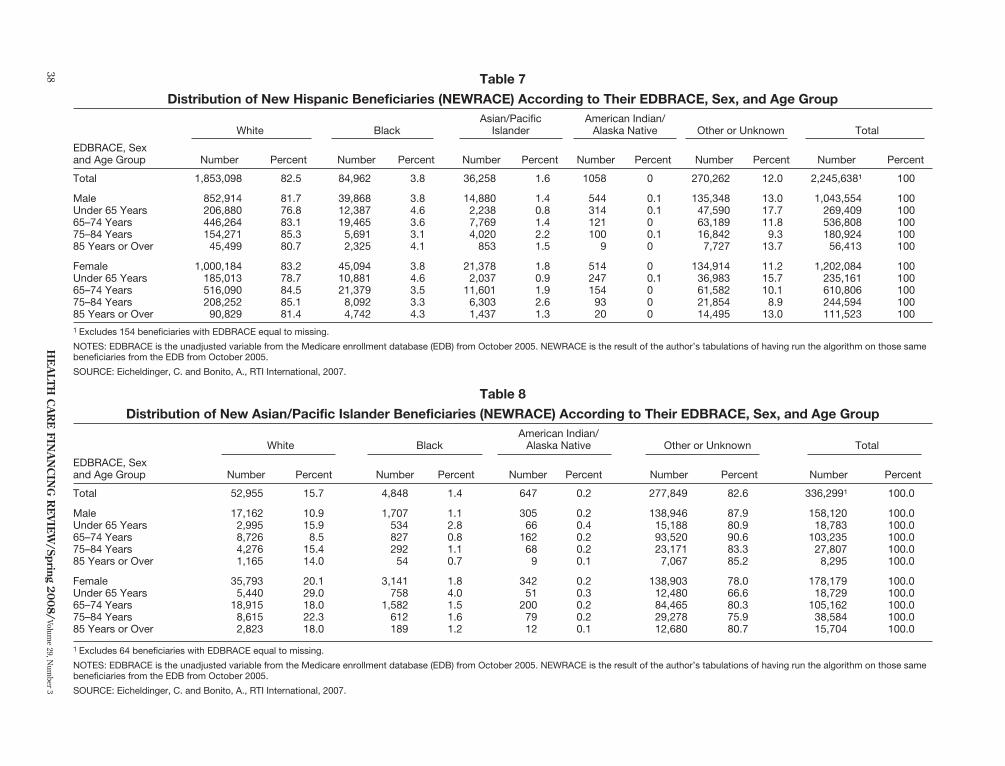
recoded to Hispanic live in the Pacific (22.3 Tables 7 and 8 illustrate further differ-percent) or West South Central (15.5 per- ences among the beneficiaries recoded cent) divisions. By far, the highest per- to Hispanic and Asian/Pacific Islander, centage of beneficiaries recoded to Asian/ respectively. These tables present differ-Pacific Islander resides in the Pacific divi- ences according to their original race/ sion (52.6 percent). ethnicity, age, and sex. Overall, more
female (1,202,084) than male beneficiaries

(1,043,554) were recoded to Hispanic. This pattern holds true for beneficiaries originally coded as White, Black, and Asian/ Pacific Islander. However, as shown in Table 6, there are more female beneficiaries in the EDB, and when sex distributions are compared, males are recoded at a higher percentage than would be expected. The largest number of new Hispanic beneficiaries is in the age group 65 to 74. This is true regardless of the beneficiaries’ original EDB race/ethnicity code and sex, with the exception of American Indians/Alaska Natives, where the largest group of new Hispanics was in the under age 65 category. Not surprisingly, the age group 85 or over had the fewest recoded, which reflects the overall age distribution of Medicare beneficiaries.
With respect to sex and age, the Asian/ Pacific Islander recodes were similar to the Hispanic recodes. Across original EDB race/ethnicity and age groups, with the exception of the American Indians/Alaska Natives under age 65 and the Other or Unknown groups under age 65, and those 65 to 74, more females were recoded to Asian/Pacific Islander than males. Overall 178,179 females were recoded compared with 158,120 males. As with Hispanic beneficiaries, beneficiaries age 65 to 74 were recoded most to Asian/Pacific Islander. Male and female Asians/Pacific Islanders followed the same overall pattern as male and female Hispanics, with the age group 85 or over having the least recodes, and the age group 65 to 74 having the most. Again, this reflects the overall age distribution of Medicare beneficiaries.
diSCuSSion
The importance of correctly identifying the race/ethnicity of Medicare beneficiaries when conducting studies of health services utilization cannot be overstated in
a period of sensitivity to reports of health care disparities. Often, results of health care utilization studies are used to justify the development of corrective health policy. These studies often use claims and measure the number and proportion of persons obtaining specific services for particular diagnoses. If the administrative records that are used to identify race/ethnicity systematically under-identify a large proportion of a particular racial/ethnic group, the number of service users identified in that group will be smaller than it actually is. This is exactly the case represented by Hispanics, Asians/Pacific Islanders, and American Indians/Alaska Natives on the Medicare EDB.
To illustrate the difference inaccurately coded race/ethnicity can make, we associated EDB race/ethnicity with participants in the 2000 and 2001 Medicare fee-forservice CAHPS® survey who self-reported their race/ethnicity. We determined whether the respondents were diabetic from their prior year’s Medicare claims. These are presented by race/ethnicity for SELFRACE, EDBRACE, and the ratio of the two in Table 9. Note that the number of Hispanics, Asians/Pacific Islanders, and American Indians/Alaska Natives with diabetes are considerably underestimated using EDBRACE. We also determined from these claims whether those identified as being diabetic had received each of four recommended diabetes secondary preventive services—foot care, eye exam, testing (Hemoglobin A1c, lipid profile, and micro-albumin), and self-care training and education. We divided the number of diabetic beneficiaries using the services in the previous year according to their self-reported race/ethnicity by the number using them according to their EDB race/ ethnicity to create a ratio for each service. We also calculated a mean ratio across the four services.
HealtH Care FinanCing review/Spring 2008/Volume 29, Number 3 37
Asian/Pacific Islander
American Indian/ Alaska Native White Black Other or Unknown Total
EDBRACE, Sexand Age Group Number Percent Number Percent Number Percent Number Percent Number Percent Number Percent
Total 1,853,098 82.5 84,962 3.8 36,258 1.6 1058 0 270,262 12.0 2,245,638¹ 100
Male 852,914 81.7 39,868 3.8 14,880 1.4 544 0.1 135,348 13.0 1,043,554 100 Under 65 Years 206,880 76.8 12,387 4.6 2,238 0.8 314 0.1 47,590 17.7 269,409 100
65–74 Years 446,264 83.1 19,465 3.6 7,769 1.4 121 0 63,189 11.8 536,808 100 75–84 Years 154,271 85.3 5,691 3.1 4,020 2.2 100 0.1 16,842 9.3 180,924 100 85 Years or Over 45,499 80.7 2,325 4.1 853 1.5 9 0 7,727 13.7 56,413 100
Female 1,000,184 83.2 45,094 3.8 21,378 1.8 514 0 134,914 11.2 1,202,084 100 Under 65 Years 185,013 78.7 10,881 4.6 2,037 0.9 247 0.1 36,983 15.7 235,161 100
65–74 Years 516,090 84.5 21,379 3.5 11,601 1.9 154 0 61,582 10.1 610,806 100 75–84 Years 208,252 85.1 8,092 3.3 6,303 2.6 93 0 21,854 8.9 244,594 100 85 Years or Over 90,829 81.4 4,742 4.3 1,437 1.3 20 0 14,495 13.0 111,523 100
American Indian/ Alaska Native White Black Other or Unknown Total
EDBRACE, Sex and Age Group Number Percent Number Percent Number Percent Number Percent Number Percent
Total 52,955 15.7 4,848 1.4 647 0.2 277,849
138,946 15,188 93,520 23,171 7,067
138,903 12,480 84,465 29,278 12,680
82.6 336,299¹ 100.0
Male 17,162 10.9 1,707 1.1 305 66 162 68 9
342 51 200 79 12
0.2 87.9 158,120 100.0 Under 65 Years 2,995 15.9 534 2.8 0.4 80.9 18,783 100.0
65–74 Years 8,726 8.5 827 0.8 0.2 90.6 103,235 100.0 75–84 Years 4,276 15.4 292 1.1 0.2 83.3 27,807 100.0 85 Years or Over 1,165 14.0 54 0.7 0.1 85.2 8,295 100.0
Female 35,793 20.1 3,141 1.8 0.2 78.0 178,179 100.0 Under 65 Years 5,440 29.0 758 4.0 0.3 66.6 18,729 100.0
65–74 Years 18,915 18.0 1,582 1.5 0.2 80.3 105,162 100.0 75–84 Years 8,615 22.3 612 1.6 0.2 75.9 38,584 100.0 85 Years or Over 2,823 18.0 189 1.2 0.1 80.7 15,704 100.0
He
altH
Ca
re
Fina
nC
ing
re
vie
w/Spring 2
00
8/
Volume 29, N
umber 3
Table 7
Distribution of New Hispanic Beneficiaries (NEWRACE) According to Their EDBRACE, Sex, and Age Group
1 Excludes 154 beneficiaries with EDBRACE equal to missing.
NOTES: EDBRACE is the unadjusted variable from the Medicare enrollment database (EDB) from October 2005. NEWRACE is the result of the author’s tabulations of having run the algorithm on those same
beneficiaries from the EDB from October 2005.
SOURCE: Eicheldinger, C. and Bonito, A., RTI International, 2007.�
Table 8
Distribution of New Asian/Pacific Islander Beneficiaries (NEWRACE) According to Their EDBRACE, Sex, and Age Group
1 Excludes 64 beneficiaries with EDBRACE equal to missing.
NOTES: EDBRACE is the unadjusted variable from the Medicare enrollment database (EDB) from October 2005. NEWRACE is the result of the author’s tabulations of having run the algorithm on those same
beneficiaries from the EDB from October 2005.
SOURCE: Eicheldinger, C. and Bonito, A., RTI International, 2007.�
38

Table 9�
Number and Percent of Medicare Beneficiaries With Diabetes Diagnosis, by EDBRACE and SELFRACE and Ratio of SELFRACE to EDBRACE�
EDBRACE SELFRACE Ratio1
Race/Ethnicity Number Percent Number Percent Numbers Percents
White 30,300 15.3 27,939 15.0 0.92 0.98
Black 3,869 24.6 3,463 24.7 0.90 1.00
Hispanic 835 27.2 2,254 25.5 2.70 0.94
Asian/Pacific Islander 316 15.7 437 15.5 1.38 0.98
American Indian/Alaska Native 103 27.5 263 23.3 2.55 0.85
Other/Unreported 374 17.5 1,441 17.0 3.85 0.97
1 The number of persons according to SELFRACE/number of persons according to EDBRACE and percent of persons according to SELFRACE/ percent of persons according to EDBRACE.
SOURCE: Eicheldinger, C. and Bonito, A., RTI International, 2007.
The mean ratios for White and Black beneficiaries were 0.93 and 0.90, respectively, suggesting that the counts based on their race/ethnicity self-reports were 7 and 10 percent lower than for their EDB race/ ethnicity. With ratios less than 1.00, it confirms the findings from our assessment of EDB race/ethnicity for White and Black beneficiaries. On the other hand, the mean ratios for Hispanics (2.53) and Asians/ Pacific Islanders (1.34) are greater than 1.00 for those groups, also confirming our earlier assessment of EDB race/ethnicity. This analysis indicates that using the numbers of diabetic Hispanic and Asian/ Pacific Islanders classified according to the EDB race variable would certainly under-count them, especially Hispanics, the largest and fastest growing minority group in the Nation.
Knowing that the number of beneficiaries included in a racial/ethnic group is too large or too small certainly places limitations on the use that can be made of the number. But, if the utilization patterns of the persons in those groups identified using administrative data are similar to those of persons who self-identified as being in the same group, then using the proportion of the group who used the services rather than the number may be unbiased and useful for many policy purposes.
We examined the utilization percentages for the same diabetes preventive services using ratios of the percentages (Table 10). The mean ratio across the four diabetes preventive services for White beneficiaries was 1.01, indicating only a 1-percent higher rate of use when self-reported race was used instead of the EDB race. The
Table 10
Ratios of Number of Medicare Beneficiaries With Diabetes Who Used Selected Diabetic Services, by Race/Ethnicity
Physiological Self-Care and Race/Ethnicity Foot Care Eye Exam Measures and Education Mean Ratio¹
White 0.99 1.01 1.01 1.01 1.01
Black 0.99 1.01 1.00 1.01 1.00
Hispanic 0.84 0.94 1.00 0.97 0.94
Asian/Pacific Islander 0.84 1.01 1.01 1.00 0.97
American Indian/Alaska Native 1.13 1.14 1.34 1.68 1.32
Other/Unreported 1.43 1.13 1.07 1.30 1.23
¹ The proportion of persons according to SELFRACE/proportion of persons according to EDBRACE.
SOURCE: Eicheldinger, C. and Bonito, A., RTI International, 2007.
HealtH Care FinanCing review/Spring 2008/Volume 29, Number 3 39

mean ratio for Black beneficiaries was 1.00, indicting that the average percentage using the four services was the same, regardless of the race measure used. Thus for White and Black beneficiaries, despite their overrepresentation according to the EDB race variable, the percentages using these services are fairly accurate. However, the situation was different for Hispanics and Asians/Pacific Islanders. The mean ratios for Hispanics and Asians/Pacific Islanders were 0.94 and 0.97, respectively. This indicates that classifying beneficiaries according to their EDB race overstates the proportion of Hispanics and Asians/ Pacific Islanders receiving diabetes preventive services by 6 and 3 percentage points, respectively.7
liMitationS
While we have demonstrated a sizable improvement in the Medicare EDB racial/ ethnic coding with our algorithm, we would be remiss if we did not acknowledge the limits of this work. Our focus in this research was solely on improving the accurate identification of Medicare beneficiaries on the EDB who are Hispanic (regardless of race) and Asian/Pacific Islanders. Validation of the algorithm showed that it is not perfect in identifying every misclassified Hispanic and Asian/Pacific Islander beneficiary, but it does represent an important improvement. We were clearly more successful with Hispanics than with Asians/ Pacific Islanders. However, our algorithm did nothing to improve identification of American Indians/Alaska Natives, thus this group remains underrepresented on the EDB. We feel that analyses of Medicare claims that seek to identify or monitor differences in racial/ethnic disparities in health services utilization can justifiably
7 Bonito et al. (2005) present more of these types of comparison of the impacts on services utilization.
be extended to include comparisons of Hispanic and Asian/Pacific Islander along with Black and White beneficiaries. However, we suggest continued restraint and caution be exercised in comparisons involving American Indians/Alaska Natives due to their relatively small numbers and incomplete representation in the EDB coding.
It is also limiting that the imputation process for the race/ethnicity variable on the EDB must be redone or updated every 6 to 12 months to make that variable current for beneficiaries new to the Medicare Program. Every 6 months, approximately 2 million new beneficiaries are added to the Medicare Program, and our update of the NEWRACE variable for mid-2006 indicates that more than 400,000 of them are either Hispanics or Asians/Pacific Islanders. Thus to keep the variable current, updating with the algorithm is essential.
ConCluSionS
We used readily available data to address a longstanding limitation of Medicare coding of beneficiary race/ethnicity. The race/ ethnicity codes on the EDB were populated with the SSA codes, and prior to 1980 these codes were limited to White, Black, and Other. Hispanics, Asians/Pacific Islanders, and American Indians/Alaska Natives were all incorrectly lumped together as Other or coded as White or Black. The effect of this has been to limit most analyses of racial/ethnic differences among Medicare beneficiaries to comparisons between White and Black persons. Despite repeated efforts by CMS to correct the race/ethnicity codes dating back to 1994, we found their sensitivities wanting. We developed and tested an algorithm largely using surname lists accumulated by the U.S. Census Bureau that allowed us to more correctly impute race/ethnicity codes for Medicare beneficiaries of Hispanic and
HealtH Care FinanCing review/Spring 2008/Volume 29, Number 3 40
Asian/Pacific Islander origin. The algorithm increased the number of identified Hispanics by more than three times, and the number of Asians/Pacific Islanders by almost one-third, producing significantly higher sensitivities.
implications
The primary implication of having developed a scientifically sound method to more accurately assign Medicare beneficiary’s race/ethnicity codes for Hispanic and Asian/Pacific Islander is to greatly enlarge the potential analytic and policy uses of Medicare administrative data, especially with regard to issues of health care disparities and equity. It is particularly important to be able to discuss disparities beyond those experienced by Black beneficiaries alone, especially since Hispanics now are the largest and fastest growing minority group in the U.S. It means that it is possible to validly and reliably report health services utilization according to race/ethnicity for more than White and Black beneficiaries. It means that efforts to identify health care disparities between Medicare beneficiaries who are White, Black, Hispanic, or Asian/Pacific Islander can safely proceed. Finally, it means it is possible to monitor efforts being made to reduce or eliminate health care disparities among these groups.
In addition to contributing to research and policy on eliminating health care disparities, having more accurate race/ ethnicity data makes it possible for CMS to monitor the participation in new and existing Medicare Program options (e.g., Medicare Part D or Medicare Advantage plans) by racial/ethnic groups. It also allows CMS to target information and enrollment efforts to minority group beneficiaries about programs for which they
may be eligible, but in which they do not appear to be participating adequately.
aCknowledgMentS
We gratefully acknowledge Linda Greenberg for her direction and assistance in the successful completion of the research project from which this article was derived and Lisa Carpenter for her statistical programming.
reFerenCeS
Arday, S.L., Arday, D.R., Monroe, S., et al.: HCFA’s Racial and Ethnic Data: Current Accuracy and Recent Improvements. Health Care Financing Review 21(4):107–116, Summer 2000. Bonito, A.J., Eicheldinger, C.R., Evensen, C., et al.: Health Disparities: Measuring Health Care Use and Access for Racial/Ethnic Populations. RTI Final Report for Project Number 0207964.008 to the Centers for Medicare & Medicaid Services. Contract Number 500-00-0024(TO8). Research Triangle Park. North Carolina. 2005. Cohen, J.: A Coefficient of Agreement for Nominal Scales. Educational and Psychological Measurement 20:37–46, 1960. Eggers, P.W. and Greenberg, L.G.: Racial and Ethnic Differences in Hospitalization Rates Among Aged Medicare Beneficiaries. Health Care Financing Review 21(4):81-95, Summer 2000. Falkenstein, M.R. and Word, D.L.: The Asian and Pacific Islander Surname List: As Developed from Census 2000. U.S. Bureau of the Census. December 2002. Landis, J.R. and Koch, G.G.: The Measurement of Observer Agreement for Categorical Data. Biometrics 33:159–174, 1977. Lauderdale, D.S. and Goldberg, J.: The Expanded Racial and Ethnic Codes in the Medicare Data Files: Their Completeness of Coverage and Accuracy. American Journal of Public Health 86(5):712–716, May 1996. Scott, C.G.: Identifying the Race or Ethnicity of SSI Recipients. Social Security Bulletin 62(4): 9-20, 1999. Word, D.L. and Perkins, R.C. Jr.: Building a Spanish Surname List for the 1990’s—A New Approach to an Old Problem. Bureau of the Census. Population Division Technical Working Paper No. 13.
HealtH Care FinanCing review/Spring 2008/Volume 29, Number 3 41

March 1996. Internet address: http://www. Reprint Requests: Celia R. Eicheldinger, RTI International, 3040 Cornwallis Road, Research Triangle Park, NC 27709. E-mail: census.gov/population/documentation/twpno13. [email protected] pdf. (Accessed 2007.)
Waldo, D.R.: Accuracy and Bias of Race/Ethnicity Codes in the Medicare Enrollment Database. Health Care Financing Review 26(2):61-72, Winter 2004-2005.
HealtH Care FinanCing review/Spring 2008/Volume 29, Number 3 42