Embed Size (px)
Citation preview
Morbidity and Mortality Weekly Report
Weekly July 5, 2002 / Vol. 51 / No. 26
Centers for Disease Control and PreventionCenters for Disease Control and PreventionCenters for Disease Control and PreventionCenters for Disease Control and PreventionCenters for Disease Control and PreventionSAFER • HEALSAFER • HEALSAFER • HEALSAFER • HEALSAFER • HEALTHIER • PEOPLETHIER • PEOPLETHIER • PEOPLETHIER • PEOPLETHIER • PEOPLETM
INSIDE
567 Heat-Related Deaths — Four States, July–August 2001,and United States, 1979–1999
570 Injuries and Deaths Among Children Left Unattendedin or Around Motor Vehicles — United States, July 2000–June 2001
572 Certification of Poliomyelitis Eradication — EuropeanRegion, June 2002
574 Food and Drug Administration Approval of a FifthAcellular Pertussis Vaccine for Use Among Infants andYoung Children — United States, 2002
Staphylococcus aureus Resistant to Vancomycin — United States, 2002Staphylococcus aureus is a cause of hospital- and community-
acquired infections (1,2). In 1996, the first clinical isolate ofS. aureus with reduced susceptibility to vancomycin wasreported from Japan (3). The vancomycin minimum inhibi-tory concentration (MIC) result reported for this isolate wasin the intermediate range (vancomycin MIC=8 µg/mL) usinginterpretive criteria defined by the National Committee forClinical Laboratory Standards (4). As of June 2002, eightpatients with clinical infections caused by vancomycin-intermediate S. aureus (VISA) have been confirmed in theUnited States (5,6). This report describes the first documentedcase of infection caused by vancomycin-resistant S. aureus(VRSA) (vancomycin MIC >32 µg/mL) in a patient in theUnited States. The emergence of VRSA underscores the needfor programs to prevent the spread of antimicrobial-resistant microorganisms and control the use of anti-microbial drugs in health-care settings.
In June 2002, VRSA was isolated from a swab obtainedfrom a catheter exit site from a Michigan resident aged 40years with diabetes, peripheral vascular disease, and chronicrenal failure. The patient received dialysis at an outpatientfacility (dialysis center A). Since April 2001, the patient hadbeen treated for chronic foot ulcerations with multiple coursesof antimicrobial therapy, some of which included vancomy-cin. In April 2002, the patient underwent amputation of agangrenous toe and subsequently developed methicillin-resistant S. aureus bacteremia caused by an infected arterio-venous hemodialysis graft. The infection was treated with van-comycin, rifampin, and removal of the infected graft. In June,the patient developed a suspected catheter exit-site infection,and the temporary dialysis catheter was removed; cultures ofthe exit site and catheter tip subsequently grew S. aureus resis-tant to oxacillin (MIC >16 µg/mL) and vancomycin (MIC>128 µg/mL). A week after catheter removal, the exit siteappeared healed; however, the patient’s chronic foot ulcer
appeared infected. VRSA, vancomycin-resistant Enterococcusfaecalis (VRE), and Klebsiella oxytoca also were recovered froma culture of the ulcer. Swab cultures of the patient’s healedcatheter exit site and anterior nares did not grow VRSA. Todate, the patient is clinically stable, and the infection isresponding to outpatient treatment consisting of aggressivewound care and systemic antimicrobial therapy withtrimethroprim/sulfamethoxazole.
The VRSA isolate recovered from the catheter exit site wasidentified initially at a local hospital laboratory using com-mercial MIC testing and was confirmed by the MichiganDepartment of Community Health and CDC. Identificationmethods used at CDC included traditional biochemical testsand DNA sequence analysis of gyrA and the gene encoding16S ribosomal RNA. Molecular tests for genes unique toenterococci were negative. The MIC results for vancomycin,teicoplaninin, and oxacillin were >128 µg/mL, 32 µg/mL, and>16 µg/mL, respectively, by the broth microdilution method.The isolate contained the vanA vancomycin resistance genefrom enterococci, which is consistent with the glycopeptideMIC profiles. It also contained the oxacillin-resistance genemecA. The isolate was susceptible to chloramphenicol
566 MMWR July 5, 2002
SUGGESTED CITATIONCenters for Disease Control and Prevention. [ArticleTitle]. MMWR 2002;51:[inclusive page numbers].
Centers for Disease Control and Prevention
Julie L. Gerberding, M.D.Director
David W. Fleming, M.D.Deputy Director for Science and Public Health
Dixie E. Snider, Jr., M.D., M.P.H.Associate Director for Science
Epidemiology Program Office
Stephen B. Thacker, M.D., M.Sc.Director
Office of Scientific and Health Communications
John W. Ward, M.D.Director
Editor, MMWR Series
David C. JohnsonActing Managing Editor, MMWR (Weekly)
Jude C. RutledgeTeresa F. Rutledge
Jeffrey D. Sokolow, M.A.Writers/Editors, MMWR (Weekly)
Lynda G. CupellMalbea A. HeilmanBeverly J. Holland
Visual Information Specialists
Quang M. DoanErica R. Shaver
Information Technology Specialists
Division of Public Health Surveillanceand Informatics
Notifiable Disease Morbidity and 122 Cities Mortality DataRobert F. Fagan
Deborah A. AdamsFelicia J. ConnorLateka Dammond
Patsy A. HallPearl C. Sharp
The MMWR series of publications is published by theEpidemiology Program Office, Centers for Disease Controland Prevention (CDC), U.S. Department of Health andHuman Services, Atlanta, GA 30333.
linezolid, minocycline, quinupristin/dalfopristin, tetracycline,and trimethoprim/sulfamethoxazole.
Epidemiologic and laboratory investigations are under wayto assess the risk for transmission of VRSA to otherpatients, health-care workers, and close family and othercontacts. To date, no VRSA transmission has been identified.
Infection-control practices in dialysis center A were assessed;all health-care workers followed standard precautions consis-tent with CDC guidelines (7). After the identification ofVRSA, dialysis center A initiated special precautions on thebasis of CDC recommendations (8), including using gloves,gowns, and masks for all contacts with the patient; perform-ing dialysis with a dedicated dialysis machine during the lastshift of the day in an area separate from other patients; hav-ing a dialysis technician dedicated to providing care for thepatient; using dedicated, noncritical patient-care items; andenhancing education of staff members about appropriateinfection-control practices. Assessment of infection-controlpractices in other health-care settings in which the patientwas treated is ongoing.Reported by: DM Sievert, MS, ML Boulton, MD, G Stoltman, PhD,D Johnson, MD, MG Stobierski, DVM, FP Downes, DrPH, PA Somsel,DrPH, JT Rudrik, PhD, Michigan Dept of Community Health;W Brown, PhD, W Hafeez, MD, T Lundstrom, MD, E Flanagan,Detroit Medical Center; R Johnson, MD, Detroit; J Mitchell, OakwoodHealth Care System, Dearborn, Michigan. Div of Healthcare QualityPromotion, Div of Bacterial and Mycotic Diseases, National Center forInfectious Diseases; S Chang, MD, EIS Officer, CDC.
Editorial Note: This report describes the first clinical isolateof S. aureus that is fully resistant to vancomycin. S. aureuscauses a wide range of human infections and is an importantcause of health-care associated infections. The introductionof new classes of antimicrobials usually has been followed byemergence of resistance in S. aureus. After the initial successof penicillin in treating S. aureus infection, penicillin-resistant S. aureus became a major threat in hospitals and nurs-eries in the 1950s, requiring the use of methicillin and relateddrugs for treatment of S. aureus infections. In the 1980s,methicillin-resistant S. aureus emerged and became endemicin many hospitals, leading to increasing use of vancomycin.In the late 1990s, cases of VISA were reported.
Although the acquired vancomycin-resistance determinantsvanA, vanB, vanD, vanE, vanF, and vanG have beenreported from VRE, these resistance determinants have notpreviously been identified in clinical isolates of S. aureus (9).Conjugative transfer of the vanA gene from enterococci toS. aureus has been demonstrated in vitro (10). The presenceof vanA in this VRSA suggests that the resistance determi-nant might have been acquired through exchange of geneticmaterial from the vancomycin-resistant enterococcus also
Vol. 51 / No. 26 MMWR 567
* The National Weather Service issues a heat advisory when the maximumdaytime heat index is expected to be >105º F (40.6º C) and the minimumnighttime heat index is expected to be 80º F (26.7º C) for 2 or more consecutivedays. The heat index takes into account air temperature and relative humidityand indicates the actual feel of the temperature to the body.
isolated from the swab culture. This VRSA isolate is suscep-tible in vitro to several antimicrobial agents, including anti-microbials recently approved by the Food and DrugAdministration (i.e., linezolid and quinupristin/dalfopristin)with activity against glycopeptide-resistant Gram-positivemicroorganisms.
In 1997, the Healthcare Infection Control Practices Advi-sory Committee published guidelines for the prevention andcontrol of staphylococcal infection associated with reducedsusceptibility to vancomycin (8); plans to contain VISA/VRSAon the basis of CDC recommendations have been establishedin some state health departments. In the health-care setting, apatient with VISA/VRSA should be placed in a private roomand have dedicated patient-care items. Health-care workersproviding care to such patients should follow contact precau-tions (i.e., wearing gowns, masks, and gloves and using anti-bacterial soap for hand washing). These control measures wereadopted by dialysis center A immediately following confir-mation of the VRSA isolate. To date, there has been no docu-mented spread of this microorganism to other patients orhealth-care workers.
Strategies to improve adherence to current guidelinesto prevent transmission of antimicrobial resistant micro-organisms in health-care settings should be a priority for allhealth-care facilities in the United States. S. aureus should betested for resistance to vancomycin using a MIC method. Theisolation of S. aureus with confirmed or presumptive vanco-mycin resistance should be reported immediately through stateand local health departments to the Division of HealthcareQuality Promotion, National Center for Infectious Diseases,CDC, telephone 800-893-0485.References1. CDC. National Nosocomial Infections Surveillance report, data sum-
mary from October 1986–April 1996, issued May 1996. Am J InfectControl 1996;24:380–8.
2. Waldvogel FA. Staphylococcus aureus (including toxic shock syndrome).In: Mandell GL, Bennett JE, Dolin R, eds. Mandell, Douglas andBenett’s Principles and Practice of Infectious Diseases, 4th ed. NewYork, New York: Churchill Livingstone, 1995:1754–77.
3. Hiramatsu K, Hanaki H, Ino T, Yabuta K, Oguri T, Tenover FC.Methicillin-resistant Staphylococcus aureus clinical strain with reducedvancomycin susceptibility. J Antimicrob Chemother 1997;40:135–6.
4. National Committee for Clinical Laboratory Standards. Methods fordilution antimicrobial susceptibility tests for bacteria that grow aero-bically. 5th ed. Approved standard, M7-A5. Wayne, Pennsylvania:National Committee for Clinical Laboratory Standards, 2000.
5. Smith TL, Pearson ML, Wilcox KR, et al. Emergence of vancomycinresistance in Staphylococcus aureus. N Engl J Med 1999;340:493–501.
6. Fridkin SK. Vancomycin-intermediate and -resistant Staphylococcusaureus: what the infectious disease specialist needs to know. ClinInfect Dis. 2001;32:108–15.
7. CDC. Recommendations for preventing transmission of infectionsamong chronic hemodialysis patients. MMWR 2001;50(RR-5).
8. CDC. Interim guidelines for prevention and control of staphylococcalinfections associated with reduced susceptibility to vancomycin.MMWR 1997;46:626–8,635.
9. Woodford N. Epidemiology of the genetic elements responsible foracquired glycopeptide resistance in enterococci. Microb Drug Resist2001;7:229–36.
10. Noble WC, Virani Z, Cree RG. Co-transfer of vancomycin and otherresistance genes from Enterococcus faecalis NCTC 12201 to Staphylo-coccus aureus. FEMS Microbiol Lett 1992;93:195–8.
Heat-Related Deaths — Four States,July–August 2001,
and United States, 1979–1999Each year in the United States, approximately 400 deaths
are attributed to excessive natural heat; these deaths arepreventable (1). This report describes heat-related deaths inMissouri, New Mexico, Oklahoma, and Texas when elevatedtemperatures were recorded for several consecutive days dur-ing July–August 2001; summarizes heat-related deaths in theUnited States during 1979–1999; and presents risk factorsand preventive measures associated with heat-related illnessand death, especially in susceptible populations.
In late July 2001, the National Oceanographic and Atmo-spheric Association (NOAA) reported temperatures averag-ing 5º F (-15º C)–10º F (-12º C) above normal in the southernplains states (2). The intense heat and humidity promptedNOAA’s National Weather Service to issue heat advisories* inMissouri, New Mexico, Oklahoma, and Texas (2; MissouriDepartment of Health and Senior Services, personal com-munication 2002). During July–August 2001, a total of 95deaths was attributed to excessive natural heat in the affectedstates. Provisional mortality statistics were obtained from thevital statistics section of each state, and information aboutunderlying cause of death, age, sex, date of death, and con-tributing causes were provided. Peak mortality occurred dur-ing the reported 8-day heat advisory period (Figure 1). Six(6%) deaths occurred among children aged <4 years and 42(41%) among persons aged >75 years; 69 (73%) deathsoccurred among males.
Case Reports Case 1. In Oklahoma in mid-July 2001, a man aged 29
years was found disoriented and wandering in a commercialparking lot. He apparently had fallen and had abrasions onhis knees and a broken tooth. In the emergency department,

568 MMWR July 5, 2002
he was semiconscious but combative. His rectal temperatureincreased from 105.4º F (40.7º C) to 107.8º F (42.1º C) in<1 hour. Despite medical treatment for hyperthermia, he waspronounced dead 22 hours after being found. Laboratory testsat autopsy were positive for cocaine and alcohol. The medicalexaminer attributed the cause of death to heat-related illness.
Case 2. In Oklahoma in mid-July 2001, police were calledto check on a man aged 62 years with a history of alcoholism,heavy smoking, and poor diet who had not been seen for7 days. The man was found dead by the police in his home,which was very hot; an ambient temperature was not recorded.A fan and air-conditioning unit in the home were in workingorder but turned off. Postmortem blood alcohol level was0.07%. Following an autopsy, the death was attributed tohyperthermia.
Case 3. In Texas in late July 2001, a boy aged 2 years wasfound in a motor vehicle with the windows rolled up for anundetermined length of time. The boy had locked himself inthe car and could not get out. The temperature inside the carwas not measured, nor was the outside temperaturerecorded; however, the high temperatures in central Texas dur-ing this time ranged from the mid-to-high 90s. The boyarrived at the hospital with an oral temperature of 102º F(39º C) and died 2 days later. The death was attributed toheatstroke.
Case 4. In a border town in Chihuahua State, Mexico, inAugust 2001, a man aged 21 years was found collapsed and
incoherent on the street. A wit-ness reported that he had com-plained about abdominal painand vomiting. He arrived at anemergency department in NewMexico 3 hours after he wasfound. His rectal temperaturewas 105.7º F (40.9º C). Thepatient had laboratory evi-dence of rhabdomyolysis,severe dehydration, and renalfailure. Blood alcohol level anda screen for drugs were nega-tive. He died 3 hours afterarrival at the hospital. Causeof death was attributed tohyperthermia due to environ-mental heat exposure. Hightemperature at the border thatday was 90º F (32º C).
United StatesDuring 1979–1999, a total of 8,015 deaths in the United
States was associated with excessive heat exposure†, 3,829(48%) were “due to weather conditions,” 377 (5%) were “ofman-made origins” (i.e., heat generated in vehicles, kitchens,boiler rooms, furnace rooms, and factories), and 3,809 (48%)were “of unspecified origin” (3); 182 deaths per year (range:54–651) were associated with excessive heat due to weatherconditions. Of the 3,764 (98%) deaths specified as due toweather conditions with a reported age (3), 142 (4%)occurred among children aged <4 years, and 1,068 (28%)occurred among persons aged >75 years (Figure 2).Reported by: R Moore, Statistical Svcs Div, Bur of Vital Statistics,Texas Dept of Health. Missouri Dept of Health and Senior Svcs.S Mallonee, MPH, T Garwe, MPH, Oklahoma State Dept of Heath.New Mexico Dept of Health. RI Sabogal, MSPH, L Zanardi, MD, Divof Environmental Hazards and Health Effects, National Center forEnvironmental Health; J Redd, MD, J Malone, MD, EIS officers, CDC.
Editorial Note: The cases summarized in this report demon-strate risk factors for heat-related illness. Heat-related illnessesinclude sunburn, heat cramps, heat rash, heat exhaustion, andheatstroke. Of these, the two most serious types of heat-related illness are heat exhaustion and heatstroke, both of
†Underlying cause of death during 1979–1998 is classified according to theInternational Classification of Disease, Ninth Revision (ICD-9). Excessive heathas three categories: E900.0 “due to weather conditions,” E900.1 “of man-made origins,” and E900.9 “of unspecified origin.” The data for 1999 arefrom ICD-10; code X30 “exposure to excessive natural heat” was added to the1979–1998 ICD-9 code E900.0, “excessive heat due to weather conditions.”
0
1
2
3
4
5
6
7
8
9
10
1 6 11 16 21 26 31 5 10 15 20 25 30
Day
New MexicoOklahomaMissouriTexasHeat Advisory Issued
Num
ber
AugJul
FIGURE 1. Reported cases of heat-related deaths*, by date and site — Missouri, New Mexico,Oklahoma, and Texas, August 2001
* n=95.

Vol. 51 / No. 26 MMWR 569
FIGURE 2. Average annual rate* of heat-related deathsattributed to weather conditions† and exposure to excessivenatural heat§, by age group — United States, 1979–1999
0
1
2
3
4
5
6
<1–14 15–19 20–24 25–34 35–44 45–54 55–64 65–74 75–84 >85
Age group (yrs)
0
0.2
0.4
0.6
<1 1–4 5–9 10–14
Age group (yrs)Rat
e
Rat
e
* Per million population.†International Classification of Diseases, Ninth Revision (ICD-9), codeE900.0.
§ICD-10, code X30.
which can result in death. Symptoms of heat exhaustioninclude heavy sweating, muscle cramps, fatigue, weakness,paleness, cold or clammy skin, dizziness, headache, nausea orvomiting, and fainting. Untreated heat exhaustion can progressto heatstroke (4). Even with prompt medical care, 15% ofheatstroke cases are fatal (5).
Symptoms of heatstroke include a high body temperature(oral temperature of >103º F [>39.4º C] or a rectal tempera-ture of 106º F [41.1º C]); red, hot, dry skin and no sweating;rapid pulse; throbbing headache; dizziness; nausea; confusion;disorientation; delirium; and coma. Heatstroke can occur inthe absence of physical exertion. Infants, elderly persons,socially isolated persons, bedridden persons, and persons withcertain mental and chronic illnesses are at highest risk (6,7).The elderly, especially those aged >80 years, are susceptible toheat-related illness because they are less able to adjust to physi-ologic changes (e.g., vasodilation) that occur with exposureto excessive heat and are more likely to be taking medicationfor chronic illness (e.g., tranquilizers and anticholinergics) thatincrease the risk for heat-related illness (5). Infants also aresensitive to heat. Conditions such as mild fever can progressquickly to heatstroke if heat stress occurs. Parents and othercaregivers should provide adequate hydration during sum-mer months and refrain from dressing children too warmly(5). Adults also should keep well hydrated during summermonths.
Heatstroke also can occur in young, healthy persons whoare exercising (6), because physical exertion during hot weatherincreases the likelihood of fainting and cramps caused byincreased blood flow to the extremities (5). Onset of heat-stroke can be rapid and is considered a medical emergency.
The findings in this report are subject to at least three limi-tations. First, information on decedents is provided by surro-gates, who might not accurately describe characteristics orbehavior of the decedents. Second, heat-related deaths due toweather conditions or exposure to excessive natural heat mightrepresent only a portion of actual heat-related deaths. Thesedeaths often are a diagnosis of exclusion and can bemisclassified as a stroke or heart attack. Deaths attributed tocardiovascular and respiratory disease increase following heatwaves (8). In addition, jurisdictions might use different defi-nitions of heat-related death. Finally, ICD-10 coding wasintroduced in 1999 and might not be comparable with previ-ous data for 1979–1998.
To reduce morbidity and mortality from heat-related ill-ness, many cities have developed emergency response plans.Local officials use meteorologic information and assess popu-lation characteristics to implement prevention strategies (7).Spending time in an air-conditioned area is the strongest fac-tor in preventing heat-related deaths (1,9). The use of fansdoes not appear to be protective during periods of high heatand humidity (1). If exposure to heat cannot be avoided, pre-vention measures should include reducing or eliminatingstrenuous activities or rescheduling them for cooler parts ofthe day; drinking water or nonalcoholic fluids frequently;taking cool showers frequently; wearing lightweight, light-colored, loose-fitting clothing; and avoiding direct sunshine(9).
Public health messages disseminated to all age groups canmake the public aware of the signs and symptoms of heat-related illness. Prevention messages delivered as early as pos-sible in the media can prevent heat-related illness, injury, anddeath (1).
Because many heat-related illnesses and deaths occur amongthe elderly population, older persons should be encouragedto take advantage of air-conditioned environments (e.g., shop-ping malls, senior centers, and public libraries) for part of theday. Parents and other caregivers should be educated aboutthe heat sensitivity of children aged <5 years (5).
AcknowledgmentsCase reports are based on data contributed by F Jordan, MD,
Oklahoma Office of the Chief Medical Examiner. PJ McFeeley, MD,M Markey, MD, New Mexico Office of the Medical Investigatorand Univ of New Mexico School of Medicine. N Peerwani, MD,L Anderson, Office of Chief of Medical Examiner, Tarrant County,Texas.
References1. Semenza JC, Rubin Ch, Falter KH, et al. Heat-related deaths during
the 1995 heat wave in Chicago. N Engl J Med 1996;335:84–90.
570 MMWR July 5, 2002
2. National Oceanographic and Atmospheric Association. Sizzling Julytemperatures bake southern plains states, July 2001. Available at http://www.noaanews.noaa.gov/stories/s685.htm.
3. National Center for Health Statistics. Compressed mortality file.Hyattsville, Maryland: U.S. Department of Health and Human Ser-vices, CDC, 2002.
4. Knochel JP. Environmental heat illness: an eclectic review. Arch InternMed 1974;133:841–64.
5. Kilbourne EM. Heat waves and hot environments. In: Noji EK, ed.The Public Health Consequences of Disasters. New York, New York:Oxford University Press, 1997:245–69.
6. Vassallo SU, Delaney KA. Thermoregulatory principles. In: GoldfrankLR, ed. Goldfrank’s Toxicologic Emergencies. 6th ed. Stamford, Con-necticut: Appleton & Lange, 1998:295–307.
7. Kaiser R, Rubin CH, Henderson AK, et al. Heat-related death andmental illness during the 1999 Cincinnati heat wave. Am J ForensicPathol 2001;22:303–7.
8. McGeehin MA, Mirabelli M. The potential impacts of climate variabil-ity and change on temperature-related morbidity and mortality in theUnited States. Environ Health Perspect 2001;109:185–90.
9. CDC. Heat-related deaths—Los Angeles County, California, 1999–2000, and United States, 1979–1998. MMWR 2001;50:623–6.
Injuries and Deaths AmongChildren Left Unattended in or
Around Motor Vehicles — UnitedStates, July 2000–June 2001
National attention concerning motor vehicles (MVs) andchild safety has focused largely on protecting children asoccupants transported in traffic on public roads. However,children who are unattended in or around MVs that are notin traffic also are at increased risk for injury and death. CDCand the nonprofit Trauma Foundation examined data fromtwo databases on both nonfatal and fatal nontraffic MV-related incidents. This report summarizes the results of thatanalysis, highlights the major causes of this type of childhooddeath and injury, and underscores the need for effective inter-ventions.
Nationally representative data on nonfatal injuries treatedin hospital emergency departments (EDs) from the NationalElectronic Injury Surveillance System All Injury Program(NEISS-AIP) were examined (1). Data on fatal injuriesoccurring across the country were reported from a databasedeveloped by the Trauma Foundation’s KIDS ’N CARS™program. During July 2000–June, 2001, data from these twoprograms documented an estimated 9,160 nonfatal injuriesand 78 fatal injuries among children aged <14 years who wereleft unattended in or around MVs that were not in traffic.
NEISS-AIP, which is operated by the U.S. Consumer Prod-uct Safety Commission, collects data annually on approxi-mately 500,000 cases from a nationally representative sampleof 65 hospital EDs in the United States. National estimates
of nonfatal injuries treated in hospital EDs were calculatedby using the sum of sample weights of study cases; weightswere derived based on the inverse of the probability of selec-tion; confidence intervals (CIs) were computed by using adirect variance estimation procedure (1). Population estimatesfor computing rates were obtained from the U.S. Bureau ofCensus.
NEISS-AIP study case-patients were children treated in aU.S. hospital ED after being injured while left unattended inor around MVs (e.g., cars, trucks, vans, and SUVs) not intraffic. These nontraffic injuries included those associated with1) parked MVs on or off the street and 2) MVs in motion offthe street. Children injured during the normal course of get-ting in or out of stationary MVs were excluded.
NEISS-AIP obtains data routinely for each nonfatal injuryon the principal diagnosis, body part primarily affected, EDdischarge disposition, and locale of occurrence (e.g., home orpublic place). Narratives describing each injury event wereused to identify the surface where the incident occurred (e.g.,driveway, parking lot, or street) and type of event. A classifi-cation scheme assigned cases to the following types of events:run over or backed over by an MV, struck by an MV, fell outof an MV in motion, or fell off of the exterior of an MV (e.g.,the bed of a pick-up truck), and other specified (e.g., bumpedagainst, dragged by, submerged in, or overheated in an MV).
The KIDS ’N CARS™ database was used to describe spe-cific incidents involving children aged <14 years who died asa result of being left unattended in or around MVs.National estimates of fatalities cannot be derived from thisdatabase. KIDS ’N CARS™ identifies cases through1) online searches of LexisNexis™, a service providing accessto thousands of newspapers and magazines worldwide; 2) key-word searches on Internet search engines, the registration ofkeyword preferences with Internet providers and news mediasites, and searches within archives of newspaper websites;3) news accounts from a clipping service; 4) contacts withchild death review teams; and 5) information from an infor-mal nationwide network of professional and personal con-tacts. Documentation from news media archives and otherrecord sources is used to validate all cases identified.
A total of 192 NEISS-AIP study cases was identified, rep-resenting a national estimate of 9,160 (95% CI=5,344–12,976) children with nonfatal injuries treated in U.S. hospitalEDs during July 2000–June 2001. Approximately 42% ofinjured children were aged <4 years, and 61.9% were male(Table 1). Injuries occurred predominantly to the head andneck region (30.4%) and the extremities (53.1%). Most(56.8%) injuries were minor contusions and abrasions; how-ever, more serious injuries also were common (26.5% were

Vol. 51 / No. 26 MMWR 571
TABLE 1. Estimated number and rate* of injuries treated inhospital emergency departments among children aged <14years who were left unattended in or around motor vehicles —United States, July 2000–June 2001Characteristic No. % Rate (95% CI†)
Age (yrs)0– 4 3,800 41.5 20.1 ( 8.5–31.7)5–14 5,360 58.5 13.5 ( 8.4–18.5)
SexMale 5,674 61.9 18.9 (11.0–26.8)Female 3,486 38.1 12.2 ( 6.1–18.2)
Total 9,160 100.0 15.6 ( 9.1–22.1)
* Per 100,000 population.†Confidence interval.
TABLE 2. Estimated number and percentage of injuries treatedin hospital emergency departments among children aged <14years who were left unattended in or around motorvehicles (MVs), by selected characteristics — United States,July 2000–June 2001Characteristic No. % (95% CI*)
Body part primarily affectedHead/neck 2,783 30.4 (12.3– 48.5)Extremity 4,860 53.1 (30.5– 75.6)Other/unspecified 1,517† 16.6† ( 6.3– 26.8)
DiagnosisContusion/abrasion 5,205 56.8 (29.6– 84.0)Fracture 1,212 13.2 ( 6.2– 20.3)Internal injury/concussion 1,217† 13.3† ( 3.8– 22.7)Other 1,526 16.7 ( 9.7– 23.6)
Disposition at ED dischargeTreated and released 7,496 81.8 (48.7–114.9)Hospitalized/transferred 1,664† 18.2† ( 6.8– 29.6)
Place of occurrenceHome 4,378 47.8 (25.7– 69.9)Public area§ 2,852 31.1 (13.0– 49.3)Unspecified 1,930 21.1 (11.7– 30.4)
Surface of occurrenceDriveway/parking lot 2,495 27.2 (10.9– 43.5)Other/unspecified¶ 6,665 72.8 (43.2–102.3)
Type of MV-related eventRun over/backed over by MV 2,767 30.2 (12.7– 47.7)Struck by MV 3,414 37.3 (23.4– 51.1)Fell out/fell off of MV 1,705 18.6 ( 8.1– 29.1)Other** 1,274 13.9 ( 6.3– 21.5)
Total 9,160 100.0
* Confidence interval.†
Estimate might be unstable because the coefficient of variation was>30%.
§Includes school, store, restaurant, park, recreation area, sports arena,and other public place.
¶Includes street.
** Includes pinned between MV and object, dragged by MV, submerged inwater in MV, overheated in MV, and ran into MV.
FIGURE. Distribution* of fatal injuries among children aged<14 years injured in or around motor vehicles (MVs)†, by ageand type of incident for cases reported — United States,July 2000–June 2001
* Percentile distributions are based on 78 KIDS ’N CARS™ cases of fatalinjuries; these distributions are not nationally representative.
†n=78.
§Other includes death in or around MV by fire, power accessories,entanglement in restraint straps, carbon monoxide poisoning, and left inMV in cold weather.
Type of incident — Fatal injuries
Other§
16.7%
MV put inmotion
by child12.8%
Trunkentrapment
9.0% Backed over by MV26.9%
Left in MVin hot weather
34.6%
Age — Fatal injuries
0–3 years82.1%
4–9 years14.1%
10–14 years3.8%
fractures or internal injuries). Most (81.8%) injured childrenwere treated and released from the ED. Most injuries occurrednear the home (47.8%) or on public property (31.1%). Inju-ries occurred in driveways and parking lots in at least 27.2%of incidents (Table 2). The most common type of nonfatalincident was being struck by an MV, followed by being runover or backed over by an MV and falling out or off of anMV. For nonfatal incidents, approximately 70% of MVs weremoving at a slow speed (e.g., moving forward or backwardshortly after being set in motion), and approximately 20%were moving backward.
The KIDS ’N CARS™ database provided information on78 children who died during July 2000–June 2001 in 76 sepa-rate incidents. Fatalities occurred in 28 states and the Districtof Columbia. Of the fatally injured children, 64 (82.1%) wereaged <4 years, and 42 (53.8%) were male. In 57 (73.1%)cases, the MV was located near a home (e.g., driveway,unpaved area near home, or street in front of home); in 39(50%) cases, the child lived at that home. The driver was theparent in 12 (57.1%) of the 21 cases in which a child wasbacked over. The most common type of fatal incident wasexposure to excessive heat inside an MV (e.g., when a childwas left inside an MV during hot weather) (34.6%), followedby being backed over and being hurt when a child put an MVin motion (26.9%). Approximately 82% of fatal injuriesoccurred among children aged <4 years (Figure).Reported by: E McLoughlin, ScD, Trauma Foundation, San Francisco,California. JA Middlebrooks, MEd, JL Annest, PhD, P Holmgreen,MS, Office of Statistics and Programming; A Dellinger, PhD, Div ofUnintentional Injury Prevention, National Center for Injury Preventionand Control, CDC.
Editorial Note: The findings in this report highlight the char-acteristics of nontraffic-related injuries and deaths amongchildren. Many more U.S. children aged <14 years areinjured (e.g., an estimated 37,115 [CI=21,029–53,200]injury-related ED visits in 2000) or killed (e.g., 533 deaths in1999) by being struck by a moving MV while in the street.

572 MMWR July 5, 2002
*Albania, Andorra, Armenia, Austria, Azerbaijan, Belarus, Belgium, Bosnia andHerzegovina, Bulgaria, Croatia, Czech Republic, Denmark, Estonia, Finland,France, Georgia, Germany, Greece, Hungary, Iceland, Ireland, Israel, Italy,Kazakhstan, Kyrgyzstan, Latvia, Lithuania, Luxembourg, Malta, Monaco,Netherlands, Norway, Poland, Portugal, Republic of Moldova, Romania,Russian Federation, San Marino, Slovakia, Slovenia, Spain, Sweden,Switzerland, Tajikistan, The Former Yugoslav Republic of Macedonia, Turkey,Turkmenistan, Ukraine, United Kingdom, Uzbekistan, and the Federal Republicof Yugoslavia.
However, the nontraffic-related incidents described in thisreport are an important cause of injuries and deaths amongchildren. These incidents are preventable, and effective inter-ventions must be determined to protect children.
The findings in this report are subject to at least six limita-tions. First, NEISS-AIP captures only injuries treated in hos-pital EDs and does not include children seen in physicians’offices and clinics. Second, NEISS-AIP provides statisticallyvalid national estimates but not state and local estimates.Third, types of nonfatal incidents were classified by usingbrief narratives transcribed from medical records; furtherdetails about each incident were not available. Fourth, KIDS’N CARS™ data are not population-based and probablyundercount the true number of fatal cases nationally. Fifth,media coverage of these incidents might contain incompleteinformation and might be less common in large urban areas.Finally, online media archives might exclude very small-circulation local newspapers. Because of these limitations,methods should be explored to obtain routine national datauseful for characterizing and monitoring detailed circum-stances of injuries and deaths from all types of nontraffic MV-related incidents involving children. The National HighwayTraffic Safety Administration is assessing methods to identifycases of nontraffic MV-related injuries and deaths in childrenand to obtain details about injury-related circumstances (2).
The findings in this report are consistent with other studiesthat indicate that children left unattended in or around MVsare at increased risk for injury and death in incidents thatinvolve parked MVs, slow-moving MVs, MVs moving back-ward in driveways and parking lots, MVs set in motion by achild, and trunk entrapment (3–10). In this report, excessiveheat exposure while in an MV was the most common causeof death; however, scientific literature examining the circum-stances of such incidents is minimal.
Several areas for possible intervention include education,legislation, regulation, and changes in vehicle design. Educa-tion campaigns aimed at parents and caregivers should com-municate the following: 1) ensure adequate supervision whenchildren are playing in areas near parked MVs; 2) never leavechildren alone in an MV, even when they are asleep orrestrained; and 3) keep MVs locked in a garage or drivewayand keep keys out of children’s reach.
Laws related to endangering the life or health of a child byleaving the child unattended in an MV have been enacted by11 states; the nature of these laws and associated penaltiesvary by state. In California, funds from 70% of fines result-ing from noncompliance with its associated law will go tocounties to support public education campaigns to addressthese preventable deaths and injuries.
Children might be protected further by commercially avail-able vehicle enhancements, such as sensors that detect unseenobstacles behind an MV or devices that emit audible signalswhen an MV is in reverse. Evaluation of such interventionsshould be conducted to inform policy makers about theireffectiveness in reducing nontraffic MV-related injuries anddeaths among children.
AcknowledgmentsThis report was developed with contributions by J Fennell,
T Struttman, KIDS ’N CARS™ program, Trauma Foundation,San Francisco, California. T Schroeder, C Downs, A McDonald,Div of Hazard and Injury Data Systems, Consumer Product SafetyCommission. K Gotsch, Office of Statistics and Programming,National Center for Injury Prevention and Control, CDC.
References1. CDC. National estimates of nonfatal injuries treated in hospital emer-
gency departments—United States, 2000. MMWR 2001;50:340–6.2. National Highway Traffic Safety Administration. NHTSA pilot study:
Non-traffic motor vehicle safety issues. An examination of selected1997 death certificates and related activity. Technical Report. Wash-ington, DC: U.S. Department of Transportation, 2002.
3. Agran PF, Winn DG, Anderson CL. Differences in child pedestrianinjury events by location. Pediatrics 1994;93:284–8.
4. Agran PF, Winn D, Castillo D. Unsupervised children in vehicles: arisk for pediatric trauma. Pediatrics 1991;87:70–3.
5. Mayr JM, Eder C, Wernig J, Zebedin D, Berghold A, Corkum SH.Vehicles reversing or rolling backwards: an underestimated hazard. InjPrev 2001;7:327–8.
6. Nadler EP, Courcoulas AP, Gardner MJ, Ford HR. Driveway injuriesin children: risk factors, morbidity, and mortality. Pediatrics2001;108:326–8.
7. Patrick DA, Bensard KK, Moore EE, Partington MD, Karrer FM.Driveway crush injuries in young children: a highly lethal, devastat-ing, and potentially preventable event. J Pediatr Surg 1998;33:1712–5.
8. Robinson P, Nolan T. Pediatric slow-speed non-traffic fatalities: Victoria,Australia, 1985–1995. Accid Anal Prev 1997;29:731–7.
9. Winn DG, Agran PF, Castillo DN. Pedestrian injuries to childrenyounger than 5 years of age. Pediatrics 1991;88:776–82.
10. CDC. Fatal car trunk entrapment involving children—United States,1987–1998. MMWR 1998;47:1019–22.
Public Health Dispatch
Certification of Poliomyelitis Eradication —European Region, June 2002
On June 21, 2002, the Regional Commission for the Cer-tification of Poliomyelitis Eradication (the Commission) cer-tified that the European Region (EUR)* of the World Health

Vol. 51 / No. 26 MMWR 573
FIGURE. World Health Organization regions certified free ofwild poliovirus*
* Americas Region certified 1994; Western Pacific Region certified 2000;European Region certified 2002.
§During March–May 2001, three cases of polio were reported in Bulgaria. InOctober 2001, wild poliovirus was isolated from a stool specimen of a child inGeorgia with aseptic meningoencephalitis. In both instances, the wild poliovirustype 1 isolated had 98% homology with virus isolated in the Indiansubcontinent. Both countries and their neighbors initiated supplementaryimmunization and enhanced surveillance in response.
Organization (WHO) is free of indigenous wild poliovirustransmission. The last known case in EUR of polio caused byindigenous wild poliovirus transmission occurred in south-east Turkey in November 1998. EUR comprises 51 countrieswith an estimated population of 873 million and is the thirdof the six WHO regions to be certified as polio-free, follow-ing the Americas Region in 1994 (1) and the Western PacificRegion in 2000 (2) (Figure). An estimated 3.4 billion persons(55% of the world’s population) live in countries and territo-ries certified free of endemic polio.
The Commission completed a 4-year review of program-matic data compiled by national certification committees toensure that the absence of reported wild poliovirus isolationreflected interruption of indigenous wild transmission. Theprerequisite for regional certification is the absence of indig-enous wild poliovirus isolation for at least 3 years (3). Othercriteria used to certify that regions are polio-free include1) high vaccination coverage rates in all countries and withinall areas of a country, 2) sensitive surveillance for acute flac-cid paralysis (AFP) meeting standard performance indicators†
and/or other means of sensitive virologic surveillance, 3) aplan of action to respond to imported cases of wild poliovi-rus, and 4) political commitment by national governments tomaintain high levels of vaccination coverage and surveillancethrough global certification of polio eradication. In addition,the Commission sought evidence of substantial progress inthe process of laboratory containment of wild poliovirus ineach country.
In 1988, the Global Polio Eradication Initiative waslaunched by the World Health Assembly; the initiative iscoordinated by WHO in primary partnership with RotaryInternational, the United Nations Children’s Fund (UNICEF),and CDC. National governments, private foundations, non-government organizations, corporations, and volunteers arecollaborating to achieve eradication. During 2001, a total of10 countries in three WHO regions (African, Eastern Medi-terranean, and Southeast Asia) reported transmission of wildpoliovirus (4).
Until polio is eradicated globally, all polio-free countriesare at risk for wild poliovirus importation. In EUR, this riskwas underscored by the discovery of poliovirus in Bulgaria(5) and Georgia in 2001§. During 2000–2001, two outbreaksof polio caused by circulating vaccine-derived poliovirus weredocumented among populations with low vaccination cover-age on the island of Hispaniola (the Dominican Republic andHaiti) and the Philippines (6). Polio-free countries shouldmaintain high levels of polio vaccination coverage and sensi-tive surveillance for the prompt detection of any circulatingpoliovirus. To minimize the risk for poliovirus spread, supple-mentary vaccination campaigns will continue in high-risk areasof some EUR countries. Many of these campaigns are syn-chronized with those of countries of the Eastern Mediterra-nean Region (EMR). During 1995–2002, OperationMECACAR (Eastern Mediterranean, Caucasus, and CentralAsian Republics) coordinated polio eradication activitiesamong 18 EUR and EMR countries; this effort represented amajor advance toward eliminating virus circulation (7,8).Reported by: Vaccine-preventable Diseases and ImmunizationProgramme, World Health Organization Regional Office for Europe,Copenhagen, Denmark. Dept of Vaccines and Biologicals, World HealthOrganization, Geneva, Switzerland. Div of Viral and RickettsialDiseases, National Center for Infectious Diseases; Global ImmunizationDiv, National Immunization Program, CDC.
References1. CDC. Certification of poliomyelitis eradication—the Americas, 1994.
MMWR 1994;43:720–2.2. CDC. Certification of poliomyelitis eradication—Western Pacific
Region, October 2000. MMWR 2001;50:1–3.3. Expanded Programme on Immunization. Report of the first meeting of
the Global Commission for the Certification of the Eradication of Po-liomyelitis. Geneva, Switzerland: World Health Organization, 1995(Document no. WHO/EPI/GEN/95.6).
4. CDC. Progress toward global eradication of poliomyelitis, 2001.MMWR 2002;51:253–7.
5. CDC. Imported wild poliovirus causing poliomyelitis—Bulgaria, 2001.MMWR 2001;50:1033–5.
†The quality of AFP surveillance is evaluated by two key indicators: sensitivityof reporting (target: nonpolio AFP rate of >1 cases per 100,000 children aged<15 years) and completeness of specimen collection (target: two adequate stoolspecimens from >80% of all persons with AFP). All stool samples should beanalyzed in WHO-accredited laboratories.
574 MMWR July 5, 2002
6. CDC. Outbreak of poliomyelitis—Dominican Republic and Haiti,2000–2001. MMWR 2001;50:855–6.
7. CDC. Progress toward poliomyelitis eradication—European region,1998–June 2000. MMWR 2000;49:656–60.
8. World Health Organization Regional Offices for Europe and the East-ern Mediterranean. Operation MECACAR: eradicating polio, finalreport 1995–2000. Copenhagen, Denmark: World Health Organiza-tion Regional Office for Europe, 2001.
Notice to Readers
Food and Drug Administration Approvalof a Fifth Acellular Pertussis Vaccine for
Use Among Infants and Young Children —United States, 2002
On May 14, 2002, the Food and Drug Administration(FDA) approved for use an additional combined diphtheriaand tetanus toxoids and acellular pertussis vaccine (DTaP)(DAPTACEL™ Aventis Pasteur, Ltd. [Toronto, Ontario])for the first 4 doses of the diphtheria and tetanus toxoids andpertussis vaccination (DTP) series administered to infants andchildren aged 6 weeks–6 years (before seventh birthday).DAPTACEL™ is the fifth acellular pertussis vaccine to belicensed for use among infants and young children in theUnited States. Of these five, three (Tripedia®, Infanrix™,and DAPTACEL™) are distributed in the United States.
DAPTACEL™ is approved for administration as a 4-doseseries at ages 2, 4, 6, and 17–20 months. The Advisory Com-mittee on Immunization Practices (ACIP), the Committeeon Infectious Diseases, the American Academy of Pediatrics,and the American Academy of Family Physicians recommendthat children routinely receive a series of 5 doses of vaccineagainst diphtheria, tetanus, and pertussis before age 7 years(1,2). The first 4 doses should be administered at ages 2, 4, 6,and 15–18 months and the fifth dose at age 4–6 years. Thecustomary age for the first dose is 2 months, but it may begiven as early as age 6 weeks and up to the seventh birthday.The interval between the third and the fourth dose should beat least 6 months. Data are insufficient to evaluate the use ofDAPTACEL™ as a fifth dose among children aged 4–6 yearswho have received DAPTACEL™ for the previous 4 doses.DAPTACEL™ may be used to complete the vaccinationseries in infants who have received 1 or more doses of whole-cell pertussis DTP.
The following evidence supports the use of DAPTACEL™for the first 4 doses of the diphtheria, tetanus, and pertussisvaccination series:
1. The rates of local reactions, fever, and other commonsystemic symptoms following receipt of DAPTACEL™inoculations were substantially lower than those followingwhole-cell pertussis vaccination (administered as DTP fordoses 1–3 in controlled clinical studies (3,4).
2. Efficacy of 3 doses of DAPTACEL™ against pertussisdisease was assessed in a double-blind, randomized, placebo-controlled trial in Sweden (3). Infants were assigned randomlyto be vaccinated with either DAPTACEL™, another investi-gational acellular pertussis vaccine, whole-cell pertussis DTPvaccine, or DT vaccine as placebo at ages 2, 4, and 6 months.The mean length of follow-up was 2 years after the third doseof vaccine. In this trial, pertussis was defined according to theWorld Health Organization case definition (i.e., a paroxys-mal cough illness lasting >21 days and confirmed by culture,serology, or epidemiologic link to a culture-positive house-hold contact). The vaccine efficacy of DAPTACEL™ againstWHO-defined pertussis was 84.9% (95% confidence inter-val [CI]=80.1%–88.6%) (3,4). The protective efficacy ofDAPTACEL™ against mild pertussis (i.e., >1 day of coughwith laboratory confirmation) was 77.9% (95% CI=72.6%–82.2%) (4). Although a serologic correlate of protection forpertussis has not been established, the antibody responses tothe pertussis antigens in DAPTACEL™ among North Ameri-can infants after 4 doses at ages 2, 4, 6, and 17–20 monthswas comparable to that achieved among Swedish infants inwhom efficacy was demonstrated after three doses at age 2, 4,and 6 months (4).
Because of the reduced frequency of adverse reactions anddemonstrated efficacy, ACIP recommends DTaP for all 5 dosesof the routine diphtheria, tetanus, and pertussis vaccinationseries and for the remaining doses in the series for childrenwho have started the vaccination series with whole-cell DTPvaccine (1). ACIP considers the data to be insufficient in termsof safety and efficacy to express a preference among differentacellular pertussis vaccine formulations.
Whenever feasible, the same DTaP vaccine should be usedthroughout the entire vaccination series. Data are limited onthe safety, immunogenicity, or efficacy of different DTaP vac-cines when administered interchangeably in the primary orbooster vaccination of a child. However, if the vaccine pro-vider does not know or have available the type of DTaP vac-cine the child to be vaccinated had received previously, any ofthe licensed DTaP vaccines may be used to complete thevaccination series (1).References1. CDC. Pertussis vaccination: use of acellular pertussis vaccine among
infants and young children—recommendations of the Advisory Com-mittee on Immunization Practices. MMWR 1997;46(No. RR-7).
2. CDC. Recommended childhood immunization schedule—UnitedStates, 2002. MMWR 2002;51:31–3.
3. Gustafsson L, Hallander HO, Olin P, et al. A controlled trial of a two-component acellular, a five-component acellular, and a whole-cell per-tussis vaccine. N Engl J Med 1996;334:349–55.
4. Diphtheria and tetanus toxoids and acellular pertussis vaccine adsorbed(DAPTACEL™) [Package insert]. Toronto, Ontario: Aventis Pasteur,Ltd., 2002.

Vol. 51 / No. 26 MMWR 575
FIGURE I. Selected notifiable disease reports, United States, comparison of provisional 4-week totals ending June 29, 2002, withhistorical data
* No measles cases were reported for the current 4-week period yielding a ratio for week 26 of zero (0).† Ratio of current 4-week total to mean of 15 4-week totals (from previous, comparable, and subsequent 4-week periods for the past 5 years). The point where the hatched area begins
is based on the mean and two standard deviations of these 4-week totals.
DISEASE DECREASE INCREASECASES CURRENT
4 WEEKS
Ratio (Log Scale)†
Beyond Historical Limits
4210.50.250.125
335
300
77
66
0
85
9
374
2
Hepatitis A, Acute
Hepatitis B, Acute
Hepatitis C; Non-A, Non-B, Acute
Legionellosis
Measles, Total
Mumps
Pertussis
Rubella
Meningococcal Infections
0.06250.03125
*
TABLE I. Summary of provisional cases of selected notifiable diseases, United States, cumulative, week ending June 29, 2002 (26th Week)*
Anthrax 1 1 Encephalitis: West Nile† 1 -Botulism: foodborne 7 10 Hansen disease (leprosy)† 37 37
infant 30 48 Hantavirus pulmonary syndrome† 6 5other (wound & unspecified) 9 6 Hemolytic uremic syndrome, postdiarrheal† 64 53
Brucellosis† 39 60 HIV infection, pediatric†§ 31 91Chancroid 29 21 Plague - 2Cholera 3 2 Poliomyelitis, paralytic - -Cyclosporiasis† 71 53 Psittacosis† 12 7Diphtheria - 1 Q fever† 15 7Ehrlichiosis: human granulocytic (HGE)† 75 42 Rabies, human 1 -
human monocytic (HME)† 36 36 Streptococcal toxic-shock syndrome† 38 51other and unspecified 2 2 Tetanus 6 22
Encephalitis: California serogroup viral† 5 2 Toxic-shock syndrome 59 64eastern equine† 1 - Trichinosis 9 8Powassan† - - Tularemia† 21 46St. Louis† - - Yellow fever 1 -western equine† - -
Cum. Cum. Cum. Cum.2002 2001 2002 2001
-:No reported cases.* Incidence data for reporting year 2001 and 2002 are provisional and cumulative (year-to-date).†Not notifiable in all states.
§Updated monthly from reports to the Division of HIV/AIDS Prevention — Surveillance and Epidemiology, National Center for HIV, STD, and TB Prevention(NCHSTP). Last update May 26, 2002.
576 MMWR July 5, 2002
N: Not notifiable. U: Unavailable. -: No reported cases. C.N.M.I.: Commonwealth of Northern Mariana Islands.* Incidence data for reporting year 2001 and 2002 are provisional and cumulative (year-to-date).† Chlamydia refers to genital infections caused by C. trachomatis.§ Updated monthly from reports to the Division of HIV/AIDS Prevention — Surveillance and Epidemiology, National Center for HIV, STD, and TB Prevention. Last update
May 26, 2002.
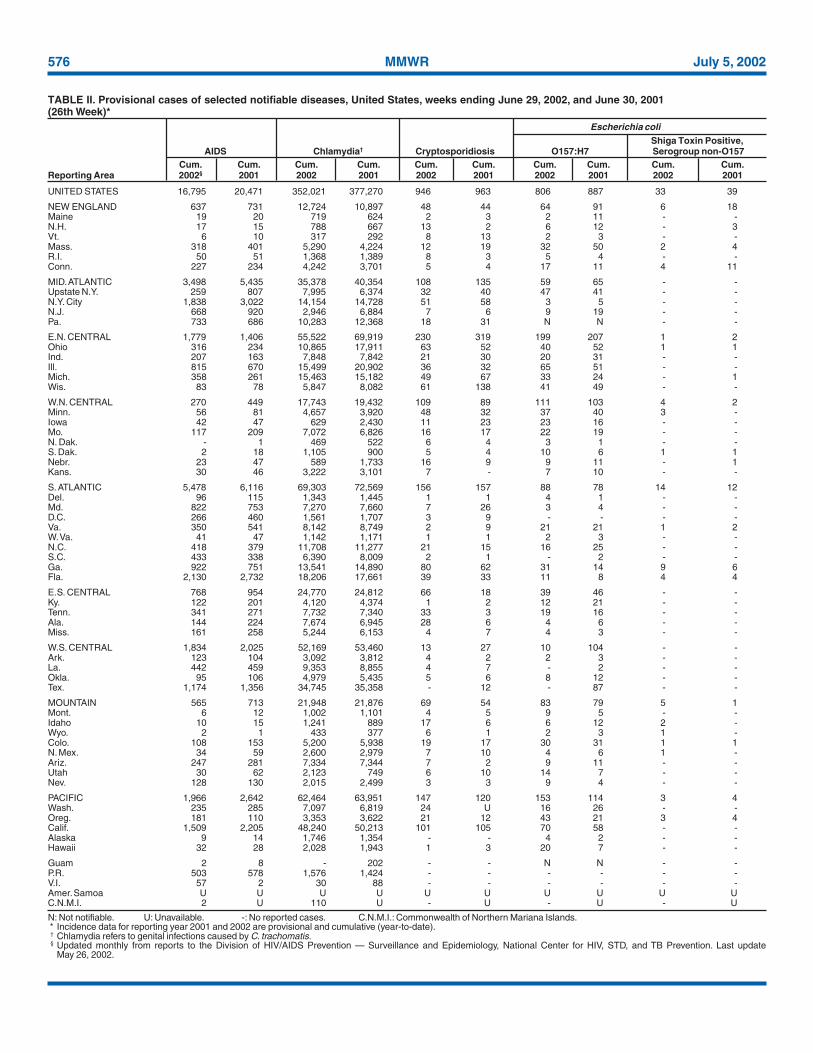
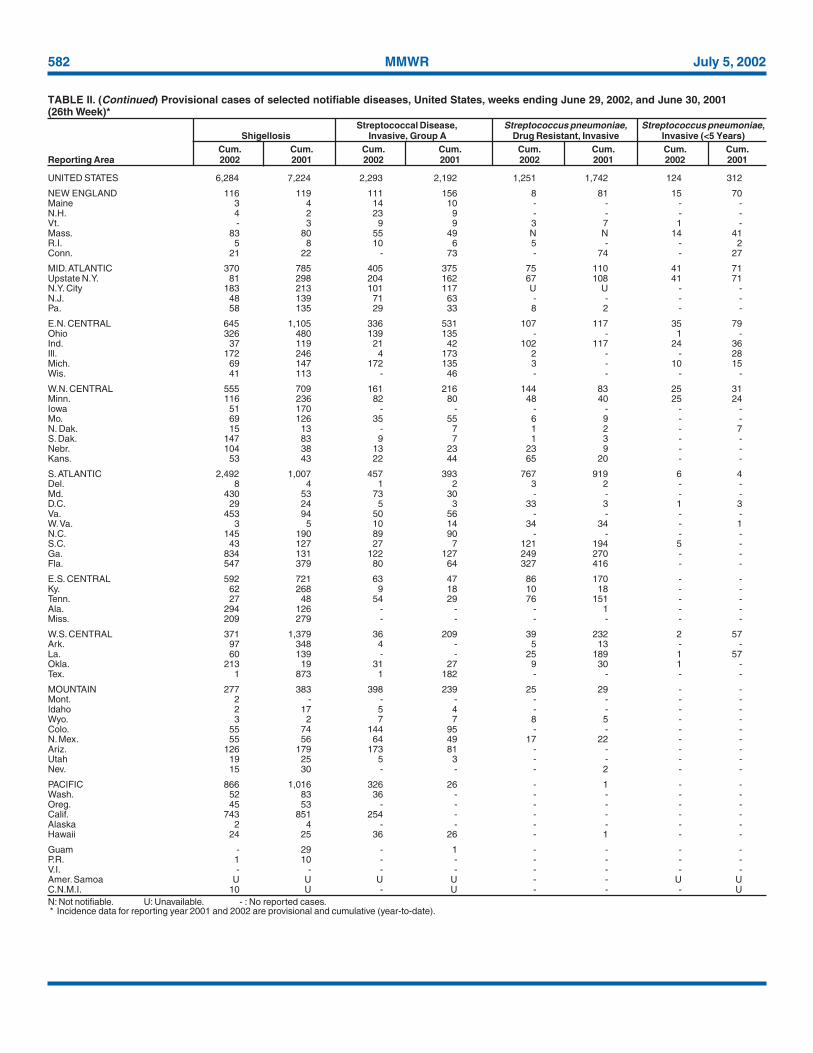
TABLE II. Provisional cases of selected notifiable diseases, United States, weeks ending June 29, 2002, and June 30, 2001(26th Week)*
UNITED STATES 16,795 20,471 352,021 377,270 946 963 806 887 33 39
NEW ENGLAND 637 731 12,724 10,897 48 44 64 91 6 18Maine 19 20 719 624 2 3 2 11 - -N.H. 17 15 788 667 13 2 6 12 - 3Vt. 6 10 317 292 8 13 2 3 - -Mass. 318 401 5,290 4,224 12 19 32 50 2 4R.I. 50 51 1,368 1,389 8 3 5 4 - -Conn. 227 234 4,242 3,701 5 4 17 11 4 11
MID. ATLANTIC 3,498 5,435 35,378 40,354 108 135 59 65 - -Upstate N.Y. 259 807 7,995 6,374 32 40 47 41 - -N.Y. City 1,838 3,022 14,154 14,728 51 58 3 5 - -N.J. 668 920 2,946 6,884 7 6 9 19 - -Pa. 733 686 10,283 12,368 18 31 N N - -
E.N. CENTRAL 1,779 1,406 55,522 69,919 230 319 199 207 1 2Ohio 316 234 10,865 17,911 63 52 40 52 1 1Ind. 207 163 7,848 7,842 21 30 20 31 - -Ill. 815 670 15,499 20,902 36 32 65 51 - -Mich. 358 261 15,463 15,182 49 67 33 24 - 1Wis. 83 78 5,847 8,082 61 138 41 49 - -
W.N. CENTRAL 270 449 17,743 19,432 109 89 111 103 4 2Minn. 56 81 4,657 3,920 48 32 37 40 3 -Iowa 42 47 629 2,430 11 23 23 16 - -Mo. 117 209 7,072 6,826 16 17 22 19 - -N. Dak. - 1 469 522 6 4 3 1 - -S. Dak. 2 18 1,105 900 5 4 10 6 1 1Nebr. 23 47 589 1,733 16 9 9 11 - 1Kans. 30 46 3,222 3,101 7 - 7 10 - -
S. ATLANTIC 5,478 6,116 69,303 72,569 156 157 88 78 14 12Del. 96 115 1,343 1,445 1 1 4 1 - -Md. 822 753 7,270 7,660 7 26 3 4 - -D.C. 266 460 1,561 1,707 3 9 - - - -Va. 350 541 8,142 8,749 2 9 21 21 1 2W. Va. 41 47 1,142 1,171 1 1 2 3 - -N.C. 418 379 11,708 11,277 21 15 16 25 - -S.C. 433 338 6,390 8,009 2 1 - 2 - -Ga. 922 751 13,541 14,890 80 62 31 14 9 6Fla. 2,130 2,732 18,206 17,661 39 33 11 8 4 4
E.S. CENTRAL 768 954 24,770 24,812 66 18 39 46 - -Ky. 122 201 4,120 4,374 1 2 12 21 - -Tenn. 341 271 7,732 7,340 33 3 19 16 - -Ala. 144 224 7,674 6,945 28 6 4 6 - -Miss. 161 258 5,244 6,153 4 7 4 3 - -
W.S. CENTRAL 1,834 2,025 52,169 53,460 13 27 10 104 - -Ark. 123 104 3,092 3,812 4 2 2 3 - -La. 442 459 9,353 8,855 4 7 - 2 - -Okla. 95 106 4,979 5,435 5 6 8 12 - -Tex. 1,174 1,356 34,745 35,358 - 12 - 87 - -
MOUNTAIN 565 713 21,948 21,876 69 54 83 79 5 1Mont. 6 12 1,002 1,101 4 5 9 5 - -Idaho 10 15 1,241 889 17 6 6 12 2 -Wyo. 2 1 433 377 6 1 2 3 1 -Colo. 108 153 5,200 5,938 19 17 30 31 1 1N. Mex. 34 59 2,600 2,979 7 10 4 6 1 -Ariz. 247 281 7,334 7,344 7 2 9 11 - -Utah 30 62 2,123 749 6 10 14 7 - -Nev. 128 130 2,015 2,499 3 3 9 4 - -
PACIFIC 1,966 2,642 62,464 63,951 147 120 153 114 3 4Wash. 235 285 7,097 6,819 24 U 16 26 - -Oreg. 181 110 3,353 3,622 21 12 43 21 3 4Calif. 1,509 2,205 48,240 50,213 101 105 70 58 - -Alaska 9 14 1,746 1,354 - - 4 2 - -Hawaii 32 28 2,028 1,943 1 3 20 7 - -
Guam 2 8 - 202 - - N N - -P.R. 503 578 1,576 1,424 - - - - - -V.I. 57 2 30 88 - - - - - -Amer. Samoa U U U U U U U U U UC.N.M.I. 2 U 110 U - U - U - U
Shiga Toxin Positive,AIDS Chlamydia† Cryptosporidiosis O157:H7 Serogroup non-O157
Cum. Cum. Cum. Cum. Cum. Cum. Cum. Cum. Cum. Cum.Reporting Area 2002§ 2001 2002 2001 2002 2001 2002 2001 2002 2001
Escherichia coli

Vol. 51 / No. 26 MMWR 577
N: Not notifiable. U: Unavailable. - : No reported cases.* Incidence data for reporting year 2001 and 2002 are provisional and cumulative (year-to-date).
UNITED STATES 13 4 6,606 148,815 169,747 828 836 11 14
NEW ENGLAND - 1 698 3,693 2,923 58 54 - 1Maine - - 77 53 68 1 1 - -N.H. - - 24 62 72 5 - - -Vt. - 1 49 44 39 3 2 - -Mass. - - 330 1,649 1,253 27 33 - 1R.I. - - 60 460 348 9 2 - -Conn. - - 158 1,425 1,143 13 16 - -
MID. ATLANTIC - - 1,493 16,527 18,368 151 119 2 3Upstate N.Y. - - 505 4,094 3,942 68 39 2 -N.Y. City - - 605 5,726 6,118 34 32 - -N.J. - - 141 2,736 2,299 31 27 - -Pa. - - 242 3,971 6,009 18 21 - 3
E.N. CENTRAL 5 2 1,220 26,320 35,611 140 143 2 1Ohio 5 2 380 5,909 9,602 54 46 - 1Ind. - - - 3,377 3,257 28 22 1 -Ill. - - 288 8,388 11,214 43 50 - -Mich. - - 383 6,804 8,706 9 8 1 -Wis. - - 169 1,842 2,832 6 17 - -
W.N. CENTRAL - - 776 7,259 7,904 27 36 - 1Minn. - - 276 1,374 1,215 17 18 - -Iowa - - 108 170 594 1 - - -Mo. - - 226 4,112 4,013 7 12 - -N. Dak. - - 11 27 18 - 4 - -S. Dak. - - 30 129 139 - - - -Nebr. - - 52 137 594 - 1 - 1Kans. - - 73 1,310 1,331 2 1 - -
S. ATLANTIC - - 1,137 40,402 44,297 208 204 1 1Del. - - 21 808 819 - - - -Md. - - 44 4,035 4,349 47 52 1 -D.C. - - 20 1,295 1,459 - - - -Va. - - 99 5,147 4,596 15 17 - -W. Va. - - 18 479 300 6 6 - 1N.C. - - - 7,959 8,777 21 29 - -S.C. - - 30 3,758 6,017 11 4 - -Ga. - - 452 7,379 8,014 63 55 - -Fla. - - 453 9,542 9,966 45 41 - -
E.S. CENTRAL - 1 155 14,042 15,821 26 56 1 -Ky. - 1 - 1,623 1,677 2 2 - -Tenn. - - 68 4,352 4,799 15 27 - -Ala. - - 87 4,931 5,414 6 25 1 -Miss. - - - 3,136 3,931 3 2 - -
W.S. CENTRAL - - 71 22,804 25,829 33 32 2 1Ark. - - 59 1,718 2,383 1 - - -La. - - 1 5,785 6,107 2 6 - -Okla. - - 11 2,158 2,464 28 25 - -Tex. - - - 13,143 14,875 2 1 2 1
MOUNTAIN 8 - 610 4,649 5,163 114 96 2 3Mont. - - 34 47 63 - - - -Idaho - - 38 40 41 2 1 - -Wyo. - - 10 30 31 1 - - -Colo. 8 - 208 1,474 1,574 21 26 - -N. Mex. - - 71 493 469 18 14 - -Ariz. - - 80 1,785 2,029 54 40 1 1Utah - - 108 171 66 13 5 - -Nev. - - 61 609 890 5 10 1 2
PACIFIC - - 446 13,119 13,831 71 96 1 3Wash. - - 173 1,405 1,459 2 1 1 -Oreg. - - 184 396 573 37 30 - -Calif. - - - 10,729 11,299 9 43 - 3Alaska - - 43 295 182 1 3 - -Hawaii - - 46 294 318 22 19 - -
Guam - - - - 24 - - - -P.R. - - 1 235 326 - 1 - -V.I. - - - 17 14 - - - -Amer. Samoa U U U U U U U U UC.N.M.I. - U - 10 U - U - U
TABLE II. (Continued) Provisional cases of selected notifiable diseases, United States, weeks ending June 29, 2002, and June 30, 2001(26th Week)*
Haemophilus influenzae,Invasive
Escherichia coli Age <5 YearsShiga Toxin Positive, All Ages, Serotype
Not Serogrouped Giardiasis Gonorrhea All Serotypes BCum. Cum. Cum. Cum. Cum. Cum. Cum. Cum. Cum.
Reporting Area 2002 2001 2002 2002 2001 2002 2001 2002 2001

578 MMWR July 5, 2002
N: Not notifiable. U: Unavailable. -: No reported cases.* Incidence data for reporting year 2001 and 2002 are provisional and cumulative (year-to-date).
UNITED STATES 130 145 11 16 4,110 4,411 3,075 3,401 1,537 2,094
NEW ENGLAND 7 10 - - 171 235 107 67 18 26Maine - - - - 6 5 4 5 - -N.H. - - - - 10 6 10 10 - -Vt. - - - - - 6 2 4 11 6Mass. 4 7 - - 79 85 56 12 7 20R.I. - - - - 24 9 17 12 - -Conn. 3 3 - - 52 124 18 24 - -
MID. ATLANTIC 21 20 1 2 513 580 689 671 711 587Upstate N.Y. 8 6 - 1 98 131 74 64 29 18N.Y. City 6 5 - - 213 214 378 326 - -N.J. 4 3 - - 61 136 142 130 668 536Pa. 3 6 1 1 141 99 95 151 14 33
E.N. CENTRAL 19 28 - 1 532 530 392 399 55 105Ohio 5 8 - - 162 126 47 58 5 7Ind. 6 4 - 1 28 40 17 22 - 1Ill. 7 11 - - 158 160 34 49 7 8Mich. - - - - 124 164 294 249 43 89Wis. 1 5 - - 60 40 - 21 - -
W.N. CENTRAL 2 2 3 2 177 187 109 109 457 661Minn. 2 1 1 - 25 14 8 11 - 2Iowa - - - - 41 18 10 11 1 -Mo. - - 2 2 49 40 62 63 448 653N. Dak. - 1 - - 1 2 4 - - -S. Dak. - - - - 3 1 - 1 - -Nebr. - - - - 5 25 14 13 6 3Kans. - - - - 53 87 11 10 2 3
S. ATLANTIC 30 27 1 5 1,250 810 796 617 78 33Del. - - - - 9 4 7 11 3 2Md. 1 4 - 1 154 114 66 69 6 3D.C. - - - - 46 21 10 8 - -Va. 2 4 - - 47 67 105 76 2 -W. Va. - - 1 - 10 6 13 14 1 6N.C. 3 1 - 4 128 64 132 109 14 9S.C. 4 1 - - 42 30 40 13 4 4Ga. 13 13 - - 306 449 254 185 21 -Fla. 7 4 - - 508 55 169 132 27 9
E.S. CENTRAL 7 11 - 2 142 178 166 224 94 130Ky. - - - 1 34 38 23 25 2 5Tenn. 5 5 - - 58 72 71 110 18 36Ala. 2 5 - 1 23 56 37 46 3 2Miss. - 1 - - 27 12 35 43 71 87
W.S. CENTRAL 6 4 - - 64 508 181 416 14 440Ark. - - - - 24 31 58 54 3 5La. 1 - - - 15 56 14 64 11 101Okla. 5 4 - - 24 80 1 58 - 4Tex. - - - - 1 341 108 240 - 330
MOUNTAIN 24 12 5 1 320 384 239 251 45 34Mont. - - - - 9 6 3 2 - 1Idaho 1 - - - 20 35 4 7 - 1Wyo. - - - - 2 2 9 - 6 4Colo. 2 - - - 53 36 48 56 21 5N. Mex. 4 6 1 1 8 15 41 65 - 10Ariz. 12 4 3 - 169 206 88 82 3 9Utah 4 2 - - 33 38 19 15 2 1Nev. 1 - 1 - 26 46 27 24 13 3
PACIFIC 14 31 1 3 941 999 396 647 65 78Wash. 1 - - 1 86 52 30 59 12 16Oreg. 4 5 - - 46 63 74 80 12 10Calif. 6 24 1 1 801 863 286 491 41 52Alaska 1 1 - - 7 12 3 4 - -Hawaii 2 1 - 1 1 9 3 13 - -
Guam - - - - - 1 - - - -P.R. - 1 - - 47 93 31 133 - 1V.I. - - - - - - - - - -Amer. Samoa U U U U U U U U U UC.N.M.I. - U - U - U 29 U - U
TABLE II. (Continued) Provisional cases of selected notifiable diseases, United States, weeks ending June 29, 2002, and June 30, 2001(26th Week)*
Haemophilus influenzae, Invasive
Age <5 Years Hepatitis (Viral, Acute), By Type
Non-Serotype B Unknown Serotype A B C; Non-A, Non-BCum. Cum. Cum. Cum. Cum. Cum. Cum. Cum. Cum. Cum.
Reporting Area 2002 2001 2002 2001 2002 2001 2002 2001 2002 2001
Vol. 51 / No. 26 MMWR 579
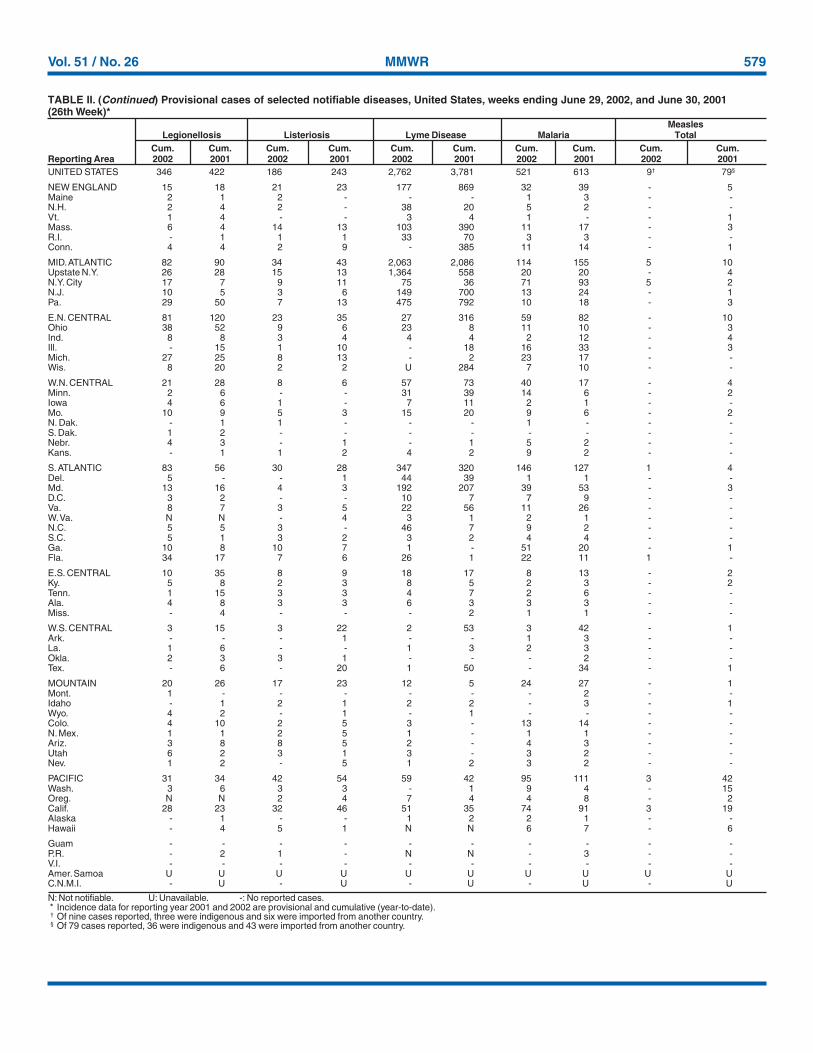
N: Not notifiable. U: Unavailable. -: No reported cases.* Incidence data for reporting year 2001 and 2002 are provisional and cumulative (year-to-date).† Of nine cases reported, three were indigenous and six were imported from another country.§ Of 79 cases reported, 36 were indigenous and 43 were imported from another country.
UNITED STATES 346 422 186 243 2,762 3,781 521 613 9† 79§
NEW ENGLAND 15 18 21 23 177 869 32 39 - 5Maine 2 1 2 - - - 1 3 - -N.H. 2 4 2 - 38 20 5 2 - -Vt. 1 4 - - 3 4 1 - - 1Mass. 6 4 14 13 103 390 11 17 - 3R.I. - 1 1 1 33 70 3 3 - -Conn. 4 4 2 9 - 385 11 14 - 1
MID. ATLANTIC 82 90 34 43 2,063 2,086 114 155 5 10Upstate N.Y. 26 28 15 13 1,364 558 20 20 - 4N.Y. City 17 7 9 11 75 36 71 93 5 2N.J. 10 5 3 6 149 700 13 24 - 1Pa. 29 50 7 13 475 792 10 18 - 3
E.N. CENTRAL 81 120 23 35 27 316 59 82 - 10Ohio 38 52 9 6 23 8 11 10 - 3Ind. 8 8 3 4 4 4 2 12 - 4Ill. - 15 1 10 - 18 16 33 - 3Mich. 27 25 8 13 - 2 23 17 - -Wis. 8 20 2 2 U 284 7 10 - -
W.N. CENTRAL 21 28 8 6 57 73 40 17 - 4Minn. 2 6 - - 31 39 14 6 - 2Iowa 4 6 1 - 7 11 2 1 - -Mo. 10 9 5 3 15 20 9 6 - 2N. Dak. - 1 1 - - - 1 - - -S. Dak. 1 2 - - - - - - - -Nebr. 4 3 - 1 - 1 5 2 - -Kans. - 1 1 2 4 2 9 2 - -
S. ATLANTIC 83 56 30 28 347 320 146 127 1 4Del. 5 - - 1 44 39 1 1 - -Md. 13 16 4 3 192 207 39 53 - 3D.C. 3 2 - - 10 7 7 9 - -Va. 8 7 3 5 22 56 11 26 - -W. Va. N N - 4 3 1 2 1 - -N.C. 5 5 3 - 46 7 9 2 - -S.C. 5 1 3 2 3 2 4 4 - -Ga. 10 8 10 7 1 - 51 20 - 1Fla. 34 17 7 6 26 1 22 11 1 -
E.S. CENTRAL 10 35 8 9 18 17 8 13 - 2Ky. 5 8 2 3 8 5 2 3 - 2Tenn. 1 15 3 3 4 7 2 6 - -Ala. 4 8 3 3 6 3 3 3 - -Miss. - 4 - - - 2 1 1 - -
W.S. CENTRAL 3 15 3 22 2 53 3 42 - 1Ark. - - - 1 - - 1 3 - -La. 1 6 - - 1 3 2 3 - -Okla. 2 3 3 1 - - - 2 - -Tex. - 6 - 20 1 50 - 34 - 1
MOUNTAIN 20 26 17 23 12 5 24 27 - 1Mont. 1 - - - - - - 2 - -Idaho - 1 2 1 2 2 - 3 - 1Wyo. 4 2 - 1 - 1 - - - -Colo. 4 10 2 5 3 - 13 14 - -N. Mex. 1 1 2 5 1 - 1 1 - -Ariz. 3 8 8 5 2 - 4 3 - -Utah 6 2 3 1 3 - 3 2 - -Nev. 1 2 - 5 1 2 3 2 - -
PACIFIC 31 34 42 54 59 42 95 111 3 42Wash. 3 6 3 3 - 1 9 4 - 15Oreg. N N 2 4 7 4 4 8 - 2Calif. 28 23 32 46 51 35 74 91 3 19Alaska - 1 - - 1 2 2 1 - -Hawaii - 4 5 1 N N 6 7 - 6
Guam - - - - - - - - - -P.R. - 2 1 - N N - 3 - -V.I. - - - - - - - - - -Amer. Samoa U U U U U U U U U UC.N.M.I. - U - U - U - U - U
TABLE II. (Continued) Provisional cases of selected notifiable diseases, United States, weeks ending June 29, 2002, and June 30, 2001(26th Week)*
MeaslesLegionellosis Listeriosis Lyme Disease Malaria Total
Cum. Cum. Cum. Cum. Cum. Cum. Cum. Cum. Cum. Cum.Reporting Area 2002 2001 2002 2001 2002 2001 2002 2001 2002 2001

580 MMWR July 5, 2002
N: Not notifiable. U: Unavailable. - : No reported cases.* Incidence data for reporting year 2001 and 2002 are provisional and cumulative (year-to-date).
UNITED STATES 894 1,447 148 116 2,884 2,506 2,575 3,450
NEW ENGLAND 60 71 7 - 303 236 387 309Maine 4 1 - - 3 - 22 36N.H. 7 9 4 - 6 10 11 6Vt. 4 4 - - 49 23 58 37Mass. 30 42 2 - 238 187 132 106R.I. 4 2 - - 1 2 29 29Conn. 11 13 1 - 6 14 135 95
MID. ATLANTIC 84 152 14 12 142 170 449 547Upstate N.Y. 31 44 2 2 101 96 273 337N.Y. City 11 25 1 7 7 30 10 14N.J. 11 25 1 - 3 8 67 92Pa. 31 58 10 3 31 36 99 104
E.N. CENTRAL 141 205 17 17 342 288 34 36Ohio 53 57 3 1 203 155 10 14Ind. 23 22 1 1 22 20 7 1Ill. 27 49 6 12 55 34 7 4Mich. 26 47 7 2 32 27 10 11Wis. 12 30 - 1 30 52 - 6
W.N. CENTRAL 80 97 11 5 280 116 203 182Minn. 20 14 3 2 92 31 16 18Iowa 11 20 - - 97 15 28 40Mo. 32 35 3 - 56 51 19 14N. Dak. - 5 1 - - - 11 24S. Dak. 2 4 - - 5 3 32 25Nebr. 10 10 - 1 4 2 - 1Kans. 5 9 4 2 26 14 97 60
S. ATLANTIC 152 213 17 17 194 117 1,123 1,203Del. 6 1 - - 2 - 24 22Md. 4 31 3 4 21 18 138 251D.C. - - - - 1 1 - -Va. 27 25 3 2 88 12 256 218W. Va. - 6 - - 6 1 85 65N.C. 17 50 1 1 20 40 329 299S.C. 14 22 2 1 26 21 41 66Ga. 21 33 4 7 14 14 132 183Fla. 63 45 4 2 16 10 118 99
E.S. CENTRAL 52 92 10 3 76 47 80 140Ky. 8 15 4 1 22 13 13 11Tenn. 21 38 2 - 36 18 48 106Ala. 15 29 2 - 18 13 19 23Miss. 8 10 2 2 - 3 - -
W.S. CENTRAL 54 226 11 9 656 228 57 709Ark. 20 12 - - 315 11 - -La. 17 55 1 2 4 4 - 4Okla. 16 18 - - 34 9 57 42Tex. 1 141 10 7 303 204 - 663
MOUNTAIN 61 70 9 8 424 881 115 130Mont. 2 2 - - 2 9 5 18Idaho 3 7 1 - 46 163 2 2Wyo. - 4 - 1 7 - 13 20Colo. 20 27 2 2 170 163 16 -N. Mex. 3 8 - 2 68 48 4 4Ariz. 18 11 - 1 89 461 72 84Utah 4 7 4 1 26 26 2 1Nev. 11 4 2 1 16 11 1 1
PACIFIC 210 321 52 45 467 423 127 194Wash. 38 42 - 1 174 66 - -Oreg. 33 37 N N 88 26 2 -Calif. 132 232 43 25 196 312 101 157Alaska 1 2 - 1 2 1 24 37Hawaii 6 8 9 18 7 18 - -
Guam - - - - - - - -P.R. 2 4 - - 1 - 41 60V.I. - - - - - - - -Amer. Samoa U U U U U U U UC.N.M.I. - U - U - U - U
TABLE II. (Continued) Provisional cases of selected notifiable diseases, United States, weeks ending June 29, 2002, and June 30, 2001(26th Week)*
MeningococcalDisease Mumps Pertussis Rabies, Animal
Cum. Cum. Cum. Cum. Cum. Cum. Cum. Cum.Reporting Area 2002 2001 2002 2001 2002 2001 2002 2001

Vol. 51 / No. 26 MMWR 581
N: Not notifiable. U: Unavailable. - : No reported cases.* Incidence data for reporting year 2001 and 2002 are provisional and cumulative (year-to-date).
UNITED STATES 272 155 6 14 2 - 13,358 14,894
NEW ENGLAND - 2 - - - - 811 1,091Maine - - - - - - 67 101N.H. - - - - - - 46 87Vt. - - - - - - 29 35Mass. - 2 - - - - 451 623R.I. - - - - - - 53 54Conn. - - - - - - 165 191
MID. ATLANTIC 14 11 2 5 - - 1,697 2,018Upstate N.Y. 3 - 1 1 - - 597 454N.Y. City 2 1 - 3 - - 565 546N.J. 2 2 1 1 - - 188 468Pa. 7 8 - - - - 347 550
E.N. CENTRAL 4 10 - 2 - - 2,213 2,061Ohio 4 1 - - - - 624 615Ind. - 1 - - - - 185 192Ill. - 8 - 2 - - 689 573Mich. - - - - - - 397 359Wis. - - - - - - 318 322
W.N. CENTRAL 37 28 - 3 - - 1,030 883Minn. - - - - - - 228 274Iowa 1 1 - 1 - - 162 137Mo. 36 25 - 1 - - 401 214N. Dak. - - - - - - 25 15S. Dak. - 2 - - - - 38 55Nebr. - - - - - - 51 64Kans. - - - 1 - - 125 124
S. ATLANTIC 170 56 2 3 - - 3,238 3,144Del. 2 - - - - - 20 33Md. 21 11 1 - - - 332 331D.C. - - - - - - 36 33Va. 7 4 - - - - 364 498W. Va. 1 - - - - - 43 49N.C. 92 23 - - - - 495 461S.C. 28 10 - 2 - - 193 323Ga. 16 5 - - - - 749 571Fla. 3 3 1 1 - - 1,006 845
E.S. CENTRAL 28 34 - - 1 - 833 836Ky. 2 1 - - - - 129 148Tenn. 18 27 - - 1 - 214 223Ala. 8 3 - - - - 267 242Miss. - 3 - - - - 223 223
W.S. CENTRAL 13 9 1 - - - 516 1,749Ark. - 4 - - - - 259 219La. - 1 - - - - 97 310Okla. 13 4 - - - - 158 121Tex. - - 1 - - - 2 1,099
MOUNTAIN 5 5 - - - - 943 925Mont. 1 1 - - - - 42 37Idaho - 1 - - - - 57 57Wyo. 2 1 - - - - 27 30Colo. 1 - - - - - 244 253N. Mex. - - - - - - 130 114Ariz. - - - - - - 277 254Utah - 2 - - - - 73 102Nev. 1 - - - - - 93 78
PACIFIC 1 - 1 1 1 - 2,077 2,187Wash. - - - - - - 179 208Oreg. - - - - - - 190 128Calif. 1 - 1 - - - 1,549 1,667Alaska - - - - - - 36 23Hawaii - - - 1 1 - 123 161
Guam - - - - - - - 9P.R. - - - 3 - - 69 454V.I. - - - - - - - -Amer. Samoa U U U U U U U UC.N.M.I. - U - U - U 18 U
TABLE II. (Continued) Provisional cases of selected notifiable diseases, United States, weeks ending June 29, 2002, and June 30, 2001(26th Week)*
RubellaRocky Mountain CongenitalSpotted Fever Rubella Rubella Salmonellosis
Cum. Cum. Cum. Cum. Cum. Cum. Cum. Cum.Reporting Area 2002 2001 2002 2001 2002 2001 2002 2001
582 MMWR July 5, 2002
N: Not notifiable. U: Unavailable. - : No reported cases.* Incidence data for reporting year 2001 and 2002 are provisional and cumulative (year-to-date).
UNITED STATES 6,284 7,224 2,293 2,192 1,251 1,742 124 312
NEW ENGLAND 116 119 111 156 8 81 15 70Maine 3 4 14 10 - - - -N.H. 4 2 23 9 - - - -Vt. - 3 9 9 3 7 1 -Mass. 83 80 55 49 N N 14 41R.I. 5 8 10 6 5 - - 2Conn. 21 22 - 73 - 74 - 27
MID. ATLANTIC 370 785 405 375 75 110 41 71Upstate N.Y. 81 298 204 162 67 108 41 71N.Y. City 183 213 101 117 U U - -N.J. 48 139 71 63 - - - -Pa. 58 135 29 33 8 2 - -
E.N. CENTRAL 645 1,105 336 531 107 117 35 79Ohio 326 480 139 135 - - 1 -Ind. 37 119 21 42 102 117 24 36Ill. 172 246 4 173 2 - - 28Mich. 69 147 172 135 3 - 10 15Wis. 41 113 - 46 - - - -
W.N. CENTRAL 555 709 161 216 144 83 25 31Minn. 116 236 82 80 48 40 25 24Iowa 51 170 - - - - - -Mo. 69 126 35 55 6 9 - -N. Dak. 15 13 - 7 1 2 - 7S. Dak. 147 83 9 7 1 3 - -Nebr. 104 38 13 23 23 9 - -Kans. 53 43 22 44 65 20 - -
S. ATLANTIC 2,492 1,007 457 393 767 919 6 4Del. 8 4 1 2 3 2 - -Md. 430 53 73 30 - - - -D.C. 29 24 5 3 33 3 1 3Va. 453 94 50 56 - - - -W. Va. 3 5 10 14 34 34 - 1N.C. 145 190 89 90 - - - -S.C. 43 127 27 7 121 194 5 -Ga. 834 131 122 127 249 270 - -Fla. 547 379 80 64 327 416 - -
E.S. CENTRAL 592 721 63 47 86 170 - -Ky. 62 268 9 18 10 18 - -Tenn. 27 48 54 29 76 151 - -Ala. 294 126 - - - 1 - -Miss. 209 279 - - - - - -
W.S. CENTRAL 371 1,379 36 209 39 232 2 57Ark. 97 348 4 - 5 13 - -La. 60 139 - - 25 189 1 57Okla. 213 19 31 27 9 30 1 -Tex. 1 873 1 182 - - - -
MOUNTAIN 277 383 398 239 25 29 - -Mont. 2 - - - - - - -Idaho 2 17 5 4 - - - -Wyo. 3 2 7 7 8 5 - -Colo. 55 74 144 95 - - - -N. Mex. 55 56 64 49 17 22 - -Ariz. 126 179 173 81 - - - -Utah 19 25 5 3 - - - -Nev. 15 30 - - - 2 - -
PACIFIC 866 1,016 326 26 - 1 - -Wash. 52 83 36 - - - - -Oreg. 45 53 - - - - - -Calif. 743 851 254 - - - - -Alaska 2 4 - - - - - -Hawaii 24 25 36 26 - 1 - -
Guam - 29 - 1 - - - -P.R. 1 10 - - - - - -V.I. - - - - - - - -Amer. Samoa U U U U - - U UC.N.M.I. 10 U - U - - - U
TABLE II. (Continued) Provisional cases of selected notifiable diseases, United States, weeks ending June 29, 2002, and June 30, 2001(26th Week)*
Streptococcal Disease, Streptococcus pneumoniae, Streptococcus pneumoniae,Shigellosis Invasive, Group A Drug Resistant, Invasive Invasive (<5 Years)
Cum. Cum. Cum. Cum. Cum. Cum. Cum. Cum.Reporting Area 2002 2001 2002 2001 2002 2001 2002 2001

Vol. 51 / No. 26 MMWR 583
N: Not notifiable. U: Unavailable. - : No reported cases.* Incidence data for reporting year 2001 and 2002 are provisional and cumulative (year-to-date).
UNITED STATES 2,931 2,819 145 266 5,265 6,415 117 151
NEW ENGLAND 59 24 - 3 192 229 10 7Maine - - - - 5 9 - 1N.H. 1 1 - - 7 11 - 1Vt. 1 2 - - - 4 - -Mass. 44 13 - 2 101 110 8 4R.I. 2 3 - - 26 37 - -Conn. 11 5 - 1 53 58 2 1
MID. ATLANTIC 322 239 23 38 1,013 1,087 32 48Upstate N.Y. 20 9 3 2 149 153 4 11N.Y. City 194 135 10 19 530 558 18 18N.J. 58 45 10 17 239 248 9 18Pa. 50 50 - - 95 128 1 1
E.N. CENTRAL 518 502 24 40 526 648 13 19Ohio 69 47 - 2 86 123 4 2Ind. 35 90 - 5 53 44 2 2Ill. 129 149 18 26 270 329 1 9Mich. 277 199 6 4 111 116 3 3Wis. 8 17 - 3 6 36 3 3
W.N. CENTRAL 48 41 - 5 242 249 4 6Minn. 18 19 - 1 108 106 3 2Iowa - 2 - - 14 18 - -Mo. 16 9 - 3 71 59 1 4N. Dak. - - - - 1 3 - -S. Dak. - - - - 9 6 - -Nebr. 4 1 - - 9 19 - -Kans. 10 10 - 1 30 38 - -
S. ATLANTIC 748 999 30 68 1,023 1,265 13 19Del. 8 8 - - 7 9 - -Md. 90 131 3 2 120 103 2 5D.C. 44 14 1 2 - 37 - -Va. 37 60 1 3 77 118 - 5W. Va. - - - - 10 15 - -N.C. 152 233 13 8 155 173 - 1S.C. 62 141 3 18 80 113 - -Ga. 112 157 1 13 167 223 7 6Fla. 243 255 8 22 407 474 4 2
E.S. CENTRAL 266 296 10 21 355 409 4 -Ky. 44 23 2 - 62 61 4 -Tenn. 106 165 3 13 133 149 - -Ala. 88 50 4 4 114 135 - -Miss. 28 58 1 4 46 64 - -
W.S. CENTRAL 408 342 39 44 701 1,036 - 10Ark. 12 21 1 5 66 67 - -La. 65 67 - - - 65 - -Okla. 30 34 2 3 62 68 - -Tex. 301 220 36 36 573 836 - 10
MOUNTAIN 147 109 9 14 161 236 8 6Mont. - - - - 4 - - 1Idaho 7 - 1 - 8 3 - -Wyo. - - - - 2 1 - -Colo. 10 15 1 - 22 63 4 -N. Mex. 21 9 - 1 17 33 - -Ariz. 100 76 7 13 92 85 - 1Utah 6 6 - - 14 11 3 -Nev. 3 3 - - 2 40 1 4
PACIFIC 415 267 10 33 1,052 1,256 33 36Wash. 24 31 1 - 111 110 3 3Oreg. 5 7 - - 45 50 2 3Calif. 381 223 9 33 799 995 28 28Alaska - - - - 28 23 - -Hawaii 5 6 - - 69 78 - 2
Guam - 2 - - - 36 - 1P.R. 120 134 10 2 33 47 - -V.I. - - - - - - - -Amer. Samoa U U U U U U U UC.N.M.I. 13 U - U 27 U - U
TABLE II. (Continued) Provisional cases of selected notifiable diseases, United States, weeks ending June 29, 2002, and June 30, 2001(26th Week)*
Syphilis TyphoidPrimary & Secondary Congenital Tuberculosis FeverCum. Cum. Cum. Cum. Cum. Cum. Cum. Cum.
Reporting Area 2002 2001 2002 2001 2002 2001 2002 2001
584 MMWR July 5, 2002
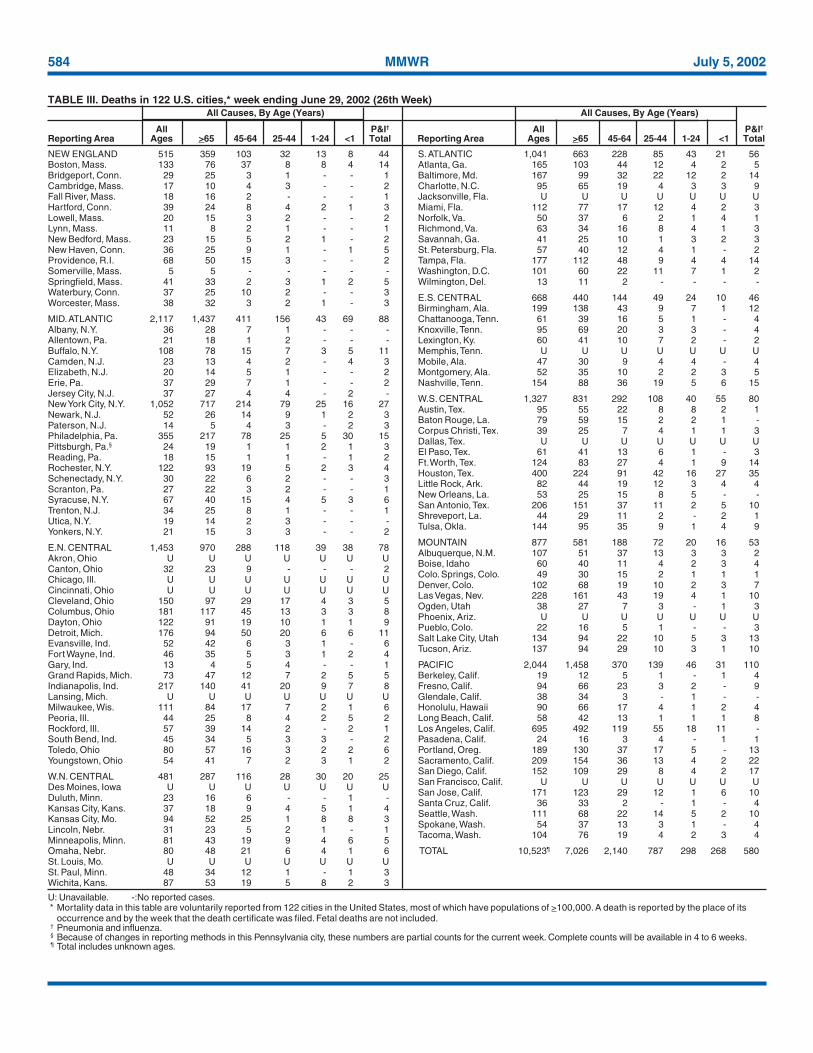
NEW ENGLAND 515 359 103 32 13 8 44Boston, Mass. 133 76 37 8 8 4 14Bridgeport, Conn. 29 25 3 1 - - 1Cambridge, Mass. 17 10 4 3 - - 2Fall River, Mass. 18 16 2 - - - 1Hartford, Conn. 39 24 8 4 2 1 3Lowell, Mass. 20 15 3 2 - - 2Lynn, Mass. 11 8 2 1 - - 1New Bedford, Mass. 23 15 5 2 1 - 2New Haven, Conn. 36 25 9 1 - 1 5Providence, R.I. 68 50 15 3 - - 2Somerville, Mass. 5 5 - - - - -Springfield, Mass. 41 33 2 3 1 2 5Waterbury, Conn. 37 25 10 2 - - 3Worcester, Mass. 38 32 3 2 1 - 3
MID. ATLANTIC 2,117 1,437 411 156 43 69 88Albany, N.Y. 36 28 7 1 - - -Allentown, Pa. 21 18 1 2 - - -Buffalo, N.Y. 108 78 15 7 3 5 11Camden, N.J. 23 13 4 2 - 4 3Elizabeth, N.J. 20 14 5 1 - - 2Erie, Pa. 37 29 7 1 - - 2Jersey City, N.J. 37 27 4 4 - 2 -New York City, N.Y. 1,052 717 214 79 25 16 27Newark, N.J. 52 26 14 9 1 2 3Paterson, N.J. 14 5 4 3 - 2 3Philadelphia, Pa. 355 217 78 25 5 30 15Pittsburgh, Pa.§ 24 19 1 1 2 1 3Reading, Pa. 18 15 1 1 - 1 2Rochester, N.Y. 122 93 19 5 2 3 4Schenectady, N.Y. 30 22 6 2 - - 3Scranton, Pa. 27 22 3 2 - - 1Syracuse, N.Y. 67 40 15 4 5 3 6Trenton, N.J. 34 25 8 1 - - 1Utica, N.Y. 19 14 2 3 - - -Yonkers, N.Y. 21 15 3 3 - - 2
E.N. CENTRAL 1,453 970 288 118 39 38 78Akron, Ohio U U U U U U UCanton, Ohio 32 23 9 - - - 2Chicago, Ill. U U U U U U UCincinnati, Ohio U U U U U U UCleveland, Ohio 150 97 29 17 4 3 5Columbus, Ohio 181 117 45 13 3 3 8Dayton, Ohio 122 91 19 10 1 1 9Detroit, Mich. 176 94 50 20 6 6 11Evansville, Ind. 52 42 6 3 1 - 6Fort Wayne, Ind. 46 35 5 3 1 2 4Gary, Ind. 13 4 5 4 - - 1Grand Rapids, Mich. 73 47 12 7 2 5 5Indianapolis, Ind. 217 140 41 20 9 7 8Lansing, Mich. U U U U U U UMilwaukee, Wis. 111 84 17 7 2 1 6Peoria, Ill. 44 25 8 4 2 5 2Rockford, Ill. 57 39 14 2 - 2 1South Bend, Ind. 45 34 5 3 3 - 2Toledo, Ohio 80 57 16 3 2 2 6Youngstown, Ohio 54 41 7 2 3 1 2
W.N. CENTRAL 481 287 116 28 30 20 25Des Moines, Iowa U U U U U U UDuluth, Minn. 23 16 6 - - 1 -Kansas City, Kans. 37 18 9 4 5 1 4Kansas City, Mo. 94 52 25 1 8 8 3Lincoln, Nebr. 31 23 5 2 1 - 1Minneapolis, Minn. 81 43 19 9 4 6 5Omaha, Nebr. 80 48 21 6 4 1 6St. Louis, Mo. U U U U U U USt. Paul, Minn. 48 34 12 1 - 1 3Wichita, Kans. 87 53 19 5 8 2 3
S. ATLANTIC 1,041 663 228 85 43 21 56Atlanta, Ga. 165 103 44 12 4 2 5Baltimore, Md. 167 99 32 22 12 2 14Charlotte, N.C. 95 65 19 4 3 3 9Jacksonville, Fla. U U U U U U UMiami, Fla. 112 77 17 12 4 2 3Norfolk, Va. 50 37 6 2 1 4 1Richmond, Va. 63 34 16 8 4 1 3Savannah, Ga. 41 25 10 1 3 2 3St. Petersburg, Fla. 57 40 12 4 1 - 2Tampa, Fla. 177 112 48 9 4 4 14Washington, D.C. 101 60 22 11 7 1 2Wilmington, Del. 13 11 2 - - - -
E.S. CENTRAL 668 440 144 49 24 10 46Birmingham, Ala. 199 138 43 9 7 1 12Chattanooga, Tenn. 61 39 16 5 1 - 4Knoxville, Tenn. 95 69 20 3 3 - 4Lexington, Ky. 60 41 10 7 2 - 2Memphis, Tenn. U U U U U U UMobile, Ala. 47 30 9 4 4 - 4Montgomery, Ala. 52 35 10 2 2 3 5Nashville, Tenn. 154 88 36 19 5 6 15
W.S. CENTRAL 1,327 831 292 108 40 55 80Austin, Tex. 95 55 22 8 8 2 1Baton Rouge, La. 79 59 15 2 2 1 -Corpus Christi, Tex. 39 25 7 4 1 1 3Dallas, Tex. U U U U U U UEl Paso, Tex. 61 41 13 6 1 - 3Ft. Worth, Tex. 124 83 27 4 1 9 14Houston, Tex. 400 224 91 42 16 27 35Little Rock, Ark. 82 44 19 12 3 4 4New Orleans, La. 53 25 15 8 5 - -San Antonio, Tex. 206 151 37 11 2 5 10Shreveport, La. 44 29 11 2 - 2 1Tulsa, Okla. 144 95 35 9 1 4 9
MOUNTAIN 877 581 188 72 20 16 53Albuquerque, N.M. 107 51 37 13 3 3 2Boise, Idaho 60 40 11 4 2 3 4Colo. Springs, Colo. 49 30 15 2 1 1 1Denver, Colo. 102 68 19 10 2 3 7Las Vegas, Nev. 228 161 43 19 4 1 10Ogden, Utah 38 27 7 3 - 1 3Phoenix, Ariz. U U U U U U UPueblo, Colo. 22 16 5 1 - - 3Salt Lake City, Utah 134 94 22 10 5 3 13Tucson, Ariz. 137 94 29 10 3 1 10
PACIFIC 2,044 1,458 370 139 46 31 110Berkeley, Calif. 19 12 5 1 - 1 4Fresno, Calif. 94 66 23 3 2 - 9Glendale, Calif. 38 34 3 - 1 - -Honolulu, Hawaii 90 66 17 4 1 2 4Long Beach, Calif. 58 42 13 1 1 1 8Los Angeles, Calif. 695 492 119 55 18 11 -Pasadena, Calif. 24 16 3 4 - 1 1Portland, Oreg. 189 130 37 17 5 - 13Sacramento, Calif. 209 154 36 13 4 2 22San Diego, Calif. 152 109 29 8 4 2 17San Francisco, Calif. U U U U U U USan Jose, Calif. 171 123 29 12 1 6 10Santa Cruz, Calif. 36 33 2 - 1 - 4Seattle, Wash. 111 68 22 14 5 2 10Spokane, Wash. 54 37 13 3 1 - 4Tacoma, Wash. 104 76 19 4 2 3 4
TOTAL 10,523¶ 7,026 2,140 787 298 268 580
U: Unavailable. -:No reported cases.* Mortality data in this table are voluntarily reported from 122 cities in the United States, most of which have populations of >100,000. A death is reported by the place of its
occurrence and by the week that the death certificate was filed. Fetal deaths are not included.† Pneumonia and influenza.§ Because of changes in reporting methods in this Pennsylvania city, these numbers are partial counts for the current week. Complete counts will be available in 4 to 6 weeks.¶ Total includes unknown ages.
TABLE III. Deaths in 122 U.S. cities,* week ending June 29, 2002 (26th Week)All Causes, By Age (Years) All Causes, By Age (Years)
All P&I† All P&I†
Reporting Area Ages >65 45-64 25-44 1-24 <1 Total Reporting Area Ages >65 45-64 25-44 1-24 <1 Total

Vol. 51 / No. 26 MMWR 585

586 MMWR July 5, 2002

Vol. 51 / No. 26 MMWR 587
All MMWR references are available on the Internet at http://www.cdc.gov/mmwr. Use the search function to find specific articles.——————
Use of trade names and commercial sources is for identification only and does not imply endorsement by the U.S. Department of Healthand Human Services.
——————References to non-CDC sites on the Internet are provided as a service to MMWR readers and do not constitute or imply endorsement ofthese organizations or their programs by CDC or the U.S. Department of Health and Human Services. CDC is not responsible for thecontent of these sites. URL addresses listed in MMWR were current as of the date of publication.

MMWR
The Morbidity and Mortality Weekly Report (MMWR) Series is prepared by the Centers for Disease Control and Prevention (CDC) andis available free of charge in electronic format and on a paid subscription basis for paper copy. To receive an electronic copy each week, sendan e-mail message to [email protected]. The body content should read SUBscribe mmwr-toc. Electronic copy also is available fromCDC’s World-Wide Web server at http://www.cdc.gov/mmwr or from CDC’s file transfer protocol server at ftp://ftp.cdc.gov/pub/publications/mmwr. To subscribe for paper copy, contact Superintendent of Documents, U.S. Government Printing Office, Washington, DC 20402;telephone 202-512-1800.
Data in the weekly MMWR are provisional, based on weekly reports to CDC by state health departments. The reporting week concludesat close of business on Friday; compiled data on a national basis are officially released to the public on the following Friday. Addressinquiries about the MMWR Series, including material to be considered for publication, to Editor, MMWR Series, Mailstop C-08, CDC,1600 Clifton Rd., N.E., Atlanta, GA 30333; telephone 888-232-3228.
All material in the MMWR Series is in the public domain and may be used and reprinted without permission; citation as to source,however, is appreciated.
✩U.S. Government Printing Office: 2002-733-100/69040 Region IV
588 July 5, 2002