Embed Size (px)
Citation preview

1
Morang District Profile
& Annual Report
2061/62 Fiscal Year
Editor Nawa Raj Subba
Ministry of Health Department of Health Services
Eastern Regional Heath Directorate District Public Health Office
Morang, Nepal
2
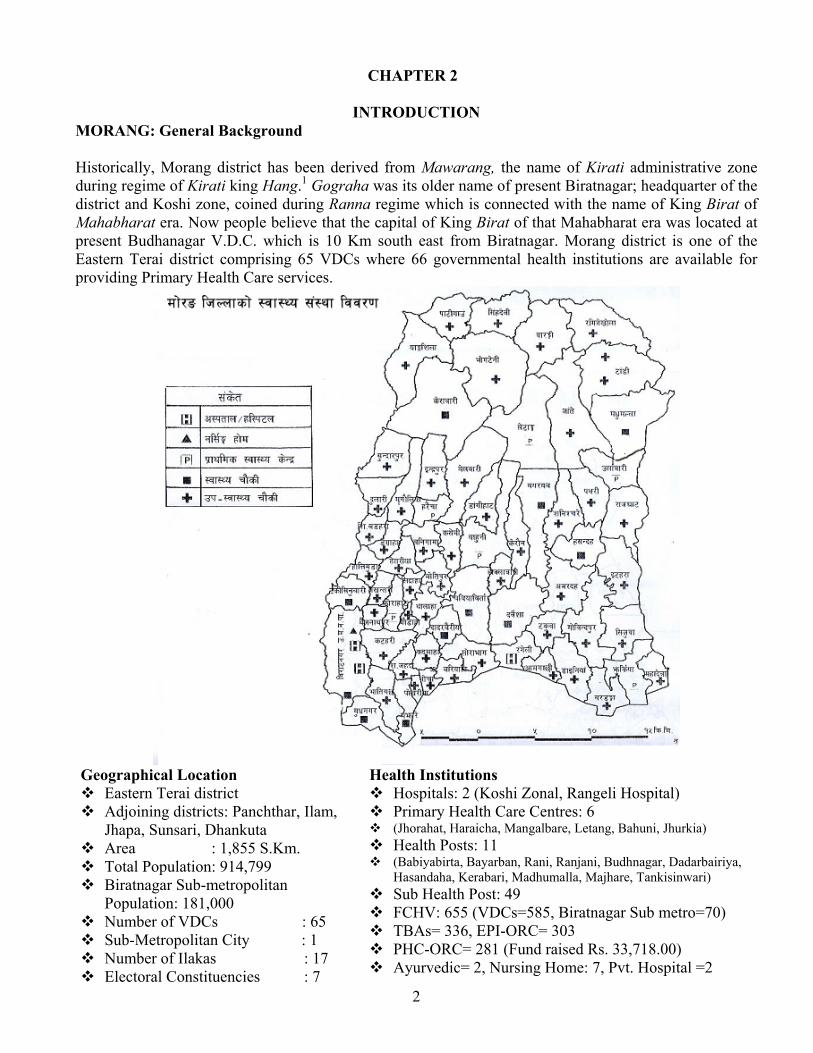
CHAPTER 2
INTRODUCTION MORANG: General Background Historically, Morang district has been derived from Mawarang, the name of Kirati administrative zone during regime of Kirati king Hang.1 Gograha was its older name of present Biratnagar; headquarter of the district and Koshi zone, coined during Ranna regime which is connected with the name of King Birat of Mahabharat era. Now people believe that the capital of King Birat of that Mahabharat era was located at present Budhanagar V.D.C. which is 10 Km south east from Biratnagar. Morang district is one of the Eastern Terai district comprising 65 VDCs where 66 governmental health institutions are available for providing Primary Health Care services.
Geographical Location
Eastern Terai district Adjoining districts: Panchthar, Ilam,
Jhapa, Sunsari, Dhankuta Area : 1,855 S.Km. Total Population: 914,799 Biratnagar Sub-metropolitan
Population: 181,000 Number of VDCs : 65 Sub-Metropolitan City : 1 Number of Ilakas : 17 Electoral Constituencies : 7
Health Institutions Hospitals: 2 (Koshi Zonal, Rangeli Hospital) Primary Health Care Centres: 6 (Jhorahat, Haraicha, Mangalbare, Letang, Bahuni, Jhurkia) Health Posts: 11 (Babiyabirta, Bayarban, Rani, Ranjani, Budhnagar, Dadarbairiya,
Hasandaha, Kerabari, Madhumalla, Majhare, Tankisinwari) Sub Health Post: 49 FCHV: 655 (VDCs=585, Biratnagar Sub metro=70) TBAs= 336, EPI-ORC= 303 PHC-ORC= 281 (Fund raised Rs. 33,718.00) Ayurvedic= 2, Nursing Home: 7, Pvt. Hospital =2
3
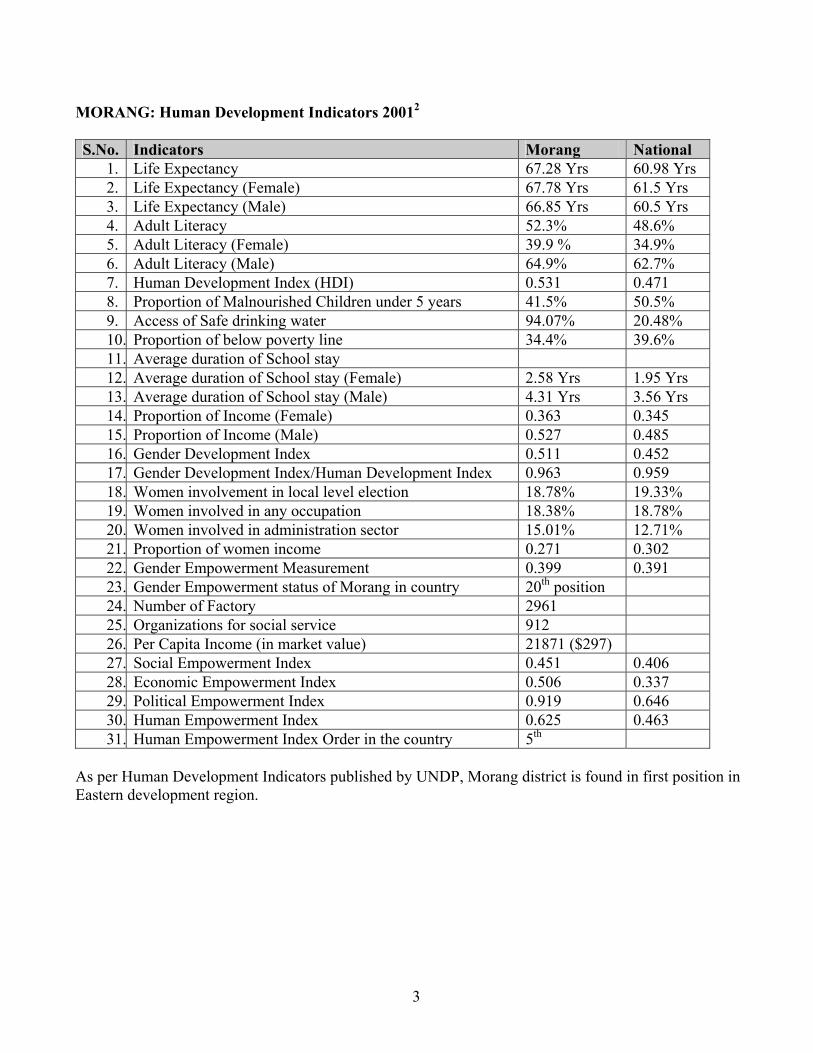
MORANG: Human Development Indicators 20012 S.No. Indicators Morang National
1. Life Expectancy 67.28 Yrs 60.98 Yrs 2. Life Expectancy (Female) 67.78 Yrs 61.5 Yrs 3. Life Expectancy (Male) 66.85 Yrs 60.5 Yrs 4. Adult Literacy 52.3% 48.6% 5. Adult Literacy (Female) 39.9 % 34.9% 6. Adult Literacy (Male) 64.9% 62.7% 7. Human Development Index (HDI) 0.531 0.471 8. Proportion of Malnourished Children under 5 years 41.5% 50.5% 9. Access of Safe drinking water 94.07% 20.48% 10. Proportion of below poverty line 34.4% 39.6% 11. Average duration of School stay 12. Average duration of School stay (Female) 2.58 Yrs 1.95 Yrs 13. Average duration of School stay (Male) 4.31 Yrs 3.56 Yrs 14. Proportion of Income (Female) 0.363 0.345 15. Proportion of Income (Male) 0.527 0.485 16. Gender Development Index 0.511 0.452 17. Gender Development Index/Human Development Index 0.963 0.959 18. Women involvement in local level election 18.78% 19.33% 19. Women involved in any occupation 18.38% 18.78% 20. Women involved in administration sector 15.01% 12.71% 21. Proportion of women income 0.271 0.302 22. Gender Empowerment Measurement 0.399 0.391 23. Gender Empowerment status of Morang in country 20th position 24. Number of Factory 2961 25. Organizations for social service 912 26. Per Capita Income (in market value) 21871 ($297) 27. Social Empowerment Index 0.451 0.406 28. Economic Empowerment Index 0.506 0.337 29. Political Empowerment Index 0.919 0.646 30. Human Empowerment Index 0.625 0.463 31. Human Empowerment Index Order in the country 5th
As per Human Development Indicators published by UNDP, Morang district is found in first position in Eastern development region.

4
CHAPTER 2
ANNUAL REPORT (F.Y. 2061/62)
Table 1 Target Population (Programme wise)
Population: 914799 Male: 458772 Female: 456027 Under 1 year's population: 22870 Under 3 year's population: 70352 Under 5 year's population: 118289 MWRA: 174510 Expected Pregnancy: 34945
Major Achievements 1. CHILD HEALTH 1.1 Expanded Programme on Immunization (EPI) 1.1.1 Background: EPI is a priority national programme of HMG/N which has been running nation wide since 1989. Active surveillance system is weak; therefore it is difficult to measure the impact of the programme. However, there is no doubt that the programme has contributed significantly towards reduction of infant and child mortality as evidence by reduction of IMR and U5MR over the last decade3. According to the Annual Report published by Ministry of Health, Department of Health Services4 noted that measles vaccine coverage rate of Rauthahat was 120 percent, National 85 percent, Eastern development region 88 percent and Morang 95 percent in FY 2060/61. However the BCHIMES5 survey conducted in early 2000 and DHS survey 20016 indicate that the actual coverage is lower than the reported coverage by 5-10%. The Multi Year Plan of Action 2002-2007 (MYPOA) has set six objectives: 1) increasing routine immunization coverage to >90% and maintain the level; 2) eradication of poliomyelitis by 2005; 3) elimination of MNT by 2005; 4) reduction of measles cases and deaths; and 5) introduction of Hep-B vaccine and 6) promotion of safe injection practices in immunization programme. 1.1.2 Objectives: • To eliminate neonatal tetanus (less than 1 cases per 1000 live births) by the year 2005; • To reduce measles cases by 90% and measles death by 95% from the previous level by the year
2005. • To obtain certificate of poliomyelitis eradication by the year 2005. • To introduce new vaccine (Hepatitis B).
1.1.3 Targets: The target population for BCG, DPT, OPV, and Measles vaccines is all infants under one year (12 months) of age. For TT+, the target population is all pregnant women. The EPI covers all the 16 districts in eastern region. It aims to have uniform coverage in all the districts and sustain high levels of coverage (i.e. at least 80% for BCG, DPT 3, OPV 3, and Measles in children under one year and 80% coverage for TT+ vaccine in pregnant women.

5
1.1.4 Strategies:
• Immunization service delivery mainly through outreach sessions, provision of immunization services by conducting 3-5 sessions per VDC per month, in the district.
• Use of all fixed sites to increase immunization coverage. EPI services provided through fixed health facilities including Hospitals, PHC, HP, SHP and other health clinics.
• Supplementary immunization activities (NIDs, SNIDs, Mopping up) for polio eradication and MNTE activities for maternal and neonatal tetanus elimination.
• Control of outbreak of VPDs through appropriate interventions. 1.1.5 Analysis: Table 2 Target Vs Achievement
Program/ Activities
Units Target Achievement % Achieved
% expenditure wrt released
budget
Reasons for not achieve
100% BCG Person 22550 21451 94
DPT3 ,, 22550 16704 73
Polio3 ,, 22550 18368 82
Hep-3 ,, 22550 20593 91
MEASLES 22550 18363 81
TT2 35006 21673 62
Cold Chain training
Times 1 1 100
Micro Planning/ DDC Orientation
,, 1 1 100
75.8
1. Measles Campaign, 2. Frequent training for health workers due to piloting programmes, 3. Shortage in supply of vaccine for 3 months.
Graph 1 Trend of Measles vaccination coverage
Trend of Measles Vaccination Coverage
76 77 75 82 90 9583
0102030405060708090
100
1998/99 1999/00 2000/01 2001/02 2002/032003/042004/05
Trend of measles vaccination seems running above 75 percent over past 7 years. This year coverage was dropped to 82 percent due to measles campaign, frequent movement of health workers due to series of trainings, and shortage of vaccine supply for three months.
6
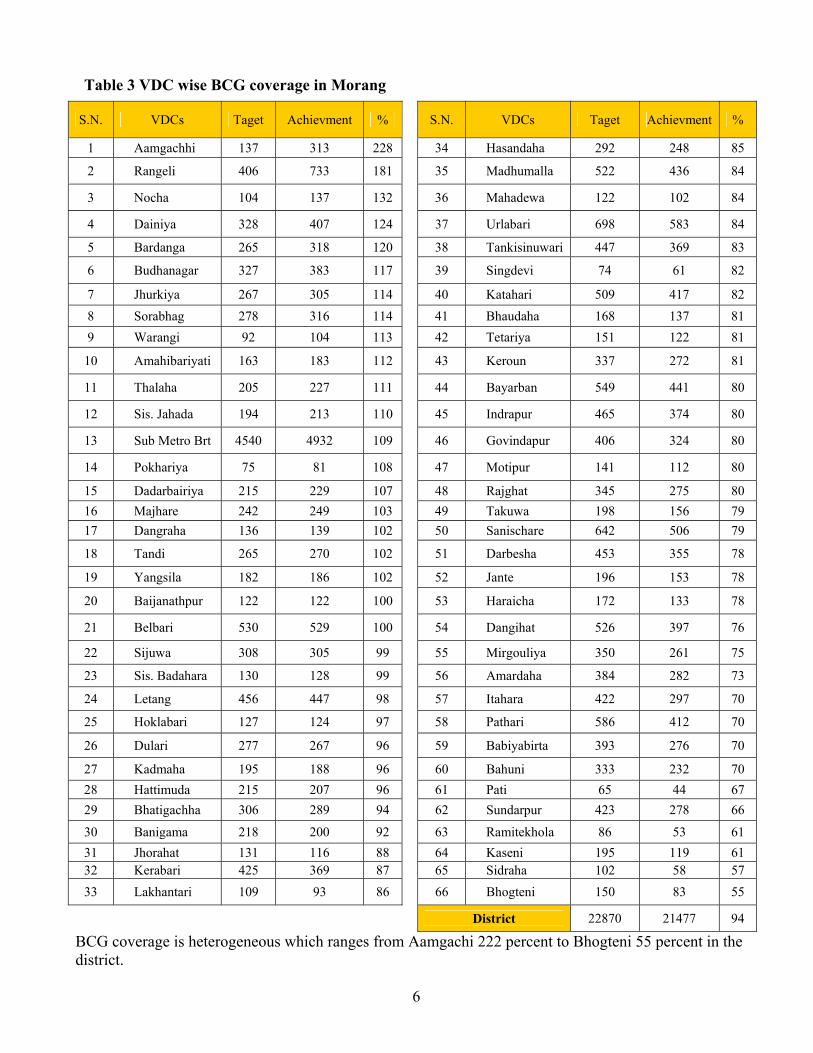
BCG coverage is heterogeneous which ranges from Aamgachi 222 percent to Bhogteni 55 percent in the district.
Table 3 VDC wise BCG coverage in Morang
S.N. VDCs Taget Achievment % S.N. VDCs Taget Achievment %
1 Aamgachhi 137 313 228 34 Hasandaha 292 248 85
2 Rangeli 406 733 181 35 Madhumalla 522 436 84
3 Nocha 104 137 132 36 Mahadewa 122 102 84
4 Dainiya 328 407 124 37 Urlabari 698 583 84
5 Bardanga 265 318 120 38 Tankisinuwari 447 369 83
6 Budhanagar 327 383 117 39 Singdevi 74 61 82
7 Jhurkiya 267 305 114 40 Katahari 509 417 82 8 Sorabhag 278 316 114 41 Bhaudaha 168 137 81 9 Warangi 92 104 113 42 Tetariya 151 122 81
10 Amahibariyati 163 183 112 43 Keroun 337 272 81
11 Thalaha 205 227 111 44 Bayarban 549 441 80
12 Sis. Jahada 194 213 110 45 Indrapur 465 374 80
13 Sub Metro Brt 4540 4932 109 46 Govindapur 406 324 80
14 Pokhariya 75 81 108 47 Motipur 141 112 80
15 Dadarbairiya 215 229 107 48 Rajghat 345 275 80 16 Majhare 242 249 103 49 Takuwa 198 156 79 17 Dangraha 136 139 102 50 Sanischare 642 506 79
18 Tandi 265 270 102 51 Darbesha 453 355 78
19 Yangsila 182 186 102 52 Jante 196 153 78
20 Baijanathpur 122 122 100 53 Haraicha 172 133 78
21 Belbari 530 529 100 54 Dangihat 526 397 76
22 Sijuwa 308 305 99 55 Mirgouliya 350 261 75
23 Sis. Badahara 130 128 99 56 Amardaha 384 282 73
24 Letang 456 447 98 57 Itahara 422 297 70
25 Hoklabari 127 124 97 58 Pathari 586 412 70
26 Dulari 277 267 96 59 Babiyabirta 393 276 70
27 Kadmaha 195 188 96 60 Bahuni 333 232 70 28 Hattimuda 215 207 96 61 Pati 65 44 67 29 Bhatigachha 306 289 94 62 Sundarpur 423 278 66
30 Banigama 218 200 92 63 Ramitekhola 86 53 61 31 Jhorahat 131 116 88 64 Kaseni 195 119 61 32 Kerabari 425 369 87 65 Sidraha 102 58 57 33 Lakhantari 109 93 86 66 Bhogteni 150 83 55
District 22870 21477 94
7
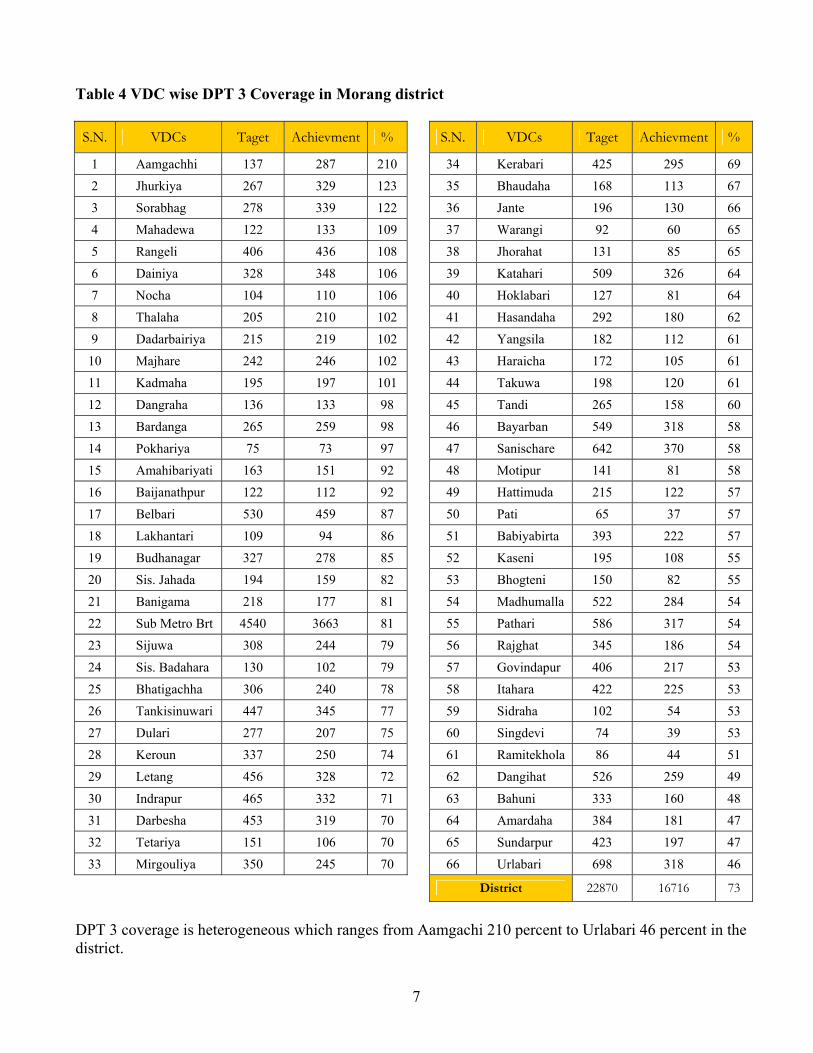
Table 4 VDC wise DPT 3 Coverage in Morang district S.N. VDCs Taget Achievment % S.N. VDCs Taget Achievment %
1 Aamgachhi 137 287 210 34 Kerabari 425 295 69
2 Jhurkiya 267 329 123 35 Bhaudaha 168 113 67
3 Sorabhag 278 339 122 36 Jante 196 130 66
4 Mahadewa 122 133 109 37 Warangi 92 60 65
5 Rangeli 406 436 108 38 Jhorahat 131 85 65
6 Dainiya 328 348 106 39 Katahari 509 326 64
7 Nocha 104 110 106 40 Hoklabari 127 81 64
8 Thalaha 205 210 102 41 Hasandaha 292 180 62
9 Dadarbairiya 215 219 102 42 Yangsila 182 112 61
10 Majhare 242 246 102 43 Haraicha 172 105 61
11 Kadmaha 195 197 101 44 Takuwa 198 120 61
12 Dangraha 136 133 98 45 Tandi 265 158 60
13 Bardanga 265 259 98 46 Bayarban 549 318 58
14 Pokhariya 75 73 97 47 Sanischare 642 370 58
15 Amahibariyati 163 151 92 48 Motipur 141 81 58
16 Baijanathpur 122 112 92 49 Hattimuda 215 122 57
17 Belbari 530 459 87 50 Pati 65 37 57
18 Lakhantari 109 94 86 51 Babiyabirta 393 222 57
19 Budhanagar 327 278 85 52 Kaseni 195 108 55
20 Sis. Jahada 194 159 82 53 Bhogteni 150 82 55
21 Banigama 218 177 81 54 Madhumalla 522 284 54
22 Sub Metro Brt 4540 3663 81 55 Pathari 586 317 54
23 Sijuwa 308 244 79 56 Rajghat 345 186 54
24 Sis. Badahara 130 102 79 57 Govindapur 406 217 53
25 Bhatigachha 306 240 78 58 Itahara 422 225 53
26 Tankisinuwari 447 345 77 59 Sidraha 102 54 53
27 Dulari 277 207 75 60 Singdevi 74 39 53
28 Keroun 337 250 74 61 Ramitekhola 86 44 51
29 Letang 456 328 72 62 Dangihat 526 259 49
30 Indrapur 465 332 71 63 Bahuni 333 160 48
31 Darbesha 453 319 70 64 Amardaha 384 181 47
32 Tetariya 151 106 70 65 Sundarpur 423 197 47
33 Mirgouliya 350 245 70 66 Urlabari 698 318 46
District 22870 16716 73
DPT 3 coverage is heterogeneous which ranges from Aamgachi 210 percent to Urlabari 46 percent in the district.

8
Table 5 VDC wise Measles vaccine coverage in Morang
S.N. VDCs Taget Achievment % S.N. VDCs Taget Achievment %
1 Aamgachhi 137 247 180 34 Bahuni 333 280 84 2 Warangi 92 144 157 35 Bhaudaha 168 139 83 3 Sorabhag 278 422 152 36 Tankisinuwari 447 368 82 4 Mahadewa 122 142 116 37 Ramitekhola 86 71 82 5 Belbari 530 601 113 38 Sanischare 642 518 81 6 Amahibariyati 163 181 111 39 Sis. Jahada 194 156 80 7 Jhurkiya 267 294 110 40 Lakhantari 109 86 79 8 Jante 196 215 110 41 Sub Metro Brt 4540 3572 79 9 Rangeli 406 440 109 42 Bhogteni 150 116 77
10 Dadarbairiya 215 230 107 43 Bhatigachha 306 235 77 11 Pokhariya 75 79 105 44 Pati 65 50 77 12 Yangsila 182 187 102 45 Tandi 265 200 76 13 Hoklabari 127 129 101 46 Madhumalla 522 393 75 14 Baijanathpur 122 121 99 47 Indrapur 465 347 75 15 Banigama 218 214 98 48 Pathari 586 430 73 16 Hasandaha 292 287 98 49 Jhorahat 131 96 73 17 Kadmaha 195 187 96 50 Sijuwa 308 224 73 18 Bardanga 265 254 96 51 Urlabari 698 497 71 19 Letang 456 436 96 52 Katahari 509 356 70 20 Dainiya 328 311 95 53 Budhanagar 327 224 68 21 Nocha 104 98 94 54 Dangihat 526 354 67 22 Dangraha 136 128 94 55 Govindapur 406 271 67 23 Sis. Badahara 130 122 94 56 Babiyabirta 393 257 65 24 Dulari 277 259 94 57 Singdevi 74 47 63 25 Hattimuda 215 198 92 58 Takuwa 198 119 60 26 Kerabari 425 391 92 59 Itahara 422 253 60 27 Rajghat 345 317 92 60 Amardaha 384 223 58 28 Keroun 337 306 91 61 Kaseni 195 110 56 29 Majhare 242 215 89 62 Darbesha 453 250 55 30 Mirgouliya 350 304 87 63 Sidraha 102 54 53 31 Thalaha 205 175 85 64 Haraicha 172 86 50 32 Tetariya 151 128 85 65 Sundarpur 423 200 47 33 Bayarban 549 463 84 66 Motipur 141 63 45
District 22870 18870 83
DPT 3 coverage is heterogeneous which ranges from Aamgachi 180 percent to Motipur 45 percent in the district.

9
Measles Campaign 2061
Table 6 VDCs Categorized with Problems and priority 2060/61 Category 1 Low Drop Out Rate (<10) High Coverage (>80)
Category 2 High Drop Out Rate (>10) High Coverage Rate (>80)
Category 3 Low Drop Out Rate (<10) Low Coverage Rate (>80)
Category 4 High Drop Out Rate (>10) Low Coverage Rate (<80)
Bhaudaha, Bahuni, Bayarban, Tetariya, Mirgouliya, Keroun, Kerabari, Hattimuda, Dulari, Sis. Badahara, Dangraha, Letang, Kadmaha, Hasandaha, Banigama, Baijanathpur, Madhumalla, Hoklabari, Yangsila, Pokhariya, Dadarbairiya, Jante, Jhurkiya, Amahibariyati, Belbari, Mahadewa, Sorabhag, Warangi, (28 Health Facilities)
Thalaha, Majhare, Nocha, Dainiya, Bardanga, Rangeli, Aamgachhi, District (7 Health Facilities)
Sidraha, Kaseni, Babiyabirta, Pathari, Indrapur, Pati, Bhogteni, Lakhantari, Sanischare, Ramitekhola, Tankisinuwari (11 Health Facilities)
Motipur, Sundarpur, Haraicha, Ranjani, Amardaha, Itahara, Takuwa, Singdevi, Govindapur, Dangihat, Budhanagar, Katahari, Urlabari, Sijuwa, Jhorahat, Tandi A+B, Bhatigachha, Rani, Siswani Jahada, (20 Health Facilities)
No Problem Priority 3 Priority 2 Priority 1 About half of VDCs of Morang district is having coverage more than 80 percent and drop out rate less than 10 percent. District average falls under the category 2. 1.1.6 Problems/Constraints And Action To Be Taken Problem/Constraints Action to be Taken Responsibility Time Frame Shortage of vaccine supply for 3 months
Requested RMS and LMD
DPHO, EPIS ASAP
Frequent Bandhs affected vaccine supply
Frequent trainings affected service flow
Action has taken to minimize the effect
DPHO ASAP
Measles campaign 2061 was introduced first time in the country. Campaign was three week long. Many rumors raised during campaign by which programme was affected. DPHO Morang, health workers, volunteers, teachers, students, civil society, human right activist, NGOs and media played important role. Overall coverage of measles vaccination was 85% in the district.

10
1.2 Nutrition 1.2.1 Background: Malnutrition is a major health problem among the children and women of childbearing age in the country. Growth monitoring, micro-nutrients distribution, de-worming, Vitamin "A” distribution, promotion of breastfeeding and control of anemia are being carried out in order to promote health of child and women under the nutrition program. 1.2.2 Objectives:
• To reduce protein malnutrition among the children under 3 years of age through multi sartorial approach. • To eliminate Iodine deficiency disorder and vitamin a deficiency by 2005; • To reduce prevalence of anemia to less than one third by the year 2010; • To reduce the incidence of low birth –weight to less than 10% of all births by the year 2005.
1.2.3 Target:
• Reduction of sever and moderate malnutrition among children under 3 years of age to half of the 1990 level by the year 2005;
• Reduction of iron deficiency anemia of expected pregnancies by one third of the 1990; Level by the year 2005.
• Reduction of vitamin "A" deficiency among children under five years of age by 90% in all districts by preventive measures by the year 2005.
1.2.4 Strategies:
• Promote, facilitate and utilize community participation and involvement for all nutrition activities. • Integrate/incorporate EPI/FP/MCH and related activities in the nutrition plans.
1.2.5 Analysis: Table 7 Nutrition: Target Vs Achievement
Program/ Activities
Units Target Achievement
% Achieved
% expenditure wrt released
budget
Reasons for not achieve 100%
Growth Monitoring Person 70352 35369 50
Deworming ,, 93862 106230 100
Anemia ,, 29755 17372 58
Vitamin "A" Distribution ,, 105595 120643 100
Treated by Vitamin "A" ,, 10560 2191 21
Albendazole Distribution for Pregnant Mother
,, 10501 8774 84
Supervision Time 2 2 100
Nutrition Review meeting ,, 3 0 0.0
Logistic Supply ,, 2 2 100
Breast Feeding week celebrate
,, 1 1 100
Iodine month Celebration Time 1 1 100
75
1. Measles Campaign, 2. Frequent training for health workers due to piloting programmes

11
Table 8 VDC wise New growth monitoring in Morang
S.N. VDCs Taget Achievment % S.N. VDCs Taget Achievment %
1 Dulari 852 1314 154 34 Tetariya 464 270 58 2 Singdevi 228 300 132 35 Madhumalla 1604 910 57 3 Motipur 432 539 125 36 Sis. Jahada 596 330 55 4 Hasandaha 899 1055 117 37 Belbari 1630 894 55 5 Yangsila 561 629 112 38 Kadmaha 600 326 54 6 Dangraha 418 450 108 39 Dainiya 1009 537 53 7 Banigama 670 678 101 40 Dangihat 1616 831 51 8 Aamgachhi 421 404 96 41 Sundarpur 1303 664 51 9 Kaseni 601 571 95 42 Sorabhag 856 427 50
10 Thalaha 631 590 94 43 Bhaudaha 517 252 49 11 Tandi 814 749 92 44 Indrapur 1432 688 48 12 Babiyabirta 1209 1109 92 45 Bardanga 815 388 48 13 Amahibariyati 502 455 91 46 Letang 1403 668 48 14 Mahadewa 375 336 90 47 Ramitekhola 266 123 46 15 Majhare 743 649 87 48 Mirgouliya 1077 482 45 16 Sis. Badahara 399 348 87 49 Takuwa 608 261 43 17 Warangi 282 229 81 50 Keroun 1037 439 42 18 Rajghat 1061 848 80 51 Jhorahat 404 159 39 19 Bhogteni 462 350 76 52 Baijanathpur 375 140 37 20 Bahuni 1024 761 74 53 Bayarban 1688 628 37 21 Amardaha 1181 877 74 54 Sijuwa 947 338 36 22 Tankisinuwari 1375 1006 73 55 Kerabari 1307 452 35 23 Pokhariya 231 169 73 56 Lakhantari 334 108 32 24 Budhanagar 1007 733 73 57 Govindapur 1249 397 32 25 Urlabari 2148 1545 72 58 Haraicha 528 166 31 26 Hoklabari 392 279 71 59 Katahari 1567 473 30 27 Nocha 320 206 64 60 Bhatigachha 941 283 30 28 Darbesha 1393 880 63 61 Itahara 1298 387 30 29 Hattimuda 661 412 62 62 Sanischare 1974 485 25 30 Jhurkiya 821 502 61 63 Pathari 1801 439 24 31 Dadarbairiya 660 401 61 64 Sidraha 313 70 22 32 Jante 603 364 60 65 Rangeli 1247 215 17 33 Pati 201 120 60 66 Sub Metro Bir 13965 2298 16
District 70348 35386 50 New growth monitoring coverage is heterogeneous which ranges from Dulari 154 percent to Biratnagar 16 percent in the district.

12
Growth monitoring for 0-3 yr. children was done by 60 percent. Likewise, 0-5 yrs. children were covered by 100 percent in Vitamin A and deworming. Prevalence of anaemia under three year children was 58 percent in the district. According to Nepal Micro Nutrient Survey 19987, the prevalence of current night blindness was high among pregnant women (6.1%) with the highest rates recorded in East Terai (13.4%) and East hills (9.3%). The survey noted that more than 1% of all school aged children had night blindness with the prevalence increasing with age. There has been little improvement in the nutritional status of children as measured by stunting over the last 23 years. The prevalence of stunting among 6-59 months has reduced by only 15.3 percentage points, from 69.4% to 54.1%. Thus, it is clear that past programmes and policies have not been sufficient and/or appropriate. Iodine Month Observed
Breast Feeding Week Observed
1.2.6 Problems/Constraints and Action to be Taken Problem/Constraints Action to be Taken Responsibility Time Frame Shortage of Weighing machine in HIs
Requested Supporting partners DPHO ASAP
Inadequate supervision DPHO supervisors and supervisors from supporting partners attempted
DPHO ASAP
Iodine Month was observed in the district in the collaboration with partners. Awareness programmes such as displaying banners, posters, producing pamphlets, conducting orientations, use of print and electronic media were held as a part of the programme. DPHO Morang was joined by Salt Trading Corporation, Nursing Campus, Aama Milan Kendra, Red Cross, Help Group, BNMT and Plan Nepal during Iodine month.
Breast feeding week was observed in the district with different women groups and mother groups. Sancharika Samuha, a women journalists group which is active in awareness programme and income generation programme in Biratnagar sub-metropolitan ward number 15. Articles were published in local newspapers and FM programme was also conducted awareness programme on the breast feeding week.
13
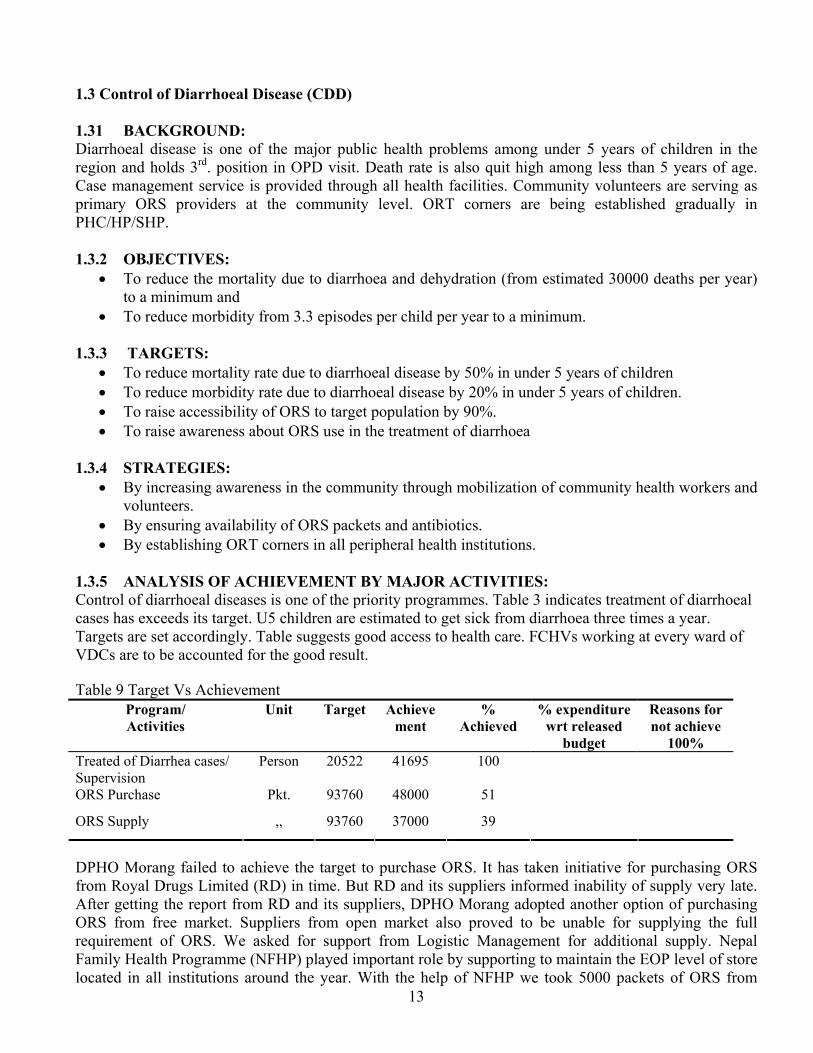
1.3 Control of Diarrhoeal Disease (CDD) 1.31 BACKGROUND: Diarrhoeal disease is one of the major public health problems among under 5 years of children in the region and holds 3rd. position in OPD visit. Death rate is also quit high among less than 5 years of age. Case management service is provided through all health facilities. Community volunteers are serving as primary ORS providers at the community level. ORT corners are being established gradually in PHC/HP/SHP. 1.3.2 OBJECTIVES:
• To reduce the mortality due to diarrhoea and dehydration (from estimated 30000 deaths per year) to a minimum and
• To reduce morbidity from 3.3 episodes per child per year to a minimum. 1.3.3 TARGETS:
• To reduce mortality rate due to diarrhoeal disease by 50% in under 5 years of children • To reduce morbidity rate due to diarrhoeal disease by 20% in under 5 years of children. • To raise accessibility of ORS to target population by 90%. • To raise awareness about ORS use in the treatment of diarrhoea
1.3.4 STRATEGIES:
• By increasing awareness in the community through mobilization of community health workers and volunteers.
• By ensuring availability of ORS packets and antibiotics. • By establishing ORT corners in all peripheral health institutions.
1.3.5 ANALYSIS OF ACHIEVEMENT BY MAJOR ACTIVITIES: Control of diarrhoeal diseases is one of the priority programmes. Table 3 indicates treatment of diarrhoeal cases has exceeds its target. U5 children are estimated to get sick from diarrhoea three times a year. Targets are set accordingly. Table suggests good access to health care. FCHVs working at every ward of VDCs are to be accounted for the good result. Table 9 Target Vs Achievement
Program/ Activities
Unit Target Achievement
% Achieved
% expenditure wrt released
budget
Reasons for not achieve
100% Treated of Diarrhea cases/ Supervision
Person 20522 41695 100
ORS Purchase Pkt. 93760 48000 51
ORS Supply ,, 93760 37000 39
DPHO Morang failed to achieve the target to purchase ORS. It has taken initiative for purchasing ORS from Royal Drugs Limited (RD) in time. But RD and its suppliers informed inability of supply very late. After getting the report from RD and its suppliers, DPHO Morang adopted another option of purchasing ORS from free market. Suppliers from open market also proved to be unable for supplying the full requirement of ORS. We asked for support from Logistic Management for additional supply. Nepal Family Health Programme (NFHP) played important role by supporting to maintain the EOP level of store located in all institutions around the year. With the help of NFHP we took 5000 packets of ORS from
14
District Health Office Sunsari to maintain the buffer stock of ORS. Under these circumstances, DPHO Morang issued letters to all under health institutions to maintain their EOP level by purchasing ORS by their CDP programme as per required. Health institutions used to buy ORS from market as a part of CDP programme following its regulation. Coverage Table 10 Incidence of CDD Indicators 2059/060 2060/061 2061/062 Incidence of Diarrhea/1,000 349 398 385
% of Severe Dehydration among new cases 1.2 0.4 0.5
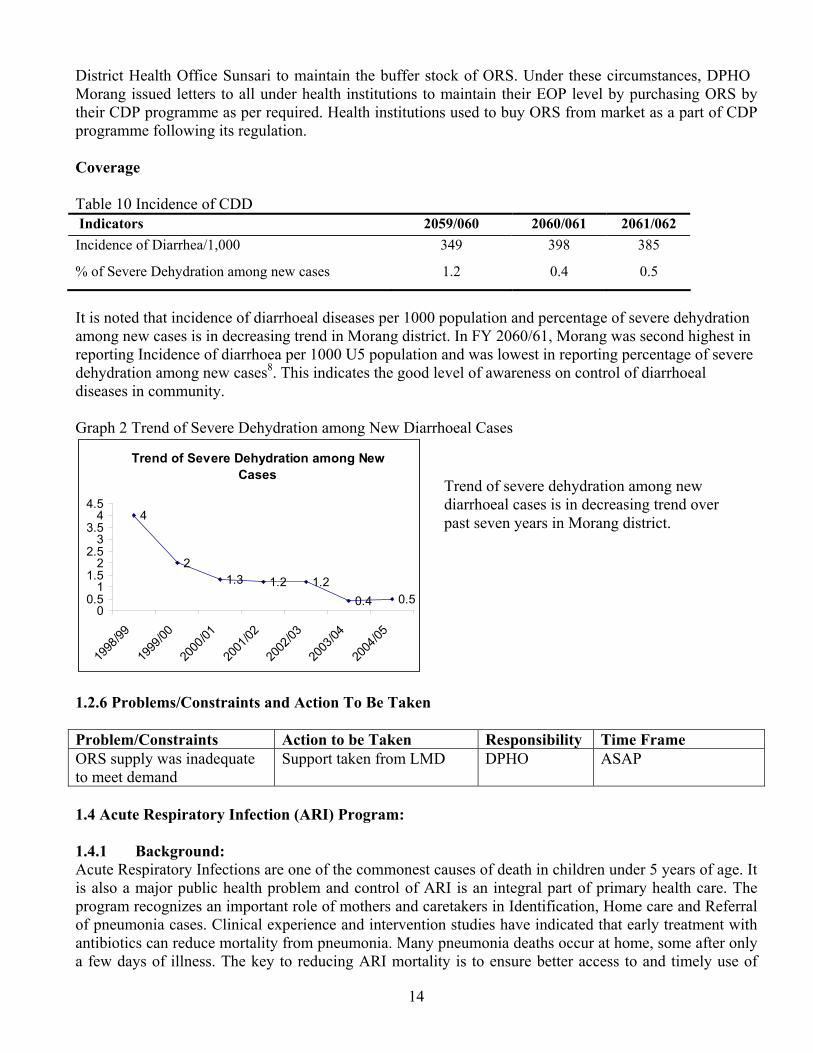
It is noted that incidence of diarrhoeal diseases per 1000 population and percentage of severe dehydration among new cases is in decreasing trend in Morang district. In FY 2060/61, Morang was second highest in reporting Incidence of diarrhoea per 1000 U5 population and was lowest in reporting percentage of severe dehydration among new cases8. This indicates the good level of awareness on control of diarrhoeal diseases in community. Graph 2 Trend of Severe Dehydration among New Diarrhoeal Cases
Trend of Severe Dehydration among New Cases
4
21.3 1.2 1.2
0.4 0.50
0.51
1.52
2.53
3.54
4.5
1998
/99
1999
/00
2000
/01
2001
/02
2002
/03
2003
/04
2004
/05
1.2.6 Problems/Constraints and Action To Be Taken Problem/Constraints Action to be Taken Responsibility Time Frame ORS supply was inadequate to meet demand
Support taken from LMD DPHO ASAP
1.4 Acute Respiratory Infection (ARI) Program: 1.4.1 Background: Acute Respiratory Infections are one of the commonest causes of death in children under 5 years of age. It is also a major public health problem and control of ARI is an integral part of primary health care. The program recognizes an important role of mothers and caretakers in Identification, Home care and Referral of pneumonia cases. Clinical experience and intervention studies have indicated that early treatment with antibiotics can reduce mortality from pneumonia. Many pneumonia deaths occur at home, some after only a few days of illness. The key to reducing ARI mortality is to ensure better access to and timely use of
Trend of severe dehydration among new diarrhoeal cases is in decreasing trend over past seven years in Morang district.
15
correct case management of pneumonia. Morang has got community based pneumonia program, where FCHVs treat the pneumonia cases with first line drug (Cotrimoxazole Pad. Tabs) and if child had any danger signs they would refer to the nearest Health facilities. 1.4.2 Objectives:
• To improve the situation of child health in Nepal by reducing mortality and morbidity due to ARI among under 5 years of children.
1.4.3 Targets:
• To reduce mortality from pneumonia in under 5 years of children. • To reduce morbidity due to ARI in under 5 years of children.
1.4.4 Strategies:
• Raising public awareness through mobilization of community health workers and volunteers by ensuring availability of antibiotics.
1.4.5 Analysis of Achievement by Major Activities: Table 11 Target Vs achievement
Program/ Activities
Unit Target Achievement
% Achieved
% expenditure wrt released
budget
Reasons for not achieve
100% Treated of Pneumonia Cases
Person 11417 30498 100.0 64.6
Like CDD programme, the achievement of treated Pneumonia cases is higher than its target. A reason of this is access of service provided by FCHV at community level. It is clear that community based pneumonia can be done, and in Nepal, has resulted in a dramatic increase in the percent of expected cases treated. There is good evidence showing that quality of care is good, that misdiagnosis is unlikely, that correct treatment is usual, and that referral patterns improve. It also appears that the model used for this programme is likely to establish a foundation, which will allow community based treatment to be sustained. The relationship between the community workers providing the treatment and the communities they serve becomes strong, providing an incentive for the worker and ongoing service to the community.9 Coverage Table 12 Incidence of ARI and Pneumonia Indicators 2059/060 2060/061 2061/062
Incidence of ARI/1000 591 657 648
% of pneumonia among new cases 1.0 0.8 0.8
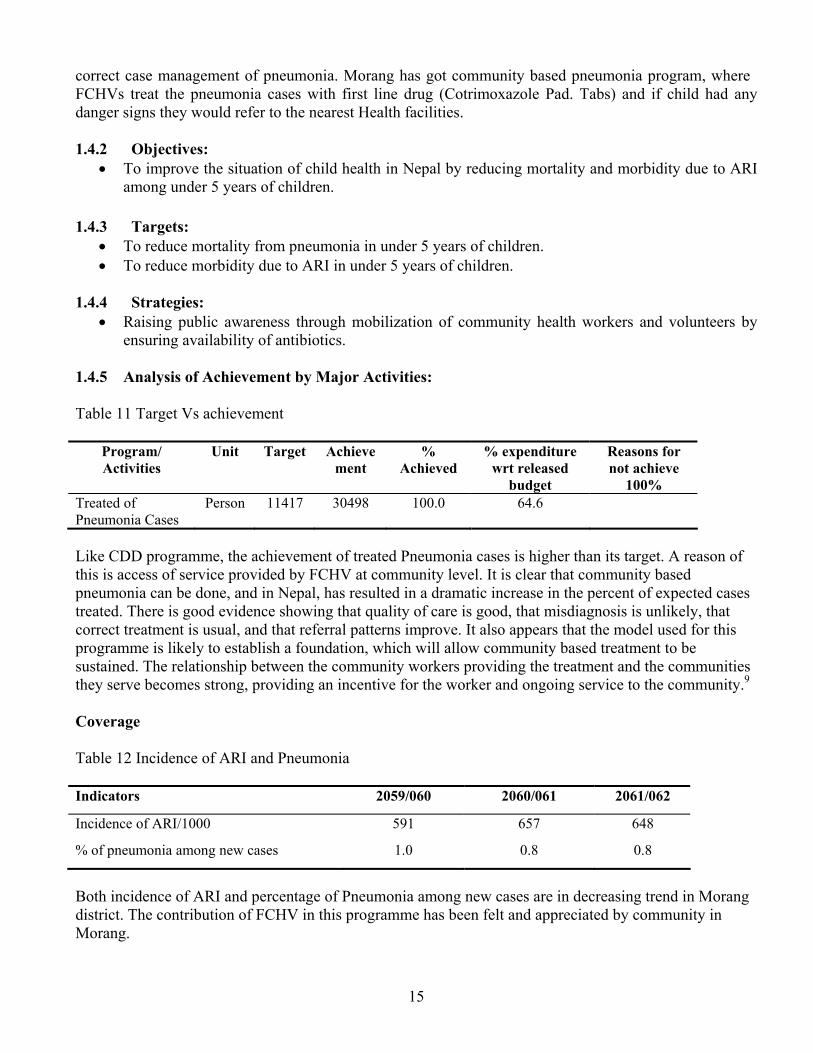
Both incidence of ARI and percentage of Pneumonia among new cases are in decreasing trend in Morang district. The contribution of FCHV in this programme has been felt and appreciated by community in Morang.
16
Graph 3 Trend of Proportion of Pneumonia among New ARI Cases
Trend of Proportion of Pneumonia among New ARI Cases
55
44 45 42 42 41 40
0
10
20
30
40
50
60
1998
/99
1999
/00
2000
/01
2001
/02
2002
/03
2003
/04
2004
/05
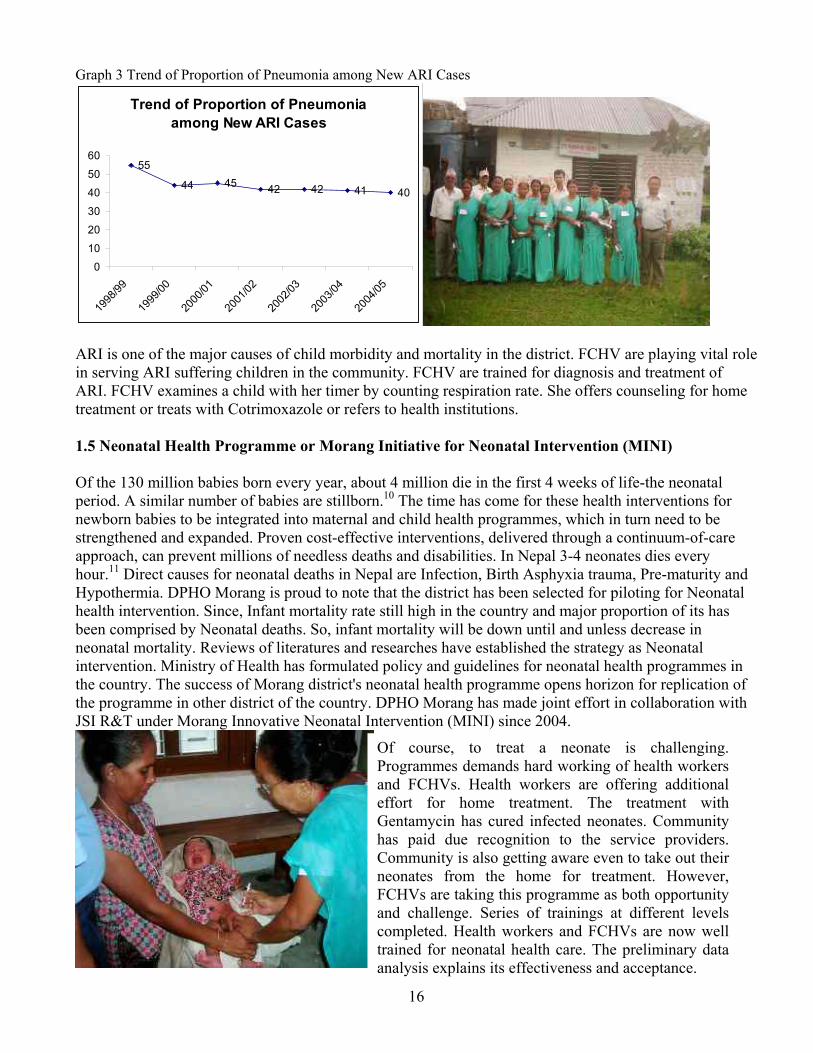
ARI is one of the major causes of child morbidity and mortality in the district. FCHV are playing vital role in serving ARI suffering children in the community. FCHV are trained for diagnosis and treatment of ARI. FCHV examines a child with her timer by counting respiration rate. She offers counseling for home treatment or treats with Cotrimoxazole or refers to health institutions. 1.5 Neonatal Health Programme or Morang Initiative for Neonatal Intervention (MINI) Of the 130 million babies born every year, about 4 million die in the first 4 weeks of life-the neonatal period. A similar number of babies are stillborn.10 The time has come for these health interventions for newborn babies to be integrated into maternal and child health programmes, which in turn need to be strengthened and expanded. Proven cost-effective interventions, delivered through a continuum-of-care approach, can prevent millions of needless deaths and disabilities. In Nepal 3-4 neonates dies every hour.11 Direct causes for neonatal deaths in Nepal are Infection, Birth Asphyxia trauma, Pre-maturity and Hypothermia. DPHO Morang is proud to note that the district has been selected for piloting for Neonatal health intervention. Since, Infant mortality rate still high in the country and major proportion of its has been comprised by Neonatal deaths. So, infant mortality will be down until and unless decrease in neonatal mortality. Reviews of literatures and researches have established the strategy as Neonatal intervention. Ministry of Health has formulated policy and guidelines for neonatal health programmes in the country. The success of Morang district's neonatal health programme opens horizon for replication of the programme in other district of the country. DPHO Morang has made joint effort in collaboration with JSI R&T under Morang Innovative Neonatal Intervention (MINI) since 2004.
Of course, to treat a neonate is challenging. Programmes demands hard working of health workers and FCHVs. Health workers are offering additional effort for home treatment. The treatment with Gentamycin has cured infected neonates. Community has paid due recognition to the service providers. Community is also getting aware even to take out their neonates from the home for treatment. However, FCHVs are taking this programme as both opportunity and challenge. Series of trainings at different levels completed. Health workers and FCHVs are now well trained for neonatal health care. The preliminary data analysis explains its effectiveness and acceptance.

17
1.6 Community Based –Integrated Management of Child Illness (CB-IMCI) The IMCI intervention is integrated case management of the five most important causes of childhood deaths – ARI, Diarrhoea, Measles, Malaria and Malnutrition. The strategy includes a range of other preventive and curative interventions, which aim to improve practices both in the health facilities and at home.
1.2.6 PROBLEMS/CONSTRAINTS AND ACTION TO BE TAKEN Problem/Constraints Action to be Taken Responsibility Time Frame More time of HWs was consumed by trainings
Tried to minimized the effect
DPHO ASAP
2. Reproductive Health 2.1 Family Planning 2.1.1 BACKGROUND: The main thrust of the National Health Policy (1991) related to the National Reproductive Health and Family Planning (RH/FP) Programme is to expand and sustain adequate quality family planning services to the community level through all health facilities. The policy also aims to encourage NGOs, social marketing organizations, as well as private practitioners to complement and supplement government efforts. Community-level volunteers (TBAs, FCHVs) are to be mobilized to promote condom distribution and re-supply of oral pills. Awareness on RH/FP is to be increased through various IEC/BCC intervention as well as active involvement of FCHVs and MGs as envisaged by the National Strategy for FCHVs. In this regard, FP services are designed to provide a constellation of contraceptive methods that reduce fertility, enhance maternal and neonatal health, child survival, and contribute to bringing about a balance in population growth and socio-economic development, resulting in an environment that will help the Nepalese people to improve their quality of life. 2.1.2 OBJECTIVES: Within the context of RH, the main objectives of FP Programme are to assist individuals and couples to:
• Space and/or limit their children; • Prevent unwanted pregnancies; • Manage infertility and • Improve their overall reproductive health.
Ten batches of twenty peoples in each batch training concluded resulting more than 200 trained health workers for IMCI. Plan Nepal supported financially. NEPAS and Koshi Zonal Hospital supported technically for the training. Evaluation of the training was also concluded with the help of NEPAS and Plan Nepal. The result of the training is expected to be reflected into the quality care of U5 children. It can be measured by qualitative method and takes time. However, recommendation from the evaluation noted that there is still room to improve the practices of health workers.

18
2.1.3 TARGETS: • To reduce TFR from 4.1 per women to 3.5 by the end of 10th Five Year Plan and to 3.05 in 2017 • To rise the CPR to 47% by the end of 10th 5 Year Plan period and to 58.2% by 2017. • To achieve approx. 2,293,000 couples using modern contraception by end of 10th Five Year Plan. • To achieve approximately 536,288 Family Planning Current Users and 23,025 Voluntary Surgical
sterilizations cases in Eastern development region in 2060/61 2.1.4 STRATEGIES:
• Increasing the knowledge and understanding of the benefits of delayed marriage, birth spacing, and a well planned family norm across the region through integrated RH/ FP/IEC and BCC activities;
• Increasing accessibility and availability of RH/FP services through a combination of approaches; • Expanding regular year-round and mobile VSC outreach services; • Expanding IUCD services with special emphasis on thorough counseling and follow-up services; • Training service providers in collaboration with NHTC; • Improving the quality of care in accordance with the NMS for contraceptive services; • Establishing management & treatment services for complications of abortion, including FP services; • Ensuring adequate supply & distribution of contraceptives at regional, district & below district level; • Strengthening HMIS for better management of FP programmes; • Ensuring effective monitoring and supervision of FP programmes and • Re-supplying pills and distributing condom through FCHV.
2.1.5 ANALYSIS OF ACHIEVEMENT: Table 13 Achievement of Programme
Program/ Activities
Unit Target Achievement
% Achieved % expenditure wrt released budget
Reasons for not achieve 100%
Current users Person 146000 110487 75.7
Sterilization ,, 6840 8160 100.0 66.1
Table 14 Trend of Family Planning Programme Coverage
Indicators 2059/060 2060/061 2061/062
Contraceptive Prevalence Rate (CPR as % of MWRA) 65.0 62.94 63.3
Condom(%CPR Method Mix) 2.7 2.1 2.0
Pills(%CPR Method Mix) 5.02 3.16 3.1
Depo(%CPR Method Mix) 14.70 12.39 11.9
IUCD(%CPR Method Mix) 1.10 1.42 1.6
Norplant(%CPR Method Mix) 1.52 1.81 1.4
VSC(%CPR Method Mix) 40.0 42.0 44.7
Total number of VSC 7456 8270 8160
Male 182 167 120
Female 7272 8103 8040
Total number of VSC in GO sector 3183 3622 3314
Total number of VSC in NGO sector 4273 4848 4846

19
Graph 4 Trend of Contraceptive Prevalence Rate
Trend of Contraceptive Prevalence Rate in Morang
52 56 60
78
60 62 63
0102030405060708090
100
1998
/99
1999
/00
2000
/01
2001
/02
2002
/03
2003
/04
2004
/05
2.1.6 PROBLEMS/CONSTRAINTS AND ACTION TO BE TAKEN Problem/Constraints Action to be Taken Responsibility Time Frame Shortage of Medical doctors for VSC
Requested RHD and FHD for doctors
DPHO ASAP
2.2 Safe motherhood 2.2.1 BACKGROUND: The MoH's Safe Motherhood Programme is the HMG's main thrust to reduce maternal and neonatal mortality by addressing the high rates of death and disability caused by the complications of pregnancy and childbirth. The past strategy of carrying out FP/MCH in an integrated manner, promoting attendance birth through TBAs and promoting ANC visits were not adequate in addressing the issues of MMR. Experience also showed that the avoidance of the three delays was imperative to achieve goal of reduction of maternal mortality. Recognizing that every pregnancy is at risk, two major strategies have been adopted, providing around the clock emergency obstetric care (either comprehensive or basic) and ensuring the presence of skilled attendants at deliveries, especially in the home setting. However, because the majority of women do not have access to maternal healthcare services due to social, economic, and political factors, medical interventions alone are not sufficient to reduce MMR. Specific non-health approaches are needed. Therefore, the Safe Motherhood Programme takes a multi-sectoral approach to include both health and non-health interventions that promote access to and utilization of services. The long-term goal of the 15-year National Safe Motherhood Plan (2002-2017) envisages establishment of BEOC and CEOC services in all 75 districts, skilled attendance of births & increased access to emergency fund & transport services. 2.2.2 OBJECTIVES:
• To reduce the mortality and morbidity among pregnant women and new born during childbirth and the postnatal period through the adaptation of a combination of health and non-health related measure.
• To improve the quality of antenatal, natal, postnatal and neonatal care through appropriate training of health personnel, including emergency obstetric care.
• To advocate and raise public awareness about safe motherhood related issues. • To strengthen referral care. • To improved legal and socio-economic status of women.
CPR of Morang which is third highest in Nepal and highest in EDR which is reached 63 percent in FY 2061/62.

20
2.2.3 TARGETS: • To contribute to the reduction of the maternal mortality rate from estimated rate of 539/100000
live birth to 300/10000 live birth end of Tenth Five year plan. • To reduce neo-natal mortality rate from 39-to32 per1000 live births by the end of Tenth five year
plan. • To increase delivery by health workers to 18% by the end of Tenth plan. • To increase % of woman attending antenatal care 4 times to 25% by end of Tenth plan.
2.2.4 STRATEGIES:
• Promoting inter-sect oral collaboration at regional district and community level. • Strengthening and expanding basic maternal care services. • Supporting activities that raise the status of women.
2.2.5 ANALYSIS OF ACHIEVEMENT: Table 15 Achievement of Safe motherhood programme
Program/ Activities
Unit Target Achievement
% Achieved
% expenditure wrt released budget
Reasons for not achieve 100%
ANC New visit (56%) Person 19603 26938 100.0
Delivery trend HW (16%) ,, 5284 7468 100.0
PNC first visit (18%) ,, 5945 13131 100.0
Table 16 Coverage of Safe motherhood programme Indicators 2059/060 2060/061 2061/062
ANC first visit as a % of expected pregnancy 79.4 72.2 77.1
% of women with 4th visit among 1st visit 40.0 54.0 35.4
% of delivery conducted at health institutions (Hospital/PHCC/HP/SHP)
7.5 15.5 16.9
Number of delivery conducted in Hospital 1371 3050 4350
Number of delivery conducted in PHCC 941 1045 1562
% of home delivery attended by HW 9.2 6.7 4.5
Delivery conducted by Health Workers 15 22 23
PNC first visit as % of expected pregnancy 32.2 40.4 38.4
Graph 5 Trend of Delivery conducted by Health Workers
Trend of delivery conducted by health workers is 22 percent which is in increasing in Morang district.
Trend of delworkers is 1trend which coming year
Trend of Delivery Conducted by HWs (%) in Morang
14 1610
6
1522 23
05
101520253035404550
1998
/99
1999
/00
2000
/01
2001
/02
2002
/03
2003
/04
2004
/05

21
Table 17 VDC wise status of 4 ANC visits in Morang S.N. VDCs ANC
First 4 visit % S.N. VDCs ANC First 4 visit %
1 Rangeli 196 352 180 34 Sijuwa 549 234 43 2 Govindapur 254 287 113 35 Indrapur 371 157 42 3 Lakhantari 86 93 108 36 Jhorahat 350 147 42 4 Amahibariyati 251 242 96 37 Aamgachhi 194 79 41
5 Tankisinuwari 264 250 95 38 Sis. Badahara 251 96 38
6 Kadmaha 249 205 82 39 Haraicha 454 173 38 7 Rajghat 128 104 81 40 Tandi 217 82 38 8 Darbesha 207 168 81 41 Pathari 339 128 38 9 Dangraha 208 165 79 42 Tetariya 100 37 37
10 Letang 485 369 76 43 Sundarpur 199 72 36 11 Banigama 285 212 74 44 Itahara 338 122 36 12 Amardaha 278 196 71 45 Dadarbairiya 549 180 33 13 Jhurkiya 454 309 68 46 Sis. Jahada 156 50 32
14 Ramitekhola 145 98 68 47 Sub Metro Brt 4383 1390 32
15 Budhanagar 347 233 67 48 Mirgouliya 253 78 31 16 Bhogteni 125 65 19 49 Madhumalla 391 117 30 17 Bardanga 268 164 61 50 Hoklabari 119 35 29 18 Dainiya 338 199 59 51 Bahuni 919 268 29 19 Warangi 103 60 58 52 Dulari 529 154 29 20 Dangihat 203 116 57 53 Takuwa 211 60 28 21 Belbari 621 353 57 54 Keroun 216 61 28 22 Jante 83 45 54 55 Bhaudaha 184 51 28 23 Hattimuda 280 151 54 56 Baijanathpur 141 39 28 24 Pokhariya 126 67 53 57 Katahari 326 86 26 25 Pati 244 123 50 58 Majhare 812 209 26 26 Hasandaha 444 223 50 59 Sidraha 68 17 25 27 Thalaha 380 189 50 60 Urlabari 2788 608 22 28 Bhatigachha 208 99 48 61 Motipur 299 59 20 29 Kerabari 408 194 48 62 Singdevi 97 19 20 30 Mahadewa 95 45 47 63 Kaseni 202 38 19 31 Sanischare 563 265 47 64 Bayarban 1007 187 19 32 Yangsila 50 22 44 65 Sorabhag 709 131 18 33 Nocha 105 46 44 66 Babiyabirta 491 76 15
District 26693 10949 41
Status of 4 ANC visits in VDCs of Morang district is heterogeneous which ranges from Rangeli 180 percent to Babiyabirta 15 percent in the district.

22
Table 18 VDC wise status of Delivery conducted by Health Workers in Morang
S.N. VDCs Taget Achievment % S.N. VDCs Taget Achievment %
1 Jhurkiya 408 283 69 34 Tandi 404 28 7 2 Urlabari 1067 692 65 35 Sis. Jahada 296 18 6 3 Biratnagar 6937 4327 62 36 Warangi 140 8 6 4 Pokhariya 115 50 44 37 Majhare 369 21 6 5 Amahibariyati 249 87 35 38 Sis. Badahara 198 11 6 6 Darbesha 692 217 31 39 Hoklabari 195 10 5 7 Haraicha 262 74 28 40 Mahadewa 186 9 5 8 Kadmaha 298 69 23 41 Sundarpur 647 31 5 9 Rangeli 620 135 22 42 Ramitekhola 132 6 5 10 Bahuni 509 110 22 43 Madhumalla 797 32 4 11 Thalaha 313 57 18 44 Mirgouliya 535 21 4 12 Aamgachhi 209 36 17 45 Bardanga 405 13 3 13 Letang 697 119 17 46 Banigama 333 9 3 14 Hasandaha 447 76 17 47 Belbari 810 21 3 15 Dangraha 208 35 17 48 Sidraha 155 4 3 16 Dadarbairiya 328 53 16 49 Yangsila 279 6 2 17 Sorabhag 425 68 16 50 Kaseni 298 6 2 18 Motipur 215 32 15 51 Pathari 895 17 2 19 Bhogteni 229 34 15 52 Babiyabirta 600 11 2 20 Tetariya 230 29 13 53 Singdevi 113 2 2 21 Jante 300 36 12 54 Rajghat 527 8 2 22 Sijuwa 471 56 12 55 Takuwa 302 4 1 23 Nocha 159 17 11 56 Sanischare 980 12 1 24 Lakhantari 166 17 10 57 Amardaha 587 7 1 25 Govindapur 620 63 10 58 Dangihat 803 8 1 26 Pati 100 9 9 59 Keroun 515 5 1 27 Budhanagar 500 43 9 60 Bhatigachha 467 4 1 28 Dainiya 501 43 9 61 Indrapur 711 5 1 29 Dulari 423 33 8 62 Bhaudaha 257 1 0 30 Kerabari 649 49 8 63 Hattimuda 328 1 0 31 Baijanathpur 186 14 8 64 Katahari 778 0 0 32 Tankisinuwari 683 50 7 65 Jhorahat 201 0 0 33 Bayarban 838 61 7 66 Itahara 645 0 0
District 34945 7413 21
Status of delivery conducted by health workers is heterogenous which ranges from Jhurkia 69 percent to Katahari, Jhorahat, Itahara, Hattimudha and Bhaudha 0 percent in the district.

23
Table 19 VDC wise status of PNC 1st Visits in Morang
S.N. VDCs Taget Achievment % S.N. VDCs Taget Achievment %
1 Kadmaha 298 258 86.6 34 Katahari 778 250 32 2 Jhorahat 201 149 74.2 35 Hoklabari 195 61 31 3 Amahibariyati 249 183 73.4 36 Hasandaha 447 136 30 4 Jhurkiya 408 289 70.9 37 Kerabari 649 183 28 5 Sorabhag 425 299 70.3 38 Rangeli 620 166 27 6 Dadarbairiya 328 223 68 39 Hattimuda 328 86 26 7 Urlabari 1067 724 67.9 40 Warangi 140 36 26 8 Tankisinuwari 683 448 65.6 41 Jante 300 74 25 9 Dangraha 208 132 63.6 42 Letang 697 170 24
10 Sub Metro Brt 6937 4391 63.3 43 Keroun 515 124 24 11 Belbari 810 482 59.5 44 Sundarpur 647 155 24 12 Budhanagar 500 296 59.2 45 Itahara 645 150 23 13 Thalaha 313 182 58.1 46 Haraicha 262 59 23 14 Lakhantari 166 93 56 47 Mirgouliya 535 110 21 15 Mahadewa 186 99 53.1 48 Pathari 895 183 20 16 Ramitekhola 132 70 53.1 49 Tandi 404 78 19 17 Babiyabirta 600 314 52.3 50 Baijanathpur 186 34 18 18 Pokhariya 115 60 52.2 51 Dainiya 501 89 18 19 Bhatigachha 467 243 52 52 Bardanga 405 70 17 20 Aamgachhi 209 98 46.8 53 Dangihat 803 130 16 21 Dulari 423 185 43.7 54 Bhaudaha 257 40 16 22 Pati 100 41 41.1 55 Bhogteni 229 33 14 23 Darbesha 692 268 38.7 56 Madhumalla 797 105 13 24 Sanischare 980 377 38.5 57 Sis. Jahada 296 37 12 25 Sis. Badahara 198 74 37.4 58 Singdevi 113 14 12 26 Banigama 333 123 36.9 59 Govindapur 620 76 12 27 Nocha 159 58 36.5 60 Kaseni 298 36 12 28 Tetariya 230 82 35.6 61 Takuwa 302 35 12 29 Sijuwa 471 165 35.1 62 Bayarban 838 95 11 30 Majhare 369 128 34.7 63 Indrapur 711 73 10 31 Bahuni 509 176 34.6 64 Rajghat 527 41 8 32 Motipur 215 73 34 65 Yangsila 279 8 3 33 Sidraha 155 52 33.5 66 Amardaha 587 16 3
District 34945 13788 39
Status of delivery conducted by health workers is heterogenous which ranges from Kadmaha 87 percent to Yangsila, Amardaha 3 percent in the district.

24
2.1.6 PROBLEMS/CONSTRAINTS AND ACTION TO BE TAKEN Problem/Constraints Action to be Taken Responsibility Time Frame ANC check up with counseling is poor
Refresher Training given
DPHO ASAP
2.3 Adolescent health
With the help of supporting partners Aama Milan Kendra five VDCs are taken as conducting piloting Youth friendly clinics in the districts. Health workers have given training for organizing separate clinics in different days for boys and girls in the health institutions. Now, hopeful results are coming.
3 DISEASES CONTROL 3.1 National Tuberculosis Programme 3.1.1 BACKGROUND: Tuberculosis is one of the major public health problems in Nepal and is a leading cause of death in adults. Introduction of treatment by Directly Observed Treatment Short Course (DOTS) has already reduced the number of deaths in Nepal from 8000-11000 to 5000-7000. Expansion of this cost-effective and highly successful treatment strategy, which already has proven its efficacy in Nepal, will have a reflective impact on mortality and morbidity. The National Tuberculosis Programme’s (NTP), long term goal is to reduce the transmission of TB to such a level that it is no longer a public health problem. The NTP operates its diagnostic and treatment services within the general health services of the country. The basic unit of management for diagnosis and treatment of TB patients is the district hospital and the Primary Health Centre. Health Post acts as sub-centre for supervision of patients on DOTS in selected health posts in different districts. Region provides support in managing TB control activities of the districts. 3.1.2 OBJECTIVES:
• To achieve 85% cure rate in new smear positive pulmonary tuberculosis • To achieve 70% case detection ratio in new pulmonary tuberculosis • To implement the DOTS activities in phased manner in all districts
3.1.3 TARGET:
• 85% cure rate in new smear positive cases • 80% conversion rate in new smear positive cases • 70% case detection rate • Expansion of DOTS in all districts
3.1.4 STRATEGIES:
• To promote early case detection of infectious pulmonary cases through sputum smear examination • To ensure effective chemotherapy • Involvement of community for planning, Implementation and monitoring of T.B. control services.

25
3.1.5 ANALYSIS OF ACHIEVEMENT BY MAJOR ACTIVITIES: Table 20 Achievement of TB programme
Program/ Activities
Units Target Achievement
% Ach
% expenditure wrt released budget
Reasons for not achieve 100%
Sputum examination for Suspected cases.
Per. 6000 5866 97.8
New sputum examination Slide 18000 17291 96.1
Follow up sputum examination
Slide 2804 2639 94.1
New sputum +ve Per. 600 574 95.7
New sputum -ve ,, 480 340 70.8
Extra pulmonary ,, 125 294 100.0
Retreatment case 137 98 71.5
TB Pts to Pts family health Ed. on DOTS
,, 150 150 100.0
Dhami Jhakri orientation ,, 20 20 100.0
DOTS center evaluation Workshop
Times 6 6 100.0
World TB day ,, 1 1 100.0
Supervision ,, 60 36 60.0
School Health programme School 25 17 68.0
TB/DOTS orientation for social Workers
No. 20 20 100.0
TB/DOTS orientation for Mothers group
,, 20 20 100.0
74.3
Table 21 Performance Indicators of TB programme
Indicators 2059/060 2060/061 2061/062
Case Detection Rate 56 64 63
Cure Rate on DOTS 90 88 89
Treatment Success Rate (Cured+Completed)
89 88 90
Sputum Conversion Rate 87 87 93

26
Graph 6 Trend of TB Cure Rate
Trend of Cure Rate of TB (%) in Morang
56
7888 89 89 87 89
0
10
20
30
40
50
60
70
80
90
100
1998
/99
1999
/00
2000
/01
2001
/02
2002
/03
2003
/04
2004
/05
Problem/Constraints Action to be Taken Responsibility Time Frame Problem in Urban DOTS Operational research
conducted with BNMT DPHO/BNMT ASAP
3.2 Leprosy 3.2.1 BACKGROUND: Leprosy is one of the major public health problems of eastern region. It is aimed to provide diagnostic and therapeutic services of leprosy within the general health services. MDT service is available in all health institutions of the region. Leprosy burden is high in Terai district where as low or eliminated in hill districts. The regional prevalence rate of leprosy is continually in decreasing trend but the new case detection rate is not declined as expected. In 1982 leprosy PR was 17.3 per 10000 populations and finally this value reduced to 2.81. This indicates the achievement of reduction is 83.76% and leprosy elimination is in the positive trend. 3.2.2 OBJECTIVES:
• Elimination of leprosy by the year 2005 AD (Prevalence rate below 1 cases per 10,000 population) at national level
• Provision of MDT to all registered cases • Prevention of disability by early detection and treatment of cases • Reduction of social stigma by increasing awareness about the disease
3.2.3 TARGET:
• To reduce the present registered prevalence rate to < 1 per 10000 population by the middle of FY 062/063 (end of December 2005)
• To reduce impairment and disability due to leprosy resulting reduction of WHO defined disability proportion around 5%
• To prevent leprosy transmission by early case detection and increase patient volunteer submission more than 90%
3.2.4 STRATEGY:
• High priority will be given to undetected cases and treatment • Increased co-operation and coordination between HMG and I/NGOs will be maintained
TB Cure rate is in increasing trend in Morang.
27
3.2.5 ANALYSIS OF ACHIEVEMENT BY MAJOR ACTIVITIES: Table 22 Performance of Health Education Programme
Program/ Activities
Units Target Achievement
% Achieved
% expenditure wrt released budget
Reasons for not achieve 100%
School Health education Times 17 17 100.0
Rapid inquiry survey VDC 10 10 100.0
Supervision Times 40 40 100.0 95.5
MB PB S.N
. Indicators
2059/60 2060/61 2061/62 2059/60 2060/61 2061/62 1. New Case
Detection Rate 2.6 2.6 1.1 4.1 3.1 1.3
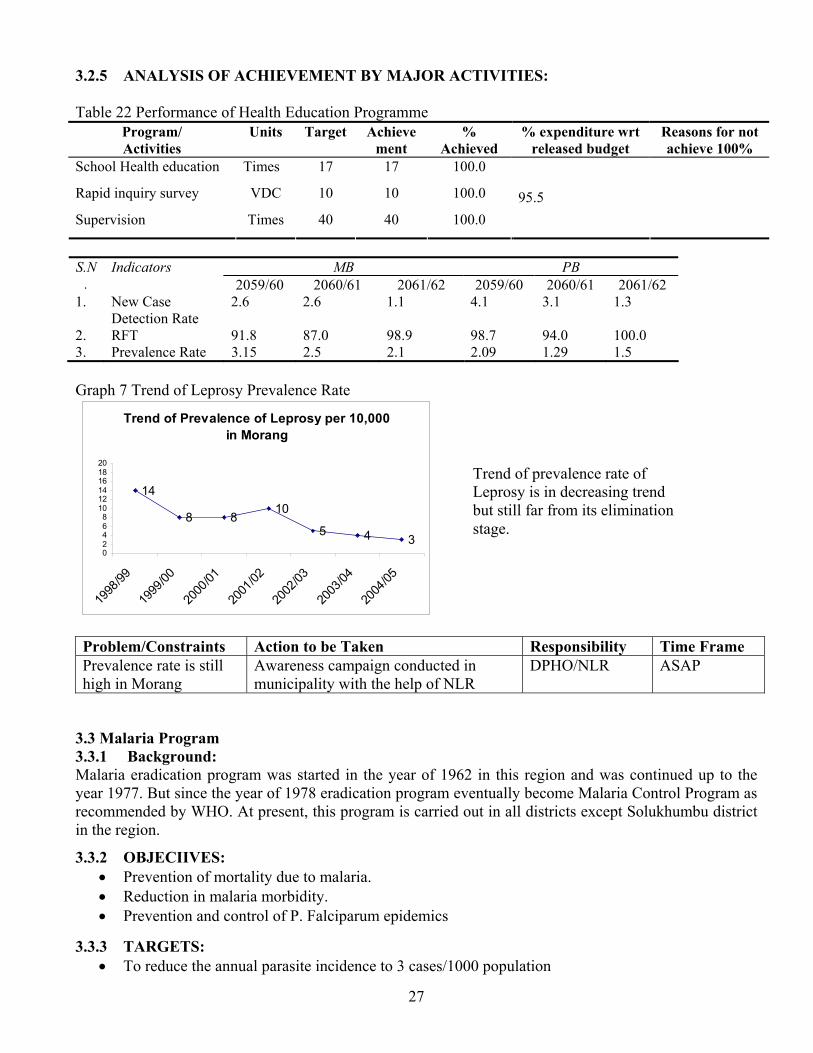
2. RFT 91.8 87.0 98.9 98.7 94.0 100.0 3. Prevalence Rate 3.15 2.5 2.1 2.09 1.29 1.5 Graph 7 Trend of Leprosy Prevalence Rate
Trend of Prevalence of Leprosy per 10,000 in Morang
14
8 810
5 4 302468
101214161820
1998
/99
1999
/00
2000
/01
2001
/02
2002
/03
2003
/04
2004
/05
Problem/Constraints Action to be Taken Responsibility Time Frame Prevalence rate is still high in Morang
Awareness campaign conducted in municipality with the help of NLR
DPHO/NLR ASAP
3.3 Malaria Program 3.3.1 Background: Malaria eradication program was started in the year of 1962 in this region and was continued up to the year 1977. But since the year of 1978 eradication program eventually become Malaria Control Program as recommended by WHO. At present, this program is carried out in all districts except Solukhumbu district in the region. 3.3.2 OBJECIIVES:
• Prevention of mortality due to malaria. • Reduction in malaria morbidity. • Prevention and control of P. Falciparum epidemics
3.3.3 TARGETS: • To reduce the annual parasite incidence to 3 cases/1000 population
Trend of prevalence rate of Leprosy is in decreasing trend but still far from its elimination stage.

28
3.3.4 STRATEGIES: • Early diagnosis and prompt treatment of malaria cases through health facilities • Selective application of indoor residual spraying in case of epidemic prone areas • Promotion of personal protective measures • Improving target setting of blood slide collection and lab facilities for strengthening early
diagnosis of malaria in service outlets of malaria endemic districts • Training for increased competence of puerperal level health staff in malaria control
3.3.5 ANALYSIS OF ACHIEVEMENT BY MAJOR ACTIVITIES: Table 23 Malaria: Target Vs Achievement
Program/ Activities
Units Target Achievement
% Achieved
% expenditure wrt released budget
Reasons for not achieve 100%
Slide collection No. 6000 14662 100.0
Malaria Spraying Times 2 2 100.0 96.5
Table 24 Malaria Incidence Indicators 2059/060 2060/061 2061/062
Malaria Parasite Incidene/1,000 0.2 0.2 0.1
Slide Positively Rate 2.5% 1.6% 1.2%
% of PF 15.2 9.9 12.4
Clinical Malaria Incidence Per/1,000 risk population 3.7 5.2 5.7
3.3.6 Problem/Constraints and Action to be taken
SN Problem/ Constraints Action to be taken Responsibility Deadline 2 Increasing SPR Re-activate the PCDV Programme. EDCE/DoHS ASAP 3 Delay budget release Requested DoHS DoHS ASAP
3.4 Kala-azar Program 3.4.1 Background: Kala-azar has been reported from six districts in this region. This disease is also a public health concern due to high case fatality rate among the infected cases. It is mostly prevalent in rural area with low socio economic group of the people. 3.4.2 Objectives:
• To reduce morbidity and mortality due to Kala – azar. • To prevent epidemic due to Kala – azar.
3.4.3 Targets:
• To reduce the Kala – azar incidence in the region. • Prevention of epidemic.

29
3.4.4 Strategies:
• Early diagnosis and prompt treatment of Kala–azar through strengthening of referral services at the peripheral health Institution.
• Early detection and timely containment of epidemics. • Protection of risk population with indoor residual spraying.
3.4.5 Analysis Of Achievement By Major Activities: Table 25 Target Vs Achievement
Program/ Activities
Units Target Achievement
% Achieved
% expenditu
re wrt
Reasons for not achieve
100% Spraying Times 2 2 100.0
Target 26 Incidence of Kala-azar Indicators 2059/060 2060/061 2061/062
Case Incidence/10000 of Population 13.7 12.4 11.4
Number of death due to Kala-azar 1 1 2
Trend of Incidence of Kala-azar Per 100,000 Population in Morang
5.11 0.3 0.6
13 12
23
05
10152025
1998
/99
1999
/00
2000
/01
2001
/02
2002
/03
2003
/04
2004
/05
Graph 8 Kala-azar is in increasing trend in Morang district.
Trend of Kala-azar Cases and Affected VDCs in Morang
39
70
2341
103
64
124
21 27 19 2717
41 35
0204060
80100120140
1998
/99
1999
/00
2000
/01
2001
/02
2002
/03
2003
/04
2004
/05
Cases
VDCs
Graph 9 The trend of Kala-azar, is increasing. Total 41 VDCs are being affected by Kala-azar.
3.5 JE Program Table 27 Target Vs Achievement
Program/ Activities
Unit Target Achievement
% Achieved
% expenditure wrt released budget
Reasons for not achieve 100%
Spraying, Fogging time 2 2 100
Table 28 Incidence of JE Indicators 2059/060 2060/061 2061/062
Case Incidence/100000 6.6 6.4 3.0
Number of death due to JE 6 8 3

30
3.6 AIDS and STDs Programme Targeted Activities. Table 29 Performance in HIV/AIDS programme
Program/ Activities
Units Target Achievement % Achieved
% expenditure wrt released budget
Reasons for not achieve 100%
HIV/AIDS day time 1 1 100 NA
DACC meeting time 2 2 100 NA
3.7 Curative Service through OPD Service 3.7.1 BACKGROUND: Curative health services aims to provide appropriate diagnosis, treatment and referral through the network of PHC outreach to specialized hospitals. It is one of the important and highly demanded services. Services are provided through all health facilities. 3.7.2 OBJECTIVES:
• To provide curative services to all patients reporting to the health facilities or PHC outreach sites to reduce duration of illnesses, mortality and improved quality of life.
3.7.3 TARGETS:
• To provide service to all clients attending health facilities with appropriate diagnosis, treatment and/or referral to specialized facilities.
3.7.4 STRATEGIES:
• Establishment and service delivery through of SHP in all the VDCs. • Establishment and service delivery through PHCs in all electoral constituencies. • Establishment of 3-5 out reach clinics in all VDCs for EPI and PHC-ORC.
3.7.5 ANALYSIS OF ACHIEVEMENT BY MAJOR ACTIVITIES: Table 30 Coverage of OPD Indicators 2059/060 2060/061 2061/062
Total OPD visits as % of total population 17.6 18.9 19.18
3.8 Epidemics control Table 31 Epidemics or Out breaks Epidemics Number of VDCs Affected Number Episode Measles, Diarrhoea, Skin 5 200 5
World AIDS day was observed in Morang in collaboration with DDC, Schools and NGOs on 1st December 2004.
Morang Male Female Total HIV/AIDS 196 112 308 IDU - - 558

31
4. SUPPORTING PROGRAMMES 4.1 Partners Defined Quality Table 32 Partners defined quality Supporting Partners No. of Health
Institutions Benefited Participants Outcome
SCF US 50 500 HFMC strengthened 4.2 HMIS 4.2.1 BACKGROUND: To develop skill in record keeping, analysis and use of information for planning and supervision, integrated HMIS implementation strategies started in 1993. Efforts are being done to utilize HMIS information in planning, monitoring, supervision and evaluation at regional and district level. 4.2.2 OBJECTIVES:
• To monitor the coverage, continuity and quality of the health services and to assist service provider and managers to use the data at the service delivery level.
• To assess the progress of district health programmes. • To help districts in preparation of work plan.
4.2.3 STRATEGIES:
• Collection of information, analysis and use for planning, monitoring and management. • Initiate bottom-up planning. • To organize programme performance review meeting.
4.2.4 ANALYSIS OF ACHIEVEMENT OF MAJOR ACTIVITIES:
• Monthly reports are monitored and feed back given to the concerned VDCs or HIs. • District level programmes performance review workshop completed. • Work plan and integrated supervision plan was prepared to cover all 17 Ilakas.
Table 33 HMIS Reporting Status by Institutions (%) FY 2059/060-2061/062
FY District Hosp PHC HP SHP PHC /ORC
FCHV NGO
059/060 100 33 100 100 99 95 96 98
060/061 100 100 100 100 99 92 920 98
061/062 100 100 100 100 98 86 95 98
Table 34 Status of number of Monthly Meeting conducted FY 2061/062.
Name of District Number of Meeting Number of monthly meeting conducted at district level based on the Monthly Monitoring sheets FY 2061/062
Morang 12

32
Table 35 Average number of People Served by type of health facilities per months FY District Hosp PHC HP SHP PHC/ORC FCHV NGOs
059/060 40 184 963 663 206 30 24 409 060/061 57 187 1009 706 238 27 34 422 061/062 51 192 1311 584 248 29 43 432
S.N. Problems/ constraints Action to be taken Responsibility Deadline
1 Delay reporting from
Health Institutions Feedback given to concerned institutions
Incharges of HIs
ASAP
2 Incomplete and Inconsistent reporting
-Proper person not always involved in report making -Feedback given
Health Institutions Incharges
ASAP
3 Lack of training for newly recruited health workers.
Provision of basic and refresher training.
MD/ NHTC/ DoHS
ASAP
4.3 LMIS Table 36 Reporting Status by Institutions (%) FY 2061/062
District Hospital PHCC/HC HP SHP
100.0% 75.0% 100.0% 100.0% 98.5% Table 37 Health Institutions wise ASL, EOP of Essential Commodities
Condom Depo Pills ORS Vita. A Cotrim Iron tablets F.Y. Health Institution ASL EOP ASL EOP ASL EOP ASL EOP ASL EOP ASL EOP ASL EOP PHC/HP/SHP
139715 27943 23530 4706 18325 3665 54445 10889 102355 20471 313305 62661 572275 114455 2060/61
District 279430 83829 47060 14118 36650 10995 108890 32667 204710 61413 626610 187983 1144550 343365 PHC/HP/SHP
2061/62
District
4.4 Female Community Health Volunteer (FCHV) 4.4.1 Background: To acquire support and active participation of the community in primary health services, the FCHV programme was initiated in the year of 1988/89 At present FCHVs are involved in the distribution of condoms, pills, Vitamin "A" Capsules, ORS and also initial management of ARI cases in selected district. They are also responsible for the dissemination of information and education in the community on FP, EPI, Nutrition and Sanitation. 4.4.2 Objectives:
• To empower rural women with basic knowledge and skill. • To develop in every word at least one FCHV as a health resource person who is knowledgeable,
trained and well supported by local mothers. 4.4.3 Strategies:
• Training of FCHVs basic and refresher. • Review meeting for FCHVs trimester. • Orientation of VDCs members for selection of FCHVs.
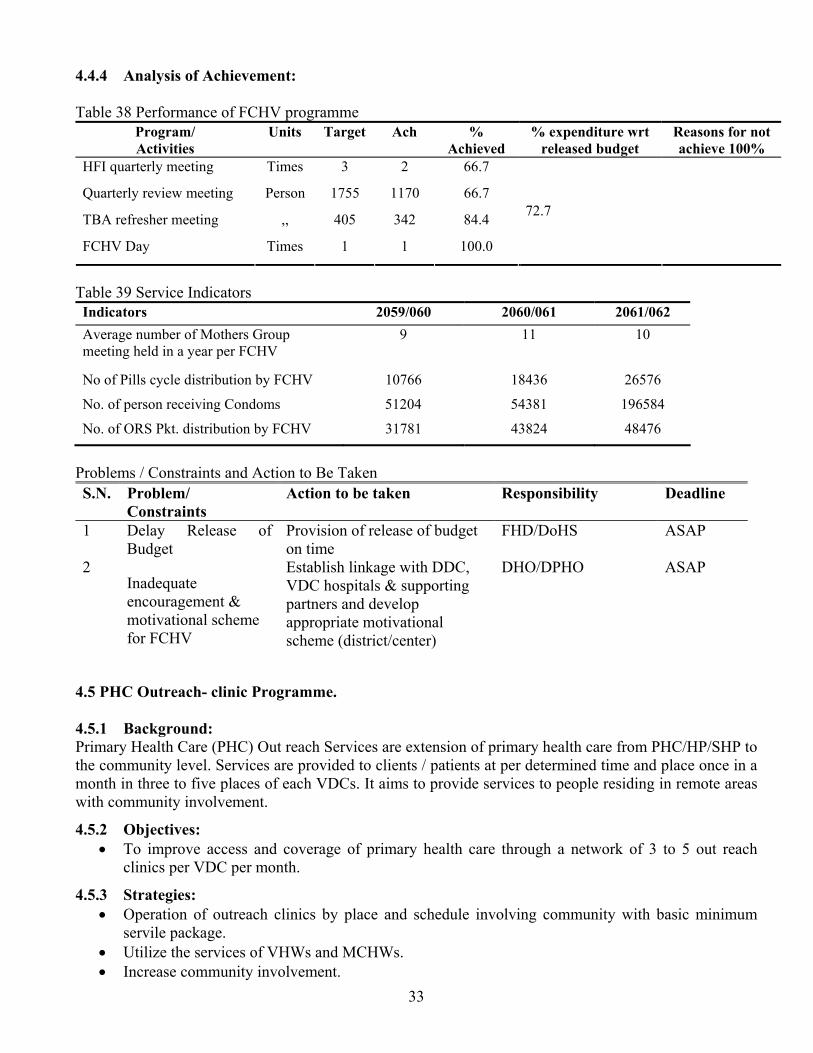
33
4.4.4 Analysis of Achievement: Table 38 Performance of FCHV programme
Program/ Activities
Units Target Ach % Achieved
% expenditure wrt released budget
Reasons for not achieve 100%
HFI quarterly meeting Times 3 2 66.7
Quarterly review meeting Person 1755 1170 66.7
TBA refresher meeting ,, 405 342 84.4
FCHV Day Times 1 1 100.0
72.7
Table 39 Service Indicators Indicators 2059/060 2060/061 2061/062 Average number of Mothers Group meeting held in a year per FCHV
9 11 10
No of Pills cycle distribution by FCHV 10766 18436 26576
No. of person receiving Condoms 51204 54381 196584
No. of ORS Pkt. distribution by FCHV 31781 43824 48476
Problems / Constraints and Action to Be Taken S.N. Problem/
Constraints Action to be taken Responsibility Deadline
1 Delay Release of
Budget Provision of release of budget on time
FHD/DoHS ASAP
2 Inadequate encouragement & motivational scheme for FCHV
Establish linkage with DDC, VDC hospitals & supporting partners and develop appropriate motivational scheme (district/center)
DHO/DPHO ASAP
4.5 PHC Outreach- clinic Programme. 4.5.1 Background: Primary Health Care (PHC) Out reach Services are extension of primary health care from PHC/HP/SHP to the community level. Services are provided to clients / patients at per determined time and place once in a month in three to five places of each VDCs. It aims to provide services to people residing in remote areas with community involvement. 4.5.2 Objectives:
• To improve access and coverage of primary health care through a network of 3 to 5 out reach clinics per VDC per month.
4.5.3 Strategies:
• Operation of outreach clinics by place and schedule involving community with basic minimum servile package.
• Utilize the services of VHWs and MCHWs. • Increase community involvement.

34
4.5.4 Analysis of Achievement: Table 40 Target Achievement of PHC-ORC
Program/ Activities
Unit Target Achievement
% Achieved
% expenditure wrt released budget %
Reasons for not achieve 100%
Clinic conducted time 3372 2913 86.4
Management committee reorientation
time 1 1 100 SCF support
Table 41 Performance Indicators of PHC-ORC Indicators 2059/060 2060/061 2061/062
% of PHC/ORC clinic conducted 95.2 92.0 86.4
Average number of clients served per clinic 30 27 29
4.6 Community Drug Programme (CDP) 4.6.1 Background CDP programme in Morang district has been started since 2057/58 with the help of UNICF. Now UNICEF has no programme for monitoring of this programme in the district. BNMT has its programme on Drug Scheme Programme but only limited VDCs are taken so far till now. But by the end of FY 2061/62 district has got data of all 66 health institutions with 10 million rupees in their respective funds in Morang district. 5.6.2 Objective
To make essential drugs available round the year with the participatory cost sharing approach. To ensure poor and disadvantaged patient with free drugs when needed.
5.6.3 Strategies
Drug management committee will ensure all indent and procurement as per needed. Committee will be responsible for overall management including auditing budget.
5.6.4 Analysis of the achievement Graph 10 Trend of the CDP fund Total Budget Balance Of Community
Drug Programme of Health Institution Committees in Morang
6535728
7653533
550000060000006500000700000075000008000000
2061
/62 Pou
sh
2061
/62 A
shar
Point of Time
Rs

35
Table 42. Status of Fund of Community Drug Programme
Ilaka 2061/62 Poush 2061/62 Ashar Jhurkiya 349810 400532 Haraicha 686648 766707 Mangalbare 617875 713294 Letang 70472 158696 Bahuni 525825 631714 Jhorahat 476117 589295 Rani 266537 272879 Babiyabirta 222830 280538 Ranjani 463242 419340 Budhnagar 45311 199498 Dadarbairia 587121 622277 Hasandaha 258057 290307 Kerabari 648790 724412 Madhumalla 512786 504342 Majhare 60770 298967 Tanki 234127 267155 Bayarban 509410 513580 Total 6535728 7653533
4.7 Training Activities 4.7.1 Background: Information Education Communication is one of the important components for the supporting health program. Since 1994, IEC activities have been decentralized and districts are involved in preparing in work-plan and developing IEC materials locally as per guideline of NHEICC. 4.7.2 Objectives:
• To raise health awareness of the people as to promote improved health status. • To prevent disease through the effort of people themselves and through utilization available
resources. 4.7.3 Strategies:
• Promotion of IEC activities in all governmental and non-governmental agencies. • Dissemination of information, education and communication on health issues through health and
health related workers. • Use of individual group and mass media in health education, information and communication.

36
4.7.4 Analysis of Achievement of Major Activities: Table 43 Target Achievement of Training Programme
Program/ Activities
Units Target Achievement
% Achieved
% expenditure wrt released budget
Reasons for not achieve 100%
FCHV (Biratnagar Municipality)
person 70 70 100 BRT M.
Neonatal Health HWs 400 400 100 MINI
Neonatal Health FCHVs 585 585 100 MINI
CB-IMCI HWs 110 110 100 Plan Nepal
4.8 National Health Information Education & Communication Programme Target Activities. 4.8.1 Annual Activities assigned by Centre Table 44 Target Achievement of IEC
Program/Activities Unit Target Achievement
% Achieved
% expenditure wrt released budget
Reason for not ach. 100%
Gender awareness workshop for health worker
No. 1 0 0.0
Slide shows in cinema halls Times
910 310 34.1
Health education exhibition in Community
,, 3 1 33.3
Street drama ,, 9 2 22.2
FM Radio programme ,, 180 195 100.0
School Health Programme ,, 173 69 39.9
Interaction programme between press and concerning personal
,, 16 12 75.0
District Health Education review
Dist. 1 1 100.0
Health education material distribution
Times
3 2 66.7
IEC material production Piece 20000 20000 100.0
Health education materials publication/prize
,, 2 2 100.0
Health education Corner times 53 38 71.7
Health Ed. promotion campaign ,, 53 53 100.0
46.0
S.N. Problems/ constraints Action to be taken Responsibility Deadline
1 Delay release of budget MoH, DoHS ASAP 2 Distributed targets were not
achieved by HIs Delay reporting resulted poor performance
District, HIs ASAP

37
4.8.2 Health Related Special Days Observed Table 45 Special days observed in the collaboration with partners round the year Special days Date
1. World Population day (DPHO Morang stood first position in this occasion on district wide stall competition organized by UNFPA and Purbanchal University at Biratnagar)
July 11
2. World Breast Feeding Week August 1-7 3. Malaria Control Day August 20 4. National FCHV day October 1 5. World Leprosy day January 25 6. Iodine Deficiency Disaoder Month February 7. World TB day March 24 8. World Health Day April 7 9. World No Tobacco day May 31
4.9 Laboratory Services Table 46 Laboratory Services
Program/ Activities
Units Target Achievement
% Achieved
% expenditure wrt released budget
Reasons for not achieve 100%
Malaria Slides Each 45740 9425 21
4.10 Financial Management Table 47 Budget Expenditure
Programme /Activities Allocated Budget
Budget Released
Budget Expenditure 2061/062
% of Irregularities Clearances
Health Education 529 245 245 Leprosy 66 63 63 CDD/ARI 570 368 368 Nutrition 189 141 141 NHTC 652 473 473 Family Planning 3960 3277 3277 Integrated Supervision 578 449 449 Malaria 940 907 907 TB 150 112 112 EPI 432 327 327 Integrated Supervision 578 449 449
70.82
Total-----> 8644 6811 6811 4.11 Human Resources Situation Table 48 Human Resources (Note: S=Sanctioned post, F= Fulfilled Posts)
DHO/DPHO PHCC HP SHP Category S F S F S F S F
DPHO/Officers 2 2 6 1 . . . . District Assistants 14 14 - - - - - - Nurse/ANM - - 24 21 11 11 - - HA/AHW - - 18 18 33 33 49 49 Lab. personnel's 3 3 6 6 - - - - VHW/MCHW - - 6 4 11 10 98 97 Adm/General staffs 12 12 12 11 22 22 - -

38
4.12 Piloting Programmes in Collaboration with EDPs 1 Neonatal Health Programme (JSI R&T) 2 Health Insurance Programme (Ministry of Health) 3 Partners Defined Quality, PDQ (Save the Children) 4 FM Radio Programme Production and Broadcasting (Koshi and Saptakoshi FM)
SECTION 3
3 Supporting Partners 3.1 Governmental: Koshi Zonal Hospital, Rangeli Hospital, Biratnagar Sub metropolitan city, district level line offices from Education, Agriculture, Veterinary, and Women development. 3.2 Non Governmental and Private Sector 3.2.1 List of INGO/NGO working in collaboration with DPHO in Morang
1. Merry Stopes Clinic 2. Nepal Red Cross, BRT 3. Help Group 4. CBR Project, Biratnagar 5. Aama Milan Kendra, BRT 6. Birat Nursing Home 7. NATA, BRT 8. FPAN, BRT 9. Adarsa Nirman Mandir, BRT
3.2.2 External Development Partners
EDPs Supporting Areas UNICEF BRT Immunization campaigns UNFPA, BRT HMIS, RH Polio Eradication(WHO), Polio and disease surveillance BNMT, BRT RH, ED, ID, TB NFHP, BRT RH, IMCI NLR , BRT Leprosy SCF(US), BRT PHC-ORC, LQS, PDQ Plan Nepal, BRT CB-IMCI, Cold chain MINI, BRT Neonatal Health
3.3 List of Private Hospital/Nursing Homes. 1. Birat Nursing Home. 2. Eye Hospital 3. Abadh Narayan Nursing Home. 4. Koshi Nursing home 5. Purbanchal Nursing Home. 6. Neuro Diagnosis Nursing Home 7. MS Nursing Home. 8. Adarsa Nirman Mandir, Biratnagar References 1 NPC, Jilla Bastugat Bibaran Morang, National Planning Commission, Statistical Section Morang, 2062 2 Report on Human Development Index, 2004 3 MoH, DoHS, National Immunization Programme of Nepal, Multi-Year Plan of Action, 2002-2007 4 MoH, DoHS, Annual Report of Ministry of Health, Department of Health Services, 2060/61 (2003/2004) 5 Between Census Household Information Monitoring and Evaluation Survey conducted by National Planning Commission, Bureau of Statistics and UNICEF in March-May 2000. 6 MoH, DoHS/USAID, Nepal Demographic and health Survey, 2001 7 MoH, UNICEF, WHO, New Era, Nepal Micro Nutrient Status Survey, 1998 8 ERHD, Annual Report of Eastern Regional Health Directorate Dhankuta, 2060/61(2003/2004) 9 Houston R, A Short History of Nepal's Community Based Pneumonia Programme, JSI/Nepal, 2001 10 The Lancet, Newborn health: a key to child survival, 2005 11 MoH, DoHS, National neonatal Health Strategy, 2060