Embed Size (px)
Citation preview


MOPC Report to Board of Directors / Members CommitteeApril 26, 2016
Noman Williams - Chair

• Action Items TWG 2016 ITPNT and Re-
evaluations Proposed Projects
2017 ITPNT Scope
RTWG – Z2 Payment Plan CMTF – White Paper Staff – Wind Integration
Study Re-evaluation
• Information Items Staff HPILS NTCs / North
Dakota Validation
Wind Integration Study II
TPITF – Update
Agenda
3

Action Items
4

TWG2016 ITPNT
5

2016 ITPNT Background• ITPNT is a near-term reliability assessment
performed annually
• Reliability needs defined per SPP, NERC, company-specific planning criteria Transmission overloads
Voltage violations
• Solutions to reliability needs 69 kV and above transmission solutions
Non-transmission solutions in the form of Operating Guides
• Economic needs or solutions not evaluated6

Key Differences from 2015 ITPNT• Footprint expansion
• NTC Re-evaluation projects removed from base models
• Consolidated Balancing Authority (CBA) weighting
• Operating guides submitted as DPPs applied during solution development
• Winter peak cases
• Significant base case issues 2015 ITPNT (9 Thermal and 127 Voltages)
2016 ITPNT (31 Thermal and 900 Voltages)7


2016 ITPNT Process• Study years: 2015 – 2020 based on 2017 and
2020 models
• Evaluated summer peak, light load (2020 only), and winter peak conditions
• Identified potential reliability-based problems for system intact (Basecase) and (N-1 contingency) conditions
• Model includes existing system network topology and previously approved transmission upgrades
• Issue NTCs from Scenario 0, Scenario 5, and Consolidated Balancing Authority (CBA)
9

SPP Annual ITPNT Load Growth
10* Each model series includes IS loads

11

12

Generation – Scenario 0
13

Generation – Scenario 5
14

Generation – SPP CBA
15

Solutions Evaluated for Needs• ITPNT needs Thermal – 1,573 total Owner unique facility needs - 76
Voltage – 2,982 total Owner unique facility needs - 186
• 1,664 solutions submitted in DPP Window 509 duplicates 33 included modeling corrections 7 non-transmission solutions 15 transmission operating guides
• 354 Staff solutions• TWG approved metrics considered project cost
and the amount of targeted relief the project provides 16

Project Plan Breakdown
17
• 86 proposed upgrades making up 49 projects in the project plan
• $229.2M net total study cost
• New NTCs: $ 362.6M
• Change in Modified NTCs: $ 6.8M
• Withdrawn NTCs: $(140.2M)

ITPNT New Line Miles by Voltage Class
18
• NTC Re-evaluation projects removed from base models

ITPNT Miles Rebuild/ Reconductor by Voltage Class
19
• NTC Re-evaluation projects removed from base models (76 miles of total 173 miles – NTC-Modify)

20
ITPNT Upgrade Cost by Voltage Class

ITPNT Cost Allocation –Regional vs. Zonal
21

ITPNT Upgrades by Need Date and Total Dollar
22

2016 ITPNT STEP Impact
23
STEP Impact
New NTC $ 362,574,605
Modified NTC
PreviouslyApproved $ 221,029,364
Updated $ 227,832,447
Change $ 6,803,083 $ 6,803,083
Withdrawn NTC ($ 140,224,519)
Net Total $ 229,153,169

2016 ITPNT Net Investment by State
24
State New NTCModified
NTC (Net Change)
Withdrawn NTC
Net Investment
KS $ 364,080 $ 12,206,413 ($ 6,088,561) $ 6,481,932
LA $ 3,534,979 $ 0 ($ 38,752,697) ($ 35,217,718)
MO $ 0 $ 0 ($ 4,329,248) ($ 4,329,248)
NE $ 619,277 $ 0 $ 0 $ 619,277
NM $ 14,706,028 $ 332,340 $ 0 $ 15,038,368
ND $ 145,656,270 $ 0 $ 0 $ 145,656,270
OK $ 136,008,936 ($ 4,985,934) ($ 71,519,747) $ 59,503,255
TX $ 61,685,035 ($ 749,736) ($ 19,534,266) $ 41,401,033
Total $ 362,574,605 $ 6,803,083 ($ 140,224,519) $ 229,153,169

NTC Re-evaluation Summary
25
Project Name Owner Re-evalReason Update Recommendation
Hobart - Roosevelt Tap -Snyder 69 kV Rebuild
AEPCost
VarianceNeed remains; reinstate Modify NTC
CPPXF#22 69 kV Terminal Upgrades
GRDATO-
RequestedNeed remains; reissue with
same Need DateModify NTC
Elmore – Paoli 69 kV Rebuild WFECTO-
RequestedNeed remains; reissue with
same Need DateModify NTC
Freedom 69 kV Cap Bank WFECTO-
RequestedNeed remains; reissue with
same Need DateModify NTC
Mustang - Sunshine Canyon 69 kV Reconductor
WFECTO-
Requested
Need remains; reissue with scope change and Need Date
delayed from 2014 to 2020Modify NTC
Knob Hill – Lane – Noel 138 kV New Line
OGE/ WFEC
TO-Requested
Need remains; Need Date accelerated from 2019 to 2017
Modify NTC
Baldwin Creek 230/115 kV Transformer
WERETO-
RequestedNeed remains; Need Date delayed from 2017 to 2019
Modify NTC

NTC Re-evaluation Summary (cont’d.)
26
Project Name Owner Re-evalReason Update Recommendation
Anadarko – Blanchard – OU SW 138 kV Rebuild
WFECTO-
RequestedNeed not found Withdraw NTC
Gracemont - Anadarko 138 kV Reconductor
WFECTO-
RequestedNeed not found Withdraw NTC
Linwood - South Shreveport 138 kV Rebuild
AEPCost
VarianceReplaced with alternative
projectWithdraw NTC
Meeker – Hammett 138 kVNew Line
WFECTO-
RequestedReplaced with alternative
projectWithdraw NTC
Anadarko – Georgia Tap 138 kV Rebuild
WFECTO-
RequestedReplaced with alternative
projectWithdraw NTC
Carmen – Cherokee Junction 138 kV New Line
WFECTO-
RequestedReplaced with alternative
projectWithdraw NTC
Winchester 69 kV Cap Bank WFECTO-
RequestedReplaced with alternative
projectWithdraw NTC
Thackerville 69 kV Cap Bank WFECTO-
RequestedReplaced with alternative
projectWithdraw NTC

ITPNT Rate Impacts By Zone
27

28
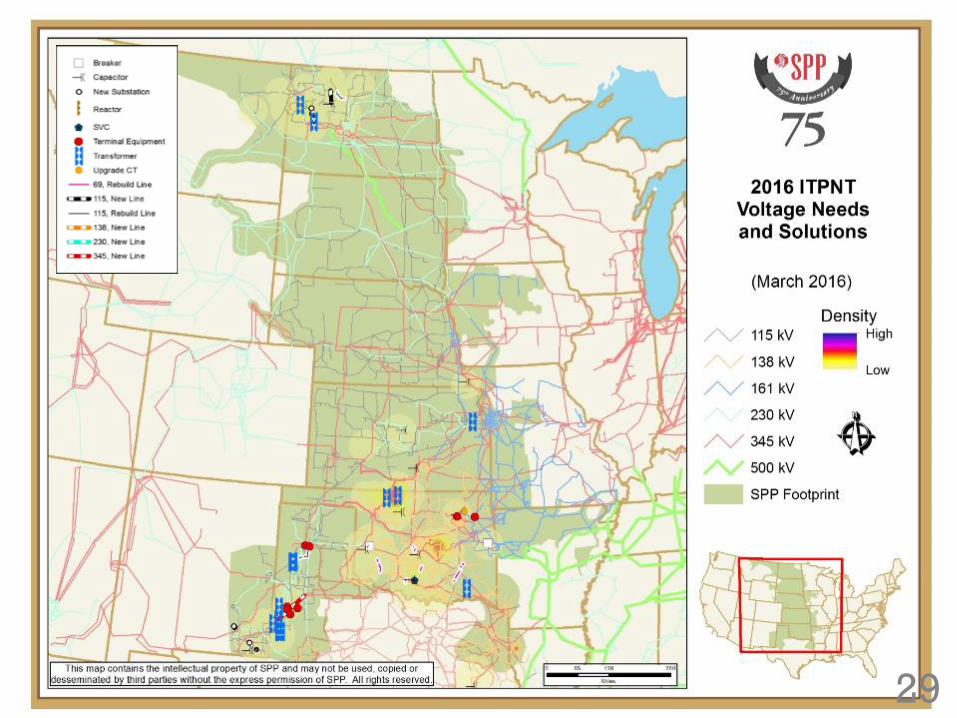
29

Scenario 5 Projects
30
Project Name Owner Need Date
Study Cost Estimate
Rebuild Hobart City-Roosevelt Tap-Snyder 69 kV line (Modification of an existing NTC)
AEP 6/1/2017 $ 31,032,157
Full rebuild Canyon West-Dawn-Panda Hereford-Deaf Smith 115 kV line
SPS 6/1/2017 $ 17,686,344
Tap Tolk-Yoakum 230 kV line and Cochran-Lehman Tap 115 kV lineNew SubstationNew 230/115 kV transformer at New Substation
SPS 6/1/2018 $ 11,672,566
Full rebuild of Duncan-Tosco Tap 69 kV lineUpgrade wave trap at Duncan
AEP 6/1/2018 $ 5,974,766
Tap the Lawrence Hill-Swissvale 230 kV lineNew Substation New 230/115kV transformer at Baldwin Creek
WERE 6/1/2019 $ 21,742,624
Full rebuild of Tosco Tap-Comanche 69 kV line AEP 6/1/2020 $ 4,365,864
Total Cost $92,474,321

RecommendationMOPC recommends the Board of Directors approve the 2016 ITPNT plan as outlined in the 2016 ITPNT plan. This includes issuance and modification of NTCs for projects within the four-year financial commitment window, issuance of Notifications to Construct with Conditions (NTC-Cs) for projects with a nominal operating voltage greater than 100 kV and cost estimate $20 million or greater, and withdrawal of NTCs for projects determined to be no longer needed.
TWG – Approved (2 NOs)
MOPC – Approved (4 Nos, NTEC, Entergy AM, ETEC, Tex-La)
RECOMMENDED MOTION: Motion to approve the 2016 ITPNT plan as outlined in the 2016 plan & 2016 ITPNT report.
31

Short-Term Reliability (STR) Project• STR Project process outlined in Attachment Y,
Section I.3 of the Tariff and SPP Business Practice 7660 SPP Board approves 2016 ITPNT Assessment STR Project information posted on SPP.org 30-day comment period on STR Project posting SPP Board approves final STR Project Report
32

TWG2017 ITPNT Scope
33

Overview• 2017 ITPNT Scope
• Summary of TPL events in the 2016 ITPNT
• 2017 ITPNT Schedule
• 2017 ITPNT Scope Recommendation
34

2017 ITPNT Scope• Purpose
The 2017 ITPNT study will generate an effective near-term plan for the SPP Regional Transmission Organization (RTO) planning region by identifying solutions to reliability criteria exceedances for system intact and contingency conditions
• Study years: 2018 – 2021 Scenarios 0, 5, SPP BA Summer and Winter Peak for both years for all scenarios Light Load for 2021 for all scenarios
• Load and Generation Non-coincident peak for each modeling area Generation with Firm Transmission Service is available for dispatch in
the model
• Topology Includes SPP Transmission Owner topology Includes First Tier entities topology Includes transmission outages of 6 months or longer
35

2017 ITPNT Scope• Contingencies 60 kV and above for SPP 100 kV and above for First Tier NCLL and CFTS TPL events
• Solutions Needs posted for DPP submittal Portfolio projects developed by SPP staff and SPP
stakeholders Seams project coordination All 2017 ITPNT Needs will be addressed
• Enhancements Allowance of NERC TPL-001-4 standard Table 1
planning events that do not allow for non-consequential load loss (NCLL) or curtailment of firm transmission service (CFTS) to be identified as potential violations
36

TPL in the 2016 ITPNT• In the 2016 ITPNT Scope recommendation letter to
MOPC, Staff stated a summary of results would be provided to MOPC
• Staff performed analysis using the TPL events that do not allow for non-consequential load loss (NCLL) or curtailment of firm transmission service (CFTS) as a sensitivity in the 2016 ITPNT study
• This analysis was performed for informational-only purposes
37
TPL in 2016 ITPNT Results• TPL events 111,988,620 total TPL NCLL and CTFS events ran 7,465,908 total per model (15 ITPNT models) 9,963 total non-converged models Would produce more potential violations once
solved
• 9,963 total Thermal potential violations 47 New unique facilities (Monitored elements) The 47 facilities are new based on TPL events and
did not show in the 2016 ITPNT Needs list
• 24,538 total Voltage potential violations 166 New unique facilities (Buses) The 166 facilities are new based on TPL events
and did not show in the 2016 ITPNT Needs list
38

TPL Potential Violations
39
3,595
47
24,538
166
Total TPL Thermal New Unique TPL Thermal Total TPL Voltage New Unique TPL Voltage
TPL Potential Violations2016 ITPNT

TPL Contingencies
40
9,9637,465,908
111,988,620
Total non-converged cases Total contingencies by case Total contingencies ran
TPL Contingencies2016 ITPNT

TPL Thermal Severity
41
• 47 New unique facilities• Severity range >100% loading – 155% loading

TPL Voltage Severity
42
• 166 New unique facilities• Severity range <0.9 p.u. – 0.5 p.u.

2017 ITPNT ScheduleItem Approval
By Start Date Completion Date
Scoping TWG January 2016 March 2016Model Development (S0, S5 & SPP BA) TWG March 2016 July 2016
Needs Assessment* TWG June 2016September
2016
DPP Response Window TWG September 2016 October 2016
Solution Development TWG September 2016 November 2016
Draft Portfolio TWG December 2016 February 2017
Final Reliability Assessment TWG March 2017
Review report TWG March 2017 April 2017
Final report with recommended Project Plan
TWG March 2017 April 2017MOPC April 2017 43*Note: This schedule does not include TPL NCLL and CFTS as potential violations the 2017 ITPNT

RecommendationThe MOPC recommends the Board of Directors endorse the 2017 ITPNT scope, which allows the NERC TPL-001-4 standard Table 1 planning events that do not allow for non-consequential load loss or curtailment of firm transmission service will be identified as potential violations.
TWG – Approved
MOPC - Approved
RECOMMENDED MOTION: Motion to endorse the 2017 ITPNT scope as Recommended by the MOPC.
44

RTWG
45

Z2 Crediting Status• Historical Data Processing Phase 1 is in process.
• Historical Data Processing Phase 2 has been delayed.
• The project is targeting production ready status by 6/01/2016.
• Based on the project schedule, historical data will be available for MOPC review in time for the October MOPC.
• Member on-site system review has been delayed until late May.
• Z2 credit invoicing is planned to begin 11/4/2016.
46

47Jan Feb Mar Apr May June July Aug Sept Oct Nov
Load Remaining HDP Data
Historical Calc Pre-Work
Load HDP Data
11/4Ready for
Invoice
BPFO
CSS M3 R2/3SAT/SIT
CSS M3 R4SAT/SIT
TS M4 SAT/SIT
PT
Overall SPP FIT
Member Test
Generate Reports
Historical Data Processing (2008 to 2016)
Review Reports
Gross CPO, BPFO, Sponsor Data, Sch11
Members, MOPC
SPP
1 GL
2.1 GL (ST, Net CPO, RRA)
3 GL
*Member On-site April/May
RRR, ST, Net CPO, STL Charges
CSS M3 R5 SAT/SIT
1/22 end
2/22 end
5/15 TENTATIVE
5/6 TENTATIVE
4/25 end – EXTENDED through May
5/27 TENTATIVE (can slide w/o impacting HDP GL2)
6/1 System Readiness – CSS, STT, BPFO, Trans STL
3/31 TENTATIVE
2.2 GL (Settlement Disty)

Payment Plan Options• Payment Plan
• Staggered Billing Approach
48

Level Payment Plan• Entities with a net payable amount will have the option
of paying the entire amount at one time or pay in four equal installments, one every three months (i.e. month 1, month 4, month 7 and month 10)
• Current implementation schedule the first monthly invoice in November 2016 Paying in four equal installments FERC interest will be
applied to unpaid balances Pay in full the total amount billed would be due in month 1
with no interest included in the payable amount.
• Those entities with net receivable balances would receive distribution of amount paid in proportion to their net receivable balances
• Historical amounts invoiced each month must be paid in full
49

Staggered Billing Plan• SPP would bill all entities incrementally based
upon subsets of the historical period over the same four consecutive quarter basis as the Level Payment Plan option.
• For example, SPP could charge and credit 2008-2010 amounts in Month 1, 2011-2012 amounts in Month 4, 2013-2014 amounts in Month 7, and 2015-2016 amounts in Month 10
• The incremental periods would be selected with the goal of smoothing out the invoiced amounts. However, the amount billed in each period would not be equal to the other periods
• No interest would be included in the amounts charged
50

Level Payment Plan – Pros & Cons• Pros Flexibility—Does not
have to be a one size fits all approach
Companies that choose to pay the entire amount avoid additional interest
Equal amounts paid and received each quarter
• Cons Administration of
multiple options including additional audit controls
Manual calculation of revenue distribution increases risk of error
Because invoice amounts are levelized, they can be directly tied to billing detail only in aggregate over entire historical period
51

Staggered Billing – Pros & Cons• Pros Flexibility in
determining time increments for billing
Ease of administration for SPP staff
No new audit controls Similar process to
production; billing could start immediately upon completing the historical period calculations
• Cons One size fits all
approach may not be preferred by all
Net receivers would not be paid interest associated with the balances during the payment plan period
52
RTWG Recommended Option• The RTWG approved the Payment Plan
option at its February 25, 2016 meeting
• There were 2 NO votes – Xcel & WFEC and 2 Abstentions – LES & Tenaska
• Xcel provided an explanation for their NO vote (included in the MOPC background material) which centers around the concerns over challenges faced by Xcel of choosing an option without knowing the amount of money involved.
• WFEC, LES and Tenaska provided no written explanation for their votes
53

Consequences of Postponing a Vote to July• Depending on the Plan selected SPP may need to file
with FERC to support the process;
• Assuming a sixty day response period for the FERC, a Plan decision by SPP in late July would put FERC response early in October;
• Should a waiver filing be required, FERC is under no such sixty day obligation to respond; and
• Financial information will not be available to stakeholders by July anyway.
54

Absent any Plan• SPP could default to current Tariff provisions and invoice
all customers by the 3rd day of the go live month with payments due 15 later.
• This would have a significant impact on many SPP customers and not the desired outcome.
55

RecommendationMOPC approved the Level Payment Plan as the method of implementing the collection and distribution of monies to compensate Upgrade Sponsors for use of Creditable Upgrades.
RTWG Approved (2 NOs, Xcel, WFEC)
MOPC Approved (77.4%, 14 Nos)
RECOMMENDED MOTION: Motion to authorize SPP staff to file all necessary waivers with the Federal Energy Regulatory Commission to implement the Z2 Payment Plan.
56

CMTF
57

Outline
58
• Background
• Load Responsible Entity
• Planning Reserve Margin Requirement
• Planning Reserve Assurance Policy
• Deliverability Study
• CMTF Recommendation

Capacity Margin Task ForcePurpose
Updating SPP Capacity Margin requirements and methodology
Members
Tom Hestermann (SEPC), Chair Jason Atwood (NTEC), Vice-Chair L. Nickell (SPP), Secretary
Bill Bojorquez (Hunt Trans) Clint Bruhn (LES) Walt Cecil (MoPSC)
Jason Chaplin (OCC) Bill Dowling (MWE) J. Grotzinger (MJMEUC)
Zac Hager (OGE) Brad Hans (MEAN) Randy Hughes (COI)
Jon Iverson (OPPD) Jim Jacoby (AEP) Rob Janssen (Dogwood)
Lloyd Linke (WAPA) Pat Lyons (NMPRC) Pat McCool (KCPL)
Aaron Ramsdell (BEPC) Randy Root (GRDA) John Stephens (CUS)
Jon Sunneberg (NPPD) Bryan Taggert (WR) Todd Tarter (EDE)
Joe Taylor (Xcel) John Varnell (Tenaska) Mike Wise (GSEC)
59
CMTF Establishment
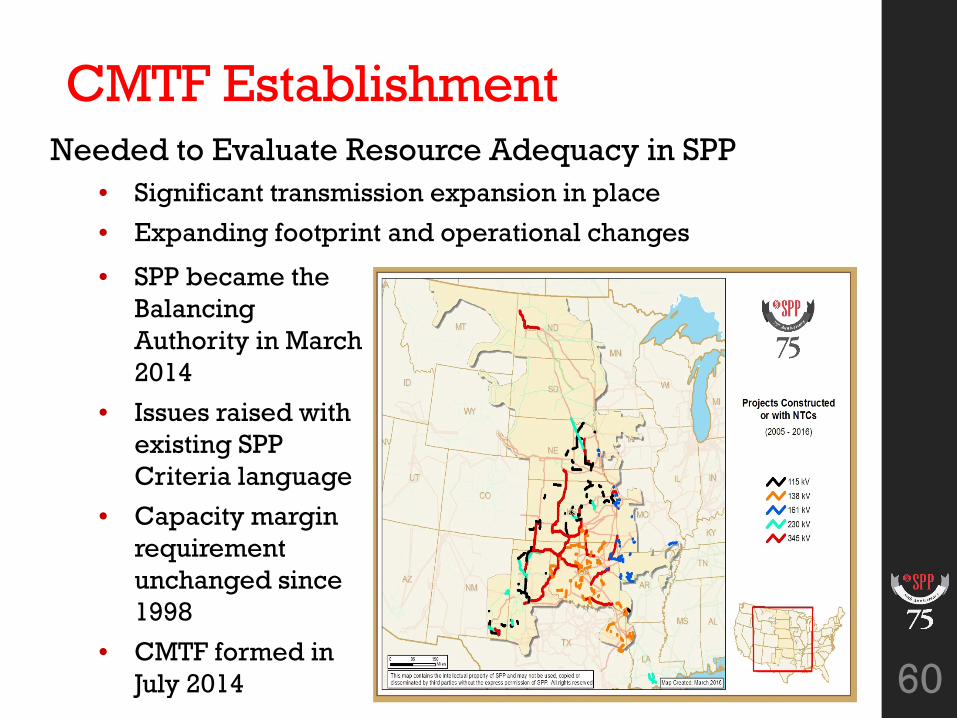
60
Needed to Evaluate Resource Adequacy in SPP• Significant transmission expansion in place
• Expanding footprint and operational changes
• SPP became the Balancing Authority in March 2014
• Issues raised with existing SPP Criteria language
• Capacity margin requirement unchanged since 1998
• CMTF formed in July 2014

CMTF Recommended Policies
61
Load Responsible
Entity
Planning Reserve Margin
Requirement
Planning Reserve
Assurance Policy
Deliverability Study

CMTF Balance Goals
62

Load Responsible Entity (LRE)63

Problem Statement
• Current SPP Criteria obligates Load Serving Members to meet SPP’s reserve margin requirement
• Not all load in the SPP Balancing Authority footprint is served by an SPP member
64

LRE Solution
65
• CMTF proposes that all load serving obligations in the SPP Balancing Authority include an obligation to meet SPP’s PlanningReserve Margin (PRM) requirement
• Approved the LRE whitepaper • Defines the Load Responsible Entity as “any Asset
Owner participating in the Integrated Marketplace with registered physical assets that are either load or firm Export Interchange Transactions”
• Assigns responsibility for PRM to the Market Participant for the LRE
• Recognizes that SPP currently has contractual obligations with the MP, but not the LREs

Planning Reserve MarginRequirement
66

Current Requirement
• SPP Planning Criteria section 4.1.9 states, “Each Load Serving Member’s Minimum Required Capacity Margin shall be twelve percent. If a Load Serving Member’s System Capacity for a Capacity Year is comprised of at least seventy-five percent hydro-based generation, then such Load Serving Member’s Minimum Required Capacity Margin for that Capacity Year shall be nine percent”
• SPP’s minimum capacity margin requirement of 12% has been in place since October 1, 1998, prior to that it was set at 15%
• The current 12% capacity margin requirement is equivalent to a reserve margin requirement of 13.6%
67

Analysis• “Limbo Study” performed to determine Loss of Load
Expectation (LOLE) at various reserve margin levels Monte Carlo simulations, each conducted at 3,000 or more
trials
Assumptions vetted by CMTF, ORWG, and GWG
Three years studied: 2016, 2017, and 2020
Topology updated to reflect latest planning models being used in 2016 ITPNT assessment
Third-party assessment of SPP’s Limbo Study performed
• Additional sensitivities performed based on feedback of CMTF, ORWG, and GWG
• Assessed load diversity impacts on non-coincident peak application of the reserve margin requirement
68

“Limbo” Study Results
69
0.92
0.46
0.27 0.18
1.73
0.45
0.19 0.15
0.45 0.37
0.15 0.080.0
0.2
0.4
0.6
0.8
1.0
1.2
1.4
1.6
1.8
2.0
7.53% 8.70% 9.89% 11.11%
LOLE
(Day
s per
ten
year
s)
Reserve Margin (%)
Reserve Margin “LIMBO” Study Results
2016 LOLE Results2017 LOLE Results2020 LOLE Results
SPP Criteria

Sensitivity Analysis Summary (2017)
70

Sensitivity Analysis Summary (2020)
71

Combined Sensitivity Analysis
72

Comparison of Regional PRM Requirements (13.6% RM)
73

Comparison of Regional PRM Requirements (12% RM)
74

PRM Reduction Cost Savings
75
InputsCurrent Reserve Margin 13.6%
Proposed Reserve Margin* 12.0%
Net CONE (CT) $109.6 ($/kW-yr)Results
Annual Capacity Cost Savings(2015 $)
$86.14 $M
40-yr Capacity Cost Savings (2015 $)
$1,347.22 $M
* Reducing reserve margin requirement from 13.6% to 12.0% results in approximately 900 MW of capacity reduction

CMTF PRM Recommendation Vote
76
• CMTF straw poll results from Dec 3rd meeting
• CMTF approved a reduction of SPP’s PRM requirement from 13.6% to 12.0% on Feb 16, 2016• 22 votes cast• Unanimous approval with 2 abstentions
Reserve Margin (%) Votes For Votes Against Abstentions
Percentage of votes for
reserve margin13.0% 20 1 1 95.2%12.5% 16 3 3 84.2%12.0% 13 6 3 68.4%11.5% 8 12 2 40.0%

Planning Reserve Assurance Policy (PRAP)
77
Planning Reserve Assurance Policy
Current PRM Enforcement Potential revocation of membership
Potential imposition of NERC reliability standard penalty provisions in SPP’s Attachment AP, if violation occurs
78
• Too extreme• Occurs too late to assure adequate
levels of PRM are maintained• Entities with capacity in excess of SPP’s
PRM requirement are not compensated for their contribution to SPP’s PRM
Shortfalls of Current
Enforcement

Planning Reserve Assurance Policy
CMTF Proposal Payment based on Cost of New Entry (CONE)
from deficient entities to entities with excess capacity, based on forecasts Payment scaled based on the potential for
reduced reliability in the SPP region
79
• Establishes a reasonable enforcement mechanism
• Ensures an adequate level of reliability is maintained
• Incentivizes proper resource planning• Compensates those with excess capacity
when needed to offset an entity’s deficiency
Benefits of the Planning
Reserve Assurance
Policy

Planning Reserve Margin Assurance Policy Timeline
80

Deliverability Study81

Deliverability Study
• Current SPP Planning Criteria 4.1.3 requires firm transmission service be obtained for load and capacity obligations
• With expected adoption of the PRAP, the Deliverability Study policy is proposed to provide an optional means of arranging for planning reserve margin capacity that recognizes: The operation of the Integrated Marketplace Performance of SPP’s planning studies
82

• Each LRE must report capacity committed to supply its load and PRM obligations
• Firm transmission service must exist to support delivery of capacity to an LRE’s peak load obligation
• LREs may use firm transmission service orcontractual arrangement with generating capacity that has been deemed deliverable through the deliverability study for their reserve marginobligation
• SPP will rely on its planning processes to both determine deliverability capacity amounts and ensure deliverability through transmission expansion
83
Deliverability Concepts

Deliverability Study Timeline
84

CMTF Recommendation85

CMTF Proposed Policy Package• The CMTF established four primary areas of
policy development as the top priorities:
• Load Responsible Entity Planning Reserve Margin Requirement Planning Reserve Assurance Policy Deliverability Study
• These policies identify who is responsible for resource adequacy, what the resource adequacy requirement is, and how and whenthe resource adequacy requirement can be and should be met
• The CMTF believes the policies are dependent on each other to yield the intended economic and reliability benefits and believes the policies should be approved and implemented collectively
86

Recommendation
The MOPC recommends the BOD approve the following items to become effective for the summer of 2017:
LRE Whitepaper Planning reserve margin requirement for entities comprised of at least seventy-five percent
hydro-based generation to remain 9.89% and for all other entities to be 12.0% “Capacity Margin” terminology be replaced with “reserve margin” terminology throughout SPP
Planning Criteria and SPP Tariff language Planning Reserve Assurance Policy Whitepaper Deliverability Study Whitepaper
CMTF unanimously approved
CAWG unanimously approved the following motion
The CAWG recommends approval of the policies developed by the CMTF and recommends that they be approved as a package by the RSC. Further, the CAWG believes that the policies are interrelated and should only be considered as a package. It is the CAWG’s position that the proposal provides benefits to ratepayers without jeopardizing reliability.
MOPC approved (1 NO, KMEA)
SPC unanimously approved
RECOMMENDED MOTION: Motion to approve the CMTF White Papers to be effective for the Summer of 2017.
87

Staff
88

Wind Integration Study Phase I• The 2015 SPP Wind Integration Study finalized and
approved at the March ORWG
• Wind Integration Study recommended that nineteen (19) transmission projects be reviewed: Ten (10) volunteered acceleration Four (4) not feasible to accelerate Three (3) NTCs were withdrawn and shall be incorporated
with Operations feedback via new TPITF process Two (2) may be accelerated
• Zero ($0) cost was reported by Transmission Owners
• Primary benefit is meet the reliability issues in the study as well as a benefit in the reduction in congestion costs
89

Benefits• Reliability
??
• Production Costs Sundown – Amoco 230kV
Average benefit for scenario (~$603/hour) Annual benefit = $1,194k/year (~$603/hour * 8760 hours/year * 0.226) Benefit over acceleration window = $597k (~$1,194k/year * 0.5 years)
Cimarron – Draper 345kV Average benefit for scenario (~$120/hour) Annual benefit = $238k/year (~$120/hour * 8760 hours/year * 0.226) Benefit over acceleration window = $437k (~$238k/year * 1.833 years)
Additional scenario was run with both projects Average benefit for scenario (~$650/hour) Annual benefit = $1,287k/year (~$650/hour * 8760 hours/year * 0.226)
90

Sundown – Amoco 230kV
91
• The ITP near term has an approved project scheduled to replace the Sundown and Amoco wave traps by 4/1/2020.
• Sundown – Amoco 230kV will overload upon contingency of the Tolk West –Yoakum 230kV line.
Sundown – Amoco 230kV

Cimarron – Draper 345kV
92
• The project will upgrade the terminal equipment on the Cimarron-Draper 345kV line from 717MVA to 1195MVA. Currently this project is expected to be in-service in 2019.
• Cimarron – Draper 345kV for the loss of either Northwest-Cimarron 345kV or Oklaunion-Lawton Eastside 345kV.
Cimarron – Draper 345kV

Voting
93
• TWG Approved recommendation #5 (Accelerate ITP projects) on 3-16-2016 – (1 NO OPPD, 2 Abstentions EDE, GDS Associates)
• OPPD Comments: My no vote regarding SPP accelerating certain NTCs out the Wind Integration Study (WIS) is due to the following reasons: 1) TWG never offered any chance to review scope for the WIS so very difficult to comment on a recommendation where TWG involvement was not sought at the beginning but at the end, 2) No indication if firm transmission service has been requested or approved for the wind generators that were causing the need to accelerate the NTC projects, 3) TWG presentation didn’t provide sufficient detail to fully understand the how the benefits were calculated and which zones were receiving the benefits.
• ESWG Approved recommendation #5 (Accelerate ITP projects) on 3-17-2016 – (2 NOs OPPD, SUNC, 1 Abstention ITC Holdings)
• SUNC Comments: I do not think the tariff supports a reevaluation or acceleration of an NTC outside of the ITP process (Business Practice 7160). If we deviate from that, then SPP board must approve the reevaluation before it starts and to allow for accelerated study if not going through the ITP process.
• OPPD Comments: There was no indication if firm transmission service has been requested or approved for the wind generators that were causing the need to accelerate the NTC projects.
• The presentation didn’t provide sufficient detail to fully understand the how the benefits were calculated and which zones were receiving the benefits”

WIS Recommended Projects for Acceleration
94
PID
Stat
e(s)
Upg
rade
N
ame
Proj
ect T
ype
New
Dat
e pr
ovid
ed b
y TO
P
Proj
ect
Ow
ner
Indi
cate
d In
-Se
rvic
e D
ate
30364 OK Tatonga - Woodward District EHV 345 kV Ckt 2 Regional Reliability 7/1/2018 new date set by TO 3/1/2021
30364 OK Mathewson - Tatonga 345 kV Ckt 2 Regional Reliability 7/1/2018 new date set by TO 3/1/2021
30364 OK Cimarron - Mathewson 345 kV Ckt 2 Regional Reliability 7/1/2016 new date set by TO 6/1/2017
30364 OK Mathewson 345 kV Regional Reliability 7/1/2016 new date set by TO 6/1/2017
30367 KS Elm Creek - Summit 345 kV Ckt 1 (ITCGP) Regional Reliability 12/31/2016 new date set by TO 3/1/2018
30367 KS Elm Creek 345/230 kV Transformer Regional Reliability 12/31/2016 new date set by TO 12/31/2016
30367 KS Elm Creek 345 kV Terminal Upgrades Regional Reliability 12/31/2016 new date set by TO 12/31/2016
30367 KS Elm Creek 230 kV Terminal Upgrades Regional Reliability 12/31/2016 new date set by TO 12/31/2016
30367 KS Elm Creek - Summit 345 kV Ckt 1 (WR) Regional Reliability 12/31/2016 new date set by TO 12/31/2016
30509 TX Canyon East Sub - Canyon West Sub 115 kV Ckt 1 Rebuild Regional Reliability7/1/2016
new date set by TO 5/31/2016
30817 TX Canyon West - Dawn 115 kV Ckt 1 Rebuild Regional Reliability not feasible to accelerate
Right of way coordination needed 4/1/2018
30817 TX Dawn - Panda 115 kV Ckt 1 Rebuild Regional Reliability not feasible to accelerate
Right of way coordination needed 4/1/2018
30817 TX Deaf Smith - Panda 115 kV Ckt 1 Rebuild Regional Reliability not feasible to accelerate
Right of way coordination needed 4/1/2018
30916 KS Buckner - Spearville 345 kV Ckt 1 Terminal Upgrades Regional Reliability 3/1/2017not feasible to
accelerate 12/31/2016
30842 TX Pantex North - Pantex South 115 kV Ckt 1 Reconductor Regional Reliability needs NTC 4/1/2019
30842 TX Highland Park - Pantex South 115 kV Ckt 1 Reconductor Regional Reliability needs NTC 4/1/2019
30842 TX Martin - Pantex North 115 kV Ckt 1 Reconductor Regional Reliability needs NTC 4/1/2019
30843 OK Cimarron - Draper 345 kV Terminal Upgrades Regional Reliability 6/1/2017 4/1/2019
30844 TX Amoco - Sundown 230 kV Terminal Upgrades Economic 10/1/2018 4/1/2019

MOPC MotionThe MOPC approve the ORWG, TWG, and ESWG recommendation to accelerate the Cimarron-Draper 345 and Amoco – Sundown 230 kV transmission projects, pending any further review and analysis and procedural processes deemed necessary to support legal requirements of the SPP OATT.
MOPC approved
95

RecommendationStaff is requesting authorization from the Board to perform an expedited review of the need to accelerate projects with results to be provided in July:
• Cimarron – Draper 345kV (Terminal Upgrades)
• Amoco – Sundown 230kV (Terminal Upgrades)
RECOMMENDED MOTION: Motion to approve the MOPC recommendation to perform an expedited review of the need to accelerate 2 projects per the Wind Integration Study with results provided in July 2016. The 2 projects are the:
• Cimarron – Draper 345kV (Terminal Upgrades)
• Amoco – Sundown 230kV (Terminal Upgrades)
96

Information
97

Staff
98

DirectiveOn April 29, 2014, the BOD approved the HPILS Report and directed issuance of NTCs and NTC-Cs as shown in Appendix C of the report. The BOD also directed...
“…the members in whose systems the additional HPILS loads and assumed generation additions reside will provide updated forecasts of these loads and generators prior to each subsequent quarterly meeting of the SPP BOD, and in addition, will notify the SPP staff immediately upon receipt of any information that, in their judgment, would impact the need for one or more of the previously issued NTCs.”
This is the 2th quarter 2016 update to MOPC and BOD to meet the above objectives.
99

Load analysis – Near Term
100
55
56
57
58
59
60
61
62
63
64
65
2016 2017 2018 2019 2020 2021
GW
SPP ITPNT Load Growth
2013 ITPNT 2014 ITPNT2015 ITPNT 2016 ITPNT

New Mexico• Unserved Load: 200 to 300 MW through 2017
• Loads: Consistent with previous projections
• Generation Additions: No change
101

Permian Basin crude oil production by county
102

North Dakota Validation - BEPC• Unserved Load: 110 MW
• Loads: Official 2016 Load Forecast used latest NIMECA’s
Forecast and accounts for the Unserved Loads Keystone XL load not in BEPC 2015 official forecast
• Generation Additions: Included the Lonesome Creek, Pioneer Station, Brady Wind, LindahlWind, and Campbell County (SD)
103

Load analysis – BEPC McKenzie
104

Load analysis – BEPC Mountrail-Williams
105

Project Status – IS Integration Projects
• New 75-mile 345 kV line from Charlie Creek to Judson placed into service 12/22/2015 Baseline cost estimate: $126,400,000 Latest cost estimate: $114,500,000 (9.4% decrease)
106

Project Status – HPILS Projects• New 40-mile 345 kV line (operated at 230 kV)
from Potash Junction to Road Runner placed into service 10/27/2015 Baseline cost estimate: $54,746,969 Latest cost estimate: $58,507,773 (6.9% increase)
• New 19-mile 115 kV line from Battle Axe to Road Runner placed into service 11/12/2015 Baseline cost estimate: $17,200,329 Latest cost estimate: $13,800,000 (19.8% decrease)
• Road Runner 115 kV SVC placed in service 3/22/2016 Latest cost estimate: $28,918,070
107

Conclusion• Consistent expected Near Term (2016-2017)
unserved loads in spite of slow down in oil drilling due to the low oil prices
• No change recommended in HPILS project construction
108

Wind Integration Study Phase II• ORWG approved scope April 7th, 2016
• Scope is an expansion of Phase I reliability-based study elements with updated models and assumptions
• Additional scenarios in Phase II Transient Stability Analysis for the Spring MDWG 2017
outlook for the 30%, 45%, and 60% wind cases. Seasonal Voltage Stability Analysis 2017 and 2021 year
outlook. Comparison between thermal and voltage to determine if Voltage Stability or thermal limitations are the most limiting. Operations and Planning sensitivity.
Frequency Response Analysis for the spring MDWG 2017 outlook for the 30%, 45% and 60% wind cases.
Targeted 5-minute analysis future ramping 5-year outlook.
• Expect results published prior to January MOPC
• MOPC Approved
109

TPITF
110

TPITF ScopeEvaluate and propose recommendations on:o The appropriateness of the planning cycle and assessments
Effectiveness of using production cost modeling in more assessments
Development, use, and weighting of futures, scenarios and sensitivities
Metrics used to evaluate proposed projects Planning the transmission system beyond the traditional planning
criteria of first contingency (“N-1”)
o Utilization of data, including data collected by operations to ensure consistency in the planning process
o The methodologies and modeling practices used in the planning, compliance, and model building groups to ensure effectiveness and consistency between processes
111

Recommendations• Implement annual ITP planning cycle
• Standardized study scope
• Establish common reliability planning model for all SPP planning assessments
• Utilize a holistic approach to planning
• Create a Staff/Stakeholder accountability program
112

Annual ITP Planning Cycle• Desired State
o Single ITP planning study incorporating near- and long-term views
Annual planning report and NTC recommendations
o Remove ITP20 from planning cycle
Perform separately no more than once every five years unless directed by the SPP Board
o Annual 10-year assessment
Combines the ITPNT, ITP10, and portions of the TPL-001-4 into one assessment
o Overlapping planning cycles
Three 10-year assessments over a three year period
113
Standardized ITP Assessment Scope
114
• Desired Stateo Standardized Scope
Review and approval of methodologies and criteria that guide study processes
Simplify scope development process; eliminate need to review and approve items annually
Help provide the consistency members seek for the planning studies
o Assumptions Document Fully outline and describe scope items that require Stakeholder
review and approval with each new study
Maintain flexibility to make needed changes for those specific scope items
o Leverage SPP’s Revision Request (RR) Process for scope changes Govern how the submitted changes will be received, reviewed,
approved, and implemented Proper Stakeholder vetting and approval

Common Planning Model• Desired State
o Base Reliability Model Reduce bookend scenario model sets to single expected case
scenario Represents SPP load responsible entities serving network load with
firm network resources only Non-coincident peak load forecasts Assumed long-term firm transmission service
o Economic Model Identify and assess solutions to economic and public policy needs
of the SPP system Developed for three study years (Years 2, 5, and 10) Up to three economic models will be developed for the reference
case future in Years 5 and 10o CBA Reliability Model
Represents SPP load responsible entities serving network load with both firm and non-firm resources under market based construct
Built from Economic model115

Holistic Planning Process• Desired State
o Reliability and Compliance Assessments Reliability needs produced from base reliability and CBA reliability
models; model set Compliance needs produced from the TPL base reliability and short
circuit models o Public Policy Assessments
Public policy needs considered in the economic model runs for each Future in Years 2, 5, and 10
o Economic Assessments Economic needs determined based on congestion in the SPP region
o Operational Assessments Chronic operational issues with a significant financial or reliability
impact identified in the operation of the integrated marketplaceo Solution Development
A single Detailed Project Proposal (DPP) window Staff will evaluate DPPs and Staff solutions to develop the most
cost-effective solutions to all needs
116

Staff/Stakeholder Accountability• Desired State
o Stakeholders/Staff implement an accountability assurance program
117

ImplementationFinal set of recommendations to the MOPC, SPC, and SPP BOD in July 2016 for approval. Forward recommendations to the appropriate Stakeholder
groups for process development and implementation TPITF will work with impacted Stakeholder groups to develop
timelines for the development, review, and implementation of the changes to the planning process
TPITF will work with Staff and Stakeholders to determine potential resource and other budgetary impacts of the recommended process improvements
Workshops will be held to inform and educate Stakeholders on the proposed improvements prior to July 2016 MOPC
118

Consent Agenda
119

MWG
120