Embed Size (px)
Citation preview

PAGE 1 OF 128
MOOSE-WILSON CORRIDOR USE LEVELS, TYPES,
PATTERNS AND IMPACTS IN GRAND TETON
NATIONAL PARK
TECHNICAL REPORT – SUMMER/FALL 2014 DATA
MAY 11TH, 2015
Submitted By:
CHRISTOPHER MONZ, PHD ASSOCIATE PROFESSOR, DEPT OF ENVIRONMENT & SOCIETY, UTAH STATE UNIVERSITY
ASHLEY D’ANTONIO, MS PH.D. CANDIDATE, DEPT OF ENVIRONMENT & SOCIETY, UTAH STATE UNIVERSITY
KEVIN HEASLIP, PH.D ASSISTANT PROFESSOR, DEPT OF CIVIL & ENVIRONMENTAL ENGINEERING, VIRGINIA TECH
PAGE 2 OF 128
TABLE OF CONTENTS
Moose-Wilson Corridor Use Levels, Types, Patterns and Impacts in Grand Teton National Park ...........................1
Technical Report – Summer/Fall 2014 Data ..............................................................................................................1
Executive Summary....................................................................................................................................................5
Methodology ..........................................................................................................................................................5
Significant Findings................................................................................................................................................5
Overall Use Levels .............................................................................................................................................5
Peak Use Periods ................................................................................................................................................6
Vehicle Use Levels .............................................................................................................................................6
Vehicle Movement Patterns................................................................................................................................6
Vehicle Parking Patterns ....................................................................................................................................6
User Types ..........................................................................................................................................................7
Time Spent in the Corridor .................................................................................................................................7
Bicycle Use Levels, Patterns and Types .............................................................................................................7
Pedestrian Use Levels, Patterns and Types ........................................................................................................8
Differences from Key Findings From Summer/Fall 2013 Report ......................................................................8
Introduction ................................................................................................................................................................9
Study Area ................................................................................................................................................................11
Data Collection Needs and Methods ........................................................................................................................12
Sampling Periods ..................................................................................................................................................12
Data Collection Details .........................................................................................................................................12
Data Collection Methodology: .................................................................................................................................14
1. Vehicle Use Levels ...........................................................................................................................................14
2. Vehicle Type ....................................................................................................................................................15
3. Vehicle Movement Patterns .............................................................................................................................15
4. Bicycle Use Levels ...........................................................................................................................................17
Moose-Wilson Road Method ...........................................................................................................................17
Bike Path Method .............................................................................................................................................17
5. Bicycle Use Type and Behavior .......................................................................................................................17
Moose-Wilson Road Method ...........................................................................................................................17
Bike Path Method .............................................................................................................................................17
6. Bicycle Movement Patterns ..............................................................................................................................19
7. Pedestrian Use Level ........................................................................................................................................19
8. Pedestrian Movement Patterns .........................................................................................................................20

PAGE 3 OF 128
9. Parking Accumulation and Overflow ...............................................................................................................20
Additonal Data Collection ....................................................................................................................................21
Wildlife Brigade ...............................................................................................................................................21
Results ......................................................................................................................................................................21
1. Vehicle Use Levels ...........................................................................................................................................21
Peak Hour for Vehicle Use ...............................................................................................................................22
Average and Total Vehicle Counts ...................................................................................................................24
Directional Traffic Flow ...................................................................................................................................28
Vehicle Use Level Changes Over Time ...........................................................................................................36
2. Vehicle Type ....................................................................................................................................................38
Automatic Traffic Recording............................................................................................................................39
Analysis of Vehicle Turning Movement ..........................................................................................................42
Commercial Vehicle Use ..................................................................................................................................51
3. Vehicle Movement Patterns .............................................................................................................................53
GPS-Tracking Data Collection Summary ........................................................................................................53
Entrance and Exit Patterns of GPS-Tracked Vehicles ......................................................................................56
Vehicle Stopping and Parking Behavior ..........................................................................................................58
Time Spent in the Moose-Wilson Corridor ......................................................................................................66
4. Bicycle Use Levels ...........................................................................................................................................69
Moose-Wilson Road .........................................................................................................................................69
Bike Path – or separated pathway? ...................................................................................................................70
5. Bicycle Use Type .............................................................................................................................................71
Moose-Wilson Road .........................................................................................................................................71
Bike Path ..........................................................................................................................................................80
6. Bicycle Movement Patterns ..............................................................................................................................84
GPS-Tracking Data Collection Summary ........................................................................................................84
Entrance and Exit Patterns of GPS-Tracked Bicyclists ....................................................................................85
Bicycle Stopping Behavior ...............................................................................................................................85
Time Spent in the Moose-Wilson Corridor ......................................................................................................87
7. Pedestrian Use Level ........................................................................................................................................88
Calibrations.......................................................................................................................................................88
Use Levels ........................................................................................................................................................89
8. Pedestrian Movement Patterns .........................................................................................................................96
GPS-Tracking Data Collection Summary ........................................................................................................96

PAGE 4 OF 128
Pedestrian Visitation Behavior .........................................................................................................................97
9. Parking Lot Accumulation and Overflow ......................................................................................................100
Total Weekday and Weekend Averages for Designated Parking Lots ...........................................................101
Maximum Use of Designated and Overflow Parking Areas: .........................................................................106
Local Use in Designated & Overflow Parking Areas .....................................................................................108
Parking Lot Use by Hours of the Day ............................................................................................................110
Additional Data Collection at LSR Preserve and Sawmill Ponds ..................................................................115
Additional Data Collection .....................................................................................................................................117
Wildlife Brigade .................................................................................................................................................117
Summary of Findings .............................................................................................................................................124
Acknowledgements ................................................................................................................................................126
Appendices .............................................................................................................................................................126
References ..............................................................................................................................................................127

PAGE 5 OF 128
EXECUTIVE SUMMARY
This report presents a summary of data from an interdisciplinary study designed to understand visitor
use levels, the types of visitors, and visitor impacts associated with use in the Moose-Wilson corridor.
This report includes a summary of descriptive findings from the Summer/Fall 2014 data collection
season. Limited data for September are reported here, but it should be noted that portions of the Moose-
Wilson corridor were closed to visitor use during September 2014 as a result of grizzly bear activity.
METHODOLOGY
The Summer/Fall 2014 data collection season consisted of six sampling periods developed from total
vehicle use differences observed in previous studies: June 2nd-15th, June 16th-30th, July, August 1st-15th, a
week in September (7th-14th), and a week in October (4th-12th). Whenever possible and appropriate,
data are summarized based on these six sampling periods in order to examine any changes or patterns
seen across the entire data collection season. Various field methodologies—some census-based and
some sampling-based—were used simultaneously in order to get a more complete understanding of
visitor use in the Moose-Wilson corridor. These methods included the use of vehicle tube counters,
calibrated trail counters, motion-activated cameras, global positioning system (GPS)-tracking of various
use types, vehicle traffic pattern analysis, and parking lot accumulation counts. Each method used is
described in detail in the body of this report.
SIGNIFICANT FINDINGS
OVERALL USE LEVELS
Results from each data collection technique are reported independently. When generalized across all
sampling periods, tube-counter results show the Moose-Wilson Road sees approximately 1,900 vehicles
per day during the summer months of June through August. Since bicycle use makes up, on average,
between 2%-4% of total use, approximately 60 bicycles use the Moose-Wilson Road per day. On
average there were 2.8 people per vehicle. Total use was calculated to about 5,300 people (# of vehicles
x avg. vehicle occupancy) entering the corridor each day averaged across all sampling periods. Side
roads, which include Death Canyon and the Laurance S. Rockefeller (LSR) Preserve Center, each see
approximately 200 vehicles per day and 500 vehicles per day, respectively, throughout the summer.

PAGE 6 OF 128
PEAK USE PERIODS
Although there was some variation based on sampling period, data from trail counters, vehicle tube
counters, and parking lot turnover counts all indicate that the first half of August (1st-15th) was the
busiest sampling period throughout the study. For the corridor as a whole, peak use generally occurs
between 11am and 2pm/3pm. In general, weekends appear to be slightly busier than weekdays.
VEHICLE USE LEVELS
Results from tube counters, turning movement and automatic traffic recording cameras, and parking lot
counts all suggest that peak use in the Moose-Wilson corridor occurs daily between 11am and 3pm,
depending on location. Results from the turning movement cameras placed at the intersection of Moose-
Wilson Road and Teton Park Road suggest that approximately 24% of traffic on Teton Park Road (from
either direction) turns onto the Moose-Wilson Road. Taxi use in the corridor appeared to be minimal,
making up just 0.4% of all license plates captured by the automatic license plate recognition (ALPR)
data collection.
VEHICLE MOVEMENT PATTERNS
In general, traffic levels were nearly equal in both directions at all counters with northbound traffic
being slightly higher on the Moose-Wilson Road. The most common movement pattern of vehicle travel
was northbound through the Moose-Wilson corridor. Northbound through traffic was most common in
the morning, making the north entrance the more used entrance of the Moose-Wilson Road. In the
afternoon southbound through traffic peaked, making the Granite Canyon entrance the more used end of
the Moose-Wilson Road. These patterns were driven by the increase in exits of the through traffic at
each end of the road adding to overall traffic at that end of the road.
VEHICLE PARKING PATTERNS
Of all vehicles asked to participate in the GPS-based tracking portion of the study, 73% accepted. The
most popular stopping area in the corridor was Sawmill Ponds Overlook, followed by the LSR Preserve
parking lot. More visitors (with at peak use periods, three times as many vehicles) park in the
“overflow” areas along the Death Canyon Road than park in the designated trailhead parking lot itself.
The period when parking lots were fullest was between 11:00am and 2:00pm. Although it was the most
popular stopping location, there was no discernable pattern of use at Sawmill Ponds. The LSR Preserve
parking lot appeared to be busiest at midday.

PAGE 7 OF 128
USER TYPES
On average, across all sampling periods, 11% of vehicles in the corridor were visitors with local (Teton
County – WY-22) license plates while the other 89% were considered non-local visitors (license plates
other than WY-22 or WY-22 rental vehicles). In parking areas, on average and across all sampling
periods, 24% of vehicles were local and 76% non-local. Overall the average percentage of local use in
designated parking lots varied widely by parking lot and sampling period. Death Canyon had fairly
consistent, high local use throughout the sampling periods compared to other parking areas.
TIME SPENT IN THE CORRIDOR
A large percentage of both bicycles (45%) and vehicles (36%) pass through the Moose-Wilson Corridor
without stopping at a destination. On average, both vehicles and bicycles spend less than one hour total
in the corridor. In many cases the total time in the corridor for vehicles is less than 30 minutes. For the
minority of vehicles that did stop within the Moose-Wilson Corridor, Sawmill Ponds and the LSR
Preserve (in that order) were the most popular stopping destinations.
GPS-tracking of vehicles indicates that the median duration time in the corridor is 28 minutes. For GPS-
tracked bicycles the median time spent in the Moose-Wilson corridor is 45 minutes. Visitors who leave
their cars and hike on trails spend on average 2 hours and 30 minutes recreating at their destination in
the Moose-Wilson Corridor.
BICYCLE USE LEVELS, PATTERNS AND TYPES
Of all bicyclists asked to participate in the GPS-based tracking portion of the study, 74% accepted.
Bicycle GPS tracking shows that 45% of bicyclists rode straight through the corridor without stopping,
with most riders travelling northbound. Results from turning movement and automatic traffic recording
cameras indicate that bicycles were between 2% and 3% of total use (depending on sampling period)
entering at the Granite Canyon entrance and less than 1% of total use entering from the Moose-Wilson
Road/Teton Park Road intersection. Like overall use, the highest level of bicycle use was observed
during the first sampling period in August (1st-15th). The majority of bicyclists that enter the Moose-
Wilson Road from the north end are doing so via the bike path. However, only 19% of bicyclists that use
the bike path enter the Moose-Wilson Road Corridor. The majority of bicyclists that exit the Moose-
Wilson Road at the north end exit and continue onto the bike path. Approximately half of those
bicyclists travel west towards Jenny Lake, and the other half head east towards the Snake River. The
most dominant type of bicyclist observed on both the Moose-Wilson Road, at the Teton Park Road and
Moose-Wilson Road intersection, the Snake River Bridge pathway, and at the Granite Canyon entrance
station was single-rider road cyclists.

PAGE 8 OF 128
PEDESTRIAN USE LEVELS, PATTERNS AND TYPES
Of all vehicles asked to participate in the GPS-based tracking portion of the study, 85% accepted. The
highest pedestrian use was found on LSR Preserve Lake Creek trail to the bridge, with the next highest
pedestrian use observed at the LSR Preserve parking lot footbridge. However, the LSR Preserve parking
lot footbridge counter was not calibrated during this study, and therefore use at this location is likely an
underestimate. The lowest level of visitor use was observed at the Huckleberry Point trail counter on the
west side of Phelps Lake. Overall, the busiest pedestrian sampling period was the first half of August
(August 1st-15th). In most cases visitor use levels were slightly higher on weekends.
The most popular pedestrian destination across all sampling periods was the Valley Trail section west of
Phelps Lake Overlook, followed by the eastern shore of Phelps Lake. Across all sampling periods, only
a few of the GPS-tracked visitors hiked to Open Canyon or accessed Teton Village via the Valley Trail.
Sawmill Ponds was a key stopping destination for vehicle use, but once at the Sawmill Ponds parking lot
visitors spent very little time there and rarely left the vicinity of the parking lot.
DIFFERENCES FROM KEY FINDINGS FROM SUMMER/FALL 2013 REPORT
In general, with only a couple of exceptions, the findings from the Summer/Fall of 2014 match the
findings from the Summer/Fall of 2013. Vehicle use in the first half of August dropped slightly between
2013 and 2014. However, when compared to data from 2006, use in the Moose-Wilson Road corridor is
continuing to increase. The percentage of vehicles and bicyclists traveling through the corridor without
stopping decreased in 2014. An increase in use at the Sawmill Ponds parking area and on the LSR
Preserve Road indicate that these may have been key stopping destinations during Summer/Fall 2014.
The remainder of this report contains basic methodology and detailed summaries of all findings from the
Summer/Fall 2014 data collection season. Several appendices are referenced throughout the document,
which contain supporting materials and maps to help illustrate the findings.

PAGE 9 OF 128
INTRODUCTION
This document is the technical report of findings from the Moose-Wilson Corridor Use Levels, Patterns
and Impacts in Grand Teton National Park 2014 data collection effort. All data was collected and
analyzed by Utah State University, with the exception of any trail counter and trail camera data, which
was collected by Grand Teton National Park (GRTE) and analyzed by Utah State University. This
document describes the methodologies used in the field and results from the 2014 data collection season,
which occurred from June 2 through October 31. A summary of salient data findings is provided.
The Moose-Wilson corridor (MWC) in the southwest corner of GRTE is an outstanding representation
of the park’s major natural ecological communities, all of which are located within a geographical area
that is about seven miles in length, five miles in width, and about 10,300 acres in size. These natural
communities include alpine, subalpine, forests, sagebrush flats, wet meadows and wetlands, lakes,
rivers, and ponds, and an associated diversity of fish and wildlife. The MWC is enclosed roughly by the
Teton Range to the west, the Snake River to the east, the community of Moose to the north, and the
park’s Granite Canyon entrance to the south.
The corridor contains several primary visitor use areas, including Death Canyon and Granite Canyon
trailhead parking areas, Laurance S. Rockefeller Preserve, White Grass Dude Ranch and Murie Ranch
historic districts, and Sawmill Ponds overlook. Other visitor use areas include Poker Flats horse trails
and the Snake River levee road. The Moose-Wilson Road is the primary access point to destinations
within the corridor and extends 7.1 miles northward from the terminus of Wyoming 390 at the Park’s
Granite Canyon entrance to Teton Park Road at Moose. The narrow, winding, partially gravel road
provides access to the south end of Grand Teton National Park and a rustic, slow driving experience for
visitors looking for exceptional scenery and wildlife viewing opportunities. Some residents and visitors
also use the road as an alternative route to the airport and other destinations within or beyond the park
during the summer months. With increasing vehicle traffic volumes, congestion along this narrow, rustic
country road has become common. This observation has raised concerns about the protection of wildlife
and other resources, visitor safety, visitor experience, and the effectiveness of park operations. The road
is open seasonally from approximately May 1 to October 31.
The goal of this project is to collect data about levels, types, patterns, and site-specific impacts of visitor
activities in the corridor. These data will inform the park’s planning process, which will assess the type
and level of visitor use that can be accommodated while sustaining the desired resource conditions and
visitor experience within the Moose-Wilson corridor. In that planning effort, the National Park Service
will use this and other information to develop and evaluate a range of alternatives that considers a
variety of management strategies within the corridor, aimed at achieving desired future conditions. The
alternatives will be developed and evaluated through a planning process that engages the public and
results in a long-term approach for corridor management.

PAGE 10 OF 128
Figure 1: Top photo of Poker Flats Ranch. Bottom photo, a least chipmunk along Death Canyon Road
(photos by Ashley D’Antonio).

PAGE 11 OF 128
STUDY AREA
The Moose-Wilson Road (Figure 2) extends 7.1 miles northward from the terminus of Wyoming 390 at
GRTE’s Granite Canyon entrance to the Teton Park Road at Moose. It contains the full extent of both
the Moose-Wilson and Death Canyon Roads. Data collection types categorize specific study site
locations. Both the extent of the project study area and the location of specific data collection activities
were developed in consultation with National Park Service (NPS) staff and were fully vetted in the data
collection plan (Monz, D’Antonio and Heaslip, 2014).
Figure 2: Data collection locations and needs for Moose-Wilson corridor study area (Summer/Fall 2014).

PAGE 12 OF 128
DATA COLLECTION NEEDS AND METHODS
SAMPLING PERIODS
Certain data collection approaches are more suitable for random sampling while other measures are
continuous throughout the study from June 2 through October 31. (Table 1 lists specific details and
locations of tasks). Periods of random sampling were selected to reflect seasonal variations in total use
of the corridor based on previous studies (McGowen et al., 2009). Note that all data collection activities
did not occur on all days in the sampling period, but results will be generalized to these periods as
appropriate. See Appendix A for full sampling schedule. With the exception of continuous counts (such
as those from vehicle tube counters and infrared trail counters), sampling intentionally did not occur on
holidays. September field sampling ended a few days early due to grizzly bear activity, which closed
portions of the Moose-Wilson Road.
Period 1: June 2-15 (12 random days during this period)
Period 2: June 16-30 (12 random days during this period)
Period 3: July 1-31 (24 random days during this period)
Period 4: August 1-15 (12 random days during this period)
Period 5: September 6-15 (7 random days, post Labor Day)
Period 6: October 4-12 (10 random days during this period)
DATA COLLECTION DETAILS
Table 1: Summary of all data collection, basic methodology and sampling approach for each data need, and data
collection-specific site locations.
Information Need Data Collection Approach
Time Frame Locations
1. Number of Vehicles on Roads
Directional tube counters (MetroCount) & Electromagnetic Counters (TRAFx)
Continuous counts until road closure
LSR Preserve Entrance Road
Death Canyon Road at Y with White Grass Access Road
On Moose-Wilson Road at:
Granite Canyon Entrance
Near Moose entrance (@ Teton Park Road (TPR) junction)
Adjacent to the Woodland Trail crossing
2. Vehicle Type Video Sampling (license plate recognition)
Stratified Random Sampling
Granite Canyon Entrance Near Moose entrance (@ Teton Park
Road (TPR) junction)
3. Vehicle Movement Patterns and Turning
GPS tracking Video Sampling
Stratified Random Sampling
Granite Canyon Entrance (ATR) Near Moose entrance (@TPR junction)

PAGE 13 OF 128
Movements Turning Patterns at LSR preserve and near Moose entrance (@ TPR junction)
4a. Number of Bicycles in MWC
Video Sampling Stratified Random Sampling
Granite Canyon Entrance Near Moose entrance (@TPR junction)
4b. Number of Bicycles Park Shared-Use Path
Automated counters Continuous East of Snake River Bridge @ Moose
5. Bicycle Use Types and Behavior
Video Sampling and Observation Motion Activated Camera (Pathway)
Stratified Random Sampling Stratified Random Sampling of Census Data (Pathway)
Granite Canyon Entrance and near Moose entrance (@ TPR junction)
Shared use pathway near Moose
6. Bicycle Movement Patterns
GPS Tracking Stratified Random Sampling
Granite Canyon Entrance Near Moose entrance (@ TPR junction)
7. Number of Pedestrians on Trails
Infrared trail counters (TRAFx and Diamond types)
Continuous 10 locations: Murie Ranch Trail (TRAFx) Sawmill Ponds Overlook Trail (TRAFx) Death Canyon Trailhead (TH)
(Diamond) LSR Preserve Parking Lot (Footbridge)
(TRAFx) LSR Preserve Trails (near waterfall)
(Diamond) LSR Preserve Lake Creek Trail MWR
crossing (Diamond) LSR Preserve Woodland Trail MWR
Crossing (Diamond) LSR Preserve East Lake Trail (Diamond) LSR Preserve West Lake Trail
(Diamond) Granite Canyon Trailhead (Diamond)
8. Pedestrian Movement Patterns and Use Densities
GPS Tracking Stratified Random Sampling
Granite Canyon TH LSR Preserve Death Canyon TH
9a. Parking Lot Accumulation
Observation Stratified Random Sampling
Granite Canyon TH LSR Preserve Death Canyon TH Sawmill Ponds/Overlook
9b. Overflow Parking Accumulation
Observation Stratified Random Sampling
Granite Canyon TH Death Canyon TH

PAGE 14 OF 128
Figure 3: Research sign used in Summer/Fall 2014 to inform visitors about the project (photo by Ashley D’Antonio).
DATA COLLECTION METHODOLOGY:
1. VEHICLE USE LEVELS
Number of vehicles on roads was recorded with MetroCount directional tube counters placed at each
end, at intermediate points along Moose-Wilson Road, and on side roads to Death Canyon trailhead and
the LSR Preserve (see Figure 2) (MetroCount, 2014; Xia and Arrowsmith, 2008). Data was collected 24
hours per day during the study period. Tube counters were provided and installed by Grand Teton
National Park, but the data download and data summary were managed by Utah State University.
MetroCount software was used to produce summary data that was then compiled by Utah State
University. The MetroCount counter on the LSR Preserve Road was downloaded by GRTE and
provided to Utah State University for summary.

PAGE 15 OF 128
2. VEHICLE TYPE
Video sampling was conducted with Miovision Scout cameras (Miovision, 2014; Xia and Arrowsmith,
2008). Turning movement counts and vehicle classifications (including bicycle counts) were conducted
at the intersection of the Moose-Wilson Road and the Teton Park Road, the intersection of the LSR
Preserve and the Moose-Wilson Road, and at the Granite Canyon entrance station. Video sampling used
a stratified random sample at select times during the study period to ensure a representative sample of
weekends, weekdays, and times of day. Data was analyzed using manual and automated video analysis
methods to report vehicles by type. Automatic license plate recognition (ALPR) cameras were placed at
each end of the Moose-Wilson Road, and four days of license plate data was collected during each
sampling period. ALPR data was analyzed to summarize commercial vehicle use in the Moose-Wilson
Corridor.
Figure 4: Field technician, Annie Weiler, downloading data from the tube counter on Death Canyon Road during
Summer 2013. The same tube counters were used during Summer/Fall 2014 (photo by Ashley D’Antonio).
3. VEHICLE MOVEMENT PATTERNS
Vehicle movement/use patterns were determined using GPS-based methodologies (D’Antonio et al.,
2010; Hallo et al., 2012). Garmin eTrex 100 units were deployed to a random sample of visitors in their
vehicles as they entered the corridor from either end of the road. Sampling was conducted using a
random sample, stratified by sampling period, to ensure representative samples of weekends, weekdays,
and times of day. A set number of GPS units were handed out randomly during each sampling hour to
ensure an even distribution of GPS units across the sampling day. Information about local versus non-
local vehicle and rental vehicle status was recorded. Due to limitations in the size of the research staff,

PAGE 16 OF 128
vehicle tracking did not occur on days when pedestrian tracking was occurring. Motorists returned the
GPS units upon leaving Moose-Wilson Road to field technicians or to drop boxes located at both road
exits. Erroneous data points were eliminated from the GPS data before analysis. GPS-tracking
methodology was combined with visitor surveys designed by Pennsylvania State University (PSU).
Results from this survey are not included in this report and will be in a separate PSU-authored report.
Turning patterns at the LSR Preserve and Teton Park Road intersections were determined by video data
collection using the Miovision Scout units (Miovision, 2014). ALPR recognition was used to determine
vehicle duration on the roadway.
Figure 5: Field technician, Dan Blair, intercepting a visitor at the Moose end of the Moose-Wilson Road in order to
retrieve a GPS unit and administer a survey (photo by Ashley D’Antonio).

PAGE 17 OF 128
4. BICYCLE USE LEVELS
MOOSE-WILSON ROAD METHOD
Video sampling was used to determine bicycle use numbers. Miovision Scout cameras were placed at
each end of Moose-Wilson Road, and sampling occurred using a stratified random approach throughout
the study period (Miovision, 2014). This ensured a representative sample of weekends, weekdays, and
times of day.
BIKE PATH METHOD
Automatic infrared counters were placed by GRTE on the bike path near Moose (Pettebone et al., 2010;
TRAFx, 2014; Xia and Arrowsmith, 2008). These automatic counters ran continuously throughout the
study period. A random sample of this census data, stratified by sampling period, was used to calibrate
the counters using observational techniques in order to determine bicycle use type (see data collection
method #5 below) and counter error. Calibrations were also used to distinguish estimates of bicycle use
from pedestrian use and bicycle group size.
5. BICYCLE USE TYPE AND BEHAVIOR
MOOSE-WILSON ROAD METHOD
Video sampling, with Miovision Scout cameras (Figure 7) placed at each end of Moose-Wilson Road,
was conducted to determine bicycle use type. Video sampling was conducted using a stratified random
sample throughout the study period while ensuring a representative sample of weekends, weekdays, and
times of day. A subsample of the ATR video was manually analyzed to determine bicycle use types.
BIKE PATH METHOD
In order to understand how bike path users interacted with the Moose-Wilson Road, observational
techniques were used at the Teton Park Road and Moose-Wilson Road intersection (Figure 7). A field
technician was positioned at the intersection to make note of the behavior of all visitors using the bike
path at this intersection. User group information was also recorded.

PAGE 18 OF 128
Figure 6: Field technician, Annie Weiler, setting up a Miovision Scout camera at the Teton Park Road/Moose-Wilson
Road intersection (photo by Ashley D’Antonio).
Figure 7: View of Moose-Wilson Road and Teton Park Road intersection in Moose, WY (photo from Miovision
turning movement camera).

PAGE 19 OF 128
6. BICYCLE MOVEMENT PATTERNS
Bicycle use patterns were assessed using GPS-based methodologies (D’Antonio et al., 2010; Hallo et al.,
2012). Unlike with vehicle and pedestrian tracking, a census of bicycle use in the Moose-Wilson
corridor was attempted. Garmin eTrex 100 GPS units were handed out to all visitors on bicycles who
were willing to participate in the study as they approached the corridor access points during vehicle
sampling periods. Sampling was conducted using a stratified random sample to ensure a representative
sample of weekends, weekdays, and times of day. Information about type of user and number in the
cycling group was recorded. Bicyclists returned the GPS units upon leaving Moose-Wilson Road to field
technicians or to a drop box which was located at both road exits. GPS tracks were cleaned of erroneous
points before data analysis. GPS-tracking methodology was combined with visitor surveys designed by
Pennsylvania State University (PSU). Results from this survey are not included in this report and will be
in a separate PSU-authored report.
7. PEDESTRIAN USE LEVEL
Visitor use counts were collected using trail counters. Trail counters (both Diamond brand and TRAFx
counters) were already in place at trailheads and at important trail junctions (Table 1) and provided by
GRTE (Diamond Traffic Products, 2014; TRAFx, 2014; Xia and Arrowsmith, 2008). Trail counters
(Figure 8) collected data continuously throughout the study period. Data was aggregated into hourly
bins. Utah State University (USU) field technicians calibrated the counters in hourly periods, randomly,
throughout the sampling periods (Pettebone et al., 2010). These observational calibration techniques
were used to determine counter error. GRTE staff downloaded the trail counter data, and the raw data
was delivered to USU for analysis.
Figure 8: TRAFx counter (on the back of the sign post) located on the LSR Preserve footbridge near the LSR
Preserve parking lot (photo by Ashley D’Antonio).

PAGE 20 OF 128
8. PEDESTRIAN MOVEMENT PATTERNS
Pedestrian use patterns were examined using GPS-based methodologies (D’Antonio et al., 2010; Hallo
et al., 2012). Garmin eTrex 100 GPS units were handed out to a random selection of day-use visitors at
Granite Canyon Trailhead, Death Canyon Trailhead, and the LSR Preserve (past the Preserve Center
where the Woodland and Lake Creek Trails split) when the visitors started their hike. Sampling was
conducted using a stratified random sample to ensure representative sample of weekends, weekdays, and
times of day. Due to limitations in research staff size, visitor GPS-tracking did not occur on days when
vehicle GPS-tracking occurred. Pedestrians returned the GPS units upon leaving the trail system they
were hiking on to research technicians or to drop boxes that were located at both road exits (same drop
box for vehicle GPS-tracking). GPS tracks were cleaned of erroneous points before data analysis. GPS-
tracking methodology was combined with visitor surveys designed by Pennsylvania State University
(PSU). Results from this survey are not included in this report and will be in a separate PSU-authored
report.
9. PARKING ACCUMULATION AND OVERFLOW
Data on level of use in key parking lots within the Moose-Wilson corridor were collected in accord with
similar studies (Lawson et al., 2003). Designated parking lots are parking areas that were designated,
installed, and maintained by GRTE. Overflow or visitor-created parking areas are locations where
visitors are parked anywhere outside of this designated area. Resource condition summaries for informal
and overflow parking areas are presented in the Summer/Fall 2013 report (Monz et al., 2014). Data
collection protocols and instruments were designed to be similar to the current parking lot data
collection occurring at the LSR Preserve so that comparisons can be made among all designated parking
lots within the corridor. Parking lot data at the LSR Preserve designated parking lot was collected by the
park and delivered to Utah State University for inclusion in this report. An hourly count of number of
parked vehicles, number of local vehicles, number of bicycles present, and number of any overflow
parking was collected at all designated parking areas along the Moose-Wilson Road corridor. At some
designated parking lots, additional information was collected (see list below). Sampling days were
determined using a stratified random sample to ensure a representative sample of weekdays, weekends,
and times of day. The location and condition of maintenance features (fences, parking logs, etc.) at
designated parking was recorded with a sub-meter Trimble XT GPS and described.
Designated Parking Lots Additional Data Collection:
● Granite Canyon Trailhead (photographs of the parking area and overflow parking when full)
● Death Canyon Trailhead (photographs of the parking area and overflow parking when full)
● Sawmill Ponds/Overlook Parking Area (documentation of visitor behavior was also recorded)

PAGE 21 OF 128
ADDITONAL DATA COLLECTION
WILDLIFE BRIGADE
In order to be able to relate vehicle movement and stopping patterns with the presence of wildlife jams,
the GRTE Wildlife Brigade and LSR Preserve staff collected additional information as part of the
project. The Wildlife Brigade is a crew of volunteers who help to manage human-wildlife interactions in
GRTE; one of their main purposes is to manage crowds and vehicles at wildlife jams. USU provided the
Wildlife Brigade and LSR Preserve staff (who also assisted with wildlife jams) with Trimble GPS units.
At all wildlife jams in the Moose-Wilson Road corridor, the Wildlife Brigade or the LSR Preserve staff
carried the GPS unit while working at the jam and also entered a few basic pieces of data for each jam
into the GPS unit (including the type of animal, duration of jam, and visual estimation of the max
number of vehicles in the jam).
RESULTS
1. VEHICLE USE LEVELS
Tube counters (Figure 1.1) were deployed by GRTE at the beginning of June and removed before the
first snowfall at the end of October. Utah State University maintained the tube counters and analyzed all
data.
Figure 1.1: Tube counter used to determine vehicle use levels on the Death Canyon Road (photo by Ashley
D’Antonio).

PAGE 22 OF 128
PEAK HOUR FOR VEHICLE USE
The most frequent peak hour for each tube counter was determined using MetroCount software
summaries (Tables 1.1-1.5). At some count locations, for some sampling periods, the peak hour varied
each day. For these sampling periods, multiple peak hours are listed. For the northern-most tube counter,
near Sawmill Ponds, the most frequent peak hour for weekdays varied mostly between the 3:00pm and
the 6:00pm hours with the 5:00pm hour being most common (Table 1.1). At Sawmill Ponds during the
June 1st-15th sampling period, the 9:00am hour was the weekday peak hour. On weekends the peak hour
varied widely across sampling periods, especially during the June sampling periods at Sawmill Ponds.
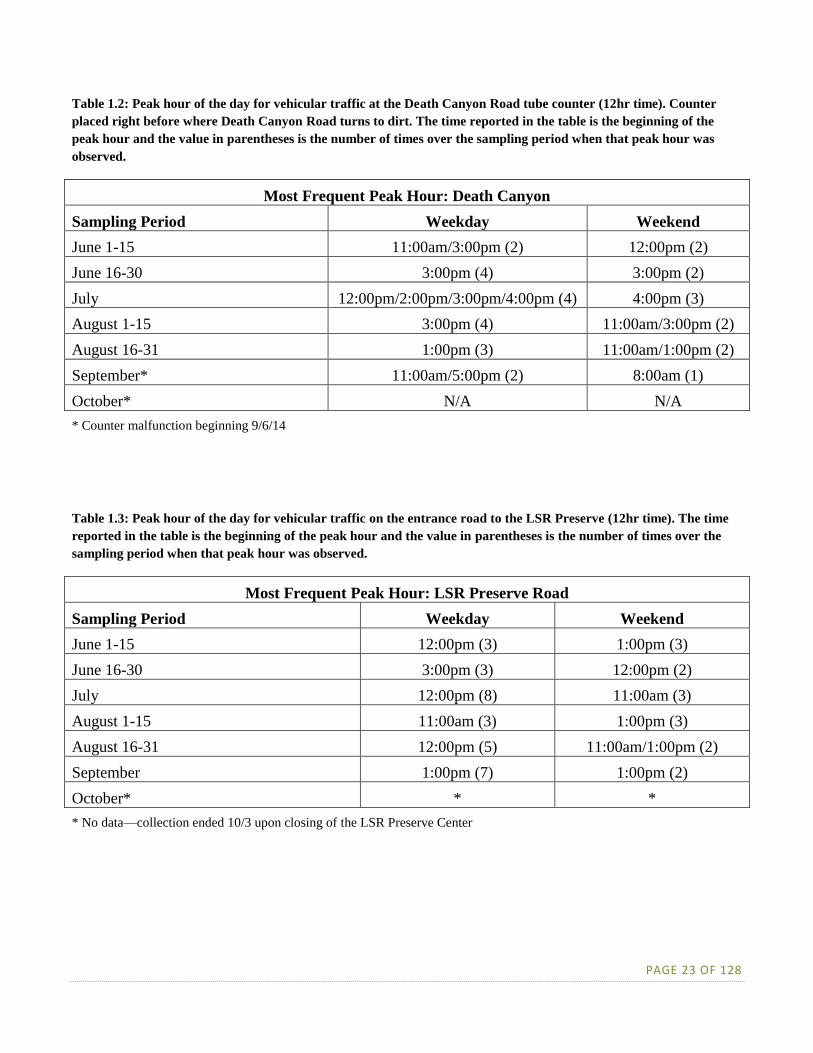
On Death Canyon Road the peak hour of use was most often the 3:00pm hour; this was true across all
sampling periods (Table 1.2). The weekend day most frequent peak hour at Death Canyon ranged
between the 4:00pm hour and the 5:00pm hour.
On the entrance road to the LSR Preserve, weekday peak hour was most often at 12:00pm, and on
weekend days peak hour was most often during the 1:00pm hour (Table 1.3). At the counter placed near
where the Woodland Trail crosses the Moose-Wilson Road, the peak hour for use on the road on
weekdays and weekends was during the 11:00am hour (Table 1.4). For the tube counter near Poker
Flats, the most southern tube counter, the 4:00pm and the 5:00pm hours were the most frequently
observed weekday peak hours throughout all summer sampling periods (Table 1.5). At Poker Flats, on
weekend days, the most frequently observed peak hour was the 4:00pm hour.
Table 1.1: Peak hour of the day for vehicular traffic at the tube counter on Moose-Wilson Road just north of Sawmill
Ponds Overlook. The time reported in the table is the beginning of the peak hour and the value in parentheses is the
number of times over the sampling period when that peak hour was observed.
Most Frequent Peak Hour: Sawmill
Sampling Period Weekday Weekend
June 1-15 9:00am (5) 9:00am/10:00am/11:00am/1:00pm/4:00pm (1)
June 16-30 5:00pm (3) 11:00am/12:00pm/3:00pm/4:00pm (1)
July 4:00pm/5:00pm (5) 12:00pm/4:00pm (3)
August 1-15 3:00pm/4:00pm (3) 3:00pm (2)
August 16-31 4:00pm/5:00pm (3) 4:00pm (3)
September 5:00pm (6) 5:00pm (4)
October 5:00pm/6:00pm (5) 11:00am (3)
PAGE 23 OF 128
Table 1.2: Peak hour of the day for vehicular traffic at the Death Canyon Road tube counter (12hr time). Counter
placed right before where Death Canyon Road turns to dirt. The time reported in the table is the beginning of the
peak hour and the value in parentheses is the number of times over the sampling period when that peak hour was
observed.
Most Frequent Peak Hour: Death Canyon
Sampling Period Weekday Weekend
June 1-15 11:00am/3:00pm (2) 12:00pm (2)
June 16-30 3:00pm (4) 3:00pm (2)
July 12:00pm/2:00pm/3:00pm/4:00pm (4) 4:00pm (3)
August 1-15 3:00pm (4) 11:00am/3:00pm (2)
August 16-31 1:00pm (3) 11:00am/1:00pm (2)
September* 11:00am/5:00pm (2) 8:00am (1)
October* N/A N/A
* Counter malfunction beginning 9/6/14
Table 1.3: Peak hour of the day for vehicular traffic on the entrance road to the LSR Preserve (12hr time). The time
reported in the table is the beginning of the peak hour and the value in parentheses is the number of times over the
sampling period when that peak hour was observed.
Most Frequent Peak Hour: LSR Preserve Road
Sampling Period Weekday Weekend
June 1-15 12:00pm (3) 1:00pm (3)
June 16-30 3:00pm (3) 12:00pm (2)
July 12:00pm (8) 11:00am (3)
August 1-15 11:00am (3) 1:00pm (3)
August 16-31 12:00pm (5) 11:00am/1:00pm (2)
September 1:00pm (7) 1:00pm (2)
October* * *
* No data—collection ended 10/3 upon closing of the LSR Preserve Center

PAGE 24 OF 128
Table 1.4: Peak hour of the day for vehicular traffic at the Woodland road counter (12hr time). Counter placed on the
Moose-Wilson Road near where the Woodland trail crosses the Moose-Wilson Road. The time reported in the table is
the beginning of the peak hour and the value in parentheses is the number of times over the sampling period when
that peak hour was observed.
Most Frequent Peak Hour: Woodland
Sampling Period Weekday Weekend
June 1-15 5:00pm (5) 3:00pm (3)
June 16-30 5:00pm (5) 11:00am (2)
July 4:00pm (5) 2:00pm/4:00pm (2)
August 1-15 11:00am/1:00pm (3) 11:00am (3)
August 16-31 11:00am (8) 11:00am/12:00pm (2)
September* 11:00am (6) 12:00pm (2)
October* * *
* Counter malfunction beginning 9/14
Table 1.5: Peak hour of the day for vehicular traffic near the Poker Flats parking lot (12hr time). Counter placed on
Moose-Wilson Road just north of Poker Flats parking area. The time reported in the table is the beginning of the
peak hour and the value in parentheses is the number of times over the sampling period when that peak hour was
observed.
Most Frequent Peak Hour: Poker Flats
Sampling Period Weekday Weekend
June 1-15 5:00pm (4) 3:00pm (3)
June 16-30 5:00pm (6) 4:00pm (2)
July 5:00pm (8) 4:00pm (3)
August 1-15 4:00pm/5:00pm (3) 4:00pm (3)
August 16-31 4:00pm (5) 12:00pm (3)
September 12:00pm (7) 11:00am (4)
October 4:00pm (6) 12:00pm/4:00pm (2)
AVERAGE AND TOTAL VEHICLE COUNTS

PAGE 25 OF 128
Use at the tube counter just north of Sawmill Ponds ranged from an average of 629 vehicles per day in
early June to 2,394 vehicles per day during the August 1st-15th sampling period (Table 1.6 and Figure
1.2). At Death Canyon Road, average vehicle use per day varied between 170 vehicles in early June to
281 vehicles per day during the August 1st-15th sampling period (Table 1.6 and Figure 1.3). Average
daily use at the entrance road into the LSR Preserve varied between about 400 and 600 vehicles per day
during the sampling periods. The lowest level of use at the LSR Preserve was observed during
September with approximately 398 vehicles per day (Table 1.6 and Figure 1.4). Highest use on the
entrance road to the LSR Preserve was observed during the August 1st-15th sampling period with 580
vehicles per day on average. The June 16th-30th sampling period had the highest average vehicles per day
for the Woodland tube counter (1,909 vehicles/day). The tube counter just north of Poker Flats recorded
peak use during the August 1st-15th sampling period (2,185 vehicles/day) and lowest average use during
October (511 vehicles/day) (Table 1.6 and Figures 1.5 and 1.6).
Table 1.6: Average number of vehicles per day (± 1 standard deviation) at each tube counter location in the Moose-
Wilson corridor reported by sampling period. Outliers that may be present on figures were removed before
calculating these averages.
Sampling Period Sawmill Ponds Death
Canyon
LSR
Preserve+ Woodland Poker Flats
June 1-15 265*
(± 186)
170
(± 41)
436
(± 54)
1451
(± 225)
1413
(± 227)
June 16-30 2148
(± 136)
218
(± 40)
533
(± 56)
1909
(± 159)
1851
(± 172)
July 2236
(± 380)
269
(± 53)
548
(± 70)
2119
(± 262)
2006
(± 555)
August 1-15 2394
(± 175)
281
(± 59)
580
(± 40)
1817
(± 293)
2185
(± 214)
August 16-31 1920
(± 281)
213
(± 60)
481
(± 60)
1254
(± 227)
1674
(± 294)
September** 1035
(± 834)
205
(± 44)***
393
(± 169)
862
(± 467)****
1037
(± 464)
October 629
(± 348) NA NA NA
511
(± 252) *Counter malfunction resulting in days with missing data
**Road closed due to bear activity in the corridor starting 9/10 through 9/19
***Counter malfunction after 9/5/14.
****No Data after 9/14/15 due to counter malfunction.
+No Data for October due to closure of LSR Preserve Center

PAGE 26 OF 128
Figure 1.2: Daily vehicle counts across the study period for the tube counter placed just north of Sawmill Ponds. Low
values observed in September were due to road closure as a result of grizzly bear activity.
Figure 1.3: Daily vehicle counts across the study period for the tube counter placed just before the beginning of the
dirt section of Death Canyon Road. No data for most of September and October due to counter malfunction.

PAGE 27 OF 128
Figure 1.4: Daily vehicle counts across the study period for the tube counter placed on the LSR Preserve Road
Entrance Road. GRTE only provided data through the end of September.
Figure 1.5: Daily vehicle counts across the study period for the tube counter placed on the Moose-Wilson Road near
where the Woodland Trail crosses the road. No data after September 14th due to counter malfunction.

PAGE 28 OF 128
Figure 1.6: Daily vehicle counts across the study period for the tube counter placed on the Moose-Wilson Road just
north of the Poker Flats horse parking area.
DIRECTIONAL TRAFFIC FLOW
Figures of daily directional flow for each individual counter along the Moose-Wilson and Death Canyon
Roads for each sampling period can be found in Appendix B. Presented here are average hourly vehicle
counts by direction (northbound and southbound) for all tube counters placed in the Moose-Wilson
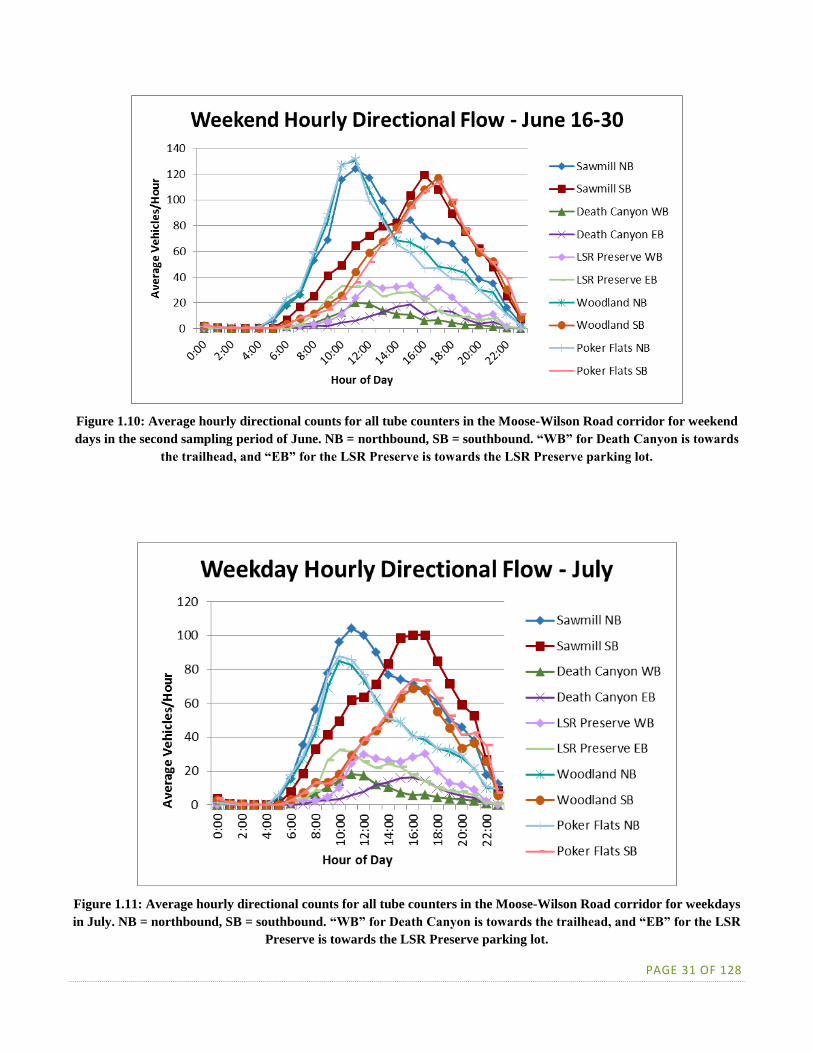
corridor (Figures 1.7 through 1.20). Across all sampling periods and both weekends and weekdays, on
average northbound traffic on the Moose-Wilson Road was at its highest between approximately 8:00am
and 10:00am, at which point northbound traffic levels began to decrease and southbound traffic began to
increase. On average, southbound traffic levels were at their highest levels between 2:00pm and 4:00pm
with use beginning to drop more dramatically at around 6:00pm. Average traffic to and from the LSR
Preserve and up and down Death Canyon Road roughly mimicked that of the traffic on the Moose-
Wilson Road, with traffic to these destinations peaking between 8:00am and 10:00am and traffic leaving
these destinations peaking between 2:00pm and 6:00pm. The peaks at the LSR Preserve and Death
Canyon Road were less dramatic than those peaks observed on the Moose-Wilson Road counter, and
both counters had more even directional use during midday (10:00am-2:00pm).
Data from the tube counters placed on Moose-Wilson, LSR Preserve, and Death Canyon Roads were
also separated by northbound and southbound (or eastbound and westbound in the case of the LSR
Preserve and Death Canyon Roads) traffic for weekdays and weekend days across all sampling periods.
In general, traffic levels were nearly equal in both directions at all counters during all sampling periods
with just slightly more northbound traffic than southbound traffic (see Appendix B). Rarely was
southbound traffic flow higher than northbound traffic flow. The most drastic example of southbound
traffic being greater than northbound traffic was observed at the Woodland counter during the August

PAGE 29 OF 128
15th-31st sampling period. Although Death Canyon is a “dead-end” road, data from the tube counter
indicates that for many days in the sampling periods, westbound (towards the trailhead) traffic levels
were much greater than eastbound traffic levels (see Appendix B). Given the nature of Death Canyon
Road being a dead-end, these results seem unlikely. The tube counters used in this study are designed to
work on pavement; the Death Canyon Road tube counter had to be placed on a narrow road where the
pavement met the dirt section of Death Canyon Road. The placement of the Death Canyon tube counter
on the edge of the pavement may have resulted in some counter error, including the counter
malfunctions that occurred in September and October. Therefore, while total counts from Death Canyon
appear to be accurate, directional flow results may be less accurate when compared to tube counters
placed on Moose-Wilson Road. Traffic on the LSR Preserve Entrance Road was also approximately
equal each direction with westbound traffic (leaving the LSR Preserve) being slightly higher during
most sampling periods. Like the Death Canyon Road, the LSR Preserve Entrance Road is a “dead-end”
road, and any large discrepancies between west- and eastbound traffic is likely due to counter error.
Figure 1.7: Average hourly directional counts for all tube counters in the Moose-Wilson Road corridor for weekdays
in the first sampling period of June. NB = northbound, SB = southbound. “WB” for Death Canyon is towards the
trailhead, and “EB” for the LSR Preserve is towards the LSR Preserve parking lot.

PAGE 30 OF 128
Figure 1.8: Average hourly directional counts for all tube counters in the Moose-Wilson Road corridor for weekend
days in the first sampling period of June. NB = northbound, SB = southbound. “WB” for Death Canyon is towards the
trailhead, and “EB” for the LSR Preserve is towards the LSR Preserve parking lot.
Figure 1.9: Average hourly directional counts for all tube counters in the Moose-Wilson Road corridor for weekdays
in the second sampling period of June. NB = northbound, SB = southbound. “WB” for Death Canyon is towards the
trailhead, and “EB” for the LSR Preserve is towards the LSR Preserve parking lot.
PAGE 31 OF 128
Figure 1.10: Average hourly directional counts for all tube counters in the Moose-Wilson Road corridor for weekend
days in the second sampling period of June. NB = northbound, SB = southbound. “WB” for Death Canyon is towards
the trailhead, and “EB” for the LSR Preserve is towards the LSR Preserve parking lot.
Figure 1.11: Average hourly directional counts for all tube counters in the Moose-Wilson Road corridor for weekdays
in July. NB = northbound, SB = southbound. “WB” for Death Canyon is towards the trailhead, and “EB” for the LSR
Preserve is towards the LSR Preserve parking lot.

PAGE 32 OF 128
Figure 1.12: Average hourly directional counts for all tube counters in the Moose-Wilson Road corridor for weekends
in July. NB = northbound, SB = southbound. “WB” for Death Canyon is towards the trailhead, and “EB” for the LSR
Preserve is towards the LSR Preserve parking lot.
Figure 1.13: Average hourly directional counts for all tube counters in the Moose-Wilson Road corridor for weekdays
in the first sampling period of August. NB = northbound, SB = southbound. “WB” for Death Canyon is towards the
trailhead, and “EB” for the LSR Preserve is towards the LSR Preserve parking lot.

PAGE 33 OF 128
Figure 1.14: Average hourly directional counts for all tube counters in the Moose-Wilson Road corridor for weekends
in the first sampling period of August. NB = northbound, SB = southbound. “WB” for Death Canyon is towards the
trailhead, and “EB” for the LSR Preserve is towards the LSR Preserve parking lot.
Figure 1.15: Average hourly directional counts for all tube counters in the Moose-Wilson Road corridor for weekdays
in the second sampling period of August. NB = northbound, SB = southbound. “WB” for Death Canyon is towards the
trailhead, and “EB” for the LSR Preserve is towards the LSR Preserve parking lot.

PAGE 34 OF 128
Figure 1.16: Average hourly directional counts for all tube counters in the Moose-Wilson Road corridor for weekends
in the second sampling period of August. NB = northbound, SB = southbound. “WB” for Death Canyon is towards the
trailhead, and “EB” for the LSR Preserve is towards the LSR Preserve parking lot.
Figure 1.17: Average hourly directional counts for all tube counters in the Moose-Wilson Road corridor for weekdays
in September. NB = northbound, SB = southbound. “WB” for Death Canyon is towards the trailhead, and “EB” for
the LSR Preserve is towards the LSR Preserve parking lot.

PAGE 35 OF 128
Figure 1.18: Average hourly directional counts for all tube counters in the Moose-Wilson Road corridor for weekends
in September. NB = northbound, SB = southbound. “WB” for Death Canyon is towards the trailhead, and “EB” for
the LSR Preserve is towards the LSR Preserve parking lot.
Figure 1.19: Average hourly directional counts for all tube counters in the Moose-Wilson Road corridor for weekdays
in October. NB = northbound, SB = southbound. “WB” for Death Canyon is towards the trailhead, and “EB” for the
LSR Preserve is towards the LSR Preserve parking lot.

PAGE 36 OF 128
Figure 1.20: Average hourly directional counts for all tube counters in the Moose-Wilson Road corridor for weekends
in October. NB = northbound, SB = southbound. “WB” for Death Canyon is towards the trailhead. The LSR Preserve
Road did not have October data.
VEHICLE USE LEVEL CHANGES OVER TIME
Historical average vehicle use levels on the Moose-Wilson Road corridor were pulled from the Moose-
Wilson corridor Adaptive Management Plan (McGowen et al., 2009). These values, from 2006 through
2008, were then compared to average daily vehicle use levels from similar locations on the Moose-
Wilson Road from the summer of 2013 and summer 2014 sampling periods (Table 1.7). This
comparison indicates that average use on the Moose-Wilson Road has increased over time for all
sampling periods. There was a slight drop in visitor use between 2013 and 2014 (Table 1.8), but the
overall trend indicates increasing use on the Moose-Wilson Road since 2006 (Figure 1.21).

PAGE 37 OF 128
Table 1.7: Percent change of average daily vehicle use levels on the Moose-Wilson Road over time.
Average Daily Vehicle Use Counts* Percent Increase
Month 2006 2007 2008 2013 2014 2006 to 2013
2006 to 2014
June
1,17
5
1,31
1
1,38
1 N/A
1,754 N/A
49%
July 1,668 1,740 1,870 2,094 2,120 26% 27%
August 1,616 1,695 1,170 2,102 1,875 30% 16%
September 1,110 1,267 1,355 1,772 978** 59% N/A
*Data in 2006, 2007, and 2008 from counters 1, 4, and 5 in McGowen et al. (2009). Data collected in 2013 at similar
locations (Sawmill Ponds, Woodland, and Poker Flats).
**Road closure during September due to grizzly bear activity & counter malfunction resulted in lower than expected average.
Figure 1.21: Average daily vehicle use levels on the Moose-Wilson Road over time. Historical data from McGowen et
al., 2009. June data was not collected in 2013. Multiple road closures in September 2014 due to grizzly bear activity
resulted in September data not being included in the comparison.
0
500
1,000
1,500
2,000
2,500
June July August September
Num
ber
of
Veh
icle
s
Average Daily Use Levels by Month
2006
2007
2008
2013
2014

PAGE 38 OF 128
Table 1.8: Percent change of average daily vehicle use levels on the Moose-Wilson Road between years over time.
Percentage Change in Daily Vehicle Use Level by Year
Month 2006-2007 2007-2008 2008-2013 2013-2014
June 12% 5% N/A N/A
July 4% 7% 12% 1%
August 5% -31% 80% -11%
September 14% 7% 31% N/A
2. VEHICLE TYPE
There were two turning movement count (TMC) locations and one automatic traffic recording (ATR) for
volume count location. The two TMC locations were at the intersection of Moose-Wilson Road and
Teton Park Road and the intersection of Moose-Wilson Road and the LSR Preserve entrance. The
volume count was located near the entrance to Granite Canyon and was installed during the same
periods as the TMC. Over the five-month study period, eighteen days were designated for TMC and
ATR data collection, resulting in three days per sampling period (Table 2.1). For the TMC and ATR
studies, a minimum of 12 hours of data was set to be collected for each location.
Table 2.1: Summary of TMC and ATR data collection days.
Sampling Period TMC & ATR Data Collection Days
June 1-15 7, 8, 9
June 16-30 20, 21, 22
July 18, 19, 20
August 1-15 2, 3, 4
September 12, 13, 14
October 4, 5, 6

PAGE 39 OF 128
Figure 2.1: Photo taken with turning movement camera placed at the intersection of the Moose-Wilson Road with the
LSR Preserve Road.
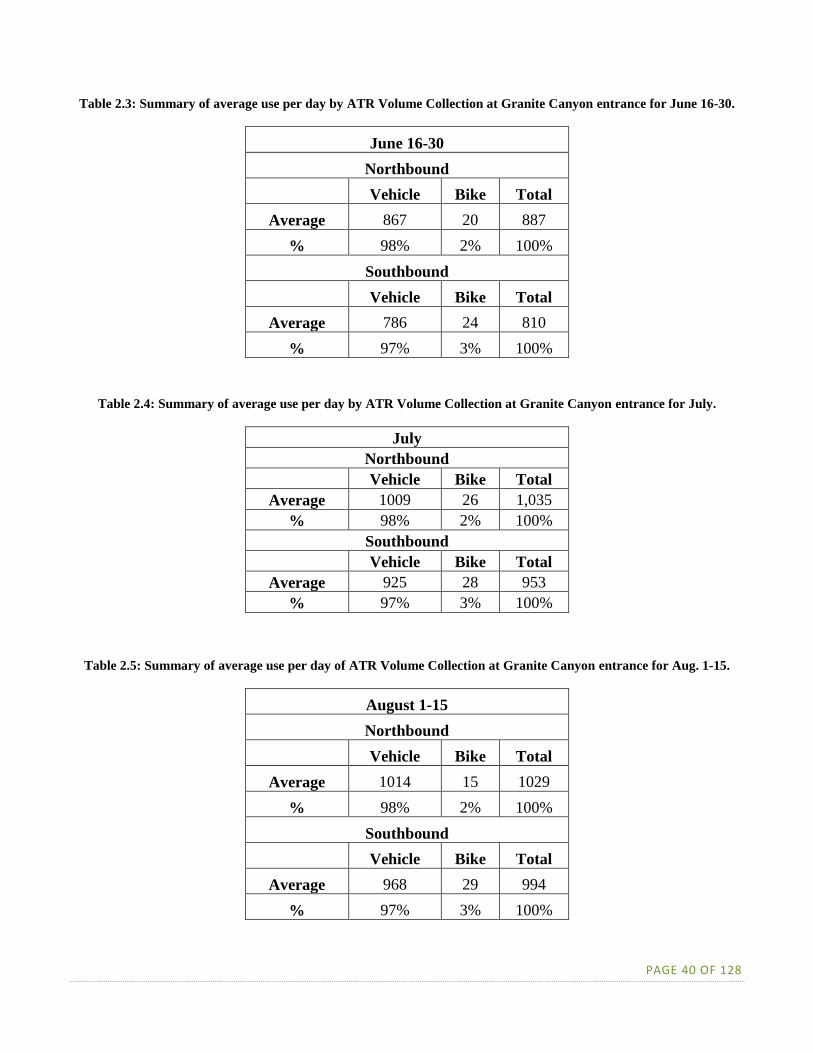
AUTOMATIC TRAFFIC RECORDING
The ATR was conducted north of the Granite Canyon entrance, capturing only northbound and
southbound volumes (Tables 2.2-2.7). The following tables summarize the ATR collected for the
Granite Canyon entrance. Cars include all forms of motorized vehicles. Across all of the sampling
periods, the majority of use, both northbound and southbound, at Granite Canyon entrance was from
vehicles. Bicycles typically accounted for 2% of northbound traffic and 2% to 4% of southbound traffic.
(Tables 2.2-2.7).
Table 2.2: Summary of average use per day by ATR Volume Collection at Granite Canyon entrance for June 1-15.
June 1-15
Northbound
Vehicle Bike Total
Average 689 18 707
% 98% 2% 100%
Southbound
Vehicle Bike Total
Average 591 23 614
% 96% 4% 100%
PAGE 40 OF 128
Table 2.3: Summary of average use per day by ATR Volume Collection at Granite Canyon entrance for June 16-30.
June 16-30
Northbound
Vehicle Bike Total
Average 867 20 887
% 98% 2% 100%
Southbound
Vehicle Bike Total
Average 786 24 810
% 97% 3% 100%
Table 2.4: Summary of average use per day by ATR Volume Collection at Granite Canyon entrance for July.
July
Northbound
Vehicle Bike Total
Average 1009 26 1,035
% 98% 2% 100%
Southbound
Vehicle Bike Total
Average 925 28 953
% 97% 3% 100%
Table 2.5: Summary of average use per day of ATR Volume Collection at Granite Canyon entrance for Aug. 1-15.
August 1-15
Northbound
Vehicle Bike Total
Average 1014 15 1029
% 98% 2% 100%
Southbound
Vehicle Bike Total
Average 968 29 994
% 97% 3% 100%

PAGE 41 OF 128
Table 2.6: Summary of average use per day by ATR Volume Collection at Granite Canyon entrance for September.
September
Northbound
Vehicle Bike Total
Average 405 10 415
% 98% 2% 100%
Southbound
Vehicle Bike Total
Average 395 11 406
% 97% 3% 100%
Table 2.7: Summary of average use per day by ATR Volume Collection at Granite Canyon entrance for October.
October
Northbound
Vehicle Bike Total
Average 429 12 441
% 98% 2% 100%
Southbound
Vehicle Bike Total
Average 407 11 418
% 98% 3% 100%

PAGE 42 OF 128
ANALYSIS OF VEHICLE TURNING MOVEMENT
The first TMC peak-hour data presented is the intersection of Teton Park Road and Moose-Wilson
Road, which is a four-leg un-signalized intersection with stop signs on the northbound and southbound
directions. Moose-Wilson Road is a two-way road with two lanes at the approach of the intersection,
while Teton Park Road is a three-lane road with a left turn lane on each eastbound and westbound
direction.
Figures 2.3 through 2.9 illustrate the complete volume by study dates. Turning movements at this
intersection did not vary much by sampling period. Of total average vehicle movement in the
intersection, 60% of the traffic was eastbound and westbound “thru” movements on Teton Park Road.
Of vehicles just traveling on the Teton Park Road, 76% drove straight through the intersection. Of the
traffic turning onto the Moose-Wilson Road at the Teton Park Road intersection: on average 52%
entered westbound, 43% entered eastbound, and 5% entered southbound. On average, 55% of the traffic
northbound on Moose-Wilson Road made a right turn towards the visitor center and 38% made a left
turn towards Jackson Lake.
Figure 2.2: View of the Moose-Wilson Road and Teton Park Road intersection from the TMC camera.

PAGE 43 OF 128
Figure 2.3: Total TMC Movement at Moose-Wilson Road and Teton Park Road for June 1-15. HQ = Park
Headquarters.
Figure 2.4: Total TMC Movement at Moose-Wilson Road and Teton Park Road for June 16-30. HQ = Park
Headquarters.
HQ
385 93 524 3
38% 9% 52% 0%
Teton Park Rd Teton Park Rd
to Jackson Lake to US89
1 0% 9% 531
303 5% 69% 3884
4372 79% 21% 1187
872 16% 0% 11
0% 40% 9% 51%
7 941 209 1204
Moose-Wilson
HQ
340 122 529 0
34% 12% 53% 0%
Teton Park Rd Teton Park Rd
to Jackson Lake to US89
4 0% 8% 535
301 5% 69% 4661
5121 77% 23% 1524
1206 18% 0% 19
0% 39% 6% 55%
3 1181 188 1692
Moose-Wilson

PAGE 44 OF 128
Figure 2.5: Total TMC Movement at Moose-Wilson Road and Teton Park Road for July. HQ = Park Headquarters.
Figure 2.6: Total TMC Movement at Moose-Wilson Road and Teton Park Road for Aug 1-15. HQ = Park
Headquarters.
HQ
386 159 502 0
37% 15% 48% 0%
Teton Park Rd Teton Park Rd
to Jackson Lake to US89
4 0% 8% 620
299 4% 72% 5889
6820 80% 20% 1667
1373 16% 0% 12
0% 44% 6% 51%
2 1479 188 1716
Moose-Wilson
HQ
480 141 564 0
41% 12% 48% 0%
Teton Park Rd Teton Park Rd
to Jackson Lake to US89
2 0% 8% 634
420 5% 71% 5860
6702 78% 21% 1739
1482 17% 0% 13
0% 43% 6% 51%
5 1479 205 1724
Moose-Wilson

PAGE 45 OF 128
Figure 2.7: Total TMC Movement at Moose-Wilson Road and Teton Park Road for September. HQ = Park
Headquarters.
Figure 2.8: Total TMC Movement at Moose-Wilson Road and Teton Park Road for October. HQ = Park
Headquarters.
HQ
303 105 466 0
35% 12% 53% 0%
Teton Park Rd Teton Park Rd
to Jackson Lake to US89
3 0% 7% 550
287 4% 81% 6070
6296 85% 12% 887
806 11% 0% 25
0% 17% 3% 79%
3 310 63 1432
Moose-Wilson
HQ
292 99 394 0
37% 13% 50% 0%
Teton Park Rd Teton Park Rd
to Jackson Lake to US89
3 0% 9% 325
225 6% 68% 2519
2947 77% 23% 852
649 17% 0% 10
0% 36% 7% 57%
2 599 119 944
Moose-Wilson

PAGE 46 OF 128
Figure 2.9: Total Average TMC Movement at Moose-Wilson Road and Teton Park Road for Study Duration. HQ =
Park Headquarters.
The second TMC data presented is the intersection of Moose-Wilson Road and the LSR Preserve
entrance. This intersection is a three-leg intersection with two lanes in the northbound and southbound
direction and two lanes on the eastbound and westbound direction. The intersection has stop signs on the
westbound approach, while the traffic remains free in the northbound and southbound direction.
Figures 2.10 through 2.17 illustrate the complete volume by designated study dates. Approximately 73%
of the total movement in the intersection was through traffic on the Moose-Wilson Road. On average,
17% of the northbound traffic made a right turn into LSR Preserve, while 16% of the southbound traffic
made a left turn into the LSR Preserve. Not including September, the traffic movement out of LSR
Preserve showed, on average, 62% of vehicles making a right turn northbound heading towards the
Teton Park Road and Moose-Wilson Road intersection while 38% of the traffic turned left southbound
heading towards the Granite Canyon entrance.
During part of the September sampling period, the Moose-Wilson Road was closed north of Death
Canyon Road due to grizzly bear activity in the Sawmill Ponds vicinity. As such, September TMC data
from the Moose-Wilson Road and LSR Preserve entrance was an anomaly. The data from September
showed 29% of vehicles making a right turn northbound heading towards the Teton Park Road and
Moose-Wilson Road intersection while 71% of vehicles turned left southbound heading towards the
Granite Canyon entrance.
HQ
365 120 497 1
37% 12% 51% 0%
Teton Park Rd Teton Park Rd
to Jackson Lake to US89
3 0% 8% 533
306 5% 72% 4814
5376 80% 20% 1310
1065 16% 0% 15
0% 38% 6% 55%
4 998 163 1452
Moose-Wilson

PAGE 47 OF 128
Figure 2.10: Total TMC Movement at Moose-Wilson Road and LSR Preserve Entrance Road for June 1-15.
Figure 2.11: Total TMC Movement at Moose-Wilson Road and LSR Preserve Entrance Road for June 16-30.
Moose
1568 289 19
84% 15% 1%
LSR
62% 397
38% 242
0% 0
0% 83% 17%
4 1713 359
Teton Village
Moose
2081 382 8
84% 15% 0%
LSR
62% 492
38% 300
0% 0
0% 84% 16%
4 2201 420
Teton Village

PAGE 48 OF 128
Figure 2.12: Total TMC Movement at Moose-Wilson Road and LSR Preserve Entrance Road for July.
Figure 2.13: Total TMC Movement at Moose-Wilson Road and LSR Preserve Entrance Road for August 1-15.
Moose
2469 423 12
85% 15% 0%
LSR
62% 532
38% 326
0% 0
0% 85% 15%
4 2580 451
Teton Village
Moose
2651 415 20
86% 13% 1%
LSR
58% 488
42% 349
0% 0
0% 85% 14%
7 2663 449
Teton Village

PAGE 49 OF 128
Figure 2.14: Total TMC Movement at Moose-Wilson Road and LSR Preserve Entrance Road for September.
Figure 2.15: Total TMC Movement at Moose-Wilson Road and LSR Preserve Entrance Road for October.
Moose
583 238 6
70% 29% 1%
LSR
29% 178
71% 440
0% 0
1% 63% 36%
9 663 381
Teton Village
Moose
1045 239 25
80% 18% 2%
LSR
68% 326
32% 155
0% 1
0% 81% 19%
1 1007 234
Teton Village

PAGE 50 OF 128
Figure 2.16: Total average TMC Movement at Moose-Wilson Road and LSR Preserve Entrance Road for study
duration.
Figure 2.17: Total average TMC Movement at Moose-Wilson Road and LSR Preserve Entrance Road for study
duration excluding September (road closure due to grizzly bear activity).
Moose
1733 331 15
83% 16% 1%
LSR
57% 345
43% 259
0% 0
0% 82% 17%
5 1805 382
Teton Village
Moose
1963 350 17
84% 15% 1%
LSR
62% 447
38% 274
0% 0
0% 84% 16%
4 2033 383
Teton Village
PAGE 51 OF 128
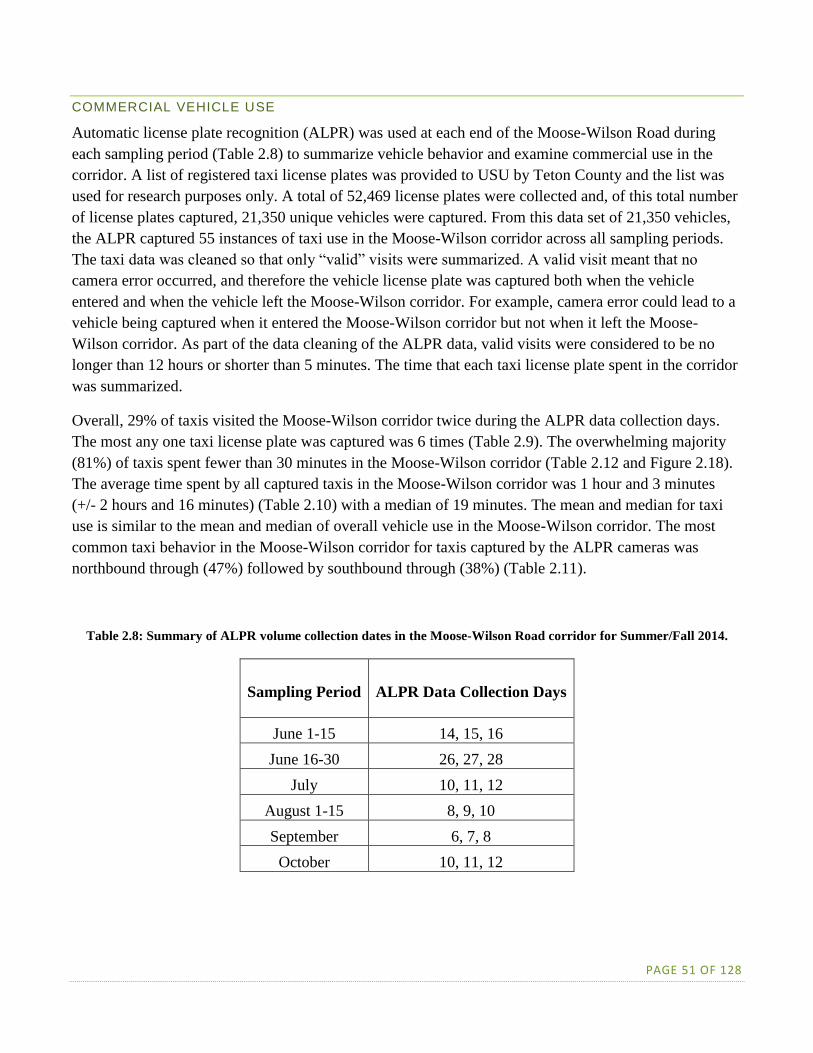
COMMERCIAL VEHICLE USE
Automatic license plate recognition (ALPR) was used at each end of the Moose-Wilson Road during
each sampling period (Table 2.8) to summarize vehicle behavior and examine commercial use in the
corridor. A list of registered taxi license plates was provided to USU by Teton County and the list was
used for research purposes only. A total of 52,469 license plates were collected and, of this total number
of license plates captured, 21,350 unique vehicles were captured. From this data set of 21,350 vehicles,
the ALPR captured 55 instances of taxi use in the Moose-Wilson corridor across all sampling periods.
The taxi data was cleaned so that only “valid” visits were summarized. A valid visit meant that no
camera error occurred, and therefore the vehicle license plate was captured both when the vehicle
entered and when the vehicle left the Moose-Wilson corridor. For example, camera error could lead to a
vehicle being captured when it entered the Moose-Wilson corridor but not when it left the Moose-
Wilson corridor. As part of the data cleaning of the ALPR data, valid visits were considered to be no
longer than 12 hours or shorter than 5 minutes. The time that each taxi license plate spent in the corridor
was summarized.
Overall, 29% of taxis visited the Moose-Wilson corridor twice during the ALPR data collection days.
The most any one taxi license plate was captured was 6 times (Table 2.9). The overwhelming majority
(81%) of taxis spent fewer than 30 minutes in the Moose-Wilson corridor (Table 2.12 and Figure 2.18).
The average time spent by all captured taxis in the Moose-Wilson corridor was 1 hour and 3 minutes
(+/- 2 hours and 16 minutes) (Table 2.10) with a median of 19 minutes. The mean and median for taxi
use is similar to the mean and median of overall vehicle use in the Moose-Wilson corridor. The most
common taxi behavior in the Moose-Wilson corridor for taxis captured by the ALPR cameras was
northbound through (47%) followed by southbound through (38%) (Table 2.11).
Table 2.8: Summary of ALPR volume collection dates in the Moose-Wilson Road corridor for Summer/Fall 2014.
Sampling Period ALPR Data Collection Days
June 1-15 14, 15, 16
June 16-30 26, 27, 28
July 10, 11, 12
August 1-15 8, 9, 10
September 6, 7, 8
October 10, 11, 12

PAGE 52 OF 128
Table 2.9: Summary of how many times an individual taxi’s license plates were captured in the Moose-Wilson
corridor by the ALPR cameras during all sampling days.
Number of Visits to MW Corridor
1 2 3 4 5 6
Number of vehicles 3 7 5 4 3 2
Frequency 13% 29% 21% 17% 13% 7%
Table 2.10: Average duration of time (and standard deviation, median, and range) spent in the Moose-Wilson
corridor for all taxis that were captured with the ALPR cameras.
Average Time
Spent in
Corridor
Standard
Deviation Median Range
All Vehicles 1 hr and 3
mins
2 hrs and 16
mins 19 mins 12 minutes – 12 hours
Figure 2.18: Frequency of individual visit lengths for taxi license plates captured by the ALPR for visits less than 30
minutes in time.

PAGE 53 OF 128
Table 2.11: Summary of taxi travel patterns into and out of the Moose-Wilson corridor for vehicles captured in the
ALPR study with valid visits.
Vehicle Travel Pattern Frequency
Northbound Through 47%
Southbound Through 38%
Enter and Exit North 9%
Enter and Exit South 6%
Table 2.12: Summary, counts and frequencies of the duration of time taxis spent in the Moose-Wilson corridor.
Duration of Stay Count Frequency
<30 minutes 43 81%
30-59 minutes 3 6%
1-3 hours 0 0%
>3 hours 7 13%
For a summary of the Summer 2013 ALPR results and the ALPR results for all vehicles in the Moose-
Wilson corridor during Summer/Fall 2014, please see Appendix C.
3. VEHICLE MOVEMENT PATTERNS
GPS-TRACKING DATA COLLECTION SUMMARY
Garmin eTrex 100 units were handed out to a random sample of vehicles as they entered the Moose-
Wilson Road from Moose (to the north) or at the Granite Canyon entrance fee station (Table 3.1).
Visitors were instructed to keep the GPS unit in their vehicles for the duration of their trips in the
Moose-Wilson corridor. Visitors returned the GPS units to researchers or to a drop box at the end of the
trip in the Moose-Wilson corridor. Similar numbers of tracks were collected at each end of the road for a
total of 854 collected useable tracks and a 73% acceptance rate (Table 3.1). The majority of the
rejections were due to time constraints, and only 6% of all of the rejections were due to language

PAGE 54 OF 128
barriers. Erroneous points were removed from individual tracks before analysis. See Appendix D for
maps of overall use patterns from the GPS-tracked vehicles and vehicle density maps.
“Local visitors” were defined as vehicles with a local (WY-22 county) license plate without a rental
company sticker attached to the vehicle. Local rental car companies confirmed that they universally use
a bar code sticker to identify vehicles and these vehicles are considered non-local visitors. All non-
“WY-22” license-plated vehicles were considered non-local visitors. This methodology was used for all
counts where local and non-locals were differentiated, including parking lot accumulation. Depending
on the sampling period, between 3% and 15% of the GPS tracks collected came from individuals with
WY-22 plates driving non-rental vehicles (defined as local visitors) (Figure 3.1). Non-local visitors
(defined as any vehicle with any license plate other than a WY-22 plate or in a rental car with a WY-22
plate) made up the other 85-97% of the total vehicles sampled across the sampling periods.
Table 3.1: Total number of GPS-tracks collected from vehicles, stratified by month, for each sampling location. The
response rate was 73% across all sampling periods and sampling locations.
Sampling Period Granite Canyon Entrance North End of Road at Moose Total Sampled
June 1-15 70 89 159
June 16-30 75 74 149
July 130 160 290
August 1-15 55 82 137
September 14 26 40
October 32 47 79

PAGE 55 OF 128
Figure 3.1: Percentage of local residents (WY-22, non-rental vehicles) and non-local (any vehicle plate other than WY-
22) tracked with GPS units stratified by sampling period.
Figure 3.2: Field technician, Sara Hansen, prepared to intercept visitors for the GPS-tracking portion of the study at
the Moose end of the Moose-Wilson Road (photo by Ashley D’Antonio).
June 1-15 June 16-30 July Aug 1 - 15 Sept Oct
% Local 15% 12% 13% 12% 10% 3%
% Non-Local 85% 88% 87% 88% 90% 97%
0%
10%
20%
30%
40%
50%
60%
70%
80%
90%
100%
% o
f veh
icle
sLocal vs. Non-Local GPS Tracked Vehicles
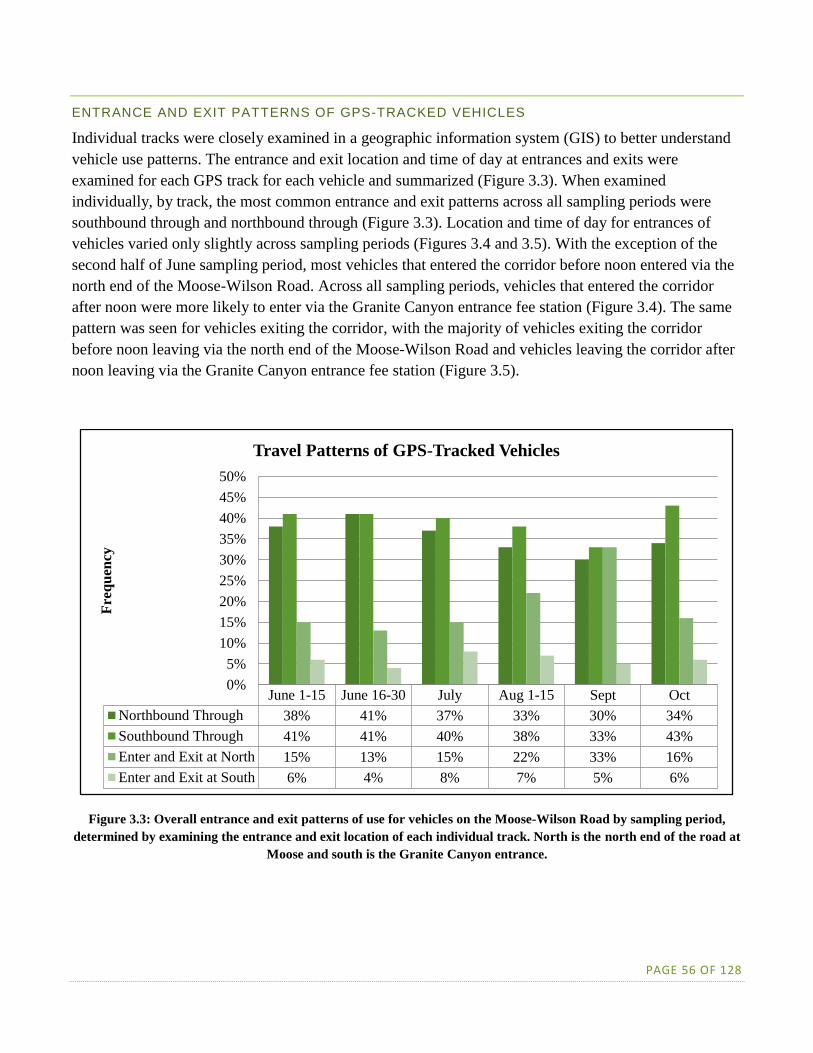
PAGE 56 OF 128
ENTRANCE AND EXIT PATTERNS OF GPS-TRACKED VEHICLES
Individual tracks were closely examined in a geographic information system (GIS) to better understand
vehicle use patterns. The entrance and exit location and time of day at entrances and exits were
examined for each GPS track for each vehicle and summarized (Figure 3.3). When examined
individually, by track, the most common entrance and exit patterns across all sampling periods were
southbound through and northbound through (Figure 3.3). Location and time of day for entrances of
vehicles varied only slightly across sampling periods (Figures 3.4 and 3.5). With the exception of the
second half of June sampling period, most vehicles that entered the corridor before noon entered via the
north end of the Moose-Wilson Road. Across all sampling periods, vehicles that entered the corridor
after noon were more likely to enter via the Granite Canyon entrance fee station (Figure 3.4). The same
pattern was seen for vehicles exiting the corridor, with the majority of vehicles exiting the corridor
before noon leaving via the north end of the Moose-Wilson Road and vehicles leaving the corridor after
noon leaving via the Granite Canyon entrance fee station (Figure 3.5).
Figure 3.3: Overall entrance and exit patterns of use for vehicles on the Moose-Wilson Road by sampling period,
determined by examining the entrance and exit location of each individual track. North is the north end of the road at
Moose and south is the Granite Canyon entrance.
June 1-15 June 16-30 July Aug 1-15 Sept Oct
Northbound Through 38% 41% 37% 33% 30% 34%
Southbound Through 41% 41% 40% 38% 33% 43%
Enter and Exit at North 15% 13% 15% 22% 33% 16%
Enter and Exit at South 6% 4% 8% 7% 5% 6%
0%
5%
10%
15%
20%
25%
30%
35%
40%
45%
50%
Fre
qu
ency
Travel Patterns of GPS-Tracked Vehicles

PAGE 57 OF 128
Figure 3.4: Patterns of use for vehicle entrances to the Moose-Wilson Road by time of day and sampling period,
determined by examining the time stamp on GPS-tracks from vehicles and noting entrance location for that vehicle
track. North is the north end of the road at Moose and south is the Granite Canyon entrance station.
Figure 3.5: Patterns of use for vehicle exits off the Moose-Wilson Road by time of day and sampling period,
determined by examining the time stamp on GPS-tracks from vehicles and noting exit location for that vehicle track.
North is the north end of the road at Moose and south is the Granite Canyon entrance station.
June
1-15
June
16-30July
Aug
1- 15Sept Oct
Enter at North before Noon 58% 45% 49% 59% 64% 58%
Enter at North after Noon 42% 55% 51% 41% 36% 43%
Enter at South before Noon 42% 48% 38% 37% 40% 54%
Enter at South after Noon 58% 52% 62% 63% 60% 46%
0%
10%
20%
30%
40%
50%
60%
70%
Fre
qu
ency
Entrance Patterns of GPS-Tracked Vehicles
June
1-15
June
16-30July
Aug
1- 15Sept Oct
Exit at North before Noon 41% 36% 30% 45% 60% 43%
Exit at North after Noon 59% 64% 70% 55% 40% 58%
Exit at South before Noon 27% 32% 29% 27% 13% 49%
Exit at South after Noon 73% 68% 71% 73% 87% 51%
0%10%20%30%40%50%60%70%80%90%
100%
Fre
qu
ency
Exit Patterns of GPS-Tracked Vehicles

PAGE 58 OF 128
VEHICLE STOPPING AND PARKING BEHAVIOR
Of the GPS-tracked vehicles, the most popular parking area across all sampling periods was Sawmill
Ponds, followed by the LSR Preserve (Table 3.2 and Figure 3.6). Attended parking areas are those
designated by the park, and unattended parking includes all visitor-created and overflow parking areas.
Far more vehicles parked in the overflow or visitor-created parking areas of the Death Canyon Road
rather than the Death Canyon designated parking lot. Between 8-10% of GPS-tracked vehicles stopped
in the Granite Canyon parking area while 1-6% of GPS-tracked vehicles stopped in the Poker Flats horse
parking area.
Vehicle tracks were examined by overall pattern of behavior while in the corridor, including individual
stops and stopping at multiple locations (Table 3.3). Between 32-43% of vehicles drove straight through
the corridor without stopping at any destinations. Depending on the sampling period, one-third to one-
half of the vehicles tracked stopped at the Sawmill Ponds parking lot. Only 12-27% of the vehicles
tracked stopped in multiple locations.
Table 3.2: Percentage of GPS-tracked vehicles that visited specific parking areas within the Moose-Wilson corridor.
Vehicles could have stopped at multiple parking areas, and frequencies do not equal 100% since not all vehicles
stopped while traveling the corridor. Attended parking areas are those designated by the park, and unattended
parking includes all visitor-created and overflow parking areas. These percentages are based on ONLY those vehicles
that stopped in the corridor. See Table 3.4 for overall frequencies of traveling behavior.
Parking Location June
1-15
June
16-30 July
August
1-15 September October
Sawmill Ponds 44% 53% 37% 34% 45% 51%
Death Canyon
(Attended)
3% 1% 3% 4% 3% 5%
Death Canyon
(Unattended)
9% 9% 9% 11% 8% 13%
LSR Preserve 28% 23% 25% 25% 20% 27%
Granite Canyon 10% 9% 9% 9% 8% 8%
Poker Flats 6% 5% 2% 2% 5% 1%
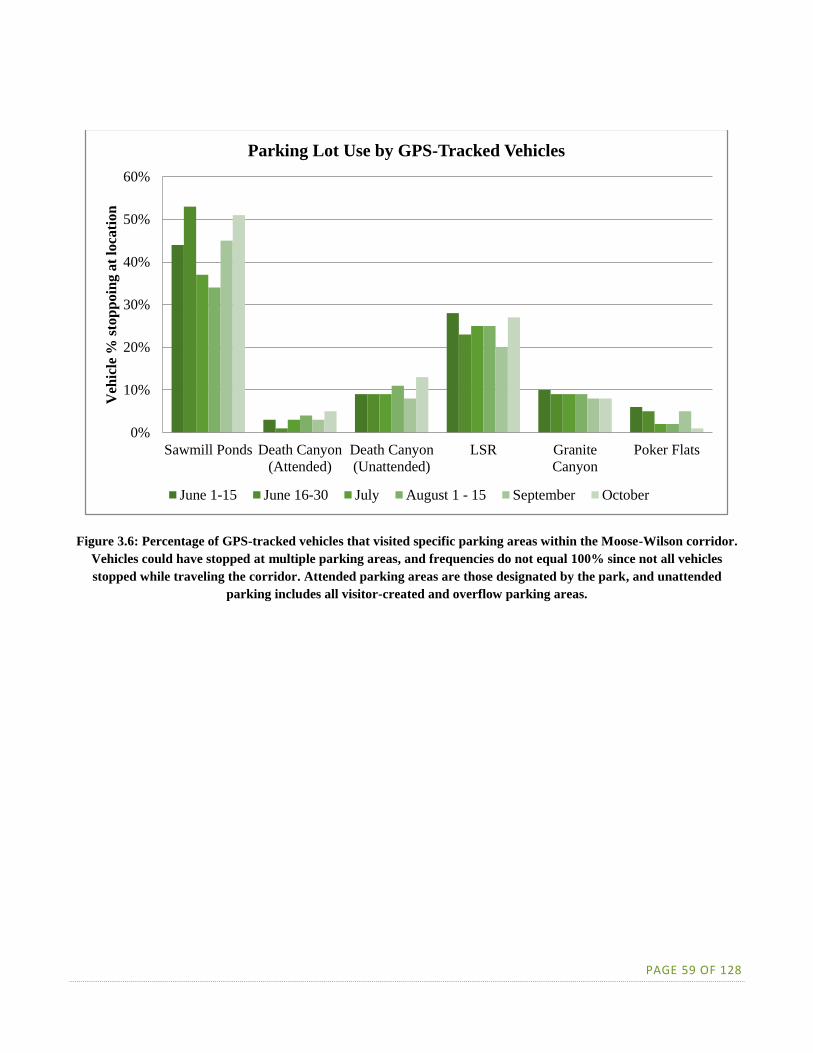
PAGE 59 OF 128
Figure 3.6: Percentage of GPS-tracked vehicles that visited specific parking areas within the Moose-Wilson corridor.
Vehicles could have stopped at multiple parking areas, and frequencies do not equal 100% since not all vehicles
stopped while traveling the corridor. Attended parking areas are those designated by the park, and unattended
parking includes all visitor-created and overflow parking areas.
0%
10%
20%
30%
40%
50%
60%
Sawmill Ponds Death Canyon
(Attended)
Death Canyon
(Unattended)
LSR Granite
Canyon
Poker Flats
Veh
icle
% s
top
po
ing
at
loca
tio
n
Parking Lot Use by GPS-Tracked Vehicles
June 1-15 June 16-30 July August 1 - 15 September October

PAGE 60 OF 128
Table 3.3: Percentage of GPS-tracked vehicles that visited specific areas of interest within the Moose-Wilson corridor.
Frequencies do not equal 100% since not all vehicles stopped while traveling the corridor, and some vehicles made
multiple stops while within the corridor.
Frequency of GPS-Tracked Vehicle Behavior
Location June
1-15
June
16-30 July
August
1-15 September October
Sawmill
Ponds
44% 53% 37% 34% 45% 51%
Death Canyon
Trailhead
3% 1% 3% 4% 3% 5%
Death Canyon
Unattended
Parking
9% 8% 9% 11% 7% 13%
LSR Preserve 28% 23% 24% 25% 20% 27%
Granite
Canyon
10% 8% 9% 9% 7% 8%
Poker Flats 6% 5% 2% 2% 5% 1%
Drive Straight
Through
36% 33% 43% 41% 32% 32%
Stopped at
Multiple
Locations
27% 27% 22% 18% 12% 24%
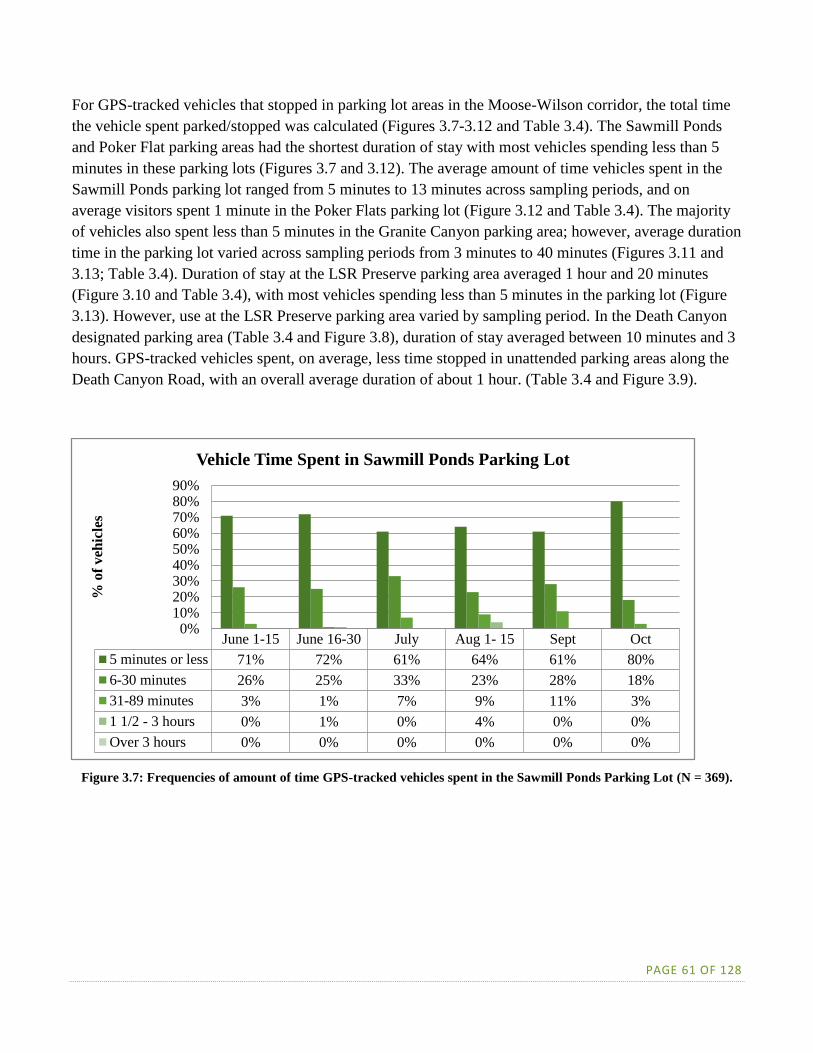
PAGE 61 OF 128
For GPS-tracked vehicles that stopped in parking lot areas in the Moose-Wilson corridor, the total time
the vehicle spent parked/stopped was calculated (Figures 3.7-3.12 and Table 3.4). The Sawmill Ponds
and Poker Flat parking areas had the shortest duration of stay with most vehicles spending less than 5
minutes in these parking lots (Figures 3.7 and 3.12). The average amount of time vehicles spent in the
Sawmill Ponds parking lot ranged from 5 minutes to 13 minutes across sampling periods, and on
average visitors spent 1 minute in the Poker Flats parking lot (Figure 3.12 and Table 3.4). The majority
of vehicles also spent less than 5 minutes in the Granite Canyon parking area; however, average duration
time in the parking lot varied across sampling periods from 3 minutes to 40 minutes (Figures 3.11 and
3.13; Table 3.4). Duration of stay at the LSR Preserve parking area averaged 1 hour and 20 minutes
(Figure 3.10 and Table 3.4), with most vehicles spending less than 5 minutes in the parking lot (Figure
3.13). However, use at the LSR Preserve parking area varied by sampling period. In the Death Canyon
designated parking area (Table 3.4 and Figure 3.8), duration of stay averaged between 10 minutes and 3
hours. GPS-tracked vehicles spent, on average, less time stopped in unattended parking areas along the
Death Canyon Road, with an overall average duration of about 1 hour. (Table 3.4 and Figure 3.9).
Figure 3.7: Frequencies of amount of time GPS-tracked vehicles spent in the Sawmill Ponds Parking Lot (N = 369).
June 1-15 June 16-30 July Aug 1- 15 Sept Oct
5 minutes or less 71% 72% 61% 64% 61% 80%
6-30 minutes 26% 25% 33% 23% 28% 18%
31-89 minutes 3% 1% 7% 9% 11% 3%
1 1/2 - 3 hours 0% 1% 0% 4% 0% 0%
Over 3 hours 0% 0% 0% 0% 0% 0%
0%10%20%30%40%50%60%70%80%90%
% o
f v
ehic
les
Vehicle Time Spent in Sawmill Ponds Parking Lot

PAGE 62 OF 128
Figure 3.8: Frequencies of amount of time GPS-tracked vehicles spent in the designated Death Canyon Parking Lot
(N = 25).
Figure 3.9: Frequencies of amount of time GPS-tracked vehicles spent in the unattended or visitor-created parking
areas along Death Canyon Road (N = 82).
June 1-15 June 16-30 July Aug 1- 15 Sept Oct
5 minutes or less 0% 0% 25% 20% 0% 50%
6-30 minutes 0% 0% 0% 0% 100% 0%
31-89 minutes 20% 50% 25% 20% 0% 0%
1 1/2 - 3 hours 40% 0% 13% 40% 0% 50%
Over 3 hours 40% 50% 38% 20% 0% 0%
0%10%20%30%40%50%60%70%80%90%
100%
% o
f v
ehic
les
Vehicle Time Spent in Death Canyon Parking Lot
(Designated)
June 1-15 June 16-30 July Aug 1- 15 Sept Oct
5 minutes or less 43% 50% 23% 7% 0% 30%
6-30 minutes 29% 36% 39% 53% 0% 70%
31-89 minutes 7% 7% 8% 13% 33% 0%
1 1/2 - 3 hours 21% 0% 19% 13% 0% 0%
Over 3 hours 0% 7% 12% 13% 67% 0%
0%
10%
20%
30%
40%
50%
60%
70%
80%
% o
f veh
icle
s
Vehicle Time Spent in Death Canyon Parking Area
(Unattended)
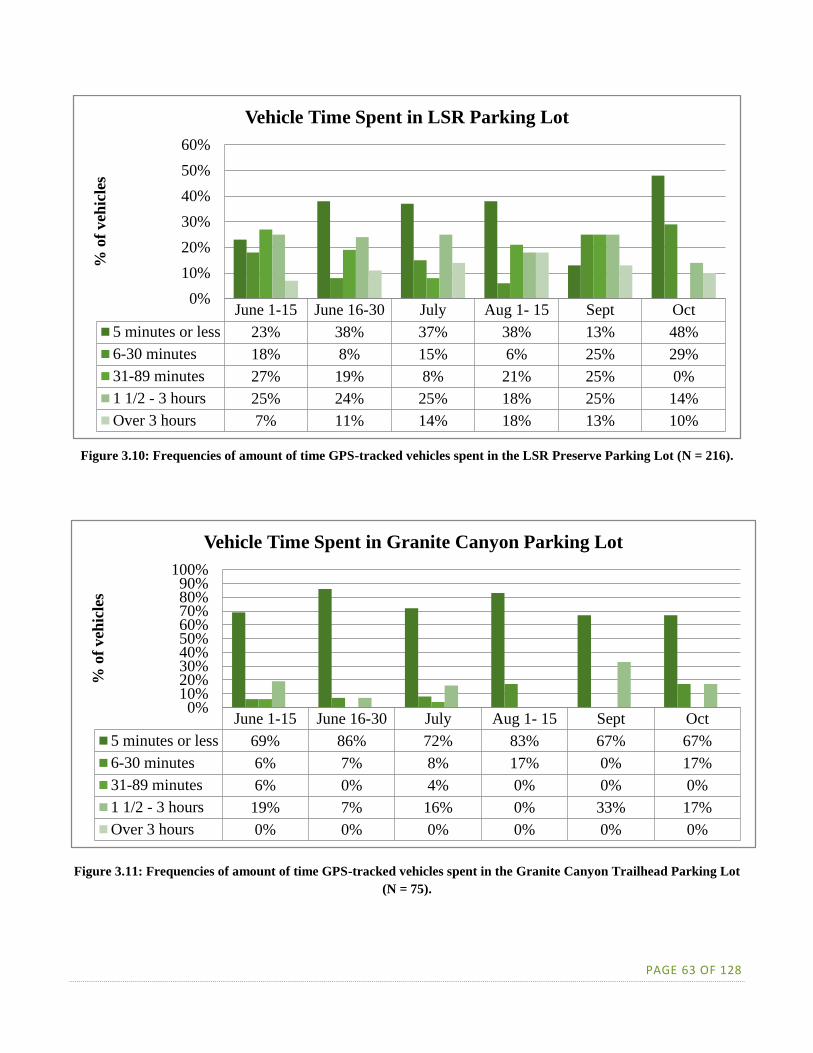
PAGE 63 OF 128
Figure 3.10: Frequencies of amount of time GPS-tracked vehicles spent in the LSR Preserve Parking Lot (N = 216).
Figure 3.11: Frequencies of amount of time GPS-tracked vehicles spent in the Granite Canyon Trailhead Parking Lot
(N = 75).
June 1-15 June 16-30 July Aug 1- 15 Sept Oct
5 minutes or less 23% 38% 37% 38% 13% 48%
6-30 minutes 18% 8% 15% 6% 25% 29%
31-89 minutes 27% 19% 8% 21% 25% 0%
1 1/2 - 3 hours 25% 24% 25% 18% 25% 14%
Over 3 hours 7% 11% 14% 18% 13% 10%
0%
10%
20%
30%
40%
50%
60%
% o
f veh
icle
s
Vehicle Time Spent in LSR Parking Lot
June 1-15 June 16-30 July Aug 1- 15 Sept Oct
5 minutes or less 69% 86% 72% 83% 67% 67%
6-30 minutes 6% 7% 8% 17% 0% 17%
31-89 minutes 6% 0% 4% 0% 0% 0%
1 1/2 - 3 hours 19% 7% 16% 0% 33% 17%
Over 3 hours 0% 0% 0% 0% 0% 0%
0%10%20%30%40%50%60%70%80%90%
100%
% o
f veh
icle
s
Vehicle Time Spent in Granite Canyon Parking Lot

PAGE 64 OF 128
Figure 3.12: Frequencies of amount of time GPS-tracked vehicles spent in the Poker Flats Parking Lot (N = 28).
June 1-15 June 16-30 July Aug 1- 15 Sept Oct
5 minutes or less 100% 100% 100% 100% 100% 100%
6-30 minutes 0% 0% 0% 0% 0% 0%
31-89 minutes 0% 0% 0% 0% 0% 0%
1 1/2 - 3 hours 0% 0% 0% 0% 0% 0%
Over 3 hours 0% 0% 0% 0% 0% 0%
0%
20%
40%
60%
80%
100%
120%
% o
f v
ehic
les
Vehicle Time Spent in Poker Flats Parking Lot

PAGE 65 OF 128
Table 3.4: Average amount of time (in minutes ± 1 standard deviation) GPS-tracked vehicles spent stopped/parked in
parking lots within the Moose-Wilson corridor.
Parking Lot June
1-15
June
16-30 July
August
1-15 September October
Sawmill
Ponds
6
(±8)
6
(±14)
8
(±13)
13
(±24)
11
(±17)
5
(±8)
Death Canyon
Trailhead
187
(±102)
170
(±120)
165
(±177)
104
(±73)
8
(±0)
64
(±74)
Death Canyon
Unattended
40
(±60)
32
(±71)
63
(±83)
63
(±75)
187
(±127)
10
(±8)
LSR Preserve 70
(±69)
77
(±92)
76
(±93)
74
(±86)
88
(±92)
41
(±70)
Granite
Canyon
23
(±41)
14
(±39)
23
(±44)
3
(±4)
40
(±66)
21
(±44)
Poker Flats 1
(±.3)
1
(±1)
1
(±0)
2
(±1)
1
(±0)
1
(±0)

PAGE 66 OF 128
Figure 3.13: Average amount of time GPS-tracked vehicles spent stopped/parked in parking lots within the Moose-
Wilson corridor. For Death Canyon, visitor-created parking areas were treated as part of the overall “parking lot.”
TIME SPENT IN THE MOOSE-WILSON CORRIDOR
The total time each GPS-tracked vehicle spent in the Moose-Wilson corridor was calculated individually
from the GPS track. For all sampling periods, the average time spent in the corridor was approximately
1 hour (Table 3.5). However, a wide range of variability was seen amongst tracks. The median value of
time spent in the corridor ranged from 23-34 minutes (Table 3.6). Frequencies of time spent in the
corridor show that, across all sampling periods, between 43-61% of the vehicles tracked spent less than
30 minutes within the Moose-Wilson corridor (Table 3.7). Of the vehicle trips less than 30 minutes, the
most frequent trip time was 18 minutes (Figure 3.14).
0
20
40
60
80
100
120
140
160
180
200
Sawmill
Ponds
Death
Canyon
(Attended)
Death
Canyon
(Unattended)
LSR Preserve Granite
Canyon
Poker Flats
Min
ute
sAverage Vehicle Duration of Stay by Parking Lot

PAGE 67 OF 128
Table 3.5: Average duration of time (± 1 standard deviation) spent in the Moose-Wilson corridor for all vehicles that
were tracked with GPS units. Findings are stratified by sampling period. Overall average: 1 hour.
June 1-15 June 16-30 July August 1-15 September October
All Vehicles 1 Hour,
2 Minutes
(± 1 Hr,
5 Min)
49 Minutes
(± 1 Hr,
3 Min)
1 Hour,
3 Minutes
(± 1 Hr,
23 Min)
1 Hour,
2 Minutes
(± 1 Hr,
15 Min)
1 Hour,
17 Minutes
(± 1 Hr,
39 Min)
53 Minutes
(± 49 Min)
Table 3.6: Median (and range) duration of time spent in the Moose-Wilson corridor for all vehicles that were tracked
with GPS units. Findings are stratified by sampling period.
June 1-15 June 16-30 July August 1-15 September October
All
Vehicles
33 Minutes
(12 mins –
6 hrs 11
mins)
25 Minutes
(7 mins –
7 hrs and 29
mins)
25 Minutes
(5 mins –
8 hrs and 53
mins)
23 Minutes
(16 mins –
6 hrs and
11mins)
32 Minutes
(17 mins –
5 hrs and 29
mins)
34 Minutes
(15 mins –
4 hrs)

PAGE 68 OF 128
Table 3.7: Frequencies of duration of time in the Moose-Wilson corridor for GPS-tracked vehicles. Determined by
examining the start and end time for the cleaned GPS-tracks.
Vehicle Duration of
Stay
June
1-15
June
16-30 July
August
1-15 September October
<30 minutes 46% 61% 59% 59% 43% 44%
30-59 minutes 25% 21% 16% 14% 20% 32%
1-3 hours 20% 13% 15% 18% 23% 20%
>3 hours 9% 5% 11% 9% 15% 4%
Figure 3.14: Counts of vehicle visit lengths (in minutes) that were less than 30 minutes for all GPS tracked vehicles
across all sampling periods. Very short visits could result from visitors entering the Moose-Wilson corridor, turning
around, and leaving the entrance they came in from.
0
10
20
30
40
50
60
70
80
5 6 7 8 9 1011121314151617181920212223242526272829
Veh
icle
Cou
nt
Length of Visit in Minutes
Counts of Vehicle Visit Lengths

PAGE 69 OF 128
Figure 3.15: Field technician Amy Rohman has just handed a GPS unit to a vehicle at the Granite end of the Moose-
Wilson Road (photo by Ashley D’Antonio).
4. BICYCLE USE LEVELS
MOOSE-WILSON ROAD
Data collected by the TMC and the ATR studies included counts of bicycle use on the Moose-Wilson
Road (Table 4.1). Results from TMC and ATR are re-summarized below to focus only on bicycle use
levels on the Moose-Wilson Road. Please refer to Section 2 for more information about the TMC and
ATR data collection, including specific sampling days and hours of sampling days.
The majority of bicycle users entering the Moose-Wilson Road were doing so from either the Granite
Canyon entrance (503 total counts) or by bicycling through the Moose-Wilson Road and Teton Park
Road intersection from park headquarters (289 total counts). It is important to note that the bike path is
located on the park headquarters side of the intersection. Very few bicyclists entered the Moose-Wilson
Road from Teton Park Road. More bicyclists exited the Moose-Wilson Road at the Teton Park Road
intersection (161 total counts) versus heading southbound out of the Granite Canyon entrance station
(117 total counts). The majority of bicyclists (605 total counts) exiting the Moose-Wilson Road did so at
the Granite Canyon entrance station.
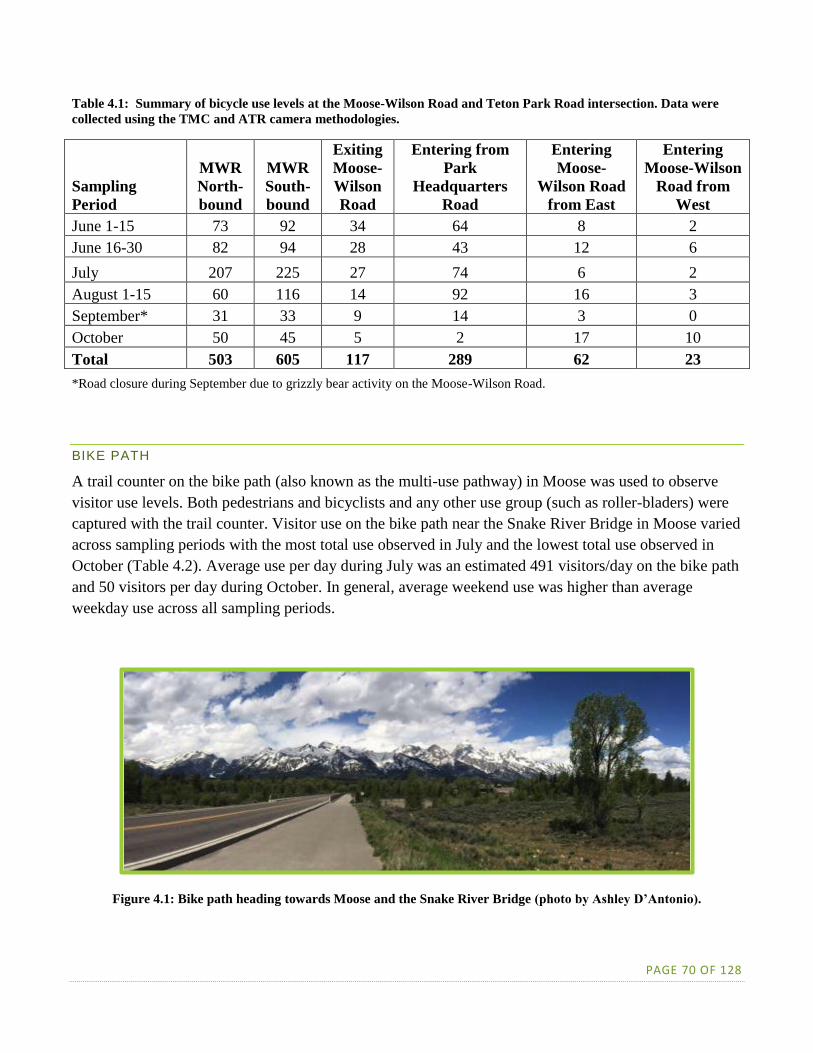
PAGE 70 OF 128
Table 4.1: Summary of bicycle use levels at the Moose-Wilson Road and Teton Park Road intersection. Data were
collected using the TMC and ATR camera methodologies.
Sampling
Period
MWR
North-
bound
MWR
South-
bound
Exiting
Moose-
Wilson
Road
Entering from
Park
Headquarters
Road
Entering
Moose-
Wilson Road
from East
Entering
Moose-Wilson
Road from
West
June 1-15 73 92 34 64 8 2
June 16-30 82 94 28 43 12 6
July 207 225 27 74 6 2
August 1-15 60 116 14 92 16 3
September* 31 33 9 14 3 0
October 50 45 5 2 17 10
Total 503 605 117 289 62 23
*Road closure during September due to grizzly bear activity on the Moose-Wilson Road.
BIKE PATH
A trail counter on the bike path (also known as the multi-use pathway) in Moose was used to observe
visitor use levels. Both pedestrians and bicyclists and any other use group (such as roller-bladers) were
captured with the trail counter. Visitor use on the bike path near the Snake River Bridge in Moose varied
across sampling periods with the most total use observed in July and the lowest total use observed in
October (Table 4.2). Average use per day during July was an estimated 491 visitors/day on the bike path
and 50 visitors per day during October. In general, average weekend use was higher than average
weekday use across all sampling periods.
Figure 4.1: Bike path heading towards Moose and the Snake River Bridge (photo by Ashley D’Antonio).
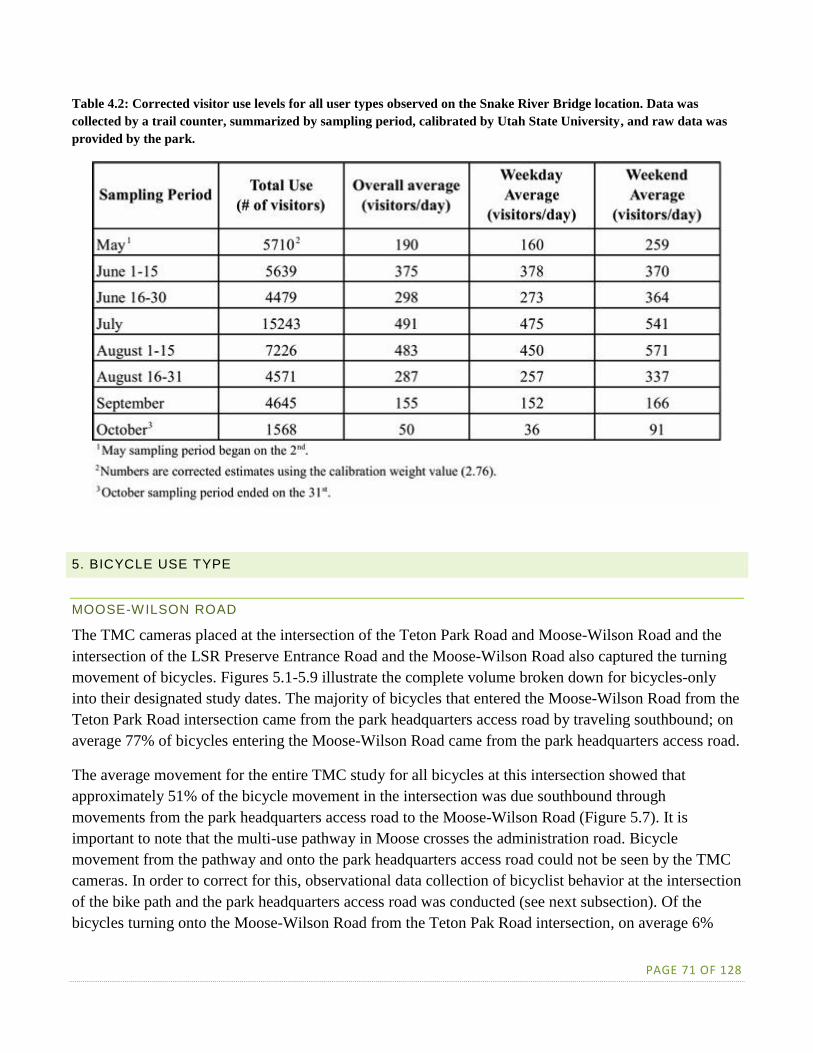
PAGE 71 OF 128
Table 4.2: Corrected visitor use levels for all user types observed on the Snake River Bridge location. Data was
collected by a trail counter, summarized by sampling period, calibrated by Utah State University, and raw data was
provided by the park.
5. BICYCLE USE TYPE
MOOSE-WILSON ROAD
The TMC cameras placed at the intersection of the Teton Park Road and Moose-Wilson Road and the
intersection of the LSR Preserve Entrance Road and the Moose-Wilson Road also captured the turning
movement of bicycles. Figures 5.1-5.9 illustrate the complete volume broken down for bicycles-only
into their designated study dates. The majority of bicycles that entered the Moose-Wilson Road from the
Teton Park Road intersection came from the park headquarters access road by traveling southbound; on
average 77% of bicycles entering the Moose-Wilson Road came from the park headquarters access road.
The average movement for the entire TMC study for all bicycles at this intersection showed that
approximately 51% of the bicycle movement in the intersection was due southbound through
movements from the park headquarters access road to the Moose-Wilson Road (Figure 5.7). It is
important to note that the multi-use pathway in Moose crosses the administration road. Bicycle
movement from the pathway and onto the park headquarters access road could not be seen by the TMC
cameras. In order to correct for this, observational data collection of bicyclist behavior at the intersection
of the bike path and the park headquarters access road was conducted (see next subsection). Of the
bicycles turning onto the Moose-Wilson Road from the Teton Pak Road intersection, on average 6%

PAGE 72 OF 128
entered westbound and 16% entered eastbound (Figure 5.7). On average, 59% of the bicycle traffic
northbound on Moose-Wilson Road traveled “straight thru” to the park headquarters access road (and
towards the pathway), 35% made a right turn towards the Craig Thomas Discovery and Visitor Center
intersection, and 6% made a left turn towards the Moose entrance station (Figure 5.7).
Figure 5.1: Moose-Wilson Road and Teton Park Road Bicycle Movement Volume for June 1-15. HQ = Park
Headquarters.
HQ
0 64 1 0
0% 98% 2% 0%
Teton Park Rd Teton Park Rd
to Jackson Lake to US89
0 0% 33% 4
1 25% 0% 0
1 25% 67% 8
2 50% 0% 0
0% 0% 69% 31%
0 0 34 15
Moose-Wilson

PAGE 73 OF 128
Figure 5.2: Moose-Wilson Road and Teton Park Road Bicycle Movement Volume for June 16-30. HQ = Park
Headquarters.
Figure 5.3: Moose-Wilson Road and Teton Park Road Bicycle Movement Volume for July. HQ = Park Headquarters.
HQ
2 43 3 1
4% 88% 6% 2%
Teton Park Rd Teton Park Rd
to Jackson Lake to US89
0 0% 11% 2
2 18% 26% 5
3 27% 63% 12
6 55% 0% 0
0% 5% 65% 30%
0 2 28 13
Moose-Wilson
HQ
0 74 0 0
0% 100% 0% 0%
Teton Park Rd Teton Park Rd
to Jackson Lake to US89
0 0% 18% 2
0 0% 27% 3
6 75% 55% 6
2 25% 0% 0
0% 3% 69% 28%
0 1 27 11
Moose-Wilson

PAGE 74 OF 128
Figure 5.4: Moose-Wilson Road and Teton Park Road Bicycle Volume Movement for August 1-15. HQ = Park
Headquarters.
Figure 5.5. Moose-Wilson Road and Teton Park Road Bicycle Movement Volume for September. HQ = Park
Headquarters.
HQ
0 92 0 3
0% 97% 0% 3%
Teton Park Rd Teton Park Rd
to Jackson Lake to US89
0 0% 28% 8
0 0% 17% 5
3 50% 55% 16
3 50% 0% 0
0% 8% 54% 38%
0 2 14 10
Moose-Wilson
HQ
1 14 0 0
7% 93% 0% 0%
Teton Park Rd Teton Park Rd
to Jackson Lake to US89
0 0% 17% 1
2 100% 33% 2
0 0% 50% 3
0 0% 0% 0
0% 0% 64% 36%
0 0 9 5
Moose-Wilson

PAGE 75 OF 128
Figure 5.6. Moose-Wilson Road and Teton Park Road Bicycle Movement Volume for October. HQ = Park
Headquarters.
Figure 5.7. Moose-Wilson Road and Teton Park Road – Average Bicycle Movement Volume. HQ = Park
Headquarters.
HQ
33 2 6 1
79% 5% 14% 2%
Teton Park Rd Teton Park Rd
to Jackson Lake to US89
0 0% 6% 3
18 20% 61% 31
63 69% 33% 17
10 11% 0% 0
4% 19% 19% 58%
1 5 5 15
Moose-Wilson
HQ
6 48 2 1
11% 84% 4% 2%
Teton Park Rd Teton Park Rd
to Jackson Lake to US89
0 0% 14% 3
4 19% 38% 8
13 62% 48% 10
4 19% 0% 0
0% 6% 59% 35%
0 2 20 12
Moose-Wilson

PAGE 76 OF 128
The second TMC data presented is the intersection of Moose-Wilson Road and the LSR Preserve
Entrance Road. Figures 5.8 through 5.14 illustrate the complete volume broken down for bicycles into
their designated study dates. The majority of the bicycle volume was shown to have a movement of
northbound and southbound as approximately 86% of the bicycle traffic on the Moose-Wilson Road was
through traffic. (Figure 5.14). On average, 7% of the northbound bicycle traffic made a right turn onto
the LSR Preserve Entrance Road, while 10% of the southbound bicycle traffic made a left turn onto the
LSR Preserve Entrance Road. The average bicycle traffic movement out of the LSR Preserve showed
60% making a right turn northbound heading towards the Teton Park Road and Moose-Wilson Road
intersection, while 40% turned left southbound heading towards the Granite Canyon entrance. The ATR
video from the Granite Canyon entrance station was manually analyzed to categorize bicycles by use
type. The majority of bicyclists ending the Moose-Wilson corridor from the Granite Canyon entrance
station were single bikes, and July was the busiest sampling period for bicycle use at the entrance
station.
Figure 5.8. Moose-Wilson Road and LSR Preserve Entrance Road Bicycle Movement Volume June 1-15.
Moose
56 9 0
86% 14% 0%
LSR
77% 10
23% 3
0% 0
0% 84% 16%
0 36 7
Teton Village

PAGE 77 OF 128
Figure 5.9. Moose-Wilson Road and LSR Preserve Entrance Road Bicycle Movement Volume June 16-30.
Figure 5.10. Moose-Wilson Road and LSR Preserve Entrance Road Bicycle Movement Volume for July.
Moose
44 5 0
90% 10% 0%
LSR
50% 3
50% 3
0% 0
0% 100% 0%
0 18 0
Teton Village
Moose
66 4 0
94% 6% 0%
LSR
100% 6
33% 2
0% 0
0% 94% 6%
0 48 3
Teton Village

PAGE 78 OF 128
Figure 5.11. Moose-Wilson Road and LSR Preserve Entrance Road Bicycle Movement Volume for August 1-15.
Figure 5.12. Moose-Wilson Road and LSR Preserve Entrance Road Bicycle Movement Volume for September.
Moose
75 5 1
93% 6% 1%
LSR
0% 0
100% 4
0% 0
0% 96% 4%
0 27 1
Teton Village
Moose
14 1 0
93% 7% 0%
LSR
0% 0
100% 2
0% 0
0% 100% 0%
0 9 0
Teton Village

PAGE 79 OF 128
Figure 5.13. Moose-Wilson Road and LSR Preserve Entrance Road Bicycle Movement Volume for October.
Figure 5.14. Moose-Wilson Road and LSR Preserve Entrance Road – Average Bicycle Movement Volume.
Moose
19 3 0
86% 14% 0%
LSR
100% 3
0% 0
0% 0
7% 93% 0%
1 13 0
Teton Village
Moose
46 5 0
90% 10% 0%
LSR
60% 3
40% 2
0% 0
0% 93% 7%
0 25 2
Teton Village
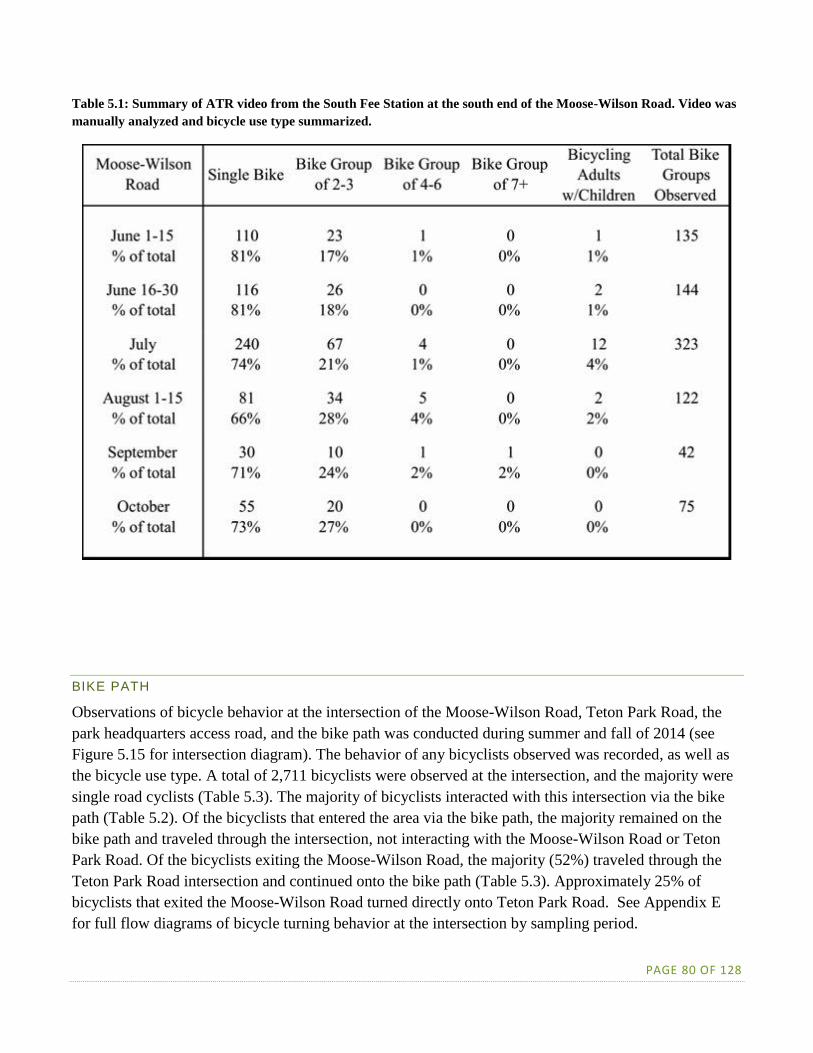
PAGE 80 OF 128
Table 5.1: Summary of ATR video from the South Fee Station at the south end of the Moose-Wilson Road. Video was
manually analyzed and bicycle use type summarized.
BIKE PATH
Observations of bicycle behavior at the intersection of the Moose-Wilson Road, Teton Park Road, the
park headquarters access road, and the bike path was conducted during summer and fall of 2014 (see
Figure 5.15 for intersection diagram). The behavior of any bicyclists observed was recorded, as well as
the bicycle use type. A total of 2,711 bicyclists were observed at the intersection, and the majority were
single road cyclists (Table 5.3). The majority of bicyclists interacted with this intersection via the bike
path (Table 5.2). Of the bicyclists that entered the area via the bike path, the majority remained on the
bike path and traveled through the intersection, not interacting with the Moose-Wilson Road or Teton
Park Road. Of the bicyclists exiting the Moose-Wilson Road, the majority (52%) traveled through the
Teton Park Road intersection and continued onto the bike path (Table 5.3). Approximately 25% of
bicyclists that exited the Moose-Wilson Road turned directly onto Teton Park Road. See Appendix E
for full flow diagrams of bicycle turning behavior at the intersection by sampling period.

PAGE 81 OF 128
Figure 5.15: Diagram of Moose-Wilson Road and Teton Park Road, including the location of the bike path.
Observations of bicyclists observed at the intersection were recorded to better understand how bike path users
interacted with the Moose-Wilson Road. See Table 5.2 for summary of bicycle movements. See Appendix C for
turning behavior details.

PAGE 82 OF 128
Table 5.2: Summary of bicycle observations at the Moose-Wilson Park Road, Teton Park Road, park administration
access road, and the bike path. August and September observations did not take place due to unexpected
circumstances during field work, including road closure due to grizzly bear activity in September. See Figure 5.14 for
abbreviation descriptions. “Enter from” describes the area of the intersection used to enter and “Exit to” describes
the area of the intersection the bike traveled to.

PAGE 83 OF 128
Analysis and calibration of the data collected at the counter on the bike path near the Snake River Bridge
indicated that the majority of visitors using the pathway were bicyclists (Table 5.3). Across all sampling
periods, between 4-8% of bike path users were pedestrians. Pedestrian use was highest in October. Of
the bicyclists using the bike path, the majority were single bicyclists or small groups of 2-3 bicyclists
(Table 5.4). During June and July, approximately half of bike path users were single bicyclists. During
October, 82% of bike path users were single bicyclists.
Table 5.3: Summary of observation counts for the Moose-Wilson Road/ Teton Park Road intersection. August and
September observations did not take place due to unexpected circumstances during field work, including road
closures due to grizzly bear activity in September.
Table 5.4: Summary of calibration techniques (observational counts) for trail counter located on the bike path in
Moose to the east of the Snake River Bridge. August and September observations did not take place due to unexpected
circumstances during field work, including road closures due to grizzly bear activity in September.
Single Bike
Bike Group of
2-3
Bike Group of
4-6
Bike Group of
7+
Bicycling Adults
w/Children
Single Pedestrian
Pedestrian Group 2-3
Total Bike Groups
Observed
Total Ped. Groups
Observed
Total Groups
Observed
26 20 0 0 3 2 0 49 2 5151% 39% 0% 0% 6% 4% 0% 96% 4%
120 89 2 3 20 8 6 234 14 24848% 36% 1% 1% 8% 3% 2% 94% 6%
153 127 1 0 12 12 4 293 16 30950% 41% <1% 0% 4% 4% 1% 95% 5%
42 5 0 0 0 4 0 47 4 5182% 10% 0% 0% 0% 8% 0% 92% 8%% of total
June 16-30
July
October
Snake River
Bridge
% of total
% of total
June 1-15% of total
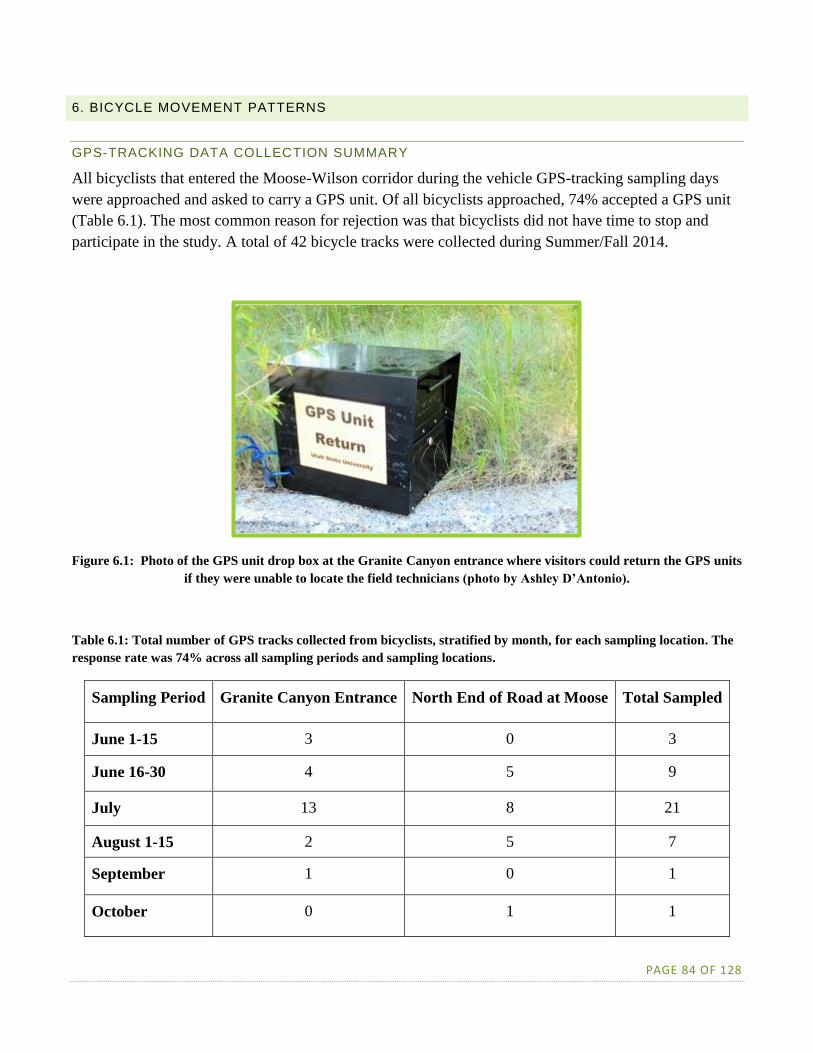
PAGE 84 OF 128
6. BICYCLE MOVEMENT PATTERNS
GPS-TRACKING DATA COLLECTION SUMMARY
All bicyclists that entered the Moose-Wilson corridor during the vehicle GPS-tracking sampling days
were approached and asked to carry a GPS unit. Of all bicyclists approached, 74% accepted a GPS unit
(Table 6.1). The most common reason for rejection was that bicyclists did not have time to stop and
participate in the study. A total of 42 bicycle tracks were collected during Summer/Fall 2014.
Figure 6.1: Photo of the GPS unit drop box at the Granite Canyon entrance where visitors could return the GPS units
if they were unable to locate the field technicians (photo by Ashley D’Antonio).
Table 6.1: Total number of GPS tracks collected from bicyclists, stratified by month, for each sampling location. The
response rate was 74% across all sampling periods and sampling locations.
Sampling Period Granite Canyon Entrance North End of Road at Moose Total Sampled
June 1-15 3 0 3
June 16-30 4 5 9
July 13 8 21
August 1-15 2 5 7
September 1 0 1
October 0 1 1
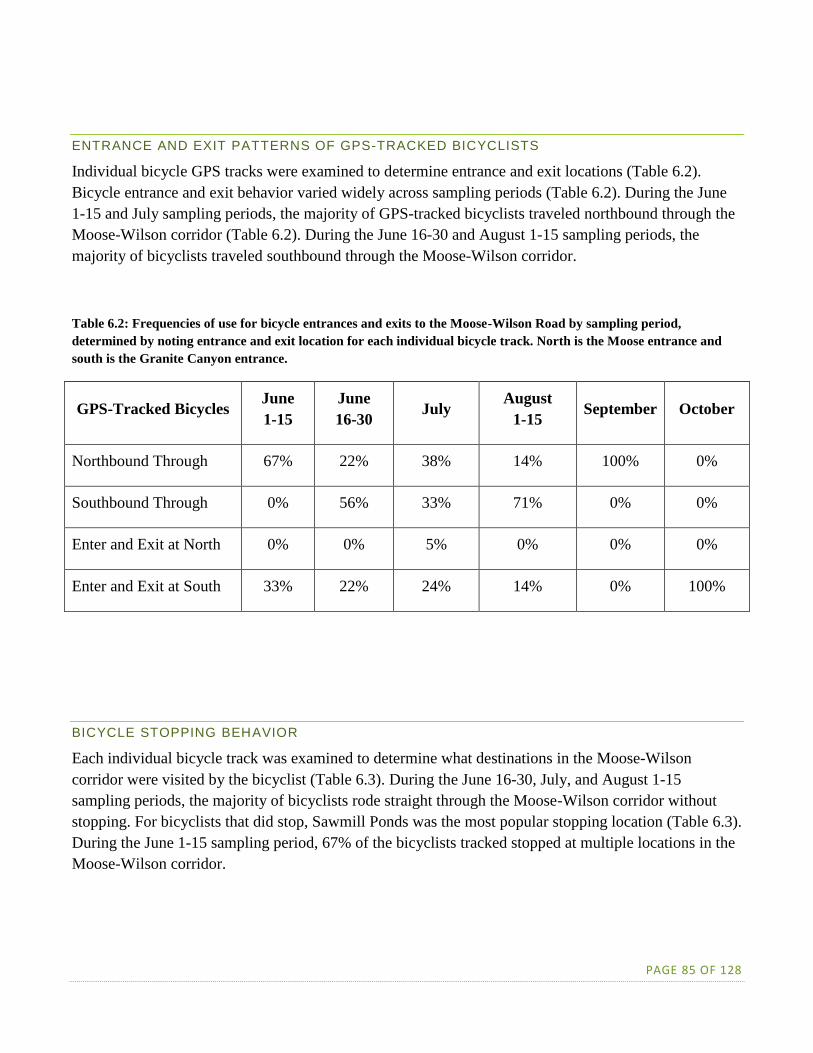
PAGE 85 OF 128
ENTRANCE AND EXIT PATTERNS OF GPS-TRACKED BICYCLISTS
Individual bicycle GPS tracks were examined to determine entrance and exit locations (Table 6.2).
Bicycle entrance and exit behavior varied widely across sampling periods (Table 6.2). During the June
1-15 and July sampling periods, the majority of GPS-tracked bicyclists traveled northbound through the
Moose-Wilson corridor (Table 6.2). During the June 16-30 and August 1-15 sampling periods, the
majority of bicyclists traveled southbound through the Moose-Wilson corridor.
Table 6.2: Frequencies of use for bicycle entrances and exits to the Moose-Wilson Road by sampling period,
determined by noting entrance and exit location for each individual bicycle track. North is the Moose entrance and
south is the Granite Canyon entrance.
GPS-Tracked Bicycles June
1-15
June
16-30 July
August
1-15 September October
Northbound Through 67% 22% 38% 14% 100% 0%
Southbound Through 0% 56% 33% 71% 0% 0%
Enter and Exit at North 0% 0% 5% 0% 0% 0%
Enter and Exit at South 33% 22% 24% 14% 0% 100%
BICYCLE STOPPING BEHAVIOR
Each individual bicycle track was examined to determine what destinations in the Moose-Wilson
corridor were visited by the bicyclist (Table 6.3). During the June 16-30, July, and August 1-15
sampling periods, the majority of bicyclists rode straight through the Moose-Wilson corridor without
stopping. For bicyclists that did stop, Sawmill Ponds was the most popular stopping location (Table 6.3).
During the June 1-15 sampling period, 67% of the bicyclists tracked stopped at multiple locations in the
Moose-Wilson corridor.

PAGE 86 OF 128
Table 6.3: Percentage of GPS-tracked bicycles that visited specific areas of interest within the Moose-Wilson corridor.
Frequencies do not equal 100% since not all bicyclists stopped while traveling the corridor, and some bicycles made
multiple stops while within the corridor.
Parking Lot
Location
June
1-15
June
16-30
July August
1-15
September October
Sawmill Ponds 67% 22% 38% 14% 100% 100%
Death Canyon
Trailhead Parking 33% 0% 5% 0% 0% 0%
Death Canyon Road
Parking (Unattended) 33% 0% 5% 0% 0% 100%
LSR Preserve
Parking 33% 11% 5% 14% 0% 0%
Granite Canyon
Trailhead Parking 0% 11% 10% 0% 0% 0%
Poker Flats Horse
Trailer Parking 0% 0% 0% 0% 0% 0%
Rode Straight
Through 33% 67% 52% 71% 0% 0%
Stopped at Multiple
Locations 67% 11% 9% 0% 0% 100%

PAGE 87 OF 128
TIME SPENT IN THE MOOSE-WILSON CORRIDOR
The total time each GPS-tracked bicycle spent in the Moose-Wilson corridor was calculated individually
from the GPS track (Tables 6.4-6.6). For all sampling periods, the average time spent in the corridor was
48 minutes (Table 6.4). The median time spent in the Moose-Wilson corridor ranged from 16 minutes to
1 hour and 37 minutes (Table 6.5). Frequencies of time spent in the corridor show that, with the
exception of the June 1-16 sampling period, most bicyclists spend between 30 minutes and an hour in
the Moose-Wilson corridor (Table 6.6). During the June 1-15 sampling period, 67% of the bicyclists
tracked spent between 1 and 3 hours in the Moose-Wilson corridor.
Table 6.4: Average duration of time (± 1 standard deviation) spent in the Moose-Wilson corridor for all bicycles that
were tracked with GPS units. Findings are stratified by sampling period (overall average = 48 minutes). During
September and October, only one bicyclist was sampled in each sampling period.
June 1-15 June 16-30 July August 1-15 September October
All
Bicycles
84 Minutes
(± 32 min)
39 Minutes
(± 20 min)
52 Minutes
(± 55 min)
37 Minutes
(± 25 min)
48 Minutes
(± N/A)
16 Minutes
(± N/A)
Table 6.5: Median (and range) for time spent in the Moose-Wilson corridor for all bicycles that were tracked with
GPS units. Findings are stratified by sampling period. During September and October, only one bicyclist was sampled
in each sampling period.
June 1-15 June 16-30 July August 1-15 September October
All
Bicycles
97 Minutes
(47 mins –
1 hr and 48
mins)
41 Minutes
(8 mins –
1 hr and 18
mins)
37 Minutes
(12 mins –
3 hrs and
46 mins)
30 Minutes
(15 mins –
1 hr and 31
mins)
48 Minutes
(N/A)
16 Minutes
(N/A)

PAGE 88 OF 128
Table 6.6: Frequencies of duration time in the Moose-Wilson corridor for GPS-tracked bicycles. Determined by
examining the start and end time of GPS-tracks.
Bicycle
Duration of
Stay
June 1-15 June 16-30 July August 1-15 September October
<30 minutes 0% 33% 33% 43% 0% 100%
30-59 minutes 33% 56% 52% 43% 100% 0%
1-3 hours 67% 11% 5% 14% 0% 0%
>3 hours 0% 0% 10% 0% 0% 0%
See Appendix F for maps of overall use patterns from the GPS-tracked bicycles and bicycle density
maps.
7. PEDESTRIAN USE LEVEL
CALIBRATIONS
Pedestrian counters were placed throughout the Moose-Wilson corridor trail system by GRTE staff (see
Figure 2). The data from these counters were downloaded by park staff, and the raw data was provided
to Utah State University for analysis and summary. During each sampling period, Utah State University
calibrated each counter to determine the level of error associated with the counter. Calibration
techniques involved manually counting pedestrians at each counter and comparing the manual counts to
the electronic counts from the counter. A correction value was calculated for each counter, with the
exception of the counter at the LSR Preserve parking lot bridge, and used to weight the total counts
provided by the park. A weight value was calculated for each trail counter for each calibration period by
dividing the number of visitors observed by the number recorded by the counter during the calibration
periods. These weight values were then averaged for a final correction value specific to each counter.
The weight value was then used to correct for any counter error by multiplying the weight value and the
counter estimates. Correction values close to 1 mean the counter has low error, values below 1 mean the
counter is overestimating use, and values above 1 indicate that the counter is underestimating use.
Calibrations do not correct for directional travel; in other words, visitors who passed the counter twice
would be counted twice. Therefore the values reported are representative of “total hits on the counter.”
Calibration rank values are included as a footnote on each counter table (Tables 7.2-7.11). Raw values
and the calibration weight calculations can be found in Appendix G.

PAGE 89 OF 128
Figure 7.1: The LSR Preserve; an automatic counter was placed near the parking lot of the LSR Preserve to help
estimate visitor use to this destination (photo by Ashley D’Antonio).
USE LEVELS
Tables 7.2 through 7.10 show total use, average use, and average weekend and weekday use at each
counter in the study. Table 7.1 shows a ranking of counter locations by calibration corrected visitor use
level. The raw values and values adjusted by the correction values (from Table 7.1) are both included in
the tables. Data collection for most, but not all, counters lasted from May through early November. Data
for collection periods outside of the official sampling periods were included in the tables since the data
was provided to Utah State University.
The counter located at the bridge just past the LSR Preserve Center (Table 7.4) received the highest
average level of use while the counter placed on the west side of Phelps Lake near Huckleberry Point
(Table 7.9) received the lowest level of use. For all counters—with the exception of the Sawmill Ponds
and the Granite Canyon Trailhead counters—the first sampling period in August (1st-15th) had the
highest level of average visitors per day. For Sawmill Ponds (Table 7.2), the second half of June was the
busiest month while July had the highest average use at Granite Canyon Trailhead. For most counters,
September or October had the lowest average use per day. One notable exception was the counter on the
old road trail near Sawmill Ponds where August 1st-15th had the lowest overall average use. A consistent
pattern was observed between weekday and weekend use levels; weekends were generally busier than

PAGE 90 OF 128
weekdays at all counters. However, most of these differences were relatively small, indicating that in
most cases visitor use levels do not vary much from weekdays to weekends. Sawmill Ponds was the only
location where large differences were observed between average weekday and average weekend use.
A trail counter, calibrated by Utah State University, was placed on the trail between the Murie Ranch
and the Craig Thomas Discovery and Visitor Center. August 1st-15th was the busiest sampling period for
use on the trail. However, use levels were consistent across all sampling periods with an average of
about 50-60 visitors passing the counter per sampling period (Table 7.11). There was not a substantial
difference seen between weekday and weekend use, and whether weekend use or weekday use was
greater varied by sampling period. Overall, use on the trail averaged between 18 and 58 visitors per day.
Table 7.1: Rank of counters based on calibration corrected visitor use levels with 1 = counter with highest use level and
9 = counter with lowest use level.
Rank Counter Location
1 LSR Preserve Lake Creek Trail to Bridge
2 LSR Preserve Parking Lot Footbridge
3 Death Canyon Trail
4 Lake Creek Trail
5 Woodland Trail
6 Sawmill Ponds
7 Granite Canyon Trail
8 Phelps Lake East
9 Huckleberry Point

PAGE 91 OF 128
Table 7.2: Corrected visitor use levels observed on the old road trail near Sawmill Ponds. Data was collected by a
trail counter, summarized by sampling period, calibrated by Utah State University, and raw data was provided by the
park.
Table 7.3: Corrected visitor use levels observed on the Death Canyon trail. Data was collected by a trail counter,
summarized by sampling period, calibrated by Utah State University, and raw data was provided by the park.

PAGE 92 OF 128
Table 7.4: Visitor use levels observed at the LSR Preserve parking lot footbridge. This counter captures use to the
LSR Preserve Center and the LSR Preserve trail system. Data was collected by a trail counter, summarized by
sampling period, but not calibrated by Utah State University; as such, these values are likely underestimations of total
use.
Table 7.5: Corrected visitor use levels observed at the LSR Preserve Lake Creek trail to the bridge counter. Data was
collected by a trail counter, summarized by sampling period, calibrated by Utah State University, and raw data was
provided by the park.
Sampling PeriodTotal Use
(# of visitors)Overall average
(visitors/day)
Weekday Average
(visitors/day)
Weekend Average
(visitors/day)
May 1 1985
2 331 301 482
June 1-15 9536 636 626 654
June 16-30 12652 843 812 929
July 29028 936 915 997
August 1-15 14153 944 932 975
August 16-31 12008 751 713 812
September 12675 422 423 421
October3 4675 161 133 2351May sampling period began on the 26th.2Numbers are corrected estimates using the calibration weight value (1.32).3October sampling period ended on the 29th.

PAGE 93 OF 128
Table 7.6: Corrected visitor use levels observed on the Lake Creek trail after it crossed Moose-Wilson Road. Data was
collected by a trail counter, summarized by sampling period, calibrated by Utah State University, and raw data was
provided by the park.
Table 7.7: Corrected visitor use levels observed on the Woodland trail right after the trail crosses the Moose-Wilson
Road. Data was collected by a trail counter, summarized by sampling period, calibrated by Utah State University, and
raw data was provided by the park.

PAGE 94 OF 128
Table 7.8: Corrected visitor use levels observed on the Phelps Lake East trail. Data was collected by a trail counter,
summarized by sampling period, calibrated by Utah State University, and raw data was provided by the park.
Table 7.9: Corrected visitor use levels observed at the counter on the Huckleberry Point trail. Data was collected by a
trail counter, summarized by sampling period, calibrated by Utah State University, and raw data was provided by the
park.
Sampling PeriodTotal Use
(# of visitors)Overall average
(visitors/day)
Weekday Average
(visitors/day)
Weekend Average
(visitors/day)
June 1-15 1780
1 119 117 122
June 16-30 1897 126 117 153
July 4426 143 137 159
August 1-15 2447 163 162 165
August 16-31 2074 130 115 155
September2 2318 77 75 831Numbers are corrected estimates using the calibration weight value (1.22).
2September sampling period ended on the 30 th.

PAGE 95 OF 128
Table 7.10: Corrected visitor use levels observed at Granite Canyon Trailhead. Data was collected by a trail counter,
summarized by sampling period, calibrated by Utah State University, and raw data was provided by the park.
Table 7.11: Visitor use levels observed on the trail to Murie Ranch from the Craig Thomas Discovery and Visitor
Center. Data was collected by a trail counter, summarized by sampling period, calibrated by Utah State University,
and raw data was provided by the park.

PAGE 96 OF 128
8. PEDESTRIAN MOVEMENT PATTERNS
GPS-TRACKING DATA COLLECTION SUMMARY
Garmin eTrex 100 GPS units were handed out to a random sample of pedestrians planning on hiking
within the Moose-Wilson corridor. GPS units were handed out at Granite Canyon Trailhead, Death
Canyon Trailhead, and the LSR Preserve (just past the LSR Preserve Center) (Table 8.1). Backpackers
were excluded from the study due to logistical difficulties with GPS battery life and complications with
field logistics and data analysis. Upon completion of their day hike, pedestrian visitors returned the GPS
units to field technicians at the trailhead or to GPS drop boxes located on each end of the Moose-Wilson
Road. GPS tracks were cleaned of any obvious outliers, and calibration techniques were used to
determine the level of positional error associated with the Garmin eTrex 100 units. Overall average error
was determined to be 5.7 (+/- 7.4) meters. A total of 800 useable GPS tracks were collected during the
summer/fall 2014 field season with an acceptance rate of 85%. The majority of rejections were due to
time constraints or a desire to avoid the survey portion of the study. The greatest number of tracks were
collected during July, and half of the tracks collected came from the LSR Preserve.
Table 8.1: Total number of GPS tracks collected from pedestrians (hikers), stratified by month, for each sampling
location. Acceptance rate of 85% across all locations and sampling periods.
Sampling Period Death Canyon LSR Preserve Granite Canyon Total Sampled
June 1-15 48 82 28 158
June 16-30 47 71 21 139
July 98 121 44 263
August 1-15 47 67 7 121
September 24 40 3 67
October 11 38 3 52

PAGE 97 OF 128
PEDESTRIAN VISITATION BEHAVIOR
The most frequently visited location by pedestrians, across all sampling periods, was any section of the
Valley Trail (almost half of all visitors tracked found themselves on the Valley Trail at some point
during their hike during most sampling periods) (Table 8.2 and Figure 8.2). During all sampling periods,
the Phelps Lake area (primarily the eastern shoreline) was the second most popular location for hikers to
visit. Approximately half of all visitors tracked visited Phelps Lake Overlook across all sampling
periods. The least visited location was Open Canyon, followed by the section of the Valley Trail which
terminates at Teton Village. At most, only one visitor tracked entering Open Canyon during any of the
sampling periods. The majority of visitors spent between 1 and 3 hours hiking at their destination in the
Moose-Wilson corridor (Table 8.3 and Figure 8.3). The average amount of time spent hiking in the
Moose-Wilson corridor by GPS-tracked pedestrians was approximately 2 hours and 30 minutes (Table
8.4). During October, on average, tracked visitors hiked for slightly less than 2 hours (Table 8.4).
Figure 8.1: Visitors at Phelps Lake Overlook, a popular hiking destination in the Moose-Wilson Corridor (photo by
Ashley D’Antonio).

PAGE 98 OF 128
Table 8.2: Percentage of GPS-tracked pedestrians that visited specific areas of interest within the Moose-Wilson
corridor. Frequencies do not equal 100% since pedestrians could have visited multiple locations. The “Valley Trail”
destination includes any section of the Valley Trail in the corridor while the “Valley Trail (Teton Village)” destination
includes just the section of the Valley Trail which terminates at Teton Village.
Destination June
1-15
June
16-30 July
Aug
1-15 Sept Oct
Phelps Lake Overlook 32% 32% 37% 38% 36% 19%
Phelps Lake Southern Shore Area 44% 45% 45% 55% 58% 52%
“Jump Rock” (east side of Phelps
Lake) 23% 8% 17% 23% 7% 10%
Valley Trail (west of Phelps Lake
Overlook) 54% 49% 58% 52% 46% 29%
Granite Canyon 17% 15% 16% 6% 4% 6%
Open Canyon 0% 0% 0.4% 0% 0% 0%
Death Canyon Trail 25% 19% 26% 31% 19% 10%
Valley Trail (Teton Village) 1% 0% 0.4% 1% 1% 0%
Figure 8.2: Percentage of GPS-tracked pedestrians that visited specific areas of interest within the Moose-Wilson
corridor. Frequencies do not equal 100% since pedestrians could have visited multiple locations. The “Valley Trail”
destination includes any section of the Valley Trail in the corridor while the “Valley Trail (Teton Village)” destination
includes just the section of the Valley Trail which terminates at Teton Village..
0%
10%
20%
30%
40%
50%
60%
70%
Phelps Lake
Overlook
Phelps Lake
Southern
Shore Area
“Jump
Rock”
Valley Trail
(west of
Phelps Lake
Overlook)
Granite
Canyon
Open
Canyon
Death
Canyon
Trail
Valley Trail
(Teton
Village)
Hiker Travel Patterns
June 1 - 15 June 16 - 30 July Aug 1- 15 Sept Oct

PAGE 99 OF 128
Table 8.3: Frequency of duration of time that GPS-tracked pedestrians spent hiking in the Moose-Wilson corridor
across sampling period.
Hiker Duration of
Stay June 1-15 June 16-30 July Aug 1-15 Sept Oct
<30 min 3% 5% 4% 1% 1% 8%
30 min-59 min 4% 7% 4% 6% 3% 10%
1-3 hours 61% 62% 60% 60% 73% 70%
>3 hours 32% 26% 32% 33% 22% 12%
Figure 8.3: Frequency of duration of time that GPS-tracked pedestrians spent hiking in the Moose-Wilson corridor
across sampling period.
June 1-
15
June 16-
30July Aug 1-15 Sept Oct
<30 minutes 3% 5% 4% 2% 1% 8%
30-59 minutes 4% 7% 4% 6% 3% 10%
1-3 hours 61% 62% 60% 60% 73% 70%
> 3 hours 32% 26% 32% 33% 22% 12%
0%
10%
20%
30%
40%
50%
60%
70%
80%
Per
cent
of
Tota
l H
iker
s
Hiker Duration of Stay

PAGE 100 OF 128
Table 8.4: Average duration of stay for GPS-tracked pedestrians in the Moose-Wilson corridor.
June 1-15 June 16-30 July Aug 1-15 Sept Oct
Duration
of Stay
2 hrs 38 min
(± 1 hr 34 min)
2 hrs 21 min
(± 1 hr 37 min)
2 hrs 41 min
(± 1 hr 52 min)
2 hrs 38 min
(± 1 hr 33 min)
2 hrs 17 min
(± 1 hr 25 min)
1 hr 56 min
(± 1 hr 05 min)
See Appendix H for maps of overall patterns of GPS-tracked pedestrian use and hiker densities.
9. PARKING LOT ACCUMULATION AND OVERFLOW
Designated parking lots are parking areas that were designated, installed, and maintained by GRTE.
Overflow or visitor-created parking areas are locations where visitors are parked anywhere outside of
this designated area. See Figure 9.1 for map of designated parking areas. The LSR Preserve parking lot
is the only parking lot in the Moose-Wilson corridor with a maximum capacity of approximately 54-55
vehicles, depending on how close vehicles are parked. The Poker Flats parking area was designed for
horse trailer use and does not have a formal capacity but at times held as many as 5 horse trailers at one
time. Data collection at the Poker Flats parking area did not occur in 2014. The Sawmill Ponds parking
area and Granite Canyon Trailhead parking area also do not have a formal capacity but can
accommodate approximately 15 to 25 vehicles. The formal parking area at the end of Death Canyon
Road can accommodate approximately 30 vehicles; however, the entire length of the road is used for
informal parking. These informal parking areas have an approximate capacity of between 70 and 90
vehicles. Once designated parking lots reach their formal capacity, there is potential for visitors to park
in overflow or visitor-created parking areas or to be displaced to other destinations in the corridor.
Parking lots were sampled on the hour, every hour, during times when GPS tracking of pedestrians
occurred.

PAGE 101 OF 128
Figure 9.1: Locations of designated parking lots where data was collected for this study. Poker Flats data was only
collected in 2013 and not in 2014.
TOTAL WEEKDAY AND WEEKEND AVERAGES FOR DESIGNATED PARKING LOTS
The total number of vehicles observed in each parking lot each day was stratified by weekend and
weekdays and then averaged across sampling period (Tables 9.1-9.4 and Figures 9.3-9.6). With a few
exceptions, especially at Sawmill Ponds, weekends were busier than weekdays (Figure 9.3). At Sawmill
Ponds and Death Canyon parking lots, July was the busiest sampling period (Tables 9.1 and 9.2). For
Granite Canyon and the LSR Preserve parking lots (Tables 9.3 and 9.4), the August 1st-15th sampling
period was the busiest. This data can indicate levels of use at each parking lot across the study period.
The designated parking lot at the LSR Preserve had the highest observed average of vehicles for both
weekends and weekdays (Table 9.3). Average total use on weekdays ranged from 10-45 vehicles and on
weekends ranged from 19-48 vehicles at the LSR Preserve (Figure 9.5).

PAGE 102 OF 128
Figure 9.2: Overflow parking along the Death Canyon Road on a busy weekday day (photo by Ashley D’Antonio).
Table 9.1: Average number of vehicles observed (± 1 standard deviation) in Sawmill Ponds designated parking area
per day for each study period stratified by weekdays and weekends.
Sawmill Ponds Weekdays Weekends
June 1-15 4 (±3) 7 (±5)
June 16-30 6 (±4) 4 (±4)
July 4 (±2) 3 (±2)
Aug 1-15 4 (±3) 6 (±4)
September N/A N/A
October 2.8 (±2) N/A

PAGE 103 OF 128
Figure 9.3: Average number of vehicles observed in Sawmill Ponds designated parking area per day for each study
period stratified by weekdays and weekends.
Table 9.2: Average number of vehicles observed (± 1 standard deviation) in Death Canyon designated parking area
per day for each study period stratified by weekdays and weekends.
Death Canyon Weekdays Weekends
June 1-15 8 (±3) 14 (±4)
June 16-30 9 (±5) 12 (±6)
July 16 (±6) 20 (±7)
Aug 1-15 16 (±6) 24 (±3)
September 10 (±4) 11 (±4)
October N/A 9 (±5)
0
1
2
3
4
5
6
7
June 1-15 June 16-30 July Aug 1-15 October
Aver
age
Veh
icle
on
th
e H
ou
r
Sawmill Ponds Designated Parking
Weekday Weekend

PAGE 104 OF 128
Figure 9.4: Average number of vehicles observed in Death Canyon trailhead designated parking area per day for each
study period stratified by weekdays and weekends.
Table 9.3: Average number of vehicles observed (± 1 standard deviation) in LSR Preserve designated parking area
per day for each study period stratified by weekdays and weekends.
LSR Preserve Weekdays Weekends
June 1-15 36 (±12) 39 (±11)
June 16-30 41 (±13) 44 (±12)
July 45 (±11) 48 (±9)
Aug 1-15 44 (±12) 46 (±11)
September 36 (±13) 38 (±13)
October 11 (±4) 19 (±10)
0
5
10
15
20
25
30
June 1-15 June 16-30 July Aug 1-15 September October
Aver
age
Veh
icle
on
th
e H
ou
r
Death Canyon Designated Parking
Weekday Weekend

PAGE 105 OF 128
Figure 9.5: Average number of vehicles observed in LSR Preserve designated parking area per day for each study
period stratified by weekdays and weekends.
Table 9.4: Average number of vehicles observed (± 1 standard deviation) in Granite Canyon designated parking area
per day for each study period stratified by weekdays and weekends.
Granite Canyon Weekdays Weekends
June 1-15 7 (±3) 10 (±5)
June 16-30 11 (±4) 13 (±4)
July 15 (±3) 17 (±4)
Aug 1-15 12 (±3) N/A
September N/A 10 (±2)
October 1 (±1) N/A
0
10
20
30
40
50
60
June 1-15 June 16-30 July August September October
Aver
age
Veh
icle
on
th
e H
ou
r
LSR Preserve Designated Parking
Weekday Weekend

PAGE 106 OF 128
Figure 9.6: Average number of vehicles observed in Granite Canyon designated parking area per day for each study
period stratified by weekdays and weekends.
MAXIMUM USE OF DESIGNATED AND OVERFLOW PARKING AREAS:
The maximum number of vehicles observed at one time within a sampling period for both designated
and overflow/visitor-created parking areas was noted (Tables 9.5 and 9.6). The LSR Preserve designated
parking area showed the highest observed number of vehicles parked at one time with 61 vehicles during
July. This maximum of 61 vehicles was due to 10 motorcycles parked in the parking lot as vehicle
capacity is between 52 and 56 vehicles. Sawmill Ponds had the lowest observed number of vehicles at
one time (max ranging from 10 to 16 vehicles). Death Canyon had the highest observed number of
vehicles parking in overflow or visitor-created parking with 85 vehicles observed at one time during the
August 1st-15th sampling periods (Table 9.6). There were significantly more cars parked in the visitor-
created overflow parking areas along Death Canyon Road than were in the designated trailhead lot;
sometimes three times as many. All other parking areas had much lower maximum observed parking in
overflow or visitor-created areas. Granite Canyon had no overflow parking observed during September
and October.
0
2
4
6
8
10
12
14
16
18
20
June 1-15 June 16-30 July Aug 1-15 September October
Aver
age
Veh
icle
on
th
e H
ou
rGranite Canyon Designated Parking
Weekday Weekend

PAGE 107 OF 128
Table 9.5: Maximum number of vehicles observed at one time in the designated parking lots.
Parking Lot June 1-15 June 16-30 July August 1-15 September October
Sawmill Ponds 16 14 10 13 n/a 11
Death Canyon 21 24 30 28 18 17
Granite Canyon 19 20 23 17 13 3
LSR Preserve 53 54 61 59 55 32
Table 9.6: Maximum number of vehicles observed at one time in overflow parking areas.
Parking Lot June 1-15 June 16-30 July August 1-15 September October
Sawmill Ponds 2 7 5 1 n/a 1
Death Canyon 33 28 62 85 33 17
Granite Canyon 8 3 9 1 0 0
Figure 9.7: Sawmill Ponds Overlook designated parking lot during a time of high use (photo by Ashley D’Antonio).

PAGE 108 OF 128
LOCAL USE IN DESIGNATED AND OVERFLOW PARKING AREAS
Vehicles with WY-22 license plates were noted while recording parking lot accumulation counts (Table
9.7). The percentages of local vehicles observed during the entire sampling period were summarized by
designated parking areas. Use of designated parking areas by locals (defined by the presence of WY-22
plates and no rental sticker) varied by parking lot and by sampling period. The Death Canyon trailhead
designated parking lot had the highest level of local use across all sampling periods with the exception
of September.
Table 9.7: Total percent of local vehicles observed in designated parking areas by sampling period.
Parking Lot June 1-15 June 16-30 July August 1-15 September October
Sawmill Ponds 14.2% 22.3% 4.7% 4.3% N/A 2%
Death Canyon 36.1% 22.8% 28.4% 26.6% 24.6% 57.9%
Granite Canyon 22.5% 16.8% 18.2% 16.9% 33.8% 0%
LSR Preserve 17% 19% 17% 14% 31%

PAGE 109 OF 128
Figure 9.8: A local vehicle parked along Death Canyon Road. Death Canyon had the highest percentage of local use
compared to other parking areas (photo by Ashley D’Antonio).

PAGE 110 OF 128
PARKING LOT USE BY HOURS OF THE DAY
At each hour, the total number of vehicles was recorded. These totals were averaged across the sampling
period to show how use of both designated and visitor-created parking areas varied across a day (Figures
9.9 through 9.14). Across all sampling periods in both Death Canyon parking areas (designated and
overflow) and the Granite Canyon trailhead, parking lot use was highest between 11:00am and 3:00pm.
The busiest sampling period for parking lot use at Death Canyon and Granite Canyon was July (Figures
9.9, 9.10, and 9.13). At Sawmill Ponds, use was not consistent, and no obvious pattern can be seen.
Overflow parking of 1 or 2 cars was observed once per sampling period at Sawmill Ponds. At the LSR
Preserve, use increased until 11am, remained high, and dropped off only slightly after 3pm (Figure
9.12). The July and August sampling periods showed the highest average vehicle use in the LSR
Preserve parking lot.
For Death Canyon (Figure 9.10) and Granite Canyon (Figure 9.14), hourly use of overflow and visitor-
created parking was also examined. Hourly use of overflow parking areas at Granite Canyon (Figure
9.14) and Death Canyon appeared to peak in the afternoons (from approximately noon-3pm).
Additionally, at Death Canyon high levels of use of overflow and visitor-created parking areas were
observed throughout the August 1st-15th sampling period. The tables accompanying the graphs are
shown with standard deviations in Appendix I.
Figure 9.9: Average number of vehicles observed at each hour of the day in designated parking area by sampling
period for Sawmill Ponds parking area. Blanks indicate that we had missing data for that time period during that
sampling period.
8:00
AM
9:00
AM
10:00
AM
11:00
AM
12:00
PM
1:00
PM
2:00
PM
3:00
PM
4:00
PM
5:00
PM
6:00
PM
June 1-15 3 4 2 9 7 6 7 3 13 6 5
June 16-30 6 6 7 6 5 4 3 2 2 3 6
July 3 4 3 6 4 4 2 2 3 3 4
Aug 1-15 1 6 4 10 3 5 7
October 3 3 3 3 3 3 2 1 7
0
2
4
6
8
10
12
14
Aver
age
Nu
mb
er o
f V
ehic
les
Sawmill Ponds - Designated Parking

PAGE 111 OF 128
Figure 9.10: Average number of vehicles observed at each hour of the day in designated parking area by sampling
period for Death Canyon trailhead parking area.
8:00
AM
9:00
AM
10:00
AM
11:00
AM
12:00
PM
1:00
PM
2:00
PM
3:00
PM
4:00
PM
5:00
PM
6:00
PM
June 1-15 4 8 9 11 12 12 11 10 10 7 5
June 16-30 3 4 9 10 12 14 15 11 7 6 5
July 7 11 14 17 21 22 22 20 18 13 11
Aug 1-15 13 14 16 20 21 24 22 19 19 14 14
September 5 7 10 14 15 11 13 10 9 8 4
October 2 3 6 6 11 14 13 12 9 6 2
0
5
10
15
20
25
Aver
age
Nu
mb
er o
f V
ehic
les Death Canyon - Designated Parking

PAGE 112 OF 128
Figure 9.11: Average number of vehicles observed at each hour of the day in overflow and visitor-created parking
areas by sampling period for Death Canyon Road.
8:00
AM
9:00
AM
10:00
AM
11:00
AM
12:00
PM
1:00
PM
2:00
PM
3:00
PM
4:00
PM
5:00
PM
6:00
PM
June 1-15 1 4 7 10 13 15 14 11 9 8 2
June 16-30 2 3 4 11 19 17 17 10 9 9 4
July 11 12 20 26 35 39 37 36 29 23 14
Aug 1-15 10 14 25 41 48 51 49 39 33 28 20
September 9 8 12 19 17 18 14 10 4 4 3
October 2 3 5 4 8 11 11 12 4 3 3
0
10
20
30
40
50
60
Aver
age
Nu
mb
er o
f V
ehic
les Death Canyon - Overflow Parking

PAGE 113 OF 128
Figure 9.12: Average number of vehicles observed at each hour of the day in designated parking area by sampling
period for LSR Preserve parking area. The LSR Preserve parking lot data was collected by GRTE staff and therefore
sampling only occurred during LSR Preserve Center hours.
9:00
AM
10:00
AM
11:00
AM
12:00
PM1:00 PM 2:00 PM 3:00 PM 4:00 PM
June 1-15 16 27 42 47 45 43 40 34
June 16-30 16 38 49 50 48 49 46 38
July 21 46 50 51 51 50 50 47
August 21 42 49 50 51 50 49 47
September 14 30 43 47 47 43 38 29
October 5 7 13 21 25 23 23 18
0
10
20
30
40
50
60
Av
era
ge
Nu
mb
er o
f V
ehic
les
LSR Preserve - Designated Parking
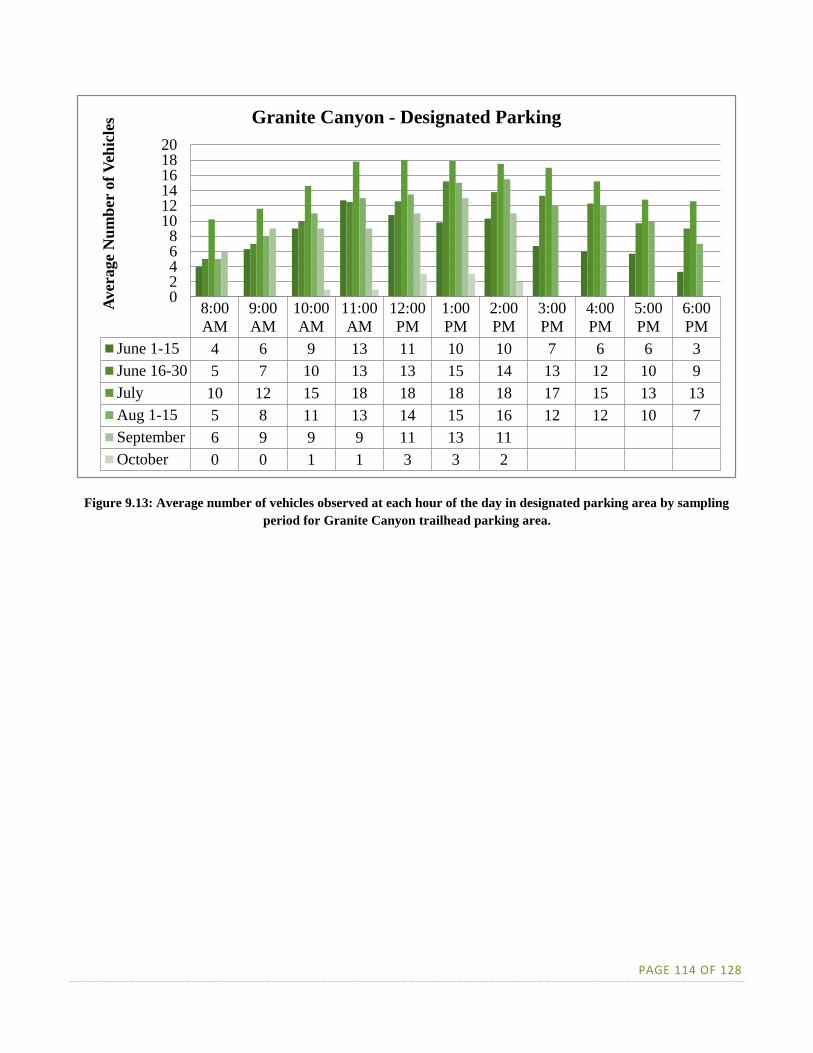
PAGE 114 OF 128
Figure 9.13: Average number of vehicles observed at each hour of the day in designated parking area by sampling
period for Granite Canyon trailhead parking area.
8:00
AM
9:00
AM
10:00
AM
11:00
AM
12:00
PM
1:00
PM
2:00
PM
3:00
PM
4:00
PM
5:00
PM
6:00
PM
June 1-15 4 6 9 13 11 10 10 7 6 6 3
June 16-30 5 7 10 13 13 15 14 13 12 10 9
July 10 12 15 18 18 18 18 17 15 13 13
Aug 1-15 5 8 11 13 14 15 16 12 12 10 7
September 6 9 9 9 11 13 11
October 0 0 1 1 3 3 2
02468
101214161820
Aver
age
Nu
mb
er o
f V
ehic
les Granite Canyon - Designated Parking

PAGE 115 OF 128
Figure 9.14: Average number of vehicles observed at each hour of the day in overflow and visitor-created parking
areas by sampling period for Granite Canyon trailhead.
ADDITIONAL DATA COLLECTION AT LSR PRESERVE AND SAWMILL PONDS
At Sawmill Ponds, additional observational data was collected to better understand how the designated
and overflow parking areas were being used by visitors. At Sawmill Ponds, the behavior of any visitor
that entered the parking lot was documented and summarized (Figure 9.15). The majority of visitors
using Sawmill Ponds either did not leave their vehicle or did not travel far from their vehicle while using
the Sawmill Ponds area. The tables accompanying the Sawmill Ponds graph is shown with standard
deviations in Appendix I.
At the LSR Preserve parking lot, staff recorded a count of the number of vehicles that were in the queue
waiting for a parking spot to open up. The number of vehicles in line was recorded on the hour with
other parking lot counts (Figure 9.17). The average number of vehicles in line peaked between 11:00am
and 12:00pm during all sampling periods at about 6-7 vehicles waiting for a spot (Figure 9.17).
8:00
AM
9:00
AM
10:00
AM
11:00
AM
12:00
PM
1:00
PM
2:00
PM
3:00
PM
4:00
PM
5:00
PM
6:00
PM
June 1-15 0.0 0.0 0.0 0.7 1.0 1.3 1.2 0.0 0.0 0.0 0.0
June 16-30 0.0 0.0 0.0 0.0 0.6 1.2 0.8 1.7 1.0 0.7 0.0
July 1.2 1.2 2.0 4.2 3.0 3.6 3.3 1.6 1.0 0.2 0.2
Aug 1-15 0.0 0.0 0.0 0.0 0.0 0.5 0.0 0.0 0.0 0.0 0.0
September 0.0 0.0 0.0 0.0 0.0 0.0 0.0
October 0.0 0.0 0.0 0.0 0.0 0.0 0.0
0.0
0.5
1.0
1.5
2.0
2.5
3.0
3.5
4.0
4.5A
ver
ag
e N
um
ber
of
Veh
icle
sGranite Canyon - Overflow Parking

PAGE 116 OF 128
Figure 9.15: Additional data collected related to visitor use emanating from the Sawmill Ponds parking area.
“Stayed” indicates visitors who remained within the boundaries of the parking lot area. “Wandered” indicates visitors
who left the parking lot area but remained on the perimeter. “Hiked” indicates visitors who left the parking area and
hiked down the “old road” trail, and “Vehicle” indicates vehicles that pulled into the Sawmill Ponds parking area and
either did not fully park or parked briefly and then left.
Figure 9.16: Sawmill Ponds is a popular destination for wildlife viewing, especially for visitors looking for Moose
(photo by Abigail Kidd).
Stayed Wandered Hiked Other Vehicles
June 1-15 171 30 5 1 43
June 16-30 151 41 5 2 72
July 131 22 12 1 36
Aug 1-15 140 20 14 1 79
October 69 30 9 8 67
0
20
40
60
80
100
120
140
160
180V
isit
ors
in
Pa
rkin
g L
ot
Sawmill Ponds - People Counts

PAGE 117 OF 128
Figure 9.17: Average number of vehicles in queue for parking spots in the LSR Preserve parking lot per hour across
all sampling periods.
ADDITIONAL DATA COLLECTION
10. WILDLIFE BRIGADE
USU provided the Wildlife Brigade and staff at the LSR Preserve with Trimble GPS units. At all
wildlife jams in the Moose-Wilson Road corridor, the Wildlife Brigade or LSR Preserve staff members
carried the GPS units while working at the jam and also entered a few basic pieces of data for each jam
into the GPS unit (including the type of animal, duration of jam, and visual estimation of the max
number of vehicles in the jam). The GPS data and associated attributes were downloaded by USU, and
wildlife jam activity on the Moose-Wilson Road from June through October was summarized. The
sampling periods with the highest number of wildlife jams was the first part of June, July, and
September (Figure 10.1). The majority of wildlife jams that occurred in early June and September were
due to bear activity; grizzly bears in June and black bears in September (Figures 10.2 and 10.6). In July,
9:00 AM 10:00 AM 11:00 AM 12:00 PM 1:00 PM 2:00 PM 3:00 PM 4:00 PM
June 0.3 0.0 1.2 2.6 1.2 0.6 0.2 0.5
July 0.0 1.2 6.1 5.4 4.0 1.7 0.8 0.7
August 0.1 1.5 5.4 6.5 3.3 1.6 1.5 1.4
September 0.0 0.0 2.2 2.5 1.4 0.4 0.5 0.0
0
1
2
3
4
5
6
7
Av
era
ge
Veh
icle
s W
ait
ing
Vehicles in Line - LSR Preserve Parking Lot

PAGE 118 OF 128
the majority of wildlife jams were caused by moose (Figure 10.4). Overall, moose caused the most
wildlife jams across the entire sampling season (Figures 10.7 and 10.8). The size and duration of the
wildlife jams varied widely (Figures 10.9 and 10.10). However, most jams lasted between 15 and 30
minutes (Figure 10.9), and the most common estimated size of jams was less than 20 cars (Figure
10.10). Maps of the location and density of the wildlife jams recorded by the park can be found in
Appendix J.
Figure 10.1: Total number of wildlife jams recorded by the park by sampling period for the Moose-Wilson Road. The
single wildlife jam in October was due to a black bear.
16
10
16
56
15
1
0
2
4
6
8
10
12
14
16
18
# o
f E
ven
ts
Wildlife Jams By Sampling Period

PAGE 119 OF 128
Figure 10.2: Total number and frequency of wildlife and wildflower jams by species recorded by the park in June
1-15 for the Moose-Wilson Road.
Figure 10.3: Total number and frequency of wildlife jams by species recorded by the park in June 16-30 for the
Moose-Wilson Road.
Black Bear ElkGreat Grey
Owl
Grizzly
BearLupine Moose Wolf
# of Events 1 2 1 5 1 4 2
% of Season Total 0.01 0.03 0.01 0.07 0.01 0.06 0.03
0
1
2
3
4
5
6
# o
f E
ven
ts
Total Wildlife & Wildflower Jams - June 1-15
Great Grey Owl Moose Wolf
# of Events 4 6 0
% of Season Total 0.06 0.09 0.00
0
1
2
3
4
5
6
7
# o
f E
ven
ts
Total Wildlife Jams - June 16-30

PAGE 120 OF 128
Figure 10.4: Total number and frequency of wildlife jams by species recorded by the park in July for the Moose-
Wilson Road.
Figure 10.5: Total number and frequency of wildlife jams by species recorded by the park in the first half of August
for the Moose-Wilson Road.
Moose Unknown
# of Events 12 4
% of Season Total 0.17 0.06
0
2
4
6
8
10
12
14# o
f E
ven
ts
Total Wildlife Jams - July
Elk Moose Unknown
# of Events 1 3 1
% of Season Total 0.01 0.04 0.01
0
0.5
1
1.5
2
2.5
3
3.5
# o
f E
ven
ts
Total Wildlife Jams - August 1-15

PAGE 121 OF 128
Figure 10.6: Total number and frequency of wildlife jams by species recorded by the park in September for the
Moose-Wilson Road.
Figure 10.7: Total number of wildlife and wildflower jams by species recorded by the park for the entire sampling
season for the Moose-Wilson Road.
Black Bear Grizzly Bear Moose Unknown
# of Events 7 1 4 3
% of Season Total 0.10 0.01 0.06 0.04
0
1
2
3
4
5
6
7
8
# o
f E
ven
ts
Total Wildlife Jams - September
1
10
36 6
1
31
2
11
0
5
10
15
20
25
30
35
# o
f E
ven
ts
Total Wildlife & Wildflower Jams by Species
# of Jams

PAGE 122 OF 128
Figure 10.8: Frequency of wildlife and wildflower jams by species recorded by the park for the entire sampling season
for the Moose-Wilson Road.
Figure 10.9: Frequency of wildlife and wildflower jam size recorded by the park for the entire sampling season for the
Moose-Wilson Road. The jams listed as having “0” cars are wildlife or wildflower jams where we have missing event
size data.
1%
14%4%
9%
9%
1%
45%
3%16%
Percent of Total Events by Species
Beaver
Black Bear
Elk
Great Grey Owl
Grizzly Bear
Lupine
Moose
Wolf
Unknown
0
5
10
15
20
25
0 <20 20 21-49 50 51-99 100 >100
# o
f E
ven
ts
# of Cars per Event
Wildlife & Wildflower Jam Event Size Frequency

PAGE 123 OF 128
Figure 10.10: Frequency of wildlife and wildflower jam length recorded by the park for the entire sampling season for
the Moose-Wilson Road.
Figure 10.11: Black bears, such as those in this photo. caused 15% of the wildlife jams in the Moose-Wilson Corridor
(photo by Abigail Kidd).
15 30 45 60 75 90 120 >120 Unknown
Frequency 12 14 7 9 8 4 1 2 12
Percent of Total 17.4 20.3 10.1 13.0 11.6 5.8 1.4 2.9 17.4
0
5
10
15
20
25
# o
f E
ven
ts
Frequency of Jam Length (in minutes)

PAGE 124 OF 128
SUMMARY OF FINDINGS
Overall Use: The first half of August (1st-15th) was the busiest sampling period throughout the
study when looking at pedestrian use on trails and parking lot use. However, vehicle traffic on
the road itself peaked in July. During the summer season (June through August), the Moose-
Wilson Road experiences approximately 1,900 vehicles per day with side roads having less use;
Death Canyon Road has use levels of approximately 200 vehicles per day, and the LSR Preserve
Entrance Road has use levels of approximately 500 vehicles per day. Given that, on average,
each vehicle contains 2.8 visitors, total use on the Moose-Wilson Road per day can be estimated
at approximately 5,300 visitors. Bicycle use makes up between 2-4% of total use in the Moose-
Wilson Corridor, resulting in approximately 60 bicycles using the Moose-Wilson Road per day.
Peak use in the Moose-Wilson corridor occurs between 11am and 2pm-3pm. At the intersection
of Moose-Wilson Road and Teton Park Road, on average, 24% of traffic from Teton Park Road
turns onto the Moose-Wilson Road.
Vehicle Use Patterns: Approximately 36% of visitors in vehicles using the Moose-Wilson
corridor drive through the corridor without stopping, spending less than 30 minutes total in the
corridor. Vehicles have median use time of approximately 18 minutes, with 45 minutes for
bicyclists. Large volumes of northbound traffic on the Moose-Wilson Road before noon made
the north end of the road a popular exiting location before noon. In the afternoon, southbound
traffic on the Moose-Wilson Road reached a peak, thus the Granite Canyon entrance station
exhibited a rise in vehicle exits. Overall though, the most common travel pattern across all
sampling periods was northbound through travel. Of vehicles that stopped within the Moose-
Wilson corridor, Sawmill Ponds was the most popular stopping location. Visitors who stopped at
Sawmill Ponds tended to spend less than 5 minutes at this destination and rarely traveled far
from their vehicle. The LSR Preserve was the second most popular stopping destination, but only
27% of vehicle traffic on the Moose-Wilson Road turned into the LSR Preserve.
Bicycle Use Levels/Patterns: The majority of bicyclists traveled through the corridor without
stopping. The frequency of northbound and southbound travel through the Moose-Wilson
corridor was almost equal for bicyclists. Bicyclists who travel on the bike path through Moose
have the option to enter the Moose-Wilson corridor. However, 81% of bicycle traffic on the bike
path at the Moose-Wilson Road/Teton Park Road intersection remained on the bike path. Of the
bicyclists exiting the Moose-Wilson corridor, 59% traveled through the intersection and entered
the bike path. The Granite Canyon entrance station was a more popular entry point for bicycles;
bicycle use made up between 2-3% of all traffic at the Granite Canyon entrance station. Of the
bicyclists that stopped at a destination, Sawmill Ponds was the most popular destination. Most
bicyclists spent between 30 minutes and 1 hour in the Moose-Wilson corridor.
Comparison to Key Findings from 2013: The majority of findings from the Summer/Fall of 2014
are consistent with the findings from the Summer/Fall 2013. However, a few key differences

PAGE 125 OF 128
were observed. Slightly lower vehicle use in the Moose-Wilson corridor was measured early
August in 2014 as compared to early August 2013. However, overall use as compared to
Western Transportation Institute data from 2006-2008 indicates that use in the Moose-Wilson
corridor is increasing across all sampling periods. Although the most popular travel pattern in the
Moose-Wilson corridor is still through traffic, the percentage of through travel fell slightly in
2014. At the same time, an increase in use at the Sawmill Ponds parking area was observed. Like
2013, visitors are not spending much time at Sawmill Ponds, but it is a popular, short-stopping
destination. Additionally, vehicle use on the LSR Preserve Entrance Road, the LSR Preserve
parking lot, and at Phelps Lake increased in 2014, indicating that more visitors were choosing to
stop at these locations in 2014 as compared to 2013. A greater percent of visitors stopping at
locations and potentially exiting their vehicles to hike led to a slight increase in use at the trail
counters throughout the corridor.
Figure 12: Field crew training at the beginning of the Summer 2013/2014 field season (photo by Ashley D’Antonio).
PAGE 126 OF 128
ACKNOWLEDGEMENTS
The authors thank the National Park Service for their financial support of this research effort and the
staff of Grand Teton National Park for logistical support and advice. We also thank Jenn Newton,
Lauren Abbott, Pete Morrone, Sara Hansen, Nicole Reed, Meghan Neville, and Amy Rohman for their
dedication to the project during the many hours of field work. Abigail Kidd, Dan Blair, and Adrian
Roadman, in addition to many hours spent in the field, contributed a significant amount of time and
effort to data processing and analysis. Annie Weiler and Derrick Taff provided assistance training the
field crew and with field work preparations. Trent Andrus provided hours of assistance, both in the field
and with data analysis related to the ATR, TMC, and ALPR work. Dr. John Daigle, Professor, School of
Forest Resources, University of Maine, provided the peer-review of this report. Tracy Jones at Utah
State University copyedited the report. Abigail Kidd provided the photo on the cover of the report.
APPENDICES
A: Moose-Wilson Corridor Use Study Sampling Schedule
B: Directional Traffic Flow from Tube Counters
C: Detailed Tables from Additional ALPR Analysis (including 2013 data)
D: Overall and Density Maps from GPS-tracked Vehicles
E: Turning Movement Diagrams for Bicyclists at Moose-Wilson Road/Teton Park Road
F: Overall and Density Maps from GPS-tracked Bicycles
G: Summary of Counter Calibrations, Raw Values, and Hourly Use
H: Overall and Density Maps from GPS-tracked Pedestrians
I: Averages and Standard Deviations from Parking Lot Graphs
J: Summary Maps of Wildlife Jams

PAGE 127 OF 128
REFERENCES
Conlon, K. (2014). Investigating the Relationship between Trail Conditions and Visitor Behavior Using
the Camera Trap Method. Thesis. North Carolina State University.
D'Antonio, A., Monz, C., Lawson, S., Newman, P., Pettebone, D., & Courtemanch, A. (2010). GPS-
based measurements of backcountry visitors in parks and protected areas: Examples of methods and
applications from three case studies. Journal of Park and Recreation Administration, 28(3).
D'Antonio, A., Monz, C., Newman, P., Lawson, S., & Taff, D. (2013). Enhancing the utility of visitor
impact assessment in parks and protected areas: A combined social-ecological approach. Journal of
Environmental Management, 124(30), 72-81.
Diamond Traffic Products (2014). Pedestrian/Trail Counting. Retrieved from:
http://diamondtraffic.com/productlist/Pedestrian-Trail-Counting, 6 June 2014.
Hallo, J.C., Beeco, J.A., Goetcheus, C., McGee, J., McGehee, N.G., & Norman, W.C. (2012). GPS as a
method for assessing spatial and temporal use distributions of nature-based tourists. Journal of Travel
Research, 51(5), 591-606.
Hunt, L.M., & Hosegood, S. (2008). The effectiveness of signs at restricting vehicle traffic: A case of
seasonal road closures on forest access roads. Canadian Journal of Forest Research, 38(8), 2306-2312.
Lawson, S., Manning, R., Valliere, W., & Wand, B. (2003). Proactive monitoring and adaptive
management of social carrying capacity in Arches National Park: An application of computer simulation
modeling. Journal of Environmental Management, 68, 305-313.
McGowen, S., Strong, C., Liang, L., Kack, D., Kumar, M., Akin, M., & Albert, S. (2009). Report:
Moose-Wilson Corridor Adaptive Management Plan. Grand Teton National Park.
MetroCount (2014). MetroCount Traffic Data Specialists. Retrieved from: http://metrocount.com/, 6
June 2014.
Miovision (2014). Miovision: Rethink Traffic. Retrieved from: http://miovision.com/, 6 June 2014.
Monz, C.A., D’Antonio, A., & Heaslip, K. (2014). Moose-Wilson Corridor Use Levels, Types, Patterns
and Impacts in Grand Teton National Park: Final Data Collection Plan Summer/Fall 2014.
Pettebone, D., Newman, P., & Lawson, S. (2010). Estimating visitor use at attraction sites and trailheads
in Yosemite National Park using automated visitor counters. Landscape and Urban Planning, 97, 229-
238.
Reconyx, Inc. (2014). Reconyx Products: Cameras. Retrieved from:
http://www.reconyx.com/shop/Cameras/118, 6 June 2014.

PAGE 128 OF 128
TRAFx Research Ltd. (2014). TRAFx Products: Vehicle Counters. Retrieved from:
http://www.trafx.net/products.htm#vehicle-counter, 6 June 2014.
Xia, J., & Arrowsmith, C.A. (2008). Techniques for counting and tracking the spatial and temporal
movement of visitors. Monitoring, Simulation, and Management of Visitor Landscapes, 85-105.
Figure 13: Panoramic of the Teton Range as viewed from the Moose-Wilson Road (photo by Ashley D’Antonio).