Embed Size (px)
Citation preview

Moody’s view – sovereigns and banks
Flash overview
Belgrade, November 2012 Petr Vins, General Manager, CEE

Belgrade, November 2012
Agenda
Sovereigns - our current view on the global economy
Potential effects on Central and Eastern Europe
Linkage to Developing countries too
Banks – recent changes in ratings
Inverse gap: Can a subsidiary be stronger than the parent bank ?
What is different: 2009 vs 2013

Belgrade, November 2012
Sovereigns – Moody’s current view 1
Belgrade, November 2012
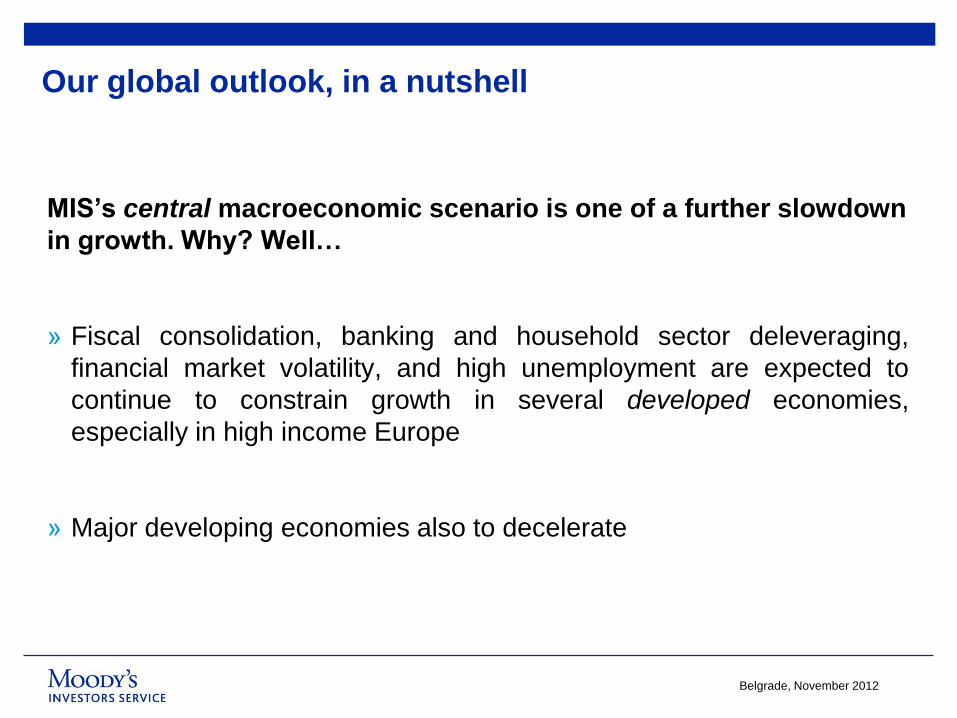
Our global outlook, in a nutshell
MIS’s central macroeconomic scenario is one of a further slowdown
in growth. Why? Well…
» Fiscal consolidation, banking and household sector deleveraging,
financial market volatility, and high unemployment are expected to
continue to constrain growth in several developed economies,
especially in high income Europe
» Major developing economies also to decelerate

Belgrade, November 2012
Our 2012-2013 forecasts: The World
-8
-3
2
7
12
China Euro Area Japan US WorldSource: Moody's

Belgrade, November 2012
2012-2013 forecasts: Adding some granularity
Growth
central
range
Unemploy
ment
central
range
Growth
central
range
Unemploy
ment
central
range
Argentina 3.5/4.5 -- 3.5/4.5 --
Australia 2.5/3.5 5.0/6.0 3.0/4.0 4.5/5.5
Brazil 1.5/2.5 -- 3.0/4.0 --
Canada 1.5/2.5 7.0/8.0 2.0/3.0 6.5/7.5
China 7.0/8.0 -- 7.0/8.0 --
Euro area -1.0/0.0 -- 0.5/1.5 --
France -0.5/0.5 9.5/10.5 0.5/1.5 9.5/10.5
Germany 0.0/1.0 5.5/6.5 1.0/2.0 5.5/6.5
India 5.5/6.5 -- 6.5/7.5 --
Indonesia 5.5/6.5 -- 6.0/7.0 --
Italy -2.5/-1.5 9.5/10.5 -1.5/0.0 9.5/10.5
Japan 1.5/2.5 4.0/5.0 1.0/2.0 4.0/5.0
Mexico 3.0/4.0 -- 3.0/4.0 --
Russia 3.0/4.0 -- 3.5/4.5 --
Saudi Arabia 5.0/6.0 -- 3.5/4.5
South Africa 2.5/3.5 -- 3.0/4.0 --
South Korea 2.5/3.5 3.0/4.0 3.5/4.5 3.0/4.0
Turkey 2.0/3.0 -- 3.5/4.5 --
UK -0.5/0.5 8.0/9.0 1.5/2.5 8.0/9.0
US 1.5/2.5 8.0/9.0 2.0/3.0 7.5/8.5
Countries
2012F 2013F

Belgrade, November 2012
2012-2013 forecasts: GDP growth, BRICs
-10
-5
0
5
10
15
Brazil China India Russia

Belgrade, November 2012
Regional Rating Trends: Negative in Europe, Positive in Latin America
Sovereign Rating at the on-set of the crisis, December 2007
So
ve
reig
n R
ati
ng
as
of
Ap
ril
20
12
0
5
10
15
20
25
America
Asia-Pacific
Europe
LatAm
MEA
Aaa Aa1 Aa2 Aa3 A1 A2 A3 Baa1 Baa2 Baa3 Ba1 Ba2 Ba3 B1 B2 B3 Caa1 Caa2 Caa3 C
Aaa
Aa1
Aa2
Aa3
A1
A2
A3
Baa1
Baa2
Baa3
Ba1
Ba2
Ba3
B1
B2
B3
Caa1
Caa2
Caa3
C

Belgrade, November 2012
Adjustment in Europe far from being complete…
75
80
85
90
95
100
105
110P
re-C
risis
Quarter,
T-1
9
Pre
-Cri
sis
Quarter,
T-1
8
Pre
-Cri
sis
Quarter,
T-1
7
Pre
-Cri
sis
Quarter,
T-1
6
Pre
-Cri
sis
Quarter,
T-1
5
Pre
-Cri
sis
Quarter,
T-1
4
Pre
-Cri
sis
Quarter,
T-1
3
Pre
-Cri
sis
Quarter,
T-1
2
Pre
-Cri
sis
Quarter,
T-1
1
Pre
-Cri
sis
Quarter,
T-1
0
Pre
-Cri
sis
Quarter,
T-9
Pre
-Cri
sis
Quarter,
T-8
Pre
-Cri
sis
Quarter,
T-7
Pre
-Cri
sis
Quarter,
T-6
Pre
-Cri
sis
Quarter,
T-5
Pre
-Cri
sis
Quarter,
T-4
Pre
-Cri
sis
Quarter,
T-3
Pre
-Cri
sis
Quarter,
T-2
Pre
-Cri
sis
Quarter,
T-1
Pre
-Cri
sis
Quarter,
T
Cri
sis
Quarter,
T
Cri
sis
Quarter,
T+1
Cri
sis
Quarter,
T+2
Cri
sis
Quarter,
T+3
Cri
sis
Quarter,
T+4
Cri
sis
Quarter,
T+5
Cri
sis
Quarter,
T+6
Cri
sis
Quarter,
T+7
Cri
sis
Quarter,
T+8
Cri
sis
Quarter,
T+9
Cri
sis
Quarter,
T+10
Cri
sis
Quarter,
T+11
Cri
sis
Quarter,
T+12
Cri
sis
Quarter,
T+13
Cri
sis
Quarter,
T+14
Cri
sis
Quarter,
T+15
Cri
sis
Quarter,
T+16
Cri
sis
Quarter,
T+17
Cri
sis
Quarter,
T+18
Cri
sis
Quarter,
T+19
Cri
sis
Quarter,
T+20
Cri
sis
Quarter,
T+21
Cri
sis
Quarter,
T+22
Cri
sis
Quarter,
T+23
Cri
sis
Quarter,
T+24
Cri
sis
Quarter,
T+25
Cri
sis
Quarter,
T+26
Cri
sis
Quarter,
T+27
Sweden Finland Portugal Ireland Greece Spain Italy
Crisis began Sweden regains pre-crisisGDP level (in 17 quarters)
Finland regainspre-crisis GDPlevel (in 27quarters)
Source: HAVER

Belgrade, November 2012
Potential effects on Central and Eastern Europe 2
Belgrade, November 2012
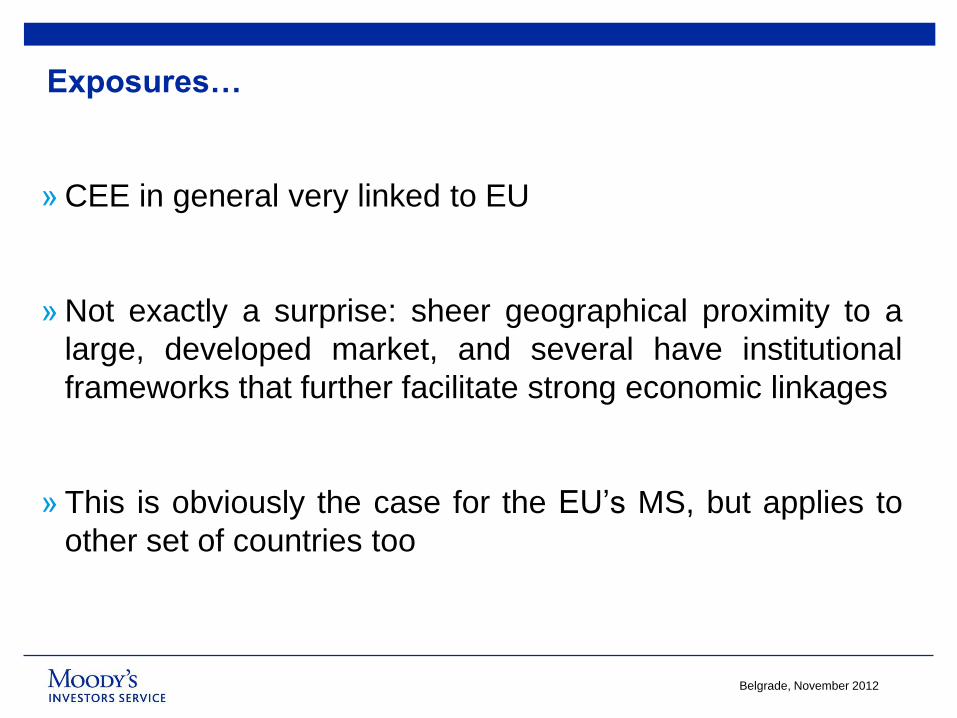
Exposures…
» CEE in general very linked to EU
» Not exactly a surprise: sheer geographical proximity to a
large, developed market, and several have institutional
frameworks that further facilitate strong economic linkages
» This is obviously the case for the EU’s MS, but applies to
other set of countries too

Belgrade, November 2012
And by how much? Trade…
X as a GDP%
X to EU as a
GDP%
X to EA as a GDP
%
X to EA5 as a
GDP %
Avg. 47.6 33.5 22.8 4.1
Bulgaria 43.2 25.9 18.8 7.5
Czech Rep. 59.0 49.1 38.8 4.2
Hungary 71.0 52.9 38.5 6.0
Latvia 37.9 25.0 11.8 0.9
Lithuania 56.8 33.5 17.8 2.0
Poland 35.3 26.9 18.7 3.1
Romania 30.0 20.8 15.6 5.1
Avg. 21.7 12.6 10.1 5.1
Avg. 31.9 12.0 8.2 3.9
Sources: EUROSTAT, DG TRADE, IMF, UNECE
EU's MS
EU's ACs
European Neighbourhood

Belgrade, November 2012
And by how much? FDI…
EU % of FDI EA % of FDI EA5 % of FDI
Avg. 84.3 71.8 6.0
Bulgaria 88.8 87.4 9.1
Czech Republic 89.0 84.3 4.7
Hungary 77.4 74.5 1.7
Latvia 77.7 51.0 1.4
Lithuania 80.2 41.0 0.5
Poland 86.5 78.2 10.3
Romania 90.7 86.2 13.9
Avg. 76.0 64.3 16.9
Avg. 46.8 30.2 1.2
EU's MS
EU's ACs
European Neighbourhood
Sources: EUROSTAT, WIIW, national central banks and statistical
offices

Belgrade, November 2012
And by how much? Bank flows…
EU EA EA5
Avg. 57.7 43.5 14.3
Bulgaria 59.2 58.3 37.7
Czech Republic 83.9 81.8 7.9
Hungary 70.5 67.9 16.2
Latvia 60.8 6.7 2.8
Lithuania 40.5 5.6 1.2
Poland 46.7 43.1 17.6
Romania 42.0 41.1 16.6
Avg. 45.5 44.8 20.9
Avg. 6.6 5.9 2.0
Source: IMF, BIS.
EU's MS
EU's ACs
European Neighbourhood

Belgrade, November 2012
Linkage to Developing countries too 3
Belgrade, November 2012
Other “Transitions”….
» Exposures should and can change, in reply to both:
1. Structural changes (the ―secular trend‖ of greater
economic clout for Developing nations)…
2. …and cyclical factors (the ongoing cyclical weakness in
the EU/EA)
» But has this happened?
Belgrade, November 2012
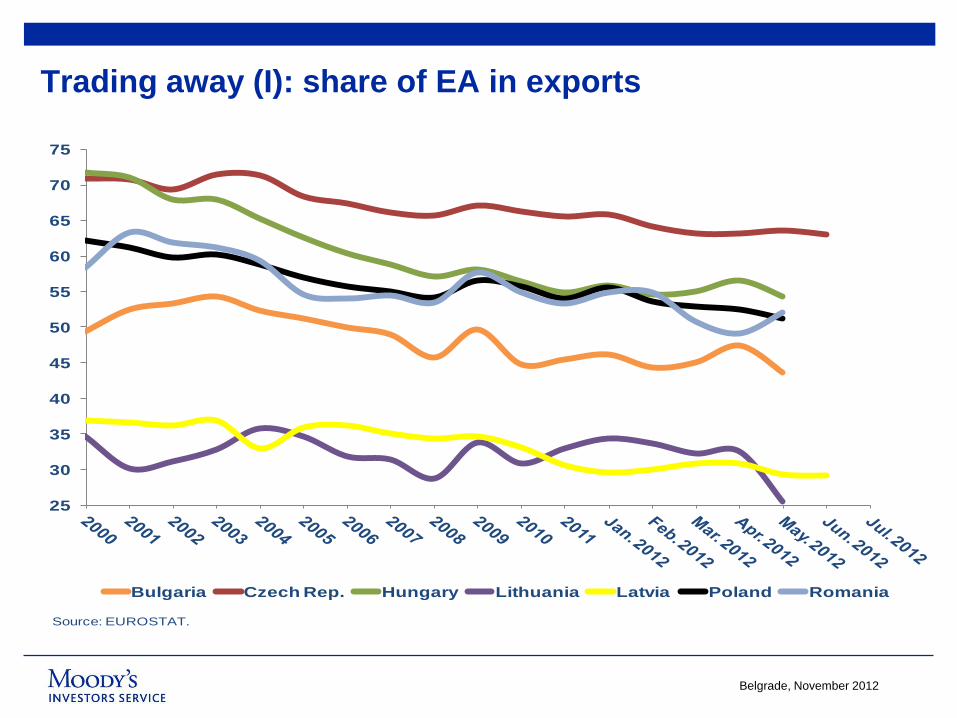
Trading away (I): share of EA in exports
25
30
35
40
45
50
55
60
65
70
75
Bulgaria Czech Rep. Hungary Lithuania Latvia Poland Romania
Source: EUROSTAT.
Belgrade, November 2012
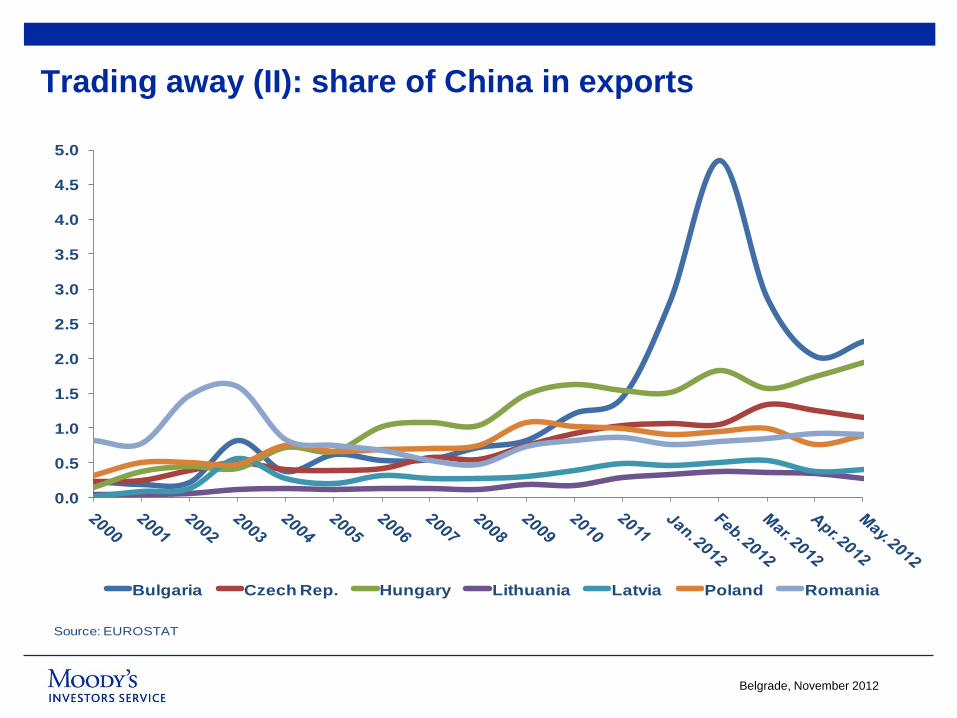
Trading away (II): share of China in exports
0.0
0.5
1.0
1.5
2.0
2.5
3.0
3.5
4.0
4.5
5.0
Bulgaria Czech Rep. Hungary Lithuania Latvia Poland Romania
Source: EUROSTAT

Belgrade, November 2012
Trading away (II): share of the Western CIS in exports
0
5
10
15
20
25
30
35
Bulgaria Czech Rep. Hungary Lithuania Latvia Poland Romania
Source: EUROSTAT

Belgrade, November 2012
Well, not yet
» ..and likely to continue…
» But there is really no escape the conclusion that, for the
foreseeable future, the EU will remain being the largest
―external shock‖ that the CEE countries will have to deal
with

Belgrade, November 2012
Examples of Moody’s rated entities in CEE – moves in 2011
Quality of credit Moody's Example
Gilt-edged Aaa
Aa1
Very high Aa2
Aa3 M6 Duna (BSS)
INVESTMENT A1
Slovenia, Czech Rep., Slovakia, Estonia, Prague, CS, SID Banka, SPP
GRADE Upper-medium A2 Poland, CEZ, PKO BP, Tatrabanka, Warsaw
A3 PGE, Telek. Polska, Elering, Poznan, Tallinn
Baa1 Lithuania, Telco Slovenije, Ceske drahy, Energa
Medium grade Baa2 Bulgaria, BVS, BPH Bank
Baa3 Croatia, Latvia, Romania, Transelectrica,
BCR, BRD, Raiff RO & Raiff BG, DSK, Zagreb
Ba1 Hungary, PKN Orlen, Hidroelectrica , NLB, NKBM
SPECULATIVE Questionable Ba2 OTP Bank, K&H Bank, Getin Noble Bank,
GRADE Ba3
Montenegro, Corp. Com. Bank, City of Novi Sad, CET 21 (SS), FHB Bank
B1 Albania, NWR, AVG, TVN, Atlas Bank, Veles
Poor quality B2 Bosnia, Agrokor, Credins Bank, BKT, PBG
B3 Baltic Int. Bank, Trasta Komercbanka, CME, CEDC
Caa1
Very poor or Caa2 Zlomrex
in default Caa3 Petrol BG
Ca
C
* As of December 2011
21
21
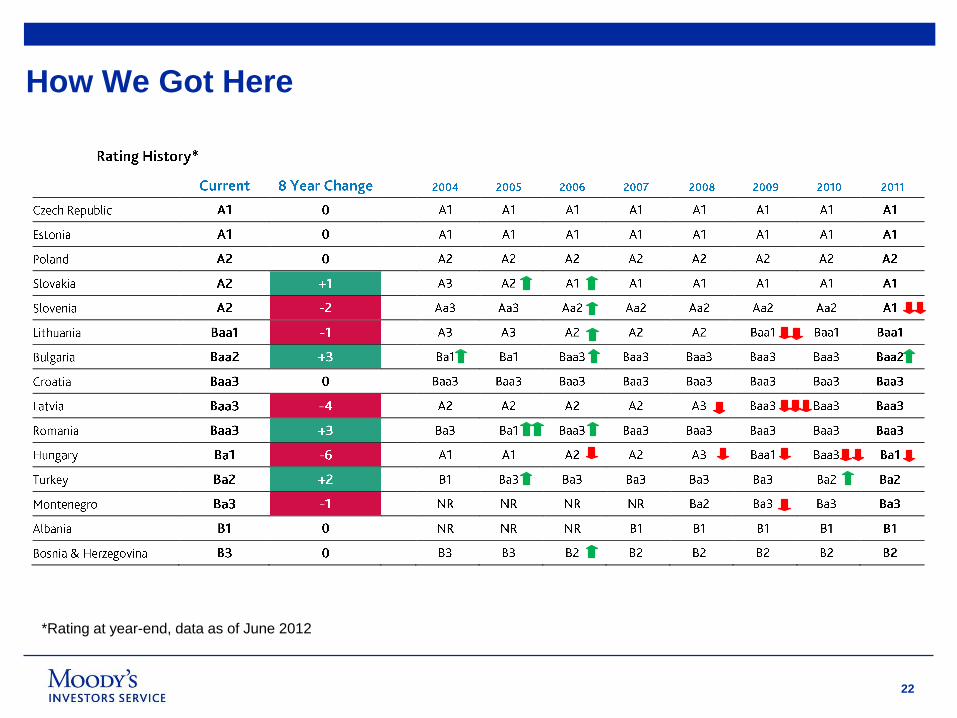
22
*Rating at year-end, data as of June 2012
How We Got Here

23
Where to NOW...?
0
200
400
600
800
1000
1200
1400
Ja
n-0
8
Ma
r-0
8
Ma
y-0
8
Ju
l-0
8
Se
p-0
8
Nov-0
8
Ja
n-0
9
Ma
r-0
9
Ma
y-0
9
Ju
l-0
9
Se
p-0
9
No
v-0
9
Ja
n-1
0
Ma
r-1
0
Ma
y-1
0
Ju
l-1
0
Se
p-1
0
Nov-1
0
Ja
n-1
1
Ma
r-11
Ma
y-1
1
Ju
l-11
Se
p-1
1
Nov-1
1
Ja
n-1
2
Ma
r-1
2
Ma
y-1
2
CEE Credit Default Swaps
Median Max Min
?
Source: Bloomberg
?
? ?

24
A “New Normal” For CEE
2
3
4
5
6
7
25 30 35 40 45 50
Inte
res
t P
aym
en
t (%
of
Re
ve
nu
e)
Gen. Gov. Debt (% of GDP)
CEE Key Debt Metrics
2011
2010
2009
2008
2007 2006
2005
2004
2012F 2013F
The New Normal
Source: Eurostat and Official National Sources

Belgrade, November 2012
Banks – recent changes in ratings 4

26
0,7
1,9 0,7 1,4 0,7
2,4
2,0
0,6
0,6
1,3
1,9 2,0
1,3 1,4
1,6 0,5
0,8 0,7
Jan 2011 Current Jan 2011 Current Jan 2011 Current Jan 2011 Current Jan 2011 Current
Czech Slovakia Poland Romania Hungary
Standalone Baseline Credit Assessment Uplift from parental support Uplift from systemic support
Aaa
Aa2
A1
A3
Baa2
Ba1
Ba3
B2
Caa1
Caa3
Rating developments in the CEE in 2012… » …principally driven by parental downgrades affecting the supported ratings
of CEE subsidiaries
» – Reduction in uplift from parental support
Investment grade

27
Parental support considerations:
» How we define parental support?
– Financial strength of the parent (expressed as stand-alone rating) …
…and resulting willingness and capacity to support subsidiaries
» What constrains parental support in the current market?
– Regulatory pressures on capital and liquidity on parent banks
– Parents’ strategic priorities are shifting towards national / domestic markets
– Long-term potential of some foreign markets is reassessed under new funding conditions
Moody's view: when resources are limited parent banks will prioritise their core franchise
at the expense of foreign operations
28
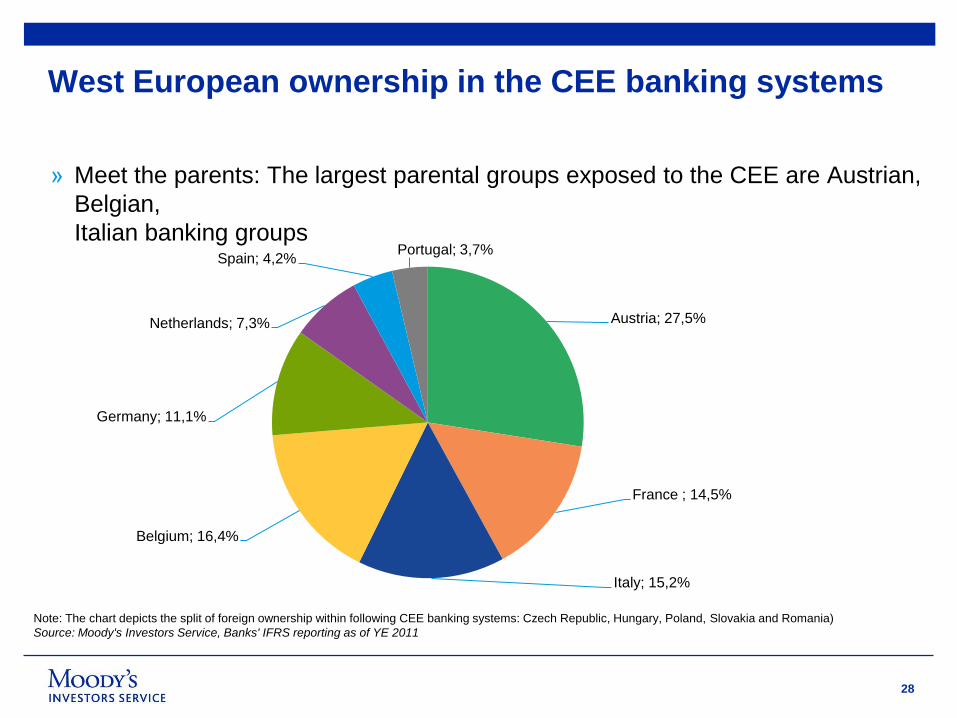
West European ownership in the CEE banking systems
» Meet the parents: The largest parental groups exposed to the CEE are Austrian,
Belgian,
Italian banking groups
Austria; 27,5%
France ; 14,5%
Italy; 15,2%
Belgium; 16,4%
Germany; 11,1%
Netherlands; 7,3%
Spain; 4,2% Portugal; 3,7%
Note: The chart depicts the split of foreign ownership within following CEE banking systems: Czech Republic, Hungary, Poland, Slovakia and Romania)
Source: Moody's Investors Service, Banks' IFRS reporting as of YE 2011
29
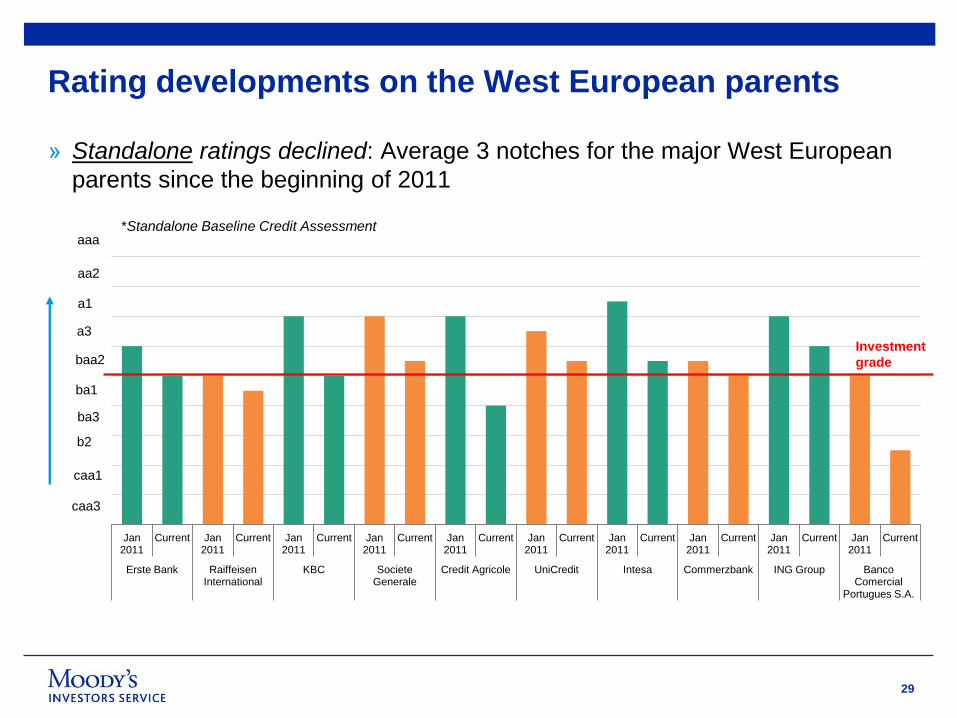
Jan 2011
Current Jan 2011
Current Jan 2011
Current Jan 2011
Current Jan 2011
Current Jan 2011
Current Jan 2011
Current Jan 2011
Current Jan 2011
Current Jan 2011
Current
Erste Bank Raiffeisen International
KBC Societe Generale
Credit Agricole UniCredit Intesa Commerzbank ING Group Banco Comercial
Portugues S.A.
aaa
aa2
a1
a3
baa2
ba1
ba3
b2
caa1
caa3
Investment
grade
Rating developments on the West European parents
» Standalone ratings declined: Average 3 notches for the major West European
parents since the beginning of 2011
*Standalone Baseline Credit Assessment
30
Inverse gap: Can a subsidiary be stronger than the parent bank? 5

31
Can I do better than my parent bank?
» For the ―Inverse Gap‖ Moody's considers inter alia:
– Sub’s domestic market is insulated from the macro pressures affecting the parent
– Ownership structure and board composition - representation of the other stakeholders, minorities
– Brand association, risk management and shared client-base with the parent
– Strength of standalone independent franchise of the subsidiary
– Exposure to the parent on the both sides of the balance sheet
– Funding structure of the subsidiary / nature of intercompany transactions
– Strong regulatory ring-fencing from undue parental interference / capital repatriation
– Not formulaic model – case-by-case basis

32
CEE subsidiaries that are higher rated on a stand-alone basis vs parent banks
Moody’s view: Fully delinking parent/sub ratings may be impossible to achieve in practice
– Can the subsidiary survive if the parent defaults – group-wide contagion?
– Severely underperforming parents may drag down well-performing individual subsidiaries in the
current market
b2
ba2
baa2 baa1
ba1
baa2
baa3
baa1 baa2
baa1
baa3
baa1
UniCredit Bank Spa
Pekao SA Erste Bank Group
Ceska Sporitelna
Societe Generale
Komercni Banka
KBC Bank N.V.
CSOB Raiffeisen Bank
International
Tatra Banka Banco Comercial Portugues
Bank Millennium
*Standalone Baseline Credit Assessment
33
What is different: 2009 vs 2013 6
34
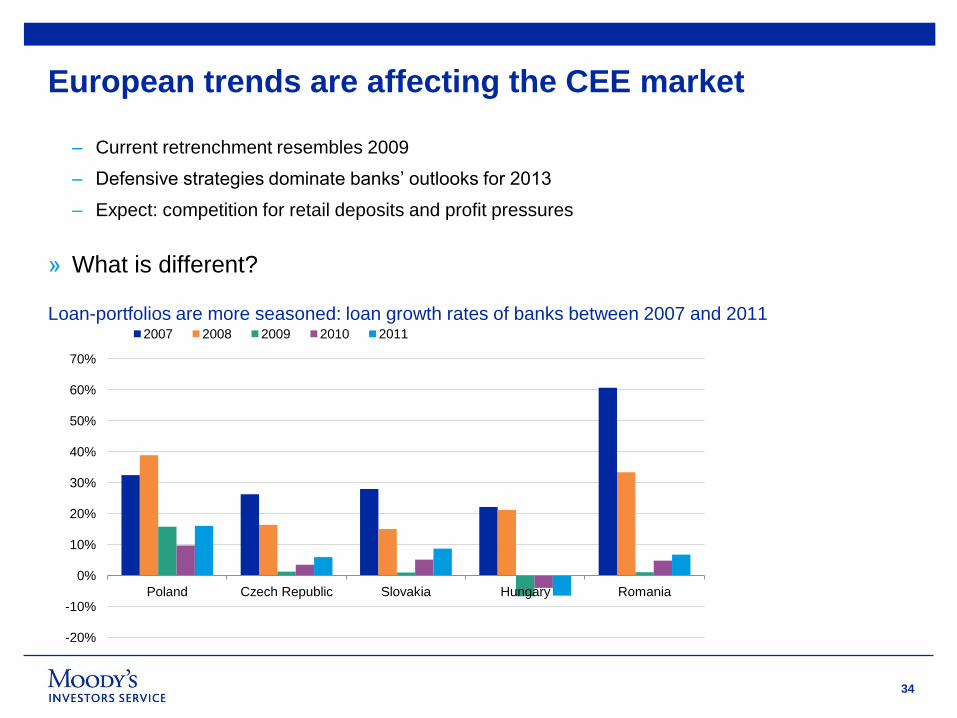
European trends are affecting the CEE market
– Current retrenchment resembles 2009
– Defensive strategies dominate banks’ outlooks for 2013
– Expect: competition for retail deposits and profit pressures
» What is different?
Loan-portfolios are more seasoned: loan growth rates of banks between 2007 and 2011
-20%
-10%
0%
10%
20%
30%
40%
50%
60%
70%
Poland Czech Republic Slovakia Hungary Romania
2007 2008 2009 2010 2011
35
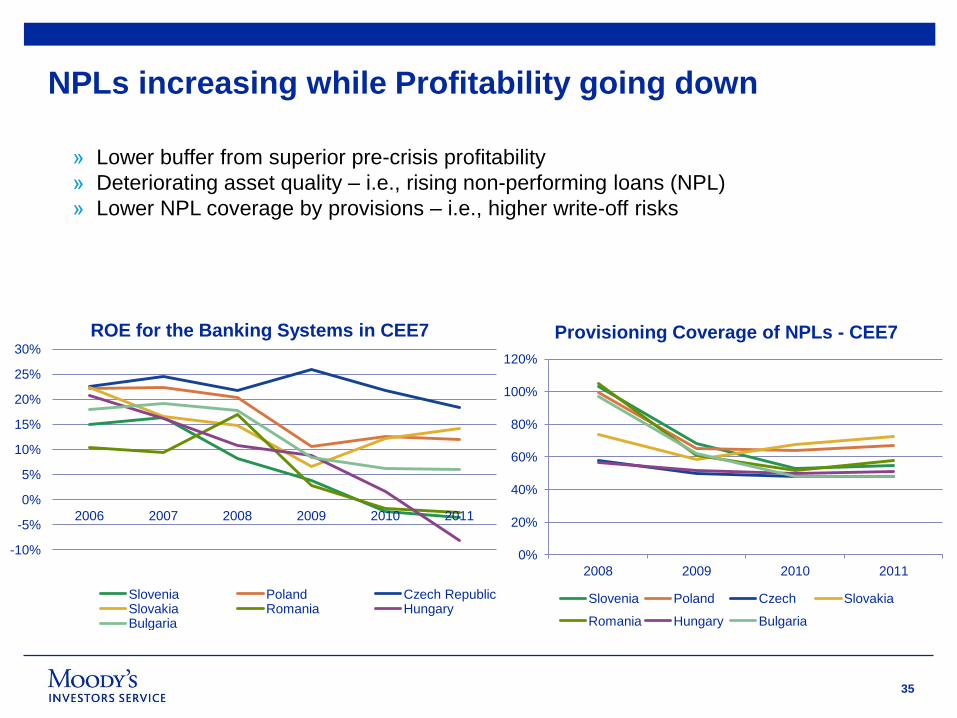
NPLs increasing while Profitability going down
» Lower buffer from superior pre-crisis profitability
» Deteriorating asset quality – i.e., rising non-performing loans (NPL)
» Lower NPL coverage by provisions – i.e., higher write-off risks
-10%
-5%
0%
5%
10%
15%
20%
25%
30%
2006 2007 2008 2009 2010 2011
Slovenia Poland Czech Republic Slovakia Romania Hungary Bulgaria
ROE for the Banking Systems in CEE7
0%
20%
40%
60%
80%
100%
120%
2008 2009 2010 2011
Provisioning Coverage of NPLs - CEE7
Slovenia Poland Czech Slovakia
Romania Hungary Bulgaria

36
European trends are affecting the CEE market
Both capital and liquidity ratios of CEE banks are more robust 2008 vs. 20011
-25%
-20%
-15%
-10%
-5%
0%
5%
10%
15%
20%
0%
2%
4%
6%
8%
10%
12%
14%
16%
18%
2008 2011 2008 2011 2008 2011 2008 2011 2008 2011
Czech Republic Slovakia Poland Romania Hungary
Capital Adequacy Ratio (Market Funds - Liquid Assets) / Total Assets
- NB – decline in the (market funds-liquid assets)/Total asset ratios means improvement in the liquidity
position

37
European trends are affecting the CEE market
Moody's view: 2013 compared with 2009
– Three stronger banking systems (Czech, Poland, Slovak) have enhanced internal capacity to
weather the expected retrenchment
– Hungary and Romania will be weighed down longer - Western parents are not
generous anymore
– However, the shock from external environment could be even more profound in 2013 vs 2009

38
Summary – key takeaway messages
» Parental rating actions were decisive in affecting ratings of the CEE
subsidiaries in 2012
» On average the parental support has become more selective i.e. pushing the
subs towards increased independence
» European wide retrenchment is influencing the strategies (and ratings) of the
CEE subs in 2013
» Some of CEE banks can maintain stronger credit profiles compared to the
parents under special circumstances
» In the next year:
– The three leading banking systems have internal buffers to deal with the retrenchment
– The two struggling systems will remain underperforming longer
– However, external shock from the EU turmoil can be long-lasting compared to the initial stages of
the crisis
39
Petr Vins
General Manager, CEE
T +420 – 224.222.929
Katerina Blahutova
Associate Business Development
T +420 – 221.666.362

40
© 2012 Moody’s Investors Service, Inc. and/or its licensors and affiliates (collectively, ―MOODY’S‖). All rights reserved.
CREDIT RATINGS ISSUED BY MOODY'S INVESTORS SERVICE, INC. (―MIS‖) AND ITS AFFILIATES ARE MOODY’S CURRENT OPINIONS OF THE RELATIVE FUTURE CREDIT RISK OF ENTITIES,
CREDIT COMMITMENTS, OR DEBT OR DEBT-LIKE SECURITIES, AND CREDIT RATINGS AND RESEARCH PUBLICATIONS PUBLISHED BY MOODY’S (―MOODY’S PUBLICATIONS‖) MAY INCLUDE
MOODY’S CURRENT OPINIONS OF THE RELATIVE FUTURE CREDIT RISK OF ENTITIES, CREDIT COMMITMENTS, OR DEBT OR DEBT-LIKE SECURITIES. MOODY’S DEFINES CREDIT RISK AS THE
RISK THAT AN ENTITY MAY NOT MEET ITS CONTRACTUAL, FINANCIAL OBLIGATIONS AS THEY COME DUE AND ANY ESTIMATED FINANCIAL LOSS IN THE EVENT OF DEFAULT. CREDIT
RATINGS DO NOT ADDRESS ANY OTHER RISK, INCLUDING BUT NOT LIMITED TO: LIQUIDITY RISK, MARKET VALUE RISK, OR PRICE VOLATILITY. CREDIT RATINGS AND MOODY’S OPINIONS
INCLUDED IN MOODY’S PUBLICATIONS ARE NOT STATEMENTS OF CURRENT OR HISTORICAL FACT. CREDIT RATINGS AND MOODY’S PUBLICATIONS DO NOT CONSTITUTE OR PROVIDE
INVESTMENT OR FINANCIAL ADVICE, AND CREDIT RATINGS AND MOODY’S PUBLICATIONS ARE NOT AND DO NOT PROVIDE RECOMMENDATIONS TO PURCHASE, SELL, OR HOLD
PARTICULAR SECURITIES. NEITHER CREDIT RATINGS NOR MOODY’S PUBLICATIONS COMMENT ON THE SUITABILITY OF AN INVESTMENT FOR ANY PARTICULAR INVESTOR. MOODY’S
ISSUES ITS CREDIT RATINGS AND PUBLISHES MOODY’S PUBLICATIONS WITH THE EXPECTATION AND UNDERSTANDING THAT EACH INVESTOR WILL MAKE ITS OWN STUDY AND
EVALUATION OF EACH SECURITY THAT IS UNDER CONSIDERATION FOR PURCHASE, HOLDING, OR SALE.
ALL INFORMATION CONTAINED HEREIN IS PROTECTED BY LAW, INCLUDING BUT NOT LIMITED TO, COPYRIGHT LAW, AND NONE OF SUCH INFORMATION MAY BE COPIED OR OTHERWISE
REPRODUCED, REPACKAGED, FURTHER TRANSMITTED, TRANSFERRED,
DISSEMINATED, REDISTRIBUTED OR RESOLD, OR STORED FOR SUBSEQUENT USE FOR ANY SUCH PURPOSE, IN WHOLE OR IN PART, IN ANY FORM OR MANNER OR BY ANY MEANS
WHATSOEVER, BY ANY PERSON WITHOUT MOODY’S PRIOR WRITTENCONSENT.
All information contained herein is obtained by MOODY’S from sources believed by it to be accurate and reliable. Because of the possibility of human or mechanical error as well as other factors, however, all
information contained herein is provided ―AS IS‖ without warranty of any kind. MOODY'S adopts all necessary measures so that the information it uses in assigning a credit rating is of sufficient quality and from
sources MOODY'S considers to be reliable including, when appropriate, independent third-party sources. However, MOODY’S is not an auditor and cannot in every instance independently verify or validate
information received in the rating process. Under no circumstances shall MOODY’S have any liability to any person or entity for (a) any loss or damage in whole or in part caused by, resulting from, or relating
to, any error (negligent or otherwise) or other circumstance or contingency within or outside the control of MOODY’S or any of its directors, officers, employees or agents in connection with the procurement,
collection, compilation, analysis, interpretation, communication, publication or delivery of any such information, or (b) any direct, indirect, special, consequential, compensatory or incidental damages
whatsoever (including without limitation, lost profits), even if MOODY’S is advised in advance of the possibility of such damages, resulting from the use of or inability to use, any such information. The ratings,
financial reporting analysis, projections, and other observations, if any, constituting part of the information contained herein are, and must be construed solely as, statements of opinion and not statements of
fact or recommendations to purchase, sell or hold any securities. Each user of the information contained herein must make its own study and evaluation of each security it may consider purchasing, holding or
selling.
NO WARRANTY, EXPRESS OR IMPLIED, AS TO THE ACCURACY, TIMELINESS, COMPLETENESS, MERCHANTABILITY OR FITNESS FOR ANY PARTICULAR PURPOSE OF ANY SUCH RATING OR
OTHER OPINION OR INFORMATION IS GIVEN OR MADE BY MOODY’S IN ANY FORM OR MANNER WHATSOEVER.
MIS, a wholly-owned credit rating agency subsidiary of Moody’s Corporation (―MCO‖), hereby discloses that most issuers of debt securities (including corporate and municipal bonds, debentures, notes and
commercial paper) and preferred stock rated by MIS have, prior to assignment of any rating, agreed to pay to MIS for appraisal and rating services rendered by it fees ranging from $1,500 to approximately
$2,500,000. MCO and MIS also maintain policies and procedures to address the independence of MIS’s ratings and rating processes. Information regarding certain affiliations that may exist between directors
of MCO and rated entities, and between entities who hold ratings from MIS and have also publicly reported to the SEC an ownership interest in MCO of more than 5%, is posted annually at www.moodys.com
under the heading ―Shareholder Relations — Corporate Governance — Director and Shareholder Affiliation Policy.‖
Any publication into Australia of this document is by MOODY’S affiliate, Moody’s Investors Service Pty Limited ABN 61 003 399 657, which holds Australian Financial Services License no. 336969. This
document is intended to be provided only to ―wholesale clients‖ within the meaning of section 761G of the Corporations Act 2001. By continuing to access this document from within Australia, you represent to
MOODY’S that you are, or are accessing the document as a representative of, a ―wholesale client‖ and that neither you nor the entity you represent will directly or indirectly disseminate this document or its
contents to ―retail clients‖ within the meaning of section 761G of the Corporations Act 2001.
Notwithstanding the foregoing, credit ratings assigned on and after October 1, 2010 by Moody’s Japan K.K. (―MJKK‖) are MJKK’s current opinions of the relative future credit risk of entities, credit commitments,
or debt or debt-like securities. In such a case, ―MIS‖ in the foregoing statements shall be deemed to be replaced with ―MJKK‖. MJKK is a wholly-owned credit rating agency subsidiary of Moody's Group Japan
G.K., which is wholly owned by Moody’s Overseas Holdings Inc., a wholly-owned subsidiary of MCO.
This credit rating is an opinion as to the creditworthiness of a debt obligation of the issuer, not on the equity securities of the issuer or any form of security that is available to retail investors. It would be
dangerous for retail investors to make any investment decision based on this credit rating. If in doubt you should contact your financial or other professional adviser.