Embed Size (px)
Citation preview
For data requests, please contact:Moody's Global Client [email protected]
CONTACTS
This monthly report contains collateral performance metrics for 41 structured finance sectors around the world: 12 asset classes in
September 30, 2010
1 March 2013
Global Structured Finance Collateral Performance Review
Please send comments, questions, andrequests to be on our distribution list to:[email protected]
This monthly report contains collateral performance metrics for 41 structured finance sectors around the world: 12 asset classes in the US, 19 in Europe, seven in Japan, two in Australia and one in Canada. The report contains typical aggregate performance metrics such as delinquencies and losses, as well as sector‐specific metrics such as residential and commercial property prices, loans in special servicing, refinancing profiles, average WARF levels, senior OC levels, payment rates, and excess spread. We also include the underlying data, as well as sector commentary and outlooks, and projected losses by vintage where applicable.
Print All TabsPrint All Tabs

More about the report
Who should I contact to be added to the distribution list?
What is Moody's RMBS Loss Tracker?
How does the report differ from what is currently offered in the market?
Where can I get more information on an index?
Moody's Global Structured Finance Collateral Performance Review presents the underlying collateral performance o
What does the report offer?
Why do cumulative losses sometimes decline at the end of the seasoning curve?
When is the report available?
How is the data as-of date defined?What is the data source behind each index?
Table of Contents
Page # Title As of Date Report Frequency Contacts3 US Subprime RMBS Dez 12 Monthly Peter McNally Debash Chatterjee Amita Shrivastava4 US Alt-A RMBS Dez 12 Monthly Peter McNally Debash Chatterjee Amita Shrivastava5 US Option ARM RMBS Dez 12 Monthly Peter McNally Debash Chatterjee Amita Shrivastava6 US Jumbo RMBS Dez 12 Monthly Peter McNally Debash Chatterjee Amita Shrivastava7 US Subprime CES RMBS Dez 12 Monthly Peter McNally Debash Chatterjee Amita Shrivastava8 US Prime CES RMBS Dez 12 Monthly Peter McNally Debash Chatterjee Amita Shrivastava9 US HELOC RMBS Dez 12 Monthly Peter McNally Debash Chatterjee Amita Shrivastava
10 US Home Prices Jan 13 Monthly Peter McNally Debash Chatterjee Amita Shrivastava11 UK NC RMBS Nov 12 Quarterly Johannes Ebner Barbara Rismondo12 UK Prime RMBS Nov 12 Quarterly Johannes Ebner Barbara Rismondo13 Spanish RMBS Dez 12 Quarterly Johannes Ebner Barbara Rismondo14 Dutch RMBS Dez 12 Quarterly Johannes Ebner Barbara Rismondo15 Italian RMBS Nov 12 Quarterly Johannes Ebner Barbara Rismondo16 Irish RMBS Okt 12 Quarterly Johannes Ebner Barbara Rismondo17 South African RMBS Sep 12 Semi-annually Johannes Ebner Barbara Rismondo18 Greek RMBS Nov 12 Quarterly Johannes Ebner Barbara Rismondo19 UK Buy-To-Let RMBS Nov 12 Quarterly Johannes Ebner Barbara Rismondo20 Portuguese RMBS Okt 12 Quarterly Johannes Ebner Barbara Rismondo21 German RMBS Okt 12 Semi-annually Johannes Ebner Barbara Rismondo22 French RMBS Sep 12 Semi-annually Johannes Ebner Barbara Rismondo23 Belgian RMBS Dez 12 Semi-annually Johannes Ebner Barbara Rismondo24 European Home Prices Jan 13 Monthly Johannes Ebner25 Japanese RMBS Dez 12 Monthly Mieko Nakamura26 Australian Prime RMBS Dez 12 Monthly Bryan Reid27 Australian Non-conforming RMBS Dez 12 Monthly Bryan Reid28 Australian Home Prices Jan 13 Monthly Bryan Reid29 US CMBS Jan 13 Monthly Kevin Fagan30 EMEA CMBS Feb 13 Quarterly Viola Karoly31 Japanese CMBS Jan 13 Monthly Koji Kumamaru32 US Autos - prime Dez 12 Monthly Sarah Huang McGinnis Caldwell33 EMEA Autos Nov 12 Quarterly Johannes Ebner Carole Gintz34 US Cards (part1) Jan 13 Monthly Sarah Huang Jeff Hibbs35 US Cards (part2) Jan 13 Monthly Sarah Huang Jeff Hibbs36 UK Cards (part1) Nov 12 Quarterly Johannes Ebner Alex Cataldo37 UK Cards (part2) Nov 12 Quarterly Johannes Ebner Alex Cataldo38 Canadian Cards (part1) Mrz 12 Quarterly Raymond Lai39 Canadian Cards (part2) Mrz 12 Quarterly Raymond Lai40 US Private Student Loan Sep 12 Quarterly Sarah Huang Tracy Rice41 Spanish ABS SME Sep 12 Quarterly Johannes Ebner Carole Gintz42 European Consumer Loan Okt 12 Quarterly Johannes Ebner Carole Gintz43 Italian Leasing Jul 12 Quarterly Johannes Ebner Carole Gintz44 Japanese ABS Dez 12 Monthly Mieko Nakamura45 Global CLOs (part1) Dez 12 Monthly Oktay Veliev Min Xu Guillaume Jolivet46 Global CLOs (part2) Dez 12 Monthly Oktay Veliev Min Xu Guillaume Jolivet
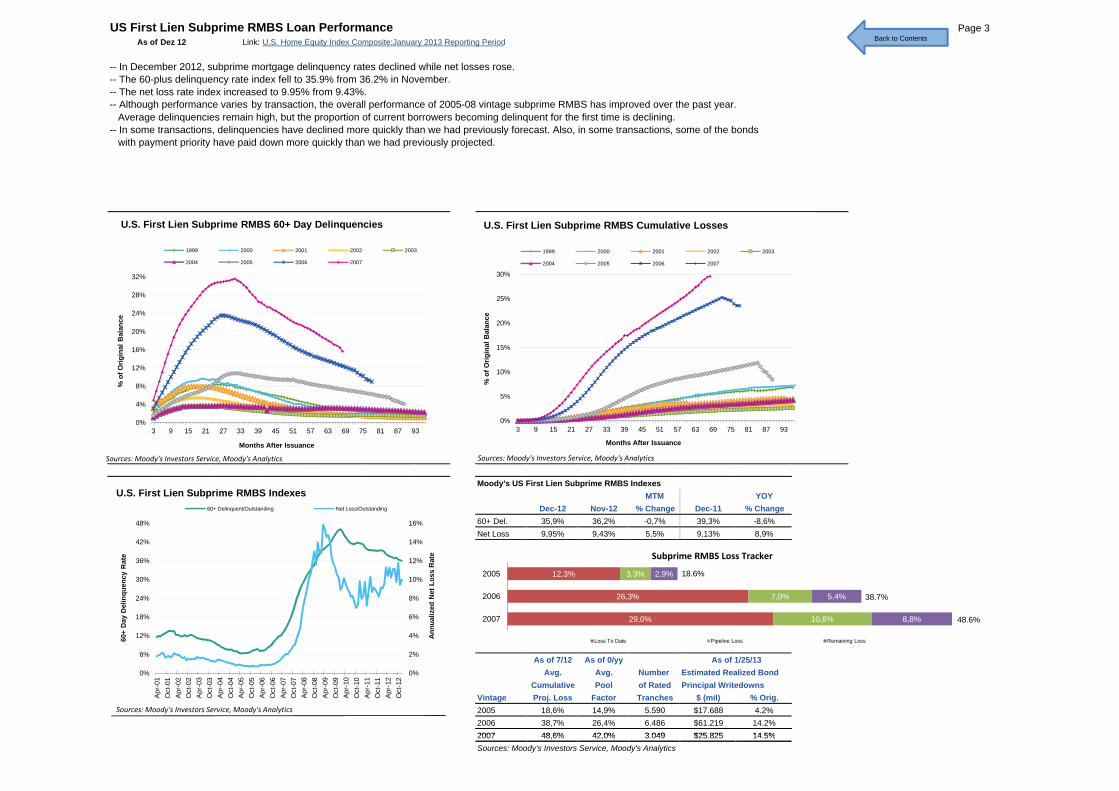
US First Lien Subprime RMBS Loan Performance Page 3As of Dez 12 Link: U.S. Home Equity Index Composite:January 2013 Reporting Period
-- In December 2012, subprime mortgage delinquency rates declined while net losses rose.-- The 60-plus delinquency rate index fell to 35.9% from 36.2% in November.-- The net loss rate index increased to 9.95% from 9.43%.-- Although performance varies by transaction, the overall performance of 2005-08 vintage subprime RMBS has improved over the past year. Average delinquencies remain high, but the proportion of current borrowers becoming delinquent for the first time is declining. -- In some transactions, delinquencies have declined more quickly than we had previously forecast. Also, in some transactions, some of the bonds with payment priority have paid down more quickly than we had previously projected.
8%
12%
16%
20%
24%
28%
32%
% o
f Orig
inal
Bal
ance
U.S. First Lien Subprime RMBS 60+ Day Delinquencies
1999 2000 2001 2002 2003
2004 2005 2006 2007
10%
15%
20%
25%
30%
% o
f Orig
inal
Bal
ance
U.S. First Lien Subprime RMBS Cumulative Losses
1999 2000 2001 2002 2003
2004 2005 2006 2007
Back to Contents
Moody's US First Lien Subprime RMBS IndexesMTM YOY
Dec-12 Nov-12 % Change Dec-11 % Change60+ Del. 35,9% 36,2% -0,7% 39,3% -8,6%Net Loss 9,95% 9,43% 5,5% 9,13% 8,9%
As of 7/12 As of 0/yyAvg. Avg. Number Estimated Realized Bond
Cumulative Pool of Rated Principal WritedownsVintage Proj. Loss Factor Tranches $ (mil) % Orig.2005 18,6% 14,9% 5.590 $17.688 4.2%2006 38,7% 26,4% 6.486 $61.219 14.2%2007 48 6% 42 0% 3 049 $25 825 14 5%
As of 1/25/13
0%
4%
8%
12%
3 9 15 21 27 33 39 45 51 57 63 69 75 81 87 93
% o
f Ori
Months After Issuance
0%
5%
10%
3 9 15 21 27 33 39 45 51 57 63 69 75 81 87 93
% o
f Or
Months After Issuance
0%
2%
4%
6%
8%
10%
12%
14%
16%
0%
6%
12%
18%
24%
30%
36%
42%
48%
Apr-
01O
ct-0
1Ap
r-02
Oct
-02
Apr-
03O
ct-0
3Ap
r-04
Oct
-04
Apr-
05O
ct-0
5Ap
r-06
Oct
-06
Apr-
07O
ct-0
7Ap
r-08
Oct
-08
Apr-
09O
ct-0
9Ap
r-10
Oct
-10
Apr-
11O
ct-1
1Ap
r-12
Oct
-12
Ann
ualiz
ed N
et L
oss
Rat
e
60+
Day
Del
inqu
ency
Rat
e
U.S. First Lien Subprime RMBS Indexes60+ Delinquent/Outstanding Net Loss/Outstanding
Sources: Moody's Investors Service, Moody's Analytics
12,3%
26,3%
29,0%
3,3%
7,0%
10,8%
2,9%
5,4%
8,8%
2005
2006
2007
Subprime RMBS Loss Tracker
Loss To Date Pipeline Loss Remaining Loss
18.6%
38.7%
48.6%
Sources: Moody's Investors Service, Moody's Analytics Sources: Moody's Investors Service, Moody's Analytics
2007 48,6% 42,0% 3.049 $25.825 14.5%Sources: Moody's Investors Service, Moody's Analytics
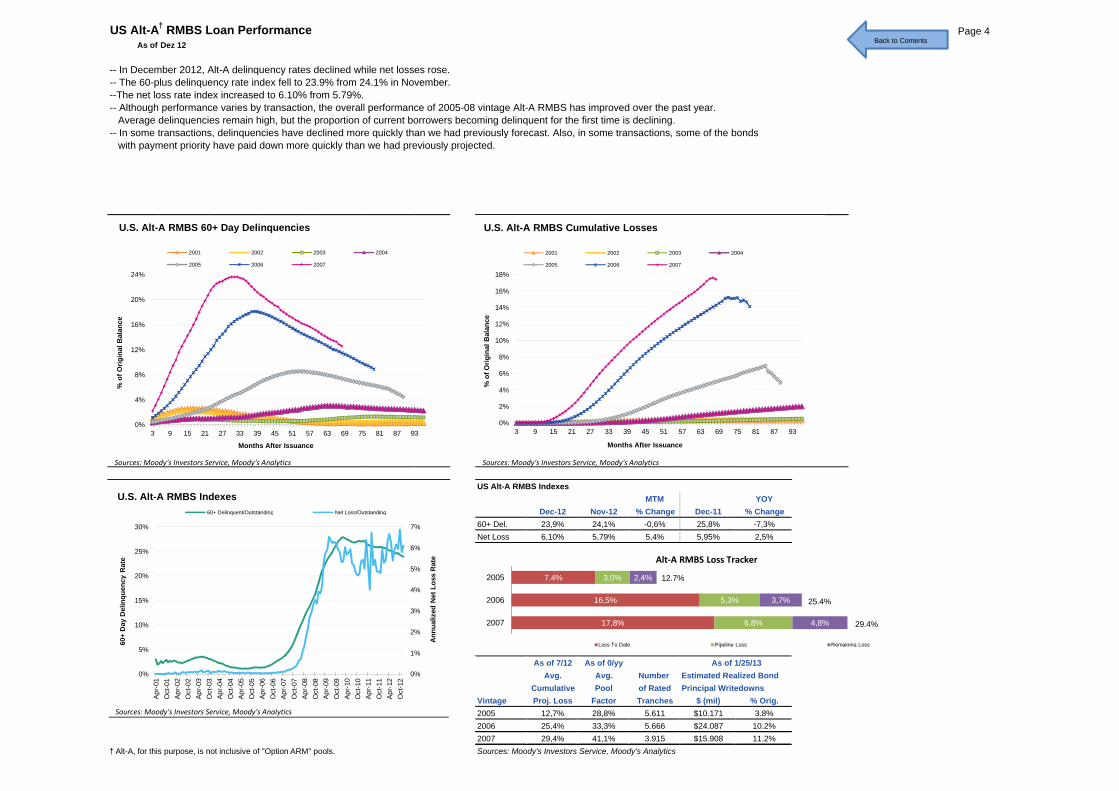
US Alt-A† RMBS Loan Performance Page 4As of Dez 12
-- In December 2012, Alt-A delinquency rates declined while net losses rose.-- The 60-plus delinquency rate index fell to 23.9% from 24.1% in November.--The net loss rate index increased to 6.10% from 5.79%.-- Although performance varies by transaction, the overall performance of 2005-08 vintage Alt-A RMBS has improved over the past year. Average delinquencies remain high, but the proportion of current borrowers becoming delinquent for the first time is declining. -- In some transactions, delinquencies have declined more quickly than we had previously forecast. Also, in some transactions, some of the bonds with payment priority have paid down more quickly than we had previously projected.
8%
12%
16%
20%
24%
of O
rigin
al B
alan
ce
U.S. Alt-A RMBS 60+ Day Delinquencies
2001 2002 2003 2004
2005 2006 2007
6%
8%
10%
12%
14%
16%
18%
of O
rigin
al B
alan
ce
U.S. Alt-A RMBS Cumulative Losses
2001 2002 2003 2004
2005 2006 2007
Back to Contents
US Alt-A RMBS IndexesMTM YOY
Dec-12 Nov-12 % Change Dec-11 % Change60+ Del. 23,9% 24,1% -0,6% 25,8% -7,3%Net Loss 6,10% 5,79% 5,4% 5,95% 2,5%
As of 7/12 As of 0/yyAvg. Avg. Number Estimated Realized Bond
Cumulative Pool of Rated Principal WritedownsVintage Proj. Loss Factor Tranches $ (mil) % Orig.2005 12,7% 28,8% 5.611 $10.171 3.8%2006 25,4% 33,3% 5.666 $24.087 10.2%
% % $ %
As of 1/25/13
7,4%
16,5%
17,8%
3,0%
5,3%
6,8%
2,4%
3,7%
4,8%
2005
2006
2007
Alt‐A RMBS Loss Tracker
Loss To Date Pipeline Loss Remaining Loss
12.7%
25.4%
29.4%
0%
4%
8%
12%
3 9 15 21 27 33 39 45 51 57 63 69 75 81 87 93
% o
f Orig
in
Months After Issuance
0%
2%
4%
6%
8%
3 9 15 21 27 33 39 45 51 57 63 69 75 81 87 93
% o
f Orig
in
Months After Issuance
0%
1%
2%
3%
4%
5%
6%
7%
0%
5%
10%
15%
20%
25%
30%
Apr-
01O
ct-0
1Ap
r-02
Oct
-02
Apr-
03O
ct-0
3Ap
r-04
Oct
-04
Apr-
05O
ct-0
5Ap
r-06
Oct
-06
Apr-
07O
ct-0
7Ap
r-08
Oct
-08
Apr-
09O
ct-0
9Ap
r-10
Oct
-10
Apr-
11O
ct-1
1Ap
r-12
Oct
-12
Ann
ualiz
ed N
et L
oss
Rat
e
60+
Day
Del
inqu
ency
Rat
e
U.S. Alt-A RMBS Indexes60+ Delinquent/Outstanding Net Loss/Outstanding
Sources: Moody's Investors Service, Moody's Analytics
Sources: Moody's Investors Service, Moody's Analytics Sources: Moody's Investors Service, Moody's Analytics
2007 29,4% 41,1% 3.915 $15.908 11.2%† Alt-A, for this purpose, is not inclusive of "Option ARM" pools. Sources: Moody's Investors Service, Moody's Analytics
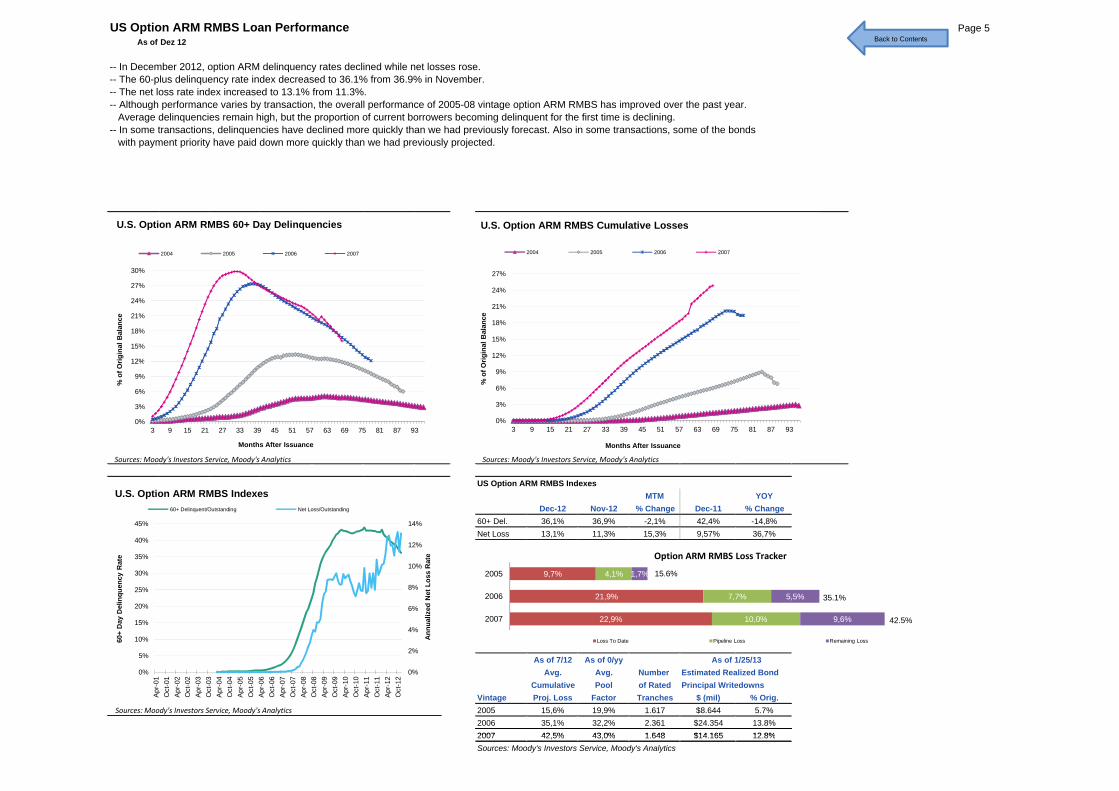
US Option ARM RMBS Loan Performance Page 5As of Dez 12
-- In December 2012, option ARM delinquency rates declined while net losses rose.-- The 60-plus delinquency rate index decreased to 36.1% from 36.9% in November.-- The net loss rate index increased to 13.1% from 11.3%.-- Although performance varies by transaction, the overall performance of 2005-08 vintage option ARM RMBS has improved over the past year. Average delinquencies remain high, but the proportion of current borrowers becoming delinquent for the first time is declining. -- In some transactions, delinquencies have declined more quickly than we had previously forecast. Also in some transactions, some of the bonds with payment priority have paid down more quickly than we had previously projected.
9%
12%
15%
18%
21%
24%
27%
30%
% o
f Orig
inal
Bal
ance
U.S. Option ARM RMBS 60+ Day Delinquencies
2004 2005 2006 2007
6%
9%
12%
15%
18%
21%
24%
27%
% o
f Orig
inal
Bal
ance
U.S. Option ARM RMBS Cumulative Losses
2004 2005 2006 2007
Back to Contents
US Option ARM RMBS IndexesMTM YOY
Dec-12 Nov-12 % Change Dec-11 % Change60+ Del. 36,1% 36,9% -2,1% 42,4% -14,8%Net Loss 13,1% 11,3% 15,3% 9,57% 36,7%
As of 7/12 As of 0/yyAvg. Avg. Number Estimated Realized Bond
Cumulative Pool of Rated Principal WritedownsVintage Proj. Loss Factor Tranches $ (mil) % Orig.2005 15,6% 19,9% 1.617 $8.644 5.7%2006 35,1% 32,2% 2.361 $24.354 13.8%2007 42 5% 43 0% 1 648 $14 165 12 8%
As of 1/25/13
0%
3%
6%
9%
12%
3 9 15 21 27 33 39 45 51 57 63 69 75 81 87 93
% o
f Or
Months After Issuance
0%
3%
6%
9%
3 9 15 21 27 33 39 45 51 57 63 69 75 81 87 93
% o
f Or
Months After Issuance
0%
2%
4%
6%
8%
10%
12%
14%
0%
5%
10%
15%
20%
25%
30%
35%
40%
45%
Apr-
01O
ct-0
1Ap
r-02
Oct
-02
Apr-
03O
ct-0
3Ap
r-04
Oct
-04
Apr-
05O
ct-0
5Ap
r-06
Oct
-06
Apr-
07O
ct-0
7Ap
r-08
Oct
-08
Apr-
09O
ct-0
9Ap
r-10
Oct
-10
Apr-
11O
ct-1
1Ap
r-12
Oct
-12
Ann
ualiz
ed N
et L
oss
Rat
e
60+
Day
Del
inqu
ency
Rat
e
U.S. Option ARM RMBS Indexes60+ Delinquent/Outstanding Net Loss/Outstanding
Sources: Moody's Investors Service, Moody's Analytics
9,7%
21,9%
22,9%
4,1%
7,7%
10,0%
1,7%
5,5%
9,6%
2005
2006
2007
Option ARM RMBS Loss Tracker
Loss To Date Pipeline Loss Remaining Loss
15.6%
35.1%
42.5%
Sources: Moody's Investors Service, Moody's Analytics Sources: Moody's Investors Service, Moody's Analytics
2007 42,5% 43,0% 1.648 $14.165 12.8%Sources: Moody's Investors Service, Moody's Analytics
US Jumbo RMBS Loan Performance Page 6As of Dez 12 Link: U.S. Jumbo Mortgage Credit Indexes: January 2013 Reporting Period
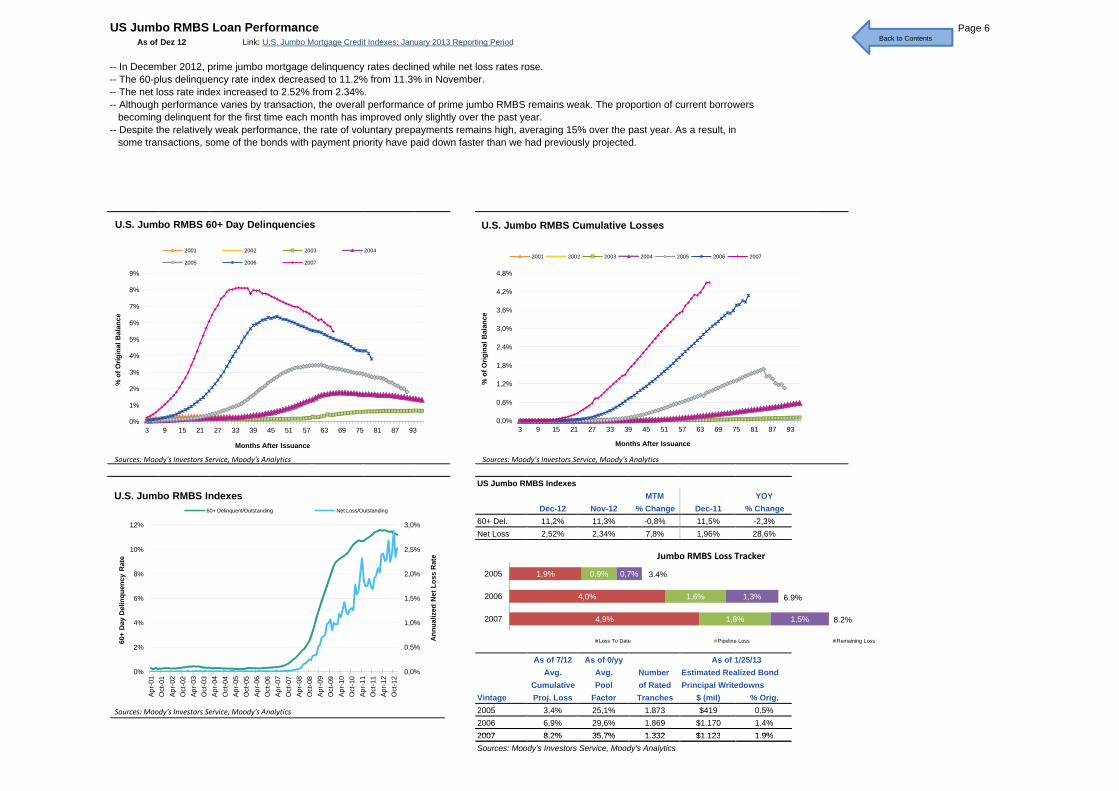
-- In December 2012, prime jumbo mortgage delinquency rates declined while net loss rates rose.-- The 60-plus delinquency rate index decreased to 11.2% from 11.3% in November.-- The net loss rate index increased to 2.52% from 2.34%. -- Although performance varies by transaction, the overall performance of prime jumbo RMBS remains weak. The proportion of current borrowers becoming delinquent for the first time each month has improved only slightly over the past year.-- Despite the relatively weak performance, the rate of voluntary prepayments remains high, averaging 15% over the past year. As a result, in some transactions, some of the bonds with payment priority have paid down faster than we had previously projected.
2%
3%
4%
5%
6%
7%
8%
9%
% o
f Orig
inal
Bal
ance
U.S. Jumbo RMBS 60+ Day Delinquencies
2001 2002 2003 2004
2005 2006 2007
1,2%
1,8%
2,4%
3,0%
3,6%
4,2%
4,8%
% o
f Orig
inal
Bal
ance
U.S. Jumbo RMBS Cumulative Losses
2001 2002 2003 2004 2005 2006 2007
Back to Contents
US Jumbo RMBS IndexesMTM YOY
Dec-12 Nov-12 % Change Dec-11 % Change60+ Del. 11,2% 11,3% -0,8% 11,5% -2,3%Net Loss 2,52% 2,34% 7,8% 1,96% 28,6%
As of 7/12 As of 0/yyAvg. Avg. Number Estimated Realized Bond
Cumulative Pool of Rated Principal WritedownsVintage Proj. Loss Factor Tranches $ (mil) % Orig.2005 3,4% 25,1% 1.873 $419 0.5%2006 6,9% 29,6% 1.869 $1.170 1.4%2007 8 2% 35 7% 1 332 $1 123 1 9%
As of 1/25/13
0%
1%
2%
3%
3 9 15 21 27 33 39 45 51 57 63 69 75 81 87 93
% o
f Or
Months After Issuance
0,0%
0,6%
1,2%
1,8%
3 9 15 21 27 33 39 45 51 57 63 69 75 81 87 93
% o
f Or
Months After Issuance
0,0%
0,5%
1,0%
1,5%
2,0%
2,5%
3,0%
0%
2%
4%
6%
8%
10%
12%
Apr-
01O
ct-0
1Ap
r-02
Oct
-02
Apr-
03O
ct-0
3Ap
r-04
Oct
-04
Apr-
05O
ct-0
5Ap
r-06
Oct
-06
Apr-
07O
ct-0
7Ap
r-08
Oct
-08
Apr-
09O
ct-0
9Ap
r-10
Oct
-10
Apr-
11O
ct-1
1Ap
r-12
Oct
-12
Ann
ualiz
ed N
et L
oss
Rat
e
60+
Day
Del
inqu
ency
Rat
e
U.S. Jumbo RMBS Indexes60+ Delinquent/Outstanding Net Loss/Outstanding
Sources: Moody's Investors Service, Moody's Analytics
1,9%
4,0%
4,9%
0,9%
1,6%
1,8%
0,7%
1,3%
1,5%
2005
2006
2007
Jumbo RMBS Loss Tracker
Loss To Date Pipeline Loss Remaining Loss
3.4%
6.9%
8.2%
Sources: Moody's Investors Service, Moody's Analytics Sources: Moody's Investors Service, Moody's Analytics
2007 8,2% 35,7% 1.332 $1.123 1.9%Sources: Moody's Investors Service, Moody's Analytics
US Subprime Closed-End Second Lien (CES) RMBS Loan Performance Page 7As of Dez 12
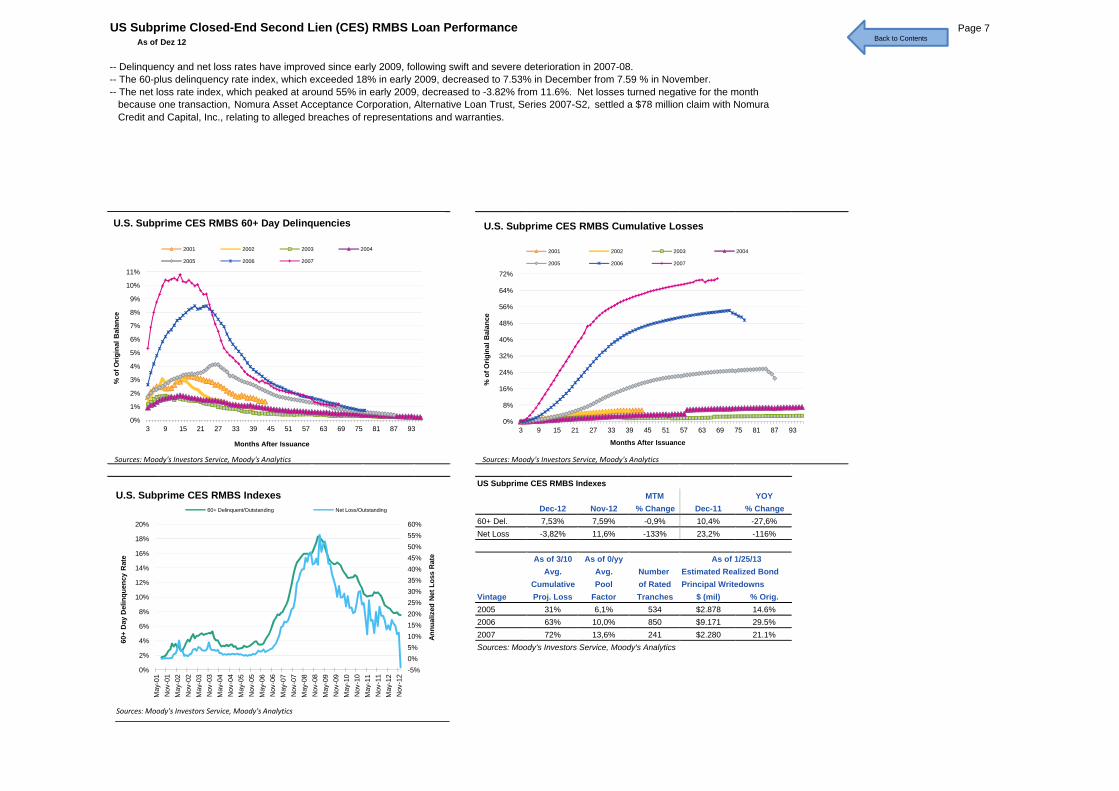
-- Delinquency and net loss rates have improved since early 2009, following swift and severe deterioration in 2007-08.-- The 60-plus delinquency rate index, which exceeded 18% in early 2009, decreased to 7.53% in December from 7.59 % in November.-- The net loss rate index, which peaked at around 55% in early 2009, decreased to -3.82% from 11.6%. Net losses turned negative for the month because one transaction, Nomura Asset Acceptance Corporation, Alternative Loan Trust, Series 2007-S2, settled a $78 million claim with Nomura Credit and Capital, Inc., relating to alleged breaches of representations and warranties.
3%
4%
5%
6%
7%
8%
9%
10%
11%
% o
f Orig
inal
Bal
ance
U.S. Subprime CES RMBS 60+ Day Delinquencies
2001 2002 2003 2004
2005 2006 2007
16%
24%
32%
40%
48%
56%
64%
72%
% o
f Orig
inal
Bal
ance
U.S. Subprime CES RMBS Cumulative Losses
2001 2002 2003 2004
2005 2006 2007
Back to Contents
US Subprime CES RMBS IndexesMTM YOY
Dec-12 Nov-12 % Change Dec-11 % Change60+ Del. 7,53% 7,59% -0,9% 10,4% -27,6%Net Loss -3,82% 11,6% -133% 23,2% -116%
As of 3/10 As of 0/yyAvg. Avg. Number Estimated Realized Bond
Cumulative Pool of Rated Principal WritedownsVintage Proj. Loss Factor Tranches $ (mil) % Orig.2005 31% 6,1% 534 $2.878 14.6%2006 63% 10,0% 850 $9.171 29.5%2007 72% 13,6% 241 $2.280 21.1%Sources: Moody's Investors Service, Moody's Analytics
As of 1/25/13
0%
1%
2%
3%
4%
3 9 15 21 27 33 39 45 51 57 63 69 75 81 87 93
% o
f Or
Months After Issuance
0%
8%
16%
24%
3 9 15 21 27 33 39 45 51 57 63 69 75 81 87 93
% o
f Or
Months After Issuance
-5%0%5%10%15%20%25%30%35%40%45%50%55%60%
0%
2%
4%
6%
8%
10%
12%
14%
16%
18%
20%
May
-01
Nov
-01
May
-02
Nov
-02
Ma y
-03
Nov
-03
May
-04
Nov
-04
May
-05
Nov
-05
May
-06
Nov
-06
May
-07
Nov
-07
May
-08
Nov
-08
Ma y
-09
Nov
-09
May
-10
Nov
-10
May
-11
Nov
-11
May
-12
Nov
-12
Ann
ualiz
ed N
et L
oss
Rat
e
60+
Day
Del
inqu
ency
Rat
e
U.S. Subprime CES RMBS Indexes60+ Delinquent/Outstanding Net Loss/Outstanding
Sources: Moody's Investors Service, Moody's Analytics
Sources: Moody's Investors Service, Moody's Analytics Sources: Moody's Investors Service, Moody's Analytics
US Prime Closed-End Second Lien (CES) RMBS Loan Performance Page 8As of Dez 12
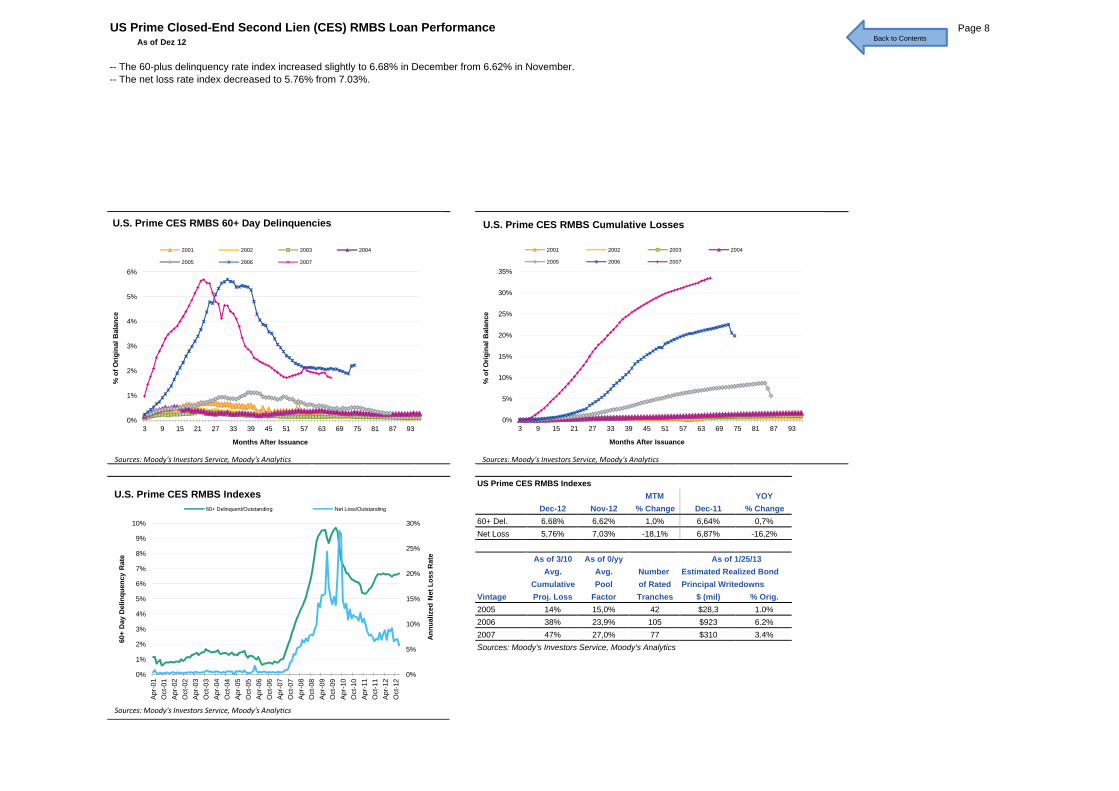
-- The 60-plus delinquency rate index increased slightly to 6.68% in December from 6.62% in November. -- The net loss rate index decreased to 5.76% from 7.03%.
2%
3%
4%
5%
6%
% o
f Orig
inal
Bal
ance
U.S. Prime CES RMBS 60+ Day Delinquencies
2001 2002 2003 2004
2005 2006 2007
10%
15%
20%
25%
30%
35%
% o
f Orig
inal
Bal
ance
U.S. Prime CES RMBS Cumulative Losses
2001 2002 2003 2004
2005 2006 2007
Back to Contents
US Prime CES RMBS IndexesMTM YOY
Dec-12 Nov-12 % Change Dec-11 % Change60+ Del. 6,68% 6,62% 1,0% 6,64% 0,7%Net Loss 5,76% 7,03% -18,1% 6,87% -16,2%
As of 3/10 As of 0/yyAvg. Avg. Number Estimated Realized Bond
Cumulative Pool of Rated Principal WritedownsVintage Proj. Loss Factor Tranches $ (mil) % Orig.2005 14% 15,0% 42 $28,3 1.0%2006 38% 23,9% 105 $923 6.2%2007 47% 27,0% 77 $310 3.4%Sources: Moody's Investors Service, Moody's Analytics
As of 1/25/13
0%
1%
2%
3 9 15 21 27 33 39 45 51 57 63 69 75 81 87 93
% o
f Or
Months After Issuance
0%
5%
10%
3 9 15 21 27 33 39 45 51 57 63 69 75 81 87 93
% o
f Or
Months After Issuance
0%
5%
10%
15%
20%
25%
30%
0%
1%
2%
3%
4%
5%
6%
7%
8%
9%
10%
Apr-
01O
ct-0
1Ap
r-02
Oct
-02
Apr-
03O
ct-0
3Ap
r-04
Oct
-04
Apr-
05O
ct-0
5Ap
r-06
Oct
-06
Apr-
07O
ct-0
7Ap
r-08
Oct
-08
Apr-
09O
ct-0
9Ap
r-10
Oct
-10
Apr-
11O
ct-1
1Ap
r-12
Oct
-12
Ann
ualiz
ed N
et L
oss
Rat
e
60+
Day
Del
inqu
ency
Rat
e
U.S. Prime CES RMBS Indexes60+ Delinquent/Outstanding Net Loss/Outstanding
Sources: Moody's Investors Service, Moody's Analytics
Sources: Moody's Investors Service, Moody's Analytics Sources: Moody's Investors Service, Moody's Analytics
US HELOC RMBS Loan Performance Page 9As of Dez 12
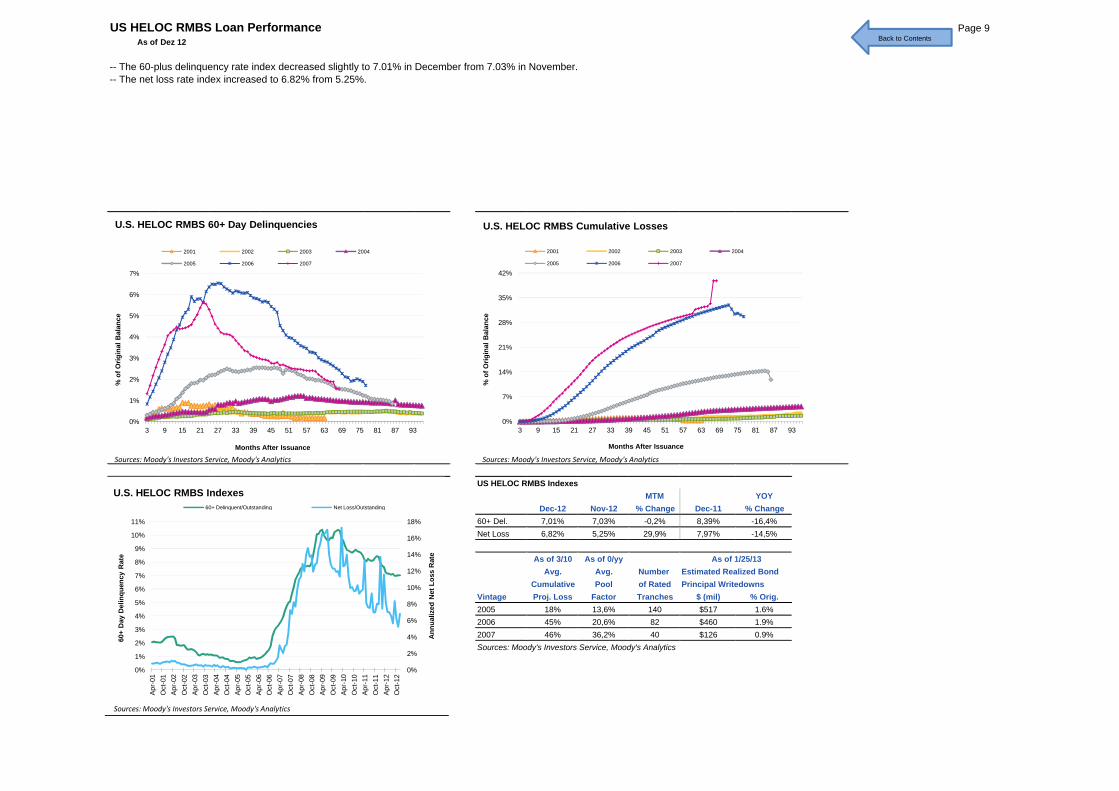
-- The 60-plus delinquency rate index decreased slightly to 7.01% in December from 7.03% in November.-- The net loss rate index increased to 6.82% from 5.25%.
2%
3%
4%
5%
6%
7%
% o
f Orig
inal
Bal
ance
U.S. HELOC RMBS 60+ Day Delinquencies
2001 2002 2003 2004
2005 2006 2007
14%
21%
28%
35%
42%
% o
f Orig
inal
Bal
ance
U.S. HELOC RMBS Cumulative Losses
2001 2002 2003 2004
2005 2006 2007
Back to Contents
US HELOC RMBS IndexesMTM YOY
Dec-12 Nov-12 % Change Dec-11 % Change60+ Del. 7,01% 7,03% -0,2% 8,39% -16,4%Net Loss 6,82% 5,25% 29,9% 7,97% -14,5%
As of 3/10 As of 0/yyAvg. Avg. Number Estimated Realized Bond
Cumulative Pool of Rated Principal WritedownsVintage Proj. Loss Factor Tranches $ (mil) % Orig.2005 18% 13,6% 140 $517 1.6%2006 45% 20,6% 82 $460 1.9%2007 46% 36,2% 40 $126 0.9%Sources: Moody's Investors Service, Moody's Analytics
As of 1/25/13
0%
1%
2%
3 9 15 21 27 33 39 45 51 57 63 69 75 81 87 93
% o
f Or
Months After Issuance
0%
7%
14%
3 9 15 21 27 33 39 45 51 57 63 69 75 81 87 93
% o
f Or
Months After Issuance
0%
2%
4%
6%
8%
10%
12%
14%
16%
18%
0%
1%
2%
3%
4%
5%
6%
7%
8%
9%
10%
11%
Apr-
01O
ct-0
1Ap
r-02
Oct
-02
Apr-
03O
ct-0
3Ap
r-04
Oct
-04
Apr-
05O
ct-0
5Ap
r-06
Oct
-06
Apr-
07O
ct-0
7Ap
r-08
Oct
-08
Apr-
09O
ct-0
9Ap
r-10
Oct
-10
Apr-
11O
ct-1
1Ap
r-12
Oct
-12
Ann
ualiz
ed N
et L
oss
Rat
e
60+
Day
Del
inqu
ency
Rat
e
U.S. HELOC RMBS Indexes60+ Delinquent/Outstanding Net Loss/Outstanding
Sources: Moody's Investors Service, Moody's Analytics
Sources: Moody's Investors Service, Moody's Analytics Sources: Moody's Investors Service, Moody's Analytics
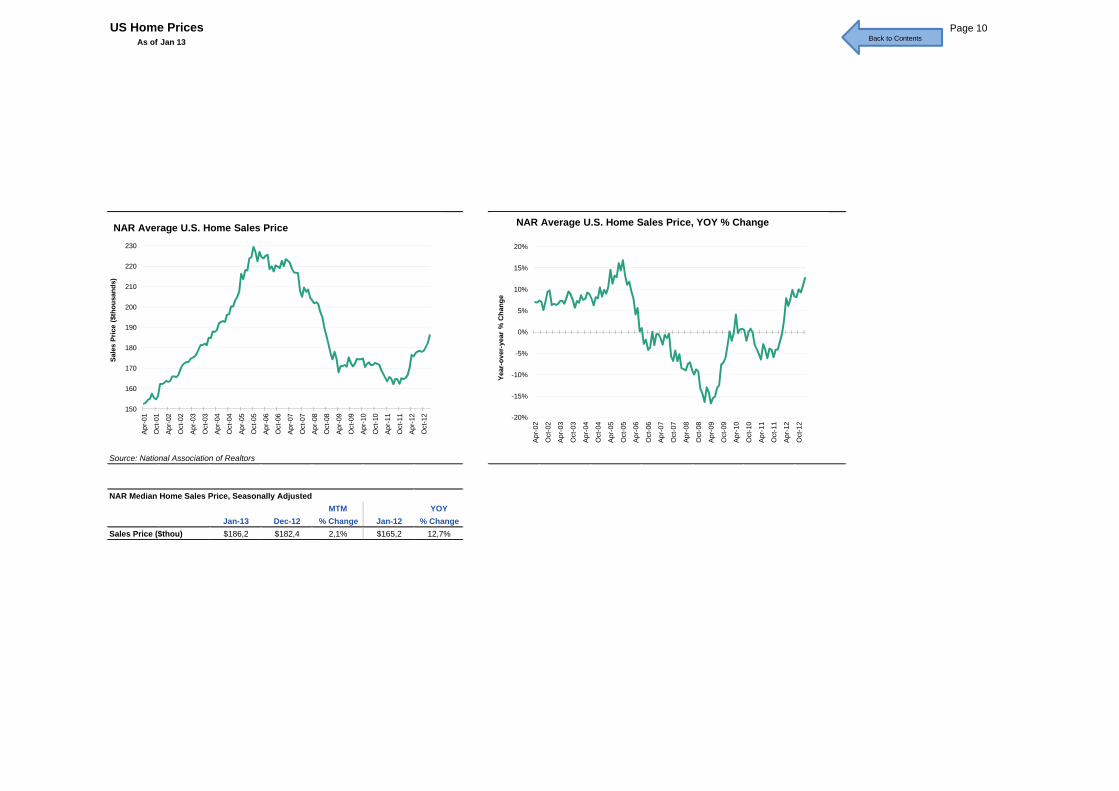
US Home Prices Page 10As of Jan 13
160
170
180
190
200
210
220
230
Sale
s Pr
ice
($th
ousa
nds)
NAR Average U.S. Home Sales Price
-10%
-5%
0%
5%
10%
15%
20%
Year
-ove
r-ye
ar %
Cha
nge
NAR Average U.S. Home Sales Price, YOY % Change
Back to Contents
Source: National Association of Realtors
NAR Median Home Sales Price, Seasonally AdjustedMTM YOY
Jan-13 Dec-12 % Change Jan-12 % ChangeSales Price ($thou) $186,2 $182,4 2,1% $165,2 12,7%
150
160
170
Apr-
01
Oct
-01
Apr-
02
Oct
-02
Apr-
03
Oct
-03
Apr-
04
Oct
-04
Apr-
05
Oct
-05
Apr-
06
Oct
-06
Apr-
07
Oct
-07
Apr-
08
Oct
-08
Apr-
09
Oct
-09
Apr-
10
Oct
-10
Apr-
11
Oct
-11
Apr-
12
Oct
-12
S
-20%
-15%
-10%
Apr-
02
Oct
-02
Apr-
03
Oct
-03
Apr-
04
Oct
-04
Apr-
05
Oct
-05
Apr-
06
Oct
-06
Apr-
07
Oct
-07
Apr-
08
Oct
-08
Apr-
09
Oct
-09
Apr-
10
Oct
-10
Apr-
11
Oct
-11
Apr-
12
Oct
-12
Year
- o
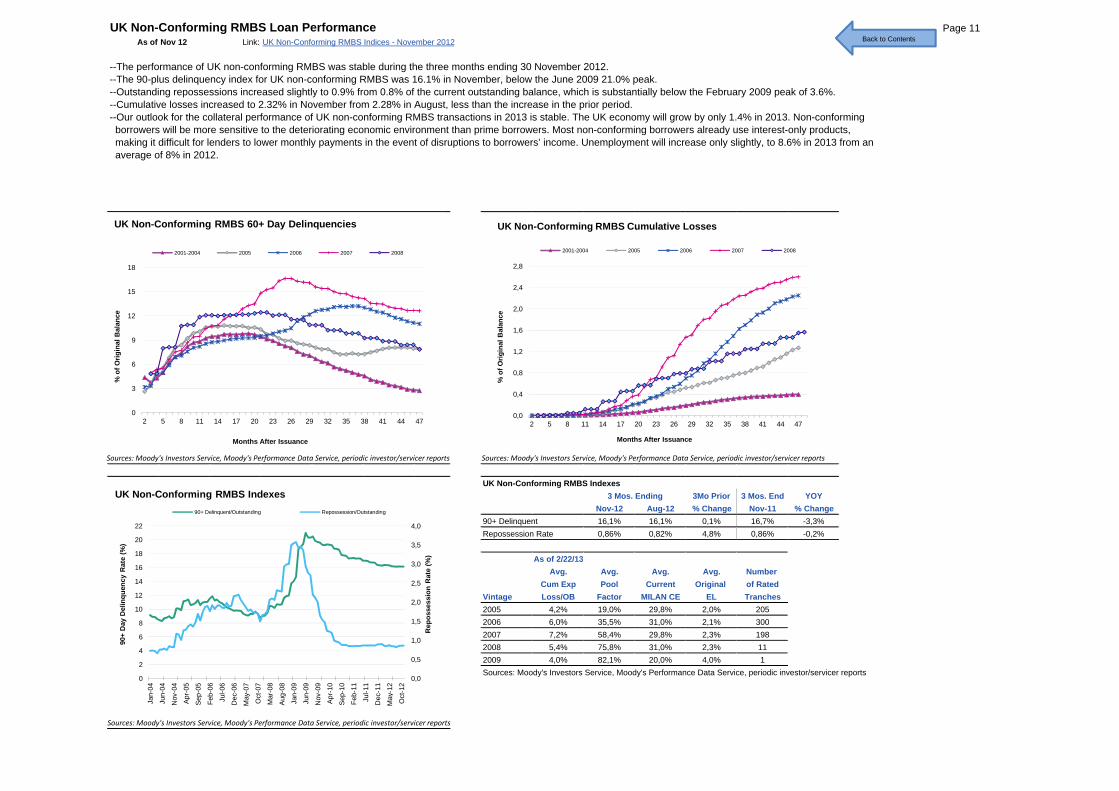
UK Non-Conforming RMBS Loan Performance Page 11As of Nov 12 Link: UK Non-Conforming RMBS Indices - November 2012
--The performance of UK non-conforming RMBS was stable during the three months ending 30 November 2012.--The 90-plus delinquency index for UK non-conforming RMBS was 16.1% in November, below the June 2009 21.0% peak.--Outstanding repossessions increased slightly to 0.9% from 0.8% of the current outstanding balance, which is substantially below the February 2009 peak of 3.6%.--Cumulative losses increased to 2.32% in November from 2.28% in August, less than the increase in the prior period.--Our outlook for the collateral performance of UK non-conforming RMBS transactions in 2013 is stable. The UK economy will grow by only 1.4% in 2013. Non-conforming borrowers will be more sensitive to the deteriorating economic environment than prime borrowers. Most non-conforming borrowers already use interest-only products, making it difficult for lenders to lower monthly payments in the event of disruptions to borrowers’ income. Unemployment will increase only slightly, to 8.6% in 2013 from an average of 8% in 2012.
3
6
9
12
15
18
% o
f Orig
inal
Bal
ance
UK Non-Conforming RMBS 60+ Day Delinquencies
2001-2004 2005 2006 2007 2008
0,8
1,2
1,6
2,0
2,4
2,8
% o
f Orig
inal
Bal
ance
UK Non-Conforming RMBS Cumulative Losses
2001-2004 2005 2006 2007 2008
Back to Contents
UK Non-Conforming RMBS Indexes3Mo Prior 3 Mos. End YOY
Nov-12 Aug-12 % Change Nov-11 % Change90+ Delinquent 16,1% 16,1% 0,1% 16,7% -3,3%Repossession Rate 0,86% 0,82% 4,8% 0,86% -0,2%
As of 2/22/13Avg. Avg. Avg. Avg. Number
Cum Exp Pool Current Original of RatedVintage Loss/OB Factor MILAN CE EL Tranches2005 4,2% 19,0% 29,8% 2,0% 2052006 6,0% 35,5% 31,0% 2,1% 3002007 7,2% 58,4% 29,8% 2,3% 1982008 5,4% 75,8% 31,0% 2,3% 112009 4,0% 82,1% 20,0% 4,0% 1Sources: Moody's Investors Service, Moody's Performance Data Service, periodic investor/servicer reports
3 Mos. Ending
0
3
6
2 5 8 11 14 17 20 23 26 29 32 35 38 41 44 47
% o
f O
Months After Issuance
0,0
0,4
0,8
2 5 8 11 14 17 20 23 26 29 32 35 38 41 44 47
% o
f O
Months After Issuance
0,0
0,5
1,0
1,5
2,0
2,5
3,0
3,5
4,0
0
2
4
6
8
10
12
14
16
18
20
22
Jan-
04
Jun-
04
Nov
-04
Apr-
05
Sep-
05
Feb-
06
Jul-0
6
Dec
-06
Ma y
-07
Oct
-07
Mar
-08
Aug-
08
Jan-
09
Jun-
09
Nov
-09
Apr-
10
Sep-
10
Feb-
11
Jul-1
1
Dec
-11
Ma y
-12
Oct
-12
Rep
osse
ssio
n R
ate
(%)
90+
Day
Del
inqu
ency
Rat
e (%
)
UK Non-Conforming RMBS Indexes90+ Delinquent/Outstanding Repossession/Outstanding
Sources: Moody's Investors Service, Moody's Performance Data Service, periodic investor/servicer reports
Sources: Moody's Investors Service, Moody's Performance Data Service, periodic investor/servicer reports
Sources: Moody's Investors Service, Moody's Performance Data Service, periodic investor/servicer reports
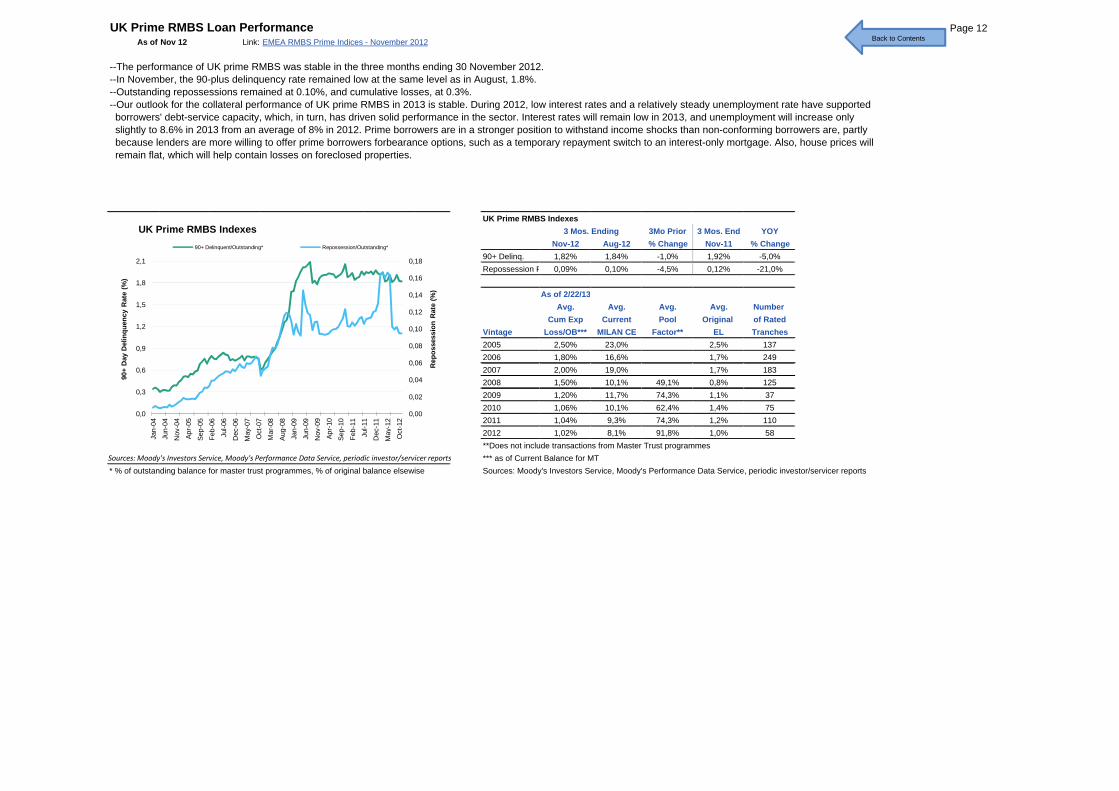
UK Prime RMBS Loan Performance Page 12As of Nov 12 Link: EMEA RMBS Prime Indices - November 2012
--The performance of UK prime RMBS was stable in the three months ending 30 November 2012.--In November, the 90-plus delinquency rate remained low at the same level as in August, 1.8%.--Outstanding repossessions remained at 0.10%, and cumulative losses, at 0.3%.--Our outlook for the collateral performance of UK prime RMBS in 2013 is stable. During 2012, low interest rates and a relatively steady unemployment rate have supported borrowers' debt-service capacity, which, in turn, has driven solid performance in the sector. Interest rates will remain low in 2013, and unemployment will increase only slightly to 8.6% in 2013 from an average of 8% in 2012. Prime borrowers are in a stronger position to withstand income shocks than non-conforming borrowers are, partly because lenders are more willing to offer prime borrowers forbearance options, such as a temporary repayment switch to an interest-only mortgage. Also, house prices will remain flat, which will help contain losses on foreclosed properties.
UK Prime RMBS Indexes3Mo Prior 3 Mos. End YOY
Nov-12 Aug-12 % Change Nov-11 % Change90+ Delinq. 1,82% 1,84% -1,0% 1,92% -5,0%Repossession R 0,09% 0,10% -4,5% 0,12% -21,0%
As of 2/22/13Avg. Avg. Avg. Avg. Number
Cum Exp Current Pool Original of RatedVintage Loss/OB*** MILAN CE Factor** EL Tranches2005 2,50% 23,0% 2,5% 1372006 1,80% 16,6% 1,7% 2492007 2,00% 19,0% 1,7% 183
3 Mos. Ending
0,04
0,06
0,08
0,10
0,12
0,14
0,16
0,18
0,6
0,9
1,2
1,5
1,8
2,1
Rep
osse
ssio
n R
ate
(%)
90+
Day
Del
inqu
ency
Rat
e (%
)
UK Prime RMBS Indexes90+ Delinquent/Outstanding* Repossession/Outstanding*
Back to Contents
2008 1,50% 10,1% 49,1% 0,8% 1252009 1,20% 11,7% 74,3% 1,1% 372010 1,06% 10,1% 62,4% 1,4% 752011 1,04% 9,3% 74,3% 1,2% 1102012 1,02% 8,1% 91,8% 1,0% 58**Does not include transactions from Master Trust programmes*** as of Current Balance for MT
* % of outstanding balance for master trust programmes, % of original balance elsewise Sources: Moody's Investors Service, Moody's Performance Data Service, periodic investor/servicer reports
0,00
0,02
0,04
0,06
0,0
0,3
0,6
Jan-
04Ju
n-04
Nov
-04
Apr-
05
Sep-
05Fe
b-06
Jul-0
6D
ec-0
6
Ma y
-07
Oct
-07
Mar
-08
Aug-
08Ja
n-09
Jun-
09N
ov-0
9
Apr-
10Se
p-10
Feb-
11Ju
l-11
Dec
-11
Ma y
-12
Oct
-12
Re
90+
D
Sources: Moody's Investors Service, Moody's Performance Data Service, periodic investor/servicer reports
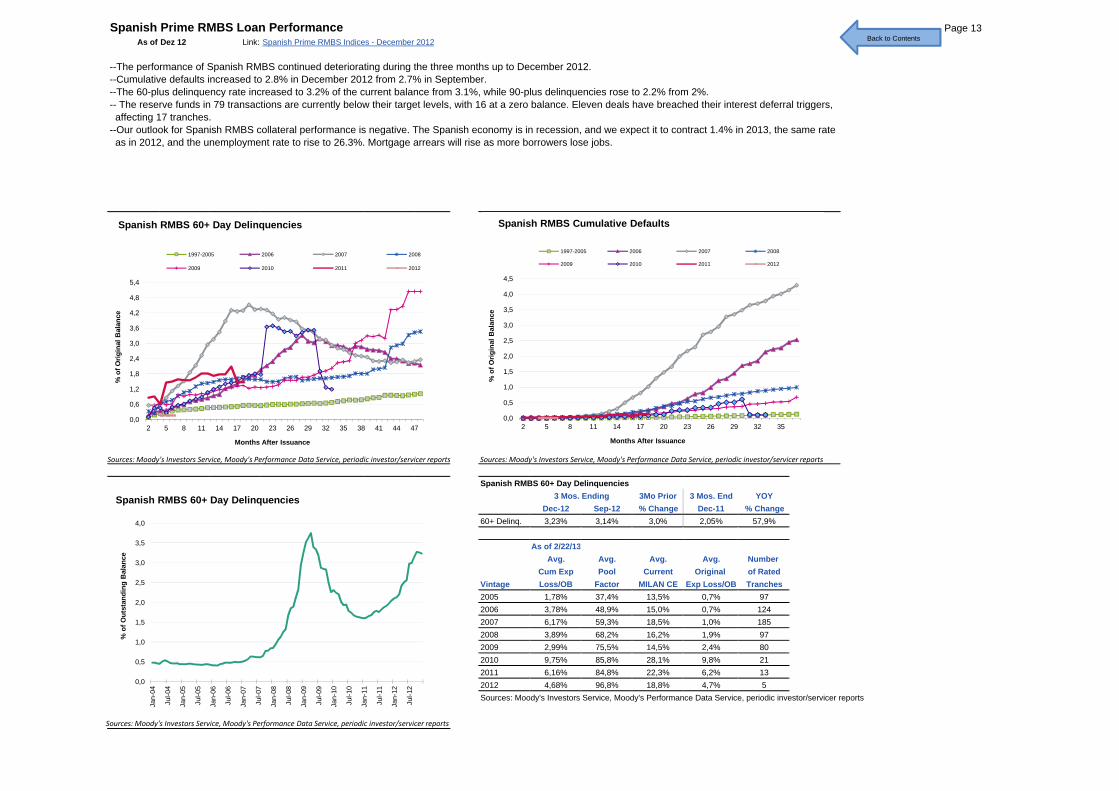
Spanish Prime RMBS Loan Performance Page 13As of Dez 12 Link: Spanish Prime RMBS Indices - December 2012
--The performance of Spanish RMBS continued deteriorating during the three months up to December 2012.--Cumulative defaults increased to 2.8% in December 2012 from 2.7% in September.--The 60-plus delinquency rate increased to 3.2% of the current balance from 3.1%, while 90-plus delinquencies rose to 2.2% from 2%. -- The reserve funds in 79 transactions are currently below their target levels, with 16 at a zero balance. Eleven deals have breached their interest deferral triggers, affecting 17 tranches.--Our outlook for Spanish RMBS collateral performance is negative. The Spanish economy is in recession, and we expect it to contract 1.4% in 2013, the same rate as in 2012, and the unemployment rate to rise to 26.3%. Mortgage arrears will rise as more borrowers lose jobs.
1 2
1,8
2,4
3,0
3,6
4,2
4,8
5,4
% o
f Orig
inal
Bal
ance
Spanish RMBS 60+ Day Delinquencies
1997-2005 2006 2007 2008
2009 2010 2011 2012
1 0
1,5
2,0
2,5
3,0
3,5
4,0
4,5
% o
f Orig
inal
Bal
ance
Spanish RMBS Cumulative Defaults
1997-2005 2006 2007 2008
2009 2010 2011 2012
Back to Contents
Spanish RMBS 60+ Day Delinquencies3Mo Prior 3 Mos. End YOY
Dec-12 Sep-12 % Change Dec-11 % Change60+ Delinq. 3,23% 3,14% 3,0% 2,05% 57,9%
As of 2/22/13Avg. Avg. Avg. Avg. Number
Cum Exp Pool Current Original of RatedVintage Loss/OB Factor MILAN CE Exp Loss/OB Tranches2005 1,78% 37,4% 13,5% 0,7% 972006 3,78% 48,9% 15,0% 0,7% 1242007 6,17% 59,3% 18,5% 1,0% 1852008 3,89% 68,2% 16,2% 1,9% 972009 2,99% 75,5% 14,5% 2,4% 802010 9,75% 85,8% 28,1% 9,8% 212011 6,16% 84,8% 22,3% 6,2% 132012 4,68% 96,8% 18,8% 4,7% 5Sources: Moody's Investors Service, Moody's Performance Data Service, periodic investor/servicer reports
3 Mos. Ending
0,0
0,6
1,2
1,8
,
2 5 8 11 14 17 20 23 26 29 32 35 38 41 44 47
% o
f O
Months After Issuance
0,0
0,5
1,0
1,5
2 5 8 11 14 17 20 23 26 29 32 35
% o
f O
Months After Issuance
0,0
0,5
1,0
1,5
2,0
2,5
3,0
3,5
4,0
Jan-
04
Jul-0
4
Jan-
05
Jul-0
5
Jan-
06
Jul-0
6
Jan-
07
Jul-0
7
Jan-
08
Jul-0
8
Jan-
09
Jul-0
9
Jan-
10
Jul-1
0
Jan-
11
Jul-1
1
Jan-
12
Jul-1
2
% o
f Out
stan
ding
Bal
ance
Spanish RMBS 60+ Day Delinquencies
Sources: Moody's Investors Service, Moody's Performance Data Service, periodic investor/servicer reports Sources: Moody's Investors Service, Moody's Performance Data Service, periodic investor/servicer reports
Sources: Moody's Investors Service, Moody's Performance Data Service, periodic investor/servicer reports
Dutch Prime RMBS Loan Performance Page 14As of Dez 12 Link: Dutch Prime and NHG RMBS Indices - December 2012
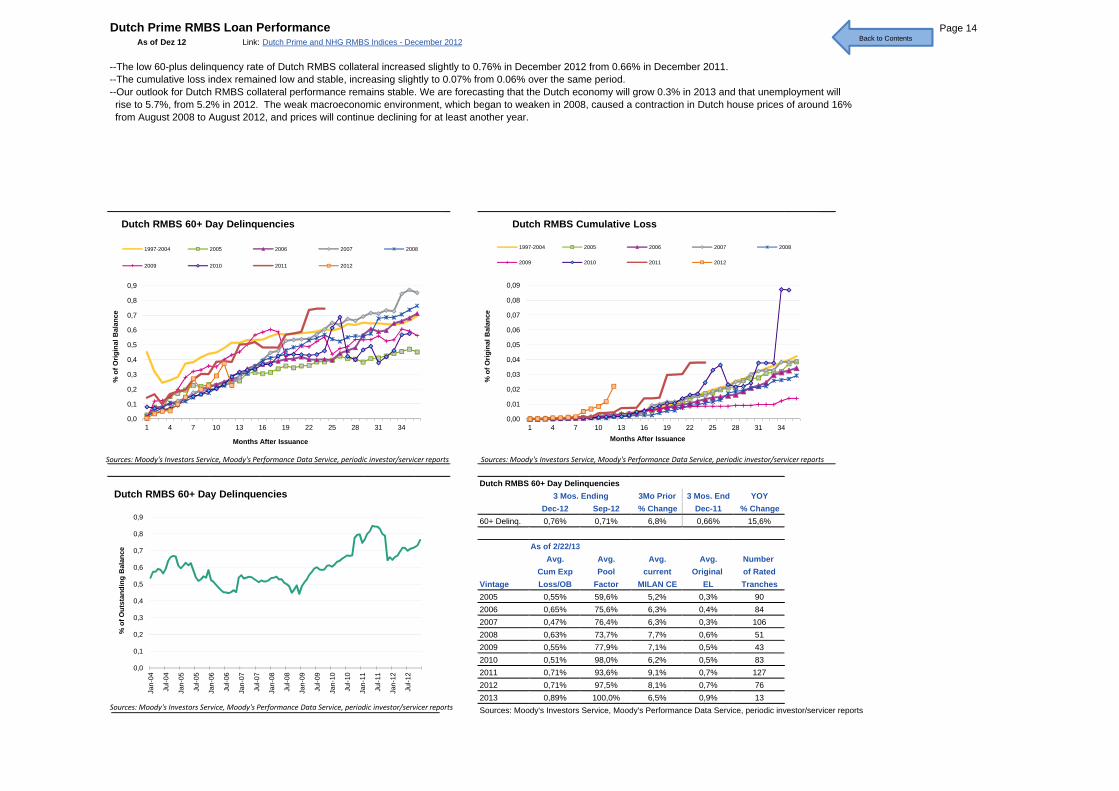
--The low 60-plus delinquency rate of Dutch RMBS collateral increased slightly to 0.76% in December 2012 from 0.66% in December 2011.--The cumulative loss index remained low and stable, increasing slightly to 0.07% from 0.06% over the same period. --Our outlook for Dutch RMBS collateral performance remains stable. We are forecasting that the Dutch economy will grow 0.3% in 2013 and that unemployment will rise to 5.7%, from 5.2% in 2012. The weak macroeconomic environment, which began to weaken in 2008, caused a contraction in Dutch house prices of around 16% from August 2008 to August 2012, and prices will continue declining for at least another year.
0 2
0,3
0,4
0,5
0,6
0,7
0,8
0,9
% o
f Orig
inal
Bal
ance
Dutch RMBS 60+ Day Delinquencies
1997-2004 2005 2006 2007 2008
2009 2010 2011 2012
0 02
0,03
0,04
0,05
0,06
0,07
0,08
0,09
% o
f Orig
inal
Bal
ance
Dutch RMBS Cumulative Loss
1997-2004 2005 2006 2007 2008
2009 2010 2011 2012
Back to Contents
Dutch RMBS 60+ Day Delinquencies3Mo Prior 3 Mos. End YOY
Dec-12 Sep-12 % Change Dec-11 % Change60+ Delinq. 0,76% 0,71% 6,8% 0,66% 15,6%
As of 2/22/13Avg. Avg. Avg. Avg. Number
Cum Exp Pool current Original of RatedVintage Loss/OB Factor MILAN CE EL Tranches2005 0,55% 59,6% 5,2% 0,3% 902006 0,65% 75,6% 6,3% 0,4% 842007 0,47% 76,4% 6,3% 0,3% 1062008 0,63% 73,7% 7,7% 0,6% 512009 0,55% 77,9% 7,1% 0,5% 432010 0,51% 98,0% 6,2% 0,5% 832011 0,71% 93,6% 9,1% 0,7% 1272012 0,71% 97,5% 8,1% 0,7% 762013 0,89% 100,0% 6,5% 0,9% 13Sources: Moody's Investors Service, Moody's Performance Data Service, periodic investor/servicer reports
3 Mos. Ending
0,0
0,1
0,2
0,3
0,4
1 4 7 10 13 16 19 22 25 28 31 34
% o
f O
Months After Issuance
0,00
0,01
0,02
0,03
0,04
1 4 7 10 13 16 19 22 25 28 31 34
% o
f O
Months After Issuance
0,0
0,1
0,2
0,3
0,4
0,5
0,6
0,7
0,8
0,9
Jan-
04
Jul-0
4
Jan-
05
Jul-0
5
Jan-
06
Jul-0
6
Jan-
07
Jul-0
7
Jan-
08
Jul-0
8
Jan-
09
Jul-0
9
Jan-
10
Jul-1
0
Jan-
11
Jul-1
1
Jan-
12
Jul-1
2
% o
f Out
stan
ding
Bal
ance
Dutch RMBS 60+ Day Delinquencies
Sources: Moody's Investors Service, Moody's Performance Data Service, periodic investor/servicer reports Sources: Moody's Investors Service, Moody's Performance Data Service, periodic investor/servicer reports
Sources: Moody's Investors Service, Moody's Performance Data Service, periodic investor/servicer reports
Italian RMBS Loan Performance Page 15As of Nov 12 Link: Italian RMBS Indices - November 2012
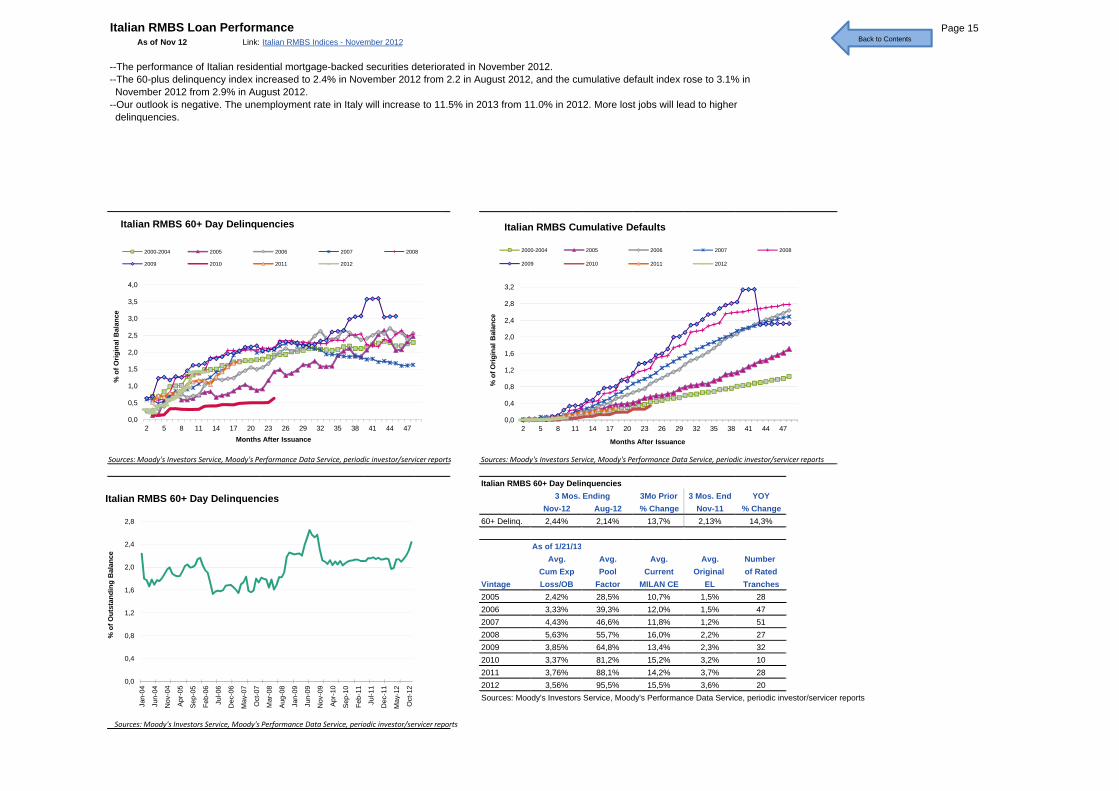
--The performance of Italian residential mortgage-backed securities deteriorated in November 2012.--The 60-plus delinquency index increased to 2.4% in November 2012 from 2.2 in August 2012, and the cumulative default index rose to 3.1% in November 2012 from 2.9% in August 2012.--Our outlook is negative. The unemployment rate in Italy will increase to 11.5% in 2013 from 11.0% in 2012. More lost jobs will lead to higher delinquencies.
1,0
1,5
2,0
2,5
3,0
3,5
4,0
% o
f Orig
inal
Bal
ance
Italian RMBS 60+ Day Delinquencies
2000-2004 2005 2006 2007 2008
2009 2010 2011 2012
0 8
1,2
1,6
2,0
2,4
2,8
3,2
% o
f Orig
inal
Bal
ance
Italian RMBS Cumulative Defaults
2000-2004 2005 2006 2007 2008
2009 2010 2011 2012
Back to Contents
Italian RMBS 60+ Day Delinquencies3Mo Prior 3 Mos. End YOY
Nov-12 Aug-12 % Change Nov-11 % Change60+ Delinq. 2,44% 2,14% 13,7% 2,13% 14,3%
As of 1/21/13Avg. Avg. Avg. Avg. Number
Cum Exp Pool Current Original of RatedVintage Loss/OB Factor MILAN CE EL Tranches2005 2,42% 28,5% 10,7% 1,5% 282006 3,33% 39,3% 12,0% 1,5% 472007 4,43% 46,6% 11,8% 1,2% 512008 5,63% 55,7% 16,0% 2,2% 272009 3,85% 64,8% 13,4% 2,3% 322010 3,37% 81,2% 15,2% 3,2% 102011 3,76% 88,1% 14,2% 3,7% 282012 3,56% 95,5% 15,5% 3,6% 20Sources: Moody's Investors Service, Moody's Performance Data Service, periodic investor/servicer reports
3 Mos. Ending
0,0
0,5
1,0
1,5
2 5 8 11 14 17 20 23 26 29 32 35 38 41 44 47
% o
f O
Months After Issuance
0,0
0,4
0,8
1,2
2 5 8 11 14 17 20 23 26 29 32 35 38 41 44 47
% o
f Or
Months After Issuance
0,0
0,4
0,8
1,2
1,6
2,0
2,4
2,8
Jan-
04
Jun-
04
Nov
-04
Apr-
05
Sep-
05
Feb-
06
Jul-0
6
Dec
-06
May
-07
Oct
-07
Mar
-08
Aug-
08
Jan-
09
Jun-
09
Nov
-09
Apr-
10
Sep-
10
Feb-
11
Jul-1
1
Dec
-11
May
-12
Oct
-12
% o
f Out
stan
ding
Bal
ance
Italian RMBS 60+ Day Delinquencies
Sources: Moody's Investors Service, Moody's Performance Data Service, periodic investor/servicer reports Sources: Moody's Investors Service, Moody's Performance Data Service, periodic investor/servicer reports
Sources: Moody's Investors Service, Moody's Performance Data Service, periodic investor/servicer reports
Irish RMBS† Loan Performance Page 16As of Okt 12 Link: Irish Prime RMBS Indices - October 2012
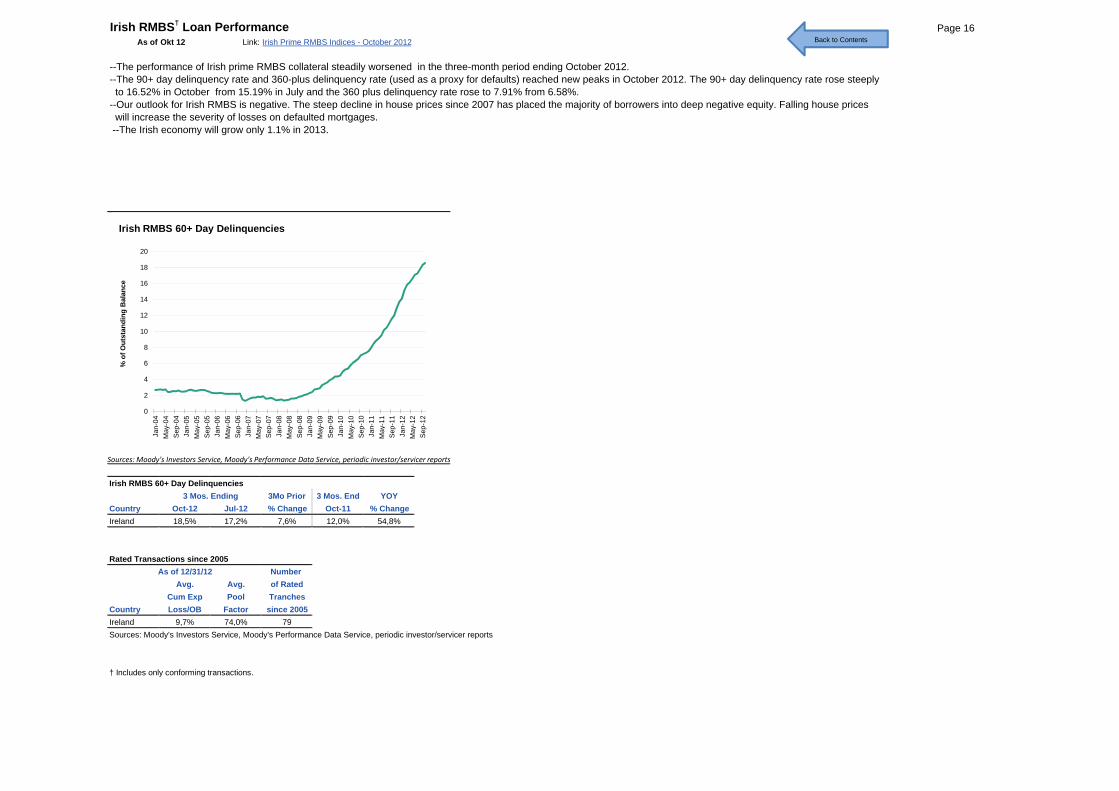
--The performance of Irish prime RMBS collateral steadily worsened in the three-month period ending October 2012.--The 90+ day delinquency rate and 360-plus delinquency rate (used as a proxy for defaults) reached new peaks in October 2012. The 90+ day delinquency rate rose steeply to 16.52% in October from 15.19% in July and the 360 plus delinquency rate rose to 7.91% from 6.58%.--Our outlook for Irish RMBS is negative. The steep decline in house prices since 2007 has placed the majority of borrowers into deep negative equity. Falling house prices will increase the severity of losses on defaulted mortgages. --The Irish economy will grow only 1.1% in 2013.
4
6
8
10
12
14
16
18
20
% o
f Out
stan
ding
Bal
ance
Irish RMBS 60+ Day Delinquencies
Back to Contents
Irish RMBS 60+ Day Delinquencies3Mo Prior 3 Mos. End YOY
Country Oct-12 Jul-12 % Change Oct-11 % ChangeIreland 18,5% 17,2% 7,6% 12,0% 54,8%
Rated Transactions since 2005As of 12/31/12 Number
Avg. Avg. of RatedCum Exp Pool Tranches
Country Loss/OB Factor since 2005Ireland 9,7% 74,0% 79Sources: Moody's Investors Service, Moody's Performance Data Service, periodic investor/servicer reports
† Includes only conforming transactions.
3 Mos. Ending
0
2
4
6
Jan-
04M
ay-0
4Se
p-04
Jan-
05M
a y-0
5Se
p-05
Jan-
06M
a y-0
6Se
p-06
Jan-
07M
a y-0
7Se
p-07
Jan-
08M
ay-0
8Se
p-08
Jan-
09M
ay-0
9Se
p-09
Jan-
10M
a y-1
0Se
p-10
Jan-
11M
a y-1
1Se
p-11
Jan-
12M
ay-1
2Se
p-12
%
Sources: Moody's Investors Service, Moody's Performance Data Service, periodic investor/servicer reports
South African RMBS† Loan Performance Page 17As of Sep 12 Link: South African Securitisation Indices September 2012
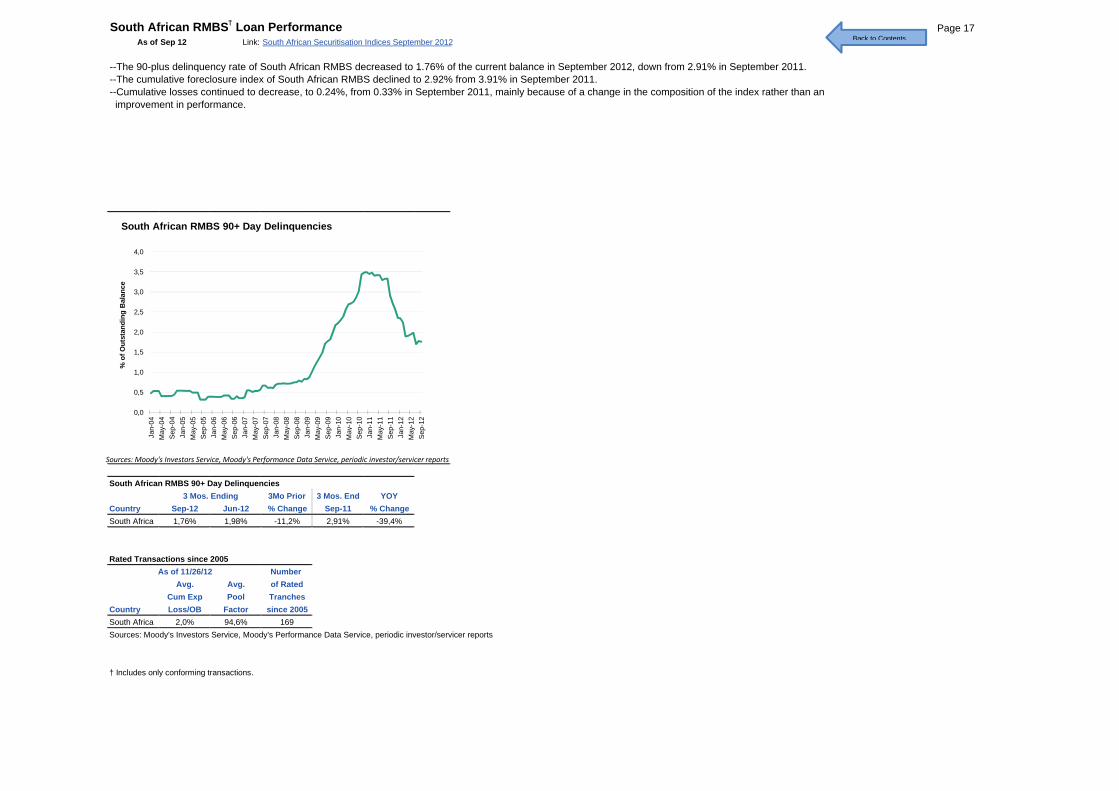
--The 90-plus delinquency rate of South African RMBS decreased to 1.76% of the current balance in September 2012, down from 2.91% in September 2011. --The cumulative foreclosure index of South African RMBS declined to 2.92% from 3.91% in September 2011. --Cumulative losses continued to decrease, to 0.24%, from 0.33% in September 2011, mainly because of a change in the composition of the index rather than an improvement in performance.
1,0
1,5
2,0
2,5
3,0
3,5
4,0
% o
f Out
stan
ding
Bal
ance
South African RMBS 90+ Day Delinquencies
Back to Contents
South African RMBS 90+ Day Delinquencies3Mo Prior 3 Mos. End YOY
Country Sep-12 Jun-12 % Change Sep-11 % ChangeSouth Africa 1,76% 1,98% -11,2% 2,91% -39,4%
Rated Transactions since 2005As of 11/26/12 Number
Avg. Avg. of RatedCum Exp Pool Tranches
Country Loss/OB Factor since 2005South Africa 2,0% 94,6% 169Sources: Moody's Investors Service, Moody's Performance Data Service, periodic investor/servicer reports
† Includes only conforming transactions.
3 Mos. Ending
0,0
0,5
1,0
Jan-
04M
ay-0
4Se
p-04
Jan-
05M
ay-0
5Se
p-05
Jan-
06M
ay-0
6Se
p-06
Jan-
07M
ay-0
7Se
p-07
Jan-
08M
ay-0
8Se
p-08
Jan-
09M
ay-0
9Se
p-09
Jan-
10M
ay-1
0Se
p-10
Jan-
11M
ay-1
1Se
p-11
Jan-
12M
ay-1
2Se
p-12
%
Sources: Moody's Investors Service, Moody's Performance Data Service, periodic investor/servicer reports
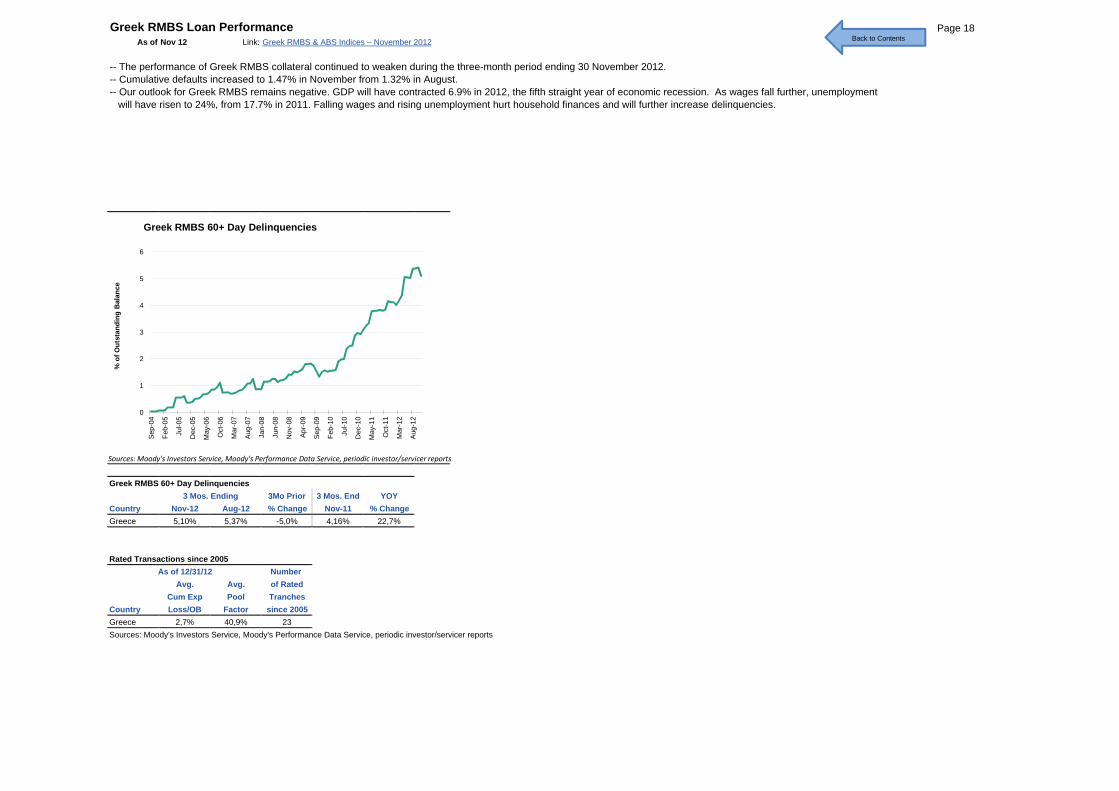
Greek RMBS Loan Performance Page 18As of Nov 12 Link: Greek RMBS & ABS Indices – November 2012
-- The performance of Greek RMBS collateral continued to weaken during the three-month period ending 30 November 2012.-- Cumulative defaults increased to 1.47% in November from 1.32% in August.-- Our outlook for Greek RMBS remains negative. GDP will have contracted 6.9% in 2012, the fifth straight year of economic recession. As wages fall further, unemployment will have risen to 24%, from 17.7% in 2011. Falling wages and rising unemployment hurt household finances and will further increase delinquencies.
1
2
3
4
5
6
% o
f Out
stan
ding
Bal
ance
Greek RMBS 60+ Day Delinquencies
Back to Contents
Greek RMBS 60+ Day Delinquencies3Mo Prior 3 Mos. End YOY
Country Nov-12 Aug-12 % Change Nov-11 % ChangeGreece 5,10% 5,37% -5,0% 4,16% 22,7%
Rated Transactions since 2005As of 12/31/12 Number
Avg. Avg. of RatedCum Exp Pool Tranches
Country Loss/OB Factor since 2005Greece 2,7% 40,9% 23Sources: Moody's Investors Service, Moody's Performance Data Service, periodic investor/servicer reports
3 Mos. Ending
0
1
Sep-
04
Feb-
05
Jul-0
5
Dec
-05
May
-06
Oct
-06
Mar
-07
Aug-
07
Jan-
08
Jun-
08
Nov
-08
Apr-
09
Sep-
09
Feb-
10
Jul-1
0
Dec
-10
May
-11
Oct
-11
Mar
-12
Aug-
12
%
Sources: Moody's Investors Service, Moody's Performance Data Service, periodic investor/servicer reports
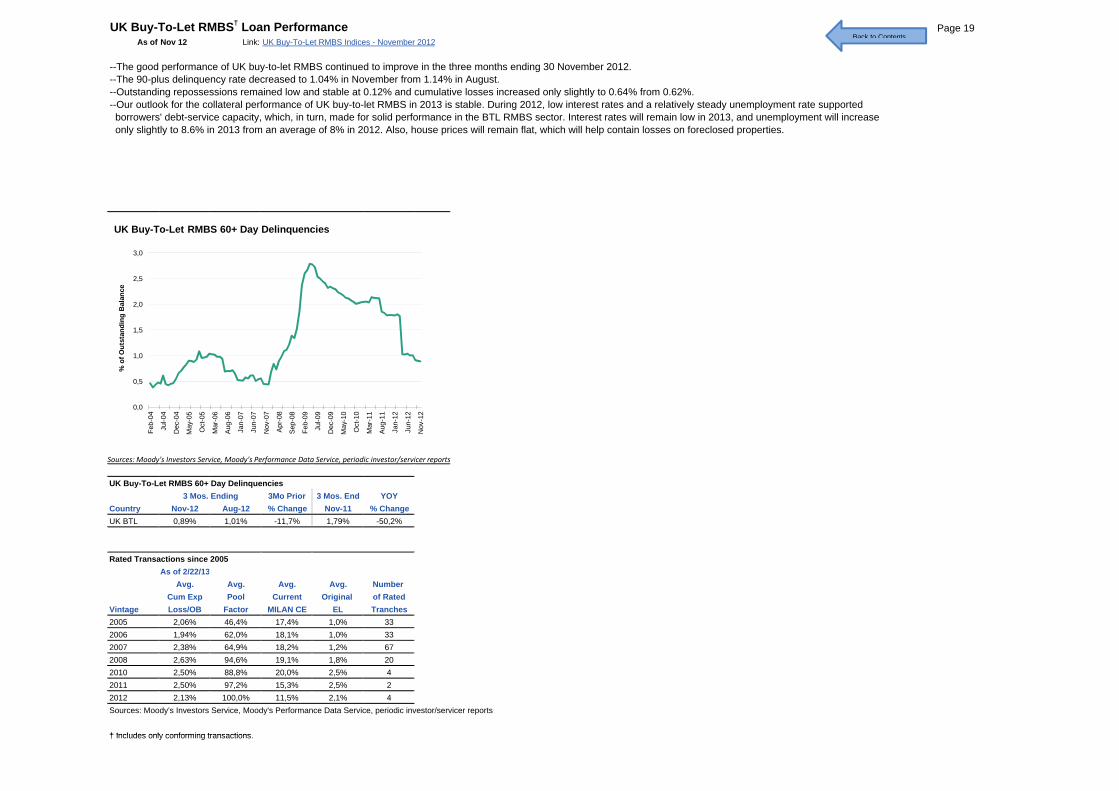
UK Buy-To-Let RMBS† Loan Performance Page 19As of Nov 12 Link: UK Buy-To-Let RMBS Indices - November 2012
--The good performance of UK buy-to-let RMBS continued to improve in the three months ending 30 November 2012.--The 90-plus delinquency rate decreased to 1.04% in November from 1.14% in August.--Outstanding repossessions remained low and stable at 0.12% and cumulative losses increased only slightly to 0.64% from 0.62%.--Our outlook for the collateral performance of UK buy-to-let RMBS in 2013 is stable. During 2012, low interest rates and a relatively steady unemployment rate supported borrowers' debt-service capacity, which, in turn, made for solid performance in the BTL RMBS sector. Interest rates will remain low in 2013, and unemployment will increase only slightly to 8.6% in 2013 from an average of 8% in 2012. Also, house prices will remain flat, which will help contain losses on foreclosed properties.
0,5
1,0
1,5
2,0
2,5
3,0
% o
f Out
stan
ding
Bal
ance
UK Buy-To-Let RMBS 60+ Day Delinquencies
Back to Contents
UK Buy-To-Let RMBS 60+ Day Delinquencies3Mo Prior 3 Mos. End YOY
Country Nov-12 Aug-12 % Change Nov-11 % ChangeUK BTL 0,89% 1,01% -11,7% 1,79% -50,2%
Rated Transactions since 2005As of 2/22/13
Avg. Avg. Avg. Avg. Number Cum Exp Pool Current Original of Rated
Vintage Loss/OB Factor MILAN CE EL Tranches2005 2,06% 46,4% 17,4% 1,0% 332006 1,94% 62,0% 18,1% 1,0% 332007 2,38% 64,9% 18,2% 1,2% 672008 2,63% 94,6% 19,1% 1,8% 202010 2,50% 88,8% 20,0% 2,5% 42011 2,50% 97,2% 15,3% 2,5% 22012 2,13% 100,0% 11,5% 2,1% 4Sources: Moody's Investors Service, Moody's Performance Data Service, periodic investor/servicer reports
† Includes only conforming transactions
3 Mos. Ending
0,0
0,5
Feb-
04
Jul-0
4
Dec
-04
May
-05
Oct
-05
Mar
-06
Aug-
06
Jan-
07
Jun-
07
Nov
-07
Apr-
08
Sep-
08
Feb-
09
Jul-0
9
Dec
-09
May
-10
Oct
-10
Mar
-11
Aug-
11
Jan-
12
Jun-
12
Nov
-12
% o
Sources: Moody's Investors Service, Moody's Performance Data Service, periodic investor/servicer reports
† Includes only conforming transactions.
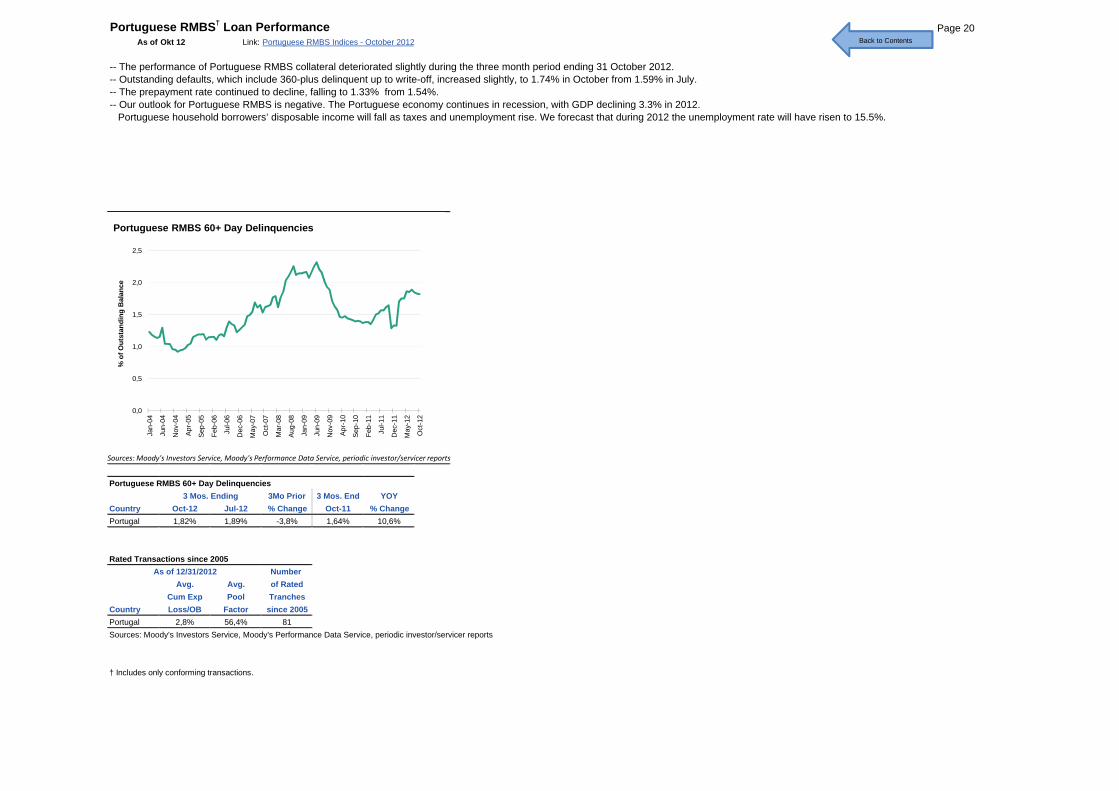
Portuguese RMBS† Loan Performance Page 20As of Okt 12 Link: Portuguese RMBS Indices - October 2012
-- The performance of Portuguese RMBS collateral deteriorated slightly during the three month period ending 31 October 2012.-- Outstanding defaults, which include 360-plus delinquent up to write-off, increased slightly, to 1.74% in October from 1.59% in July.-- The prepayment rate continued to decline, falling to 1.33% from 1.54%.-- Our outlook for Portuguese RMBS is negative. The Portuguese economy continues in recession, with GDP declining 3.3% in 2012. Portuguese household borrowers’ disposable income will fall as taxes and unemployment rise. We forecast that during 2012 the unemployment rate will have risen to 15.5%.
0,5
1,0
1,5
2,0
2,5
% o
f Out
stan
ding
Bal
ance
Portuguese RMBS 60+ Day Delinquencies
Back to Contents
Portuguese RMBS 60+ Day Delinquencies3Mo Prior 3 Mos. End YOY
Country Oct-12 Jul-12 % Change Oct-11 % ChangePortugal 1,82% 1,89% -3,8% 1,64% 10,6%
Rated Transactions since 2005As of 12/31/2012 Number
Avg. Avg. of RatedCum Exp Pool Tranches
Country Loss/OB Factor since 2005Portugal 2,8% 56,4% 81Sources: Moody's Investors Service, Moody's Performance Data Service, periodic investor/servicer reports
† Includes only conforming transactions.
3 Mos. Ending
0,0
0,5
Jan-
04
Jun-
04
Nov
-04
Apr-
05
Sep-
05
Feb-
06
Jul-0
6
Dec
-06
May
-07
Oct
-07
Mar
-08
Aug-
08
Jan-
09
Jun-
09
Nov
-09
Apr-
10
Sep-
10
Feb-
11
Jul-1
1
Dec
-11
May
-12
Oct
-12
%
Sources: Moody's Investors Service, Moody's Performance Data Service, periodic investor/servicer reports
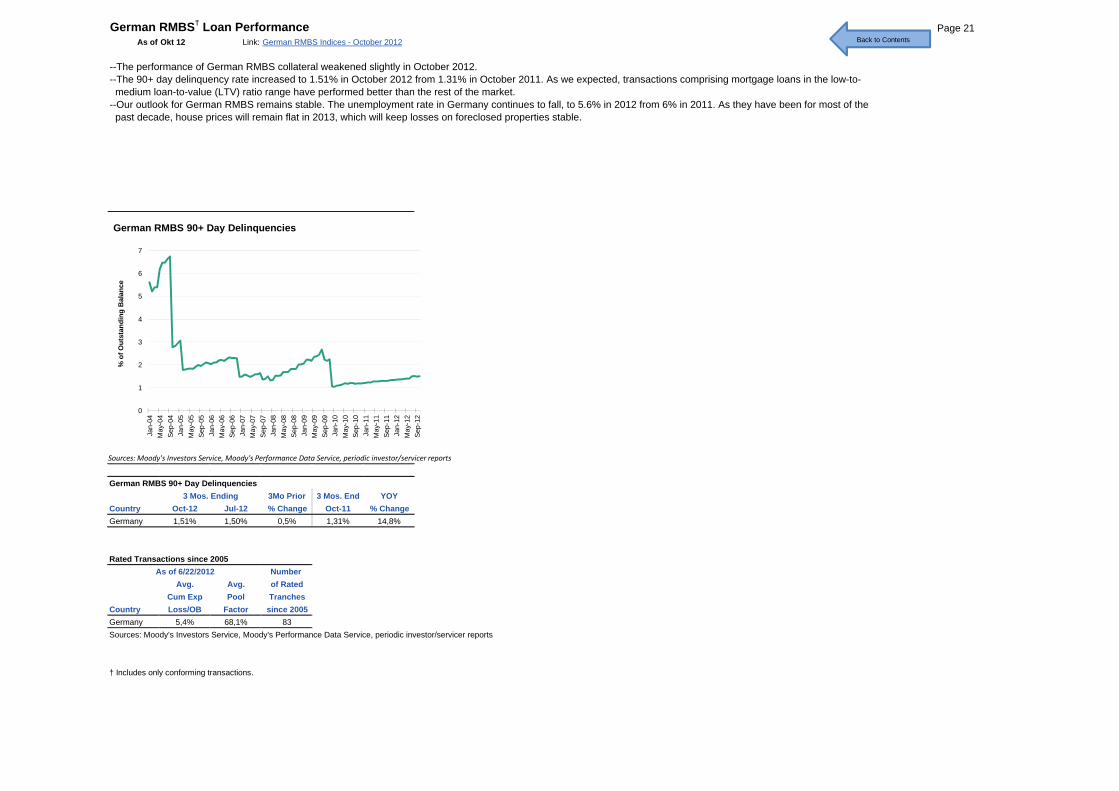
German RMBS† Loan Performance Page 21As of Okt 12 Link: German RMBS Indices - October 2012
--The performance of German RMBS collateral weakened slightly in October 2012.--The 90+ day delinquency rate increased to 1.51% in October 2012 from 1.31% in October 2011. As we expected, transactions comprising mortgage loans in the low-to- medium loan-to-value (LTV) ratio range have performed better than the rest of the market.--Our outlook for German RMBS remains stable. The unemployment rate in Germany continues to fall, to 5.6% in 2012 from 6% in 2011. As they have been for most of the past decade, house prices will remain flat in 2013, which will keep losses on foreclosed properties stable.
1
2
3
4
5
6
7
% o
f Out
stan
ding
Bal
ance
German RMBS 90+ Day Delinquencies
Back to Contents
German RMBS 90+ Day Delinquencies3Mo Prior 3 Mos. End YOY
Country Oct-12 Jul-12 % Change Oct-11 % ChangeGermany 1,51% 1,50% 0,5% 1,31% 14,8%
Rated Transactions since 2005As of 6/22/2012 Number
Avg. Avg. of RatedCum Exp Pool Tranches
Country Loss/OB Factor since 2005Germany 5,4% 68,1% 83Sources: Moody's Investors Service, Moody's Performance Data Service, periodic investor/servicer reports
† Includes only conforming transactions.
3 Mos. Ending
0
1
2
Jan-
04M
ay-0
4Se
p-04
Jan-
05M
a y-0
5Se
p-05
Jan-
06M
a y-0
6Se
p-06
Jan-
07M
ay-0
7Se
p-07
Jan-
08M
a y-0
8Se
p-08
Jan-
09M
ay-0
9Se
p-09
Jan-
10M
a y-1
0Se
p-10
Jan-
11M
ay-1
1Se
p-11
Jan-
12M
a y-1
2Se
p-12
%
Sources: Moody's Investors Service, Moody's Performance Data Service, periodic investor/servicer reports
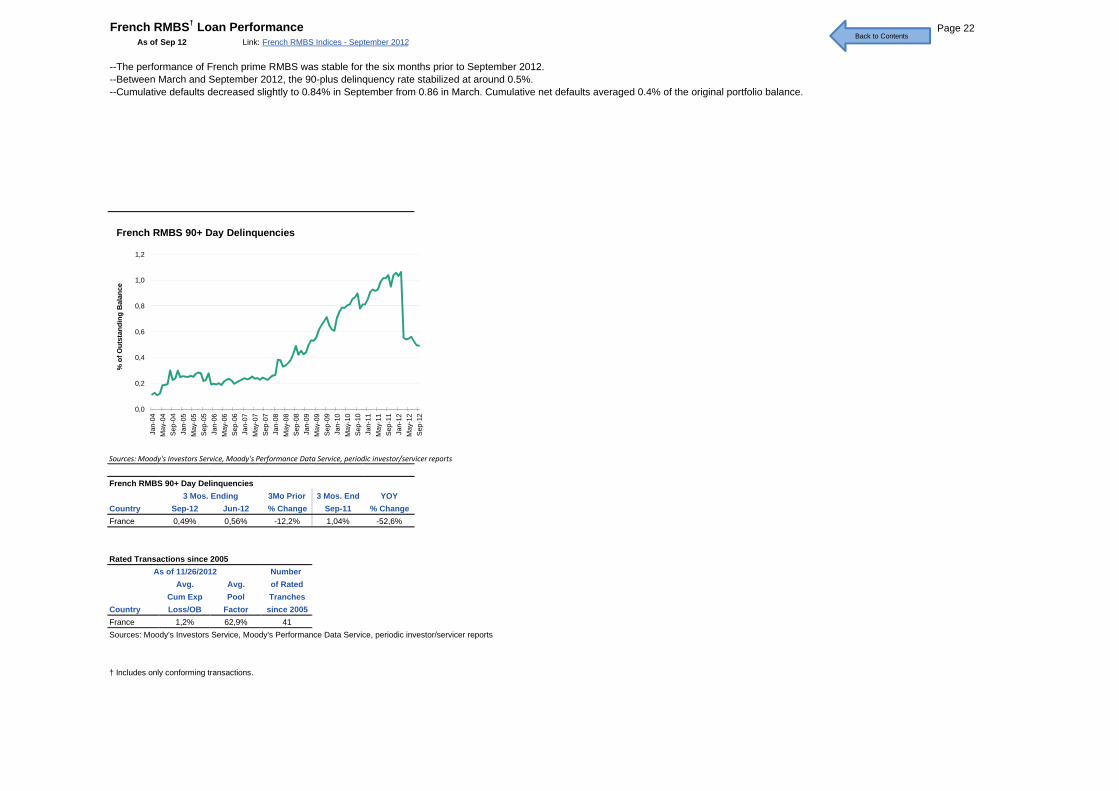
French RMBS† Loan Performance Page 22As of Sep 12 Link: French RMBS Indices - September 2012
--The performance of French prime RMBS was stable for the six months prior to September 2012. --Between March and September 2012, the 90-plus delinquency rate stabilized at around 0.5%.--Cumulative defaults decreased slightly to 0.84% in September from 0.86 in March. Cumulative net defaults averaged 0.4% of the original portfolio balance.
0,2
0,4
0,6
0,8
1,0
1,2
% o
f Out
stan
ding
Bal
ance
French RMBS 90+ Day Delinquencies
Back to Contents
French RMBS 90+ Day Delinquencies3Mo Prior 3 Mos. End YOY
Country Sep-12 Jun-12 % Change Sep-11 % ChangeFrance 0,49% 0,56% -12,2% 1,04% -52,6%
Rated Transactions since 2005As of 11/26/2012 Number
Avg. Avg. of RatedCum Exp Pool Tranches
Country Loss/OB Factor since 2005France 1,2% 62,9% 41Sources: Moody's Investors Service, Moody's Performance Data Service, periodic investor/servicer reports
† Includes only conforming transactions.
3 Mos. Ending
0,0
0,2
Jan-
04M
ay-0
4Se
p-04
Jan-
05M
a y-0
5Se
p-05
Jan-
06M
a y-0
6Se
p-06
Jan-
07M
ay-0
7Se
p-07
Jan-
08M
a y-0
8Se
p-08
Jan-
09M
a y-0
9Se
p-09
Jan-
10M
a y-1
0Se
p-10
Jan-
11M
a y-1
1Se
p-11
Jan-
12M
ay-1
2Se
p-12
% o
Sources: Moody's Investors Service, Moody's Performance Data Service, periodic investor/servicer reports
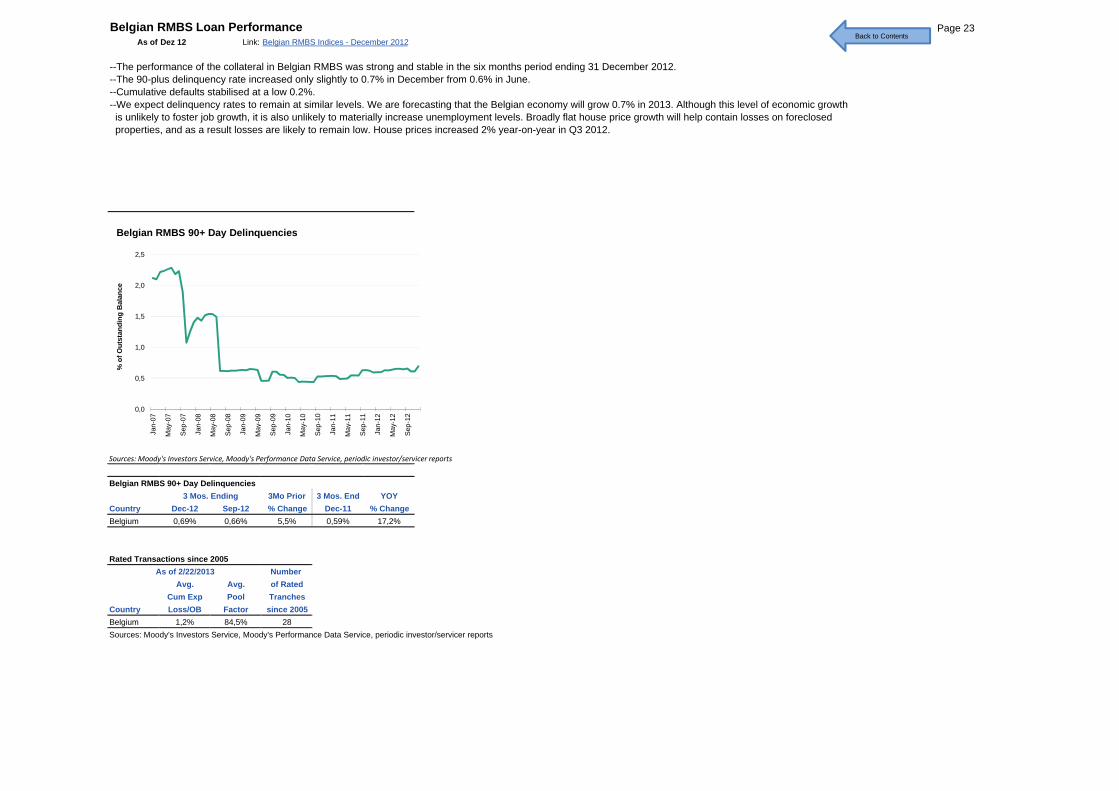
Belgian RMBS Loan Performance Page 23As of Dez 12 Link: Belgian RMBS Indices - December 2012
--The performance of the collateral in Belgian RMBS was strong and stable in the six months period ending 31 December 2012.--The 90-plus delinquency rate increased only slightly to 0.7% in December from 0.6% in June. --Cumulative defaults stabilised at a low 0.2%. --We expect delinquency rates to remain at similar levels. We are forecasting that the Belgian economy will grow 0.7% in 2013. Although this level of economic growth is unlikely to foster job growth, it is also unlikely to materially increase unemployment levels. Broadly flat house price growth will help contain losses on foreclosed properties, and as a result losses are likely to remain low. House prices increased 2% year-on-year in Q3 2012.
0,5
1,0
1,5
2,0
2,5
% o
f Out
stan
ding
Bal
ance
Belgian RMBS 90+ Day Delinquencies
Back to Contents
Belgian RMBS 90+ Day Delinquencies3Mo Prior 3 Mos. End YOY
Country Dec-12 Sep-12 % Change Dec-11 % ChangeBelgium 0,69% 0,66% 5,5% 0,59% 17,2%
Rated Transactions since 2005As of 2/22/2013 Number
Avg. Avg. of RatedCum Exp Pool Tranches
Country Loss/OB Factor since 2005Belgium 1,2% 84,5% 28Sources: Moody's Investors Service, Moody's Performance Data Service, periodic investor/servicer reports
3 Mos. Ending
0,0
0,5
Jan-
07
May
-07
Sep-
07
Jan-
08
May
-08
Sep-
08
Jan-
09
May
-09
Sep-
09
Jan-
10
May
-10
Sep-
10
Jan-
11
May
-11
Sep-
11
Jan-
12
May
-12
Sep-
12
% o
Sources: Moody's Investors Service, Moody's Performance Data Service, periodic investor/servicer reports
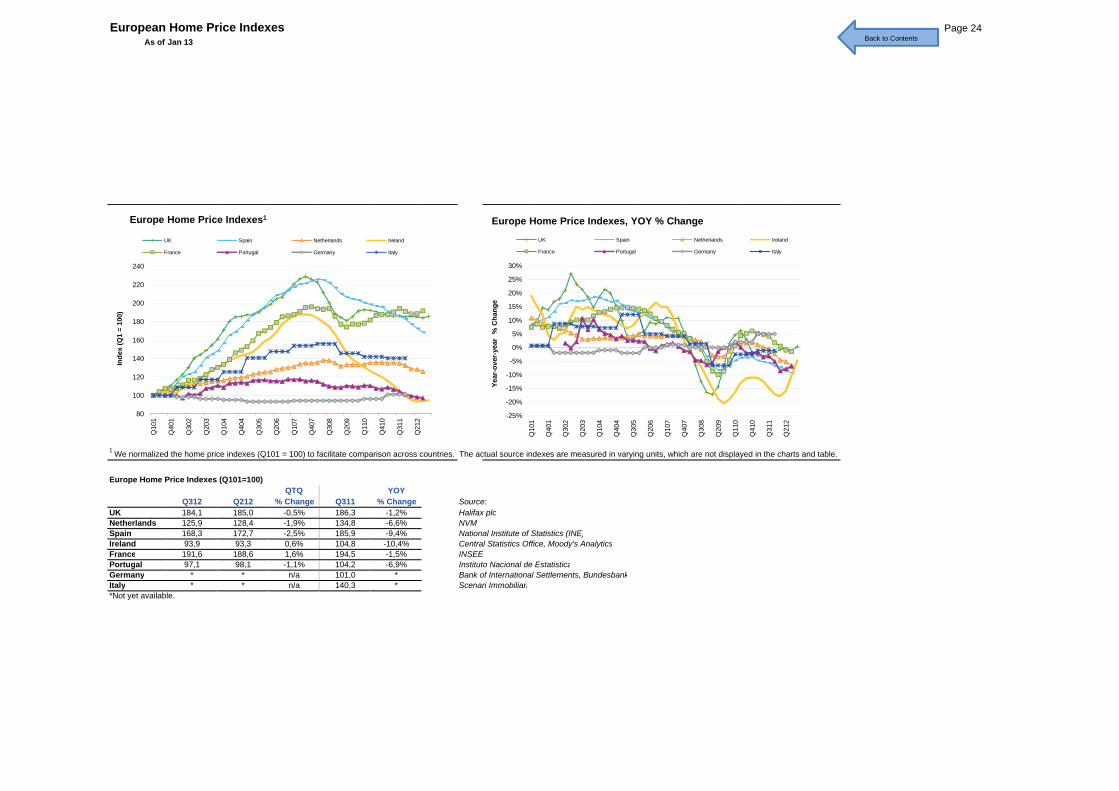
European Home Price Indexes Page 24As of Jan 13
120
140
160
180
200
220
240
Inde
x (Q
1 =
100)
Europe Home Price Indexes1
UK Spain Netherlands Ireland
France Portugal Germany Italy
-10%
-5%
0%
5%
10%
15%
20%
25%
30%
ear-
over
-yea
r %
Cha
nge
Europe Home Price Indexes, YOY % ChangeUK Spain Netherlands Ireland
France Portugal Germany Italy
Back to Contents
1 We normalized the home price indexes (Q101 = 100) to facilitate comparison across countries. The actual source indexes are measured in varying units, which are not displayed in the charts and table.
Europe Home Price Indexes (Q101=100)QTQ YOY
Q312 Q212 % Change Q311 % Change Source:UK 184,1 185,0 -0,5% 186,3 -1,2% 2 Halifax plcNetherlands 125,9 128,4 -1,9% 134,8 -6,6% 8 NVMSpain 168,3 172,7 -2,5% 185,9 -9,4% 5 National Institute of Statistics (INE)Ireland 93,9 93,3 0,6% 104,8 -10,4% 11 Central Statistics Office, Moody's AnalyticsFrance 191,6 188,6 1,6% 194,5 -1,5% 14 INSEEPortugal 97,1 98,1 -1,1% 104,2 -6,9% 17 Instituto Nacional de EstatisticaGermany * * n/a 101,0 * 20 Bank of International Settlements, BundesbankItaly * * n/a 140,3 * 23 Scenari Immobiliari*Not yet available.
80
100
120
140
Q10
1
Q40
1
Q30
2
Q20
3
Q10
4
Q40
4
Q30
5
Q20
6
Q10
7
Q40
7
Q30
8
Q20
9
Q11
0
Q41
0
Q31
1
Q21
2
Ind
-25%
-20%
-15%
-10%
-5%
Q10
1
Q40
1
Q30
2
Q20
3
Q10
4
Q40
4
Q30
5
Q20
6
Q10
7
Q40
7
Q30
8
Q20
9
Q11
0
Q41
0
Q31
1
Q21
2
Year
-ove
r
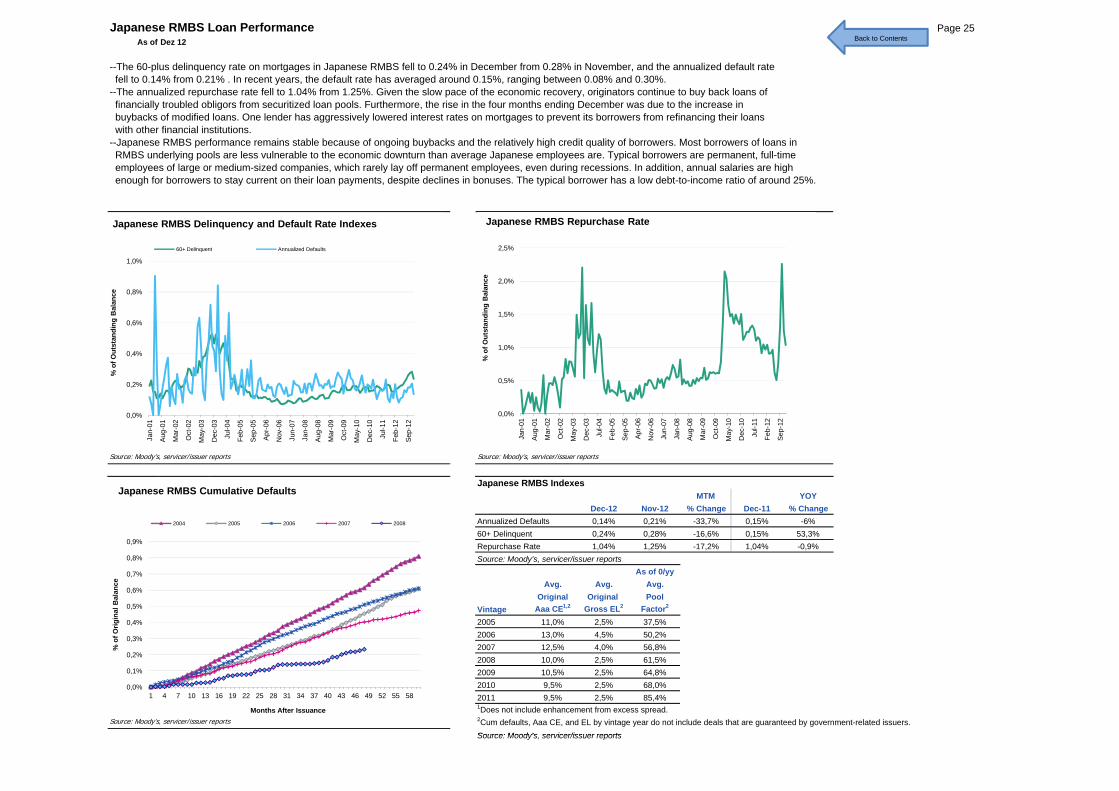
Japanese RMBS Loan Performance Page 25As of Dez 12
--The 60-plus delinquency rate on mortgages in Japanese RMBS fell to 0.24% in December from 0.28% in November, and the annualized default rate fell to 0.14% from 0.21% . In recent years, the default rate has averaged around 0.15%, ranging between 0.08% and 0.30%.--The annualized repurchase rate fell to 1.04% from 1.25%. Given the slow pace of the economic recovery, originators continue to buy back loans of financially troubled obligors from securitized loan pools. Furthermore, the rise in the four months ending December was due to the increase in buybacks of modified loans. One lender has aggressively lowered interest rates on mortgages to prevent its borrowers from refinancing their loans with other financial institutions.--Japanese RMBS performance remains stable because of ongoing buybacks and the relatively high credit quality of borrowers. Most borrowers of loans in RMBS underlying pools are less vulnerable to the economic downturn than average Japanese employees are. Typical borrowers are permanent, full-time employees of large or medium-sized companies, which rarely lay off permanent employees, even during recessions. In addition, annual salaries are high enough for borrowers to stay current on their loan payments, despite declines in bonuses. The typical borrower has a low debt-to-income ratio of around 25%.
0,2%
0,4%
0,6%
0,8%
1,0%
% o
f Out
stan
ding
Bal
ance
Japanese RMBS Delinquency and Default Rate Indexes
60+ Delinquent Annualized Defaults
0,5%
1,0%
1,5%
2,0%
2,5%
% o
f Out
stan
ding
Bal
ance
Japanese RMBS Repurchase Rate
Back to Contents
Japanese RMBS IndexesMTM YOY
Dec-12 Nov-12 % Change Dec-11 % ChangeAnnualized Defaults 0,14% 0,21% -33,7% 0,15% -6%60+ Delinquent 0,24% 0,28% -16,6% 0,15% 53,3%Repurchase Rate 1,04% 1,25% -17,2% 1,04% -0,9%
Source: Moody's, servicer/issuer reports 2As of 0/yy
Avg. Avg. Avg.Original Original Pool
Vintage Aaa CE1,2 Gross EL2 Factor2
2005 11,0% 2,5% 37,5%2006 13,0% 4,5% 50,2%2007 12,5% 4,0% 56,8%2008 10,0% 2,5% 61,5%2009 10,5% 2,5% 64,8%2010 9,5% 2,5% 68,0%2011 9,5% 2,5% 85,4%1Does not include enhancement from excess spread.2Cum defaults, Aaa CE, and EL by vintage year do not include deals that are guaranteed by government-related issuers.Source: Moody's servicer/issuer reports
0,0%
0,1%
0,2%
0,3%
0,4%
0,5%
0,6%
0,7%
0,8%
0,9%
1 4 7 10 13 16 19 22 25 28 31 34 37 40 43 46 49 52 55 58
% o
f Orig
inal
Bal
ance
Months After Issuance
Japanese RMBS Cumulative Defaults
2004 2005 2006 2007 2008
0,0%
0,2%
Jan-
01
Aug-
01
Mar
-02
Oct
-02
May
-03
Dec
-03
Jul-0
4
Feb-
05
Sep-
05
Apr-
06
Nov
-06
Jun-
07
Jan-
08
Aug-
08
Mar
-09
Oct
-09
May
-10
Dec
-10
Jul-1
1
Feb-
12
Sep-
12
% o
f
0,0%
0,5%
Jan-
01
Aug-
01
Mar
-02
Oct
-02
May
-03
Dec
-03
Jul-0
4
Feb-
05
Sep-
05
Apr-
06
Nov
-06
Jun-
07
Jan-
08
Aug-
08
Mar
-09
Oct
-09
May
-10
Dec
-10
Jul-1
1
Feb-
12
Sep-
12
Source: Moody's, servicer/issuer reportsSource: Moody's, servicer/issuer reports
Source: Moody's, servicer/issuer reports
Source: Moody's, servicer/issuer reports
Australian Prime RMBS Performance Page 26As of Dez 12 Link: Australian RMBS Performance Review: Q4 2012
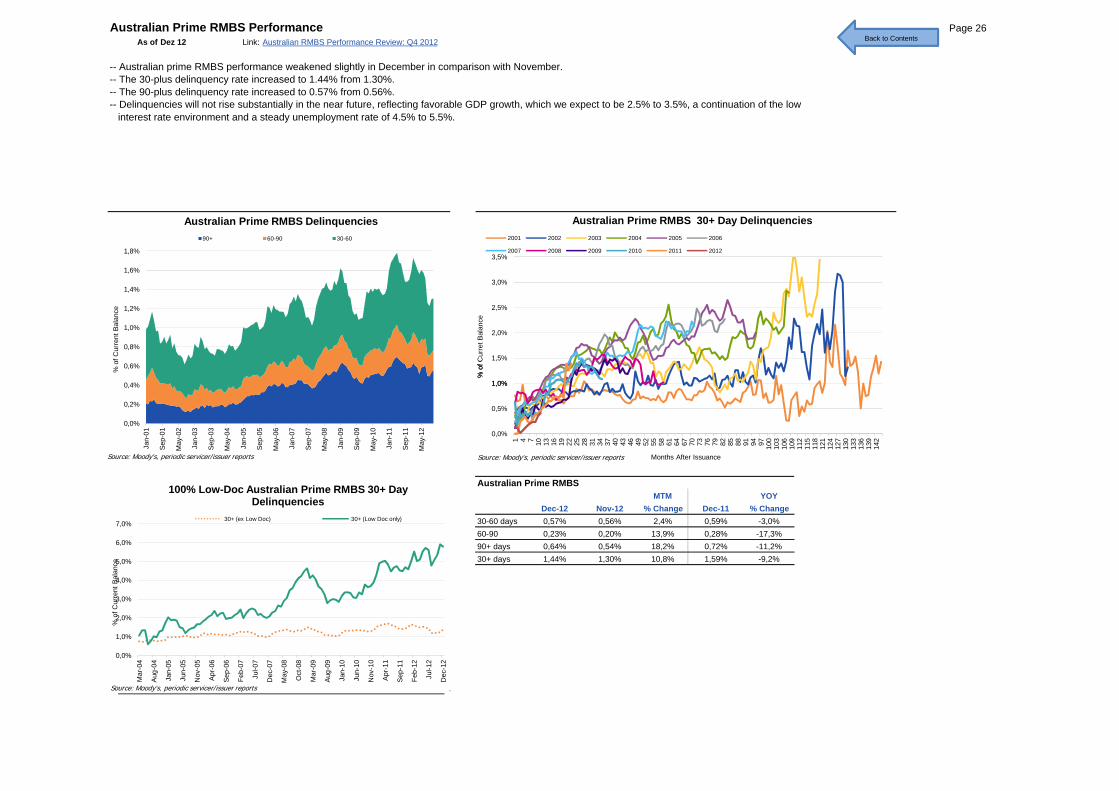
-- Australian prime RMBS performance weakened slightly in December in comparison with November.-- The 30-plus delinquency rate increased to 1.44% from 1.30%.-- The 90-plus delinquency rate increased to 0.57% from 0.56%.-- Delinquencies will not rise substantially in the near future, reflecting favorable GDP growth, which we expect to be 2.5% to 3.5%, a continuation of the low interest rate environment and a steady unemployment rate of 4.5% to 5.5%.
0,4%
0,6%
0,8%
1,0%
1,2%
1,4%
1,6%
1,8%
% o
f Cur
rent
Bal
ance
Australian Prime RMBS Delinquencies90+ 60-90 30-60
1,0%
1,5%
2,0%
2,5%
3,0%
3,5%
% o
f Cur
ret B
alan
ce
Australian Prime RMBS 30+ Day Delinquencies2001 2002 2003 2004 2005 2006
2007 2008 2009 2010 2011 2012
Back to ContentsBack to Contents
Australian Prime RMBSMTM YOY
Dec-12 Nov-12 % Change Dec-11 % Change30-60 days 0,57% 0,56% 2,4% 0,59% -3,0%60-90 0,23% 0,20% 13,9% 0,28% -17,3%90+ days 0,64% 0,54% 18,2% 0,72% -11,2%30+ days 1,44% 1,30% 10,8% 1,59% -9,2%
0,0%
0,2%
0,4%
0,6%
Jan-
01
Sep-
01
May
-02
Jan-
03
Sep-
03
May
-04
Jan-
05
Sep-
05
May
-06
Jan-
07
Sep-
07
May
-08
Jan-
09
Sep-
09
May
-10
Jan-
11
Sep-
11
May
-12
% o
0,0%
0,5%
1,0%
1 4 7 10 13 16 19 22 25 28 31 34 37 40 43 46 49 52 55 58 61 64 67 70 73 76 79 82 85 88 91 94 97 100
103
106
109
112
115
118
121
124
127
130
133
136
139
142
% o
f C
Months After Issuance
0,0%
1,0%
2,0%
3,0%
4,0%
5,0%
6,0%
7,0%
Mar
-04
Aug-
04
Jan-
05
Jun-
05
Nov
-05
Apr-
06
Sep-
06
Feb-
07
Jul-0
7
Dec
-07
May
-08
Oct
-08
Mar
-09
Aug-
09
Jan-
10
Jun-
10
Nov
-10
Apr-
11
Sep-
11
Feb-
12
Jul-1
2
Dec
-12
% o
f Cur
rent
Bal
ance
100% Low-Doc Australian Prime RMBS 30+ Day Delinquencies
30+ (ex Low Doc) 30+ (Low Doc only)
Source: Moody's, periodic servicer/issuer reports
Source: Moody's, periodic servicer/issuer reports Source: Moody's, periodic servicer/issuer reports
Australian Non-conforming RMBS Performance Page 27As of Dez 12 Link: Australian RMBS Performance Review: Q4 2012
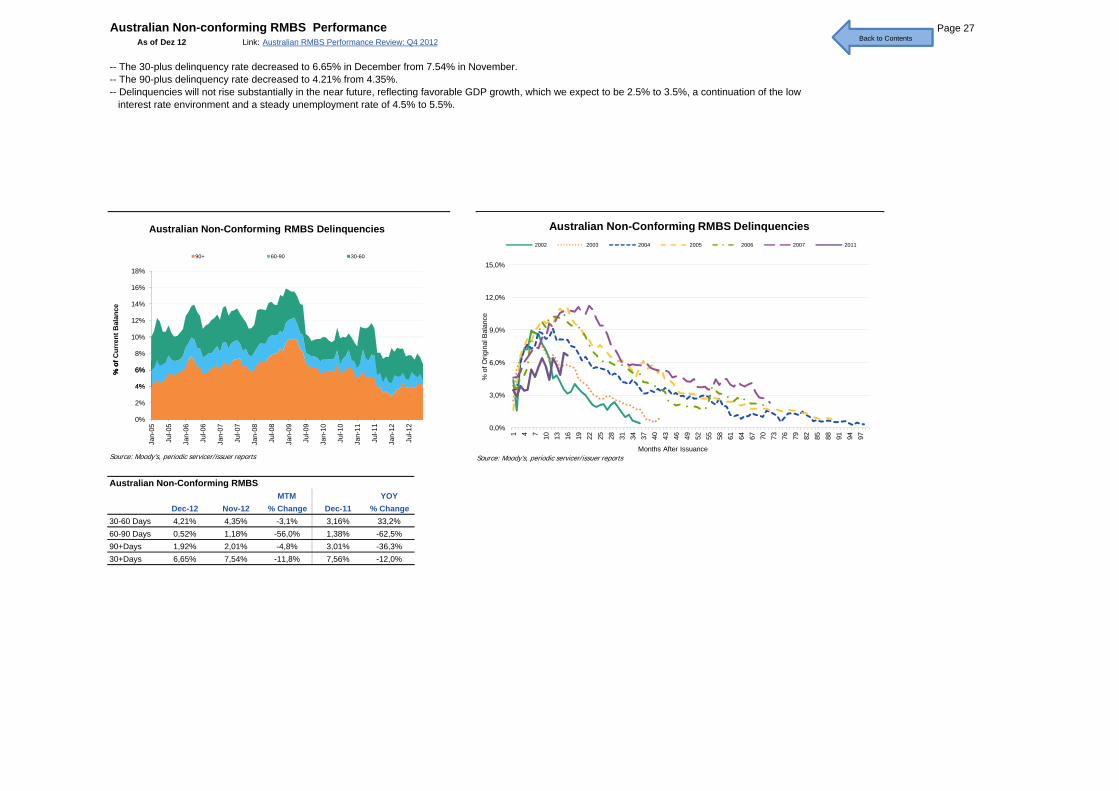
-- The 30-plus delinquency rate decreased to 6.65% in December from 7.54% in November.-- The 90-plus delinquency rate decreased to 4.21% from 4.35%.-- Delinquencies will not rise substantially in the near future, reflecting favorable GDP growth, which we expect to be 2.5% to 3.5%, a continuation of the low interest rate environment and a steady unemployment rate of 4.5% to 5.5%.
4%
6%
8%
10%
12%
14%
16%
18%
% o
f Cur
rent
Bal
ance
Australian Non-Conforming RMBS Delinquencies
90+ 60-90 30-60
6,0%
9,0%
12,0%
15,0%
% o
f Orig
inal
Bal
ance
Australian Non-Conforming RMBS Delinquencies2002 2003 2004 2005 2006 2007 2011
Back to ContentsBack to Contents
Australian Non-Conforming RMBSMTM YOY
Dec-12 Nov-12 % Change Dec-11 % Change30-60 Days 4,21% 4,35% -3,1% 3,16% 33,2%60-90 Days 0,52% 1,18% -56,0% 1,38% -62,5%90+Days 1,92% 2,01% -4,8% 3,01% -36,3%30+Days 6,65% 7,54% -11,8% 7,56% -12,0%
0%
2%
4%
6%
Jan-
05
Jul-0
5
Jan-
06
Jul-0
6
Jan-
07
Jul-0
7
Jan-
08
Jul-0
8
Jan-
09
Jul-0
9
Jan-
10
Jul-1
0
Jan-
11
Jul-1
1
Jan-
12
Jul-1
2
% o
f
0,0%
3,0%
6,0%
1 4 7 10 13 16 19 22 25 28 31 34 37 40 43 46 49 52 55 58 61 64 67 70 73 76 79 82 85 88 91 94 97
% o
f O
Months After IssuanceSource: Moody's, periodic servicer/issuer reports Source: Moody's, periodic servicer/issuer reports
Australian Home Price IndicesAs of Jan 13
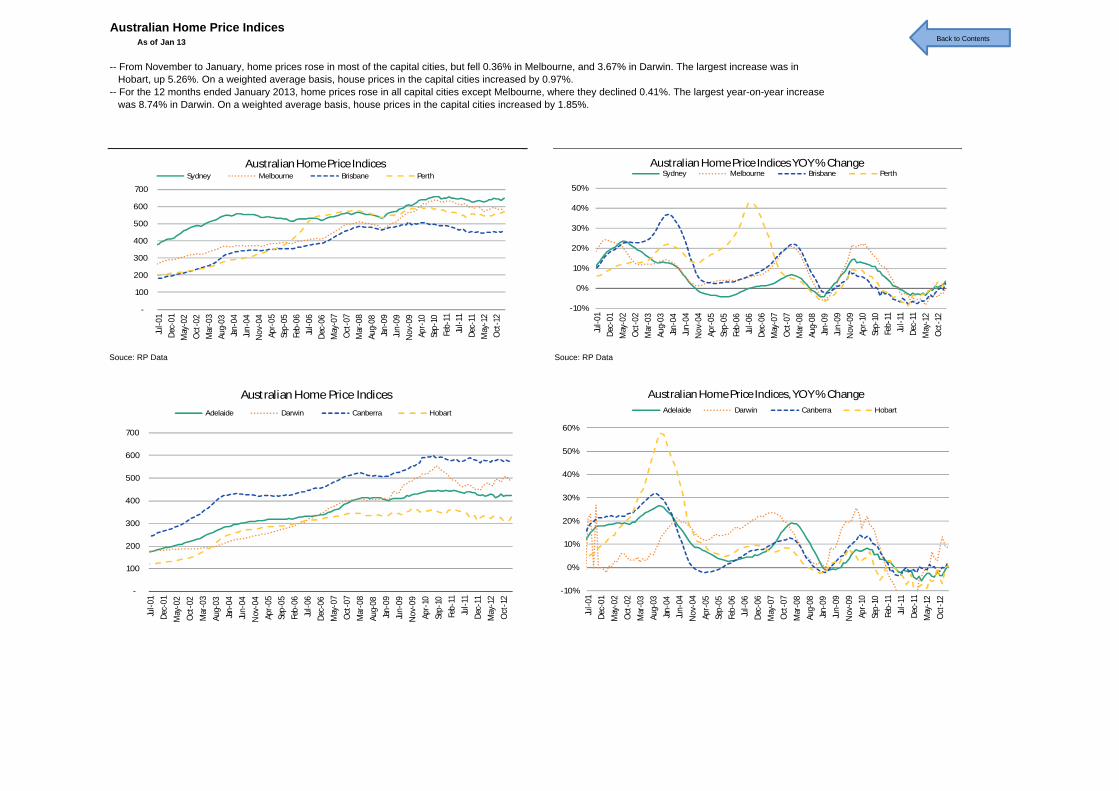
-- From November to January, home prices rose in most of the capital cities, but fell 0.36% in Melbourne, and 3.67% in Darwin. The largest increase was in Hobart, up 5.26%. On a weighted average basis, house prices in the capital cities increased by 0.97%.-- For the 12 months ended January 2013, home prices rose in all capital cities except Melbourne, where they declined 0.41%. The largest year-on-year increase was 8.74% in Darwin. On a weighted average basis, house prices in the capital cities increased by 1.85%.
Souce: RP Data Souce: RP Data
Back to Contents
-
100
200
300
400
500
600
700
Jul-0
1De
c-01
May
-02
Oct
-02
Mar
-03
Aug-
03Ja
n-04
Jun-
04N
ov-0
4Ap
r-05
Sep-
05Fe
b-06
Jul-0
6De
c-06
May
-07
Oct
-07
Mar
-08
Aug-
08Ja
n-09
Jun-
09N
ov-0
9Ap
r-10
Sep-
10Fe
b-11
Jul-1
1De
c-11
May
-12
Oct
-12
Australian Home Price IndicesSydney Melbourne Brisbane Perth
-10%
0%
10%
20%
30%
40%
50%
Jul-0
1De
c-01
May
-02
Oct
-02
Mar
-03
Aug-
03Ja
n-04
Jun-
04N
ov-0
4Ap
r-05
Sep-
05Fe
b-06
Jul-0
6De
c-06
May
-07
Oct
-07
Mar
-08
Aug-
08Ja
n-09
Jun-
09N
ov-0
9Ap
r-10
Sep-
10Fe
b-11
Jul-1
1De
c-11
May
-12
Oct
-12
Australian Home Price Indices YOY % ChangeSydney Melbourne Brisbane Perth
-
100
200
300
400
500
600
700
Jul-0
1De
c-01
May
-02
Oct
-02
Mar
-03
Aug-
03Ja
n-04
Jun-
04N
ov-0
4Ap
r-05
Sep-
05Fe
b-06
Jul-0
6De
c-06
May
-07
Oct
-07
Mar
-08
Aug-
08Ja
n-09
Jun-
09N
ov-0
9Ap
r-10
Sep-
10Fe
b-11
Jul-1
1De
c-11
May
-12
Oct
-12
Australian Home Price IndicesAdelaide Darwin Canberra Hobart
-10%
0%
10%
20%
30%
40%
50%
60%
Jul-0
1De
c-01
May
-02
Oct
-02
Mar
-03
Aug-
03Ja
n-04
Jun-
04N
ov-0
4Ap
r-05
Sep-
05Fe
b-06
Jul-0
6De
c-06
May
-07
Oct
-07
Mar
-08
Aug-
08Ja
n-09
Jun-
09N
ov-0
9Ap
r-10
Sep-
10Fe
b-11
Jul-1
1De
c-11
May
-12
Oct
-12
Australian Home Price Indices, YOY % ChangeAdelaide Darwin Canberra Hobart

Page 28
US CMBS Performance Page 29As of Jan 13 Link: Moody's/RCA CPPI - February 2013 Moody's Delinquency Tracker - February 2013
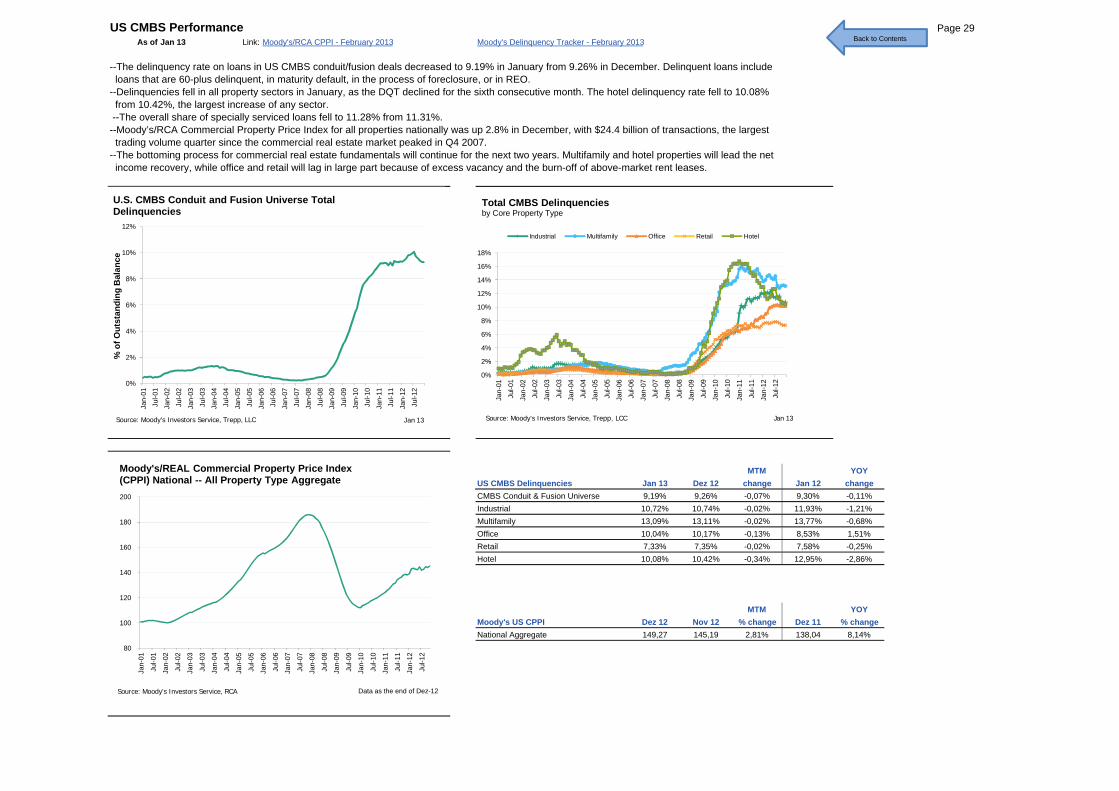
--The delinquency rate on loans in US CMBS conduit/fusion deals decreased to 9.19% in January from 9.26% in December. Delinquent loans include loans that are 60-plus delinquent, in maturity default, in the process of foreclosure, or in REO.--Delinquencies fell in all property sectors in January, as the DQT declined for the sixth consecutive month. The hotel delinquency rate fell to 10.08% from 10.42%, the largest increase of any sector. --The overall share of specially serviced loans fell to 11.28% from 11.31%.--Moody’s/RCA Commercial Property Price Index for all properties nationally was up 2.8% in December, with $24.4 billion of transactions, the largest trading volume quarter since the commercial real estate market peaked in Q4 2007.--The bottoming process for commercial real estate fundamentals will continue for the next two years. Multifamily and hotel properties will lead the net income recovery, while office and retail will lag in large part because of excess vacancy and the burn-off of above-market rent leases.
0%
2%
4%
6%
8%
10%
12%
% o
f Out
stan
ding
Bal
ance
U.S. CMBS Conduit and Fusion Universe Total Delinquencies
0%
2%
4%
6%
8%
10%
12%
14%
16%
18%
-01
-01
-02
-02
-03
-03
-04
-04
-05
-05
-06
-06
-07
-07
-08
-08
-09
-09
-10
-10
-11
-11
-12
-12
Total CMBS Delinquenciesby Core Property Type
Industrial Multifamily Office Retail Hotel
Back to Contents
Data as of end of 00 yyyy MTM YOYUS CMBS Delinquencies Jan 13 Dez 12 change Jan 12 changeCMBS Conduit & Fusion Universe 9,19% 9,26% -0,07% 9,30% -0,11%Industrial 10,72% 10,74% -0,02% 11,93% -1,21%Multifamily 13,09% 13,11% -0,02% 13,77% -0,68%Office 10,04% 10,17% -0,13% 8,53% 1,51%Retail 7,33% 7,35% -0,02% 7,58% -0,25%Hotel 10,08% 10,42% -0,34% 12,95% -2,86%
MTM YOYMoody's US CPPI Dez 12 Nov 12 % change Dez 11 % changeNational Aggregate 149,27 145,19 2,81% 138,04 8,14%
Data as the end of Dez-12
0%
Jan-
01Ju
l-01
Jan-
02
Jul-0
2
Jan-
03
Jul-0
3Ja
n-04
Jul-0
4
Jan-
05
Jul-0
5
Jan-
06Ju
l-06
Jan-
07
Jul-0
7
Jan-
08
Jul-0
8Ja
n-09
Jul-0
9
Jan-
10
Jul-1
0
Jan-
11Ju
l-11
Jan-
12
Jul-1
2Jan 13Source: Moody's Investors Service, Trepp, LLC
0%
2%
Jan-
01
Jul-0
1
Jan-
02
Jul-0
2
Jan-
03
Jul-0
3
Jan-
04
Jul-0
4
Jan-
05
Jul-0
5
Jan-
06
Jul-0
6
Jan-
07
Jul-0
7
Jan-
08
Jul-0
8
Jan-
09
Jul-0
9
Jan-
10
Jul-1
0
Jan-
11
Jul-1
1
Jan-
12
Jul-1
2
Jan 13Source: Moody's Investors Service, Trepp, LCC
80
100
120
140
160
180
200
Jan-
01
Jul-0
1
Jan-
02
Jul-0
2
Jan-
03
Jul-0
3
Jan-
04
Jul-0
4
Jan-
05
Jul-0
5
Jan-
06
Jul-0
6
Jan-
07
Jul-0
7
Jan-
08
Jul-0
8
Jan-
09
Jul-0
9
Jan-
10
Jul-1
0
Jan-
11
Jul-1
1
Jan-
12
Jul-1
2
Moody's/REAL Commercial Property Price Index (CPPI) National -- All Property Type Aggregate
Source: Moody's Investors Service, RCA Data as the end of Dez-12
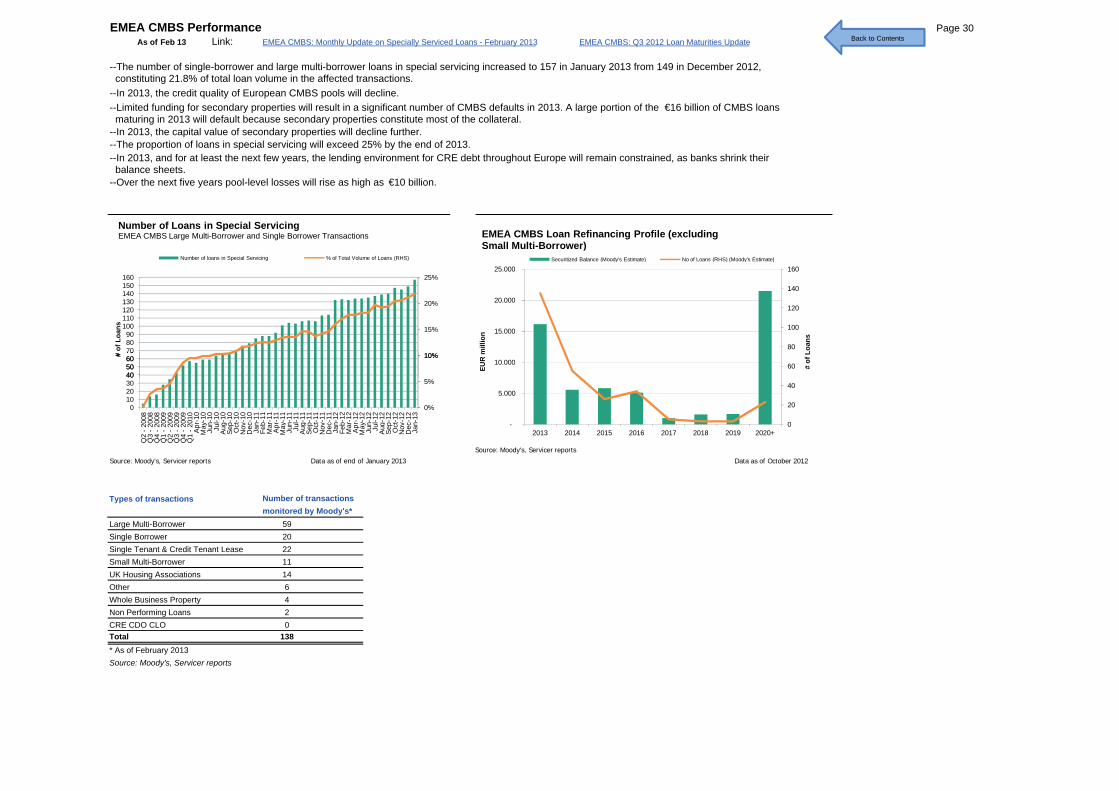
EMEA CMBS Performance Page 30As of Feb 13 Link: EMEA CMBS: Monthly Update on Specially Serviced Loans - February 2013 EMEA CMBS: Q3 2012 Loan Maturities Update
--The number of single-borrower and large multi-borrower loans in special servicing increased to 157 in January 2013 from 149 in December 2012, constituting 21.8% of total loan volume in the affected transactions.--In 2013, the credit quality of European CMBS pools will decline. --Limited funding for secondary properties will result in a significant number of CMBS defaults in 2013. A large portion of the €16 billion of CMBS loans maturing in 2013 will default because secondary properties constitute most of the collateral.--In 2013, the capital value of secondary properties will decline further. --The proportion of loans in special servicing will exceed 25% by the end of 2013.--In 2013, and for at least the next few years, the lending environment for CRE debt throughout Europe will remain constrained, as banks shrink their balance sheets.--Over the next five years pool-level losses will rise as high as €10 billion.
10%
15%
20%
25%
405060708090
100110120130140150160
# of
Loa
ns
Number of Loans in Special ServicingEMEA CMBS Large Multi-Borrower and Single Borrower Transactions
Number of loans in Special Servicing % of Total Volume of Loans (RHS)
60
80
100
120
140
160
10.000
15.000
20.000
25.000
# of
Loa
ns
EUR
mill
ion
EMEA CMBS Loan Refinancing Profile (excluding Small Multi-Borrower)
Securitized Balance (Moody's Estimate) No of Loans (RHS) (Moody's Estimate)
Back to Contents
Types of transactions Number of transactions monitored by Moody's*
Large Multi-Borrower 59Single Borrower 20Single Tenant & Credit Tenant Lease 22Small Multi-Borrower 11UK Housing Associations 14Other 6Whole Business Property 4Non Performing Loans 2CRE CDO CLO 0Total 138* As of February 2013Source: Moody's, Servicer reports
0%
5%
10%
010203040506070
Q2
-200
8Q
3 -2
008
Q4
-200
8Q
1 -2
009
Q2
-200
9Q
3 -2
009
Q4
-200
9Q
1 -2
010
Apr-
10M
a y-1
0Ju
n-10
Jul-1
0Au
g-10
Sep-
10O
ct-1
0N
ov-1
0D
ec-1
0Ja
n-11
Feb-
11M
ar-1
1Ap
r-11
Ma y
-11
Jun-
11Ju
l-11
Aug-
11Se
p-11
Oct
-11
Nov
-11
Dec
-11
Jan-
12Fe
b-12
Mar
-12
Apr-
12M
ay-1
2Ju
n-12
Jul-1
2Au
g-12
Sep-
12O
ct-1
2N
ov-1
2D
ec-1
2Ja
n-13
#
0
20
40
60
-
5.000
10.000
2013 2014 2015 2016 2017 2018 2019 2020+
# of
L
EUR
m
Source: Moody's, Servicer reports Data as of end of January 2013 Data as of October 2012
Source: Moody's, Servicer reports
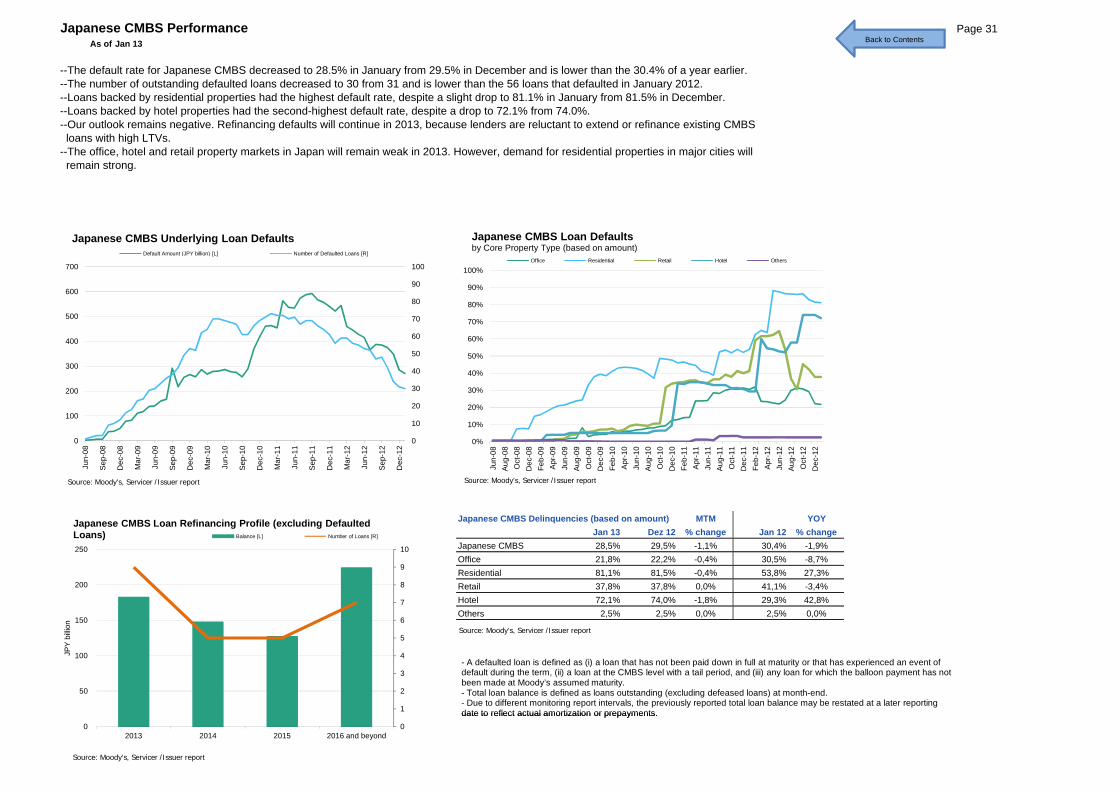
Japanese CMBS Performance Page 31As of Jan 13
--The default rate for Japanese CMBS decreased to 28.5% in January from 29.5% in December and is lower than the 30.4% of a year earlier.--The number of outstanding defaulted loans decreased to 30 from 31 and is lower than the 56 loans that defaulted in January 2012.--Loans backed by residential properties had the highest default rate, despite a slight drop to 81.1% in January from 81.5% in December.--Loans backed by hotel properties had the second-highest default rate, despite a drop to 72.1% from 74.0%.--Our outlook remains negative. Refinancing defaults will continue in 2013, because lenders are reluctant to extend or refinance existing CMBS loans with high LTVs.--The office, hotel and retail property markets in Japan will remain weak in 2013. However, demand for residential properties in major cities will remain strong.
30
40
50
60
70
80
90
100
200
300
400
500
600
700
Japanese CMBS Underlying Loan DefaultsDefault Amount (JPY billion) [L] Number of Defaulted Loans [R]
30%
40%
50%
60%
70%
80%
90%
100%
Japanese CMBS Loan Defaultsby Core Property Type (based on amount)
Office Residential Retail Hotel Others
Back to Contents
Japanese CMBS Delinquencies (based on amount) MTM YOYJan 13 Dez 12 % change Jan 12 % change
Japanese CMBS 28,5% 29,5% -1,1% 30,4% -1,9%Office 21,8% 22,2% -0,4% 30,5% -8,7%Residential 81,1% 81,5% -0,4% 53,8% 27,3%Retail 37,8% 37,8% 0,0% 41,1% -3,4%Hotel 72,1% 74,0% -1,8% 29,3% 42,8%Others 2,5% 2,5% 0,0% 2,5% 0,0%
0
10
20
30
40
0
100
200
300
Jun-
08
Sep
-08
Dec
-08
Mar
-09
Jun-
09
Sep
-09
Dec
-09
Mar
-10
Jun-
10
Sep
-10
Dec
-10
Mar
-11
Jun-
11
Sep
-11
Dec
-11
Mar
-12
Jun-
12
Sep
-12
Dec
-12
- A defaulted loan is defined as (i) a loan that has not been paid down in full at maturity or that has experienced an event ofdefault during the term, (ii) a loan at the CMBS level with a tail period, and (iii) any loan for which the balloon payment has not been made at Moody’s assumed maturity.- Total loan balance is defined as loans outstanding (excluding defeased loans) at month-end.- Due to different monitoring report intervals, the previously reported total loan balance may be restated at a later reportingdate to reflect actual amortization or prepayments.
0%
10%
20%
30%
40%
Jun-
08A
ug-0
8O
ct-0
8D
ec-0
8Fe
b-09
Apr
-09
Jun-
09A
ug-0
9O
ct-0
9D
ec-0
9Fe
b-10
Apr
-10
Jun-
10A
ug-1
0O
ct-1
0D
ec-1
0Fe
b-11
Apr
-11
Jun-
11A
ug-1
1O
ct-1
1D
ec-1
1Fe
b-12
Apr
-12
Jun-
12A
ug-1
2O
ct-1
2D
ec-1
2
0
1
2
3
4
5
6
7
8
9
10
0
50
100
150
200
250
2013 2014 2015 2016 and beyond
JPY
billio
n
Balance [L] Number of Loans [R]
Japanese CMBS Loan Refinancing Profile (excluding Defaulted Loans)
Source: Moody's, Servicer /Issuer report Source: Moody's, Servicer /Issuer report
Source: Moody's, Servicer /Issuer report
date to reflect actual amortization or prepayments.00
2013 2014 2015 2016 and beyond
Source: Moody's, Servicer /Issuer report
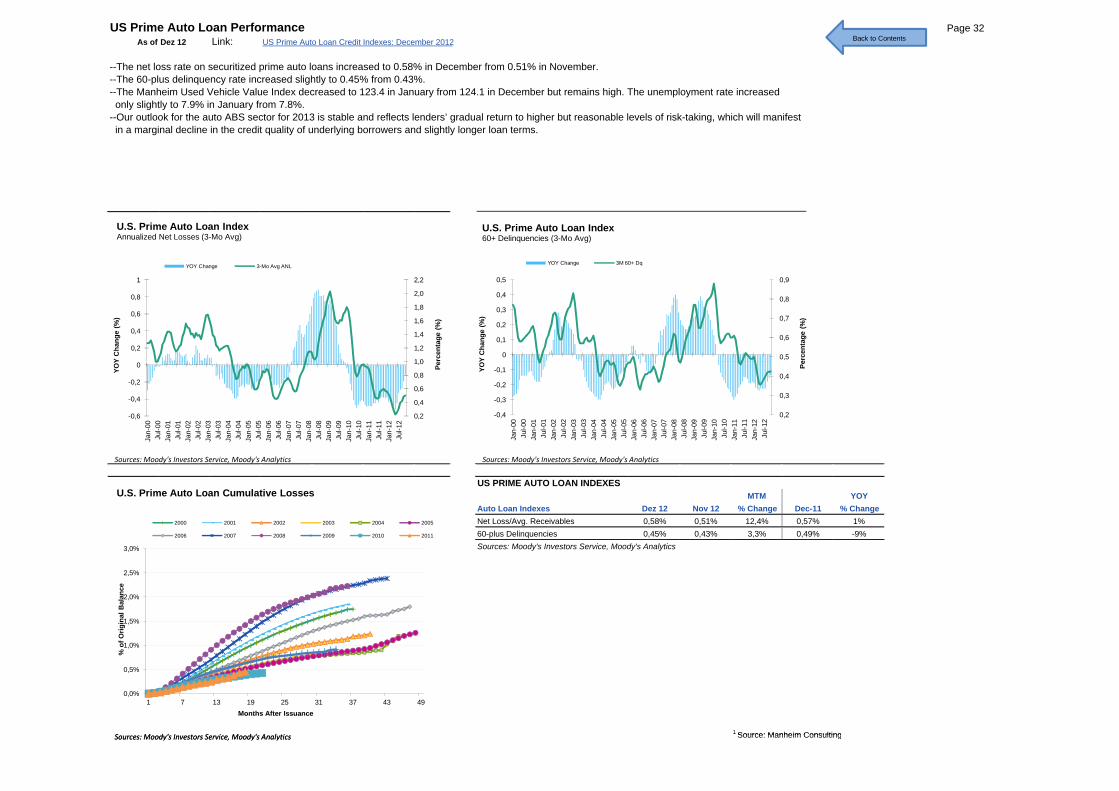
US Prime Auto Loan Performance Page 32As of Dez 12 Link: US Prime Auto Loan Credit Indexes: December 2012
--The net loss rate on securitized prime auto loans increased to 0.58% in December from 0.51% in November.--The 60-plus delinquency rate increased slightly to 0.45% from 0.43%.--The Manheim Used Vehicle Value Index decreased to 123.4 in January from 124.1 in December but remains high. The unemployment rate increased only slightly to 7.9% in January from 7.8%.--Our outlook for the auto ABS sector for 2013 is stable and reflects lenders’ gradual return to higher but reasonable levels of risk-taking, which will manifest in a marginal decline in the credit quality of underlying borrowers and slightly longer loan terms.
0 6
0,8
1,0
1,2
1,4
1,6
1,8
2,0
2,2
-0,2
0
0,2
0,4
0,6
0,8
1
Perc
enta
ge (%
)
YOY
Cha
nge
(%)
U.S. Prime Auto Loan IndexAnnualized Net Losses (3-Mo Avg)
YOY Change 3-Mo Avg ANL
0,4
0,5
0,6
0,7
0,8
0,9
-0,2
-0,1
0
0,1
0,2
0,3
0,4
0,5
Perc
enta
ge (%
)
YOY
Cha
nge
(%)
U.S. Prime Auto Loan Index60+ Delinquencies (3-Mo Avg)
YOY Change 3M 60+ Dq
Back to Contents
US PRIME AUTO LOAN INDEXESMTM YOY
Auto Loan Indexes Dez 12 Nov 12 % Change Dec-11 % ChangeNet Loss/Avg. Receivables 0,58% 0,51% 12,4% 0,57% 1%60-plus Delinquencies 0,45% 0,43% 3,3% 0,49% -9%Sources: Moody's Investors Service, Moody's Analytics
1 Source: Manheim Consulting
0,2
0,4
0,6
0,8
1,0
-0,6
-0,4
-0,2
0
Jan-
00Ju
l-00
Jan-
01Ju
l-01
Jan-
02Ju
l-02
Jan-
03Ju
l-03
Jan-
04Ju
l-04
Jan-
05Ju
l-05
Jan-
06Ju
l-06
Jan-
07Ju
l-07
Jan-
08Ju
l-08
Jan-
09Ju
l-09
Jan-
10Ju
l-10
Jan-
11Ju
l-11
Jan-
12Ju
l-12
PeYOY
0,2
0,3
0,4
-0,4
-0,3
-0,2
-0,1
Jan-
00Ju
l-00
Jan-
01Ju
l-01
Jan-
02Ju
l-02
Jan-
03Ju
l-03
Jan-
04Ju
l-04
Jan-
05Ju
l-05
Jan-
06Ju
l-06
Jan-
07Ju
l-07
Jan-
08Ju
l-08
Jan-
09Ju
l-09
Jan-
10Ju
l-10
Jan-
11Ju
l-11
Jan-
12Ju
l-12
P eYOY
0,0%
0,5%
1,0%
1,5%
2,0%
2,5%
3,0%
1 7 13 19 25 31 37 43 49
% o
f Orig
inal
Bal
ance
Months After Issuance
U.S. Prime Auto Loan Cumulative Losses
2000 2001 2002 2003 2004 2005
2006 2007 2008 2009 2010 2011
Sources: Moody's Investors Service, Moody's Analytics Sources: Moody's Investors Service, Moody's Analytics
Sources: Moody's Investors Service, Moody's Analytics1 Source: Manheim Consulting
Months After Issuance
Sources: Moody's Investors Service, Moody's Analytics
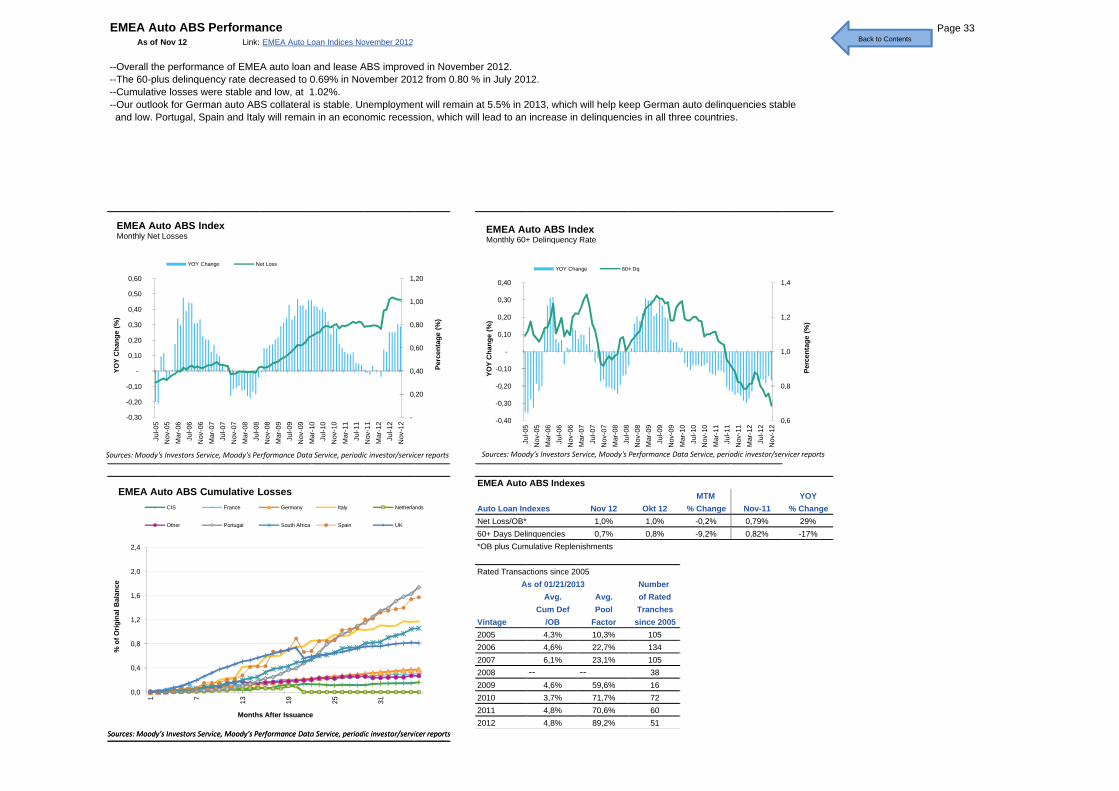
EMEA Auto ABS Performance Page 33As of Nov 12 Link: EMEA Auto Loan Indices November 2012
--Overall the performance of EMEA auto loan and lease ABS improved in November 2012.--The 60-plus delinquency rate decreased to 0.69% in November 2012 from 0.80 % in July 2012.--Cumulative losses were stable and low, at 1.02%. --Our outlook for German auto ABS collateral is stable. Unemployment will remain at 5.5% in 2013, which will help keep German auto delinquencies stable and low. Portugal, Spain and Italy will remain in an economic recession, which will lead to an increase in delinquencies in all three countries.
0,40
0,60
0,80
1,00
1,20
-0 10
-
0,10
0,20
0,30
0,40
0,50
0,60
Perc
enta
ge (%
)
YOY
Cha
nge
(%)
EMEA Auto ABS IndexMonthly Net Losses
YOY Change Net Loss
0 8
1,0
1,2
1,4
-0 20
-0,10
-
0,10
0,20
0,30
0,40
Perc
enta
ge (%
)
YOY
Cha
nge
(%)
EMEA Auto ABS IndexMonthly 60+ Delinquency Rate
YOY Change 60+ Dq
Back to Contents
EMEA Auto ABS IndexesMTM YOY
Auto Loan Indexes Nov 12 Okt 12 % Change Nov-11 % ChangeNet Loss/OB* 1,0% 1,0% -0,2% 0,79% 29%60+ Days Delinquencies 0,7% 0,8% -9,2% 0,82% -17%*OB plus Cumulative Replenishments
Rated Transactions since 2005As of 01/21/2013 Number
Avg. Avg. of RatedCum Def Pool Tranches
Vintage /OB Factor since 20052005 4,3% 10,3% 1052006 4,6% 22,7% 1342007 6,1% 23,1% 1052008 -- -- 382009 4,6% 59,6% 162010 3,7% 71,7% 722011 4,8% 70,6% 602012 4,8% 89,2% 51
-
0,20
0,40
-0,30
-0,20
-0,10
-
Jul-0
5N
ov-0
5M
ar-0
6Ju
l-06
Nov
-06
Mar
-07
Jul-0
7N
ov-0
7M
ar-0
8Ju
l-08
Nov
-08
Mar
-09
Jul-0
9N
ov-0
9M
ar-1
0Ju
l-10
Nov
-10
Mar
-11
Jul-1
1N
ov-1
1M
ar-1
2Ju
l-12
Nov
-12
PeYOY
0,6
0,8
-0,40
-0,30
-0,20
-0,10
Jul-0
5N
ov-0
5M
ar-0
6Ju
l-06
Nov
-06
Mar
-07
Jul-0
7N
ov-0
7M
ar-0
8Ju
l-08
Nov
-08
Mar
-09
Jul-0
9N
ov-0
9M
ar-1
0Ju
l-10
Nov
-10
Mar
-11
Jul-1
1N
ov-1
1M
ar-1
2Ju
l-12
Nov
-12
Per c
YOY
0,0
0,4
0,8
1,2
1,6
2,0
2,4
1 7 13 19 25 31
% o
f Orig
inal
Bal
ance
Months After Issuance
EMEA Auto ABS Cumulative LossesCIS France Germany Italy Netherlands
Other Portugal South Africa Spain UK
Sources: Moody's Investors Service, Moody's Performance Data Service, periodic investor/servicer reports Sources: Moody's Investors Service, Moody's Performance Data Service, periodic investor/servicer reports
Sources: Moody's Investors Service, Moody's Performance Data Service, periodic investor/servicer reports
Months After Issuance
Sources: Moody's Investors Service, Moody's Performance Data Service, periodic investor/servicer reports
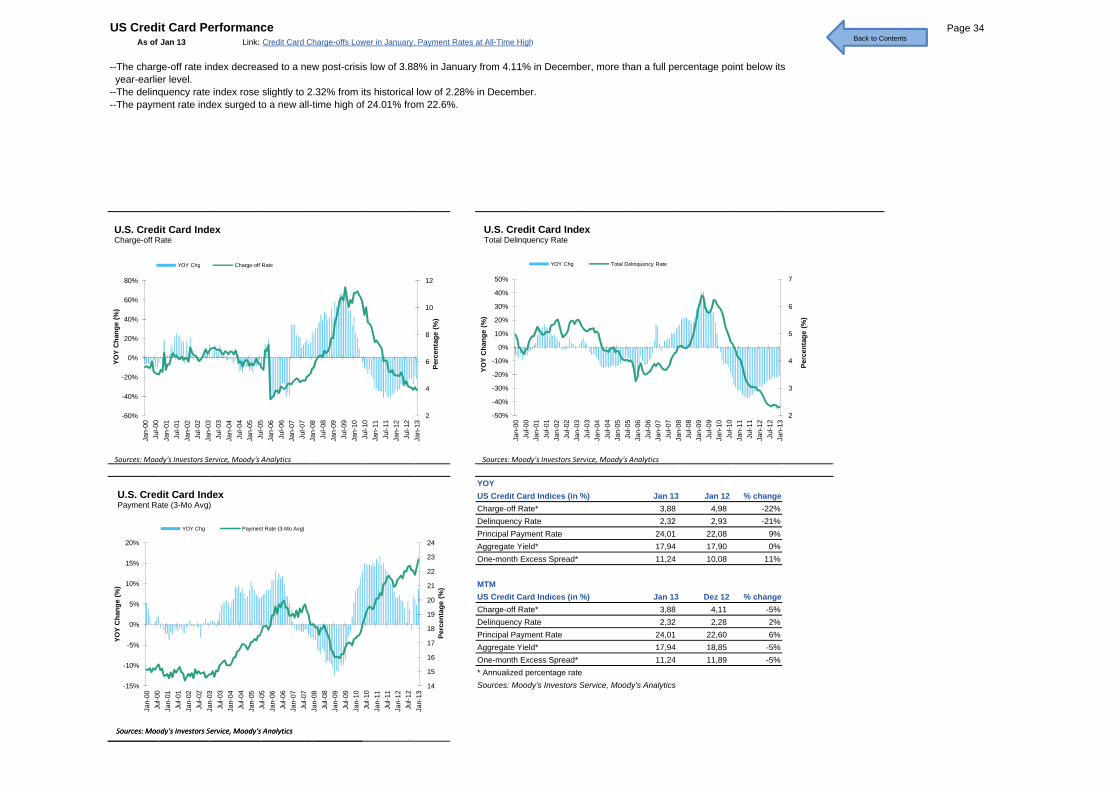
US Credit Card Performance Page 34As of Jan 13 Link: Credit Card Charge-offs Lower in January, Payment Rates at All-Time High
--The charge-off rate index decreased to a new post-crisis low of 3.88% in January from 4.11% in December, more than a full percentage point below its year-earlier level.--The delinquency rate index rose slightly to 2.32% from its historical low of 2.28% in December.--The payment rate index surged to a new all-time high of 24.01% from 22.6%.
4
6
8
10
12
-20%
0%
20%
40%
60%
80%
Perc
enta
ge (%
)
YOY
Cha
nge
(%)
U.S. Credit Card IndexCharge-off Rate
YOY Chg Charge-off Rate
3
4
5
6
7
30%
-20%
-10%
0%
10%
20%
30%
40%
50%
Perc
enta
ge (%
)
YOY
Cha
nge
(%)
U.S. Credit Card IndexTotal Delinquency Rate
YOY Chg Total Delinquency Rate
Back to Contents
YOYUS Credit Card Indices (in %) Jan 13 Jan 12 % changeCharge-off Rate* 3,88 4,98 -22%Delinquency Rate 2,32 2,93 -21%Principal Payment Rate 24,01 22,08 9%Aggregate Yield* 17,94 17,90 0%One-month Excess Spread* 11,24 10,08 11%
MTMUS Credit Card Indices (in %) Jan 13 Dez 12 % changeCharge-off Rate* 3,88 4,11 -5%Delinquency Rate 2,32 2,28 2%Principal Payment Rate 24,01 22,60 6%Aggregate Yield* 17,94 18,85 -5%One-month Excess Spread* 11,24 11,89 -5%* Annualized percentage rateSources: Moody's Investors Service, Moody's Analytics
2
4
6
-60%
-40%
-20%
Jan-
00Ju
l-00
Jan-
01Ju
l-01
Jan-
02Ju
l-02
Jan-
03Ju
l-03
Jan-
04Ju
l-04
Jan-
05Ju
l-05
Jan-
06Ju
l-06
Jan-
07Ju
l-07
Jan-
08Ju
l-08
Jan-
09Ju
l-09
Jan-
10Ju
l-10
Jan-
11Ju
l-11
Jan-
12Ju
l-12
Jan-
13
PeY
2
3
4
-50%
-40%
-30%
-20%
-10%
Jan-
00Ju
l-00
Jan-
01Ju
l-01
Jan-
02Ju
l-02
Jan-
03Ju
l-03
Jan-
04Ju
l-04
Jan-
05Ju
l-05
Jan-
06Ju
l-06
Jan-
07Ju
l-07
Jan-
08Ju
l-08
Jan-
09Ju
l-09
Jan-
10Ju
l-10
Jan-
11Ju
l-11
Jan-
12Ju
l-12
Jan-
13
P eYOY
14
15
16
17
18
19
20
21
22
23
24
-15%
-10%
-5%
0%
5%
10%
15%
20%
Jan-
00Ju
l-00
Jan-
01Ju
l-01
Jan-
02Ju
l-02
Jan-
03Ju
l-03
Jan-
04Ju
l-04
Jan-
05Ju
l-05
Jan-
06Ju
l-06
Jan-
07Ju
l-07
Jan-
08Ju
l-08
Jan-
09Ju
l-09
Jan-
10Ju
l-10
Jan-
11Ju
l-11
Jan-
12Ju
l-12
Jan-
13
Perc
enta
ge (%
)
YOY
Cha
nge
(%)
U.S. Credit Card IndexPayment Rate (3-Mo Avg)
YOY Chg Payment Rate (3-Mo Avg)
Sources: Moody's Investors Service, Moody's Analytics Sources: Moody's Investors Service, Moody's Analytics
Sources: Moody's Investors Service, Moody's AnalyticsSources: Moody's Investors Service, Moody's Analytics
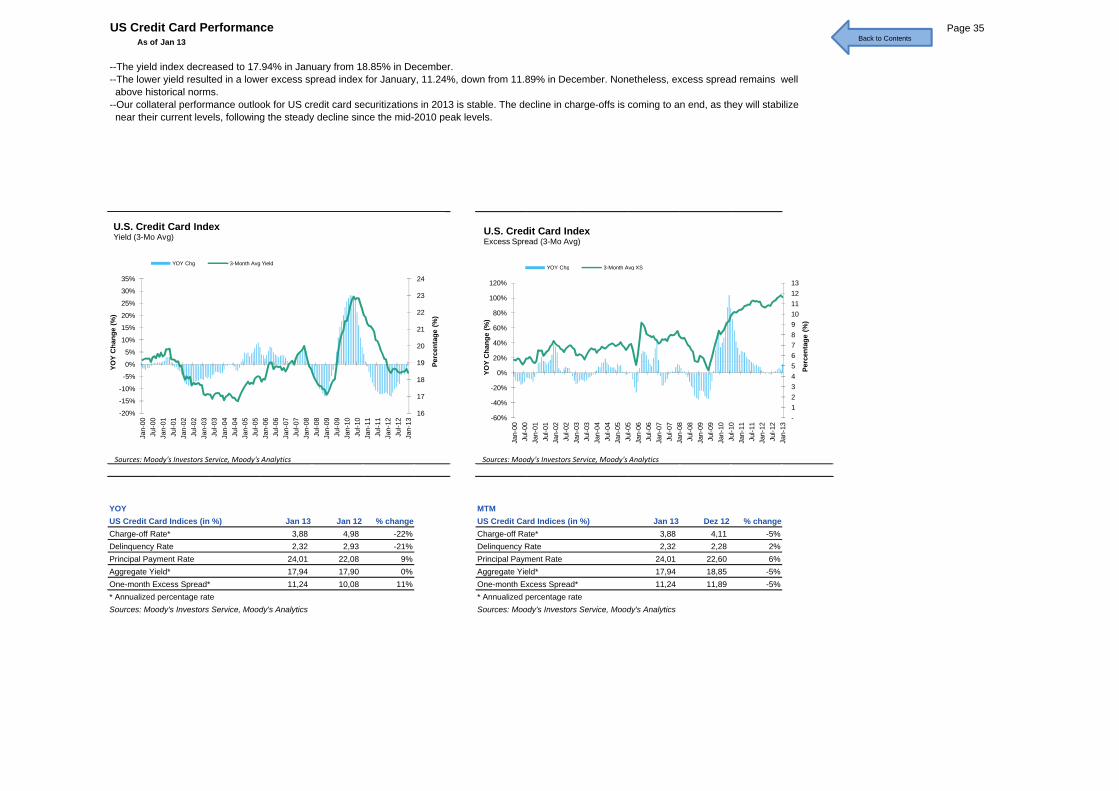
US Credit Card Performance Page 35As of Jan 13
--The yield index decreased to 17.94% in January from 18.85% in December. --The lower yield resulted in a lower excess spread index for January, 11.24%, down from 11.89% in December. Nonetheless, excess spread remains well above historical norms. --Our collateral performance outlook for US credit card securitizations in 2013 is stable. The decline in charge-offs is coming to an end, as they will stabilize near their current levels, following the steady decline since the mid-2010 peak levels.
18
19
20
21
22
23
24
10%
-5%
0%
5%
10%
15%
20%
25%
30%
35%
Perc
enta
ge (%
)
YOY
Cha
nge
(%)
U.S. Credit Card IndexYield (3-Mo Avg)
YOY Chg 3-Month Avg Yield
34 5 6 7 8 9 10 11 12 13
20%
0%
20%
40%
60%
80%
100%
120%
Perc
enta
ge (%
)
YOY
Cha
nge
(%)
U.S. Credit Card IndexExcess Spread (3-Mo Avg)
YOY Chg 3-Month Avg XS
Back to Contents
YOY MTMUS Credit Card Indices (in %) Jan 13 Jan 12 % change US Credit Card Indices (in %) Jan 13 Dez 12 % changeCharge-off Rate* 3,88 4,98 -22% Charge-off Rate* 3,88 4,11 -5%Delinquency Rate 2,32 2,93 -21% Delinquency Rate 2,32 2,28 2%Principal Payment Rate 24,01 22,08 9% Principal Payment Rate 24,01 22,60 6%Aggregate Yield* 17,94 17,90 0% Aggregate Yield* 17,94 18,85 -5%One-month Excess Spread* 11,24 10,08 11% One-month Excess Spread* 11,24 11,89 -5%* Annualized percentage rate * Annualized percentage rateSources: Moody's Investors Service, Moody's Analytics Sources: Moody's Investors Service, Moody's Analytics
16
17
18
19
-20%
-15%
-10%
-5%
0%
Jan-
00Ju
l-00
Jan-
01Ju
l-01
Jan-
02Ju
l-02
Jan-
03Ju
l-03
Jan-
04Ju
l-04
Jan-
05Ju
l-05
Jan-
06Ju
l-06
Jan-
07Ju
l-07
Jan-
08Ju
l-08
Jan-
09Ju
l-09
Jan-
10Ju
l-10
Jan-
11Ju
l-11
Jan-
12Ju
l-12
Jan-
13
P eYO
-1 2 3 4 5
-60%
-40%
-20%
0%
Jan-
00Ju
l-00
Jan-
01Ju
l-01
Jan-
02Ju
l-02
Jan-
03Ju
l-03
Jan-
04Ju
l-04
Jan-
05Ju
l-05
Jan-
06Ju
l-06
Jan-
07Ju
l-07
Jan-
08Ju
l-08
Jan-
09Ju
l-09
Jan-
10Ju
l-10
Jan-
11Ju
l-11
Jan-
12Ju
l-12
Jan-
13
Per
YOY
Sources: Moody's Investors Service, Moody's Analytics Sources: Moody's Investors Service, Moody's Analytics
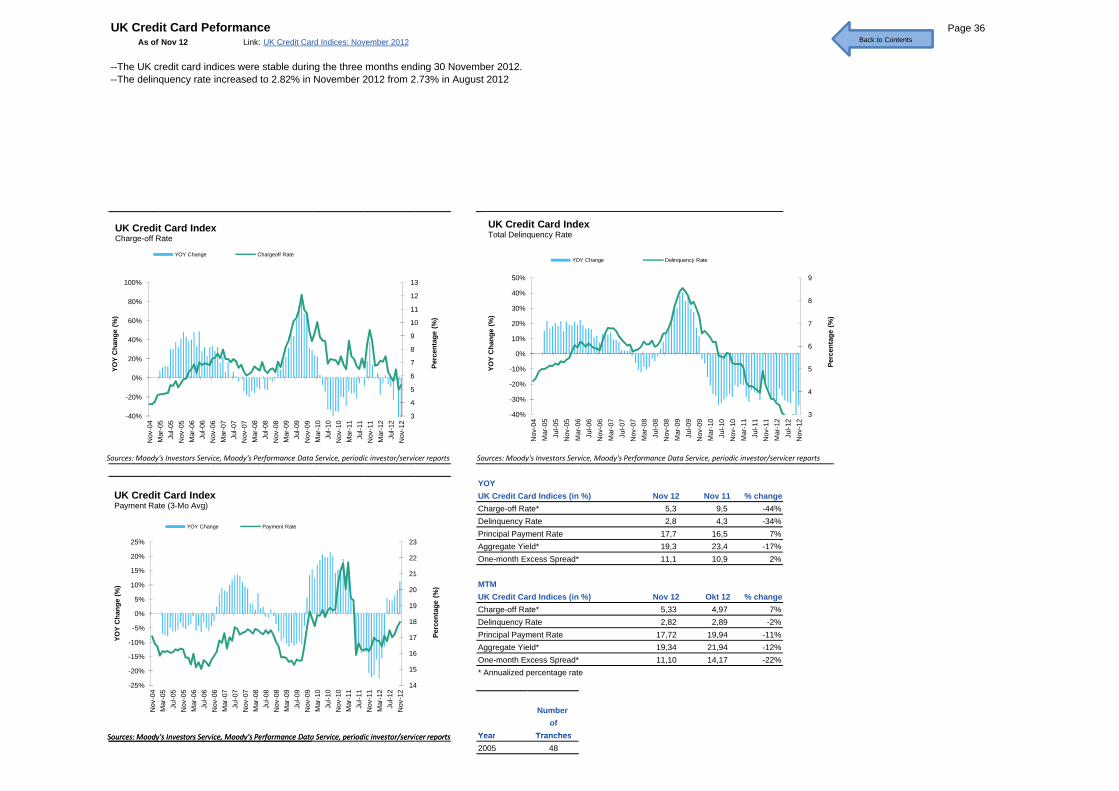
UK Credit Card Peformance Page 36As of Nov 12 Link: UK Credit Card Indices: November 2012
--The UK credit card indices were stable during the three months ending 30 November 2012.--The delinquency rate increased to 2.82% in November 2012 from 2.73% in August 2012
5
6
7
8
9
10
11
12
13
0%
20%
40%
60%
80%
100%
Perc
enta
ge (%
)
YOY
Cha
nge
(%)
UK Credit Card IndexCharge-off Rate
YOY Change Chargeoff Rate
5
6
7
8
9
-20%
-10%
0%
10%
20%
30%
40%
50%
Perc
enta
ge (%
)
YOY
Cha
nge
(%)
UK Credit Card IndexTotal Delinquency Rate
YOY Change Delinquency Rate
Back to ContentsBack to ContentsBack to ContentsBack to Contents
YOYUK Credit Card Indices (in %) Nov 12 Nov 11 % changeCharge-off Rate* 5,3 9,5 -44% 3Delinquency Rate 2,8 4,3 -34% 6Principal Payment Rate 17,7 16,5 7% 5Aggregate Yield* 19,3 23,4 -17% 2One-month Excess Spread* 11,1 10,9 2% 4
MTMUK Credit Card Indices (in %) Nov 12 Okt 12 % changeCharge-off Rate* 5,33 4,97 7% 3Delinquency Rate 2,82 2,89 -2% 6Principal Payment Rate 17,72 19,94 -11% 5Aggregate Yield* 19,34 21,94 -12% 2One-month Excess Spread* 11,10 14,17 -22% 4* Annualized percentage rate
Number of
Year Tranches
3
4
5
6
7
-40%
-20%
0%
%
Nov
-04
Mar
-05
Jul-0
5N
ov-0
5M
ar-0
6Ju
l-06
Nov
-06
Mar
-07
Jul-0
7N
ov-0
7M
ar-0
8Ju
l-08
Nov
-08
Mar
-09
Jul-0
9N
ov-0
9M
ar-1
0Ju
l-10
Nov
-10
Mar
-11
Jul-1
1N
ov-1
1M
ar-1
2Ju
l-12
Nov
-12
PeYOY
3
4
5
-40%
-30%
-20%
-10%
Nov
-04
Mar
-05
Jul-0
5N
ov-0
5M
ar-0
6Ju
l-06
Nov
-06
Mar
-07
Jul-0
7N
ov-0
7M
ar-0
8Ju
l-08
Nov
-08
Mar
-09
Jul-0
9N
ov-0
9M
ar-1
0Ju
l-10
Nov
-10
Mar
-11
Jul-1
1N
ov-1
1M
ar-1
2Ju
l-12
Nov
-12
PeYO
14
15
16
17
18
19
20
21
22
23
-25%
-20%
-15%
-10%
-5%
0%
5%
10%
15%
20%
25%
Nov
-04
Mar
-05
Jul-0
5N
ov-0
5M
ar-0
6Ju
l-06
Nov
-06
Mar
-07
Jul-0
7N
ov-0
7M
ar-0
8Ju
l-08
Nov
-08
Mar
-09
Jul-0
9N
ov-0
9M
ar-1
0Ju
l-10
Nov
-10
Mar
-11
Jul-1
1N
ov-1
1M
ar-1
2Ju
l-12
Nov
-12
Perc
enta
ge (%
)
YOY
Cha
nge
(%)
UK Credit Card IndexPayment Rate (3-Mo Avg)
YOY Change Payment Rate
Sources: Moody's Investors Service, Moody's Performance Data Service, periodic investor/servicer reports Sources: Moody's Investors Service, Moody's Performance Data Service, periodic investor/servicer reports
Sources: Moody's Investors Service, Moody's Performance Data Service, periodic investor/servicer reports Year Tranches2005 48
Sources: Moody's Investors Service, Moody's Performance Data Service, periodic investor/servicer reports
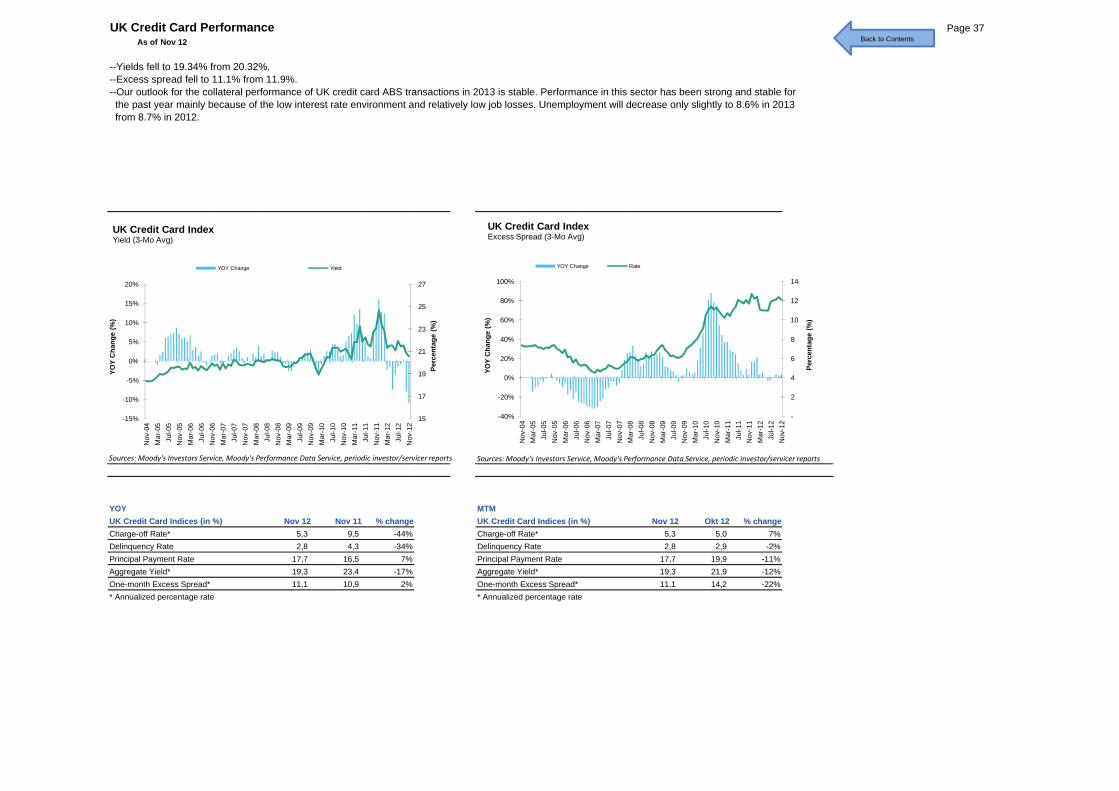
UK Credit Card Performance Page 37As of Nov 12
--Yields fell to 19.34% from 20.32%.--Excess spread fell to 11.1% from 11.9%.--Our outlook for the collateral performance of UK credit card ABS transactions in 2013 is stable. Performance in this sector has been strong and stable for the past year mainly because of the low interest rate environment and relatively low job losses. Unemployment will decrease only slightly to 8.6% in 2013 from 8.7% in 2012.
19
21
23
25
27
-5%
0%
5%
10%
15%
20%
Perc
enta
ge (%
)
YOY
Cha
nge
(%)
UK Credit Card IndexYield (3-Mo Avg)
YOY Change Yield
4
6
8
10
12
14
0%
20%
40%
60%
80%
100%
Perc
enta
ge (%
)
YOY
Cha
nge
(%)
UK Credit Card IndexExcess Spread (3-Mo Avg)
YOY Change Rate
Back to Contents
YOY MTMUK Credit Card Indices (in %) Nov 12 Nov 11 % change UK Credit Card Indices (in %) Nov 12 Okt 12 % changeCharge-off Rate* 5,3 9,5 -44% Charge-off Rate* 5,3 5,0 7%Delinquency Rate 2,8 4,3 -34% Delinquency Rate 2,8 2,9 -2%Principal Payment Rate 17,7 16,5 7% Principal Payment Rate 17,7 19,9 -11%Aggregate Yield* 19,3 23,4 -17% Aggregate Yield* 19,3 21,9 -12%One-month Excess Spread* 11,1 10,9 2% One-month Excess Spread* 11,1 14,2 -22%* Annualized percentage rate * Annualized percentage rate
15
17
19
-15%
-10%
-5%
0%
Nov
-04
Mar
-05
Jul-0
5N
ov-0
5M
ar-0
6Ju
l-06
Nov
-06
Mar
-07
Jul-0
7N
ov-0
7M
ar-0
8Ju
l-08
Nov
-08
Mar
-09
Jul-0
9N
ov-0
9M
ar-1
0Ju
l-10
Nov
-10
Mar
-11
Jul-1
1N
ov-1
1M
ar-1
2Ju
l-12
Nov
-12
Per
YOY
-
2
4
-40%
-20%
0%
Nov
-04
Mar
-05
Jul-0
5N
ov-0
5M
ar-0
6Ju
l-06
Nov
-06
Mar
-07
Jul-0
7N
ov-0
7M
ar-0
8Ju
l-08
Nov
-08
Mar
-09
Jul-0
9N
ov-0
9M
ar-1
0Ju
l-10
Nov
-10
Mar
-11
Jul-1
1N
ov-1
1M
ar-1
2Ju
l-12
Nov
-12
Per
YOY
Sources: Moody's Investors Service, Moody's Performance Data Service, periodic investor/servicer reports Sources: Moody's Investors Service, Moody's Performance Data Service, periodic investor/servicer reports
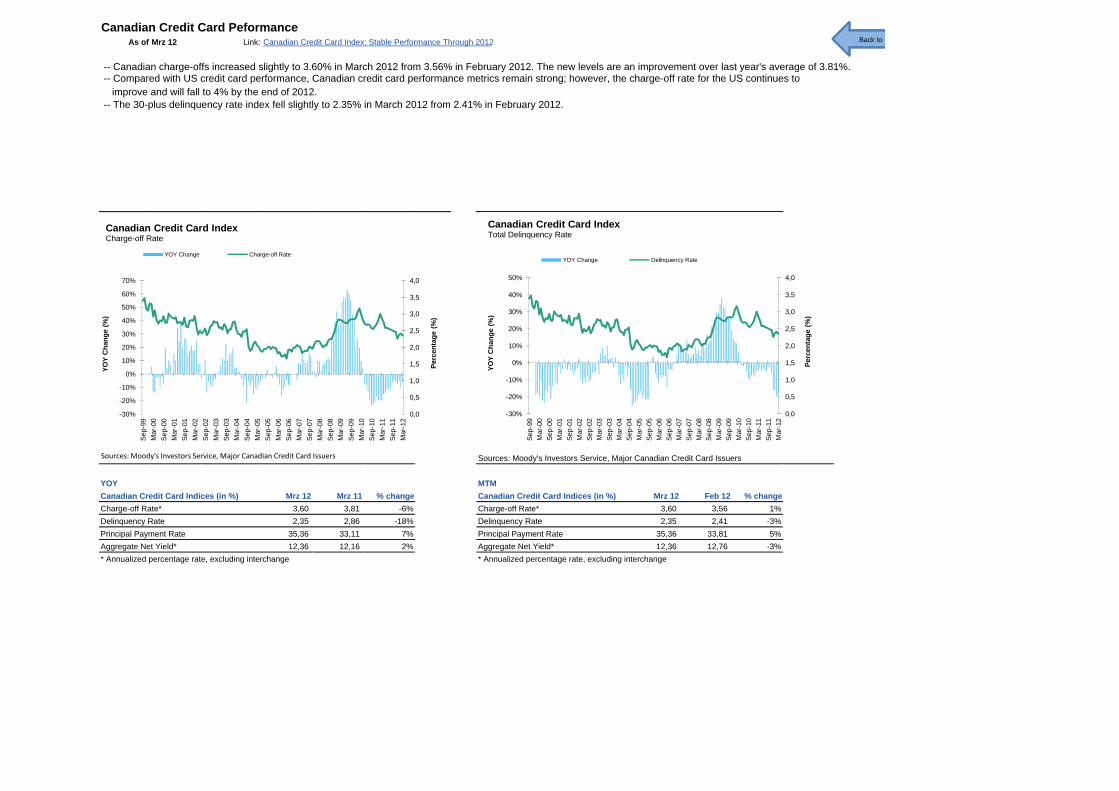
Canadian Credit Card PeformanceAs of Mrz 12 Link: Canadian Credit Card Index: Stable Performance Through 2012
-- Canadian charge-offs increased slightly to 3.60% in March 2012 from 3.56% in February 2012. The new levels are an improvement over last year's average of 3.81%. -- Compared with US credit card performance, Canadian credit card performance metrics remain strong; however, the charge-off rate for the US continues to improve and will fall to 4% by the end of 2012. -- The 30-plus delinquency rate index fell slightly to 2.35% in March 2012 from 2.41% in February 2012.
1,0
1,5
2,0
2,5
3,0
3,5
4,0
-10%
0%
10%
20%
30%
40%
50%
60%
70%
Perc
enta
ge (%
)
YOY
Cha
nge
(%)
Canadian Credit Card IndexCharge-off Rate
YOY Change Charge-off Rate
1,0
1,5
2,0
2,5
3,0
3,5
4,0
-10%
0%
10%
20%
30%
40%
50%
Perc
enta
ge (%
)
YOY
Cha
nge
(%)
Canadian Credit Card IndexTotal Delinquency Rate
YOY Change Delinquency Rate
Back to CBack to CBack to CBack to C
Sources: Moody's Investors Service, Major Canadian Credit Card Issuers
YOY MTMCanadian Credit Card Indices (in %) Mrz 12 Mrz 11 % change Canadian Credit Card Indices (in %) Mrz 12 Feb 12 % changeCharge-off Rate* 3,60 3,81 -6% Charge-off Rate* 3,60 3,56 1% 3Delinquency Rate 2,35 2,86 -18% Delinquency Rate 2,35 2,41 -3% 6Principal Payment Rate 35,36 33,11 7% Principal Payment Rate 35,36 33,81 5% 5Aggregate Net Yield* 12,36 12,16 2% Aggregate Net Yield* 12,36 12,76 -3% 2* Annualized percentage rate, excluding interchange * Annualized percentage rate, excluding interchange
0,0
0,5
1,0
1,5
-30%
-20%
-10%
0%
10%
Sep-
99M
ar-0
0Se
p-00
Mar
-01
Sep-
01M
ar-0
2Se
p-02
Mar
-03
Sep-
03M
ar-0
4Se
p-04
Mar
-05
Sep-
05M
ar-0
6Se
p-06
Mar
-07
Sep-
07M
ar-0
8Se
p-08
Mar
-09
Sep-
09M
ar-1
0Se
p-10
Mar
-11
Sep-
11M
ar-1
2
PeYOY
0,0
0,5
1,0
1,5
-30%
-20%
-10%
0%
Sep-
99M
ar-0
0Se
p-00
Mar
-01
Sep-
01M
ar-0
2Se
p-02
Mar
-03
Sep-
03M
ar-0
4Se
p-04
Mar
-05
Sep-
05M
ar-0
6Se
p-06
Mar
-07
Sep-
07M
ar-0
8Se
p-08
Mar
-09
Sep-
09M
ar-1
0Se
p-10
Mar
-11
Sep-
11M
ar-1
2
PeYO
Sources: Moody's Investors Service, Major Canadian Credit Card Issuers
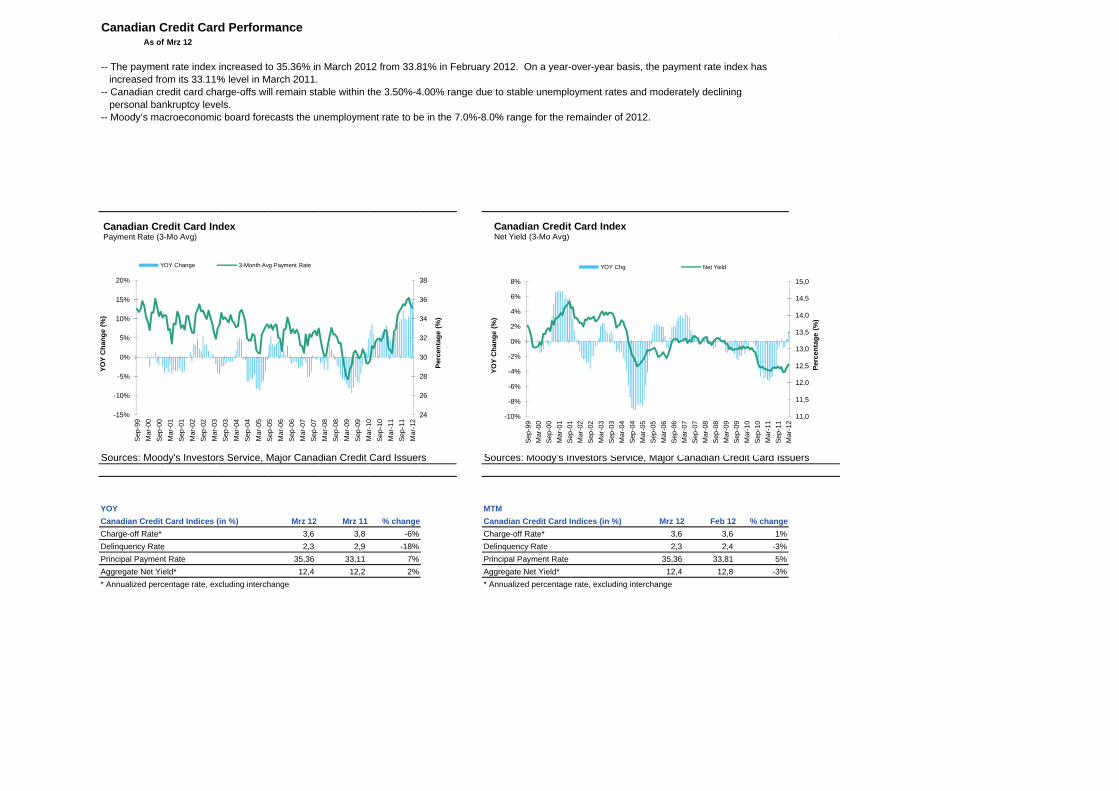
Canadian Credit Card PerformanceAs of Mrz 12
-- The payment rate index increased to 35.36% in March 2012 from 33.81% in February 2012. On a year-over-year basis, the payment rate index has increased from its 33.11% level in March 2011.-- Canadian credit card charge-offs will remain stable within the 3.50%-4.00% range due to stable unemployment rates and moderately declining personal bankruptcy levels.-- Moody’s macroeconomic board forecasts the unemployment rate to be in the 7.0%-8.0% range for the remainder of 2012.
28
30
32
34
36
38
-5%
0%
5%
10%
15%
20%
Perc
enta
ge (%
)
YOY
Cha
nge
(%)
Canadian Credit Card IndexPayment Rate (3-Mo Avg)
YOY Change 3-Month Avg Payment Rate
12,0
12,5
13,0
13,5
14,0
14,5
15,0
-6%
-4%
-2%
0%
2%
4%
6%
8%
Perc
enta
ge (%
)
YOY
Cha
nge
(%)
Canadian Credit Card IndexNet Yield (3-Mo Avg)
YOY Chg Net Yield
Sources: Moody's Investors Service, Major Canadian Credit Card Issuers Sources: Moody's Investors Service, Major Canadian Credit Card Issuers
YOY MTMCanadian Credit Card Indices (in %) Mrz 12 Mrz 11 % change Canadian Credit Card Indices (in %) Mrz 12 Feb 12 % changeCharge-off Rate* 3,6 3,8 -6% Charge-off Rate* 3,6 3,6 1%Delinquency Rate 2,3 2,9 -18% Delinquency Rate 2,3 2,4 -3%Principal Payment Rate 35,36 33,11 7% Principal Payment Rate 35,36 33,81 5%Aggregate Net Yield* 12,4 12,2 2% Aggregate Net Yield* 12,4 12,8 -3%* Annualized percentage rate, excluding interchange * Annualized percentage rate, excluding interchange
24
26
28
-15%
-10%
-5%
Sep-
99M
ar-0
0Se
p-00
Mar
-01
Sep-
01M
ar-0
2Se
p-02
Mar
-03
Sep-
03M
ar-0
4Se
p-04
Mar
-05
Sep-
05M
ar-0
6Se
p-06
Mar
-07
Sep-
07M
ar-0
8Se
p-08
Mar
-09
Sep-
09M
ar-1
0Se
p-10
Mar
-11
Sep-
11M
ar-1
2
PeYOY
11,0
11,5
12,0
12,5
-10%
-8%
-6%
-4%
Sep-
99M
ar-0
0Se
p-00
Mar
-01
Sep-
01M
ar-0
2Se
p-02
Mar
-03
Sep-
03M
ar-0
4Se
p-04
Mar
-05
Sep-
05M
ar-0
6Se
p-06
Mar
-07
Sep-
07M
ar-0
8Se
p-08
Mar
-09
Sep-
09M
ar-1
0Se
p-10
Mar
-11
Sep-
11M
ar-1
2
Per
YOY
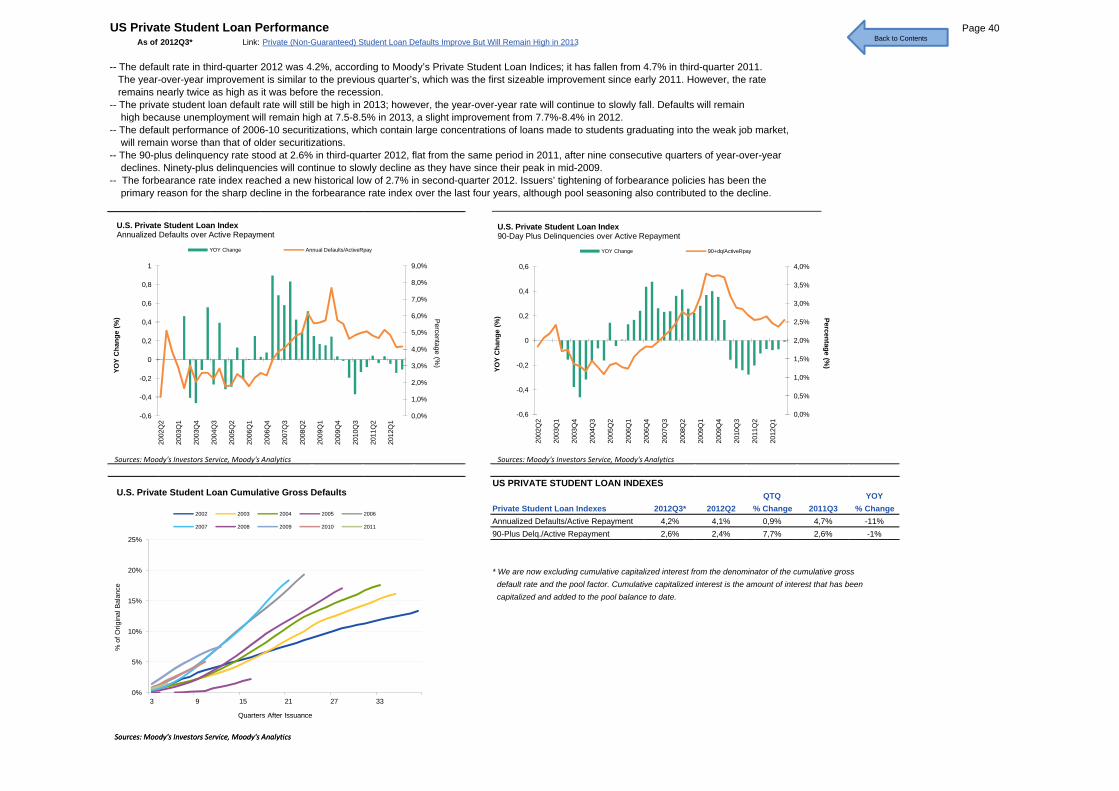
US Private Student Loan Performance Page 40As of 2012Q3* Link: Private (Non-Guaranteed) Student Loan Defaults Improve But Will Remain High in 2013
-- The default rate in third-quarter 2012 was 4.2%, according to Moody’s Private Student Loan Indices; it has fallen from 4.7% in third-quarter 2011. The year-over-year improvement is similar to the previous quarter’s, which was the first sizeable improvement since early 2011. However, the rate remains nearly twice as high as it was before the recession. -- The private student loan default rate will still be high in 2013; however, the year-over-year rate will continue to slowly fall. Defaults will remain high because unemployment will remain high at 7.5-8.5% in 2013, a slight improvement from 7.7%-8.4% in 2012. -- The default performance of 2006-10 securitizations, which contain large concentrations of loans made to students graduating into the weak job market, will remain worse than that of older securitizations.-- The 90-plus delinquency rate stood at 2.6% in third-quarter 2012, flat from the same period in 2011, after nine consecutive quarters of year-over-year declines. Ninety-plus delinquencies will continue to slowly decline as they have since their peak in mid-2009. -- The forbearance rate index reached a new historical low of 2.7% in second-quarter 2012. Issuers’ tightening of forbearance policies has been the primary reason for the sharp decline in the forbearance rate index over the last four years, although pool seasoning also contributed to the decline.
2,0%
3,0%
4,0%
5,0%
6,0%
7,0%
8,0%
9,0%
-0,2
0
0,2
0,4
0,6
0,8
1
Percentage (%)
YOY
Cha
nge
(%)
U.S. Private Student Loan IndexAnnualized Defaults over Active Repayment
YOY Change Annual Defaults/ActiveRpay
1,0%
1,5%
2,0%
2,5%
3,0%
3,5%
4,0%
0 4
-0,2
0
0,2
0,4
0,6
Percentage (%)
YOY
Cha
nge
(%)
U.S. Private Student Loan Index90-Day Plus Delinquencies over Active Repayment
YOY Change 90+dq/ActiveRpay
Back to Contents
US PRIVATE STUDENT LOAN INDEXESQTQ YOY
Private Student Loan Indexes 2012Q3* 2012Q2 % Change 2011Q3 % ChangeAnnualized Defaults/Active Repayment 4,2% 4,1% 0,9% 4,7% -11%90-Plus Delq./Active Repayment 2,6% 2,4% 7,7% 2,6% -1%
* We are now excluding cumulative capitalized interest from the denominator of the cumulative gross default rate and the pool factor. Cumulative capitalized interest is the amount of interest that has been capitalized and added to the pool balance to date.
0,0%
1,0%
2,0%
3,0%
-0,6
-0,4
-0,2
0
2002
Q2
2003
Q1
2003
Q4
2004
Q3
2005
Q2
2006
Q1
2006
Q4
2007
Q3
2008
Q2
2009
Q1
2009
Q4
2010
Q3
2011
Q2
2012
Q1
%)
YOY
0,0%
0,5%
1,0%
, %
-0,6
-0,4
-0,2
2002
Q2
2003
Q1
2003
Q4
2004
Q3
2005
Q2
2006
Q1
2006
Q4
2007
Q3
2008
Q2
2009
Q1
2009
Q4
2010
Q3
2011
Q2
2012
Q1
%)
YOY
0%
5%
10%
15%
20%
25%
3 9 15 21 27 33
% o
f Orig
inal
Bal
ance
Quarters After Issuance
U.S. Private Student Loan Cumulative Gross Defaults
2002 2003 2004 2005 2006
2007 2008 2009 2010 2011
Sources: Moody's Investors Service, Moody's Analytics Sources: Moody's Investors Service, Moody's Analytics
Sources: Moody's Investors Service, Moody's Analytics
Quarters After Issuance
Sources: Moody's Investors Service, Moody's Analytics
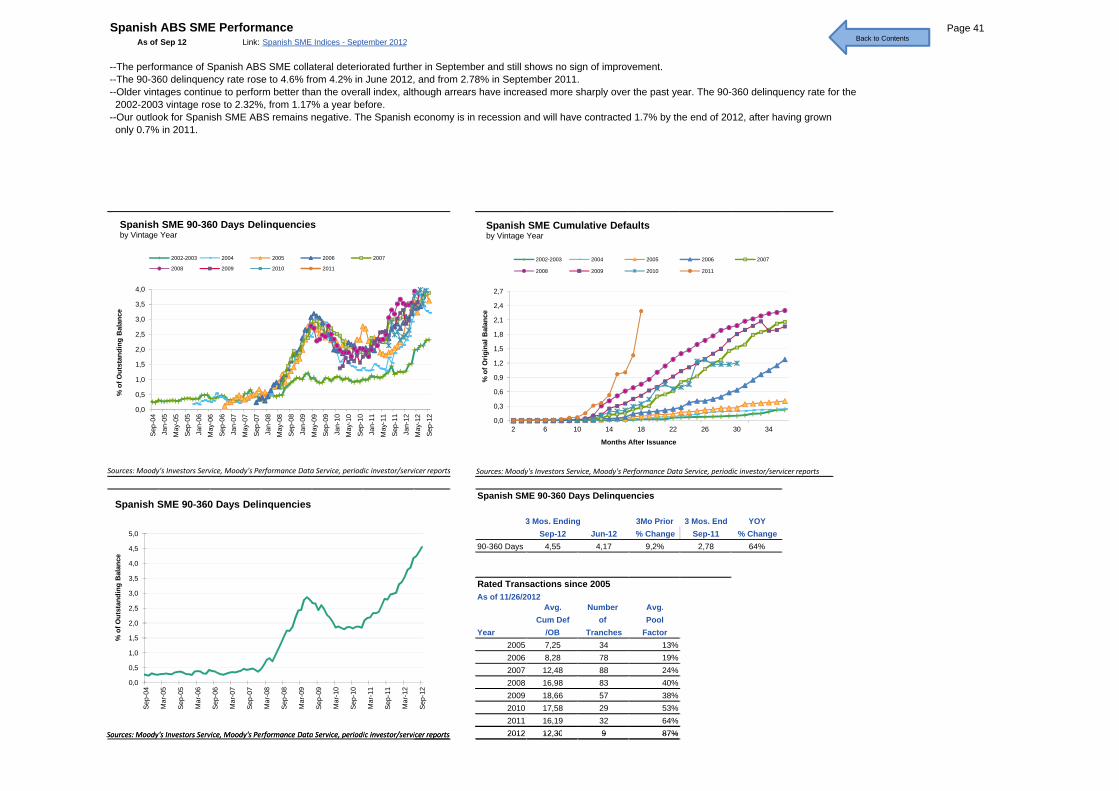
Spanish ABS SME Performance Page 41As of Sep 12 Link: Spanish SME Indices - September 2012
--The performance of Spanish ABS SME collateral deteriorated further in September and still shows no sign of improvement. --The 90-360 delinquency rate rose to 4.6% from 4.2% in June 2012, and from 2.78% in September 2011.--Older vintages continue to perform better than the overall index, although arrears have increased more sharply over the past year. The 90-360 delinquency rate for the 2002-2003 vintage rose to 2.32%, from 1.17% a year before.--Our outlook for Spanish SME ABS remains negative. The Spanish economy is in recession and will have contracted 1.7% by the end of 2012, after having grown only 0.7% in 2011.
1,0
1,5
2,0
2,5
3,0
3,5
4,0
of O
utst
andi
ng B
alan
ce
Spanish SME 90-360 Days Delinquenciesby Vintage Year
2002-2003 2004 2005 2006 2007
2008 2009 2010 2011
0,9
1,2
1,5
1,8
2,1
2,4
2,7
% o
f Orig
inal
Bal
ance
Spanish SME Cumulative Defaultsby Vintage Year
2002-2003 2004 2005 2006 2007
2008 2009 2010 2011
Back to Contents
Spanish SME 90-360 Days Delinquencies
3 Mos. Ending 3Mo Prior 3 Mos. End YOYSep-12 Jun-12 % Change Sep-11 % Change
90-360 Days 4,55 4,17 9,2% 2,78 64%
Rated Transactions since 2005As of 11/26/2012
Avg. Number Avg.Cum Def of Pool
Year /OB Tranches Factor2005 7,25 34 13%2006 8,28 78 19%2007 12,48 88 24%2008 16,98 83 40%2009 18,66 57 38%2010 17,58 29 53%2011 16,19 32 64%2012 12,30 9 87%
0,0
0,5
1,0
1,5
Sep-
04Ja
n-05
May
-05
Sep-
05Ja
n-06
May
-06
Sep-
06Ja
n-07
May
-07
Sep-
07Ja
n-08
May
-08
Sep-
08Ja
n-09
May
-09
Sep-
09Ja
n-10
May
-10
Sep-
10Ja
n-11
May
-11
Sep-
11Ja
n-12
May
-12
Sep-
12
% o
f Out
st
0,0
0,5
1,0
1,5
2,0
2,5
3,0
3,5
4,0
4,5
5,0
Sep-
04
Mar
-05
Sep-
05
Mar
-06
Sep-
06
Mar
-07
Sep-
07
Mar
-08
Sep-
08
Mar
-09
Sep-
09
Mar
-10
Sep-
10
Mar
-11
Sep-
11
Mar
-12
Sep-
12
% o
f Out
stan
ding
Bal
ance
Spanish SME 90-360 Days Delinquencies
0,0
0,3
0,6
0,9
1,2
2 6 10 14 18 22 26 30 34
% o
f O
Months After Issuance
Sources: Moody's Investors Service, Moody's Performance Data Service, periodic investor/servicer reports Sources: Moody's Investors Service, Moody's Performance Data Service, periodic investor/servicer reports
Sources: Moody's Investors Service, Moody's Performance Data Service, periodic investor/servicer reports 2012 12,30 9 87%Sources: Moody's Investors Service, Moody's Performance Data Service, periodic investor/servicer reports
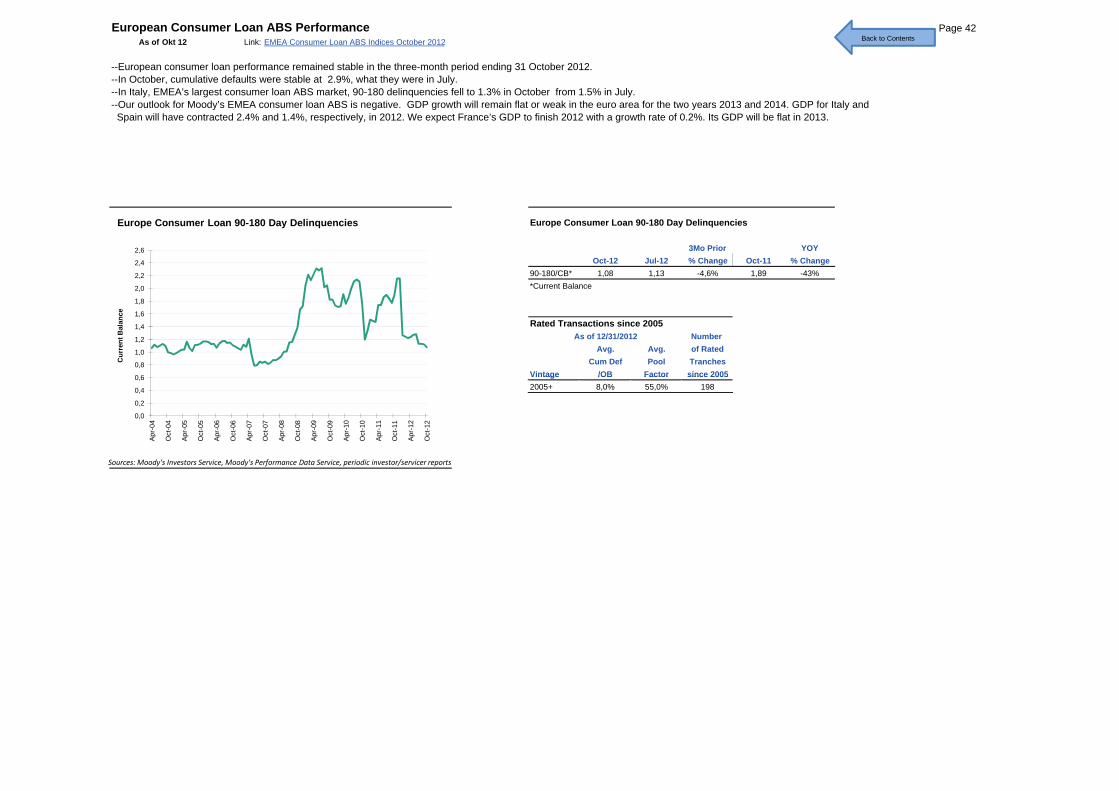
European Consumer Loan ABS Performance Page 42As of Okt 12 Link: EMEA Consumer Loan ABS Indices October 2012
--European consumer loan performance remained stable in the three-month period ending 31 October 2012.--In October, cumulative defaults were stable at 2.9%, what they were in July. --In Italy, EMEA’s largest consumer loan ABS market, 90-180 delinquencies fell to 1.3% in October from 1.5% in July.--Our outlook for Moody’s EMEA consumer loan ABS is negative. GDP growth will remain flat or weak in the euro area for the two years 2013 and 2014. GDP for Italy and Spain will have contracted 2.4% and 1.4%, respectively, in 2012. We expect France’s GDP to finish 2012 with a growth rate of 0.2%. Its GDP will be flat in 2013.
Europe Consumer Loan 90-180 Day Delinquencies
3Mo Prior YOYOct-12 Jul-12 % Change Oct-11 % Change
90-180/CB* 1,08 1,13 -4,6% 1,89 -43%*Current Balance
Rated Transactions since 2005As of 12/31/2012 Number
Avg. Avg. of RatedCum Def Pool Tranches
Vintage /OB Factor since 20050,6
0,8
1,0
1,2
1,4
1,6
1,8
2,0
2,2
2,4
2,6
Cur
rent
Bal
ance
Europe Consumer Loan 90-180 Day Delinquencies
Back to Contents
Vintage /OB Factor since 20052005+ 8,0% 55,0% 198
0,0
0,2
0,4
0,6
0,8
1,0
Apr-
04
Oct
-04
Apr-
05
Oct
-05
Apr-
06
Oct
-06
Apr-
07
Oct
-07
Apr-
08
Oct
-08
Apr-
09
Oct
-09
Apr-
10
Oct
-10
Apr-
11
Oct
-11
Apr-
12
Oct
-12
Cu
Sources: Moody's Investors Service, Moody's Performance Data Service, periodic investor/servicer reports
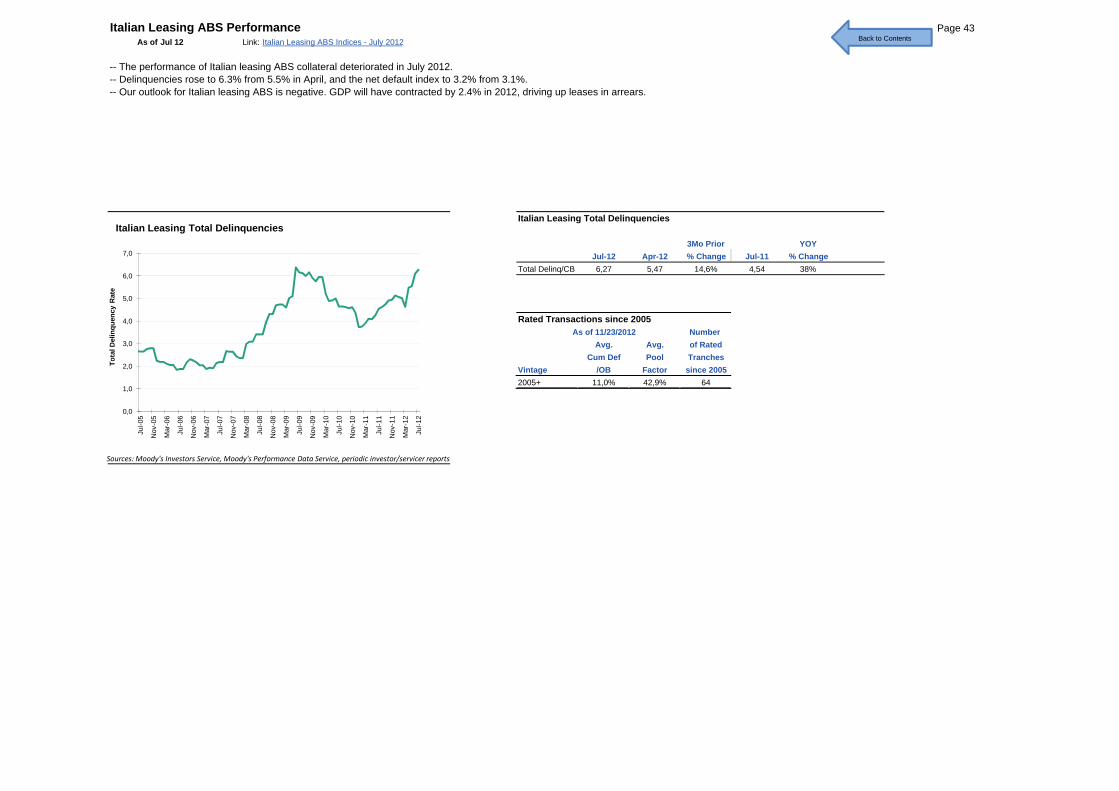
Italian Leasing ABS Performance Page 43As of Jul 12 Link: Italian Leasing ABS Indices - July 2012
-- The performance of Italian leasing ABS collateral deteriorated in July 2012.-- Delinquencies rose to 6.3% from 5.5% in April, and the net default index to 3.2% from 3.1%.-- Our outlook for Italian leasing ABS is negative. GDP will have contracted by 2.4% in 2012, driving up leases in arrears.
Italian Leasing Total Delinquencies
3Mo Prior YOYJul-12 Apr-12 % Change Jul-11 % Change
Total Delinq/CB 6,27 5,47 14,6% 4,54 38%
Rated Transactions since 2005As of 11/23/2012 Number
Avg. Avg. of Rated3 Cum Def Pool Tranches2 Vintage /OB Factor since 2005
1 0
2,0
3,0
4,0
5,0
6,0
7,0
Tota
l Del
inqu
ency
Rat
e
Italian Leasing Total Delinquencies
Back to Contents
4 2005+ 11,0% 42,9% 64320,0
1,0
2,0
Jul-0
5
Nov
-05
Mar
-06
Jul-0
6
Nov
-06
Mar
-07
Jul-0
7
Nov
-07
Mar
-08
Jul-0
8
Nov
-08
Mar
-09
Jul-0
9
Nov
-09
Mar
-10
Jul-1
0
Nov
-10
Mar
-11
Jul-1
1
Nov
-11
Mar
-12
Jul-1
2
T
Sources: Moody's Investors Service, Moody's Performance Data Service, periodic investor/servicer reports
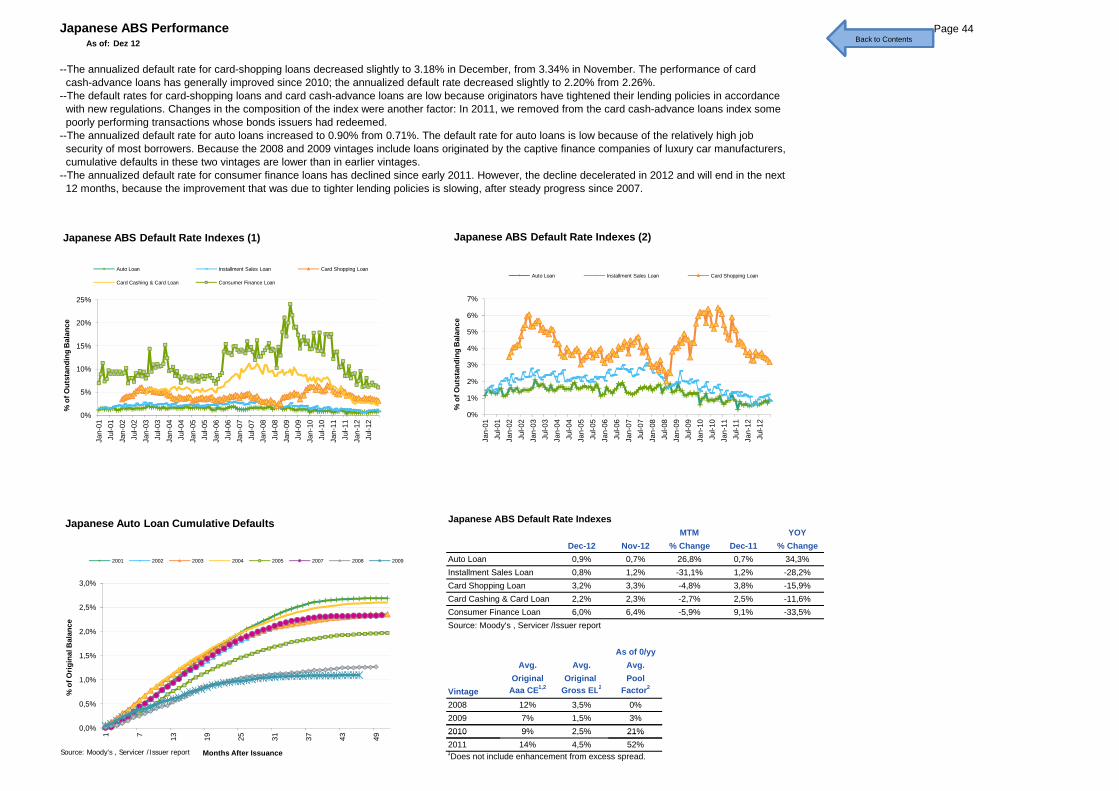
Japanese ABS Performance Page 44As of: Dez 12
--The annualized default rate for card-shopping loans decreased slightly to 3.18% in December, from 3.34% in November. The performance of card cash-advance loans has generally improved since 2010; the annualized default rate decreased slightly to 2.20% from 2.26%.--The default rates for card-shopping loans and card cash-advance loans are low because originators have tightened their lending policies in accordance with new regulations. Changes in the composition of the index were another factor: In 2011, we removed from the card cash-advance loans index some poorly performing transactions whose bonds issuers had redeemed.--The annualized default rate for auto loans increased to 0.90% from 0.71%. The default rate for auto loans is low because of the relatively high job security of most borrowers. Because the 2008 and 2009 vintages include loans originated by the captive finance companies of luxury car manufacturers, cumulative defaults in these two vintages are lower than in earlier vintages.--The annualized default rate for consumer finance loans has declined since early 2011. However, the decline decelerated in 2012 and will end in the next 12 months, because the improvement that was due to tighter lending policies is slowing, after steady progress since 2007.
10%
15%
20%
25%
tand
ing
Bal
ance
Japanese ABS Default Rate Indexes (1)
Auto Loan Installment Sales Loan Card Shopping Loan
Card Cashing & Card Loan Consumer Finance Loan
3%
4%
5%
6%
7%
stan
ding
Bal
ance
Japanese ABS Default Rate Indexes (2)
Auto Loan Installment Sales Loan Card Shopping Loan
Back to ContentsBack to ContentsBack to ContentsBack to Contents
Japanese ABS Default Rate Indexes MTM YOY
Dec-12 Nov-12 % Change Dec-11 % ChangeAuto Loan 0,9% 0,7% 26,8% 0,7% 34,3% 2Installment Sales Loan 0,8% 1,2% -31,1% 1,2% -28,2% 3Card Shopping Loan 3,2% 3,3% -4,8% 3,8% -15,9% 4Card Cashing & Card Loan 2,2% 2,3% -2,7% 2,5% -11,6% 5Consumer Finance Loan 6,0% 6,4% -5,9% 9,1% -33,5% 6Source: Moody's , Servicer /Issuer report 7
As of 0/yyAvg. Avg. Avg.
Original Original PoolVintage Aaa CE1,2 Gross EL2 Factor2
2008 12% 3,5% 0%2009 7% 1,5% 3%2010 9% 2,5% 21%
0%
5%
10%
Jan-
01Ju
l-01
Jan-
02Ju
l-02
Jan-
03Ju
l-03
Jan-
04Ju
l-04
Jan-
05Ju
l-05
Jan-
06Ju
l-06
Jan-
07Ju
l-07
Jan-
08Ju
l-08
Jan-
09Ju
l-09
Jan-
10Ju
l-10
Jan-
11Ju
l-11
Jan-
12Ju
l-12
% o
f Out
stan
ding
0%
1%
2%
3%
Jan-
01Ju
l-01
Jan-
02Ju
l-02
Jan-
03Ju
l-03
Jan-
04Ju
l-04
Jan-
05Ju
l-05
Jan-
06Ju
l-06
Jan-
07Ju
l-07
Jan-
08Ju
l-08
Jan-
09Ju
l-09
Jan-
10Ju
l-10
Jan-
11Ju
l-11
Jan-
12Ju
l-12
% o
f Out
stan
din g
0,0%
0,5%
1,0%
1,5%
2,0%
2,5%
3,0%
1 7 3 9 25 31 37 43 49
% o
f Orig
inal
Bal
ance
Japanese Auto Loan Cumulative Defaults
2001 2002 2003 2004 2005 2007 2008 2009
2010 9% 2,5% 21%2011 14% 4,5% 52%1Does not include enhancement from excess spread.
0,0%
1 7 13 19 25 31 37 43 49
Months After IssuanceSource: Moody's , Servicer /Issuer report

2Includes only auto loan transactions
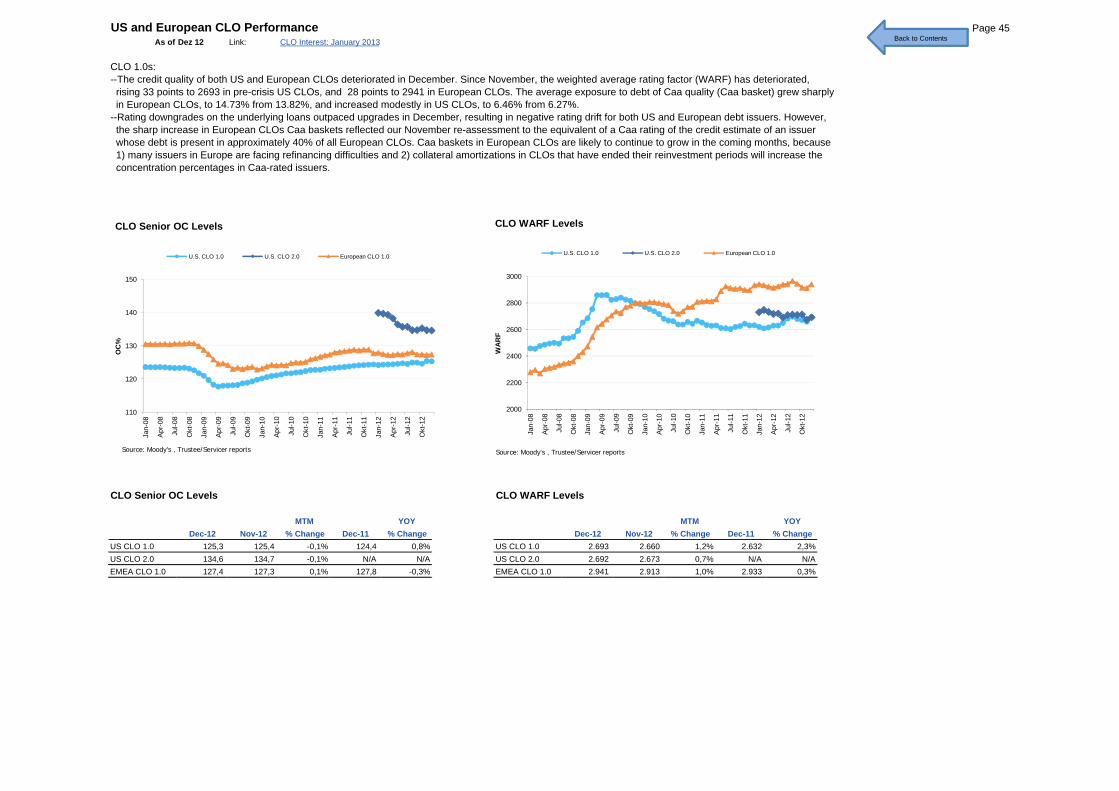
US and European CLO Performance Page 45As of Dez 12 Link: CLO Interest: January 2013
CLO 1.0s:--The credit quality of both US and European CLOs deteriorated in December. Since November, the weighted average rating factor (WARF) has deteriorated, rising 33 points to 2693 in pre-crisis US CLOs, and 28 points to 2941 in European CLOs. The average exposure to debt of Caa quality (Caa basket) grew sharply in European CLOs, to 14.73% from 13.82%, and increased modestly in US CLOs, to 6.46% from 6.27%. --Rating downgrades on the underlying loans outpaced upgrades in December, resulting in negative rating drift for both US and European debt issuers. However, the sharp increase in European CLOs Caa baskets reflected our November re-assessment to the equivalent of a Caa rating of the credit estimate of an issuer whose debt is present in approximately 40% of all European CLOs. Caa baskets in European CLOs are likely to continue to grow in the coming months, because 1) many issuers in Europe are facing refinancing difficulties and 2) collateral amortizations in CLOs that have ended their reinvestment periods will increase the concentration percentages in Caa-rated issuers.
120
130
140
150
OC
%
CLO Senior OC Levels
U.S. CLO 1.0 U.S. CLO 2.0 European CLO 1.0
2200
2400
2600
2800
3000
WA
RF
CLO WARF Levels
U.S. CLO 1.0 U.S. CLO 2.0 European CLO 1.0
Back to ContentsBack to Contents
CLO Senior OC Levels CLO WARF Levels
MTM YOY MTM YOYDec-12 Nov-12 % Change Dec-11 % Change Dec-12 Nov-12 % Change Dec-11 % Change
US CLO 1.0 125,3 125,4 -0,1% 124,4 0,8% US CLO 1.0 2.693 2.660 1,2% 2.632 2,3%US CLO 2.0 134,6 134,7 -0,1% N/A N/A US CLO 2.0 2.692 2.673 0,7% N/A N/AEMEA CLO 1.0 127,4 127,3 0,1% 127,8 -0,3% EMEA CLO 1.0 2.941 2.913 1,0% 2.933 0,3%
110
120
Jan-
08
Apr-
08
Jul-0
8
Okt
-08
Jan-
09
Apr-
09
Jul-0
9
Okt
-09
Jan-
10
Apr-
10
Jul-1
0
Okt
-10
Jan-
11
Apr-
11
Jul-1
1
Okt
-11
Jan-
12
Apr-
12
Jul-1
2
Okt
-12
Source: Moody's , Trustee/Servicer reports
2000
2200
Jan-
08
Apr-
08
Jul-0
8
Okt
-08
Jan-
09
Apr-
09
Jul-0
9
Okt
-09
Jan-
10
Apr-
10
Jul-1
0
Okt
-10
Jan-
11
Apr-
11
Jul-1
1
Okt
-11
Jan-
12
Apr-
12
Jul-1
2
Okt
-12
Source: Moody's , Trustee/Servicer reports
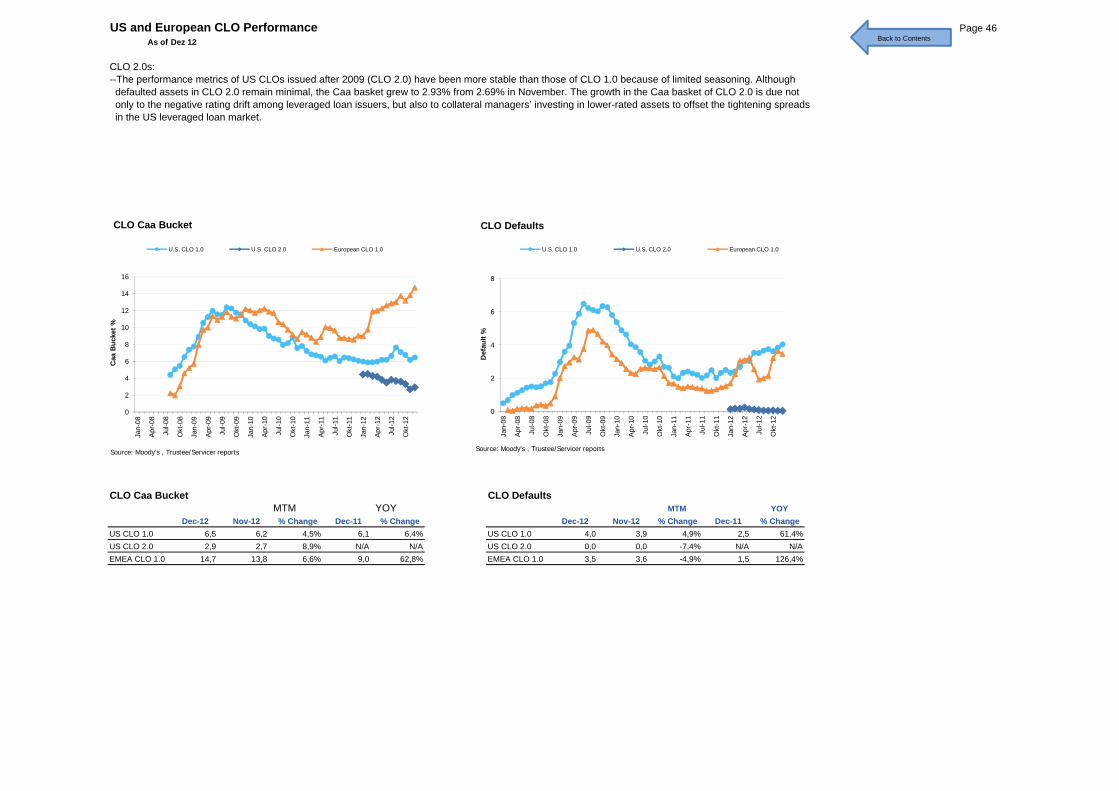
US and European CLO Performance Page 46As of Dez 12
CLO 2.0s:--The performance metrics of US CLOs issued after 2009 (CLO 2.0) have been more stable than those of CLO 1.0 because of limited seasoning. Although defaulted assets in CLO 2.0 remain minimal, the Caa basket grew to 2.93% from 2.69% in November. The growth in the Caa basket of CLO 2.0 is due not only to the negative rating drift among leveraged loan issuers, but also to collateral managers’ investing in lower-rated assets to offset the tightening spreads in the US leveraged loan market.
4
6
8
10
12
14
16
Caa
Buc
ket %
CLO Caa Bucket
U.S. CLO 1.0 U.S. CLO 2.0 European CLO 1.0
2
4
6
8
Def
ault
%
CLO Defaults
U.S. CLO 1.0 U.S. CLO 2.0 European CLO 1.0
Back to Contents
CLO Caa Bucket CLO DefaultsMTM YOY MTM YOY
Dec-12 Nov-12 % Change Dec-11 % Change Dec-12 Nov-12 % Change Dec-11 % ChangeUS CLO 1.0 6,5 6,2 4,5% 6,1 6,4% US CLO 1.0 4,0 3,9 4,9% 2,5 61,4%US CLO 2.0 2,9 2,7 8,9% N/A N/A US CLO 2.0 0,0 0,0 -7,4% N/A N/AEMEA CLO 1.0 14,7 13,8 6,6% 9,0 62,8% EMEA CLO 1.0 3,5 3,6 -4,9% 1,5 126,4%
0
2
4
6
Jan-
08
Apr-
08
Jul-0
8
Okt
-08
Jan-
09
Apr-
09
Jul-0
9
Okt
-09
Jan-
10
Apr-
10
Jul-1
0
Okt
-10
Jan-
11
Apr-
11
Jul-1
1
Okt
-11
Jan-
12
Apr-
12
Jul-1
2
Okt
-12
C
0
2
Jan-
08
Apr-
08
Jul-0
8
Okt
-08
Jan-
09
Apr-
09
Jul-0
9
Okt
-09
Jan-
10
Apr-
10
Jul-1
0
Okt
-10
Jan-
11
Apr-
11
Jul-1
1
Okt
-11
Jan-
12
Apr-
12
Jul-1
2
Okt
-12
Source: Moody's , Trustee/Servicer reportsSource: Moody's , Trustee/Servicer reports
© 2013 Moody’s Investors Service, Inc. and/or its licensors and affiliates (collectively, “MOODY’S”). All rights reserved.
CREDIT RATINGS ISSUED BY MOODY'S INVESTORS SERVICE, INC. (“MIS”) AND ITS AFFILIATES ARE MOODY’S CURRENT OPINIONS OF THE RELATIVE FUTURE CREDIT RISK OF ENTITIES, CREDIT COMMITMENTS, OR DEBT OR DEBT-LIKE SECURITIES, AND CREDIT RATINGS AND RESEARCH PUBLICATIONS PUBLISHED BY MOODY’S (“MOODY’S PUBLICATIONS”) MAY INCLUDE MOODY’S CURRENT OPINIONS OF THE RELATIVE FUTURE CREDIT RISK OF ENTITIES, CREDIT COMMITMENTS, OR DEBT OR DEBT-LIKE SECURITIES. MOODY’S DEFINES CREDIT RISK AS THE RISK THAT AN ENTITY MAY NOT MEET ITS CONTRACTUAL, FINANCIAL OBLIGATIONS AS THEY COME DUE AND ANY ESTIMATED FINANCIAL LOSS IN THE EVENT OF DEFAULT. CREDIT RATINGS DO NOT ADDRESS ANY OTHER RISK, INCLUDING BUT NOT LIMITED TO: LIQUIDITY RISK, MARKET VALUE RISK, OR PRICE VOLATILITY. CREDIT RATINGS AND MOODY’S OPINIONS INCLUDED IN MOODY’S PUBLICATIONS ARE NOT STATEMENTS OF CURRENT OR HISTORICAL FACT. CREDIT RATINGS AND MOODY’S PUBLICATIONS DO NOT CONSTITUTE OR PROVIDE INVESTMENT OR FINANCIAL ADVICE, AND CREDIT RATINGS AND MOODY’S PUBLICATIONS ARE NOT AND DO NOT PROVIDE RECOMMENDATIONS TO PURCHASE, SELL, OR HOLD PARTICULAR SECURITIES. NEITHER CREDIT RATINGS NOR MOODY’S PUBLICATIONS COMMENT ON THESUITABILITY OF AN INVESTMENT FOR ANY PARTICULAR INVESTOR. MOODY’S ISSUES ITS CREDIT RATINGS AND PUBLISHES MOODY’S PUBLICATIONS WITH THE EXPECTATION AND UNDERSTANDING THAT EACH INVESTOR WILL MAKE ITS OWN STUDY AND EVALUATION OF EACH SECURITY THAT IS UNDER CONSIDERATION FOR PURCHASE, HOLDING, OR SALE.
ALL INFORMATION CONTAINED HEREIN IS PROTECTED BY LAW, INCLUDING BUT NOT LIMITED TO, COPYRIGHT LAW, AND NONE OF SUCH INFORMATION MAY BE COPIED OR OTHERWISE REPRODUCED, REPACKAGED, FURTHER TRANSMITTED, TRANSFERRED, DISSEMINATED, REDISTRIBUTED OR RESOLD, OR STORED FOR SUBSEQUENT USE FOR ANY SUCH PURPOSE, IN WHOLE OR IN PART, IN ANY FORM OR MANNER OR BY ANY MEANS WHATSOEVER, BY ANY PERSON WITHOUT MOODY’S PRIOR WRITTEN CONSENT.
All information contained herein is obtained by MOODY’S from sources believed by it to be accurate and reliable. Because of the possibility of human or mechanical error as well as other factors, however, all information contained herein is provided “AS IS” without warranty of any kind. MOODY'S adopts all necessary measures so that the information it uses in assigning a credit rating is of sufficient quality and from sources MOODY'S considers to be reliable including, when appropriate, independent third-party sources. However, MOODY’S is not an auditor and cannot in every instance independently verify or validate information received in the rating process. Under no circumstances shall MOODY’S have any liability to any person or entity for (a) any loss or damage in whole or in part caused by, resulting from, or relating to, any error (negligent or otherwise) or other circumstance or contingency within or outside the control of MOODY’S or any of its directors, officers, employees or agents in connection with the procurement, collection, compilation, analysis, interpretation, communication, publication or delivery of any such information, or (b) any direct, indirect, special, consequential, compensatory or incidental damages whatsoever (including without limitation, lost profits), even if MOODY’S is advised in advance of the possibility of such damages, resulting from the use of or inability to use, any such information. The ratings, financial reporting analysis, projections, and other observations, if any, constituting part of the information contained herein are, and must be construed solely as statements of opinion and not statements of fact or recommendations to purchase sell or hold any securities Each user of the information contained herein must make its
interpretation, communication, publication or delivery of any such information, or (b) any direct, indirect, special, consequential, compensatory or incidental damages whatsoever (including without limitation, lost profits), even if MOODY’S is advised in advance of the possibility of such damages, resulting from the use of or inability to use, any such information. The ratings, financial reporting analysis, projections, and other observations, if any, constituting part of the information contained herein are, and must be construed solely as, statements of opinion and not statements of fact or recommendations to purchase, sell or hold any securities. Each user of the information contained herein must make its own study and evaluation of each security it may consider purchasing, holding or selling.
NO WARRANTY, EXPRESS OR IMPLIED, AS TO THE ACCURACY, TIMELINESS, COMPLETENESS, MERCHANTABILITY OR FITNESS FOR ANY PARTICULAR PURPOSE OF ANY SUCH RATING OR OTHER OPINION OR INFORMATION IS GIVEN OR MADE BY MOODY’S IN ANY FORM OR MANNER WHATSOEVER.
MIS, a wholly-owned credit rating agency subsidiary of Moody’s Corporation (“MCO”), hereby discloses that most issuers of debt securities (including corporate and municipal bonds, debentures, notes and commercial paper) and preferred stock rated by MIS have, prior to assignment of any rating, agreed to pay to MIS for appraisal and rating services rendered by it fees ranging from $1,500 to approximately $2,500,000. MCO and MIS also maintain policies and procedures to address the independence of MIS’s ratings and rating processes. Information regarding certain affiliations that may exist between directors of MCO and rated entities, and between entities who hold ratings from MIS and have also publicly reported to the SEC an ownership interest in MCO of more than 5%, is posted annually at www.moodys.com under the heading “Shareholder Relations — Corporate Governance — Director and Shareholder Affiliation Policy.”
For Australia only: Any publication into Australia of this document is pursuant to the Australian Financial Services License of MOODY’S affiliate, Moody’s Investors Service Pty Limited ABN 61 003 399 657AFSL 336969 and/or Moody’s Analytics Australia Pty Ltd ABN 94 105 136 972 AFSL 383569 (as applicable). This document is intended to be provided only to “wholesale clients” within the meaning of section 761G of the Corporations Act 2001. By continuing to access this document from within Australia, you represent to MOODY’S that you are, or are accessing the document as a representative of, a “wholesale client” and that neither you nor the entity you represent will directly or indirectly disseminate this document or its contents to “retail clients” within the meaning of section 761G of the Corporations Act 2001. MOODY’S credit rating is an opinion as to the creditworthiness of a debt obligation of the issuer, not on the equity securities of the issuer or any form of security that is available to retail clients. It would be dangerous for retail clients to make any investment decision based on MOODY’S credit rating. If in doubt you should contact your financial or other professional adviser.