Embed Size (px)
Citation preview

Montwood High SchoolPhysics
R. Casao

Kinematics
The study of motion of an object without regard to the causes of the motion.

Motion At this time we will discuss motion
that is restricted in 3 ways:
It is linear (only along a straight line). Forces will not be discussed (other
than to acknowledge that the forces are causing the motion).
The object in motion can be modeled as a particle.

Position and Displacement To locate an object we need a reference
point – the origin. We also then need to consider where
the object is relative to the origin – the position of the object.
The position will be measured along the x-axis for linear horizontal motion and the y-axis for linear vertical motion.
The positive direction is taken to be the direction of increasing numbers (coordinates) on an axis.
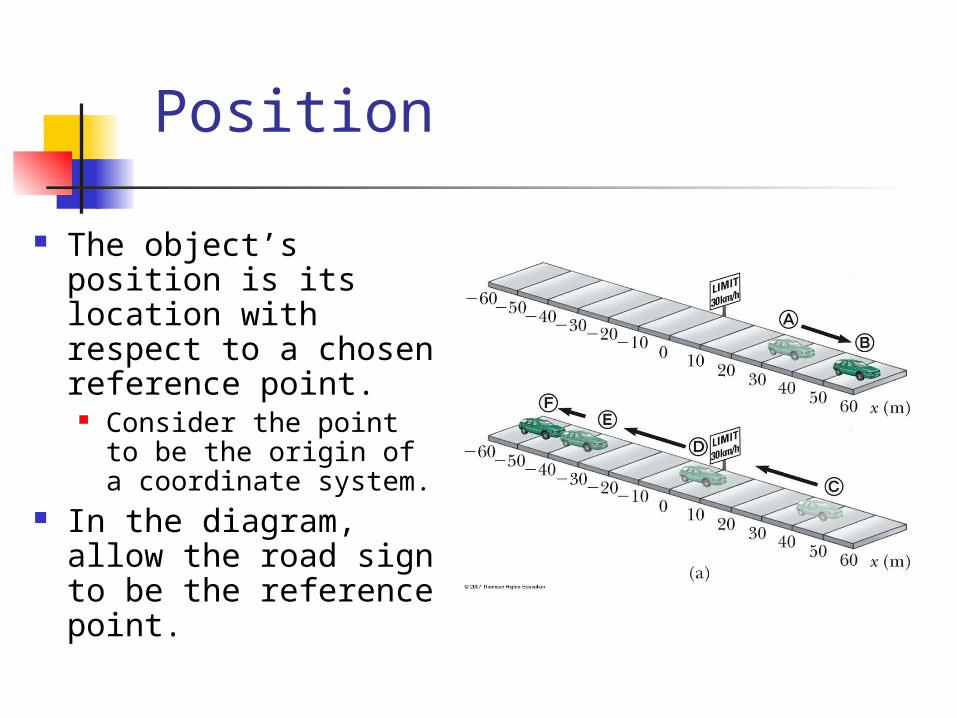
Position
The object’s position is its location with respect to a chosen reference point.
Consider the point to be the origin of a coordinate system.
In the diagram, allow the road sign to be the reference point.

Position-Time Graph
The position-time graph shows the motion of the particle (car).
The smooth curve is a guess as to what happened between the data points.

Motion of Car
Note the relationship between the position of the car and the points on the graph.
Compare the different representations of the motion.

Data Table
The table gives the actual data collected during the motion of the object (car).
Positive is defined as being to the right.

Motion in One Dimension Displacement: a change in the position of a
particle; it is a vector quantity. The displacement of a particle is known if its initial
and final coordinates (positions) are known. Displacement symbol x. Displacement equation: x = xf - xi Example: we move from position x1 (7) to x2 (12),
Δx = x2 – x1 = 12 – 7 = 5 If we then move from position x1 (12) to x2 (7),
Δx = x2 – x1 = 7 – 12 = -5 In the 1st case (x2 > x1) we have a positive
displacement; in the 2nd case (x2 < x1) the displacement is negative.

Displacement:

Positive versus Negative Displacement:

Motion in One Dimension Displacement
vector (arrow) goes where the displacement begins and the head of the vector goes where the displacement ends.

Motion in One Dimension The distance traveled by a particle can
be the same as the displacement, as happens in straight line motion.
The distance traveled by a particle can be different from its displacement.
Distance traveled is the length of the path and is not concerned with the direction of motion.

Motion in One Dimension The displacement can be zero even though the
distance traveled is not zero. This occurs when an object moves and returns
to its original position. If we moved from x1 to x2 and then back to x1,
the total displacement is 0 because the beginning and ending point of the motion is the same point (xi and xf have the same value, xf = xi ;
Δx = xf – xi = 0). Displacement is the difference in the starting
and ending positions – the total distance traveled is irrelevant.


Position – Time Graphs At t = 0 s, the mouse is 5
units to the left of the origin and begins moving toward the origin.
The mouse crosses the origin at t = 3 s.
The mouse moves to the right of the origin from t = 3 s to t = 5 s.

Position – Time Graphs A straight line on a position-time
graph indicates that the object is not moving with respect to the origin (stationary).
x (m)
Time (s)

Particle Under Constant Velocity
The graph represents the motion of a particle under constant velocity.
The slope of the graph is the value of the constant velocity.
The y-intercept is xi.

Speed Speed tells you how fast a particle
is moving without regard to direction (magnitude only).
The term magnitude refers to a number only, not a direction. Therefore, speed will always be positive.
Speed is a scalar quantity.

Velocity Velocity tells you how fast a
particle is moving and in what direction the particle is moving (magnitude and direction).
Quantities having a magnitude and a direction are called vector quantities.

Average Velocity The position-time graph
for a particle moving along the x-axis is shown at the right.
Average velocity vavg is the slope of the line drawn from point P to point Q.
The steeper the slope, the greater the average velocity.

Note: average velocity is the slope of the line that connects two points on a position – time graph.

Average Velocity Equation
Average velocity is independent of the motion between points P and Q; all that matters is the displacement.
The average velocity can be zero if the displacement is zero.
if
ifavg tt
xxtΔxΔ
timetotalntdisplacemetotal
v

Average Velocity Average velocity can be positive or negative
depending on the sign of the displacement. The change in time t is always positive.
A velocity in the +x direction occurs when x is positive.
A velocity in the –x direction occurs when x is negative.
For linear motion, speed is the absolute value of the average velocity; speed = |velocity|.

Example A particle moving along the x-axis is at xi =
12 m at ti = 1 s and at xf = 4m at tf = 3 s. Determine the displacement, the average velocity and the speed of the particle.
A positive value for displacement and velocity would indicate that the particle is moving away from the origin.
A negative value for displacement and velocity would indicate that the particle is moving toward the origin.

Instantaneous Velocity Instantaneous velocity is the velocity
of a particle at any instant in time. Instantaneous velocity is equal to the
slope of the tangent line through that one point on the curve of a position-time graph at the indicated instant in time.
A line is tangent to a point on the curve if the line intersects, but does not cross the curve at that point.

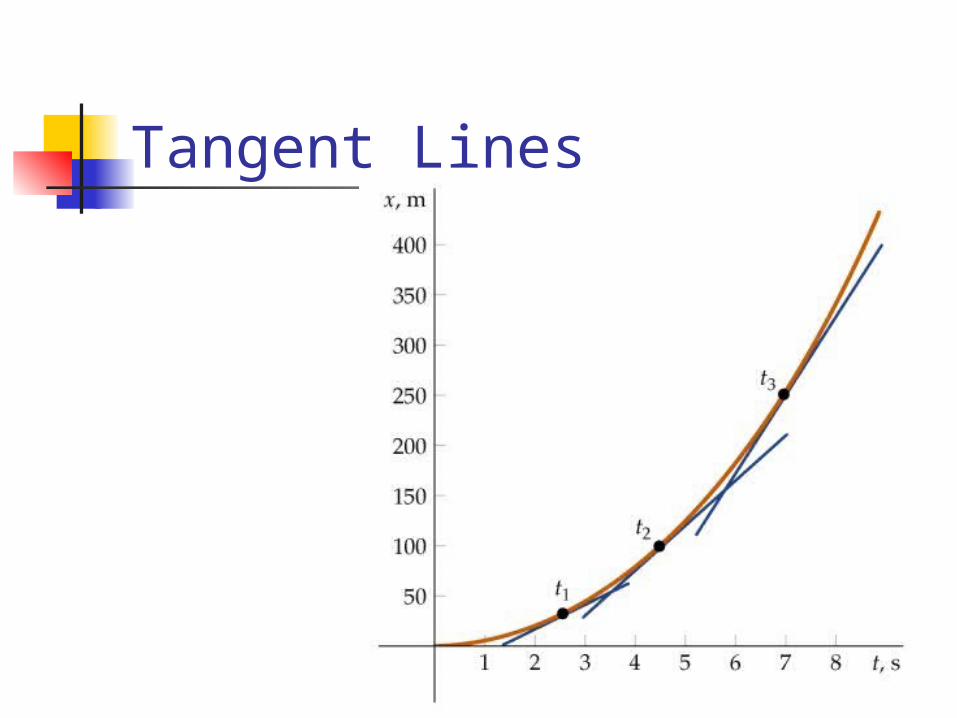
Tangent Lines

Tangent Lines Slope of the tan line through point A is
positive and indicates that the instantaneous velocity is increasing.
Slope of the tan line through point B is 0 and indicates that the instantaneous velocity is 0 (the particle is changing directions).
Slope of the tan line through point C is negative and indicates that the instantaneous velocity is decreasing.

Slope of Tan Line = Velocity

Constant (Uniform) Speed/Velocity
Constant or uniform speed means that the displacement per unit time remains constant.
Constant or uniform velocity means that the displacement per unit time and the direction remain constant.


Equations and Units
General units for speed and velocity are m/s or km/hr.
To convert from km/hr to m/s, divide the km/hr by 3.6:
2 1
2 1
/
y yriseslope
run x x
xspeed velocity
t
s3600hr1
km1m1000
hrkm

Equations
For straight line motion, the magnitude of the average speed and the average velocity is the same.
total displacementaverage velocity =
total time
total distanceaveragespeed =
total time

Circular Paths If an object travels in a circular
path, the distance traveled is equal to the circumference of the circle.
1 rotation (revolution) = 2r
tr2
td
v
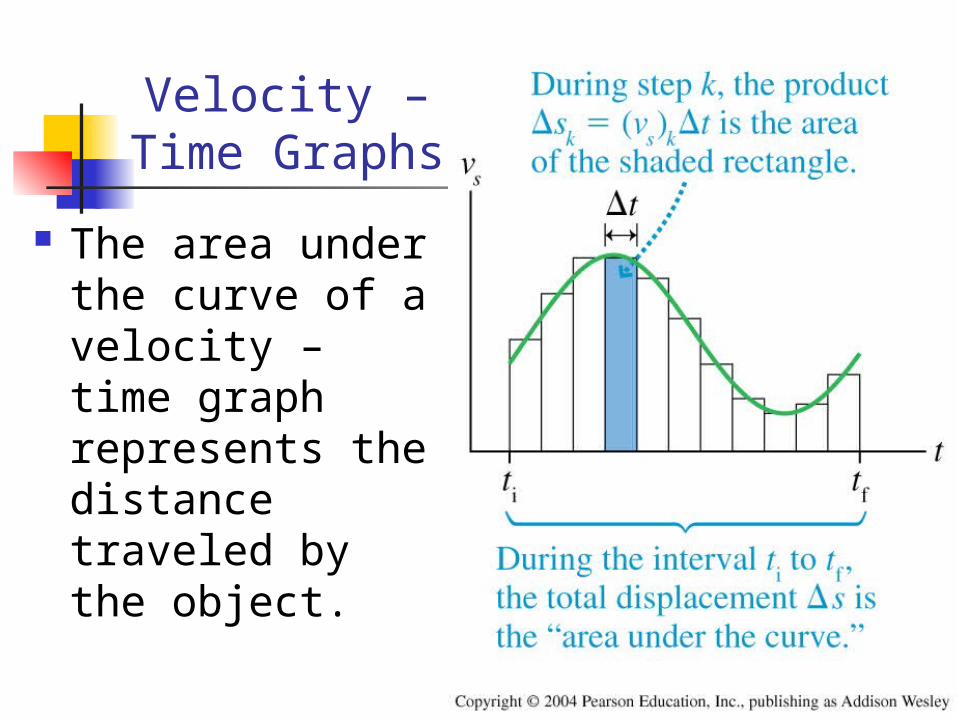
Velocity – Time Graphs
The area under the curve of a velocity – time graph represents the distance traveled by the object.


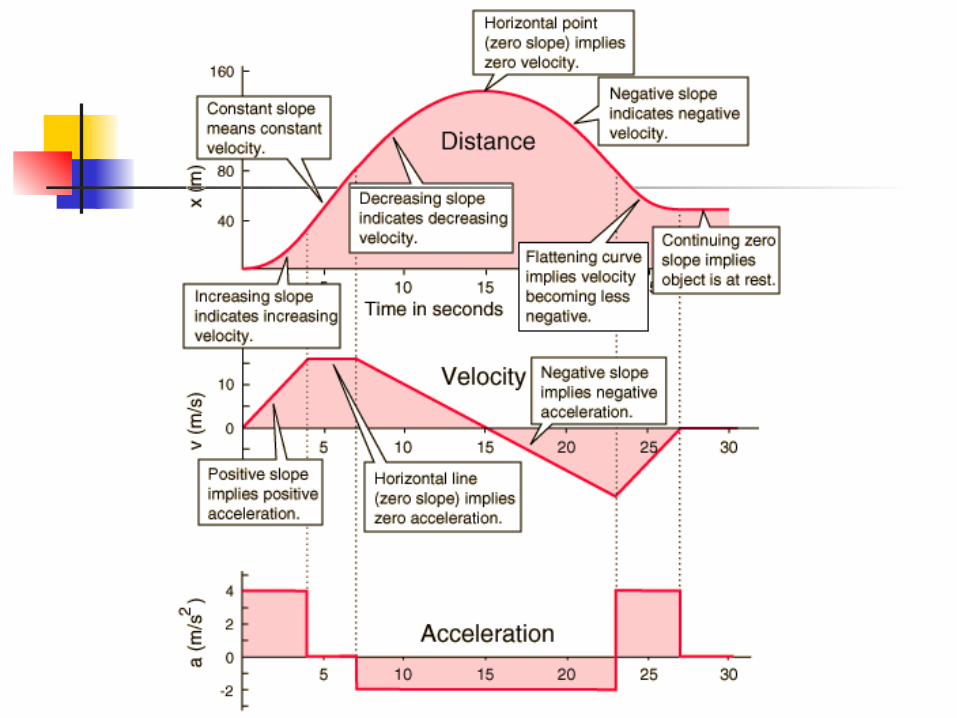
Position – Time Graphs Summarized
• the y-coordinate at any time gives the position of the object.
• the slope of a position-time graph at any instant is the instantaneous velocity of the object; instantaneous velocity involves finding the slope of the tangent line through that one point on the graph.
•the slope of the line that connects any two points on a position-time graph is the average velocity of the object. •for straight line segments of the graph, the tangent line lies directly on the straight line segment and the average velocity is equal to the instantaneous velocity.
• horizontal graph segments indicate that the object is “at rest”.
• graph segments moving upward imply movement in the positive direction.
• graph segments moving downward imply movement in the negative direction .

Position – Time Graphs Summarized
• straight line graph segments indicate constant speed.
• curving graph segments indicate changing speed.
• graph segments becoming steeper indicate an increase in speed.
• graph segments becoming less steep indicate a decrease in speed.
• a change of direction is indicated whenever the graph is concave upward or downward.

Velocity – Time Graphs Summarized
• the y-coordinate at any time gives the velocity of the object• the slope of a velocity-time graph is the acceleration of the object• horizontal graph segments indicate that the object has constant velocity
• graph segments above the x-axis imply movement in the positive direction• graph segments below the x-axis imply movement in the negative direction • horizontal segments on the x-axis indicate no movement• straight line graph segments indicate constant acceleration• graph segments moving upward indicate an increase in velocity• graph segments moving downward indicate a decrease in velocity• a change of direction is indicated whenever the graph crosses the x-axis• an increase in speed is indicated by graph segments moving away from the x-axis
Check This Out One Dimensional Motion Diagrams an
d Motion Graphs PhysicsLab Resource LessonConstant
Velocity: Position-Time Graphs PhysicsLab Constant Velocity:
Position-Time Graphs