Embed Size (px)
Citation preview

11
MontrealSeptember 24, 2008
22
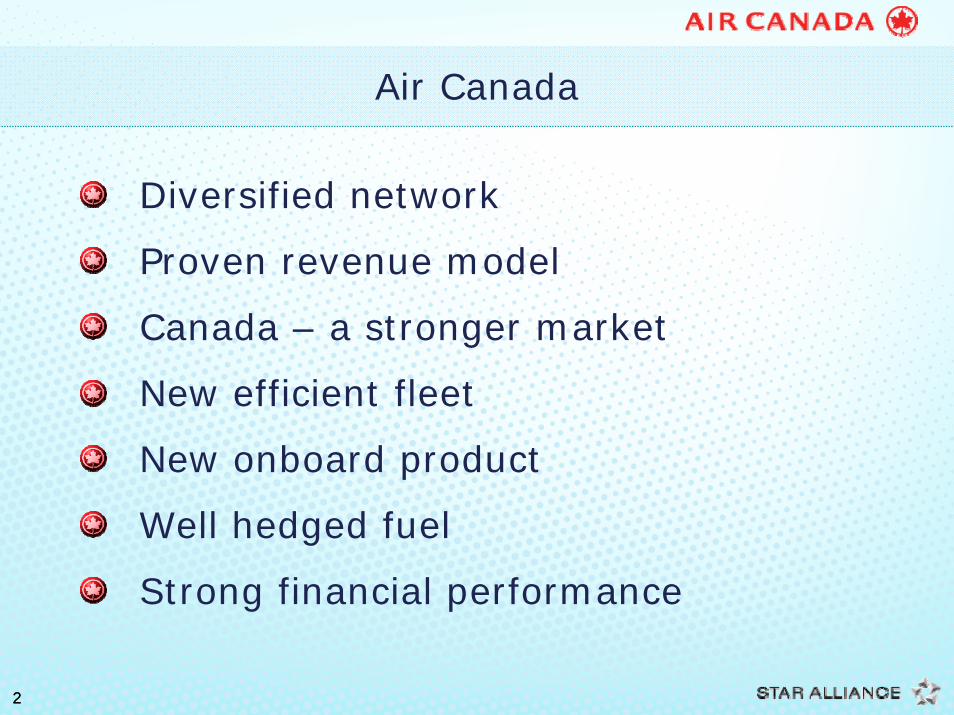
Air Canada
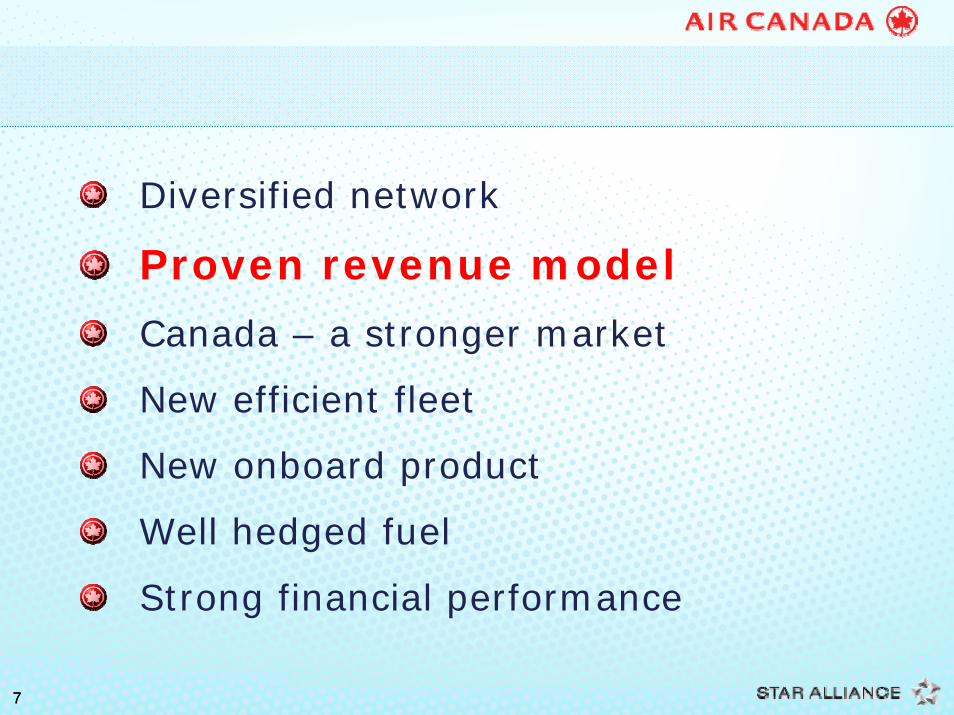
Diversified network
Proven revenue model
Canada – a stronger market
New efficient fleet
New onboard product
Well hedged fuel
Strong financial performance
33
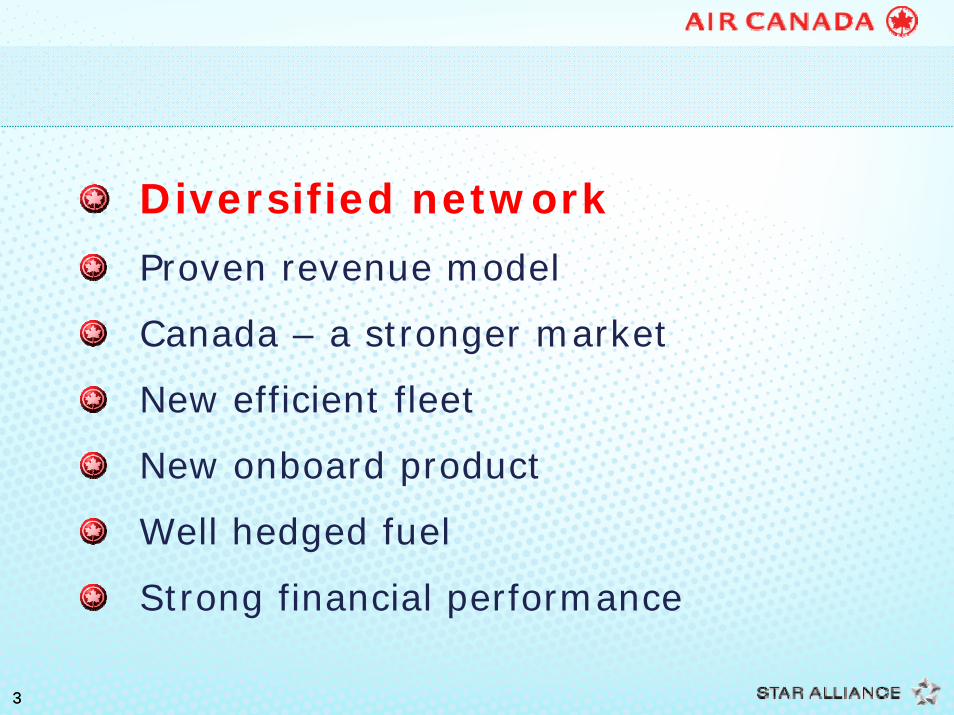
Diversified network
Proven revenue model
Canada – a stronger market
New efficient fleet
New onboard product
Well hedged fuel
Strong financial performance
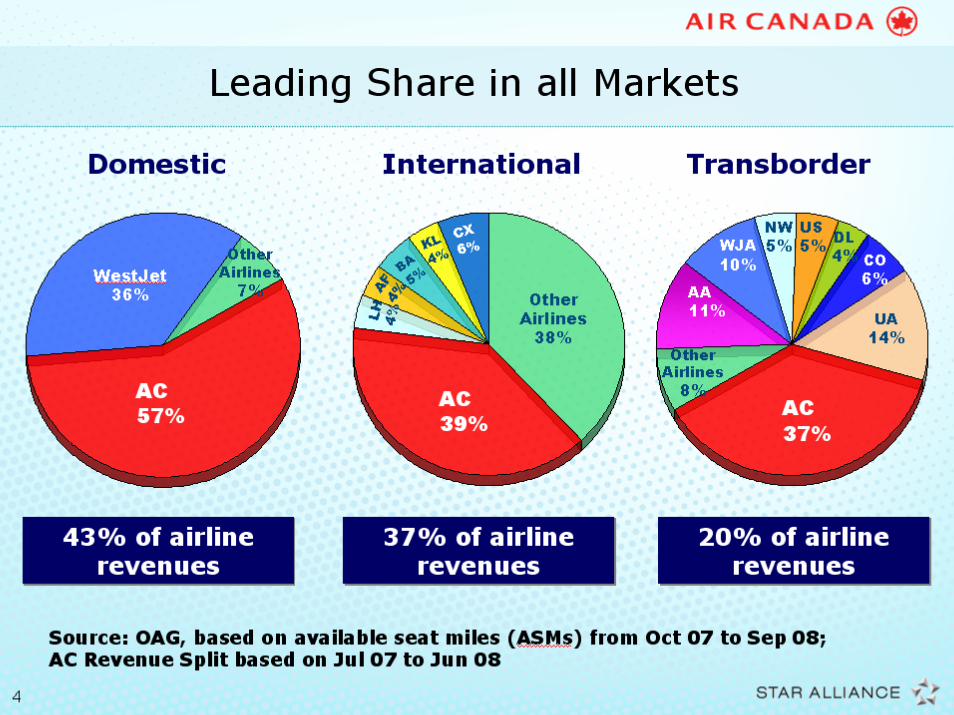
44
55
66
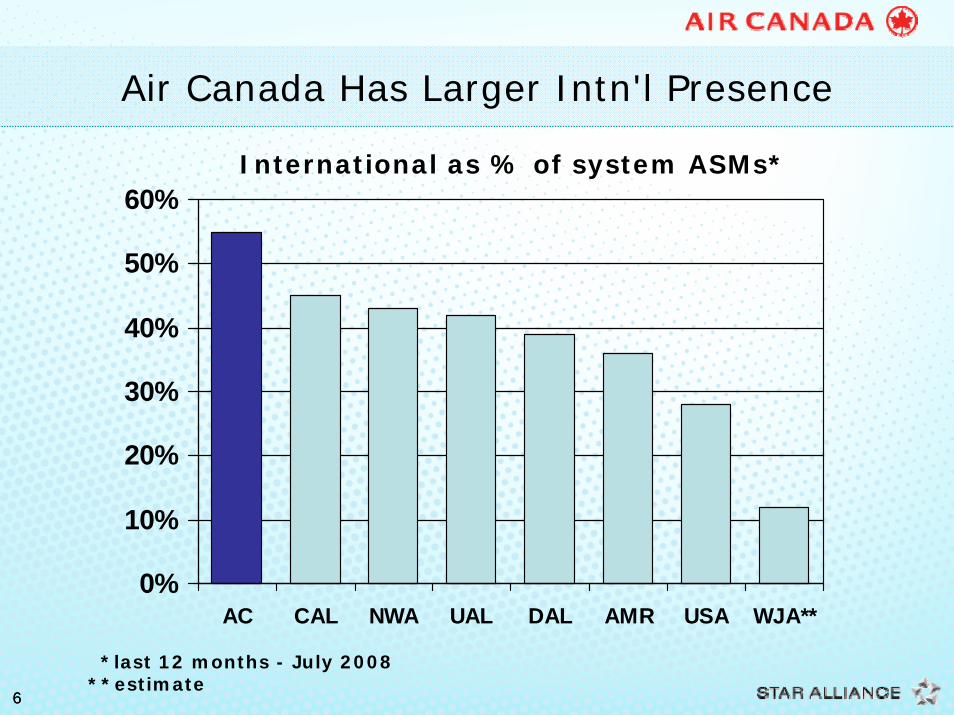
Air Canada Has Larger Intn'l Presence
0%
10%
20%
30%
40%
50%
60%
AC CAL NWA UAL DAL AMR USA WJA**
International as % of system ASMs*
*last 12 months - July 2008**estimate
77
Diversified network
Proven revenue model
Canada – a stronger market
New efficient fleet
New onboard product
Well hedged fuel
Strong financial performance
88
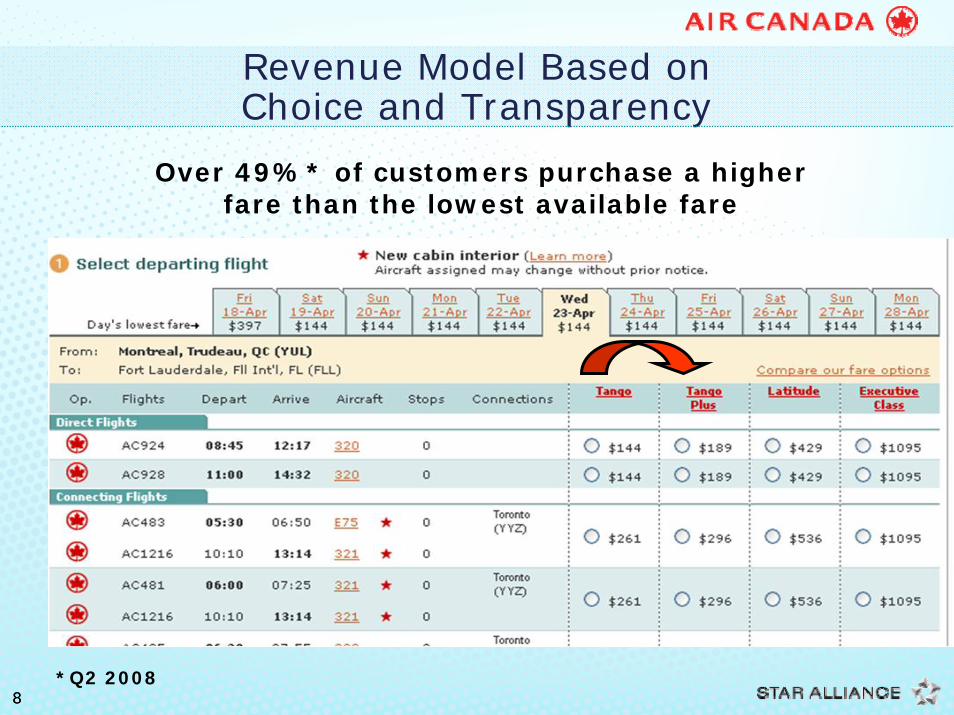
Revenue Model Based onChoice and Transparency
Over 49%* of customers purchase a higher fare than the lowest available fare
*Q2 2008
99
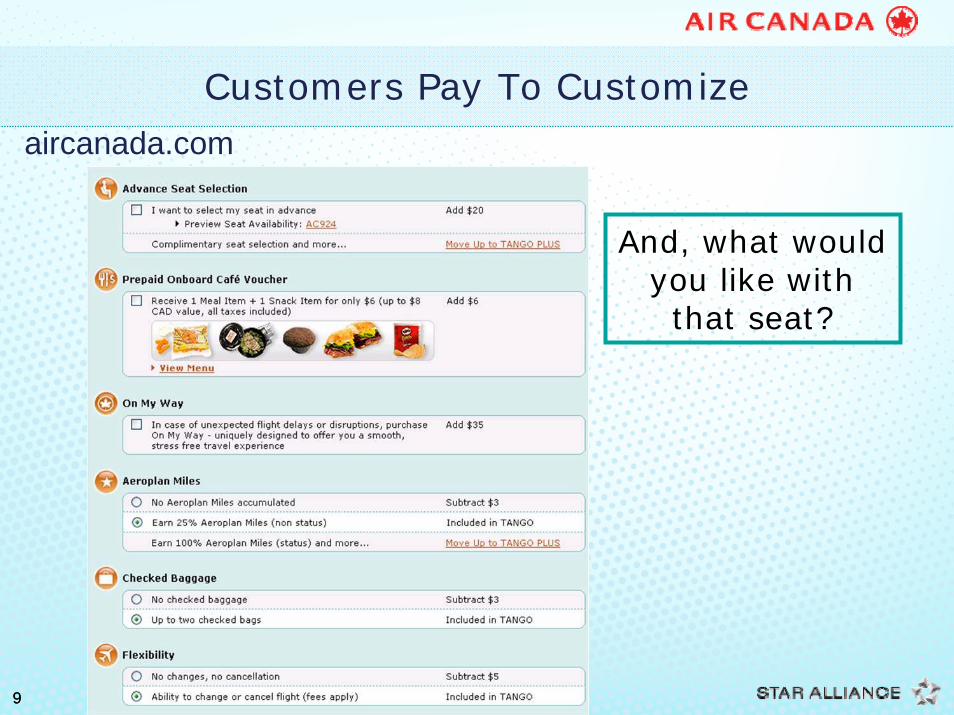
Customers Pay To Customize
And, what would you like with that seat?
aircanada.com
1010
$0.00
$1.00
$2.00
$3.00
$4.00
$5.00
$6.00
$7.00
$8.00
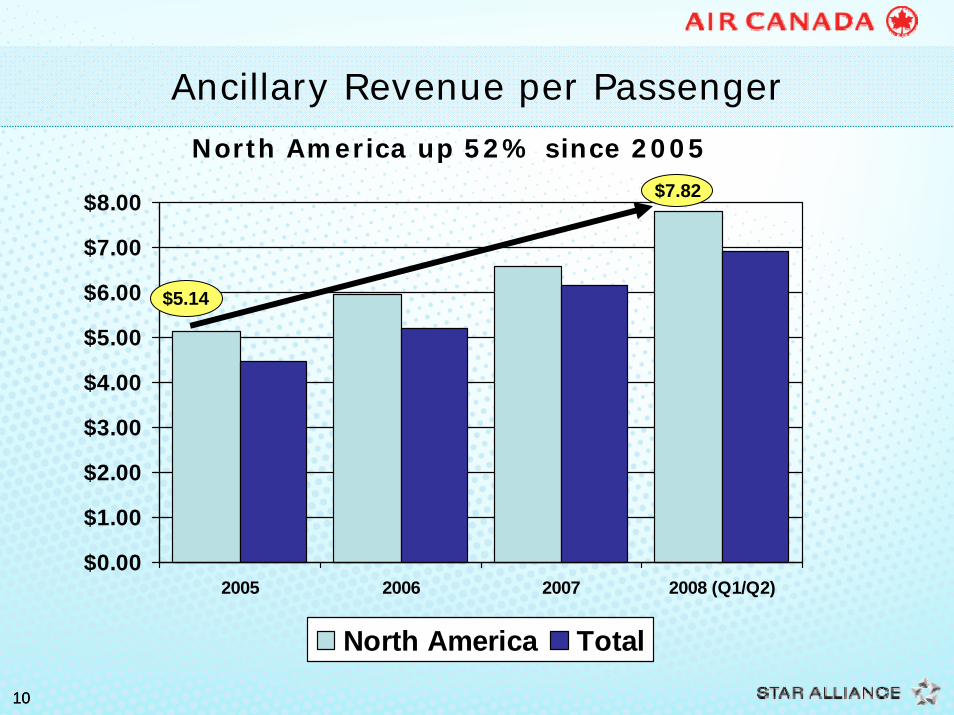
2005 2006 2007 2008 (Q1/Q2)
North America Total
$7.82
$5.14
Ancillary Revenue per Passenger
North America up 52% since 2005
1111
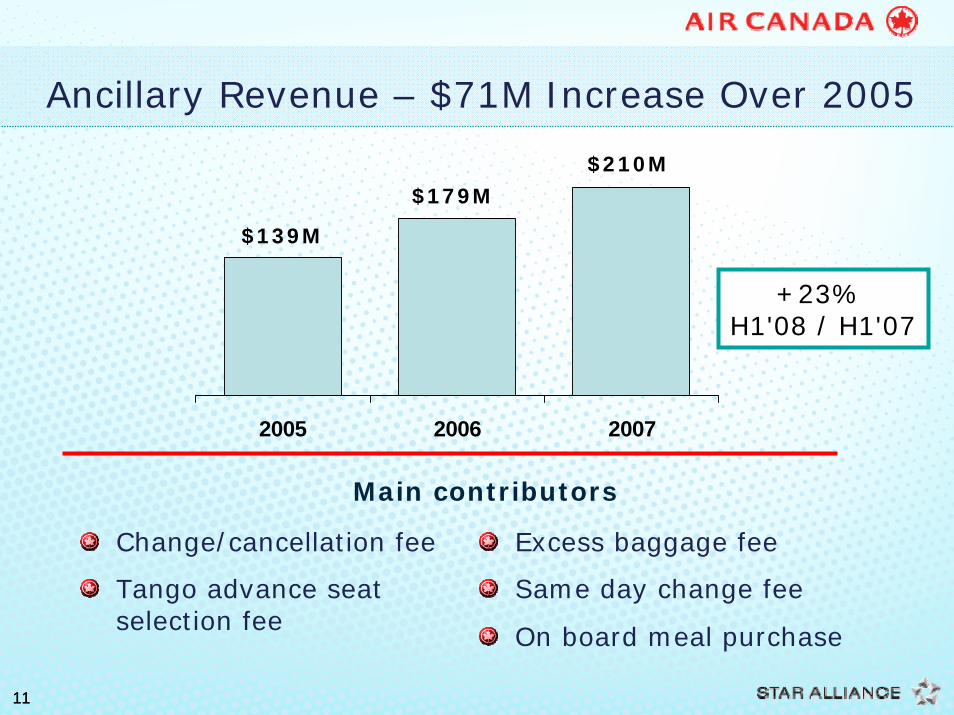
Ancillary Revenue – $71M Increase Over 2005
Change/cancellation fee
Tango advance seat selection fee
Excess baggage fee
Same day change fee
On board meal purchase
Main contributors
2005 2006 2007
$139M
$179M$210M
+23% H1'08 / H1'07
1212
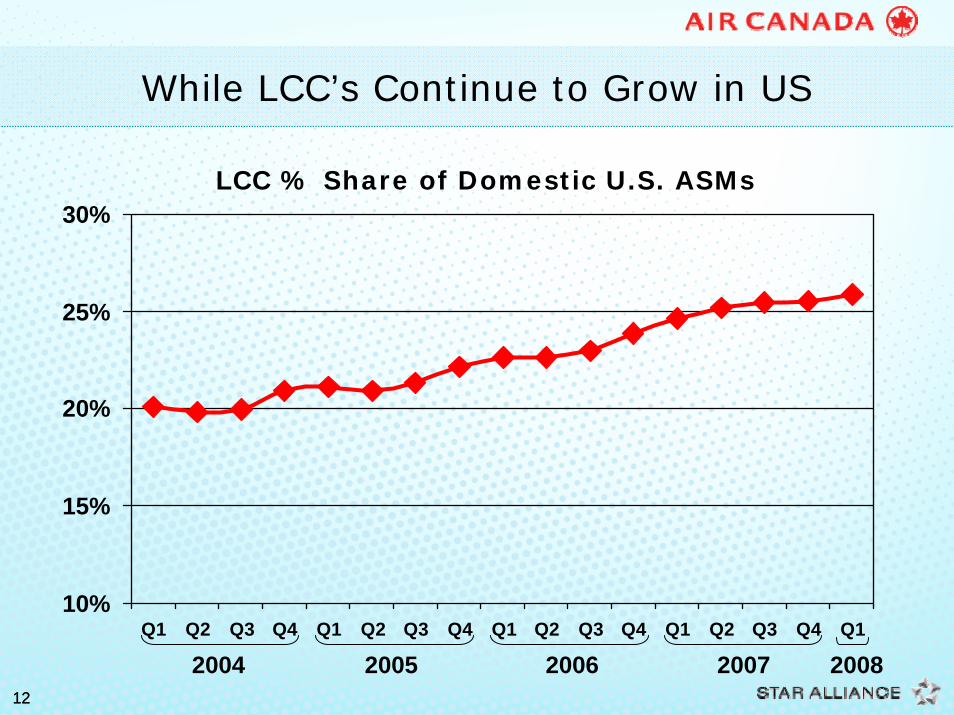
While LCC’s Continue to Grow in US
10%
15%
20%
25%
30%
Q1 Q2 Q3 Q4 Q1 Q2 Q3 Q4 Q1 Q2 Q3 Q4 Q1 Q2 Q3 Q4 Q1
2004 2005 2006 2007 2008
LCC % Share of Domestic U.S. ASMs
1313
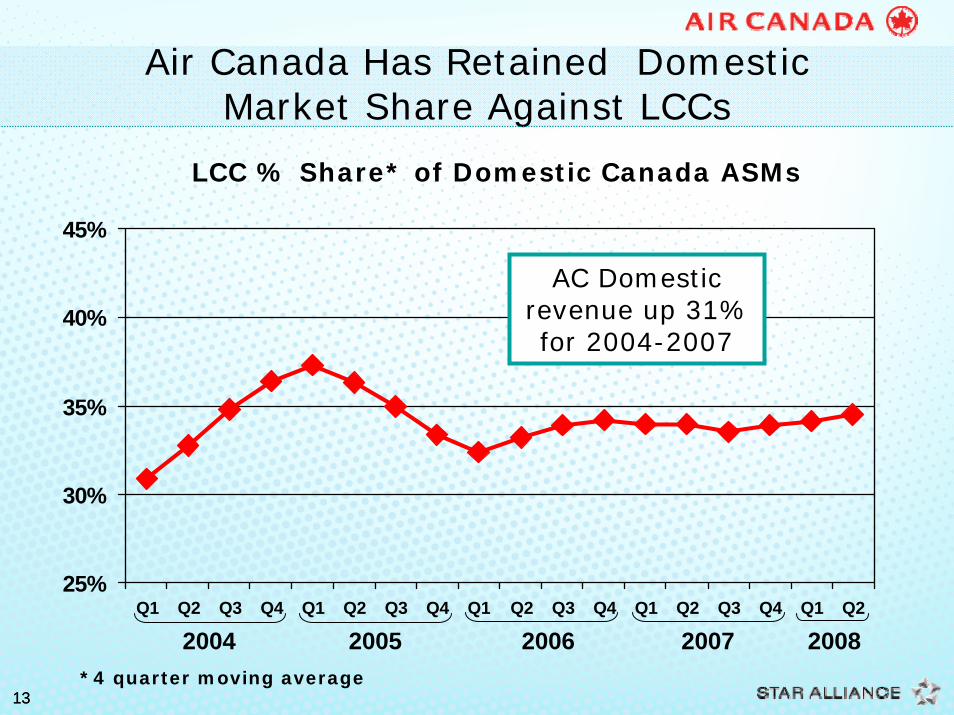
Air Canada Has Retained Domestic Market Share Against LCCs
25%
30%
35%
40%
45%
Q1 Q2 Q3 Q4 Q1 Q2 Q3 Q4 Q1 Q2 Q3 Q4 Q1 Q2 Q3 Q4 Q1 Q2
2004 2005 2006 2007 2008
LCC % Share* of Domestic Canada ASMs
AC Domesticrevenue up 31% for 2004-2007
*4 quarter moving average

1414
Web penetration - 12 month moving average
0%
10%
20%
30%
40%
50%
60%
70%
Dec-04
Mar-05
Jun-05
Sep-05
Dec-05
Mar-06
Jun-06
Sep-06
Dec-06
Mar-07
Jun-07
Sep-07
Dec-07
Mar-08
Jun-08
Domestic System total
Direct Sales - Web Penetration Continues
Source: Network Planning Portal/Daily Booking Enhanced
1515
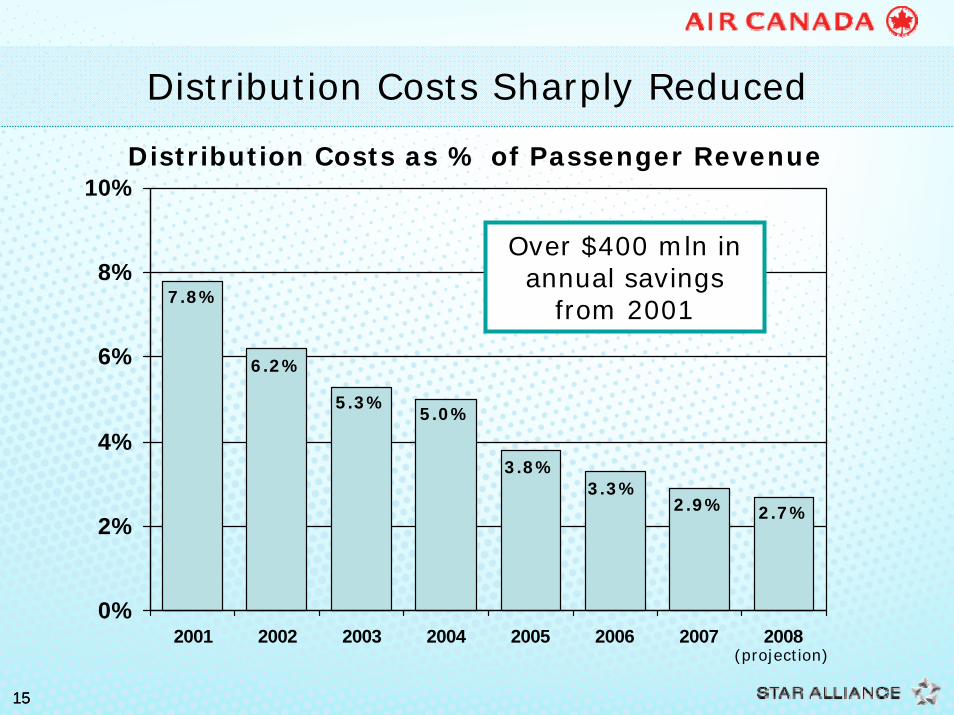
Distribution Costs Sharply Reduced
0%
2%
4%
6%
8%
10%
2001 2002 2003 2004 2005 2006 2007 2008
Distribution Costs as % of Passenger Revenue
(projection)
7.8%
6.2%
5.3%5.0%
3.8%3.3%
2.9% 2.7%
Over $400 mln in annual savings
from 2001
1616
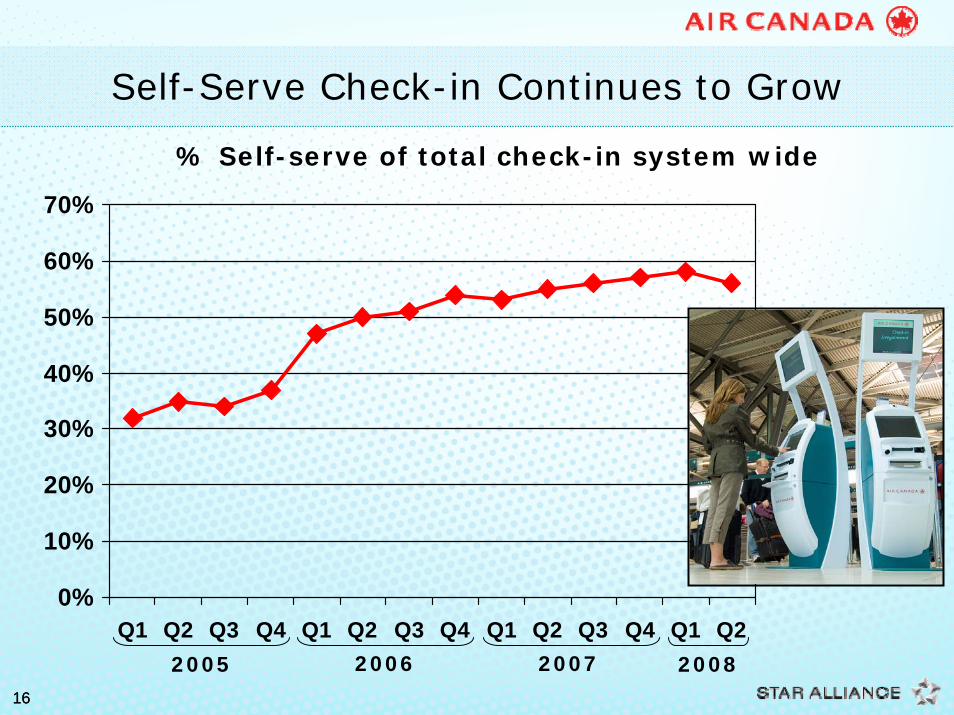
Self-Serve Check-in Continues to Grow
% Self-serve of total check-in system wide
0%
10%
20%
30%
40%
50%
60%
70%
Q1 Q2 Q3 Q4 Q1 Q2 Q3 Q4 Q1 Q2 Q3 Q4 Q1 Q22005 2006 2007 2008
1717
Diversified network
Proven revenue model
Canada – a stronger market
New efficient fleet
New onboard product
Well hedged fuel
Strong financial performance

11
Dom. Psgr. Revenue Growth for Canadian Industry Exceeds That of US Industry
0%
2%
4%
6%
8%
10%
2004 2005 2006 2007 2008
Canada* U.S. Industry**
(1)
(1) 1st half 2008*estimate**source – ATA
22
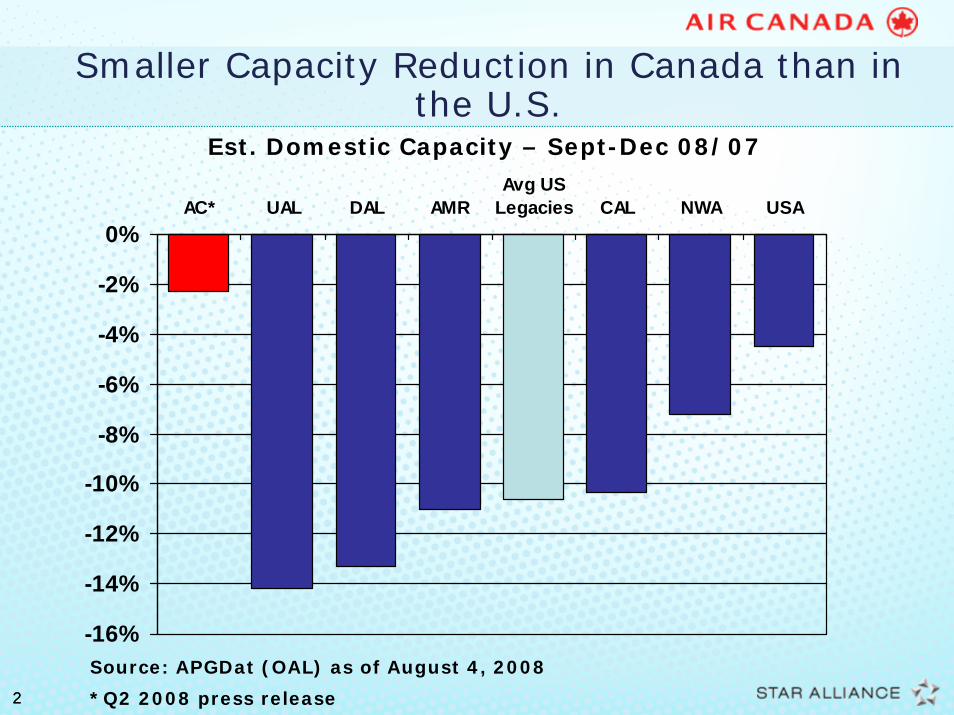
Smaller Capacity Reduction in Canada than in the U.S.
-16%
-14%
-12%
-10%
-8%
-6%
-4%
-2%
0%AC* UAL DAL AMR
Avg USLegacies CAL NWA USA
Est. Domestic Capacity – Sept-Dec 08/07
Source: APGDat (OAL) as of August 4, 2008
*Q2 2008 press release
33
Diversified network
Proven revenue model
Canada – a stronger market
New efficient fleet
New onboard product
Well hedged fuel
Strong financial performance

44
Fleet Renewal Nearing Completion
B777 17 firm (18 options)
– additional annual EBITDAR per aircraft
• B777-300: $13M• B777-200: $10M
B787 37 firm (23 options)– expected to be 30% cheaper on fuel
and maintenance than B767-300– deliveries delayed to 2012 from 2010
EMB190 45 Aircraft (23 options)– cash operating costs 19% cheaper than
A319 on a per trip basis
55
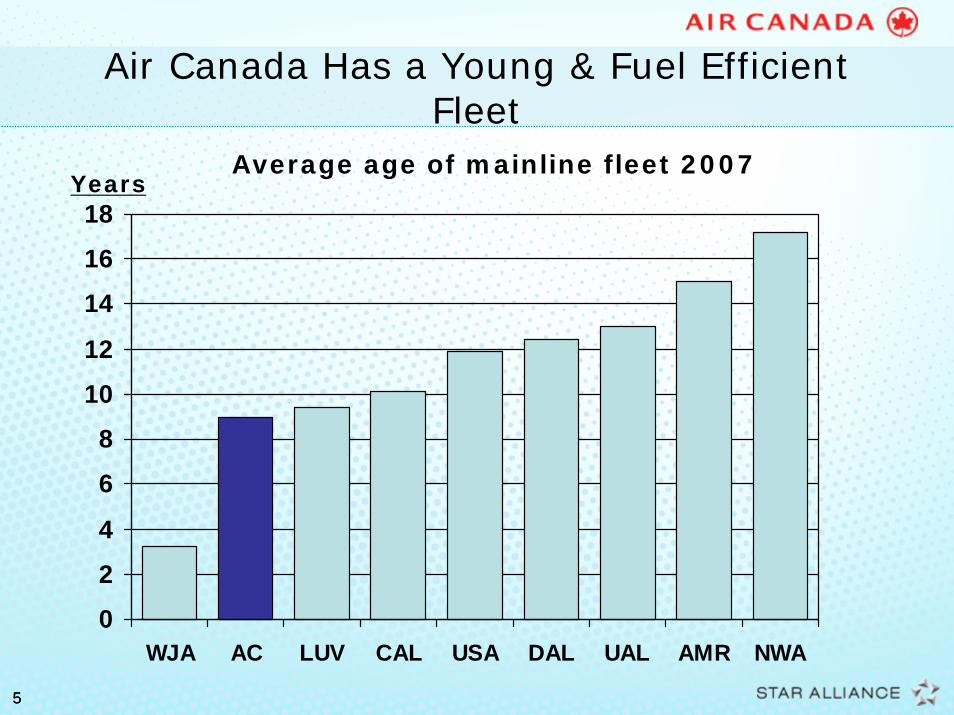
Air Canada Has a Young & Fuel Efficient Fleet
0
2
4
6
8
10
12
14
16
18
WJA AC LUV CAL USA DAL UAL AMR NWA
Average age of mainline fleet 2007Years
66
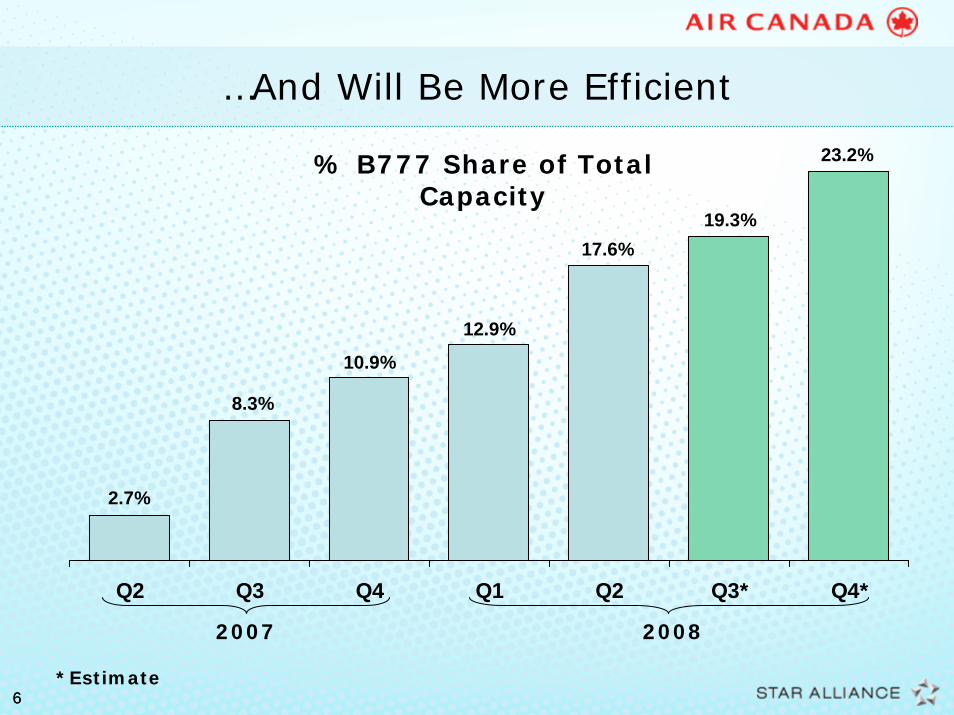
…And Will Be More Efficient
Q2 Q3 Q4 Q1 Q2 Q3* Q4*
12.9%
2007 2008
2.7%
8.3%
10.9%
17.6%19.3%
23.2%% B777 Share of Total Capacity
*Estimate

77
Diversified network
Proven revenue model
Canada – a stronger market
New efficient fleet
New onboard product
Well hedged fuel
Strong financial performance
88
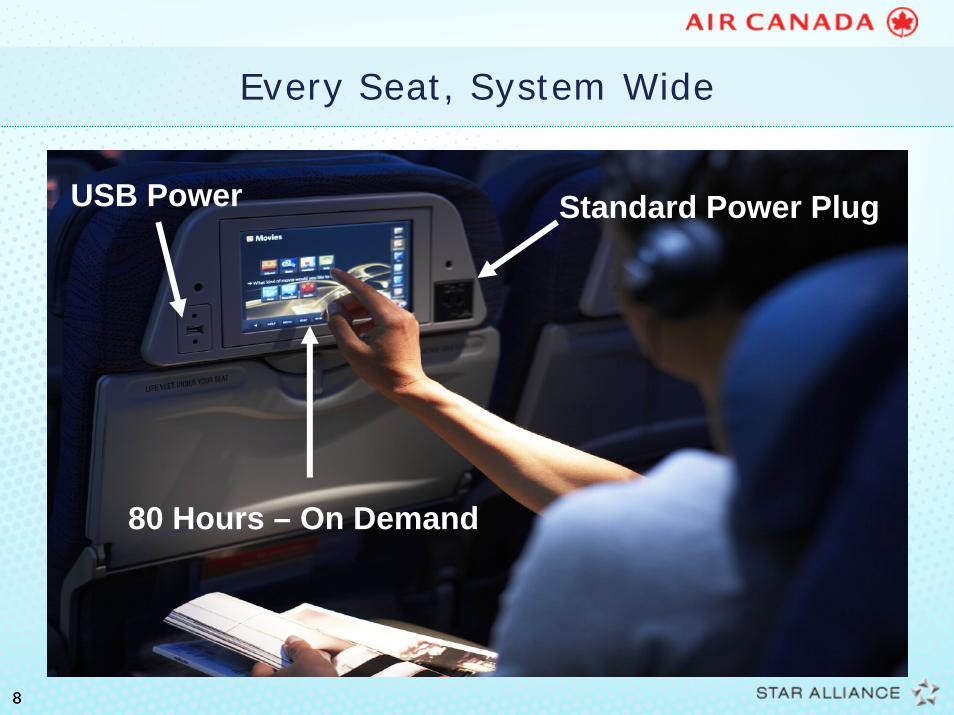
Every Seat, System Wide
Standard Power Plug
80 Hours – On Demand
USB Power
99
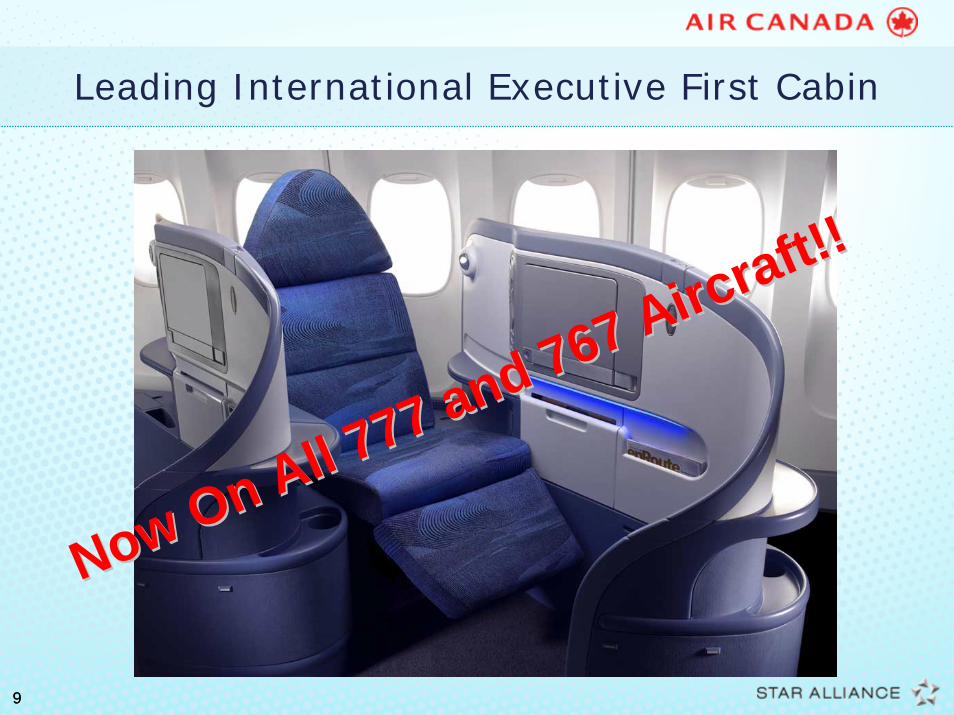
Leading International Executive First Cabin
Now On All 777 and 767 Aircraft!!
Now On All 777 and 767 Aircraft!!
1010
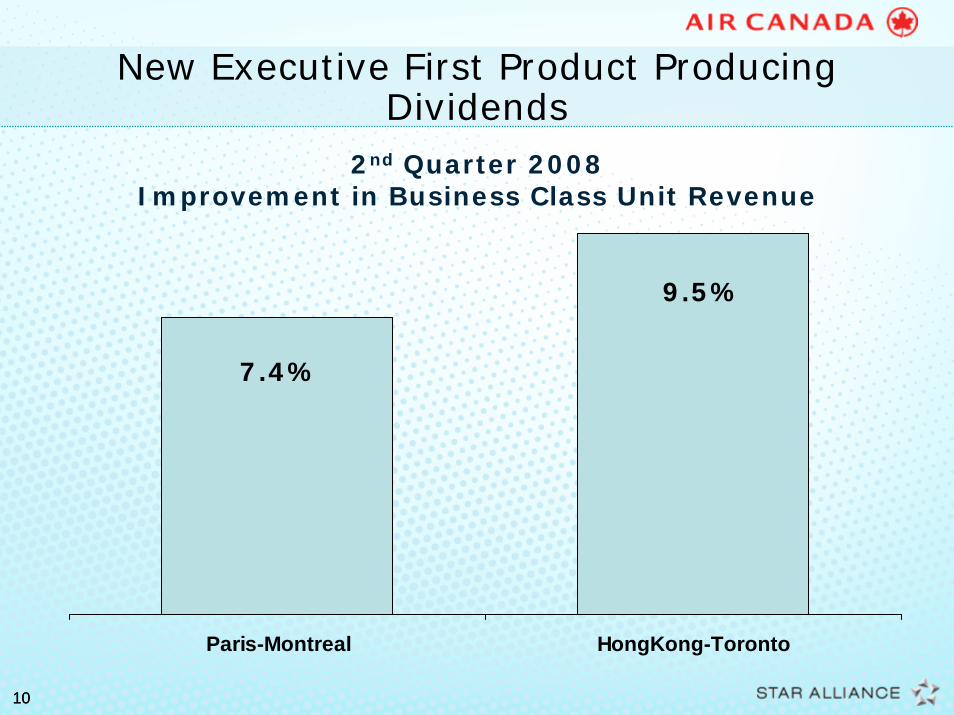
New Executive First Product Producing Dividends
Paris-Montreal HongKong-Toronto
2nd Quarter 2008 Improvement in Business Class Unit Revenue
7.4%
9.5%
1111
Diversified network
Proven revenue model
Canada – a stronger market
New efficient fleet
New onboard product
Well hedged fuel
Strong financial performance
1212
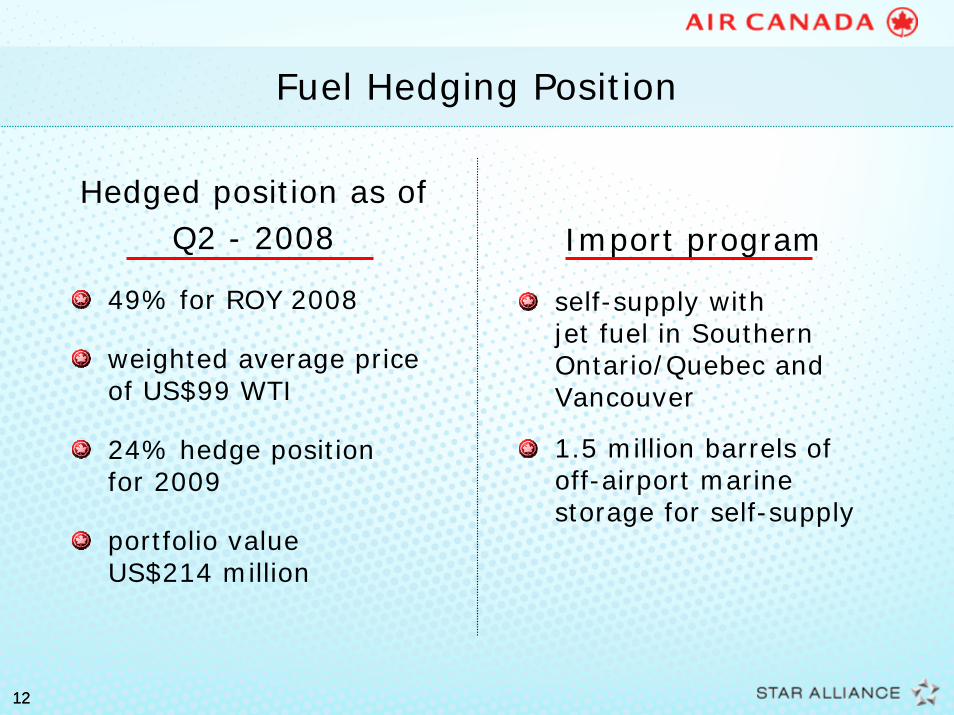
Fuel Hedging Position
Hedged position as ofQ2 - 2008
49% for ROY 2008
weighted average price of US$99 WTI
24% hedge position for 2009
portfolio value US$214 million
Import program
self-supply with jet fuel in Southern Ontario/Quebec and Vancouver
1.5 million barrels of off-airport marine storage for self-supply
1313
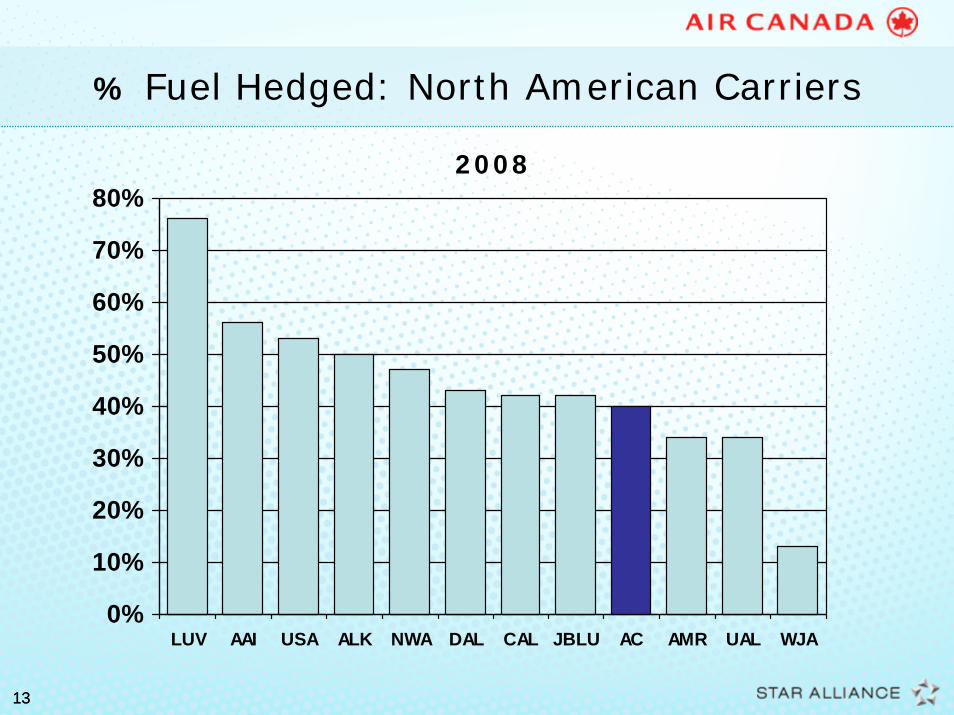
% Fuel Hedged: North American Carriers
0%
10%
20%
30%
40%
50%
60%
70%
80%
LUV AAI USA ALK NWA DAL CAL JBLU AC AMR UAL WJA
2008
1414
Diversified network
Proven revenue model
Canada – a stronger market
New efficient fleet
New onboard product
Well hedged fuel
Strong financial performance
1515
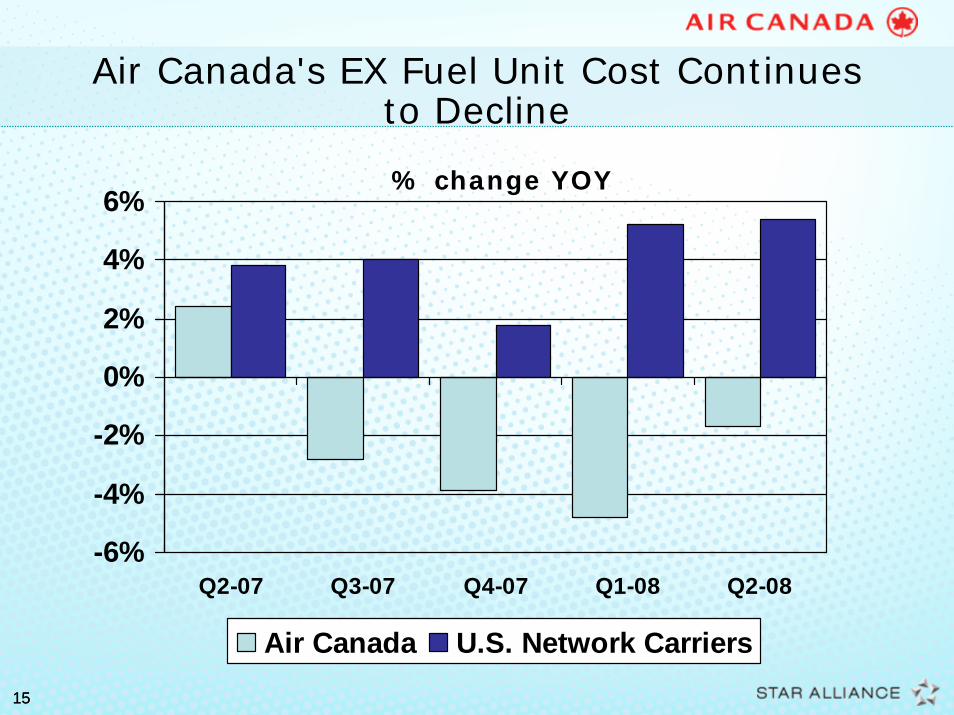
Air Canada's EX Fuel Unit Cost Continues to Decline
-6%
-4%
-2%
0%
2%
4%
6%
Q2-07 Q3-07 Q4-07 Q1-08 Q2-08
Air Canada U.S. Network Carriers
% change YOY
1616
Cost Initiatives
Blitz program - $100 million target– Started early 2008 – expect to deliver savings by Y/E– Consists of approximately 100 different projects
Weight reduction - $25-$50 million target– Cross-functional team – reduce weight on aircraft– Short-term and long-term actions
Renegotiate supplier contracts - $20-$40 milliontarget
Lobby efforts– Provincial & federal governments – excise tax & airport
rents
1717
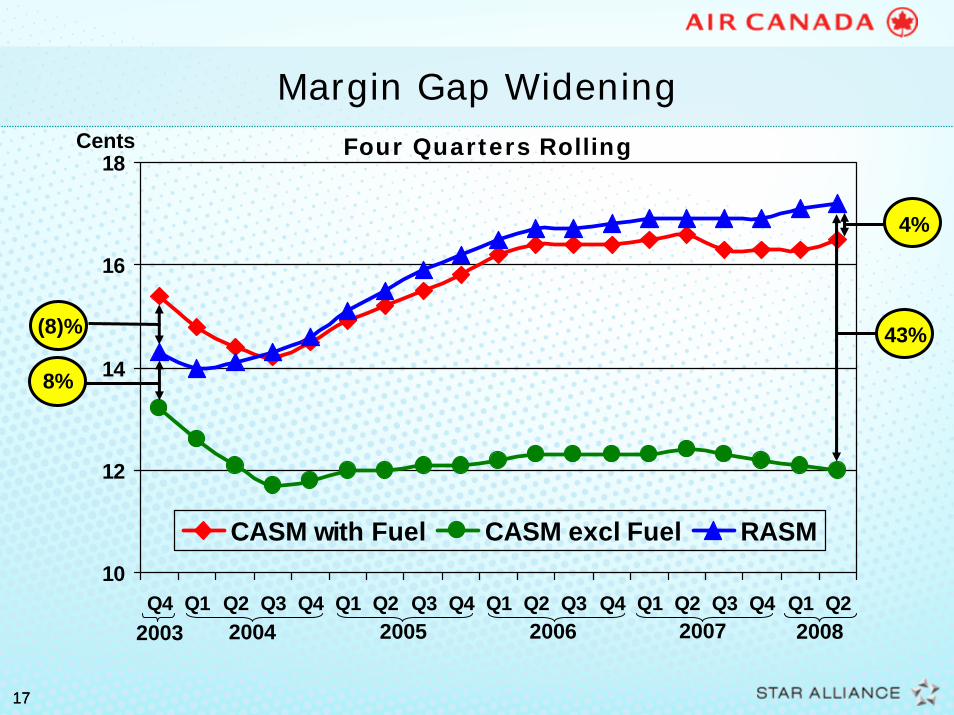
10
12
14
16
18
Q4 Q1 Q2 Q3 Q4 Q1 Q2 Q3 Q4 Q1 Q2 Q3 Q4 Q1 Q2 Q3 Q4 Q1 Q2
CASM with Fuel CASM excl Fuel RASM
Margin Gap WideningFour Quarters Rolling
2003 2004 2005 2006 2007 2008
Cents
(8)%
4%
8%
43%
1818
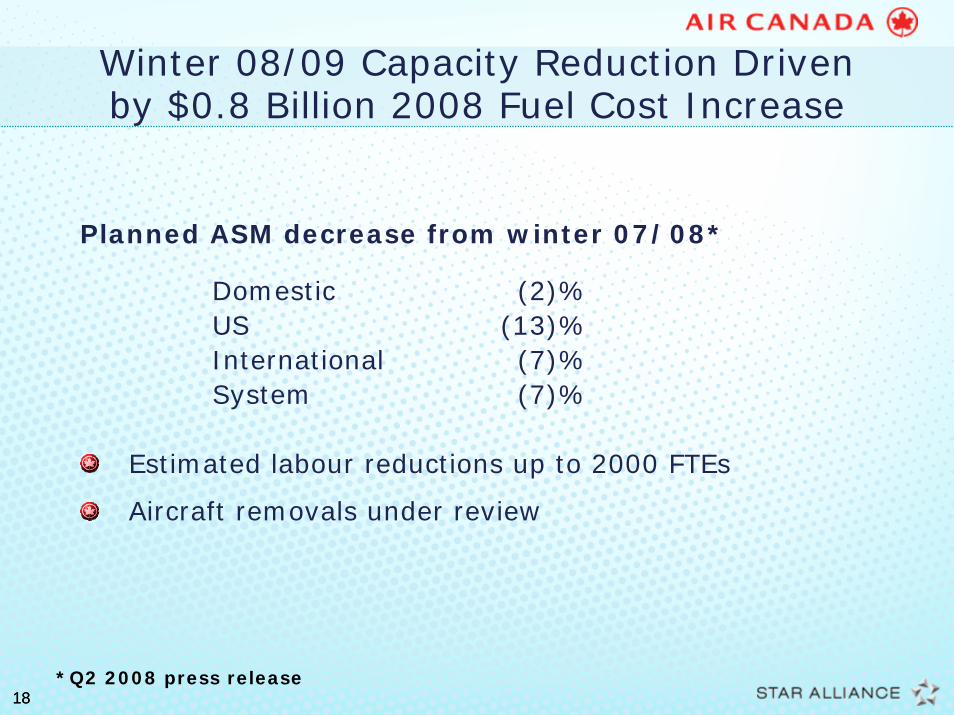
Winter 08/09 Capacity Reduction Driven by $0.8 Billion 2008 Fuel Cost Increase
Planned ASM decrease from winter 07/08*
Domestic (2)%US (13)%International (7)%System (7)%
Estimated labour reductions up to 2000 FTEs
Aircraft removals under review
*Q2 2008 press release
1919
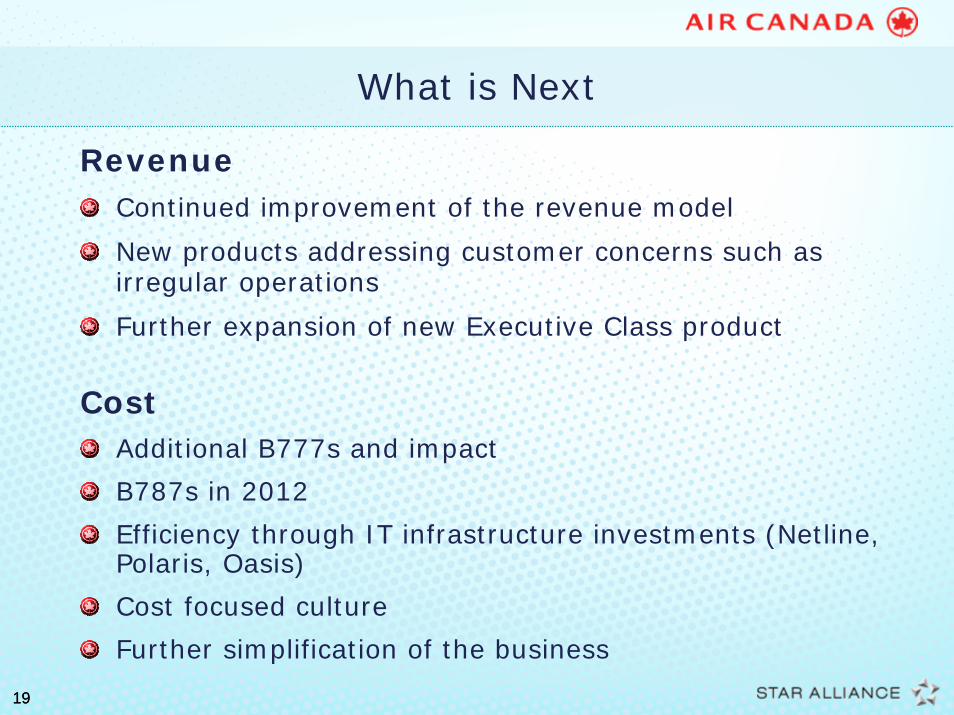
What is Next
RevenueContinued improvement of the revenue model
New products addressing customer concerns such as irregular operations
Further expansion of new Executive Class product
CostAdditional B777s and impact
B787s in 2012
Efficiency through IT infrastructure investments (Netline, Polaris, Oasis)
Cost focused culture
Further simplification of the business
2020
Our Investment Proposition
Diversified network
Proven revenue model
Canada – a stronger market
New efficient fleet
New onboard product
Well hedged fuel
Strong financial performance
2121
Caution Regarding Forward-looking Information
Air Canada’s public communications may include written or oral forward looking statements within the meaning of applicable securities laws. Such statements are included in this presentation and may be included in filings with regulatory authorities and securities regulators. Forward-looking statements relate to analyses and other information that are based on forecasts of future results and estimates of amounts not yet determinable. These statements may involve, but are not limited to, comments relating to strategies, expectations, planned operations or future actions. These forward-looking statements are identified by the use of terms and phrases such as “anticipate", “believe", “could", “estimate", “expect", “intend", “may", “plan", “predict", “project", “will", “would", and similar terms and phrases, including references to assumptions.
Forward-looking statements, by their nature, are based on assumptions, including those described below, and are subject to important risks and uncertainties. Any forecasts or forward-looking predictions or statements cannot be relied upon due to, amongst other things, changing external events and general uncertainties of the business. Results indicated in forward-looking statements may differ materially from actual results due to a number of factors, including without limitation, energy prices, general industry, market and economic conditions, currency exchange and interest rates, competition, war, terrorist acts, epidemic diseases, insurance issues and costs, changes in demand due to the seasonal nature of the business, the ability to reduce operating costs, employee and labour relations, pension issues, supply issues, changes in laws, regulatory developments or proceedings, pending and future litigation and actions by third parties as well as the factors identified throughout this presentation and, in particular, those identified in the “Risk Factors" section (Section 17) of Air Canada’s 2007 MD&A dated February 6, 2008 and section 13 of our second quarter MD&A dated August 8, 2008. Except as otherwise provided, the forward-looking statements contained in this presentationrepresent the Corporation’s expectations as of the date of this presentation and are subject to change after such date. However, the Corporation disclaims any intention or obligation to update or revise any forward-looking statements whether as a result of new information, future events or otherwise, except as required under applicable securities regulations.

2222