Embed Size (px)
Citation preview

Monthly Weather Review
Victoria
May 2010

The Monthly Weather Review - Victoria is produced twelve times each year by the Australian Bureau of Meteorology's VictoriaClimate Services Centre.
It is intended to provide a concise but informative overview of the temperatures, rainfall and significant weather events in Victoriafor the month.
To keep the Monthly Weather Review as timely as possible, much of the information is based on electronic reports. Although everyeffort is made to ensure the accuracy of these reports, the results can be considered only preliminary until complete quality controlprocedures have been carried out. Major discrepancies will be noted in later issues.
We are keen to ensure that the Monthly Weather Review is appropriate to the needs of its readers. If you have any comments orsuggestions, please do not hesitate to contact us:
By mail
Victoria Climate Services CentreBureau of MeteorologyPO Box 1636Melbourne VIC 3001AUSTRALIA
By telephone
(03) 9669 4956
By email
You may also wish to visit the Bureau's home page, http://www.bom.gov.au.
Units of measurementExcept where noted, temperature is given in degrees Celsius (°C), rainfall in millimetres (mm), and wind speed in kilometres per hour(km/h).
Observation times and periodsEach station in Victoria makes its main observation for the day at 9 am local time. At this time, the precipitation over the past 24hours is determined, and maximum and minimum thermometers are also read and reset. In this publication, the followingconventions are used for assigning dates to the observations made:
Maximum temperatures are for the 24 hours from 9 am on the date mentioned. They normally occur in the afternoon of that day.
Minimum temperatures are for the 24 hours to 9 am on the date mentioned. They normally occur in the early morning of that day.
Daily rainfall is for the 24 hours to 9 am on the date mentioned. This means a significant fraction of the rain may have occurred onthe previous calendar day.
Monthly rainfall is for the period from 9 am on the last day of the previous month to 9 am on the last day of this month.
Maximum daily wind gusts are in the 24 hours from midnight to midnight.
Climatological valuesThe climatological averages shown in the text and tables are generally long-term means based on observations from all availableyears of record, which vary widely from site to site. They are not shown for sites with less than 10 years of record, as they cannotthen be calculated reliably. Climatological extremes are generally taken from available observations from all available years of record.The number of years can vary substantially from site to site.
Copyright© Commonwealth of Australia 2010This work is copyright. You may download, display, print and reproduce this material in unaltered form only (retaining this notice) foryour personal, non-commercial use or use within your organisation. Apart from any use as permitted under the Copyright Act 1968,all other rights are reserved. Requests and inquiries concerning reproduction and rights should be addressed to CommonwealthCopyright Administration, Attorney General’s Department, Robert Garran Offices, National Circuit, Barton ACT 2600 or posted athttp://www.ag.gov.au/cca.
Product code IDCKGC16R1. Prepared on 17 June 2010. ISSN 1836-3016
Cover photographSunrise glows on a deck of middle-level cloud above Kirwans Bridge, Nagambie.Photograph by Margaret McLean, 9 June 2008. Used with permission.If you have a photo you think would make a good cover for the Monthly Weather Review, please contact us at the address above.
Monthly Weather Review Victoria May 2010

OverviewMaximum temperatures were close to, or slightlyabove average across the state, whilst minimumtemperatures were close to normal. Most districtsreceived close to average rainfall, with only someparts of western and northeastern Victoria receivingbelow average totals.
Extremes in May 2010
Hottest day(Highest daily maximum temperature)27.1 °C at East Sale Airport on the 4th
Warmest days on average(Highest mean daily maximum temperature)
19.5 °C at Mildura AirportCoolest days on average
(Lowest mean daily maximum temperature)4.4 °C at Mount Hotham
Coldest day(Lowest daily maximum temperature)
−1.5 °C at Mount Baw Baw on the 11thColdest night
(Lowest daily minimum temperature)−4.8 °C at Mount Hotham on the 12th
Coolest nights on average(Lowest mean daily minimum temperature)
−0.1 °C at Mount HothamWarmest nights on average
(Highest mean daily minimum temperature)12.1 °C at Wilsons Promontory Lighthouse
Warmest night(Highest daily minimum temperature)
15.5 °C at Gabo Island Lighthouse on the 4thWettest overall
(Highest total rainfall)195.6 mm at Genoa (Fools Haven)
Wettest day(Highest daily rainfall)
87.4 mm at Mount Wellington on the 31stHighest wind gust
120 km/h at Mount Hotham on the 30th
Significant weatherWindA cold front moved across the state on the 4th with avigorous north to northwesterly flow ahead. Windgusts to 102 km/h were recorded at Mt William inthe Grampians.
On the 11th, Wilsons Promontory recorded averagewind speeds of 94 km/h with gusts to 118 km/h.
On the 30th, Mt Hotham recorded average windspeeds of 68 km/h with gusts to 120 km/h.
FloodsFlood watches were current for East Gippsland rivers(Mitchell, Tambo, Snowy, Cann and Genoa Rivers)between the 29th and 31st.
A moderate flood warning was issued for the SnowyRiver on the evening of Sunday 30th after rainfalltotals in the Upper Snowy River catchment rangedfrom 30 mm to 178 mm since 9 am the previous day.The warning was finalised on the 3rd of June.
TemperaturePhillip Island Penguin Reserve experienced its lowestMay temperature on record on the 23rd (−0.2 °C).
Synoptic summaryThe pressure pattern at the beginning of the monthwas mostly typical of May, with high pressuresystems traversing central Australia and cold frontscrossing Victoria. There was also a period of up totwo weeks of mostly stable weather across the Stateas a blocking high pressure system developed overNew South Wales. Blocking high pressure systemsare not uncommon during Autumn and can result instretches of sunny weather for weeks at a time.Minimum temperatures were slightly below normalfor the month due to this period of clear skies andlight winds, with maximum temperatures near thelong term average.
This period of stable weather broke down towardsthe end of the month as two low pressure systemcrossed southern New South Wales on the 25th and29th. The passage of these two systems resulted inrainfall across the far north of the State being aboveaverage, while elsewhere it was either average orslightly below normal. Mean Sea Level Pressure(MSLP) across south-eastern Australia was up to2 hPa below average as a result of the low pressuresystems crossing the region.
Monthly Weather Review Victoria May 2010
page 1
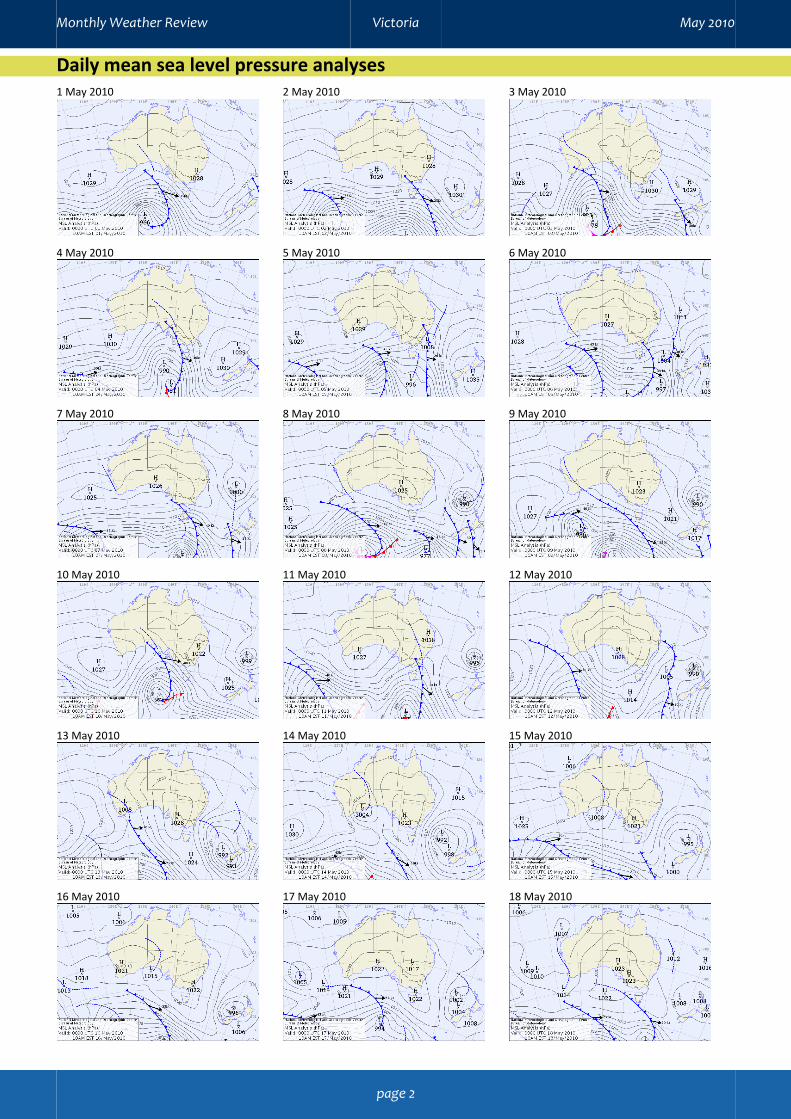
Daily mean sea level pressure analyses1 May 2010 2 May 2010 3 May 2010
4 May 2010 5 May 2010 6 May 2010
7 May 2010 8 May 2010 9 May 2010
10 May 2010 11 May 2010 12 May 2010
13 May 2010 14 May 2010 15 May 2010
16 May 2010 17 May 2010 18 May 2010
Monthly Weather Review Victoria May 2010
page 2

19 May 2010 20 May 2010 21 May 2010
22 May 2010 23 May 2010 24 May 2010
25 May 2010 26 May 2010 27 May 2010
28 May 2010 29 May 2010 30 May 2010
31 May 2010
Monthly Weather Review Victoria May 2010
page 3

TemperaturesA period of stable weather during the middle of themonth caused by a blocking high pressure systemlead to maximums for the month being slightly abovenormal and minimums slightly below.
The mean temperature for Victoria in May 2010 was11.34 °C, which is 0.14 °C above the long-termaverage.
New temperature records
Record lowest May daily minimum temperature
New record Old recordYears
ofrecord
Phillip Island PenguinReserve −0.2 on the 23rd 0.7 on the 11th in 1998 24
Maximum temperaturesThe hottest day was 27.1 °C at East Sale Airport onthe 4th.
The warmest days on average were 19.5 °C atMildura Airport, followed by 19.3 °C at WalpeupResearch, followed by 19.2 °C at Hopetoun Airportand Ouyen (Post Office).
The coolest day was −1.5 °C at Mount Baw Baw onthe 11th.
The coolest days on average were 4.4 °C at MountHotham, followed by 6.0 °C at Falls Creek and MountBaw Baw, followed by 6.1 °C at Mount Buller.
Anomalies of mean daily maximum temperature inMay 2010
Decile rank of mean daily maximum temperaturein May 2010
There could be discrepancies between the values shown on these mapsand those at individual locations, as a result of the way the maps aregenerated.
Monthly Weather Review Victoria May 2010
page 4

Minimum temperaturesThe coldest night was −4.8 °C at Mount Hotham onthe 12th.
The coolest nights on average were −0.1 °C at MountHotham, followed by 0.8 °C at Dinner Plain (MountHotham Airport), followed by 0.9 °C at Falls Creek.
The warmest nights on average were 12.1 °C atWilsons Promontory Lighthouse, followed by 11.3 °Cat Gabo Island Lighthouse, followed by 11.0 °C atPoint Hicks (Lighthouse).
The warmest night was 15.5 °C at Gabo IslandLighthouse on the 4th.
Anomalies of mean daily minimum temperature inMay 2010
Decile rank of mean daily minimum temperature inMay 2010
There could be discrepancies between the values shown on these mapsand those at individual locations, as a result of the way the maps aregenerated.
Monthly Weather Review Victoria May 2010
page 5

RainfallMost areas received close to average rainfall thismonth, with rainfall slightly above average in farnorthern parts of the Mallee and Northern Country,and in east Gippsland. Parts of the Western andWimmera districts, as well as areas to the northeastof Melbourne, received totals that were belowaverage. The passage of two low pressure systemsacross southern New South Wales which thendeepened as they moved into the Tasman Searesulted in parts of East Gippsland receiving falls inexcess of 100 mm in the last week of May.
The wettest overall was 195.6 mm at Genoa (FoolsHaven).
The wettest single day was 87.4 mm at MountWellington on the 31st.
Total rainfall in May 2010
Decile rank of total rainfall in May 2010
There could be discrepancies between the values shown on these mapsand those at individual locations, as a result of the way the maps aregenerated.
New rainfall records
Highest May total rainfall for at least 20 years
Observed this month Most recent higherYearssince
higherWerrimull 58.0 65.0 in 1979 25Kerang Gmw 74.1 80.1 in 1988 21Irymple (Arlington) 54.0 60.8 in 1990 20Mildura Airport 51.2 63.6 in 1990 20Pira Wild Horse Plains 69.0 83.0 in 1989 20
Lowest May total rainfall for at least 20 yearsObserved this
monthMost recent
lower
Yearssincelower
Winchelsea (PostOffice) 7.0 2.3 in 1947 60
Monthly Weather Review Victoria May 2010
page 6
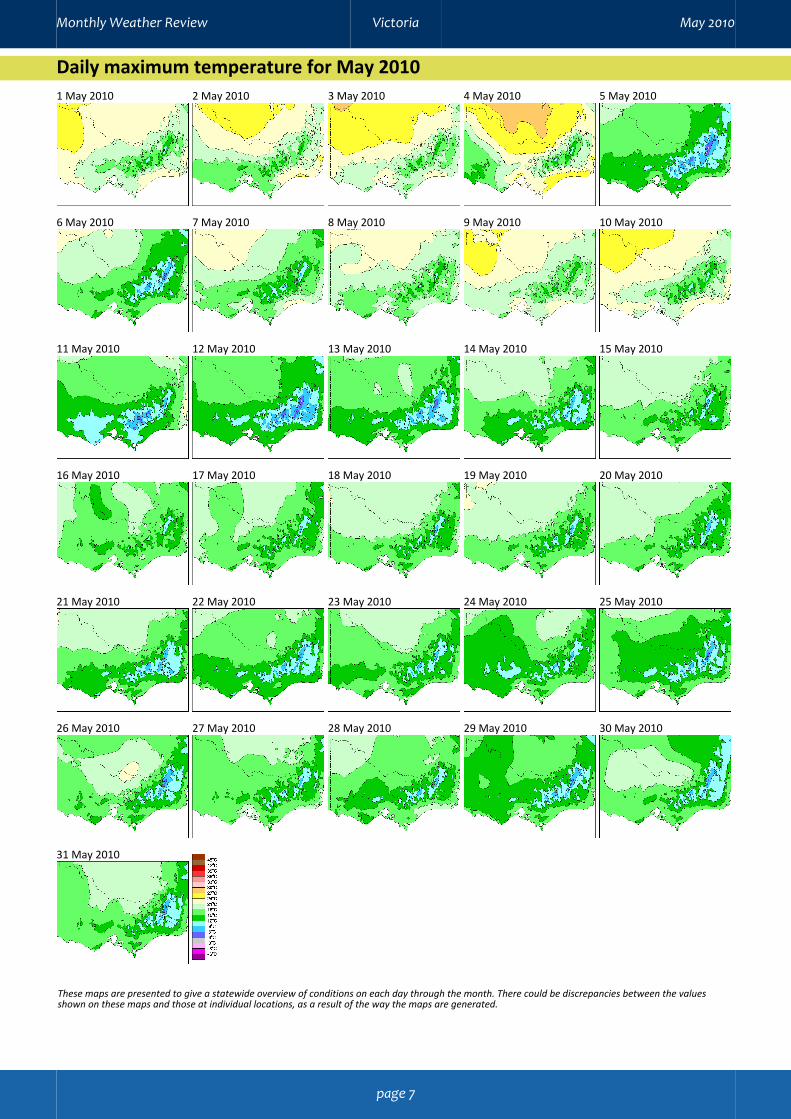
Daily maximum temperature for May 20101 May 2010 2 May 2010 3 May 2010 4 May 2010 5 May 2010
6 May 2010 7 May 2010 8 May 2010 9 May 2010 10 May 2010
11 May 2010 12 May 2010 13 May 2010 14 May 2010 15 May 2010
16 May 2010 17 May 2010 18 May 2010 19 May 2010 20 May 2010
21 May 2010 22 May 2010 23 May 2010 24 May 2010 25 May 2010
26 May 2010 27 May 2010 28 May 2010 29 May 2010 30 May 2010
31 May 2010
These maps are presented to give a statewide overview of conditions on each day through the month. There could be discrepancies between the valuesshown on these maps and those at individual locations, as a result of the way the maps are generated.
Monthly Weather Review Victoria May 2010
page 7
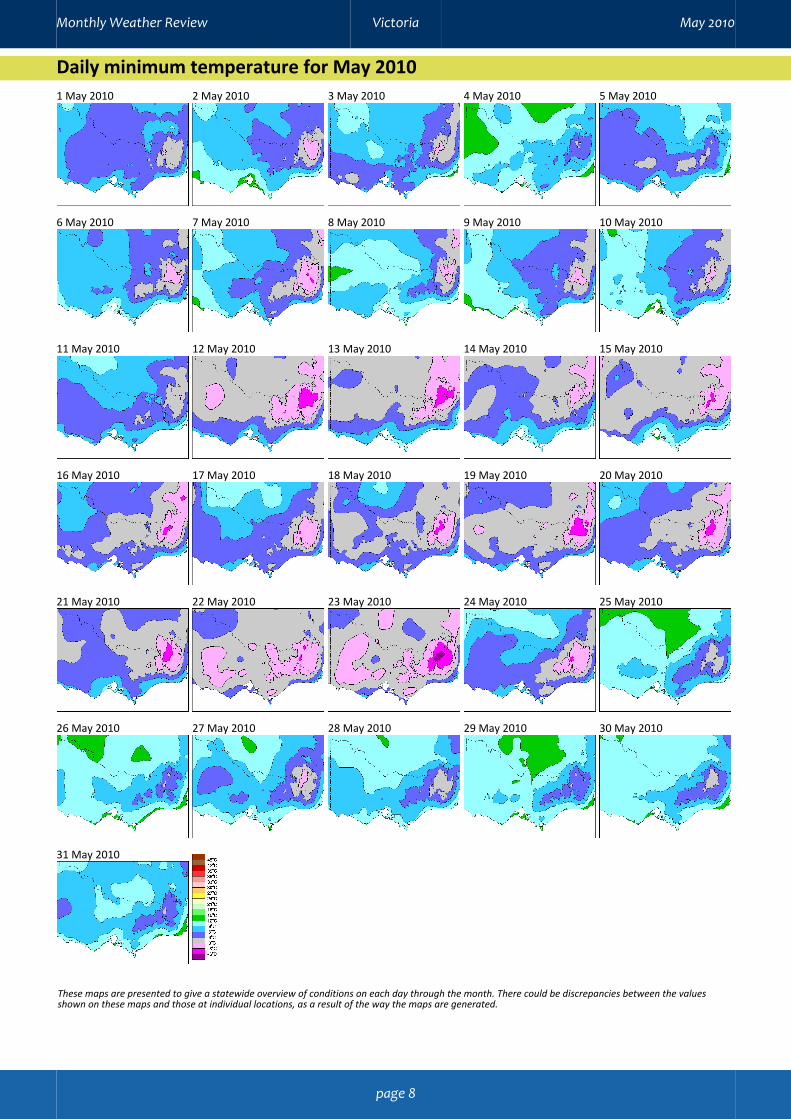
Daily minimum temperature for May 20101 May 2010 2 May 2010 3 May 2010 4 May 2010 5 May 2010
6 May 2010 7 May 2010 8 May 2010 9 May 2010 10 May 2010
11 May 2010 12 May 2010 13 May 2010 14 May 2010 15 May 2010
16 May 2010 17 May 2010 18 May 2010 19 May 2010 20 May 2010
21 May 2010 22 May 2010 23 May 2010 24 May 2010 25 May 2010
26 May 2010 27 May 2010 28 May 2010 29 May 2010 30 May 2010
31 May 2010
These maps are presented to give a statewide overview of conditions on each day through the month. There could be discrepancies between the valuesshown on these maps and those at individual locations, as a result of the way the maps are generated.
Monthly Weather Review Victoria May 2010
page 8

Daily rainfall for May 20101 May 2010 2 May 2010 3 May 2010 4 May 2010 5 May 2010
6 May 2010 7 May 2010 8 May 2010 9 May 2010 10 May 2010
11 May 2010 12 May 2010 13 May 2010 14 May 2010 15 May 2010
16 May 2010 17 May 2010 18 May 2010 19 May 2010 20 May 2010
21 May 2010 22 May 2010 23 May 2010 24 May 2010 25 May 2010
26 May 2010 27 May 2010 28 May 2010 29 May 2010 30 May 2010
31 May 2010
These maps are presented to give a statewide overview of conditions on each day through the month. There could be discrepancies between the valuesshown on these maps and those at individual locations, as a result of the way the maps are generated.
Monthly Weather Review Victoria May 2010
page 9

Summary of observations for Melbourne in May 2010Observations and climatology are from the city, except for evaporation, sunshine and wind which are fromMelbourne Airport.
Observed this month Climatological valueTemperatureMean daily maximum temperature 18.2 °C 16.7 °CMean daily minimum temperature 9.8 °C 8.6 °CMean temperature 14.0 °C 12.7 °CMean temperature at 9 am 12.2 °C 11.7 °CMean temperature at 3 pm 17.1 °C 16.3 °CHighest temperature 23.5 °C on the 4th 28.7 °C on the 7th in 1905Lowest temperature 4.0 °C on the 23rd −1.1 °C on the 29th in 1916Days 30 °C or warmer 0 0.0Days 35 °C or warmer 0 0.0Nights 5 °C or cooler 2 3.6Nights 2 °C or cooler 0 0.4HumidityMean relative humidity at 9 am 76 % 77 %Mean relative humidity at 3 pm 58 % 59 %PressureMean MSL pressure at 9 am 1019.1 hPa 1021.0 hPaMean MSL pressure at 3 pm 1016.9 hPa 1019.0 hPaWindStrongest wind gust N 80 km/h on the 4th N 107 km/h on the 21st in 1989Mean wind speed at 9 am 17 km/h 17 km/hMean wind speed at 3 pm 19 km/h 20 km/hDays with strong wind 2 5.9Days with gales 0 0.6Days with gale-force gusts 2 5.0RainfallTotal precipitation 25.0 mm 55.7 mmNumber of rain days 11 14.6Wettest day 4.8 mm on the 8th 51.2 mm on the 15th in 1974SunshineMean daily sunshine 4.9 hours 4.8 hoursEvaporationMean daily evaporation 2.1 mm 2.5 mmPhenomenaDays of thunder 0 0.8Days of hail 0 0.6Days of frost 0 1.6Days of fog 0 2.1Days with mist or haze 19 18.4
Monthly Weather Review Victoria May 2010
page 10
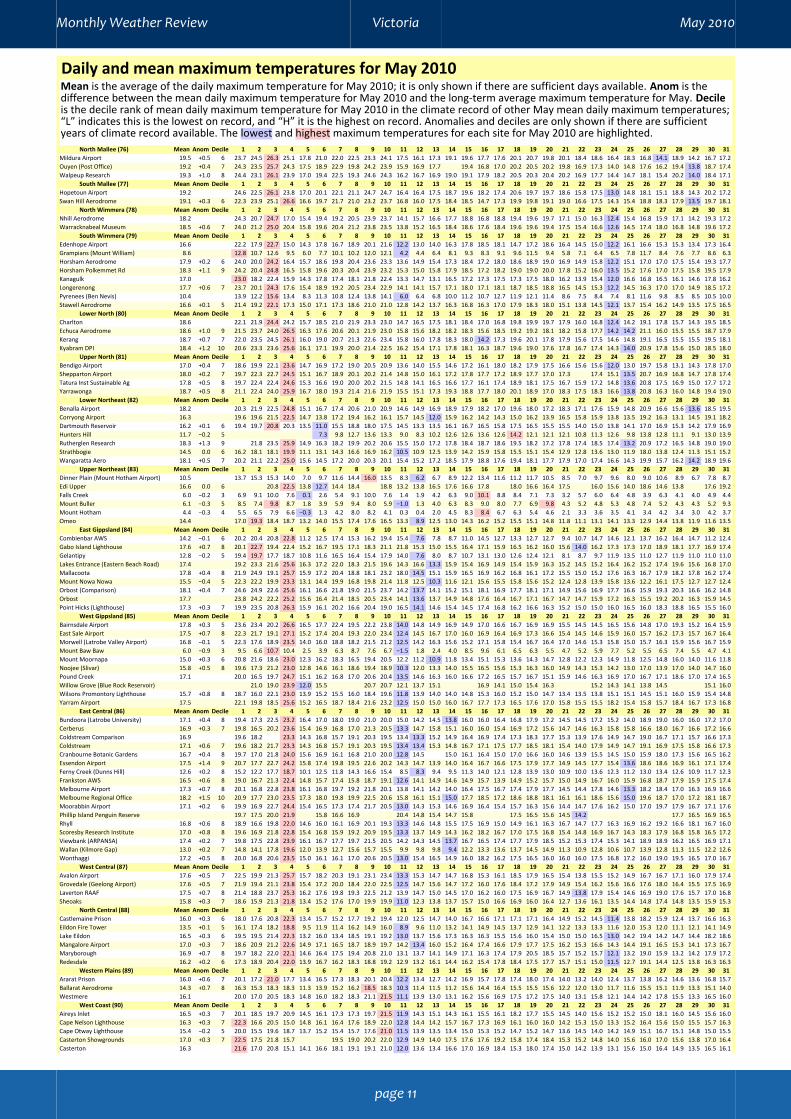
Daily and mean maximum temperatures for May 2010Mean is the average of the daily maximum temperature for May 2010; it is only shown if there are sufficient days available. Anom is thedifference between the mean daily maximum temperature for May 2010 and the long-term average maximum temperature for May. Decileis the decile rank of mean daily maximum temperature for May 2010 in the climate record of other May mean daily maximum temperatures;“L” indicates this is the lowest on record, and “H” it is the highest on record. Anomalies and deciles are only shown if there are sufficientyears of climate record available. The lowest and highest maximum temperatures for each site for May 2010 are highlighted.
North Mallee (76) Mean Anom Decile 1 2 3 4 5 6 7 8 9 10 11 12 13 14 15 16 17 18 19 20 21 22 23 24 25 26 27 28 29 30 31Mildura Airport 19.5 +0.5 6 23.7 24.5 26.3 25.1 17.8 21.0 22.0 22.5 23.3 24.1 17.5 16.1 17.3 19.1 19.6 17.7 17.6 20.1 20.7 19.8 20.1 18.4 18.6 16.4 18.3 16.8 14.1 18.9 14.2 16.7 17.2Ouyen (Post Office) 19.2 +0.4 7 24.3 23.5 25.7 24.3 17.5 18.9 22.9 19.8 24.2 23.9 15.9 16.9 17.7 19.4 16.8 17.0 20.2 20.5 20.2 19.8 16.9 17.3 14.0 14.8 17.6 16.2 19.4 13.8 18.7 17.4Walpeup Research 19.3 +1.0 8 24.4 23.1 26.1 23.9 17.0 19.4 22.5 19.3 24.6 24.3 16.2 16.7 16.9 19.0 19.1 17.9 18.2 20.5 20.3 20.4 20.2 16.9 17.7 14.4 14.7 18.1 15.4 20.2 14.0 18.4 17.1
South Mallee (77) Mean Anom Decile 1 2 3 4 5 6 7 8 9 10 11 12 13 14 15 16 17 18 19 20 21 22 23 24 25 26 27 28 29 30 31Hopetoun Airport 19.2 24.6 22.5 26.1 23.8 17.0 20.1 22.1 21.1 24.7 24.7 16.4 16.4 17.5 18.7 19.6 18.2 17.4 20.6 19.7 19.7 18.6 15.8 17.5 13.0 14.8 18.1 15.1 18.8 14.3 20.2 17.2Swan Hill Aerodrome 19.1 +0.3 6 22.3 23.9 25.1 26.6 16.6 19.7 21.7 21.0 23.2 23.7 16.8 16.0 17.5 18.4 18.5 14.7 17.3 19.9 19.8 19.1 19.0 16.6 17.5 14.3 15.4 18.8 18.3 17.9 13.5 19.7 18.1
North Wimmera (78) Mean Anom Decile 1 2 3 4 5 6 7 8 9 10 11 12 13 14 15 16 17 18 19 20 21 22 23 24 25 26 27 28 29 30 31Nhill Aerodrome 18.2 24.3 20.7 24.7 17.0 15.4 19.4 19.2 20.5 23.9 23.7 14.1 15.7 16.6 17.7 18.8 16.8 18.8 19.4 19.6 19.7 17.1 15.0 16.3 12.4 15.4 16.8 15.9 17.1 14.2 19.3 17.2Warracknabeal Museum 18.5 +0.6 7 24.0 21.2 25.0 20.4 15.8 19.6 20.4 21.2 23.8 23.5 13.8 15.2 16.5 18.4 18.6 17.6 18.4 19.6 19.6 19.4 17.5 15.4 16.6 12.6 14.5 17.4 18.0 16.8 14.8 19.6 17.2
South Wimmera (79) Mean Anom Decile 1 2 3 4 5 6 7 8 9 10 11 12 13 14 15 16 17 18 19 20 21 22 23 24 25 26 27 28 29 30 31Edenhope Airport 16.6 22.2 17.9 22.7 15.0 14.3 17.8 16.7 18.9 20.1 21.6 12.2 13.0 14.0 16.3 17.8 18.5 18.1 14.7 17.2 18.6 16.4 14.5 15.0 12.2 16.1 16.6 15.3 15.3 13.4 17.3 16.4Grampians (Mount William) 8.6 12.8 10.7 12.6 9.5 6.0 7.7 10.1 10.2 12.0 12.1 4.2 4.4 6.4 8.1 9.3 8.3 9.1 9.6 11.5 9.4 5.8 7.1 6.4 6.5 7.8 11.7 8.4 7.6 7.7 8.6 6.3Horsham Aerodrome 17.9 +0.2 6 24.0 20.0 24.2 16.4 15.7 18.6 19.8 20.4 23.6 23.3 13.6 14.9 15.4 17.3 18.4 17.2 18.0 18.6 18.9 19.0 16.9 14.9 15.8 12.2 15.1 17.0 17.0 17.5 15.4 19.3 17.7Horsham Polkemmet Rd 18.3 +1.1 9 24.2 20.4 24.8 16.5 15.8 19.6 20.3 20.4 23.9 23.2 15.3 15.0 15.8 17.9 18.5 17.2 18.2 19.0 19.0 20.0 17.8 15.2 16.0 13.5 15.2 17.6 17.0 17.5 15.8 19.5 17.9Kanagulk 17.0 23.0 18.2 22.4 15.9 14.3 17.8 17.4 18.1 21.8 22.4 13.3 14.7 13.1 16.5 17.2 17.3 17.5 17.3 17.5 18.0 16.2 13.9 15.4 12.0 16.6 16.8 16.5 16.1 14.6 17.8 16.2Longerenong 17.7 +0.6 7 23.7 20.1 24.3 17.6 15.4 18.9 19.2 20.5 23.4 22.9 14.1 14.1 15.7 17.1 18.0 17.1 18.1 18.7 18.5 18.8 16.5 14.5 15.3 12.2 14.5 16.3 17.0 17.0 14.9 18.5 17.2Pyrenees (Ben Nevis) 10.4 13.9 12.2 15.6 13.4 8.3 11.3 10.8 12.4 13.8 14.1 6.0 6.4 6.8 10.0 11.2 10.7 12.7 11.9 12.1 11.4 8.6 7.5 8.4 7.4 8.1 11.6 9.8 8.5 8.5 10.5 10.0Stawell Aerodrome 16.6 +0.1 5 21.4 19.2 22.1 17.3 15.0 17.1 17.3 18.6 21.0 21.0 12.8 14.2 13.7 16.3 16.8 16.3 17.0 17.9 18.3 18.0 15.1 13.8 14.5 12.1 13.7 15.4 16.2 14.9 13.5 17.5 16.5
Lower North (80) Mean Anom Decile 1 2 3 4 5 6 7 8 9 10 11 12 13 14 15 16 17 18 19 20 21 22 23 24 25 26 27 28 29 30 31Charlton 18.6 22.1 21.9 24.4 24.2 15.7 18.5 21.0 21.9 23.3 23.0 14.7 16.5 17.5 18.1 18.4 17.0 16.8 19.8 19.9 19.7 17.9 16.0 16.8 12.4 14.2 19.1 17.8 15.7 14.3 19.5 18.5Echuca Aerodrome 18.6 +1.0 9 21.5 23.7 24.0 26.5 16.3 17.6 20.6 20.1 21.9 23.0 15.8 15.6 18.2 18.2 18.3 15.6 18.5 19.2 19.2 18.1 18.2 15.8 17.7 14.2 14.2 21.1 16.0 15.5 15.5 18.7 17.9Kerang 18.7 +0.7 7 22.0 23.5 24.5 26.1 16.0 19.0 20.7 21.3 22.6 23.4 15.8 16.0 17.8 18.3 18.0 14.2 17.3 19.6 20.1 17.8 17.9 15.6 17.5 14.6 14.8 19.1 16.5 15.5 15.5 19.5 18.1Kyabram DPI 18.4 +1.2 10 20.6 23.3 23.6 25.6 16.1 17.1 19.9 20.0 21.4 22.5 16.2 15.4 17.1 17.8 18.1 16.3 18.7 19.6 19.0 17.6 17.8 16.7 17.4 14.3 14.0 20.9 17.8 15.6 15.0 18.5 18.0
Upper North (81) Mean Anom Decile 1 2 3 4 5 6 7 8 9 10 11 12 13 14 15 16 17 18 19 20 21 22 23 24 25 26 27 28 29 30 31Bendigo Airport 17.0 +0.4 7 18.6 19.9 22.1 23.6 14.7 16.9 17.2 19.0 20.5 20.9 13.6 14.0 15.5 14.6 17.2 16.1 18.0 18.2 17.9 17.5 16.6 15.6 15.6 12.0 13.0 19.7 15.8 13.1 14.3 17.8 17.0Shepparton Airport 18.0 +0.2 7 19.7 22.3 22.7 24.5 15.1 16.7 18.9 20.1 20.2 21.4 14.8 15.0 16.1 17.2 17.8 17.7 17.2 18.9 17.7 17.0 17.3 17.4 15.1 13.5 20.7 16.9 16.8 14.7 17.8 17.4Tatura Inst Sustainable Ag 17.8 +0.5 8 19.7 22.4 22.4 24.6 15.3 16.6 19.0 20.0 20.2 21.5 14.8 14.1 16.5 16.6 17.7 16.1 17.4 18.9 18.1 17.5 16.7 15.9 17.2 14.8 13.6 20.8 17.5 16.9 15.0 17.7 17.2Yarrawonga 18.7 +0.5 8 21.1 22.4 24.0 25.9 16.7 18.0 19.3 21.4 21.6 21.9 15.5 15.1 17.3 19.3 18.8 17.7 18.0 20.1 18.9 17.0 18.3 17.5 18.3 16.6 13.8 20.8 16.3 16.0 14.8 19.4 19.0
Lower Northeast (82) Mean Anom Decile 1 2 3 4 5 6 7 8 9 10 11 12 13 14 15 16 17 18 19 20 21 22 23 24 25 26 27 28 29 30 31Benalla Airport 18.2 20.3 21.9 22.5 24.8 15.1 16.7 17.4 20.6 21.0 20.9 14.6 14.9 16.9 18.9 17.9 18.2 17.0 19.6 18.0 17.2 18.3 17.1 17.6 15.9 14.8 20.9 16.6 15.6 13.6 18.5 19.5Corryong Airport 16.3 19.6 19.6 21.5 22.5 14.7 13.8 17.2 19.4 16.2 16.1 15.7 14.5 12.0 15.9 16.2 14.2 14.3 15.0 16.2 13.9 16.5 15.8 15.9 13.8 13.5 19.2 16.3 13.1 14.5 19.1 18.2Dartmouth Reservoir 16.2 +0.1 6 19.4 19.7 20.8 20.3 13.5 11.0 15.5 18.8 18.0 17.5 14.5 13.3 13.5 16.1 16.7 16.5 15.8 17.5 16.5 15.5 15.5 14.0 15.0 13.8 14.1 17.0 16.9 15.3 14.2 17.9 16.9Hunters Hill 11.7 −0.2 5 7.3 9.8 12.7 13.6 13.3 9.0 8.3 10.2 12.6 12.6 13.6 12.6 14.2 12.1 12.1 12.1 10.8 11.3 12.6 9.8 13.8 12.8 11.1 9.1 13.0 13.9Rutherglen Research 18.3 +1.3 9 21.8 23.5 25.9 14.9 16.3 18.2 19.9 20.2 20.6 15.5 15.0 17.2 17.8 18.4 18.7 18.6 19.5 18.2 17.2 17.8 17.4 18.5 17.4 13.2 20.9 17.2 16.5 14.8 19.0 19.0Strathbogie 14.5 0.0 6 16.2 18.1 18.1 19.9 11.1 13.1 14.3 16.6 16.9 16.2 10.5 10.9 12.5 13.9 14.2 15.9 15.8 15.5 15.1 15.4 12.9 12.8 13.6 13.0 11.9 18.0 13.8 12.4 11.3 15.1 15.2Wangaratta Aero 18.1 +0.5 7 20.2 21.1 22.2 25.0 15.6 14.5 17.2 20.0 20.3 20.1 15.4 15.2 17.2 18.5 17.9 18.8 17.6 19.4 18.1 17.7 17.9 17.0 17.4 16.6 14.3 19.9 15.7 16.2 14.2 18.9 19.6
Upper Northeast (83) Mean Anom Decile 1 2 3 4 5 6 7 8 9 10 11 12 13 14 15 16 17 18 19 20 21 22 23 24 25 26 27 28 29 30 31Dinner Plain (Mount Hotham Airport) 10.5 13.7 15.3 15.3 14.0 7.0 9.7 11.6 14.4 16.0 13.5 8.3 6.2 6.7 8.9 12.2 13.4 11.6 11.2 11.7 10.5 8.5 7.0 9.7 9.6 8.0 9.0 10.6 8.9 6.7 7.8 8.7Edi Upper 16.6 0.0 6 20.8 22.5 13.8 12.7 14.4 18.4 18.8 13.2 13.8 16.5 17.6 16.6 17.8 18.0 16.6 16.4 17.5 16.0 15.6 14.0 18.6 14.6 13.8 17.6 19.2Falls Creek 6.0 −0.2 3 6.9 9.1 10.0 7.6 0.1 2.6 5.4 9.1 10.0 7.6 1.4 1.9 4.2 6.3 9.0 10.1 8.8 8.4 7.1 7.3 3.2 5.7 6.0 6.4 4.8 3.9 6.3 4.1 4.0 4.9 4.4Mount Buller 6.1 −0.3 5 8.5 7.4 9.8 8.7 1.8 3.9 5.9 9.4 8.0 5.9 −1.0 1.3 4.0 6.3 8.3 9.0 8.0 7.7 6.9 9.8 4.3 5.2 4.8 5.3 4.8 7.4 5.2 4.3 4.3 5.2 9.3Mount Hotham 4.4 −0.3 4 5.5 6.5 7.9 6.6 −0.3 1.3 4.2 8.0 8.2 4.1 0.3 0.4 2.0 4.5 8.3 8.4 6.7 6.3 5.4 4.6 2.1 3.3 3.6 3.5 4.1 3.4 4.2 3.4 3.0 4.2 3.7Omeo 14.4 17.0 19.3 18.4 18.7 13.2 14.0 15.5 17.4 17.6 16.5 13.3 8.9 12.5 13.0 14.3 16.2 15.2 15.5 15.1 14.8 11.8 11.1 13.1 14.1 13.3 12.9 14.4 13.8 11.9 11.6 13.5
East Gippsland (84) Mean Anom Decile 1 2 3 4 5 6 7 8 9 10 11 12 13 14 15 16 17 18 19 20 21 22 23 24 25 26 27 28 29 30 31Combienbar AWS 14.2 −0.1 6 20.2 20.4 20.8 22.8 11.2 12.5 17.4 15.3 16.2 19.4 15.4 7.6 7.8 8.7 11.0 14.5 12.7 13.3 12.7 12.7 9.4 10.7 14.7 14.6 12.1 13.7 16.2 16.4 14.7 11.2 12.4Gabo Island Lighthouse 17.6 +0.7 8 20.1 22.7 19.4 22.4 15.2 16.7 19.5 17.1 18.3 21.1 21.8 15.3 15.0 15.5 16.4 17.1 15.9 16.5 16.2 16.0 15.6 14.0 16.2 17.3 17.3 17.0 18.9 18.1 17.7 16.9 17.4Gelantipy 12.8 −0.2 5 19.4 19.7 17.7 18.7 10.8 11.6 16.5 16.4 15.4 17.9 14.0 7.6 8.0 8.7 10.7 13.1 13.0 12.6 12.4 12.1 8.1 8.7 9.7 11.9 13.5 11.0 12.7 11.9 11.0 11.0 11.0Lakes Entrance (Eastern Beach Road) 17.4 19.2 23.3 21.6 25.6 16.3 17.2 22.0 18.3 21.5 19.6 14.3 16.6 13.3 15.9 15.4 16.9 14.9 15.4 15.9 16.3 15.2 14.5 15.2 16.4 16.2 15.2 17.4 19.6 15.6 16.8 17.0Mallacoota 17.8 +0.4 8 21.9 24.9 19.1 25.7 15.9 17.2 20.4 18.8 18.1 23.2 18.0 14.5 15.1 15.9 16.5 16.9 16.2 16.8 16.1 17.2 15.5 15.0 15.2 17.6 16.3 16.7 17.9 18.2 17.8 16.2 17.4Mount Nowa Nowa 15.5 −0.4 5 22.3 22.2 19.9 23.3 13.1 14.4 19.9 16.8 19.8 21.4 11.8 12.5 10.3 11.6 12.1 15.6 15.5 15.8 15.6 15.2 12.4 12.8 13.9 15.8 13.6 12.2 16.1 17.5 12.7 12.7 12.4Orbost (Comparison) 18.1 +0.4 7 24.6 24.9 22.6 25.6 16.1 16.6 21.8 19.0 21.5 23.7 14.2 13.7 14.1 15.2 15.1 18.1 16.9 17.7 18.1 17.1 14.9 15.6 16.9 17.7 16.6 15.9 19.3 20.3 16.6 16.2 14.8Orbost 17.7 23.8 24.2 22.2 25.2 15.6 16.4 21.4 18.5 20.5 23.4 14.1 13.6 13.7 14.9 14.8 17.6 16.4 16.7 17.1 16.7 14.7 14.7 15.9 17.2 16.3 15.5 19.2 20.2 16.3 15.9 14.5Point Hicks (Lighthouse) 17.3 +0.3 7 19.9 23.5 20.8 26.3 15.9 16.1 20.2 16.6 20.4 19.0 16.5 14.1 14.6 15.4 14.5 17.4 16.8 16.2 16.6 16.3 15.2 15.0 15.0 16.0 16.5 16.0 18.3 18.8 16.5 15.5 16.0
West Gippsland (85) Mean Anom Decile 1 2 3 4 5 6 7 8 9 10 11 12 13 14 15 16 17 18 19 20 21 22 23 24 25 26 27 28 29 30 31Bairnsdale Airport 17.8 +0.3 5 23.6 23.4 20.2 26.6 16.5 17.7 22.4 19.5 22.2 23.8 14.0 14.8 14.9 16.9 14.9 17.0 16.6 16.7 16.9 16.9 15.5 14.5 14.5 16.5 15.6 14.8 17.0 19.3 15.2 16.4 15.9East Sale Airport 17.5 +0.7 8 22.3 21.7 19.1 27.1 15.2 17.4 20.4 19.3 22.0 23.4 12.4 14.5 16.7 17.0 16.0 16.9 16.4 16.9 17.3 16.6 15.4 14.5 14.6 15.9 16.0 15.7 16.2 17.3 15.7 16.7 16.4Morwell (Latrobe Valley Airport) 16.8 −0.1 5 22.3 17.6 18.9 23.5 14.0 16.0 18.8 18.2 21.5 21.2 12.5 14.2 16.3 15.6 15.2 17.1 15.8 15.4 16.7 16.4 17.0 14.6 15.3 15.8 15.0 15.7 16.3 15.9 15.6 16.7 15.9Mount Baw Baw 6.0 −0.9 3 9.5 6.6 10.7 10.4 2.5 3.9 6.3 8.7 7.6 6.7 −1.5 1.8 2.4 4.0 8.5 9.6 6.1 6.5 6.3 5.5 4.7 5.2 5.9 7.7 5.2 5.5 6.5 7.4 5.5 4.7 4.1Mount Moornapa 15.0 +0.3 6 20.8 21.6 18.6 23.0 12.3 16.2 18.3 16.5 19.4 20.5 12.2 11.2 10.9 11.8 13.4 15.1 15.3 13.6 14.3 14.7 12.8 12.2 12.3 14.9 11.8 12.5 14.8 16.0 14.0 11.6 11.8Noojee (Slivar) 15.8 +0.5 8 19.6 17.3 21.2 23.0 12.8 14.6 16.1 18.6 19.4 18.9 10.3 12.0 13.3 14.0 15.5 16.5 15.6 15.3 16.3 16.0 14.9 14.3 15.3 14.2 13.0 17.0 13.9 17.0 14.0 14.7 16.0Pound Creek 17.1 20.0 16.5 19.7 24.7 15.1 16.2 16.8 17.0 20.6 20.4 13.5 14.6 16.3 16.0 16.6 17.2 16.5 15.7 16.7 15.1 15.9 14.6 16.3 16.9 17.0 16.7 17.1 18.6 17.0 17.4 16.5Willow Grove (Blue Rock Reservoir) 21.0 19.0 23.9 12.0 15.5 20.7 20.7 12.1 13.7 15.1 16.9 14.1 15.0 15.4 16.3 15.2 14.3 14.1 13.8 14.5 15.1 16.0Wilsons Promontory Lighthouse 15.7 +0.8 8 18.7 16.0 22.1 23.0 13.9 15.2 15.5 16.0 18.4 19.6 11.8 13.9 14.0 14.0 14.8 15.3 16.0 15.2 15.0 14.7 13.4 13.5 13.8 15.1 15.1 14.5 15.1 16.0 15.9 15.4 14.8Yarram Airport 17.5 22.1 19.8 18.5 25.6 15.2 16.5 18.7 18.4 21.6 23.2 12.5 15.0 15.0 16.0 16.7 17.7 17.3 16.5 17.6 17.0 15.8 15.5 15.5 18.2 15.4 15.8 15.7 18.4 16.7 17.3 16.8
East Central (86) Mean Anom Decile 1 2 3 4 5 6 7 8 9 10 11 12 13 14 15 16 17 18 19 20 21 22 23 24 25 26 27 28 29 30 31Bundoora (Latrobe University) 17.1 +0.4 8 19.4 17.3 22.5 23.2 16.4 17.0 18.0 19.0 21.0 20.0 15.0 14.2 14.5 13.8 16.0 16.0 16.4 16.8 17.9 17.2 14.5 14.5 17.2 15.2 14.0 18.9 19.0 16.0 16.0 17.2 17.0Cerberus 16.9 +0.3 7 19.8 16.5 20.2 23.6 15.4 16.9 16.8 17.0 21.3 20.5 13.3 14.7 15.8 15.1 16.0 16.0 15.4 16.9 17.2 15.6 14.7 14.6 16.3 15.8 15.8 16.6 18.0 16.7 16.6 17.2 16.6Coldstream Comparison 16.9 19.6 18.2 23.3 14.3 16.8 15.7 19.1 20.3 19.5 13.4 13.3 15.2 14.9 16.4 16.9 17.4 17.3 18.3 17.7 15.3 13.9 17.6 14.9 14.7 19.0 16.7 17.1 15.7 16.6 17.3Coldstream 17.1 +0.6 7 19.6 18.2 21.7 23.3 14.3 16.8 15.7 19.1 20.3 19.5 13.4 13.4 15.3 14.8 16.7 17.1 17.5 17.7 18.5 18.1 15.4 14.0 17.9 14.9 14.7 19.1 16.9 17.5 15.8 16.6 17.3Cranbourne Botanic Gardens 16.7 +0.4 8 19.7 17.0 21.8 24.0 15.6 16.9 16.1 16.8 21.0 20.0 12.8 14.5 15.0 16.1 16.4 15.0 17.0 16.6 16.0 14.6 13.9 15.5 14.5 15.0 15.9 18.0 17.3 15.6 16.5 16.2Essendon Airport 17.5 +1.4 9 20.7 17.7 22.7 24.2 15.8 17.4 19.8 19.5 22.6 20.2 14.3 14.7 13.9 14.0 16.4 16.7 16.6 17.5 17.9 17.7 14.9 14.5 17.7 15.4 13.6 18.6 18.6 16.9 16.1 17.1 17.4Ferny Creek (Dunns Hill) 12.6 +0.2 8 15.2 12.2 17.7 18.7 10.1 12.5 11.8 14.3 16.6 15.4 8.5 8.3 9.4 9.5 11.3 14.0 12.1 12.8 13.9 13.0 10.9 10.0 13.6 12.3 11.2 13.0 13.4 12.6 10.9 11.7 12.3Frankston AWS 16.5 +0.6 8 19.0 16.7 21.3 22.4 14.8 15.7 17.4 15.8 18.7 19.1 12.6 14.1 14.9 14.6 14.9 15.7 13.9 14.9 15.2 15.7 15.0 14.9 16.7 16.0 15.9 16.8 18.7 17.9 15.9 17.5 17.4Melbourne Airport 17.3 +0.7 8 20.1 16.8 22.8 23.8 16.1 16.8 19.7 19.2 21.8 20.1 13.8 14.1 14.2 14.0 16.4 17.5 16.7 17.4 17.9 17.7 14.5 14.4 17.8 14.6 13.3 18.2 18.4 17.0 16.3 16.9 16.6Melbourne Regional Office 18.2 +1.5 10 20.9 17.7 23.0 23.5 17.3 18.0 19.8 19.9 22.5 20.6 15.8 16.1 15.1 15.0 17.7 18.5 17.2 18.6 18.8 18.1 16.1 16.1 18.6 15.6 15.0 19.6 18.7 17.0 17.2 18.1 18.7Moorabbin Airport 17.1 +0.2 6 19.9 16.9 22.7 24.4 15.4 16.5 17.3 17.4 21.7 20.5 13.0 14.3 15.3 14.6 16.9 16.4 15.4 15.7 16.3 15.6 14.4 14.7 17.6 16.2 15.0 17.0 19.7 17.9 16.7 17.1 17.6Phillip Island Penguin Reserve 19.7 17.5 20.0 21.9 15.8 16.6 16.9 20.4 14.8 15.4 14.7 15.8 17.5 16.5 15.6 14.5 14.2 17.7 16.5 16.9 16.5Rhyll 16.8 +0.6 8 18.9 16.6 19.8 22.0 14.6 16.0 16.1 16.9 20.1 19.3 13.3 14.6 14.8 15.5 17.5 16.9 15.0 14.9 16.1 16.3 16.7 14.7 17.7 16.3 16.9 16.2 19.2 16.6 18.1 16.7 16.0Scoresby Research Institute 17.0 +0.8 8 19.6 16.9 21.8 22.8 15.4 16.8 15.9 19.2 20.9 19.5 13.3 13.7 14.9 14.3 16.2 18.2 16.7 17.0 17.5 16.8 15.4 14.8 16.9 16.7 14.3 18.3 17.9 16.8 15.8 16.5 17.2Viewbank (ARPANSA) 17.4 +0.2 7 19.8 17.5 22.8 23.9 16.1 16.7 17.7 19.7 21.5 20.5 14.2 14.3 14.5 13.7 16.7 16.5 17.4 17.7 17.9 18.5 15.2 15.3 17.4 15.3 14.1 18.9 18.9 16.2 16.5 16.9 17.1Wallan (Kilmore Gap) 13.0 +0.2 7 14.8 14.1 17.8 19.6 12.0 13.9 12.7 15.6 15.7 15.5 9.9 9.8 9.8 9.4 12.2 13.3 13.6 13.7 14.5 14.9 11.3 10.9 12.8 10.6 10.7 13.9 12.8 11.3 11.5 12.2 12.6Wonthaggi 17.2 +0.5 8 20.0 16.8 20.6 23.5 15.0 16.1 16.1 17.0 20.6 20.5 13.0 15.4 16.5 14.9 16.0 18.2 16.2 17.5 16.5 16.0 16.0 16.0 17.5 16.8 17.2 16.0 19.0 19.5 16.5 17.0 16.7
West Central (87) Mean Anom Decile 1 2 3 4 5 6 7 8 9 10 11 12 13 14 15 16 17 18 19 20 21 22 23 24 25 26 27 28 29 30 31Avalon Airport 17.6 +0.5 7 22.5 19.9 21.3 25.7 15.7 18.2 20.3 19.1 23.1 23.4 13.3 15.3 14.7 14.7 16.8 15.3 16.1 18.5 17.9 16.5 15.4 13.8 15.5 15.2 14.9 16.7 16.7 17.1 16.0 17.9 17.4Grovedale (Geelong Airport) 17.6 +0.5 7 21.9 19.4 21.1 23.8 15.4 17.2 20.0 18.4 22.0 22.5 12.5 14.7 15.6 14.7 17.2 16.0 17.6 18.4 17.2 17.9 14.9 15.4 16.2 15.6 16.6 17.6 18.0 16.4 15.5 17.5 16.9Laverton RAAF 17.5 +0.7 8 21.4 18.8 23.7 25.3 16.2 17.6 19.8 19.3 22.5 21.2 13.9 14.7 15.0 14.5 17.0 16.2 16.0 17.5 16.9 16.7 14.9 13.8 17.9 15.4 14.6 16.9 19.0 17.6 15.7 17.0 16.8Sheoaks 15.8 +0.3 7 18.6 15.9 21.3 21.8 13.4 15.2 17.6 17.0 19.9 19.9 11.0 12.3 13.8 13.7 15.7 15.0 16.6 16.9 16.0 16.4 12.7 13.6 16.1 13.5 14.4 14.8 17.4 14.8 13.5 15.9 15.3
North Central (88) Mean Anom Decile 1 2 3 4 5 6 7 8 9 10 11 12 13 14 15 16 17 18 19 20 21 22 23 24 25 26 27 28 29 30 31Castlemaine Prison 16.0 +0.3 6 18.0 17.6 20.8 22.3 13.4 15.7 15.2 17.7 19.2 19.4 12.0 12.5 14.7 14.0 16.7 16.6 17.1 17.1 17.1 16.4 14.9 15.2 14.5 11.4 13.8 18.2 15.9 12.4 13.7 16.6 16.3Eildon Fire Tower 13.5 +0.1 5 16.1 17.4 18.2 18.8 9.5 11.9 11.4 16.2 14.9 16.0 8.9 9.6 11.0 13.2 14.1 14.9 14.5 13.7 12.9 14.1 12.2 13.3 13.3 11.6 12.0 15.3 12.0 11.1 12.1 14.1 14.9Lake Eildon 16.5 +0.3 6 19.5 19.5 21.4 22.3 13.2 16.0 13.4 18.5 19.1 19.2 13.0 13.7 15.6 17.3 16.3 16.3 15.5 15.6 16.0 15.4 15.0 15.0 16.5 13.0 14.2 19.4 14.2 14.7 14.4 18.2 18.6Mangalore Airport 17.0 +0.3 7 18.6 20.9 21.2 22.6 14.9 17.1 16.5 18.7 18.9 19.7 14.2 13.4 16.0 15.2 16.4 17.4 16.6 17.9 17.7 17.5 16.2 15.3 16.6 14.3 14.4 19.1 16.5 15.3 14.1 17.3 16.7Maryborough 16.9 +0.7 8 19.7 18.2 22.0 22.1 14.6 16.4 17.5 19.4 20.8 21.0 13.1 13.7 14.1 14.9 17.1 16.3 17.4 17.9 20.5 18.5 15.7 15.2 15.7 12.1 13.2 19.0 15.9 13.2 14.2 17.9 17.2Redesdale 16.2 +0.2 6 17.3 18.9 20.4 22.0 13.9 16.7 16.2 18.3 18.8 19.2 12.9 13.2 16.1 14.4 16.2 15.4 17.8 18.4 17.5 17.7 15.7 15.1 15.0 11.5 12.7 19.1 14.4 12.5 13.8 16.3 16.3
Western Plains (89) Mean Anom Decile 1 2 3 4 5 6 7 8 9 10 11 12 13 14 15 16 17 18 19 20 21 22 23 24 25 26 27 28 29 30 31Ararat Prison 16.0 +0.6 7 20.1 17.2 21.0 17.7 13.4 16.5 17.3 18.3 20.1 20.4 12.2 13.4 12.7 14.2 16.9 15.7 17.8 17.4 18.0 17.4 14.0 13.2 14.0 12.4 13.7 13.8 16.2 14.6 13.6 16.8 15.7Ballarat Aerodrome 14.3 +0.7 8 16.3 15.3 18.3 18.3 11.3 13.9 15.2 16.2 18.5 18.3 10.3 11.4 11.5 11.2 15.6 14.4 16.4 15.5 15.5 15.6 12.2 12.0 13.0 11.7 11.6 15.5 15.1 11.9 13.3 15.1 14.0Westmere 16.1 20.0 17.0 20.5 18.3 14.8 16.0 18.2 18.3 21.1 21.5 11.1 13.9 13.0 13.1 16.2 15.6 16.9 17.5 17.2 17.5 14.0 13.1 15.8 12.1 14.4 14.2 17.8 15.5 13.3 16.5 16.0
West Coast (90) Mean Anom Decile 1 2 3 4 5 6 7 8 9 10 11 12 13 14 15 16 17 18 19 20 21 22 23 24 25 26 27 28 29 30 31Aireys Inlet 16.5 +0.3 7 20.1 18.5 19.7 20.9 14.5 16.1 17.3 17.3 19.7 21.5 11.9 14.3 15.1 14.3 16.1 15.5 16.1 18.2 17.7 15.5 14.5 14.0 15.6 15.2 15.2 15.0 18.1 16.0 14.5 15.6 16.0Cape Nelson Lighthouse 16.3 +0.3 7 22.3 16.6 20.5 15.0 14.8 16.1 16.4 17.6 18.9 22.0 12.8 14.4 14.2 15.7 16.7 17.3 16.9 16.1 16.0 16.0 14.2 15.3 15.0 13.3 15.2 16.4 15.6 15.0 15.5 15.7 16.3Cape Otway Lighthouse 15.4 −0.2 5 20.0 15.5 19.6 18.7 13.7 15.2 15.4 15.7 17.6 21.0 11.5 13.9 13.5 13.4 15.0 15.3 15.2 14.7 15.2 14.7 13.6 14.5 14.0 14.2 14.9 15.1 16.7 15.1 14.8 15.0 15.5Casterton Showgrounds 17.0 +0.3 7 22.5 17.5 21.8 15.7 19.5 19.0 20.2 22.0 12.9 14.9 14.0 17.5 17.6 17.6 19.2 15.8 17.4 18.4 15.3 15.2 14.8 14.0 15.6 16.0 17.0 15.6 13.8 17.0 16.4Casterton 16.3 21.6 17.0 20.8 15.1 14.1 16.6 18.1 19.1 19.1 21.0 12.0 13.6 13.4 16.6 17.0 16.9 18.4 15.3 18.0 17.4 15.0 14.2 13.9 13.1 15.6 15.0 16.4 14.9 13.5 16.5 16.1
Monthly Weather Review Victoria May 2010
page 11

Daily and mean maximum temperatures for May 2010Mean is the average of the daily maximum temperature for May 2010; it is only shown if there are sufficient days available. Anom is thedifference between the mean daily maximum temperature for May 2010 and the long-term average maximum temperature for May. Decileis the decile rank of mean daily maximum temperature for May 2010 in the climate record of other May mean daily maximum temperatures;“L” indicates this is the lowest on record, and “H” it is the highest on record. Anomalies and deciles are only shown if there are sufficientyears of climate record available. The lowest and highest maximum temperatures for each site for May 2010 are highlighted.Colac (Mount Gellibrand) 14.7 17.8 15.5 18.6 19.2 12.7 13.6 15.7 15.6 18.1 19.1 9.6 12.1 13.5 11.9 14.1 14.3 14.7 14.1 15.0 15.8 13.2 12.7 13.6 12.0 14.6 15.0 16.2 13.0 13.3 15.2 14.8Dartmoor 16.7 21.9 17.0 21.0 14.0 14.7 17.2 17.7 18.1 19.6 21.1 12.8 14.9 13.8 16.7 17.5 17.9 18.1 15.6 17.4 16.9 15.3 15.3 14.6 14.3 16.9 16.5 16.3 15.0 15.6 16.3 16.4Hamilton Airport 15.6 −0.1 5 20.6 16.5 20.5 13.4 13.0 16.0 17.3 17.1 19.3 20.2 11.5 13.3 12.2 15.4 16.3 16.6 17.2 15.8 16.9 16.3 13.9 13.3 14.1 12.9 15.1 13.9 15.0 14.7 13.6 16.9 15.5Mortlake Racecourse 16.4 +0.2 7 21.7 16.6 20.8 18.4 14.9 16.0 18.0 17.3 20.0 21.5 11.8 13.7 14.1 14.1 16.3 16.5 17.0 17.4 17.3 16.3 14.3 13.9 15.9 12.9 15.1 15.1 17.8 14.6 14.1 17.7 16.5Port Fairy AWS 16.8 0.0 5 22.3 18.3 21.0 14.6 15.8 16.8 17.5 17.8 20.3 22.2 13.1 15.1 15.2 15.7 18.0 17.2 16.6 16.0 17.0 16.1 14.8 15.8 15.6 13.3 16.3 16.5 16.8 16.2 15.4 16.7 16.7Portland (Cashmore Airport) 16.0 +0.1 7 21.4 16.9 19.9 14.7 14.2 15.9 16.4 17.2 18.4 20.7 13.4 14.4 13.2 15.7 16.5 17.0 18.2 15.8 16.4 16.3 13.9 14.9 14.1 12.5 14.8 16.3 15.2 14.5 14.7 15.6 15.6Warrnambool Airport NDB 16.5 −0.2 5 20.6 17.3 19.7 15.2 14.7 16.9 18.3 17.6 19.6 21.0 12.6 14.4 14.3 14.8 16.5 17.2 18.3 16.6 18.0 16.4 14.8 14.8 15.7 13.7 16.5 15.5 16.3 15.5 14.9 16.7 16.6Weeaproinah 12.4 +0.3 7 16.0 13.6 15.3 14.5 10.2 11.5 13.5 12.6 14.3 17.0 7.5 10.0 11.0 10.5 13.0 13.3 13.5 13.4 13.9 12.1 10.1 9.5 12.3 12.0 12.5 10.8 12.6 11.2 12.1 12.6 12.5
Monthly Weather Review Victoria May 2010
page 12

Daily and mean minimum temperatures for May 2010Mean is the average of the daily minimum temperature for May 2010; it is only shown if there are sufficient days available. Anom is thedifference between the mean daily minimum temperature for May 2010 and the long-term average minimum temperature for May. Decile isthe decile rank of mean daily minimum temperature for May 2010 in the climate record of other May mean daily minimum temperatures;“L” indicates this is the lowest on record, and “H” it is the highest on record. Anomalies and deciles are only shown if there are sufficientyears of climate record available. The lowest and highest minimum temperatures for each site for May 2010 are highlighted.
North Mallee (76) Mean Anom Decile 1 2 3 4 5 6 7 8 9 10 11 12 13 14 15 16 17 18 19 20 21 22 23 24 25 26 27 28 29 30 31Mildura Airport 7.5 +0.1 6 7.1 9.6 9.1 10.2 5.5 7.1 10.1 7.6 9.6 10.5 8.9 1.5 1.4 2.0 2.4 8.3 10.3 3.6 5.0 8.0 4.1 3.0 3.7 9.8 11.7 12.4 7.8 10.3 10.9 11.3 9.1Ouyen (Post Office) 7.7 +0.5 7 6.9 6.8 9.2 12.2 5.6 8.0 10.6 10.1 9.8 10.8 7.5 2.4 4.5 4.4 3.1 9.9 5.8 5.4 8.0 5.0 5.6 1.5 5.6 10.9 12.3 8.6 10.3 11.5 11.4 8.7Walpeup Research 8.4 +0.7 8 9.1 9.3 10.3 12.5 4.9 7.6 10.3 10.7 11.7 11.4 6.4 1.1 4.6 6.9 7.0 9.0 9.7 7.0 6.3 11.0 5.9 6.2 3.2 6.8 10.8 9.9 9.5 11.7 10.8 11.1 7.4
South Mallee (77) Mean Anom Decile 1 2 3 4 5 6 7 8 9 10 11 12 13 14 15 16 17 18 19 20 21 22 23 24 25 26 27 28 29 30 31Hopetoun Airport 5.3 4.0 6.7 8.6 12.4 2.7 6.8 5.3 10.0 5.2 8.9 4.8 −2.6 −1.0 0.7 1.7 7.0 4.9 0.1 1.1 5.7 1.4 0.4 −1.3 6.3 10.3 10.6 4.5 8.2 10.9 11.1 8.0Swan Hill Aerodrome 6.8 +0.7 8 4.4 9.0 8.5 9.9 6.1 8.3 9.1 11.0 7.0 9.2 7.9 2.6 2.3 3.4 2.9 5.9 8.7 4.9 2.6 5.4 2.6 1.8 −0.9 5.7 11.8 11.6 8.3 10.8 11.2 11.2 8.8
North Wimmera (78) Mean Anom Decile 1 2 3 4 5 6 7 8 9 10 11 12 13 14 15 16 17 18 19 20 21 22 23 24 25 26 27 28 29 30 31Nhill Aerodrome 6.3 6.5 9.8 8.6 12.5 4.2 8.1 9.1 12.3 10.3 11.2 5.0 2.1 0.5 4.3 4.2 7.5 4.2 1.5 0.3 4.6 3.2 0.4 1.1 4.1 10.0 8.8 5.9 8.7 10.4 10.9 5.2Warracknabeal Museum 6.1 −0.4 4 4.5 7.0 7.6 12.0 5.0 8.0 9.6 12.5 8.4 9.5 6.2 1.0 1.5 3.4 2.5 6.5 5.8 1.4 1.8 4.4 4.5 −0.4 −0.8 4.0 9.8 10.8 4.0 6.8 11.0 11.0 9.4
South Wimmera (79) Mean Anom Decile 1 2 3 4 5 6 7 8 9 10 11 12 13 14 15 16 17 18 19 20 21 22 23 24 25 26 27 28 29 30 31Edenhope Airport 6.4 6.6 11.8 5.9 11.4 4.3 8.2 10.5 11.3 11.4 10.9 4.9 3.0 1.0 3.2 3.2 5.9 4.1 2.7 1.9 4.8 3.8 3.1 1.6 5.2 9.8 9.7 3.1 7.0 10.3 10.8 6.8Grampians (Mount William) 3.9 4.9 6.6 3.1 7.4 1.1 2.0 4.8 4.1 6.6 8.2 −0.2 0.0 1.2 3.3 4.2 3.7 4.2 4.8 4.1 4.7 2.8 0.4 1.1 3.2 4.0 6.1 5.2 5.4 4.1 5.1 4.5Horsham Aerodrome 4.7 −0.3 5 3.2 6.9 11.9 4.1 6.8 7.9 10.9 9.0 8.3 −1.5 0.6 1.0 1.0 4.8 3.8 0.6 −0.9 2.6 0.6 −2.2 −1.8 4.5 9.3 11.4 2.4 6.1 10.3 10.5 3.9Horsham Polkemmet Rd 4.9 −1.3 2 3.4 8.9 4.2 12.2 5.0 7.9 8.0 11.4 10.7 7.1 5.1 −1.5 1.1 −0.3 1.0 6.2 3.4 0.0 −1.5 2.5 1.5 −2.5 −1.0 5.0 9.1 11.5 3.0 5.8 10.4 10.9 4.6Kanagulk 5.5 5.4 10.7 4.0 9.6 2.6 7.5 9.9 11.1 11.8 9.0 4.8 2.1 0.9 2.4 1.0 3.1 2.8 0.9 0.9 3.2 5.4 −1.2 −2.3 3.2 9.2 10.1 6.1 7.3 10.4 10.5 8.1Longerenong 5.1 −0.8 3 3.6 7.2 8.2 13.4 3.0 7.2 7.1 11.1 9.2 8.8 3.4 −2.2 0.1 1.2 2.2 6.4 3.7 −0.1 −1.9 4.1 2.0 −2.1 −0.7 3.4 9.2 10.0 2.9 5.8 10.3 10.5 10.1Pyrenees (Ben Nevis) 5.1 6.2 7.4 5.8 9.9 2.2 3.3 5.9 5.9 6.7 8.6 0.9 1.5 2.7 3.7 4.5 5.3 5.7 5.4 5.5 6.2 3.9 2.0 3.7 4.7 4.4 7.1 5.7 6.8 5.7 5.9 5.1Stawell Aerodrome 5.9 −0.1 6 4.2 7.3 5.1 9.2 4.5 8.6 9.1 7.0 9.8 9.9 5.6 1.2 2.3 2.6 2.2 3.3 6.1 2.2 1.4 3.2 4.6 −1.2 0.7 6.0 8.9 11.6 8.5 9.0 9.4 10.3 9.6
Lower North (80) Mean Anom Decile 1 2 3 4 5 6 7 8 9 10 11 12 13 14 15 16 17 18 19 20 21 22 23 24 25 26 27 28 29 30 31Charlton 5.9 3.2 6.9 8.9 12.4 4.3 8.2 6.9 11.7 7.0 9.2 5.6 0.5 0.5 3.7 1.5 4.0 7.8 2.8 0.9 2.9 4.5 0.0 −0.8 6.8 9.9 8.2 4.8 9.5 10.7 10.9 8.3Echuca Aerodrome 6.3 −0.3 5 4.4 6.4 7.9 9.5 5.2 7.8 8.4 11.4 5.1 7.3 8.7 2.4 3.9 4.9 2.4 1.4 7.2 2.5 1.5 2.3 2.9 0.2 0.9 9.3 11.0 9.8 8.8 10.8 11.7 9.8 9.9Kerang 7.0 +0.3 6 5.0 7.7 8.9 11.0 5.8 7.9 8.9 11.9 7.5 9.5 8.3 2.5 2.3 5.5 3.0 5.7 7.2 4.0 2.7 5.6 4.5 3.1 1.0 2.9 11.4 11.2 8.3 11.3 11.7 11.1 9.4Kyabram DPI 6.0 −0.1 6 4.9 7.7 7.9 9.9 4.7 7.6 6.5 10.8 6.3 7.8 7.9 1.1 1.7 3.1 1.8 1.3 6.2 1.9 1.1 2.0 3.0 0.4 1.3 7.4 11.6 9.9 9.6 10.5 11.6 9.6 8.8
Upper North (81) Mean Anom Decile 1 2 3 4 5 6 7 8 9 10 11 12 13 14 15 16 17 18 19 20 21 22 23 24 25 26 27 28 29 30 31Bendigo Airport 5.2 0.0 5 3.5 5.2 9.9 6.1 2.7 6.0 3.8 8.0 7.6 6.6 5.8 0.6 0.8 3.5 1.3 3.0 6.5 1.9 0.5 2.1 3.3 3.5 3.8 6.6 9.2 6.3 6.1 8.4 11.0 7.7 9.5Shepparton Airport 5.6 +0.2 7 4.3 5.3 6.3 7.7 5.2 7.0 5.8 10.8 4.4 5.8 6.3 1.1 2.8 3.7 1.7 1.0 5.4 1.4 0.6 2.0 3.4 0.2 6.8 11.5 8.8 9.3 10.2 11.5 10.3 8.7Tatura Inst Sustainable Ag 5.0 −0.8 4 2.8 4.8 7.1 9.4 4.7 5.5 4.8 8.2 4.4 6.2 5.8 3.1 1.1 2.1 0.1 1.4 4.8 2.0 −0.5 1.3 1.6 0.3 −1.3 6.5 11.4 10.0 7.6 10.5 11.6 10.5 8.6Yarrawonga 6.1 0.0 6 7.0 7.0 7.8 9.6 6.7 7.7 6.1 11.4 5.3 6.8 8.7 1.3 2.4 1.8 0.8 3.8 5.4 1.8 1.1 2.4 1.0 −1.0 2.1 8.7 11.7 10.1 9.5 9.3 11.8 10.4 9.1
Lower Northeast (82) Mean Anom Decile 1 2 3 4 5 6 7 8 9 10 11 12 13 14 15 16 17 18 19 20 21 22 23 24 25 26 27 28 29 30 31Benalla Airport 4.7 3.4 3.1 6.9 6.3 6.9 5.2 3.6 11.4 3.8 3.6 7.1 1.3 1.9 0.6 0.9 1.2 3.3 0.9 −0.4 1.3 2.8 1.5 −0.1 4.3 11.1 7.6 8.1 6.5 11.1 8.5 10.7Corryong Airport 2.4 3.1 3.0 2.9 5.5 6.4 6.2 5.0 8.4 3.6 4.9 3.5 −2.8 −1.0 0.0 −2.0 0.0 0.2 1.0 −1.6 −1.5 −1.9 −2.2 −3.6 1.0 2.8 4.4 1.0 4.1 7.9 8.0 9.5Dartmouth Reservoir 4.9 +0.2 6 6.0 5.1 7.1 6.7 9.2 7.9 9.0 9.4 6.1 5.0 6.4 −0.5 0.4 3.0 1.5 1.5 3.0 2.0 1.5 1.5 3.0 1.5 −0.3 0.3 5.8 9.1 4.7 6.3 8.8 7.5 12.6Hunters Hill 5.7 +0.1 4 8.0 4.2 6.7 7.6 6.6 8.1 −0.1 2.2 3.8 5.2 5.3 6.5 6.5 5.9 4.8 5.2 3.6 2.6 5.0 6.7 7.8 7.0 7.2 7.4 6.8 7.1Rutherglen Research 3.3 −1.1 4 3.0 4.4 7.5 7.7 3.0 3.1 10.3 1.8 1.9 7.6 −2.9 −1.3 −1.3 −1.1 −1.1 2.4 −1.6 −1.8 −0.7 −1.6 −2.7 −2.5 5.7 11.9 7.2 5.5 8.5 11.4 8.0 6.5Strathbogie 3.8 +0.2 7 2.6 3.3 3.1 11.2 4.4 6.0 3.8 9.3 2.0 3.5 5.5 1.2 3.8 1.4 −0.1 −1.2 1.2 0.4 −1.8 −0.9 2.4 0.9 −3.2 2.7 9.6 9.3 4.1 8.5 9.3 6.5 9.2Wangaratta Aero 3.6 −0.7 4 3.3 3.1 5.0 5.4 7.8 4.9 3.8 9.9 2.8 3.2 4.4 −1.3 1.0 −0.8 −0.2 −0.4 3.0 −0.7 −1.2 1.1 −1.0 −2.8 −1.5 4.3 10.3 7.4 8.6 5.7 9.2 9.5 8.3
Upper Northeast (83) Mean Anom Decile 1 2 3 4 5 6 7 8 9 10 11 12 13 14 15 16 17 18 19 20 21 22 23 24 25 26 27 28 29 30 31Dinner Plain (Mount Hotham Airport) 0.8 0.9 3.2 1.5 6.0 0.8 0.7 −1.8 5.9 1.7 0.9 3.0 −1.5 −2.7 0.7 −2.5 −3.4 −0.5 −1.0 −1.2 −0.4 −0.7 −3.7 −4.4 −2.3 4.9 4.9 0.7 2.0 5.0 3.3 4.1Edi Upper 5.8 −0.3 4 6.8 6.4 7.6 5.8 5.7 10.0 6.4 6.4 1.8 2.6 2.6 3.5 4.0 5.4 3.2 4.4 3.8 2.0 2.6 9.2 9.8 8.4 7.9 10.2 7.8Falls Creek 0.9 +0.2 7 3.6 2.7 4.6 5.3 −1.4 −1.8 −0.9 1.7 3.8 3.1 1.4 −4.3 −2.7 −0.2 0.0 1.7 2.5 0.8 0.8 0.5 −2.1 −3.0 −1.8 −0.7 2.1 2.6 1.8 2.4 2.2 2.1 1.3Mount Buller 1.0 −0.2 5 3.0 2.7 4.0 4.5 −2.7 −2.2 0.0 1.8 3.2 3.0 −1.3 −3.4 −2.7 −0.4 1.6 2.1 2.4 2.4 −0.3 0.6 −0.3 −1.8 −1.1 −0.1 1.6 3.0 2.9 2.2 1.7 2.1 1.0Mount Hotham −0.1 −0.1 5 2.4 1.8 2.7 2.9 −2.5 −2.8 −1.5 0.4 3.3 2.1 0.3 −4.8 −4.0 −1.1 0.1 1.1 1.3 0.4 −0.3 −0.4 −2.7 −3.5 −3.1 −1.6 0.7 1.7 1.3 1.5 1.1 0.9 0.6Omeo 2.1 1.6 2.2 7.3 6.7 4.1 4.1 0.8 5.4 0.7 −0.5 2.4 −1.8 −1.9 1.5 −1.3 3.6 −0.5 −1.7 −0.4 −0.7 −0.3 −4.3 −3.8 −2.8 2.8 8.6 7.2 5.7 6.5 5.1 8.3
East Gippsland (84) Mean Anom Decile 1 2 3 4 5 6 7 8 9 10 11 12 13 14 15 16 17 18 19 20 21 22 23 24 25 26 27 28 29 30 31Combienbar AWS 7.5 −0.2 5 7.7 12.7 9.7 10.5 7.8 6.2 6.5 9.0 9.6 10.4 10.0 3.8 4.5 6.0 7.1 6.4 6.5 6.1 6.5 7.1 5.9 4.1 3.9 5.7 9.2 8.0 7.3 7.8 9.8 9.6 8.3Gabo Island Lighthouse 11.3 +0.1 5 10.9 11.8 14.4 15.5 13.0 10.8 9.5 13.3 10.3 12.4 12.4 8.0 8.7 11.2 11.2 10.3 8.7 9.8 8.4 9.4 9.3 8.2 8.5 9.1 12.9 14.8 11.8 12.2 14.7 14.8 14.6Gelantipy 5.1 +0.2 8 4.8 5.9 7.3 10.4 5.5 6.3 2.4 7.2 6.0 5.0 8.9 1.3 3.6 5.7 5.7 3.4 2.9 2.9 2.7 2.3 4.7 0.4 0.3 1.2 7.4 7.9 6.2 6.1 8.2 6.9 7.6Lakes Entrance (Eastern Beach Road) 8.5 6.7 8.0 7.9 8.5 9.6 10.9 10.0 13.0 7.3 8.0 10.7 7.8 8.9 10.6 10.6 10.0 5.1 5.4 6.0 5.9 5.6 4.7 5.8 4.0 7.0 13.0 11.3 8.8 10.0 10.7 13.0Mallacoota 8.9 −0.5 3 8.8 8.5 12.7 13.7 11.9 6.8 6.3 10.1 6.9 9.3 9.3 7.7 7.8 8.4 10.9 8.9 6.3 7.3 6.1 5.4 8.9 6.6 4.2 4.2 9.6 13.1 9.8 7.9 12.3 13.7 14.0Mount Nowa Nowa 8.7 0.0 6 9.3 12.5 10.3 12.4 8.1 8.6 7.9 9.8 9.5 10.2 8.0 5.5 7.7 8.3 8.3 8.1 7.9 7.0 7.4 7.2 8.1 5.1 5.0 6.1 8.9 9.9 9.0 10.6 11.8 10.1 10.4Orbost (Comparison) 6.5 −0.6 3 4.8 7.3 8.1 7.4 10.2 9.9 3.4 8.9 4.4 6.7 4.8 5.9 9.4 8.7 11.0 4.8 2.7 3.8 3.6 2.9 6.0 1.0 0.3 3.6 7.7 11.4 5.7 6.6 10.1 11.0 10.9Orbost 8.0 6.6 10.7 9.2 10.2 10.3 10.2 6.2 9.7 7.0 9.7 6.1 6.5 9.3 8.9 10.9 6.8 4.3 5.5 5.9 5.6 6.8 2.8 3.0 5.6 8.6 11.5 6.8 8.8 11.2 11.4 11.7Point Hicks (Lighthouse) 11.0 −0.1 4 9.8 12.6 12.8 14.7 12.2 11.2 9.7 12.4 9.8 12.5 13.3 7.4 8.7 10.8 11.4 10.8 9.3 9.9 9.3 9.4 10.0 8.0 7.5 9.0 11.5 13.5 11.0 12.0 12.8 14.0 13.5
West Gippsland (85) Mean Anom Decile 1 2 3 4 5 6 7 8 9 10 11 12 13 14 15 16 17 18 19 20 21 22 23 24 25 26 27 28 29 30 31Bairnsdale Airport 6.4 −0.3 4 3.1 7.6 7.0 7.2 8.0 7.5 2.4 9.5 4.7 6.0 7.8 5.6 9.0 9.6 7.7 2.6 2.2 3.3 2.3 3.2 8.8 1.3 −0.5 3.1 6.0 11.8 10.1 9.4 12.3 9.2 11.4East Sale Airport 5.7 −0.6 3 3.0 6.0 6.7 4.4 8.0 8.8 1.6 7.8 2.9 4.1 6.6 6.0 7.4 8.4 7.1 1.9 1.5 3.4 3.2 2.7 6.8 0.4 −1.6 1.7 5.0 12.1 11.1 8.0 10.1 11.8 9.7Morwell (Latrobe Valley Airport) 6.0 −0.6 2 5.1 4.7 3.7 4.3 7.1 9.3 2.9 11.9 3.6 4.3 7.2 6.5 8.6 7.1 9.5 2.9 1.9 4.1 2.9 3.6 6.5 0.0 −1.4 2.0 6.5 11.6 11.8 8.7 10.2 7.7 10.4Mount Baw Baw 1.1 −0.7 4 2.9 5.1 2.3 5.6 −2.0 −1.5 0.1 2.2 3.2 3.9 −2.3 −3.0 −1.5 0.1 0.7 2.0 3.0 1.0 −0.5 0.7 −0.4 −2.6 −1.6 0.5 2.4 1.7 2.2 3.1 2.8 2.8 1.5Mount Moornapa 7.9 0.0 5 8.1 11.1 9.4 12.7 6.5 8.1 8.0 10.6 9.0 10.1 4.7 4.6 6.5 8.1 7.6 6.3 6.8 6.3 6.9 6.8 7.4 4.9 3.9 6.2 8.8 9.2 8.6 9.2 10.0 9.9 9.1Noojee (Slivar) 6.0 +0.3 7 5.6 6.9 6.4 7.0 7.0 7.5 3.9 11.4 6.2 5.4 6.0 4.8 6.3 9.0 9.0 4.1 3.5 3.3 1.9 2.6 5.0 1.4 −0.2 4.0 9.2 8.9 7.1 7.5 10.4 10.2Pound Creek 7.1 4.0 12.5 2.3 9.0 8.7 8.8 6.7 10.2 8.4 10.0 8.1 6.8 11.1 9.7 10.5 1.7 2.5 3.0 2.7 4.6 3.9 −0.7 −0.8 5.1 10.0 13.1 10.6 12.1 11.6 7.2 8.2Willow Grove (Blue Rock Reservoir) 8.5 8.4 8.5 7.4 8.6 7.0 5.2 6.8 9.8 4.5 5.0 4.5 5.2 7.0 2.3 5.4 9.8 10.4 10.2 7.9Wilsons Promontory Lighthouse 12.1 +1.0 9 12.6 13.3 12.0 14.3 9.7 10.0 12.6 13.6 13.5 15.4 8.8 8.0 10.5 11.8 12.0 12.4 12.2 11.9 12.0 12.3 11.1 10.4 11.0 12.2 13.0 12.6 13.6 12.2 13.7 13.4 13.8Yarram Airport 6.0 4.4 7.5 3.3 6.3 8.6 9.6 2.4 10.0 4.3 5.3 8.2 6.8 9.6 7.6 10.4 2.0 0.8 0.9 0.2 2.5 4.4 −1.2 −1.0 1.2 7.5 13.0 12.3 7.5 11.0 11.3 10.5
East Central (86) Mean Anom Decile 1 2 3 4 5 6 7 8 9 10 11 12 13 14 15 16 17 18 19 20 21 22 23 24 25 26 27 28 29 30 31Bundoora (Latrobe University) 8.1 +0.2 8 5.5 14.0 6.6 12.2 7.0 10.6 9.0 10.5 11.0 9.8 7.0 7.0 10.0 11.0 3.5 4.8 3.9 7.5 5.0 6.0 2.0 0.5 11.0 10.0 9.5 7.7 11.5 11.5 9.5Cerberus 8.2 −0.1 5 5.6 13.0 3.2 11.7 8.9 10.5 5.4 9.7 8.8 9.9 8.3 7.8 9.8 10.4 10.5 3.5 3.5 5.5 4.6 5.2 7.9 0.4 2.5 6.8 11.7 13.0 11.1 11.6 11.5 10.1 12.9Coldstream Comparison 5.3 5.0 6.5 3.4 5.7 9.6 4.7 11.8 5.8 6.3 7.3 6.0 6.9 7.3 10.5 2.5 2.4 0.9 −0.5 2.2 3.0 −0.5 −2.5 2.3 9.0 7.1 5.4 4.3 9.7 6.5 9.4Coldstream 5.5 +0.1 7 5.1 6.7 3.5 9.5 5.9 9.8 4.8 11.9 5.9 6.4 7.3 6.2 7.0 7.4 10.6 2.6 2.5 1.0 −0.4 2.4 3.2 −0.4 −2.4 2.3 9.0 7.2 5.6 4.5 9.8 6.5 9.5Cranbourne Botanic Gardens 8.4 −0.1 5 7.7 13.7 6.5 8.5 9.0 10.3 9.5 10.5 11.3 13.0 8.0 7.0 7.0 9.8 5.4 5.8 6.0 5.5 6.1 8.0 2.9 1.9 6.5 8.2 11.6 11.3 10.0 11.1 10.2 10.5Essendon Airport 7.8 +0.1 6 5.8 13.4 6.1 11.5 7.5 10.3 8.9 9.7 10.7 13.2 6.8 6.9 7.5 10.5 11.1 3.5 4.6 3.0 3.0 5.0 7.8 1.4 0.2 5.4 11.0 9.7 8.0 8.1 11.7 10.2 10.7Ferny Creek (Dunns Hill) 7.9 +0.3 7 8.5 10.1 8.1 11.7 4.0 4.8 7.9 8.6 9.1 11.6 4.0 4.0 5.5 8.1 6.9 7.3 8.0 8.0 7.7 8.7 6.9 5.7 6.3 8.5 8.6 8.7 9.5 9.8 9.4 9.1 8.3Frankston AWS 10.6 +0.1 7 9.1 14.1 9.4 12.0 10.9 11.4 11.8 14.4 12.4 14.2 9.4 9.8 10.6 11.4 11.2 7.6 8.9 8.4 7.1 8.3 10.2 5.7 5.0 7.6 12.1 12.7 12.6 12.8 12.3 12.3 12.4Melbourne Airport 7.9 −0.4 4 7.6 12.4 6.1 11.0 6.4 8.9 8.3 9.7 10.1 13.0 6.6 5.3 7.3 10.2 10.7 4.2 6.2 4.2 4.9 5.1 8.1 2.8 2.1 6.6 10.8 11.0 7.9 7.7 11.4 10.4 9.4Melbourne Regional Office 9.8 +1.2 9 8.2 13.5 9.2 11.6 9.1 11.4 10.4 12.9 13.0 14.5 7.6 8.5 9.5 11.5 12.6 6.2 7.3 6.9 6.1 7.6 9.9 4.3 4.0 6.2 11.9 11.3 10.8 10.9 12.6 12.1 11.5Moorabbin Airport 8.2 −0.4 4 7.2 13.9 5.4 11.1 9.1 10.7 10.0 11.9 10.4 12.4 8.1 9.1 10.0 9.1 11.2 3.4 5.2 3.7 4.6 5.5 7.6 0.8 0.8 5.7 9.9 11.0 10.1 8.5 12.1 8.6 7.2Phillip Island Penguin Reserve 4.4 13.6 2.4 13.8 9.7 10.4 8.7 11.7 11.3 1.8 2.3 6.4 10.4 0.3 −0.2 5.7 11.5 12.6 14.0Rhyll 10.9 +0.3 7 10.3 12.1 10.1 14.3 9.7 9.9 11.7 12.1 12.4 13.0 8.6 8.3 10.1 11.4 11.5 9.2 9.1 9.3 8.8 10.4 10.6 7.8 8.1 10.8 12.4 13.3 12.8 12.6 12.4 12.9 13.1Scoresby Research Institute 7.4 −0.8 3 7.3 12.9 4.8 9.7 6.5 10.0 7.4 9.7 8.4 13.6 7.5 7.2 8.5 10.4 10.3 2.5 4.4 4.3 2.8 5.2 6.3 0.7 0.4 4.6 11.0 7.0 7.6 9.3 11.1 10.5 8.2Viewbank (ARPANSA) 7.5 −0.2 6 5.8 9.7 5.9 8.9 8.0 9.7 8.3 11.0 9.6 10.3 7.3 7.4 8.5 9.0 10.8 3.3 4.3 3.8 3.2 5.2 6.3 0.4 0.5 4.2 11.0 9.6 9.7 8.5 10.1 11.2 10.1Wallan (Kilmore Gap) 7.2 +0.4 7 7.7 7.7 7.4 10.4 4.1 6.3 7.1 7.8 9.0 9.7 3.8 3.8 5.4 7.6 6.7 6.3 7.6 6.8 7.4 7.5 6.7 4.2 4.7 7.6 8.6 9.2 9.4 8.4 8.8 9.2 7.6Wonthaggi 8.9 +0.3 8 7.5 6.0 8.0 13.0 11.0 14.1 8.5 9.0 11.5 10.6 11.5 6.0 5.0 5.5 6.8 7.0 3.0 4.5 5.5 9.5 9.8 11.5 11.3 11.5 11.0 12.2
West Central (87) Mean Anom Decile 1 2 3 4 5 6 7 8 9 10 11 12 13 14 15 16 17 18 19 20 21 22 23 24 25 26 27 28 29 30 31Avalon Airport 7.7 +0.2 7 5.8 11.9 3.6 10.3 6.9 10.6 7.9 9.0 12.6 11.6 7.3 6.3 7.6 9.2 11.1 3.2 4.4 2.6 2.6 4.1 8.6 2.1 0.0 5.8 12.0 12.9 8.1 8.8 11.2 11.6 9.8Grovedale (Geelong Airport) 7.9 +0.1 7 7.3 11.9 3.6 10.9 6.2 9.7 7.0 5.9 10.7 9.2 6.8 6.2 7.5 9.2 10.6 4.0 5.8 4.0 5.5 6.6 8.1 3.1 0.5 5.9 11.7 12.6 7.5 10.9 12.0 12.3 12.0Laverton RAAF 7.8 0.0 7 6.2 13.7 5.3 9.8 6.2 10.7 7.3 10.5 10.8 13.3 7.0 6.9 6.6 8.1 11.6 2.6 4.8 3.1 3.1 4.2 8.9 1.5 0.1 5.5 11.2 9.1 8.2 9.5 12.2 11.9 12.7Sheoaks 7.3 0.0 6 6.3 12.0 2.9 11.7 7.0 9.0 7.8 8.7 11.5 12.5 5.8 5.8 7.6 8.6 9.3 4.1 6.1 3.5 3.1 4.7 8.8 0.8 0.8 4.9 10.5 11.0 6.8 6.4 10.5 11.0 6.8
North Central (88) Mean Anom Decile 1 2 3 4 5 6 7 8 9 10 11 12 13 14 15 16 17 18 19 20 21 22 23 24 25 26 27 28 29 30 31Castlemaine Prison 5.4 +0.1 5 5.1 8.4 9.6 11.2 2.9 5.2 4.7 8.6 8.1 12.2 4.4 1.3 1.4 5.1 0.9 2.3 5.2 1.8 1.0 2.1 1.8 0.4 2.2 2.8 8.4 5.5 7.3 9.9 9.5 7.5 9.8Eildon Fire Tower 6.8 +0.1 7 7.8 9.1 8.4 11.2 4.0 5.0 7.0 8.4 8.9 8.6 3.8 3.2 4.8 5.9 4.9 5.1 6.3 6.3 5.6 6.1 4.8 3.1 4.5 7.2 8.4 9.1 9.0 7.6 8.5 7.7 9.2Lake Eildon 6.6 +0.6 8 7.5 8.6 6.9 10.6 6.0 7.7 6.6 10.1 9.0 10.0 6.9 6.3 6.4 4.4 3.6 4.5 4.6 4.0 4.0 3.0 2.5 1.0 0.5 4.6 9.2 8.2 8.5 8.9 10.4 9.1 9.8Mangalore Airport 6.0 −0.1 6 4.0 6.0 8.8 10.1 3.4 6.5 6.6 10.7 6.1 7.0 7.0 −1.0 3.7 3.2 6.1 3.1 5.8 4.8 1.7 2.8 6.0 3.9 0.8 4.7 10.9 10.1 6.3 6.2 11.4 9.5 8.6Maryborough 6.0 −0.1 5 3.5 6.1 7.1 8.2 2.8 5.8 5.5 8.1 10.0 8.8 4.2 3.6 3.9 7.2 3.9 3.8 5.9 3.7 2.3 3.2 5.1 2.2 3.1 6.2 8.3 8.0 5.8 8.8 10.0 10.7 9.1Redesdale 4.8 −0.5 3 2.9 4.4 8.0 5.6 1.2 7.0 2.7 7.5 5.6 7.7 3.8 0.5 0.5 5.5 1.7 2.3 5.5 2.3 1.4 2.0 3.6 1.8 −0.2 6.4 9.3 8.5 5.8 6.5 10.2 9.5 9.6
Western Plains (89) Mean Anom Decile 1 2 3 4 5 6 7 8 9 10 11 12 13 14 15 16 17 18 19 20 21 22 23 24 25 26 27 28 29 30 31Ararat Prison 4.5 −1.0 3 3.6 8.6 1.4 6.7 3.0 7.8 7.1 7.6 11.6 8.7 3.7 3.7 0.8 5.4 −0.3 0.1 2.4 −0.7 0.6 1.4 2.9 −2.1 −4.1 −0.1 9.0 10.9 6.9 9.0 8.5 9.5 7.1Ballarat Aerodrome 5.0 −0.7 2 3.0 8.0 4.2 10.0 2.3 6.0 4.2 9.4 8.1 10.1 3.5 2.7 3.2 6.8 0.9 0.2 2.6 1.3 0.7 2.3 4.2 −2.4 −1.6 5.9 8.0 10.0 4.1 8.9 8.8 9.6 9.3Westmere 4.9 3.6 10.9 −0.9 7.9 4.9 8.6 6.9 5.9 11.4 9.1 5.4 4.4 4.8 3.5 −0.1 −0.8 2.6 0.0 1.7 1.8 3.1 −3.1 −3.2 4.2 9.7 10.9 6.6 6.9 9.3 10.8 5.7
West Coast (90) Mean Anom Decile 1 2 3 4 5 6 7 8 9 10 11 12 13 14 15 16 17 18 19 20 21 22 23 24 25 26 27 28 29 30 31Aireys Inlet 9.9 0.0 6 10.0 13.2 8.2 12.1 7.2 9.9 9.5 9.3 12.1 13.3 7.2 7.1 9.2 9.6 10.3 8.4 8.7 8.8 8.6 9.9 10.4 7.3 5.8 8.3 11.3 12.6 12.3 10.6 11.6 11.9 13.2Cape Nelson Lighthouse 10.4 −0.4 2 9.2 13.2 6.9 11.9 10.0 12.1 13.0 11.0 14.1 13.0 8.7 9.4 11.6 10.5 7.2 8.6 8.8 9.7 10.9 7.8 10.2 6.0 5.8 8.8 10.9 12.9 12.5 10.0 10.9 11.6 14.0Cape Otway Lighthouse 10.2 +0.2 6 8.6 12.7 7.4 13.1 8.1 11.1 10.3 11.0 13.1 11.9 7.7 6.6 10.8 9.4 9.5 8.7 9.0 8.3 8.7 8.9 7.9 6.2 8.6 10.7 12.4 12.7 12.5 12.9 12.2 12.7 13.3Casterton Showgrounds 5.9 −1.2 1 6.1 12.4 2.8 6.8 5.2 12.2 7.6 10.2 8.5 6.5 4.0 4.5 3.8 1.9 1.2 1.5 1.5 3.6 4.4 4.8 −0.8 −1.6 0.6 11.2 10.5 9.4 8.8 10.8 11.0 8.0Casterton 6.3 6.1 12.3 4.6 9.9 4.4 9.3 11.3 7.0 11.9 9.9 5.8 2.9 3.5 3.3 1.6 3.5 5.0 2.9 2.4 2.6 7.5 −0.6 −0.4 3.3 11.1 8.7 7.7 8.5 10.4 10.8 8.3
Monthly Weather Review Victoria May 2010
page 13

Daily and mean minimum temperatures for May 2010Mean is the average of the daily minimum temperature for May 2010; it is only shown if there are sufficient days available. Anom is thedifference between the mean daily minimum temperature for May 2010 and the long-term average minimum temperature for May. Decile isthe decile rank of mean daily minimum temperature for May 2010 in the climate record of other May mean daily minimum temperatures;“L” indicates this is the lowest on record, and “H” it is the highest on record. Anomalies and deciles are only shown if there are sufficientyears of climate record available. The lowest and highest minimum temperatures for each site for May 2010 are highlighted.Colac (Mount Gellibrand) 7.8 7.4 9.9 7.2 8.8 4.9 6.7 8.4 8.5 9.5 10.9 5.4 4.2 5.6 6.8 8.0 7.3 6.6 8.0 6.7 7.6 8.3 5.3 4.8 6.0 9.1 10.6 9.9 9.8 10.0 10.5 9.7Dartmoor 6.8 7.7 11.8 2.3 9.8 5.8 9.1 12.2 7.1 12.1 9.9 6.5 6.1 5.3 5.1 2.2 4.4 2.9 3.5 4.2 5.1 4.1 1.5 0.0 3.7 11.2 9.6 11.2 8.1 10.3 10.9 8.6Hamilton Airport 6.3 −0.2 5 5.6 10.7 4.7 11.3 3.6 7.3 10.6 8.7 12.1 9.1 4.8 3.4 3.0 4.1 3.7 2.4 4.9 3.7 1.0 4.3 6.0 0.5 −0.4 6.3 10.3 11.2 10.2 7.5 9.7 10.0 5.9Mortlake Racecourse 5.5 −1.1 1 5.3 9.0 0.8 6.8 4.9 7.8 8.0 5.9 10.9 9.4 5.8 4.4 4.3 3.5 1.2 1.9 3.1 1.4 1.7 3.3 5.2 −1.9 −0.2 3.8 10.8 9.7 8.4 8.8 10.0 11.0 4.3Port Fairy AWS 8.3 −0.8 L 7.0 12.4 3.4 9.6 7.6 10.7 11.8 8.2 11.7 10.0 7.0 7.3 8.7 7.6 4.5 5.0 5.9 4.9 6.2 5.2 6.7 8.0 2.9 4.9 11.8 12.9 11.2 8.8 10.6 11.3 13.0Portland (Cashmore Airport) 7.6 −0.7 3 6.9 12.7 3.9 8.8 7.6 9.8 12.1 7.9 13.0 10.4 5.7 7.5 7.7 7.3 5.7 4.0 5.1 5.2 7.3 5.4 7.8 2.2 0.7 4.6 9.6 8.9 11.5 5.1 9.6 10.5 10.4Warrnambool Airport NDB 6.6 −0.6 4 4.2 10.8 2.7 7.5 6.3 8.6 11.0 8.6 12.0 9.2 5.0 6.3 6.6 4.6 3.2 3.4 4.5 3.9 3.6 3.3 3.4 0.9 0.5 3.7 10.6 9.8 11.0 9.5 10.0 10.8 7.9Weeaproinah 7.4 +0.1 6 7.5 8.0 5.2 9.3 5.0 7.1 8.0 8.0 9.0 10.5 4.6 3.7 6.7 7.7 7.0 6.6 6.8 7.0 7.0 7.6 4.3 3.1 5.7 8.0 9.3 10.1 9.0 9.4 9.6 10.1 8.2
Monthly Weather Review Victoria May 2010
page 14
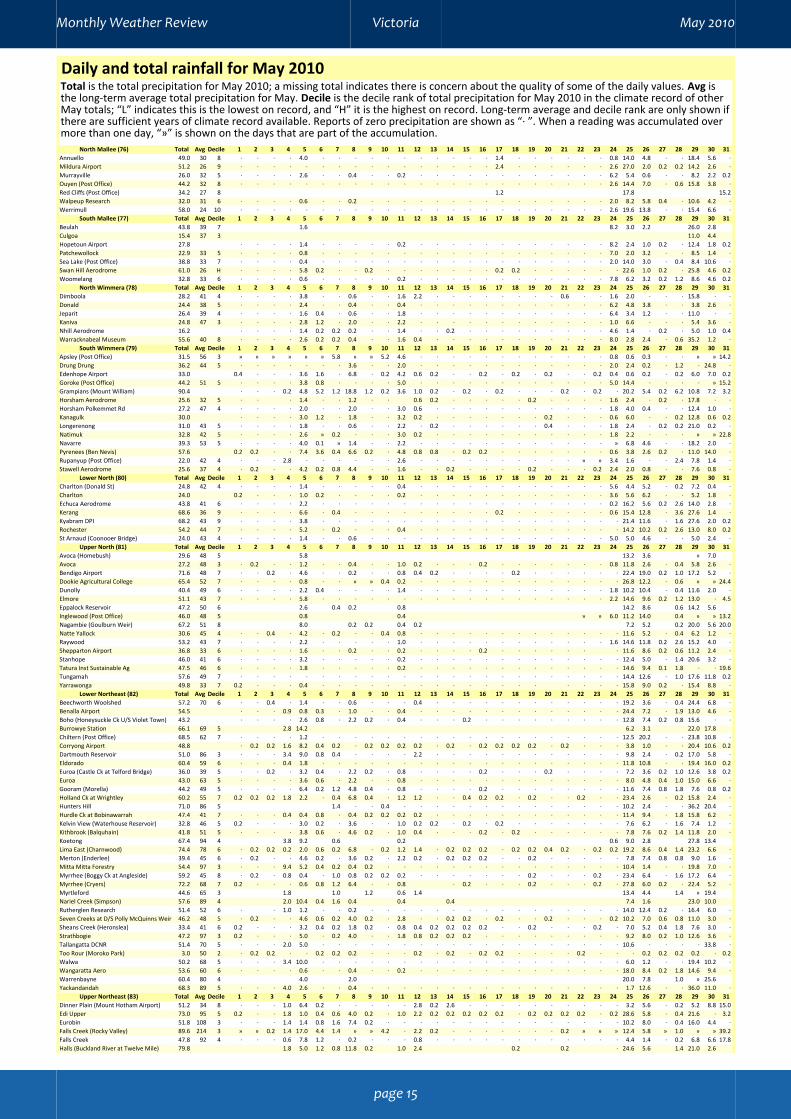
Daily and total rainfall for May 2010Total is the total precipitation for May 2010; a missing total indicates there is concern about the quality of some of the daily values. Avg isthe long-term average total precipitation for May. Decile is the decile rank of total precipitation for May 2010 in the climate record of otherMay totals; “L” indicates this is the lowest on record, and “H” it is the highest on record. Long-term average and decile rank are only shown ifthere are sufficient years of climate record available. Reports of zero precipitation are shown as “· ”. When a reading was accumulated overmore than one day, “»” is shown on the days that are part of the accumulation.
North Mallee (76) Total Avg Decile 1 2 3 4 5 6 7 8 9 10 11 12 13 14 15 16 17 18 19 20 21 22 23 24 25 26 27 28 29 30 31Annuello 49.0 30 8 · · · · 4.0 · · · · · · · · · · · 1.4 · · · · · · 0.8 14.0 4.8 · · 18.4 5.6 ·Mildura Airport 51.2 26 9 · · · · · · · · · · · · · · · · 2.4 · · · · · · 2.6 27.0 2.0 0.2 0.2 14.2 2.6 ·Murrayville 26.0 32 5 · · · · 2.6 · · 0.4 · · 0.2 · · · · · · · · · · · · 6.2 5.4 0.6 · · 8.2 2.2 0.2Ouyen (Post Office) 44.2 32 8 · · · · · · · · · · · · · · · · · · · · · · · 2.6 14.4 7.0 · 0.6 15.8 3.8 ·Red Cliffs (Post Office) 34.2 27 8 1.2 17.8 15.2Walpeup Research 32.0 31 6 · · · · 0.6 · · 0.2 · · · · · · · · · · · · · · · 2.0 8.2 5.8 0.4 · 10.6 4.2 ·Werrimull 58.0 24 10 · · · · · · · · · · · · · · · · · · · · · · · 2.6 19.6 13.8 · · 15.4 6.6 ·
South Mallee (77) Total Avg Decile 1 2 3 4 5 6 7 8 9 10 11 12 13 14 15 16 17 18 19 20 21 22 23 24 25 26 27 28 29 30 31Beulah 43.8 39 7 1.6 8.2 3.0 2.2 26.0 2.8Culgoa 15.4 37 3 11.0 4.4Hopetoun Airport 27.8 · · · · 1.4 · · · · · 0.2 · · · · · · · · · · · · 8.2 2.4 1.0 0.2 · 12.4 1.8 0.2Patchewollock 22.9 33 5 · · · · 0.8 · · · · · · · · · · · · · · · · · · 7.0 2.0 3.2 · · 8.5 1.4 ·Sea Lake (Post Office) 38.8 33 7 · · · · 0.4 · · · · · · · · · · · · · · · · · · 2.0 14.0 3.0 · 0.4 8.4 10.6 ·Swan Hill Aerodrome 61.0 26 H · · · · 5.8 0.2 · · 0.2 · · · · · · · 0.2 0.2 · · · · · · 22.6 1.0 0.2 · 25.8 4.6 0.2Woomelang 32.8 33 6 · · · · 0.6 · · · · · 0.2 · · · · · · · · · · · · 7.8 6.2 3.2 0.2 1.2 8.6 4.6 0.2
North Wimmera (78) Total Avg Decile 1 2 3 4 5 6 7 8 9 10 11 12 13 14 15 16 17 18 19 20 21 22 23 24 25 26 27 28 29 30 31Dimboola 28.2 41 4 · · · · 3.8 · · 0.6 · · 1.6 2.2 · · · · · · · · 0.6 · · 1.6 2.0 · · · 15.8 · ·Donald 24.4 38 5 · · · · 2.4 · · 0.4 · · 0.4 · · · · · · · · · · · · 6.2 4.8 3.8 · · 3.8 2.6 ·Jeparit 26.4 39 4 · · · · 1.6 0.4 · 0.6 · · 1.8 · · · · · · · · · · · · 6.4 3.4 1.2 · · 11.0 · ·Kaniva 24.8 47 3 · · · · 2.8 1.2 · 2.0 · · 2.2 · · · · · · · · · · · · 1.0 6.6 · · · 5.4 3.6 ·Nhill Aerodrome 16.2 · · · · 1.4 0.2 0.2 0.2 · · 1.4 · · 0.2 · · · · · · · · · 4.6 1.4 · 0.2 · 5.0 1.0 0.4Warracknabeal Museum 55.6 40 8 · · · · 2.6 0.2 0.2 0.4 · · 1.6 0.4 · · · · · · · · · · · 8.0 2.8 2.4 · 0.6 35.2 1.2 ·
South Wimmera (79) Total Avg Decile 1 2 3 4 5 6 7 8 9 10 11 12 13 14 15 16 17 18 19 20 21 22 23 24 25 26 27 28 29 30 31Apsley (Post Office) 31.5 56 3 » » » » » » 5.8 » » 5.2 4.6 · · · · · · · · · · · · 0.8 0.6 0.3 · · » » 14.2Drung Drung 36.2 44 5 · · · · · · · 3.6 · · 2.0 · · · · · · · · · · · · 2.0 2.4 0.2 · 1.2 · 24.8 ·Edenhope Airport 33.0 0.4 · · · 3.6 1.6 · 6.8 · 0.2 4.2 0.6 0.2 · · 0.2 · 0.2 · 0.2 · · 0.2 0.4 0.6 0.2 · 0.2 6.0 7.0 0.2Goroke (Post Office) 44.2 51 5 · · · · 3.8 0.8 · · · · 5.0 · · · · · · · · · · · · 5.0 14.4 · · · · » 15.2Grampians (Mount William) 90.4 · · · 0.2 4.8 5.2 1.2 18.8 1.2 0.2 3.6 1.0 0.2 · 0.2 · 0.2 · · · 0.2 · 0.2 · 20.2 5.4 0.2 6.2 10.8 7.2 3.2Horsham Aerodrome 25.6 32 5 · · · 1.4 · · 1.2 · · 0.6 0.2 · · · · · 0.2 · · · · 1.6 2.4 · 0.2 · 17.8 · ·Horsham Polkemmet Rd 27.2 47 4 · · · · 2.0 · · 2.0 · · 3.0 0.6 · · · · · · · · · · · 1.8 4.0 0.4 · · 12.4 1.0 ·Kanagulk 30.0 · · · · 3.0 1.2 · 1.8 · · 3.2 0.2 · · · · · · · 0.2 · · · 0.6 6.0 · · 0.2 12.8 0.6 0.2Longerenong 31.0 43 5 · · · · 1.8 · · 0.6 · · 2.2 · 0.2 · · · · · · 0.4 · · · 1.8 2.4 · 0.2 0.2 21.0 0.2 ·Natimuk 32.8 42 5 · · · · 2.6 » 0.2 · · · 3.0 0.2 · · · · · · · · · · · 1.8 2.2 · · · » » 22.8Navarre 39.3 53 5 · · · · 4.0 0.1 » 1.4 · · 2.2 · · · · · · · · · · · · » 6.8 4.6 · · 18.2 2.0 ·Pyrenees (Ben Nevis) 57.6 0.2 0.2 · · 7.4 3.6 0.4 6.6 0.2 · 4.8 0.8 0.8 · 0.2 0.2 · · · · · · · 0.6 3.8 2.6 0.2 · 11.0 14.0 ·Rupanyup (Post Office) 22.0 42 4 · · · 2.8 · · · · · · 2.6 · · · · · · · · · · » » 3.4 1.6 · · 2.4 7.8 1.4 ·Stawell Aerodrome 25.6 37 4 · 0.2 · · 4.2 0.2 0.8 4.4 · · 1.6 · · 0.2 · · · · 0.2 · · · 0.2 2.4 2.0 0.8 · · 7.6 0.8 ·
Lower North (80) Total Avg Decile 1 2 3 4 5 6 7 8 9 10 11 12 13 14 15 16 17 18 19 20 21 22 23 24 25 26 27 28 29 30 31Charlton (Donald St) 24.8 42 4 · · · · 1.4 · · · · · 0.4 · · · · · · · · · · · · 5.6 4.4 5.2 · 0.2 7.2 0.4 ·Charlton 24.0 0.2 · · · 1.0 0.2 · · · · 0.2 · · · · · · · · · · · · 3.6 5.6 6.2 · · 5.2 1.8 ·Echuca Aerodrome 43.8 41 6 · · · · 2.2 · · · · · · · · · · · · · · · · · · 0.2 16.2 5.6 0.2 2.6 14.0 2.8 ·Kerang 68.6 36 9 · · · · 6.6 · 0.4 · · · · · · · · · 0.2 · · · · · · 0.6 15.4 12.8 · 3.6 27.6 1.4 ·Kyabram DPI 68.2 43 9 · · · · 3.8 · · · · · · · · · · · · · · · · · · · 21.4 11.6 · 1.6 27.6 2.0 0.2Rochester 54.2 44 7 · · · · 5.2 · 0.2 · · · 0.4 · · · · · · · · · · · · · 14.2 10.2 0.2 2.6 13.0 8.0 0.2St Arnaud (Coonooer Bridge) 24.0 43 4 · · · · 1.4 · · 0.6 · · · · · · · · · · · · · · · 5.0 5.0 4.6 · · 5.0 2.4 ·
Upper North (81) Total Avg Decile 1 2 3 4 5 6 7 8 9 10 11 12 13 14 15 16 17 18 19 20 21 22 23 24 25 26 27 28 29 30 31Avoca (Homebush) 29.6 48 5 5.8 13.2 3.6 » 7.0Avoca 27.2 48 3 · 0.2 · · 1.2 · · 0.4 · · 1.0 0.2 · · · 0.2 · · · · · · · 0.8 11.8 2.6 · 0.4 5.8 2.6 ·Bendigo Airport 71.6 48 7 · · 0.2 · 4.6 · · 0.2 · · 0.8 0.4 0.2 · · · · 0.2 · · · · · · 22.4 19.0 0.2 1.0 17.2 5.2 ·Dookie Agricultural College 65.4 52 7 · · · · 0.8 · · » » 0.4 0.2 · · · · · · · · · · · · · 26.8 12.2 · 0.6 » » 24.4Dunolly 40.4 49 6 · · · · 2.2 0.4 · · · · 1.4 · · · · · · · · · · · · 1.8 10.2 10.4 · 0.4 11.6 2.0 ·Elmore 51.1 43 7 · · · · 5.8 · · · · · · · · · · · · · · · · · · 2.2 14.6 9.6 0.2 1.2 13.0 · 4.5Eppalock Reservoir 47.2 50 6 2.6 0.4 0.2 0.8 14.2 8.6 0.6 14.2 5.6Inglewood (Post Office) 46.0 48 5 0.8 0.4 » » 6.0 11.2 14.0 0.4 » » 13.2Nagambie (Goulburn Weir) 67.2 51 8 8.0 0.2 0.2 0.4 0.2 7.2 5.2 0.2 20.0 5.6 20.0Natte Yallock 30.6 45 4 · · 0.4 · 4.2 · 0.2 · · 0.4 0.8 · · · · · · · · · · · · · 11.6 5.2 · 0.4 6.2 1.2 ·Raywood 53.2 43 7 · · · · 2.2 · · · · · 1.0 · · · · · · · · · · · · 1.6 14.6 11.8 0.2 2.6 15.2 4.0 ·Shepparton Airport 36.8 33 6 · · · · 1.6 · · 0.2 · · 0.2 · · · · 0.2 · · · · · · · 11.6 8.6 0.2 0.6 11.2 2.4 ·Stanhope 46.0 41 6 · · · · 3.2 · · · · · 0.2 · · · · · · · · · · · · · 12.4 5.0 · 1.4 20.6 3.2 ·Tatura Inst Sustainable Ag 47.5 46 6 · · · · 1.8 · · · · · 0.2 · · · · · · · · · · · · · 14.6 9.4 0.1 1.8 · · 19.6Tungamah 57.6 49 7 · · · · · · · · · · · · · · · · · · · · · · · · 14.4 12.6 · 1.0 17.6 11.8 0.2Yarrawonga 49.8 33 7 0.2 · · · 0.4 · · · · · · · · · · · · · · · · · · 15.8 9.0 0.2 · 15.4 8.8 ·
Lower Northeast (82) Total Avg Decile 1 2 3 4 5 6 7 8 9 10 11 12 13 14 15 16 17 18 19 20 21 22 23 24 25 26 27 28 29 30 31Beechworth Woolshed 57.2 70 6 · · 0.4 · 1.4 · · 0.6 · · · 0.4 · · · · · · · · · · · · 19.2 3.6 · 0.4 24.4 6.8 ·Benalla Airport 54.5 · · · 0.9 0.8 0.3 · 1.0 · · 0.4 · · · · · · · · · · · · · 24.4 7.2 · 1.9 13.0 4.6 ·Boho (Honeysuckle Ck U/S Violet Town) 43.2 · · · · 2.6 0.8 · 2.2 0.2 · 0.4 · · · 0.2 · · · · · · · · · 12.8 7.4 0.2 0.8 15.6 · ·Burrowye Station 66.1 69 5 2.8 14.2 6.2 3.1 22.0 17.8Chiltern (Post Office) 68.5 62 7 · · · · 1.2 · · · · · · · · · · · · · · · · · · · 12.5 20.2 · · 23.8 10.8 ·Corryong Airport 48.8 · 0.2 0.2 1.6 8.2 0.4 0.2 · 0.2 0.2 0.2 0.2 · 0.2 · 0.2 0.2 0.2 0.2 · 0.2 · · · 3.8 1.0 · · 20.4 10.6 0.2Dartmouth Reservoir 51.0 86 3 · · · 3.4 9.0 0.8 0.4 · · · · 2.2 · · · · · · · · · · · · 9.8 2.4 · 0.2 17.0 5.8 ·Eldorado 60.4 59 6 · · · 0.4 1.8 · · · · · · · · · · · · · · · · · · · 11.8 10.8 · · 19.4 16.0 0.2Euroa (Castle Ck at Telford Bridge) 36.0 39 5 · · 0.2 · 3.2 0.4 · 2.2 0.2 · 0.8 · · · · 0.2 · · · 0.2 · · · · 7.2 3.6 0.2 1.0 12.6 3.8 0.2Euroa 43.0 63 5 · · · · 3.6 0.6 · 2.2 · · 0.8 · · · · · · · · · · · · · 8.0 4.8 0.4 1.0 15.0 6.6 ·Gooram (Morella) 44.2 49 5 · · · · 6.4 0.2 1.2 4.8 0.4 · 0.8 · · · · 0.2 · · · · · · · · 11.6 7.4 0.8 1.8 7.6 0.8 0.2Holland Ck at Wrightley 60.2 55 7 0.2 0.2 0.2 1.8 2.2 · 0.4 6.8 0.4 · 1.2 1.2 · · 0.4 0.2 0.2 · 0.2 · · 0.2 · · 23.4 2.6 · 0.2 15.8 2.4 ·Hunters Hill 71.0 86 5 1.4 · · 0.4 · · · · · · · · · · · · · · 10.2 2.4 · · 36.2 20.4 ·Hurdle Ck at Bobinawarrah 47.4 41 7 · · · 0.4 0.4 0.8 · 0.4 0.2 0.2 0.2 0.2 · · · · · · · · · · · · 11.4 9.4 · 1.8 15.8 6.2 ·Kelvin View (Waterhouse Reservoir) 32.8 46 5 0.2 · · · 3.0 0.2 · 3.6 · · 1.0 0.2 0.2 · 0.2 · 0.2 · · · · · · · 7.6 6.2 · 1.6 7.4 1.2 ·Kithbrook (Balquhain) 41.8 51 5 · · · · 3.8 0.6 · 4.6 0.2 · 1.0 0.4 · · · 0.2 · 0.2 · · · · · · 7.8 7.6 0.2 1.4 11.8 2.0 ·Koetong 67.4 94 4 3.8 9.2 0.6 0.2 0.6 9.0 2.8 27.8 13.4Lima East (Charnwood) 74.4 78 6 · 0.2 0.2 0.2 2.0 0.6 0.2 6.8 · 0.2 1.2 1.4 · 0.2 0.2 0.2 · 0.2 0.2 0.4 0.2 · 0.2 0.2 19.2 8.6 0.4 1.4 23.2 6.6 ·Merton (Enderlee) 39.4 45 6 · 0.2 · · 4.6 0.2 · 3.6 0.2 · 2.2 0.2 · 0.2 0.2 0.2 · · 0.2 · · · · · 7.8 7.4 0.8 0.8 9.0 1.6 ·Mitta Mitta Forestry 54.4 97 3 · · · 9.4 5.2 0.4 0.2 0.4 0.2 · · · · · · · · · · · · · · · 10.4 1.4 · · 19.8 7.0 ·Myrrhee (Boggy Ck at Angleside) 59.2 45 8 · 0.2 · 0.8 0.4 · 1.0 0.8 0.2 0.2 0.2 · · · · · · · 0.2 · · · 0.2 · 23.4 6.4 · 1.6 17.2 6.4 ·Myrrhee (Cryers) 72.2 68 7 0.2 · · · 0.6 0.8 1.2 6.4 · · 0.8 · 0.2 · · · 0.2 · · · 0.2 · 27.8 6.0 0.2 · 22.4 5.2 ·Myrtleford 44.6 65 3 1.8 1.0 1.2 0.6 1.4 13.4 4.4 1.4 » 19.4Nariel Creek (Simpson) 57.6 89 4 2.0 10.4 0.4 1.6 0.4 0.4 0.4 7.4 1.6 23.0 10.0Rutherglen Research 51.4 52 6 · · 1.0 1.2 · · 0.2 · · · · · · · · · · · · · · · · 14.0 12.4 0.2 · 16.4 6.0 ·Seven Creeks at D/S Polly McQuinns Weir 46.2 48 5 · 0.2 · · 4.6 0.6 0.2 4.0 0.2 · 2.8 · · 0.2 0.2 · 0.2 · · 0.2 · · · 0.2 10.2 7.0 0.6 0.8 11.0 3.0 ·Sheans Creek (Heronslea) 33.4 41 6 0.2 · · · 3.2 0.4 0.2 1.8 0.2 · 0.8 0.4 0.2 0.2 0.2 0.2 · · 0.2 · · · 0.2 · 7.0 5.2 0.4 1.8 7.6 3.0 ·Strathbogie 47.2 97 3 0.2 · · · 5.0 · 0.2 4.0 · · 1.8 0.8 0.2 0.2 0.2 · · · · · · · · · 9.2 8.0 0.2 1.0 12.6 3.6 ·Tallangatta DCNR 51.4 70 5 · · · 2.0 5.0 · · · · · · · · · · · · · · · · · · · 10.6 · · · · 33.8 ·Too Rour (Moroko Park) 3.0 50 2 · 0.2 0.2 · · 0.2 0.2 0.2 · · · 0.2 · 0.2 · 0.2 0.2 · · · · 0.2 · · · 0.2 0.2 0.2 0.2 · 0.2Walwa 50.2 68 5 · · · 3.4 10.0 · · · · · · · · · · · · · · · · · · · 6.0 1.2 · · 19.4 10.2 ·Wangaratta Aero 53.6 60 6 · · · · 0.6 · · 0.4 · · 0.2 · · · · · · · · · · · · · 18.0 8.4 0.2 1.8 14.6 9.4 ·Warrenbayne 60.4 80 4 4.0 2.0 20.0 7.8 1.0 » 25.6Yackandandah 68.3 89 5 · · · 4.0 2.6 · · 0.4 · · · · · · · · · · · · · · · · 1.7 12.6 · · 36.0 11.0 ·
Upper Northeast (83) Total Avg Decile 1 2 3 4 5 6 7 8 9 10 11 12 13 14 15 16 17 18 19 20 21 22 23 24 25 26 27 28 29 30 31Dinner Plain (Mount Hotham Airport) 51.2 34 8 · · · 1.0 6.4 0.2 · · · · · 2.8 0.2 2.6 · · · · · · · · · · 3.2 5.6 · 0.2 5.2 8.8 15.0Edi Upper 73.0 95 5 0.2 · · 1.8 1.0 0.4 0.6 4.0 0.2 · 1.0 2.2 0.2 0.2 0.2 0.2 0.2 · 0.2 0.2 0.2 0.2 · 0.2 28.6 5.8 · 0.4 21.6 · 3.2Eurobin 51.8 108 3 · · · 1.4 1.4 0.8 1.6 7.4 0.2 · · · · · · · · · · · · · · · 10.2 8.0 · 0.4 16.0 4.4 ·Falls Creek (Rocky Valley) 89.6 214 3 » » 0.2 1.4 17.0 4.4 1.4 » » 4.2 · 2.2 0.2 · · · · · · · 0.2 » » » 12.4 5.8 » 1.0 » » 39.2Falls Creek 47.8 92 4 · · · 0.6 7.8 1.2 · 0.2 · · · 0.8 · · · · · · · · · · · · 4.4 1.4 · 0.2 6.8 6.6 17.8Halls (Buckland River at Twelve Mile) 79.8 1.8 5.0 1.2 0.8 11.8 0.2 1.0 2.4 0.2 0.2 · 24.6 5.6 1.4 21.0 2.6
Monthly Weather Review Victoria May 2010
page 15

Daily and total rainfall for May 2010Total is the total precipitation for May 2010; a missing total indicates there is concern about the quality of some of the daily values. Avg isthe long-term average total precipitation for May. Decile is the decile rank of total precipitation for May 2010 in the climate record of otherMay totals; “L” indicates this is the lowest on record, and “H” it is the highest on record. Long-term average and decile rank are only shown ifthere are sufficient years of climate record available. Reports of zero precipitation are shown as “· ”. When a reading was accumulated overmore than one day, “»” is shown on the days that are part of the accumulation.Harrietville 70.6 128 3 · · · 5.4 8.4 1.8 · 5.8 · · 2.8 · · · · · · · · · · · · · 13.8 1.4 · 1.8 16.8 8.8 3.8Lake Buffalo 61.4 97 4 0.4 2.4 0.2 4.2 3.4 18.2 7.8 3.6 17.2 4.0Mansfield (Post Office) 39.4 63 4 · · · · 3.6 1.2 0.6 » » 4.4 1.8 2.2 · · · · · · · · · · · · 12.2 4.4 0.4 1.4 » » 7.2Mount Buller 97.0 130 4 · · · · 17.4 4.2 0.4 18.2 · · 5.6 3.4 0.2 · · · · · · · · · · · 13.6 4.6 · 1.2 24.6 0.6 3.0Mount Hotham 76.2 123 4 · · · 6.6 10.0 3.8 0.6 3.8 0.2 · · 3.6 · · 0.2 · · · · · · · · · 6.6 5.4 · 2.4 14.8 7.8 10.4Omeo 48.8 · 0.2 · 0.2 4.8 · · · 0.2 0.2 · 0.8 0.6 0.4 0.2 · 0.2 0.2 · 0.2 · 0.2 · 0.2 4.4 0.6 · · 3.2 11.2 20.8Tolmie (Mount Tabletop Repeater) 65.0 53 8 · · · · 4.0 2.0 1.0 6.0 · · 3.0 · · 1.0 · · · · · · · · · · 19.0 2.0 · · 25.0 2.0 ·Whitfield (King River at Cheshunt) 77.2 66 7 · · 0.2 · 1.0 0.2 0.6 6.8 0.2 · 1.0 0.6 0.4 0.2 · · · 0.2 · · · · · · 30.2 7.4 · 0.4 21.0 6.8 ·Whitlands (Burder's Lane) 100.0 136 5 · · · 3.2 1.6 0.4 1.6 10.0 · · 1.0 2.0 · · · · · · · · · · · · 31.6 11.2 · · 28.8 8.6 ·Woods Point 76.2 131 3 · · · · 16.0 4.4 · 7.2 · · 5.4 4.8 1.2 · · · · · · · 1.2 · · · 12.4 0.8 1.0 0.8 5.2 6.6 9.2
East Gippsland (84) Total Avg Decile 1 2 3 4 5 6 7 8 9 10 11 12 13 14 15 16 17 18 19 20 21 22 23 24 25 26 27 28 29 30 31Bonang 71.0 73 6 · · · · 5.2 1.0 · · · · · 5.4 6.4 15.6 1.4 · · · · · · 3.0 · · 2.0 · · · · 18.6 12.4Buchan 79.8 63 7 · · · · 4.0 · 13.2 · · · · 3.0 0.2 14.8 0.2 · · · · 0.6 5.0 3.2 0.2 · 5.0 6.2 · 0.2 1.0 14.0 9.0Bullumwaal 77.4 40 9 · · · · 2.2 2.4 · 0.2 · · · 6.0 · 16.8 0.2 0.2 · · · 0.2 2.8 12.2 · · 5.4 6.4 1.4 0.6 0.4 14.8 5.2Cabbage Tree Creek 92.6 100 6 · · · · 4.6 · · · · · · 7.2 20.4 1.8 · · · · · · 5.0 · · · 3.4 5.4 3.2 · · 27.0 14.6Cann River 103.0 74 8 · · · · 4.6 · · · · · · 8.6 15.6 6.0 1.8 · · · · · 1.2 0.4 · · 5.8 11.4 3.6 · · 36.0 8.0Club Terrace 99.4 84 7 · · · · 5.2 0.8 · · · · · 3.0 11.8 4.6 4.4 · · · · · 0.8 0.4 · · 5.8 10.0 3.6 · · 28.8 20.2Combienbar AWS 139.6 69 9 · · · · 5.0 2.8 0.2 0.2 · · · 1.4 7.0 1.8 1.0 0.2 · · 0.2 · 0.2 2.4 0.2 · 1.6 19.2 4.2 · · 39.2 52.8Combienbar 139.6 · · · · · 4.8 0.8 · · · » » 10.6 4.8 4.2 · · · · · 1.2 3.8 · » » » 23.8 · · 44.0 41.6Dellicknora (Tellicura) 63.2 50 7 · · · · 5.6 5.8 · · · · · 2.2 2.8 7.2 1.0 · · · · · · · · · 1.0 5.2 · · · 15.0 17.4Ensay 53.4 50 7 · · · · 7.0 · · · · · · 4.0 0.8 9.2 0.2 · · · · · 3.0 · · · 2.0 0.4 · 2.8 0.4 12.6 11.0Gabo Island Lighthouse 152.6 100 9 · · · · 3.8 2.8 · · · · · 6.8 13.4 1.0 · · · · · 0.2 · 5.4 · · 40.2 8.0 4.8 · 8.0 44.8 13.4Gelantipy 78.4 50 8 · · · · 5.4 · · · · 0.2 · 4.8 1.4 18.2 0.4 · 0.4 0.2 0.2 0.2 2.6 4.2 0.2 · 1.8 4.8 · 1.8 · 20.4 11.2Genoa (Fools Haven) 195.6 75 10 0.4 0.2 · 0.2 2.8 · 0.4 · 0.2 0.2 0.2 6.0 15.8 0.8 0.2 · 0.2 0.2 · 0.2 · 0.6 0.2 0.2 5.0 55.0 3.4 0.4 · 70.8 32.0Lakes Entrance (Eastern Beach Road) 73.0 · · · · 2.0 · 3.4 0.4 · · · 3.6 4.2 7.4 · · · · · · 3.0 · · · 3.2 6.6 1.4 · · 35.0 2.8Mallacoota 150.0 85 9 · · · · 5.2 0.8 · · 0.8 0.2 · 5.2 19.0 0.2 0.4 · · 0.2 0.4 0.2 · 1.4 · · 17.6 30.0 4.4 · 0.8 56.8 6.4Mount Nowa Nowa 84.8 60 8 · · · · 2.2 · 1.2 · · · · 3.2 1.0 16.2 0.4 · 0.4 0.2 · · 4.6 0.6 · · 6.0 3.2 3.4 · 0.2 22.6 19.4Orbost (Comparison) 73.9 70 7 · · · · 3.8 0.2 0.6 · · · · 2.6 8.4 3.4 1.2 · · 0.2 · · 2.6 0.6 0.2 · 5.4 5.8 1.0 · 1.0 26.7 10.2Orbost 74.8 52 8 0.2 · · · 3.6 0.2 0.6 · 0.2 · · 3.6 8.0 3.4 1.0 · 0.2 0.2 0.2 0.2 3.6 0.4 · 0.2 4.6 5.8 1.4 · 0.4 26.0 10.8Point Hicks (Lighthouse) 89.3 96 6 0.2 · · · 3.6 1.2 · 0.6 0.4 · · 15.0 13.7 0.8 1.4 · · · · · 6.4 7.4 · · 5.3 6.8 2.8 · · 20.2 3.5Tubbut 53.6 44 7 1.0 4.4 10.8 0.8 1.0 6.0 0.8 19.0 9.8Weeragua (Cann River (East Branch) at Ch 155.8 · · · · 4.8 0.8 0.2 · · · · 1.8 7.2 1.8 3.8 · · · 0.4 3.8 · · 4.8 30.8 4.6 · · 39.0 52.0Wonnagatta River @ Waterford 60.6 27 H · · · · 4.8 · · · · · · 8.8 1.4 0.8 · · · · 0.2 0.2 1.8 0.2 · · 8.2 4.8 · 2.8 0.2 17.6 8.8
West Gippsland (85) Total Avg Decile 1 2 3 4 5 6 7 8 9 10 11 12 13 14 15 16 17 18 19 20 21 22 23 24 25 26 27 28 29 30 31Bairnsdale Airport 68.0 47 9 · · · · 3.4 · 0.6 · 0.2 · 0.8 5.8 · 12.0 · 0.2 · 0.4 · · 4.0 · 0.2 · 8.8 6.6 2.0 0.2 1.6 20.4 0.8Boolarra South 105.0 0.4 0.2 1.2 0.2 13.8 8.6 0.4 5.2 0.2 12.4 16.6 13.0 1.2 0.8 0.6 0.2 0.4 0.4 0.2 0.2 2.4 5.0 2.4 4.4 2.6 9.4 2.6Drouin Bowling Club 85.2 92 5 0.2 0.2 0.4 · 12.2 12.0 0.2 8.2 · · 14.0 9.4 5.6 3.4 1.0 · · · · · 0.2 0.8 · · 4.2 1.2 1.0 2.0 4.0 3.0 2.0East Sale Airport 42.0 52 7 · · · 0.2 1.0 · · 0.4 0.2 · 3.4 5.4 1.8 2.4 · · · 0.2 0.2 · 1.8 · · · 7.4 1.0 1.2 0.4 0.2 14.8 ·Erica (Parkers Corner) 110.4 91 8 · · · · 15.0 3.2 1.6 2.4 · · 9.8 7.4 2.0 2.2 0.6 · · · · · 3.6 · · · 9.2 9.0 3.2 1.0 0.8 26.4 13.0Foster Hoddle 104.2 88 8 20.0 » » 22.4 11.6 18.2 4.0 10.0 » » 9.8 8.2Glencairn (Barkly River (Glenview)) 39.6 5.8 0.4 4.0 1.0 0.8 10.0 1.4 1.2 9.0 6.0Glenmaggie Weir 52.9 50 7 · · 6.5 0.4 · · · · · 5.4 9.0 » » 31.6Jindivick 78.0 96 5 0.2 · · · 13.2 4.0 · 8.4 · · 16.2 6.6 4.2 2.8 3.6 · 0.4 0.2 0.4 · · · · · 8.0 1.0 · 2.8 1.6 3.8 0.6Labertouche 56.0 79 3 · · · · 11.5 3.5 · 4.4 · · 11.0 5.8 2.8 3.8 2.4 · · · · · · · · · 6.2 1.2 · 1.0 2.4 · ·Leongatha Sth Gippsland Water 74.0 87 4 · · · · 12.8 16.2 · 4.6 · · 8.2 15.2 3.4 1.0 · · · · · · · · · · 0.8 0.6 · 3.2 5.4 2.4 0.2Lindenow 66.6 53 8 · · · · 4.2 · · · · · » 6.4 · 8.8 · · · · · · 14.2 · · · 9.2 5.3 1.6 · 1.5 13.8 1.6Maffra 40.8 33 7 · · · · 2.6 · · · · · 4.6 1.4 · · · · · · · · 0.6 · · · 9.2 3.6 1.0 · » » 17.8Mirboo North Water Board 86.4 93 5 · · 0.8 · 9.0 6.8 · 5.2 · · 10.4 22.2 10.2 1.4 0.6 · · · · · 1.6 · · · 2.0 2.6 0.4 6.0 3.2 3.6 0.4Mitchell River @ Glenaladale 62.6 35 9 · · · · 8.0 · · · 0.2 0.2 1.0 3.6 · 10.0 0.2 · · 0.2 · · 2.0 0.2 0.2 · 11.6 1.0 0.2 3.2 0.8 16.8 3.2Morwell (Latrobe Valley Airport) 60.4 52 7 · · 0.2 · 9.2 1.0 · 1.6 · · 10.6 4.2 2.8 · · 0.2 · 0.4 0.4 · 0.6 · · · 9.4 3.8 1.0 2.8 1.2 11.0 ·Mount Baw Baw 152.0 103 8 0.2 · · · 14.6 2.6 3.2 2.0 0.2 · 9.2 14.4 14.0 13.0 · · · · · · 1.4 · · · 13.0 2.8 1.0 0.8 1.2 31.2 27.2Mount Moornapa · · ·Mount Tamboritha 96.0 61 9 · · · · 8.8 0.4 · · 0.2 · 2.2 3.6 3.0 0.4 · · · · · · 0.6 0.2 0.2 · 9.2 2.6 · 0.6 0.2 17.2 46.6Mount Useful 40.4 0.2 · 0.2 14.8 · · · · · · · · · · · · · · · · · · · · 10.6 14.6Murderers Hill 126.6 57 9 · · · · 8.2 0.4 1.2 1.6 · 0.2 8.0 3.8 0.2 0.2 0.2 · · 0.2 0.2 · 5.4 · 0.2 · 10.0 16.0 4.8 1.0 1.2 33.2 30.4Noojee (Slivar) 78.0 79 5 0.4 · · · 12.4 3.0 3.2 4.6 0.4 0.4 8.6 5.4 4.2 5.0 0.6 · · · · · · · · · 13.0 0.6 1.0 5.8 0.8 7.2 1.4Pound Creek 78.6 0.4 0.2 1.2 · 18.4 6.4 · 5.2 · 0.2 10.8 18.0 4.6 0.2 1.4 0.4 · 0.2 0.2 0.2 0.2 · · · 0.4 0.8 0.6 1.8 4.2 2.6 ·Reeves Knob 177.2 · · 0.2 · 4.2 · · · · · 0.2 8.2 1.8 5.6 · · · · 0.2 · 10.4 0.2 · 0.2 10.8 44.0 2.4 6.0 · 26.6 56.2Toora 109.2 86 8 » » 0.6 · 13.2 10.2 0.2 · · · 10.2 15.0 3.6 1.4 0.2 · · · · · · · · · 0.2 35.0 0.4 7.8 1.8 » 9.4Traralgon Creek at Koornalla 74.0 58 8 · · · · 5.6 3.0 · 5.4 · · 10.2 13.0 2.8 · · 0.2 · · · · · · · · 6.2 6.0 0.4 10.0 0.8 9.2 1.2Traralgon EPA 55.2 36 9 · · · · 5.8 0.6 · 2.4 · · 9.2 3.4 1.6 0.2 · · · 0.2 · · 3.6 · · · 10.0 3.0 0.6 1.2 0.6 12.6 0.2Willow Grove (Blue Rock Reservoir) 82.3 52 9 » » 0.3 · 12.0 7.0 · » » 4.0 13.0 9.8 1.2 1.4 · · · · · · 2.6 » » » 7.2 5.2 0.6 5.2 » » 12.8Willow Grove 83.2 70 7 · · · · 13.8 4.6 0.8 4.2 0.2 · 14.6 9.0 1.0 1.8 · · 0.6 · · · 5.4 · · · 9.0 5.0 0.4 · 2.0 9.8 1.0Wilsons Promontory Lighthouse 151.2 113 8 · 0.8 1.0 · 61.8 10.6 · 6.0 · · 12.6 12.8 2.4 2.4 · · · · · · · 0.2 · · · 18.2 · 6.4 0.2 15.8 ·Yarram Airport 51.2 · · · · 1.0 1.0 · 0.8 · · 6.0 3.4 2.0 4.2 · · · · · · 0.8 · 0.2 · 5.4 11.8 · 5.8 0.8 7.2 0.8
East Central (86) Total Avg Decile 1 2 3 4 5 6 7 8 9 10 11 12 13 14 15 16 17 18 19 20 21 22 23 24 25 26 27 28 29 30 31Bundoora (Latrobe University) 35.2 50 4 · · · · 7.6 2.4 · 3.0 · · 3.6 0.4 1.2 1.0 · · · · · · · · · · 10.2 2.8 · 0.6 2.0 0.4 ·Cerberus 57.2 62 5 0.2 · 1.2 · 9.6 3.0 · 4.4 · · 6.8 8.8 6.2 4.4 1.2 0.2 · 0.2 0.2 0.2 0.4 · · · 1.6 · · 0.8 6.4 1.4 ·Cheltenham Kingston Centre 32.7 69 2 · · · · 6.2 1.8 · 8.5 · · 4.6 3.2 1.0 0.8 · · · · · · · · · · · 3.0 · · 3.6 · ·Coldstream 52.6 61 4 · · · · 10.8 1.2 · 4.4 · · 5.2 3.0 5.6 1.2 0.2 · 0.2 · · · · · 0.2 · 11.8 1.8 · 5.4 1.6 · ·Cranbourne Botanic Gardens 64.9 62 5 0.4 · 0.6 · 9.4 4.8 · 12.0 0.1 · 7.4 7.4 3.2 » 3.6 0.2 · 0.4 · 0.2 · · · · 2.6 · 0.2 0.9 10.8 0.7 ·Croydon (Council Depot) 59.4 84 3 · · · · 11.6 3.4 · » » 3.8 6.2 2.6 8.4 1.6 · · · · · · · · · · 11.6 4.2 · 1.4 » » 4.6Epping 37.6 54 4 · · · · 6.4 2.2 · 3.6 · 3.4 · 1.2 · 2.4 · · · · · · · · · · 10.6 · · · 5.0 2.8 ·Essendon Airport 26.6 49 3 · 0.2 · · 3.4 0.6 · 2.8 · · 3.2 · · 2.8 0.2 · 0.2 · · · · · · · 7.6 2.2 · 1.4 1.6 0.4 ·Ferny Creek (Dunns Hill) 93.0 86 6 · · · · 14.8 5.8 · 9.4 · · 12.8 11.2 15.0 5.4 0.6 · · · · · · · · · 7.2 1.6 · 1.2 7.0 1.0 ·Flemington Racecourse 26.2 50 3 · · · · 2.4 1.6 0.2 4.4 0.2 · 3.6 0.2 · 2.4 · · · · · · · · · · 5.0 2.2 0.2 1.0 2.4 0.4 ·Glen Waverley (Golf Course) 58.2 71 4 · · · · 12.4 3.6 · 12.6 · · 5.6 3.8 3.0 1.2 · · · · · · · · · · 6.2 3.0 · 0.6 5.6 0.6 ·Healesville (Valley View Farm) 59.4 0.4 · · · 13.4 0.8 0.6 7.4 · · 7.4 2.6 5.4 2.8 0.8 0.2 · · · · · · · · 10.2 1.6 0.4 2.8 2.0 0.6 ·Kinglake West 57.0 86 4 1.0 · · · 9.0 3.2 0.2 2.0 · · 4.8 2.2 4.4 4.2 · · · · · · · · · · 8.4 4.0 0.4 1.2 9.8 » 2.2Lilydale 53.0 80 4 1.0 · · · 9.4 1.0 1.8 3.4 · · 5.6 2.0 6.0 3.4 · · · · · · · · · · 11.2 3.8 1.2 1.2 2.0 · ·Main Ridge 84.7 · · · 3.0 8.4 5.8 · · · 7.8 » 29.6 5.8 7.0 1.0 · · · · · · · · · 2.4 · · · 6.0 3.9 4.0Melbourne Airport 31.4 40 4 0.2 · · · 2.2 1.4 · 3.0 · · 3.0 · 0.2 1.2 · 0.2 · · · · · · · · 13.2 2.2 · 0.8 3.0 0.6 0.2Melbourne Regional Office 25.0 56 2 · · · · 4.2 2.2 · 4.8 · · 3.8 · 0.2 1.0 · · · · · · · · · · 4.2 1.8 · 0.4 1.8 0.6 ·Mitcham 52.4 84 3 0.6 10.0 4.2 4.4 4.8 1.2 3.8 1.6 0.2 0.2 9.2 3.8 1.0 5.0 2.4Monbulk (Bulb Farm) 54.6 98 3 · · 0.4 · 11.4 5.6 · 7.2 · · 7.6 · 5.8 2.4 · · · · · · · · · · 7.6 · » 2.6 2.8 1.2 ·Moorabbin Airport 40.8 70 2 0.4 · · · 7.4 5.8 · 9.0 · · 5.6 2.8 1.4 0.4 · · · · · · 0.6 · · · 2.2 0.6 · 0.4 3.8 0.4 ·Mornington 63.8 69 5 » » 1.6 · 9.6 0.4 · » » 4.6 13.4 11.4 11.6 1.8 » » 0.4 0.2 · · 0.6 » » 0.2 0.2 · · 0.4 » » 7.4Oakleigh (Metropolitan Golf Club) 36.9 70 2 8.0 3.0 7.6 » 10.3 2.6 » 5.4Phillip Island Penguin Reserve 59.4 68 4 · 1.6 · » 6.4 8.2 3.2 6.2 0.2 » 8.6 7.8 2.6 5.0 1.0 · · » 0.4 · · · · · 1.2 · · 0.6 5.2 1.2 ·Prahran (Como House) 29.8 59 2 » » 1.8 · 4.0 2.0 · · · · 9.6 0.8 0.8 1.2 · · · · · · · · · · 4.0 2.2 · · » » 3.4Preston Reservoir 30.4 58 3 5.6 2.0 2.0 2.8 3.2 1.6 0.2 8.8 3.0 0.6 0.6Rhyll 70.6 65 6 0.2 0.2 0.2 · 9.6 16.8 · 9.4 0.2 · 7.8 12.6 2.2 3.0 0.6 · · 0.4 0.2 · · · · · 1.0 · 0.2 2.6 3.0 0.4 ·Rosebud (Country Club) 56.0 81 4 1.0 0.6 0.4 · 6.4 2.4 · 3.2 · · 12.2 13.2 5.4 0.6 0.6 · · · · · · · · · 1.0 · · 0.2 5.6 3.2 ·Scoresby Research Institute 56.4 89 2 0.4 · · · 10.0 2.8 0.2 6.2 · · 6.4 2.2 8.4 1.0 · · · 0.2 · 0.2 · · · · 6.2 3.4 0.2 1.2 7.0 0.4 ·Springvale Necropolis 59.3 82 3 · · · · 13.0 7.1 · · · · 18.8 6.1 3.0 · · · · · · · 0.3 · · · · 6.0 · · » » 5.0Toorourrong Reservoir (Toorourrong) 43.2 68 3 0.2 0.2 10.4 1.0 0.2 0.4 5.0 0.6 2.4 3.2 0.4 8.8 1.8 0.6 0.4 5.0 2.4 0.2Ventnor (Oaklands) 61.4 78 4 1.4 0.2 8.0 9.8 0.4 7.2 7.8 6.6 3.2 5.0 0.8 1.6 0.2 0.2 0.2 4.6 4.2Viewbank (ARPANSA) 45.0 49 5 0.6 · · · 9.4 3.2 · 3.6 0.2 · 4.2 0.8 2.2 1.0 · 0.2 0.2 0.2 · 0.2 · 0.2 · · 10.4 3.6 · 0.6 3.6 0.6 ·Wallan (Kilmore Gap) 52.8 58 6 0.2 0.2 · · 6.4 0.4 1.6 0.6 · · 4.8 0.2 0.8 4.4 · 0.2 0.2 0.2 · · 0.2 · 0.2 · 10.0 3.4 · 3.0 11.8 3.8 0.2Warburton (O'Shannassy Reservoir(Quarte
55.4 127 2 15.4 0.8 3.0 3.8 7.6 3.0 5.0 1.6 0.8 7.4 0.8 0.8 2.0 2.4 1.0
Wonthaggi 90.7 97 5 0.4 0.4 2.0 · 25.8 9.0 0.2 7.6 · · 15.4 12.2 2.4 1.4 0.8 · · · · 1.0 0.2 · · · 0.5 0.2 · 2.8 6.0 2.4 ·Yan Yean 47.0 56 5 0.4 0.2 10.4 0.4 1.0 2.4 0.2 4.2 0.2 2.0 2.6 0.2 12.0 4.2 0.2 1.4 3.0 1.8 0.2
West Central (87) Total Avg Decile 1 2 3 4 5 6 7 8 9 10 11 12 13 14 15 16 17 18 19 20 21 22 23 24 25 26 27 28 29 30 31Altona (City Offices) 25.3 50 3 » » » » 5.9 » » » » » » 11.2 » » » » 2.2 · · · · · · · 3.0 » » » » » 3.0
Monthly Weather Review Victoria May 2010
page 16

Daily and total rainfall for May 2010Total is the total precipitation for May 2010; a missing total indicates there is concern about the quality of some of the daily values. Avg isthe long-term average total precipitation for May. Decile is the decile rank of total precipitation for May 2010 in the climate record of otherMay totals; “L” indicates this is the lowest on record, and “H” it is the highest on record. Long-term average and decile rank are only shown ifthere are sufficient years of climate record available. Reports of zero precipitation are shown as “· ”. When a reading was accumulated overmore than one day, “»” is shown on the days that are part of the accumulation.Avalon Airport 29.2 35 5 · · · · 4.2 0.2 · 1.6 · · 3.8 · 0.2 0.6 · 0.2 · · 0.2 · 6.6 0.2 · 0.2 2.8 1.0 · · 3.4 4.0 ·Ballan 52.8 60 5 · · · · 10.6 1.2 0.8 3.6 · · 5.0 1.0 0.6 1.2 · · · · · · 0.8 · · · 9.6 3.4 0.2 · 6.6 8.0 0.2Bannockburn 29.0 43 4 · · · · 5.0 0.6 · · » 0.8 4.8 0.4 · 1.4 · · · · · · 4.0 · · · 0.8 · · » 4.8 » 6.4Barwon Heads Golf Club 39.4 1.0 4.2 0.8 1.4 3.2 5.2 3.4 1.6 2.8 6.2 1.2 4.4 4.0Blackwood 64.0 91 4 · · · · 11.8 1.4 · 1.8 · · 3.2 0.8 0.4 0.6 · · · · · · 1.2 0.4 · · 10.0 4.2 0.2 · 17.6 8.2 2.2Clifton Springs 35.4 · · 0.4 · 4.4 0.8 · 3.0 · · 4.2 » 6.2 2.6 1.0 · · · · 0.2 0.4 · · · 1.4 · · · 4.0 6.8 ·Durdidwarrah 72.2 58 8 0.2 · 0.2 · 9.0 1.4 0.2 7.0 · · 5.8 5.2 0.2 1.2 0.2 · 0.2 0.2 0.2 · 10.8 0.2 · 0.2 2.8 2.6 · · 9.8 13.8 0.8Grovedale (Geelong Airport) 28.8 47 5 · · · · 3.2 0.2 · 0.4 · · 2.6 0.4 0.2 0.2 0.6 0.2 · 0.2 · · 10.2 · 0.2 · 1.2 · · 0.2 3.8 5.0 ·Lancefield 48.4 65 5 · · · · » 6.0 · 1.0 · · 2.2 · · · · · 0.4 · · · 0.8 · · · 14.2 4.6 » » 17.2 1.8 0.2Laverton RAAF 23.2 47 3 · · · · 5.4 2.0 · 4.2 · · 2.4 · · 0.2 · · · · · · · · · · 3.0 1.2 · 0.4 3.6 0.8 ·Meredith (Darra) 54.8 56 6 · · · · 9.2 1.2 · 7.0 · · 4.6 2.2 0.6 1.4 · 0.2 · · · · 5.2 · · · 2.2 1.8 0.2 · 6.6 11.8 0.6Meredith 20.0 57 1 6.0 14.0Moorabool River at Lal Lal 47.8 38 7 0.2 · · · 12.4 1.6 0.2 3.0 0.2 · 3.6 1.2 1.4 0.4 0.2 · · · · · 2.0 · · · 5.4 2.0 · 0.4 6.4 6.4 0.8Moorabool River at Morrisons 23.2 33 4 12.4 1.4 2.4 4.4 1.6 0.4 0.6Sheoaks 44.4 31 8 0.2 0.4 0.2 · 5.4 · · 4.2 · · 4.4 3.6 0.2 0.2 · 0.2 0.2 · · · 6.6 0.2 · 0.2 0.2 0.8 · · 4.0 13.0 0.2
North Central (88) Total Avg Decile 1 2 3 4 5 6 7 8 9 10 11 12 13 14 15 16 17 18 19 20 21 22 23 24 25 26 27 28 29 30 31Acheron River @ Taggerty 37.2 51 5 · · · · 9.2 1.0 0.2 2.8 · · 2.8 0.8 0.2 · · · · · · · · · · · 6.6 3.0 · 0.8 9.0 0.8 ·Alexandra (Post Office) 43.8 64 4 · · · · 13.8 1.2 0.6 » » 4.0 3.4 · · · · · · · · · · · · · 9.2 2.0 · 1.0 » » 8.6Avenel (Post Office) 44.8 56 5 · · · · 6.2 · · 1.2 · · 1.6 · · · · · · · · · · · · · 5.6 3.6 0.4 1.0 23.0 2.2 ·Broadford (Kilmore North) 49.7 · · · · 4.8 0.2 · · · · 4.0 · · · 1.0 · · · · · · · · · 12.2 4.6 · 5.0 15.8 1.8 0.3Bullarto South 59.0 · · 15.0 2.0 · 4.0 · 4.0 1.0 1.0 1.0 · · 1.0 · 9.0 1.0 1.0 15.0 2.0 2.0Cairn Curran Reservoir 35.6 50 4 0.2 · · · 4.2 · · 2.0 · · 1.8 · · · · · 0.2 · · · · · · · 13.0 5.8 0.4 0.8 4.8 2.4 ·Castlemaine Prison 45.4 58 5 · · · 3.0 · 0.6 3.8 · · 2.2 0.2 0.2 · · · · · · · · · · · · 11.4 6.6 0.8 14.4 2.0 0.2 ·Clunes 43.8 55 5 · · · · 8.2 · 1.2 2.4 · · 3.2 · 0.6 · · · · · · · · 0.2 · · 12.4 0.4 · 1.0 13.6 0.6 ·Daylesford 59.6 88 4 15.2 2.4 1.0 » » 3.4 3.4 0.6 0.4 13.4 0.8 » » 19.0Eildon Fire Tower 52.0 55 5 0.4 · · · 12.4 1.8 1.2 6.6 0.2 · 1.8 1.8 0.2 0.4 0.2 0.4 0.2 · · · 0.2 · · · 8.8 3.6 · 2.2 8.8 0.8 ·Heathcote 59.8 57 6 · · · · 5.8 · 0.2 0.4 · · 1.0 · · · · · · · · · · · · · 12.8 8.4 · 15.6 14.4 1.2 ·Kinglake West (Wallaby Creek) 67.2 110 3 0.2 0.2 11.4 1.4 0.6 2.6 0.4 0.2 6.2 1.0 7.8 4.0 0.4 0.2 0.2 0.2 12.2 4.2 0.2 1.0 10.8 1.6 0.2Kyneton 46.6 74 4 » » » 0.4 2.2 2.0 · 4.8 0.2 · 2.0 0.2 0.4 · 0.2 · 0.2 · · · 1.2 0.2 · · 12.6 3.2 0.2 3.0 12.2 1.0 0.4Lake Eildon 50.2 79 4 · · · · 11.4 4.2 1.8 4.2 · · 2.0 0.4 · 0.2 0.2 0.2 · 0.2 0.2 0.2 0.2 0.2 · · 9.8 5.6 0.2 1.6 6.8 0.6 ·Mangalore Airport 37.0 55 4 · · · · 6.2 · 0.2 0.4 · 1.0 0.2 · · 0.2 · 0.2 · · · · 0.2 · · 6.8 3.2 0.4 1.0 14.2 2.8 ·Maryborough 45.4 49 6 · · · · 8.8 0.4 0.5 1.3 · · 2.4 0.4 · · · 0.1 · · · · · · · 0.2 12.3 6.1 0.3 1.1 8.4 2.9 0.2Marysville Golf Course 72.0 · · 25.0 6.0 7.0 · · 7.0 5.0 · · · 1.0 · · · · · · · 6.0 1.0 · 4.0 9.0 1.0 ·Redesdale 58.4 57 6 0.2 · · · 3.6 0.2 0.2 1.6 · · 0.6 0.2 0.2 · 0.2 0.2 · · · · 0.2 · · · 18.0 9.4 · 3.2 18.6 1.8 ·Strath Creek 44.2 58 5 0.2 0.2 · · 5.4 0.4 0.4 1.2 · · 2.2 0.4 0.2 0.2 0.2 0.2 0.2 · · 0.2 · · · · 12.4 2.0 0.2 1.4 15.8 0.8 ·Trentham (Post Office) 58.0 104 3 · · · · 7.6 1.6 0.4 · · · · 4.2 0.4 0.6 · · · · · · · · · · 12.2 3.2 0.2 · 22.8 3.2 1.6
Western Plains (89) Total Avg Decile 1 2 3 4 5 6 7 8 9 10 11 12 13 14 15 16 17 18 19 20 21 22 23 24 25 26 27 28 29 30 31Ararat Prison 23.3 53 3 · · · 0.4 2.2 1.8 · 3.4 · · 4.8 · · · · · · · · · · · · 0.4 2.4 0.6 · · 2.5 4.6 0.2Ballarat Aerodrome 33.2 65 2 0.2 · · · 7.4 1.0 · 1.6 · · 3.0 1.0 0.6 0.2 · · · · · · 0.2 · · · 3.4 4.0 · 0.8 8.4 1.4 ·Balmoral (Post Office) 30.2 61 2 · · · · 1.0 1.8 0.6 4.2 1.0 · 4.6 0.4 · 0.2 · · · · · · · · · 0.2 5.0 · · · 9.6 1.2 0.4Beaufort 55.8 62 5 · · · · 12.4 2.2 · · · · 8.8 11.4 · · · · · · · · · · · · 2.4 » » » 13.0 » 5.6Cavendish (Post Office) 26.2 60 2 · · · · 3.0 1.8 0.2 2.6 0.8 · 5.2 0.4 0.2 · · · · · · · · · · 0.4 0.4 0.4 · · 4.8 5.0 1.0Cressy · 0.4 · · 9.2 0.8 · 2.0 · · 6.0 5.6 0.8 0.6 · · · · · · · · · · · · · · 4.8 8.0 0.4Derrinallum (Post Office) 42.8 59 4 0.2 0.8 0.2 · 14.4 1.4 0.2 2.0 · 0.2 5.8 2.2 0.4 0.4 0.2 · 0.2 · 0.2 · 0.2 · · 0.2 6.0 0.4 · 0.2 2.0 3.6 1.4Dunkeld 22.8 65 1 » 7.2 1.8 10.6 » 3.2Glenthompson 23.5 51 3 · · · 0.9 · 6.2 · · · · 5.8 0.9 0.6 · · · · · · · · » » 0.4 2.3 · · · » » 6.4Leigh River @ Mount Mercer · ·Lismore (Post Office) 33.8 54 4 · » 0.8 · 10.8 1.6 · 2.2 · · 5.0 2.6 · 0.4 · · · · · · · · » 0.4 3.2 0.2 · · 3.6 » 3.0Rokewood (Wurrook South) 21.7 44 3 » 7.5 5.6 8.6Skipton Post Office 39.0 56 4 · · 1.0 0.4 6.0 1.8 · · · 5.8 5.4 0.8 0.4 0.6 · · · · · · · · · · 2.4 · · · 7.0 5.6 1.8Warrambine Ck at Warrambine 35.6 36 6 · 0.4 · 0.2 9.8 1.0 · 1.2 · 0.2 4.6 4.8 0.2 0.4 · · · · · · 0.6 · · · 0.6 0.4 0.2 · 3.0 7.8 0.2Westmere 27.8 0.2 0.2 · · 4.2 0.6 · 3.4 0.2 · 5.8 1.4 0.2 0.4 · · · · 0.2 · · 0.2 · · 2.8 · · · 1.0 6.4 0.6Wickliffe 25.7 50 2 · 0.6 · » 4.8 0.4 · 2.0 · · 4.0 0.6 · · · · · · · · · · · · 3.6 0.8 · 3.2 2.3 3.0 0.4Willaura (Main Street) 24.4 48 2 · · · · 4.0 0.4 · 5.2 · · 3.2 · · · · · · · · · · · · · 3.8 · · 1.4 3.2 » 3.2
West Coast (90) Total Avg Decile 1 2 3 4 5 6 7 8 9 10 11 12 13 14 15 16 17 18 19 20 21 22 23 24 25 26 27 28 29 30 31Aireys Inlet 47.6 47 6 0.2 · · · 3.4 0.6 · 1.0 · · 5.0 0.6 · 1.6 2.6 · · 0.2 · 0.2 9.4 · · · 2.4 0.8 · · 3.0 16.6 ·Apollo Bay 93.0 97 5 0.8 1.4 0.2 · 14.8 5.2 0.6 5.8 0.2 0.2 14.8 8.4 4.2 4.4 0.2 0.2 0.2 0.2 0.8 0.4 10.8 · 0.2 · · 6.4 » » » » 12.6Benwerrin 94.4 78 7 · 0.4 · · 8.2 · 1.8 9.4 · 0.2 8.2 5.4 0.4 2.2 2.0 0.2 0.2 0.2 0.2 1.8 20.2 · · · 3.2 4.4 0.2 · 3.4 21.4 0.8Birregurra (Post Office) 31.2 62 3 · · · · 6.0 · · » » 1.8 7.0 4.0 » 0.8 · · · · · · 0.8 · · · 1.4 1.0 · · » » 8.4Boonah 87.4 65 9 0.2 0.2 0.2 · 9.0 3.8 0.2 4.8 0.2 · 9.6 3.0 0.4 5.2 0.2 0.6 0.4 0.4 0.4 0.2 23.2 · · · 4.2 1.8 · · 2.8 16.0 0.4Camperdown 35.5 · · · · 6.0 3.4 · » » 2.0 7.5 6.2 1.0 · · · · · · · · · · · 4.0 · 0.4 · » » 5.0Cape Nelson Lighthouse 61.6 65 6 0.6 · · 3.4 5.6 2.8 2.4 1.8 1.8 0.4 19.2 2.2 1.4 1.0 0.2 · · 0.4 · · 5.2 0.2 · 0.2 3.6 0.2 · · 1.2 4.2 3.6Cape Otway Lighthouse 90.2 91 6 0.2 1.6 · · 20.8 8.6 · 4.8 · · 18.0 6.0 1.6 2.4 0.4 · · · · · 14.0 · · · · 1.8 · · 3.4 4.0 2.6Caramut 36.2 53 3 5.2 2.0 5.2 0.6 0.2 11.6 3.0 0.6 0.4 2.8 1.0 1.4 2.2Casterton Showgrounds 54.1 61 5 · · · 0.4 5.5 1.6 1.2 1.6 0.4 · 6.2 1.4 · · 0.2 0.2 0.2 0.2 0.4 0.4 0.2 0.2 0.2 0.8 5.4 0.4 · 0.2 3.4 22.4 1.0Casterton 49.2 · · · 1.4 3.6 2.0 1.0 2.8 0.6 · 8.8 1.4 0.4 · · 0.2 · · 0.2 · · · · 0.2 1.8 0.2 · · 3.2 20.8 0.6Cobden (Post Office) 41.0 81 2 · · 0.4 · 5.6 3.2 · » » 2.8 » 20.8 1.0 0.4 · · · · · · 0.6 · · · 3.0 0.4 » » » » 2.8Colac (Mount Gellibrand) 42.6 36 7 0.4 0.2 · · 10.2 0.8 · 2.8 0.2 · 9.4 3.0 0.4 0.6 · 0.2 0.2 0.2 0.2 · 0.2 · · · 0.4 0.2 · · 3.4 9.6 ·Coleraine Hospital 40.3 57 4 5.2 1.8 1.0 » » 5.0 4.8 1.4 0.6 0.1 1.8 » » 18.6Forrest State Forest 77.0 97 4 » » 0.6 · 12.0 5.6 2.4 » » 6.4 9.8 9.0 3.4 0.4 · · · · · · · · · · · · · · » » 27.4Haines Junction (Mount Sabine) 155.4 114 9 0.8 0.4 · 0.2 15.0 8.8 8.2 11.8 0.2 0.4 10.8 9.6 5.2 4.4 1.2 0.2 0.2 0.2 · 0.2 9.4 · 0.2 · 0.8 16.4 0.4 4.0 37.6 8.8Hamilton Airport 28.6 49 3 · · · 0.2 4.6 1.2 0.4 3.6 0.2 · 5.4 0.8 0.2 0.2 · 0.2 · · · · 0.2 0.2 · · 0.2 0.2 · 0.2 3.8 5.2 1.6Hawkesdale (Post Office) 31.2 65 1 · · · · 3.8 2.4 · 1.4 · · 10.6 3.2 0.4 0.4 · · · · · · · · » 0.2 1.6 · · · 1.6 » 5.6Koroit 19.2 77 1 » 2.4 » » » · · 0.6 » 0.4 ·Lorne (Mount Cowley) 110.0 85 8 · 0.4 · 0.2 5.2 0.8 6.8 14.6 0.2 · 10.4 6.2 1.2 2.4 1.4 0.2 · · 0.2 · 15.8 · · · 5.0 13.0 0.4 · 3.2 19.2 3.2Merino 56.6 71 4 · · · 3.2 10.4 3.6 2.8 0.8 · · 5.2 1.8 · · · · · · · · · · · 1.2 6.4 · · · 5.0 14.6 1.6Mortlake Racecourse 31.8 47 3 · 0.4 · · 4.4 2.6 · 4.4 · 0.2 9.6 3.2 0.2 0.4 · · 0.2 · · 0.2 · · 0.2 · 2.6 · 0.2 1.2 0.4 0.8 0.6Nelson 53.2 80 3 · · · 2.8 3.0 3.2 2.2 2.4 0.4 0.2 15.0 4.2 » 0.8 · · · 0.2 · · · · · · 1.0 0.2 · · 1.0 12.0 4.6Penshurst (Post Office) 42.0 69 3 · 0.2 · · 5.0 2.6 0.6 6.0 0.8 · 11.4 1.2 0.4 · 0.2 · · · · · · · · 1.0 4.0 0.6 · · 1.8 4.2 2.0Port Fairy AWS 58.2 60 5 0.2 · · 0.2 17.2 5.0 0.4 3.0 · 0.2 18.2 3.4 0.6 0.4 · 0.2 · 0.2 · · · · · · 5.2 · · · 0.4 3.2 0.2Portland (Cashmore Airport) 79.6 76 7 0.4 0.4 · 5.0 10.0 3.6 1.6 6.4 1.0 0.4 26.2 1.4 1.8 2.0 · 0.2 · 0.4 · 0.2 1.2 0.2 · 0.4 2.2 · · 1.0 1.0 8.2 4.4Terang 44.2 74 2 · · · · 4.4 2.2 · 10.2 · · 9.6 9.6 1.2 · · · · · · · · · · · 4.0 · · · 3.0 · ·Warrnambool Airport NDB 39.0 62 2 0.4 0.2 · 0.2 6.4 3.0 · 5.4 · · 12.6 4.4 1.2 · 0.2 · 0.2 · 0.2 · 0.2 · · · 1.0 · · · 0.4 2.8 0.2Warrnambool Golf Club 46.4 · · · · 11.5 · · · 21.0 · · 9.5 · · · · · · · · · · · · 1.0 · · · · 3.4 ·Weeaproinah 180.6 197 5 0.8 1.4 0.2 · 21.0 14.6 9.2 26.4 0.2 0.4 17.6 19.6 9.4 5.0 0.2 0.2 0.2 0.4 0.2 0.4 3.0 0.6 · · 1.0 4.6 1.0 0.4 7.6 25.6 9.4
Monthly Weather Review Victoria May 2010
page 17