Embed Size (px)
Citation preview
Contents www.bmbi.co.uk [email protected] @theBMBI
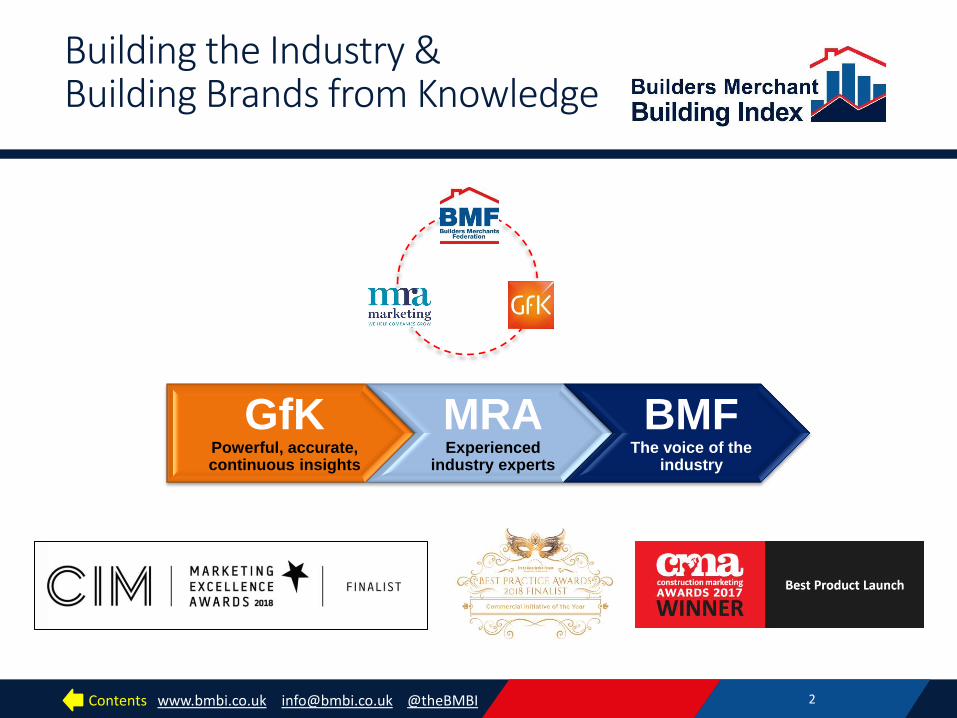
Building the Industry & Building Brands from Knowledge
GfK Powerful, accurate, continuous insights
MRA Experienced
industry experts
BMF The voice of the
industry
2
Retain CMA logo for now
same
Contents www.bmbi.co.uk [email protected] @theBMBI 3
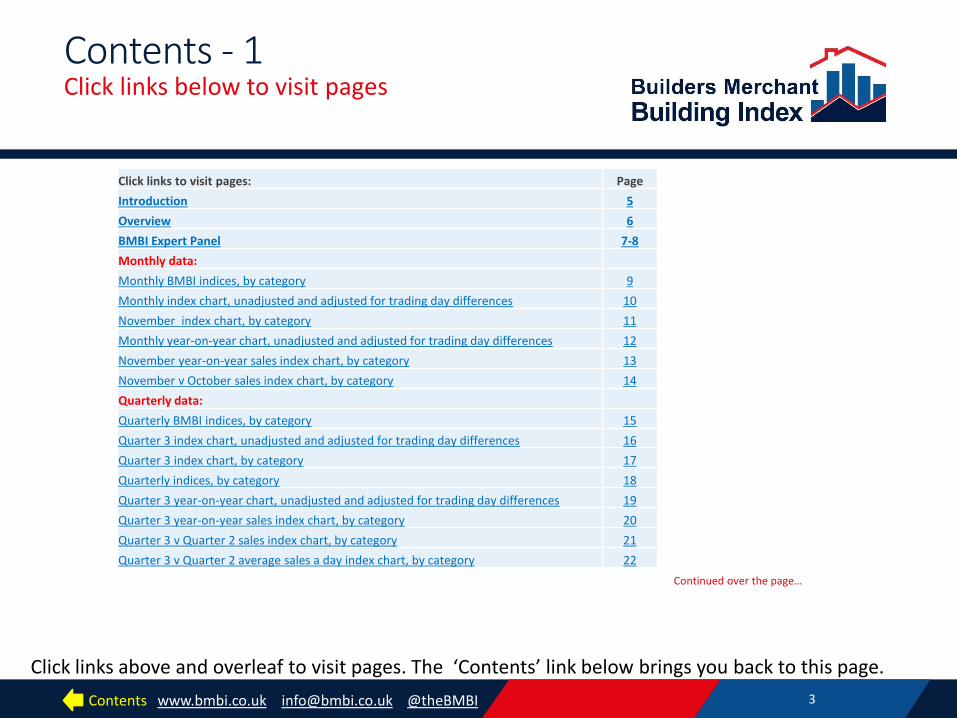
Click links to visit pages: Page
Introduction 5
Overview 6
BMBI Expert Panel 7-8
Monthly data:
Monthly BMBI indices, by category 9
Monthly index chart, unadjusted and adjusted for trading day differences 10
November index chart, by category 11
Monthly year-on-year chart, unadjusted and adjusted for trading day differences 12
November year-on-year sales index chart, by category 13
November v October sales index chart, by category 14
Quarterly data:
Quarterly BMBI indices, by category 15
Quarter 3 index chart, unadjusted and adjusted for trading day differences 16
Quarter 3 index chart, by category 17
Quarterly indices, by category 18
Quarter 3 year-on-year chart, unadjusted and adjusted for trading day differences 19
Quarter 3 year-on-year sales index chart, by category 20
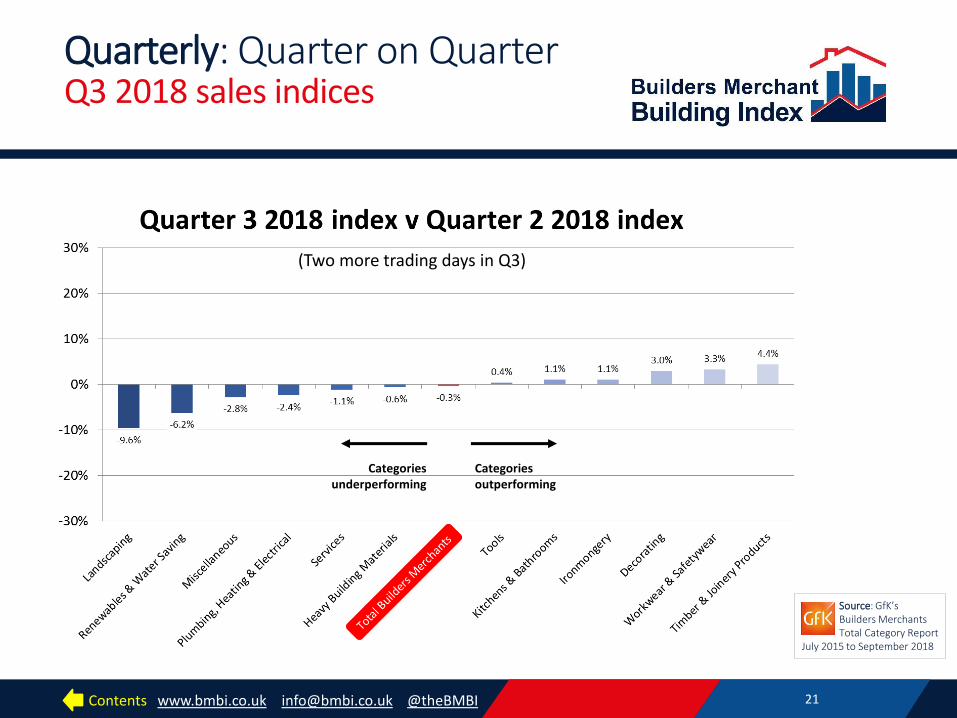
Quarter 3 v Quarter 2 sales index chart, by category 21
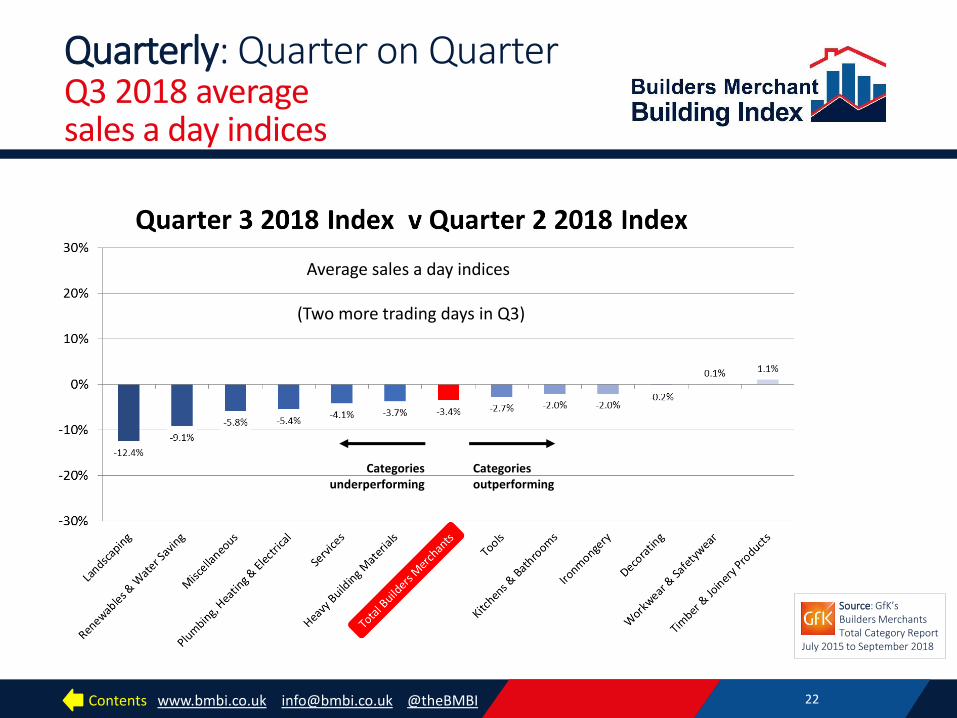
Quarter 3 v Quarter 2 average sales a day index chart, by category 22
Continued over the page…
Click links above and overleaf to visit pages. The ‘Contents’ link below brings you back to this page.
Contents - 1 Click links below to visit pages
Remember to update month
labels!
Remember to update quarter
labels!
Contents www.bmbi.co.uk [email protected] @theBMBI 4
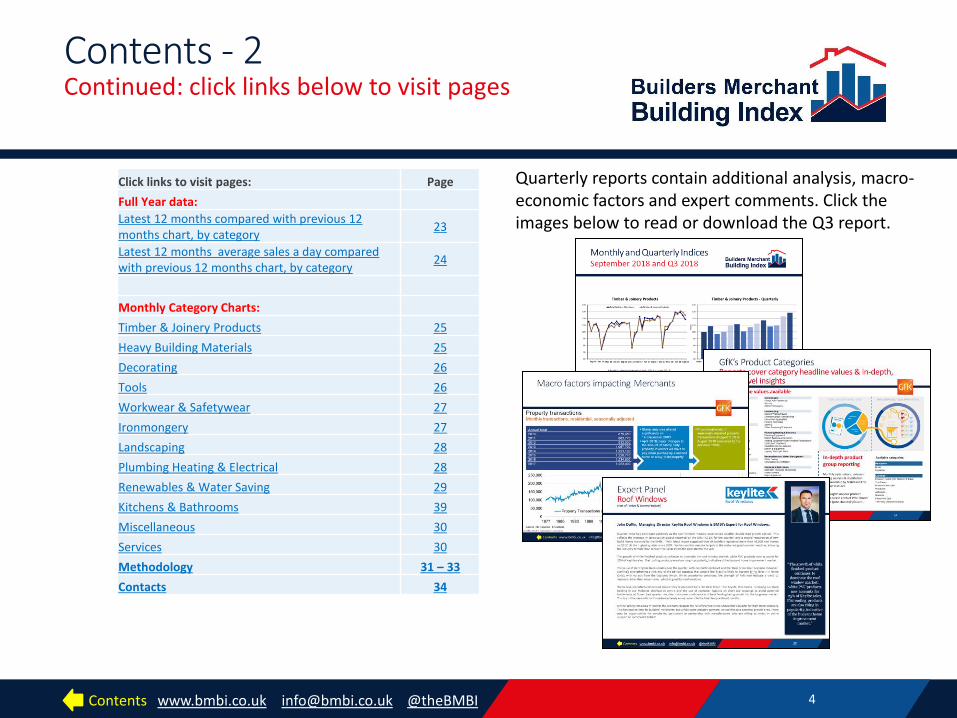
Click links to visit pages: Page
Full Year data:
Latest 12 months compared with previous 12 months chart, by category
23
Latest 12 months average sales a day compared with previous 12 months chart, by category
24
Monthly Category Charts:
Timber & Joinery Products 25
Heavy Building Materials 25
Decorating 26
Tools 26
Workwear & Safetywear 27
Ironmongery 27
Landscaping 28
Plumbing Heating & Electrical 28
Renewables & Water Saving 29
Kitchens & Bathrooms 39
Miscellaneous 30
Services 30
Methodology 31 – 33
Contacts 34
Quarterly reports contain additional analysis, macro-economic factors and expert comments. Click the images below to read or download the Q3 report.
Contents - 2 Continued: click links below to visit pages
Image settings: SIZE Set all to 4.5cm high POSITIONS Top: 15.27, 6.35 (chart) Mid right: 18.68, 9.29 (GfK categories) Mid left: 13.86, 9.86 (Macro factors) Bottom: 15.99, 12.87 (Expert) REMEMBER: • Edit links • Update text ref to latest quarter
Contents www.bmbi.co.uk [email protected] @theBMBI
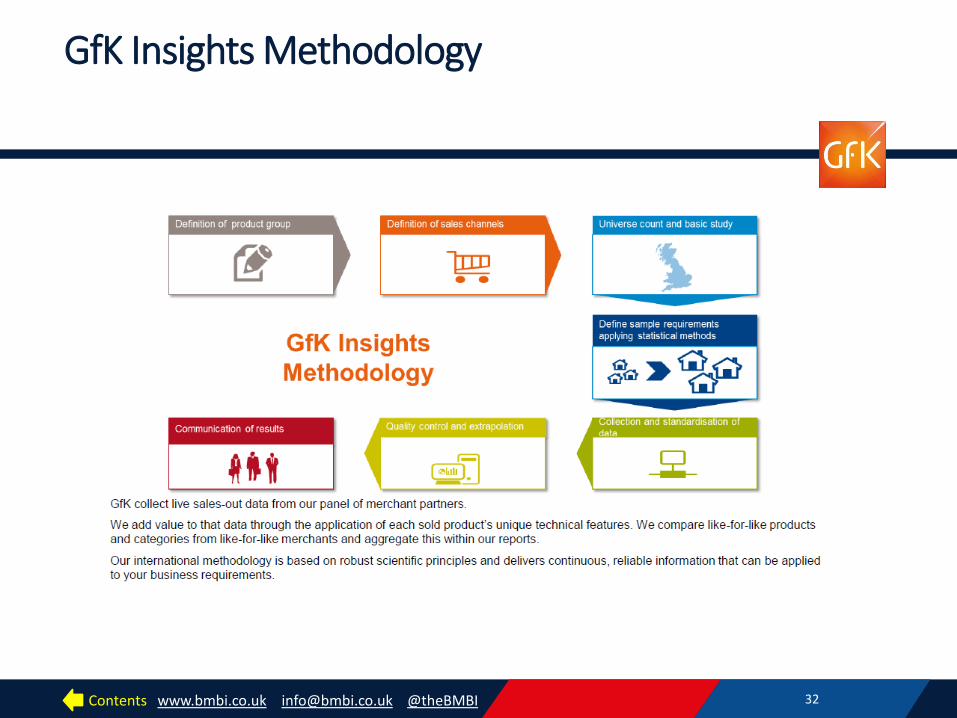
This Builders Merchant Building Index (BMBI) report contains data from GfK’s ground-breaking Builders Merchants Panel, which analyses data from over 80% of generalist builders’ merchants’ sales throughout Great Britain. GfK’s Builders Merchant Point of Sale Tracking Data sets a gold standard in reliable market trends. Unlike data from sources based on estimates, or sales from suppliers to the supply chain, this up-to-date data is based on actual sales from merchants to builders and other trades. BMBI trend data is indexed on the 12 month period July 2014 to June 2015. The monthly series tracks what is happening in the market month by month and includes an in-depth review every quarter. This trend series gives the industry access to far more accurate and comprehensive insights than that available to other construction sectors. MRA Marketing produces the Builders Merchant Building Index, a brand of the BMF, to communicate to the wider market as the voice of the industry as well as the voice of individual Expert Brands: The Crystal Group, Keylite Roof Windows, Timbmet, Alumasc Water Management Solutions, Hanson Cement, IKO PLC, Keystone Lintels, Knauf Insulation, Encon Insulation, Ibstock, Talasey Group, Heatrae Sadia, Dulux Trade and Lakes, who provide valuable commentary on market trends and influences. Meet the BMBI Experts on pages 7 and 8. More data available This BMBI report provides valuable top-level indices but there’s considerably more data available. GfK insights go much deeper and include sales value data. GfK can quantify market values and drill down into contributing categories, tracing product group performance, to focus on aspects that are critical to you. GfK can also produce robust like-for-like market comparability tailored to the requirements of an individual business. As more merchants join to submit their monthly sales-out data the quality of this information can only become more extensive and rigorous. Merchants or suppliers who are interested in acquiring data or getting involved should contact Richard Frankcom at [email protected].
The BMBI website enables you to compare Landscaping trends with Heavy Building Materials, or Kitchens with Timber on our interactive charts. Download current and past reports, read the news or search through comments or blogs at www.bmbi.co.uk. Follow us and the Experts @theBMBI.
Introduction
5
This Builders Merchant Building Index (BMBI) report contains data from GfK’s ground-breaking Builders Merchants Panel, which analyses data from over 80% of generalist builders’ merchants’ sales throughout Great Britain. GfK’s Builders Merchant Point of Sale Tracking Data sets a gold standard in reliable market trends. Unlike data from sources based on estimates, or sales from suppliers to the supply chain, this up-to-date data is based on actual sales from merchants to builders and other trades. BMBI trend data is indexed on the 12 month period July 2014 to June 2015. The monthly series tracks what is happening in the market month by month and includes an in-depth review every quarter. This trend series gives the industry access to far more accurate and comprehensive insights than that available to other construction sectors. MRA Marketing produces the Builders Merchant Building Index, a brand of the BMF, to communicate to the wider market as the voice of the industry as well as the voice of individual Expert Brands: Crystal Direct, Keylite Roof Windows, Timbmet, Alumasc Water Management Solutions, Hanson Cement, IKO PLC, Keystone Lintels, Knauf Insulation, Encon Insulation, Ibstock, Natural Paving Products and Heatrae Sadia, who provide valuable commentary on market trends and influences. More data available This BMBI report provides valuable top-level indices but there’s considerably more data available. GfK insights go much deeper and include sales value data. GfK can quantify market values and drill down into contributing categories, tracing product group performance, to focus on aspects that are critical to you. GfK can also produce robust like-for-like market comparability tailored to the requirements of an individual business. As more merchants join to submit their monthly sales-out data the quality of this information can only become more extensive and rigorous. Merchants or suppliers who are interested in acquiring data or getting involved should contact Richard Frankcom at [email protected].
The BMBI website enables you to compare Landscaping trends with Heavy Building Materials, or Kitchens with Timber on our interactive charts. Download current and past reports, read the news or search through comments or blogs at www.bmbi.co.uk. Follow us and the Experts @theBMBI.
same
Contents www.bmbi.co.uk [email protected] @theBMBI
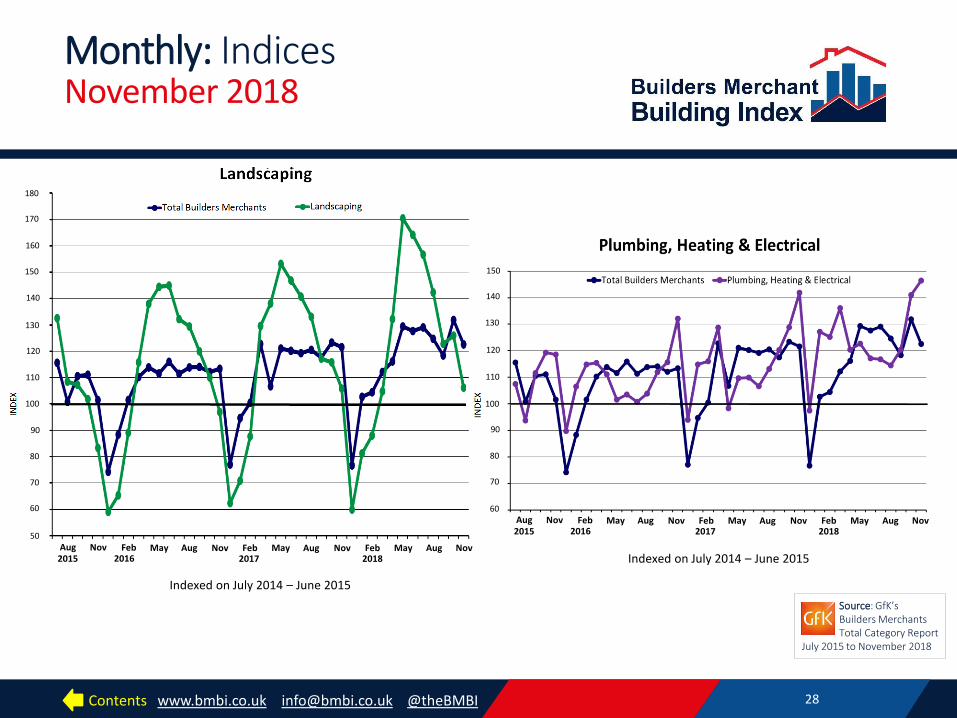
Plumbing Heating & Electrical (+3.3%)
had its highest monthly sales since
BMBI started in July 2014.
Overview
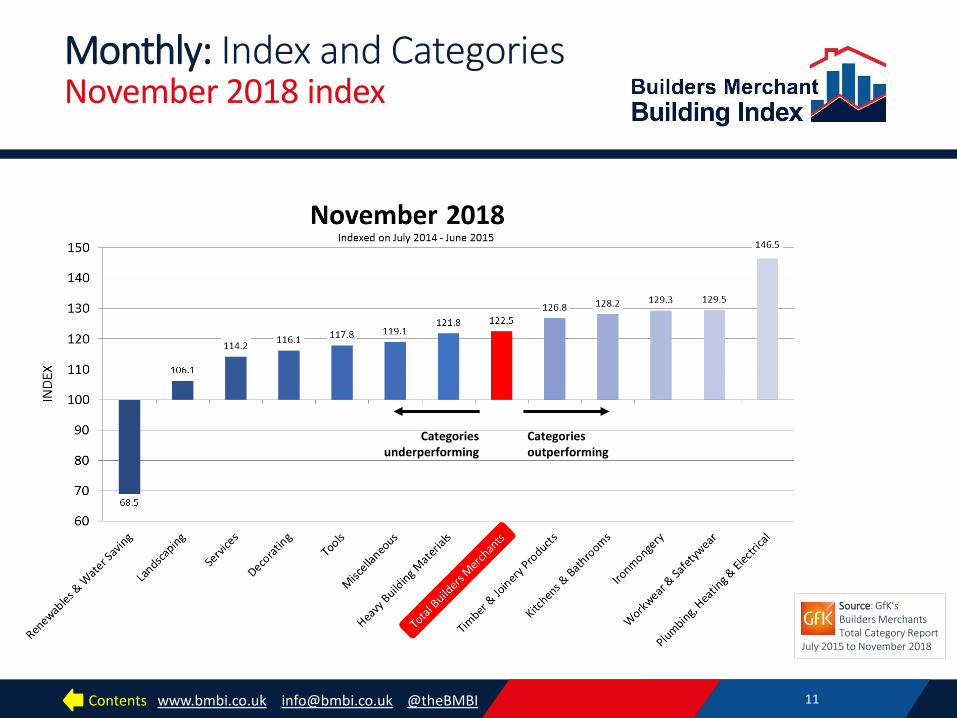
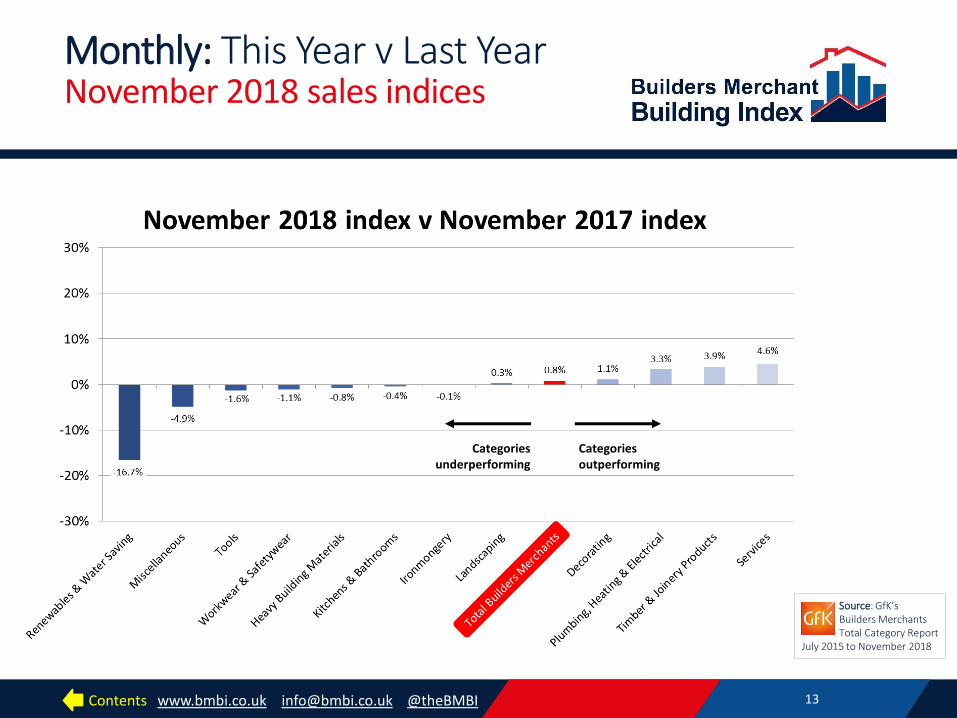
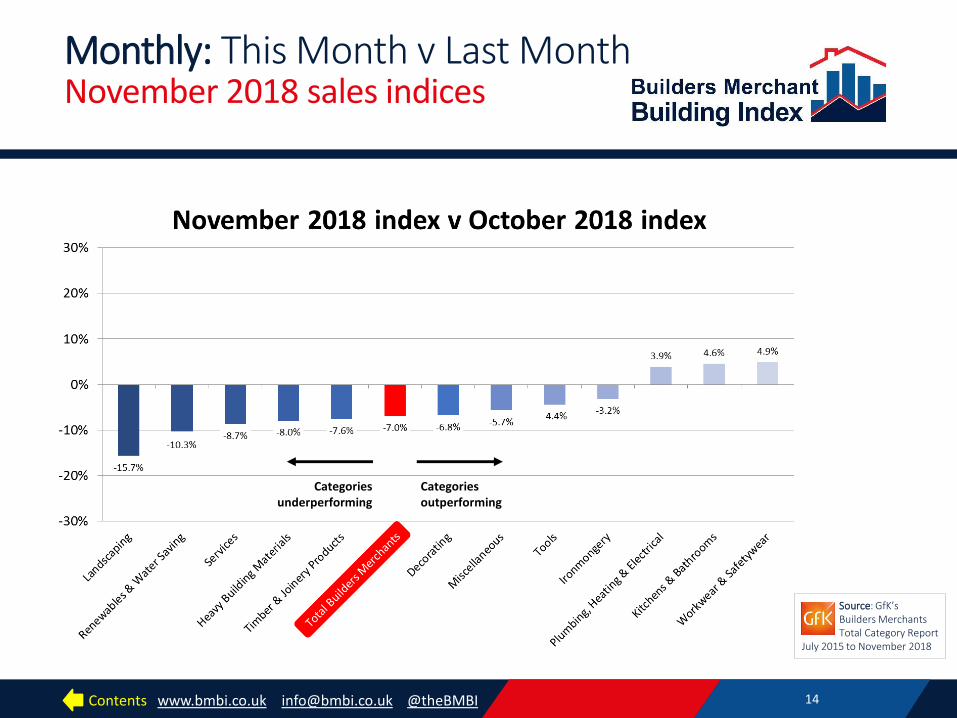
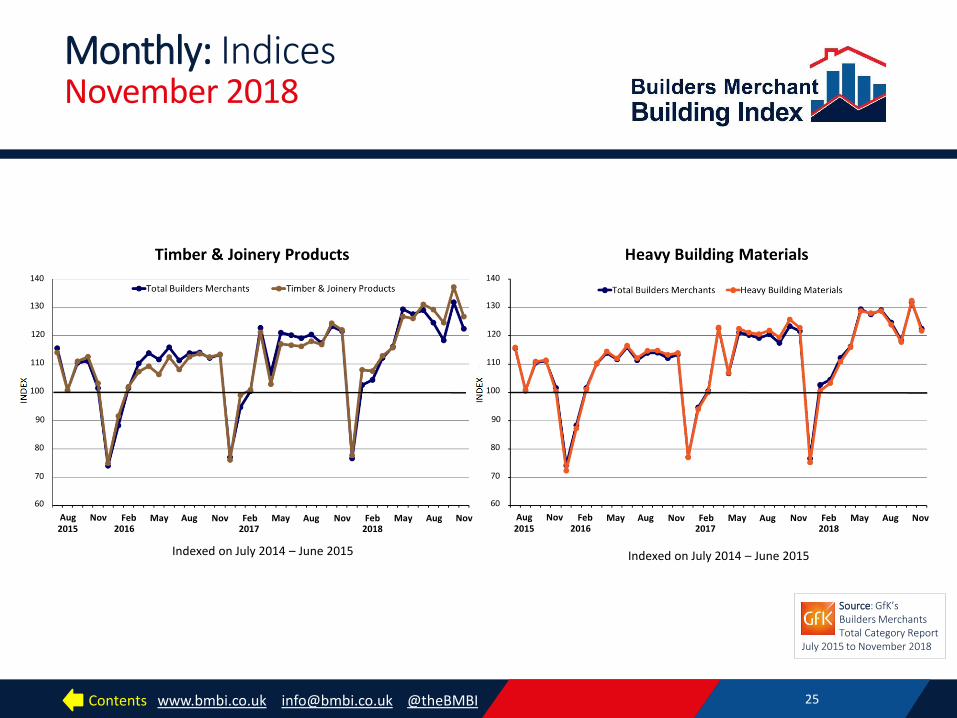
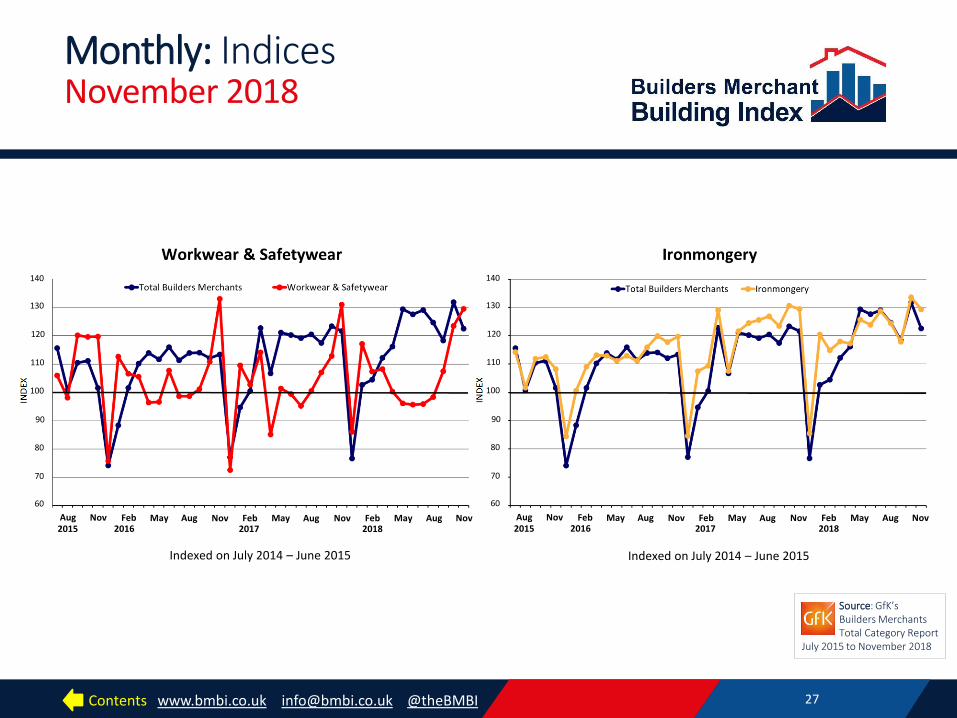
Weaker November propped up by robust Timber & Joinery Products sales Year on year Total Builders Merchant value sales were up 0.8% in November compared with November 2017. Four categories did better, including Timber & Joinery Products (+3.9%), the second-largest category. Plumbing Heating & Electrical (+3.3%) had its highest monthly sales since BMBI started in July 2014. Seven categories sold less this year, but three had falls of less than 1%: Ironmongery (-0.1%), Kitchens & Bathrooms (-0.4%) which, despite the decline , had its best monthly sales in 2018, and largest category Heavy Building Materials (-0.8%). Month on month Overall November sales were 7.0% lower than October. The last three years have seen sales drop between October and November but the reduction was higher this year. However October 2018 had the highest value sales since BMBI started and this will have contributed to the larger month-on-month fall. Workwear & Safetywear (+4.9%) was one of only three categories that sold more, along with Kitchens & Bathrooms (+4.6%) and Plumbing Heating & Electrical (+3.9%). Seasonal category Landscaping (-15.7%) was weakest. Other periods The eleven months January to November 2018 were 4.0% ahead of the same period in 2017. Plumbing Heating & Electrical was strongest (+7.7%) with Timber & Joinery Products (+7.2%) close behind. The rolling 12 months December 2017 to November 2018 were 3.7% above the same 12 months a year earlier, with one less trading day. Plumbing Heating & Electrical (+7.5%) was strongest. Average sales a day in the period were 4.2% higher. Index November’s BMBI index was 122.5 with one additional trading day. Plumbing Heating & Electrical was top (146.5). The average sales a day index for November was 115.6.
6
ok

Contents www.bmbi.co.uk [email protected] @theBMBI
The Expert Panel Speaking for their markets - 1
The Builders Merchant Building Index (BMBI) includes a growing panel of industry Experts. In each quarterly report they comment on the market, with a particular focus on the story behind the trends. Experts are leading brands, or brands aspiring to become leaders, who are the voice of their markets.
The Q3 2018 report, which includes commentary from our experts is available here
Expert for PVC-U Windows & Doors Steve Halford Group Managing Director The Crystal Group
Read latest Comment: Q3 2018 Report
Expert for Roof Windows John Duffin Managing Director Keylite Roof Windows
Read latest Comment: Q3 2018 Report
Expert for Timber & Panel Products Nigel Cox Managing Director Timbmet
Read latest Comment: Q3 2018 Report
Expert for Civils, Metal Rainwater & Drainage
(New Expert to be announced) Alumasc Water Management Systems
Read latest Comment: Q3 2018 Report
Expert for Cement & Aggregates Andrew Simpson National Commercial Director Hanson Cement
Read latest Comment: Q3 2018 Report
Expert for Roofing Products Paul Owen Commercial Director Distribution IKO PLC
Read latest Comment: Q3 2018 Report
7
Meet the Builders Merchant Building Index Experts:
Remember to update text in links (no need
to edit the link)

Contents www.bmbi.co.uk [email protected] @theBMBI
The Expert Panel Speaking for their markets - 2
Expert for Steel Lintels Derrick McFarland Managing Director Keystone Lintels
Read latest Comment: Q3 2018 Report
Expert for Mineral Wool Insulation John Sinfield Managing Director Knauf Insulation
Read latest Comment: Q3 2018 Report
Expert for Insulation Products - Distribution
Mike Beard Merchant Development Director Encon Insulation
Read latest Comment: Q3 2018 Report
Expert for Bricks Tony France Sales Director Ibstock
Read latest Comment: Q3 2018 Report
Expert for Water Heating Paul Rivett Managing Director Heatrae Sadia
Read latest Comment: Q3 2018 Report
Expert for Natural Stone Landscaping Products,
Vitrified Paving & Artificial Grass
Malcolm Gough Group Sales & Marketing Director Talasey Group
Read latest Comment: Q3 2018 Report
Expert for Paint Paul Roughan Trade Merchants Sales Director Dulux Trade
Read latest Comment: Q3 2018 Report
Additional experts will be joining the panel in 2018
Click here to find out more about the BMBI Experts and their sectors
8
Remember to update text in links (no need
to edit the link)
Expert for Shower Enclosures and Showering
Mike Tattam Sales & Marketing Director Lakes
Read latest Comment: Q3 2018 Report
Add background image or wash to Mike
Remember to edit the link if an expert
changes
Contents www.bmbi.co.uk [email protected] @theBMBI
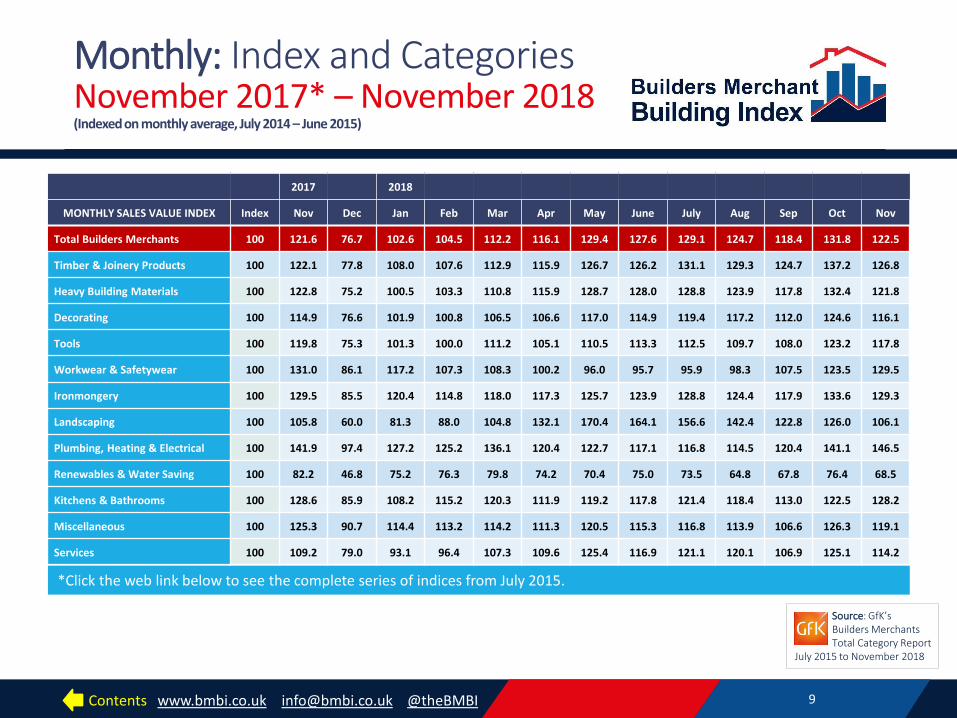
Monthly: Index and Categories November 2017* – November 2018 (Indexed on monthly average, July 2014 – June 2015)
9
Source: GfK’s Builders Merchants Total Category Report July 2015 to November 2018
*Click the web link below to see the complete series of indices from July 2015.
Use Excel template to update table layout – adding next month and deleting first month Adjust table to fit: • H=10.39 • W=22.86 • Position
1.27, 4.6 • Text to
Calibri 9pt bold
• Alight figures to middle
2017 2018
MONTHLY SALES VALUE INDEX Index Nov Dec Jan Feb Mar Apr May June July Aug Sep Oct Nov
Total Builders Merchants 100 121.6 76.7 102.6 104.5 112.2 116.1 129.4 127.6 129.1 124.7 118.4 131.8 122.5
Timber & Joinery Products 100 122.1 77.8 108.0 107.6 112.9 115.9 126.7 126.2 131.1 129.3 124.7 137.2 126.8
Heavy Building Materials 100 122.8 75.2 100.5 103.3 110.8 115.9 128.7 128.0 128.8 123.9 117.8 132.4 121.8
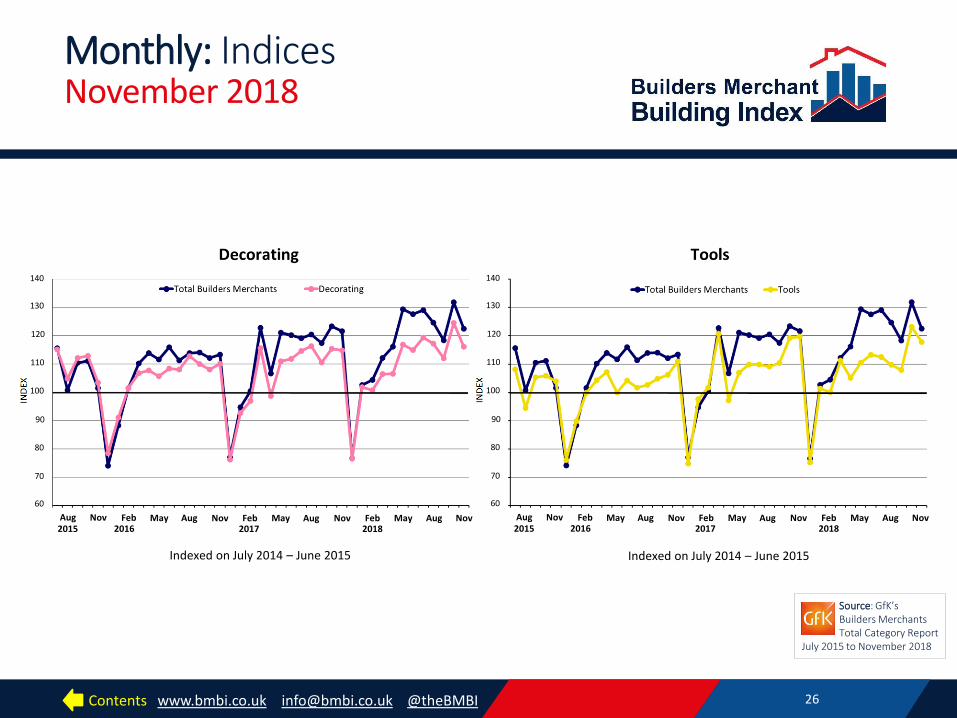
Decorating 100 114.9 76.6 101.9 100.8 106.5 106.6 117.0 114.9 119.4 117.2 112.0 124.6 116.1
Tools 100 119.8 75.3 101.3 100.0 111.2 105.1 110.5 113.3 112.5 109.7 108.0 123.2 117.8
Workwear & Safetywear 100 131.0 86.1 117.2 107.3 108.3 100.2 96.0 95.7 95.9 98.3 107.5 123.5 129.5
Ironmongery 100 129.5 85.5 120.4 114.8 118.0 117.3 125.7 123.9 128.8 124.4 117.9 133.6 129.3
Landscaping 100 105.8 60.0 81.3 88.0 104.8 132.1 170.4 164.1 156.6 142.4 122.8 126.0 106.1
Plumbing, Heating & Electrical 100 141.9 97.4 127.2 125.2 136.1 120.4 122.7 117.1 116.8 114.5 120.4 141.1 146.5
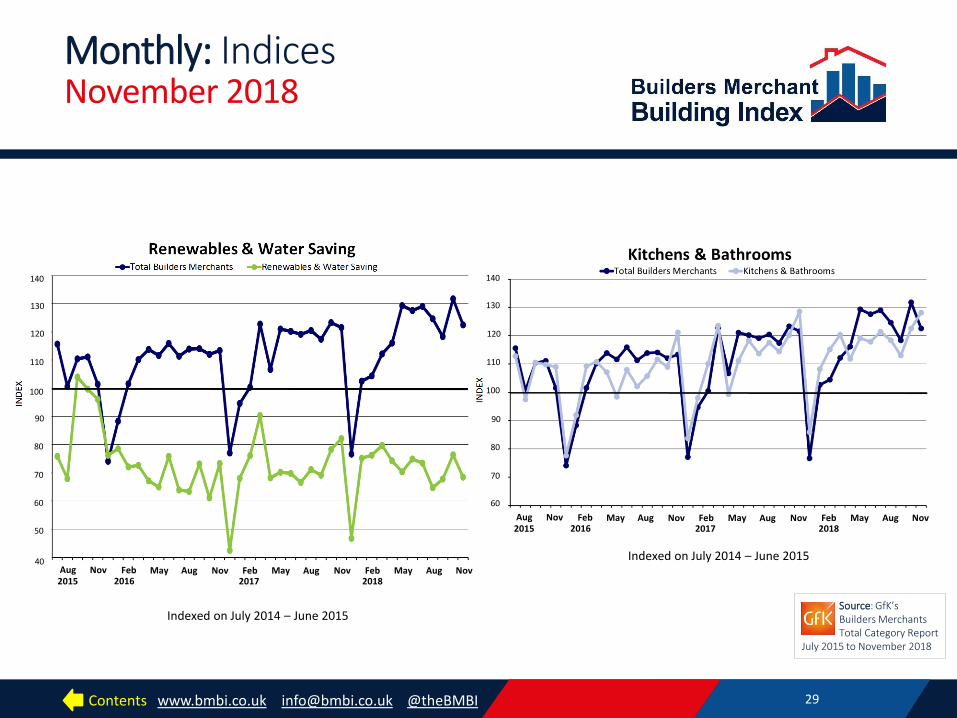
Renewables & Water Saving 100 82.2 46.8 75.2 76.3 79.8 74.2 70.4 75.0 73.5 64.8 67.8 76.4 68.5
Kitchens & Bathrooms 100 128.6 85.9 108.2 115.2 120.3 111.9 119.2 117.8 121.4 118.4 113.0 122.5 128.2
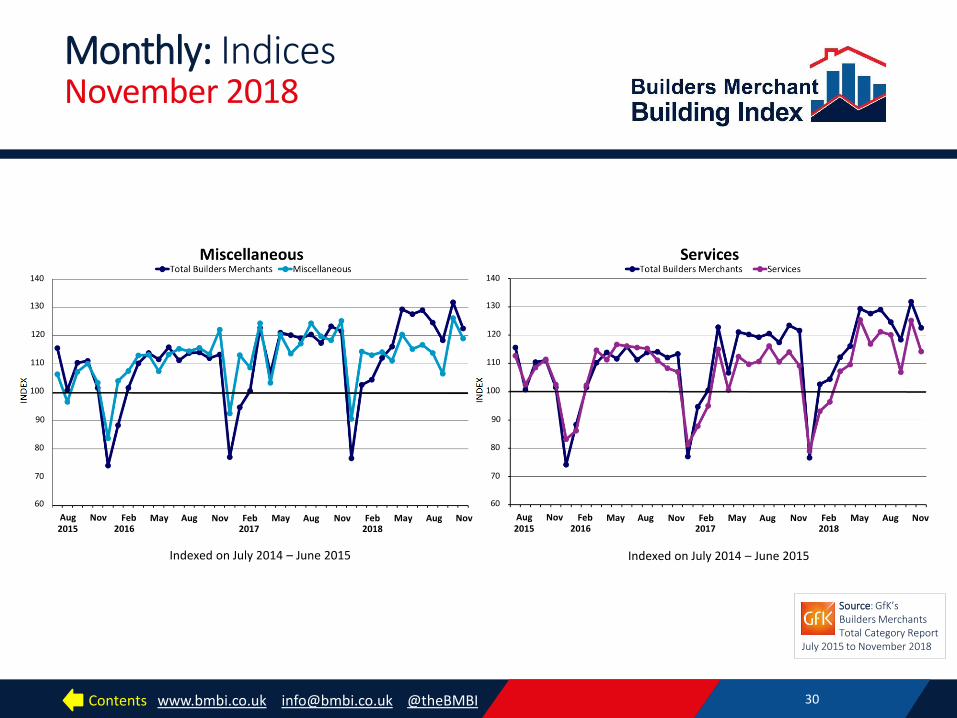
Miscellaneous 100 125.3 90.7 114.4 113.2 114.2 111.3 120.5 115.3 116.8 113.9 106.6 126.3 119.1
Services 100 109.2 79.0 93.1 96.4 107.3 109.6 125.4 116.9 121.1 120.1 106.9 125.1 114.2
Contents www.bmbi.co.uk [email protected] @theBMBI
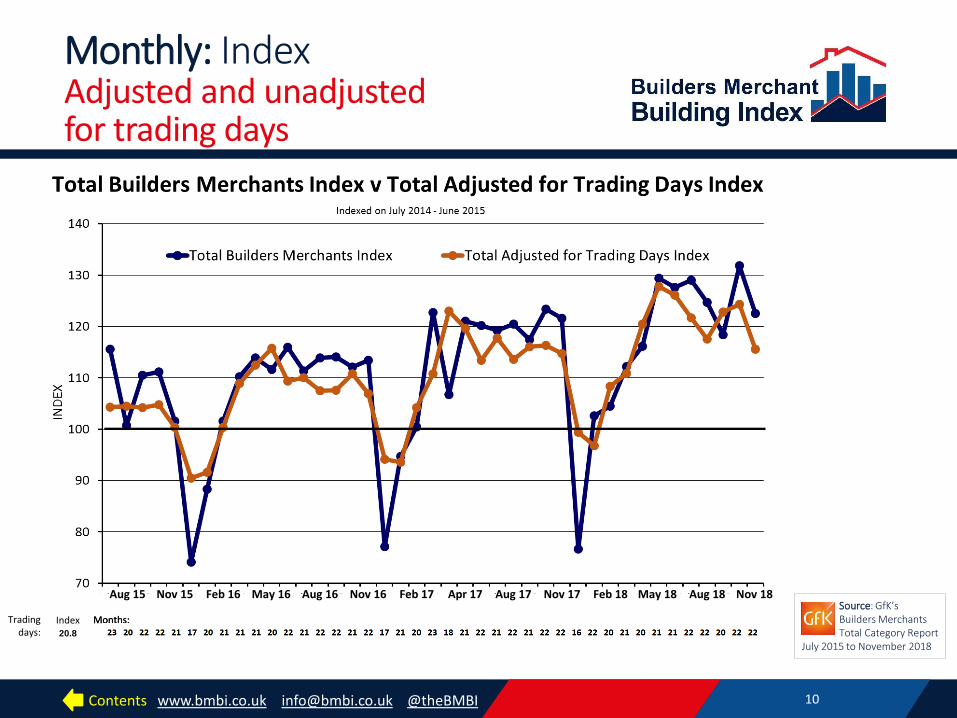
Monthly: Index Adjusted and unadjusted for trading days
10
1) Paste chart 2) Set height to 12.7, 3) Set horizontal to 1.07,
vertical to 3.8 4) Crop from the top to
fit 5) Send to the back 6) Manually change the
months and reposition, so the current month always visible. Add another month at the start when required
7) Add another cell to trading days table on spreadsheet, snip (don’t copy and paste – snip is clearer) and set W=17.6, Hor=2.7, V=16.53. Send to back.
Trading days:
Source: GfK’s Builders Merchants Total Category Report July 2015 to November 2018
Index 20.8
Months:
Aug 18 May 18 Feb 18 Nov 17 Aug 17 Apr 17 Feb 17 Nov 16 Aug 16 May 16
Months:
Feb 16 Nov 18 Nov 15 Aug 15
Contents www.bmbi.co.uk [email protected] @theBMBI
Monthly: Index and Categories November 2018 index
11
1) Paste chart 2) Set height to 13.3 3) Set horizontal to
0.64, vertical to 4.45 4) Send to back to
reveal ‘over / underperforming’ graphic
Source: GfK’s Builders Merchants Total Category Report July 2015 to November 2018
Categories outperforming
Categories underperforming
Contents www.bmbi.co.uk [email protected] @theBMBI
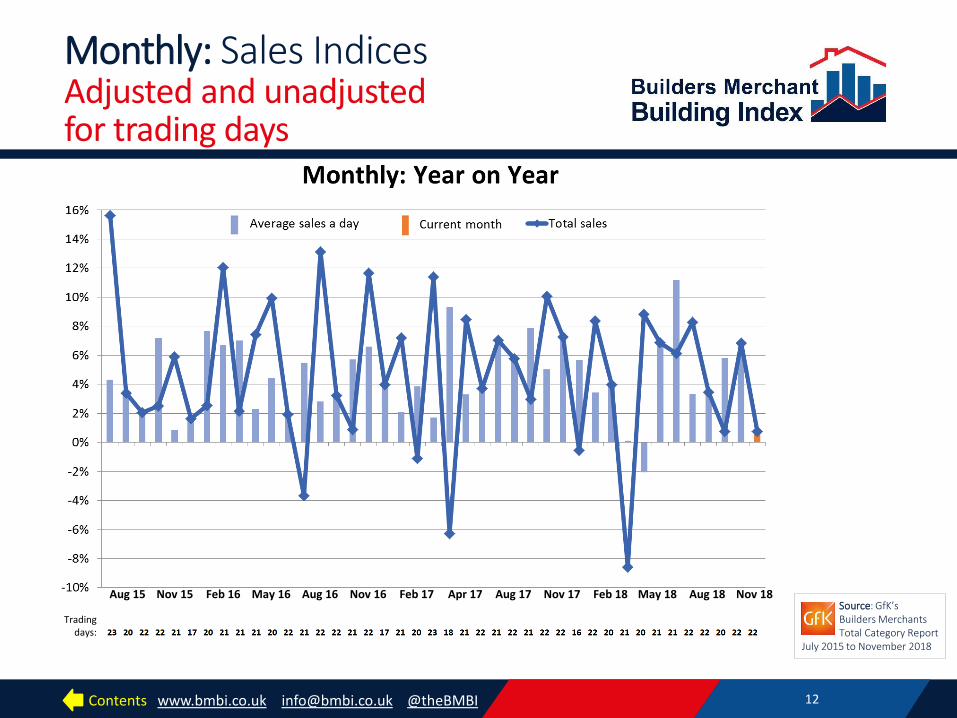
Monthly: Sales Indices Adjusted and unadjusted for trading days
12
1) Paste chart 2) Set height to 12.44 3) Set horizontal to 1.56,
vertical to 3.88 4) Crop top to fit 5) Send to back 6) Copy month labels
and trading days from Index chart (so current month visible)
7) Copy trading days
Source: GfK’s Builders Merchants Total Category Report July 2015 to November 2018
Trading days:
Aug 18 May 18 Feb 18 Nov 17 Aug 17 Apr 17 Feb 17 Nov 16 Aug 16 May 16 Feb 16 Nov 18 Nov 15 Aug 15
Contents www.bmbi.co.uk [email protected] @theBMBI
Monthly: This Year v Last Year November 2018 sales indices
13
1) Paste chart 2) Set height to 13.3 3) Set horizontal to
0.64, vertical to 4.45
4) Send to back to reveal ‘under / over performing’ graphic and reposition graphic as required
Source: GfK’s Builders Merchants Total Category Report July 2015 to November 2018
1 more trading day this year
Categories outperforming
Categories underperforming
2 more trading days this year
Contents www.bmbi.co.uk [email protected] @theBMBI
Monthly: This Month v Last Month November 2018 sales indices
14
1) Paste chart 2) Set height to 13.3 3) Set horizontal to
0.64, vertical to 4.45
Source: GfK’s Builders Merchants Total Category Report July 2015 to November 2018
Categories outperforming
Categories underperforming
2 more trading days this month
2 less trading days this month
Contents www.bmbi.co.uk [email protected] @theBMBI
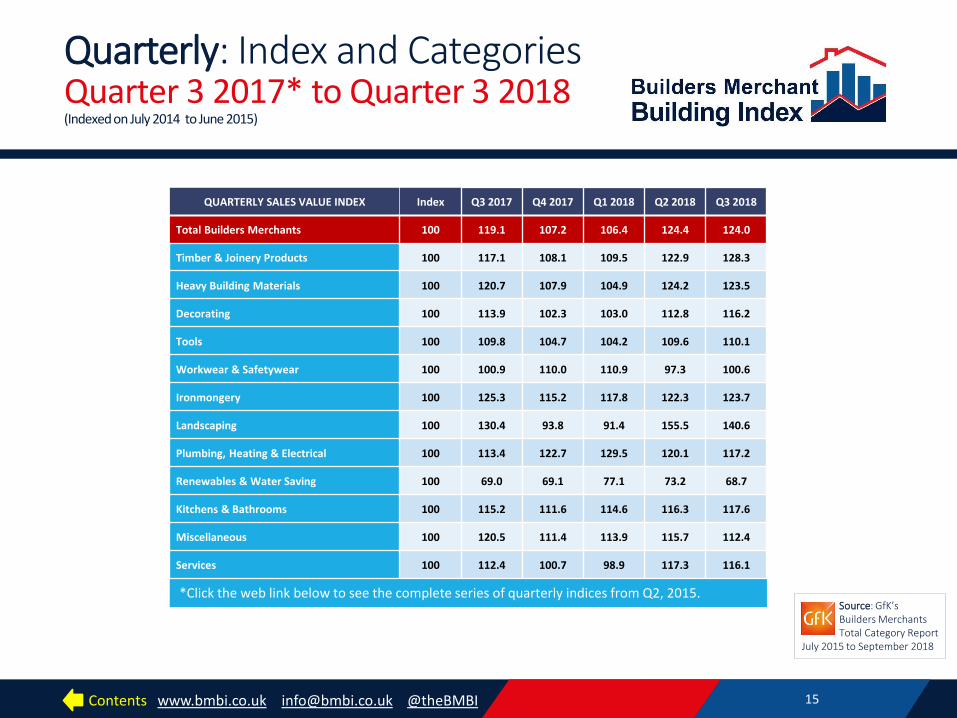
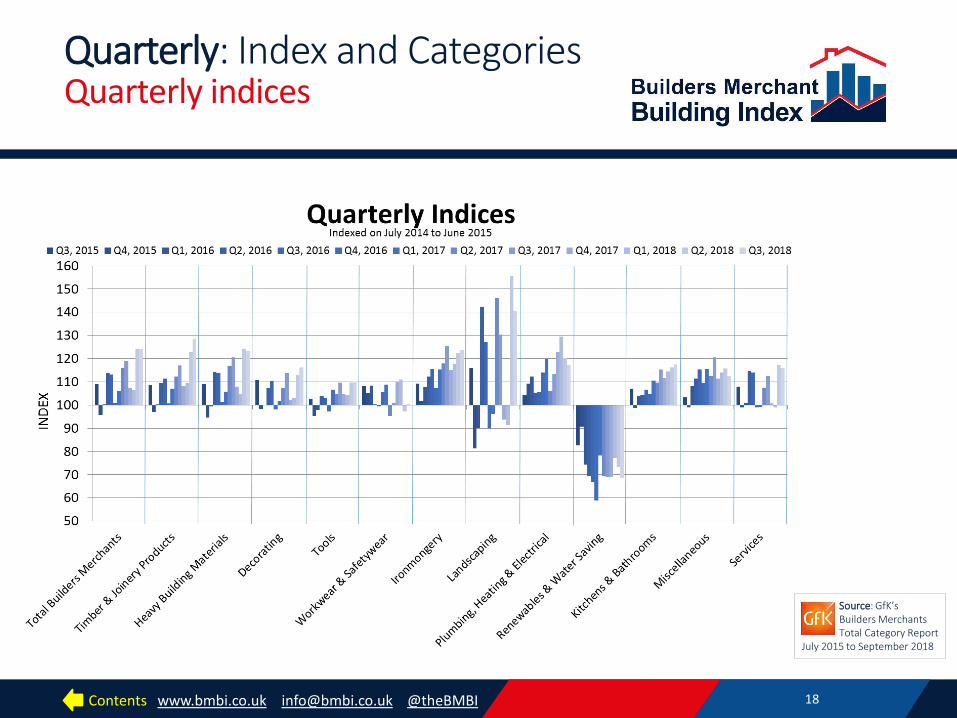
Quarterly: Index and Categories Quarter 3 2017* to Quarter 3 2018 (Indexed on July 2014 to June 2015)
15
Source: GfK’s Builders Merchants Total Category Report July 2015 to September 2018
*Click the web link below to see the complete series of quarterly indices from Q2, 2015.
Use Excel template to update table layout – adding next month and deleting first month Manually adjust table to fit: • H=10.37 • W=15.84 • Position 4.5,
4.97 • Alight text to
middle • Check
alignment of footer text box
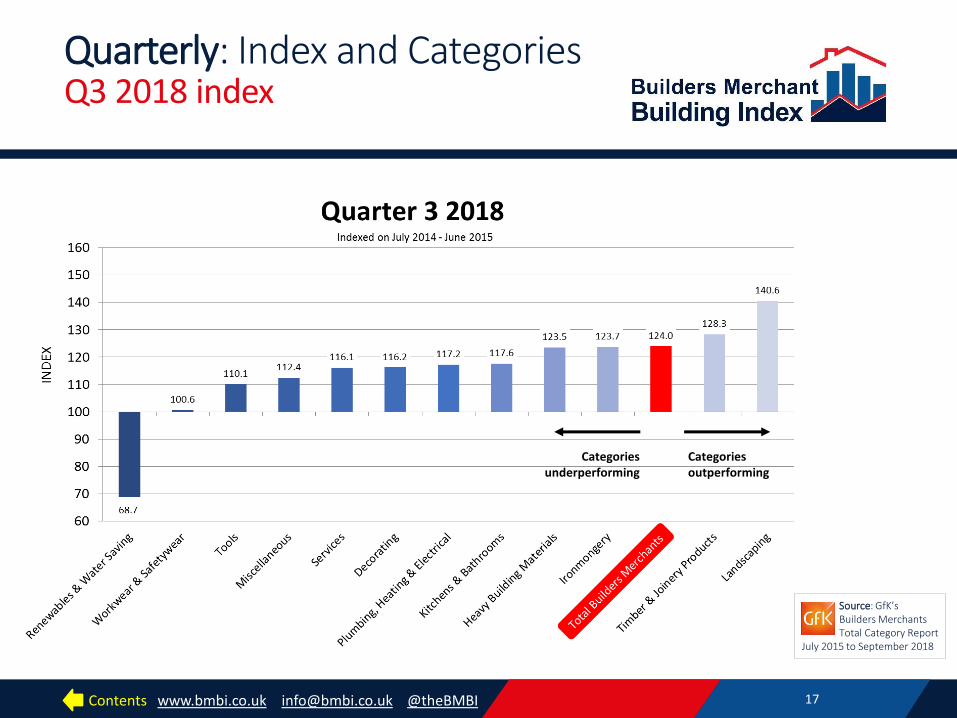
QUARTERLY SALES VALUE INDEX Index Q3 2017 Q4 2017 Q1 2018 Q2 2018 Q3 2018
Total Builders Merchants 100 119.1 107.2 106.4 124.4 124.0
Timber & Joinery Products 100 117.1 108.1 109.5 122.9 128.3
Heavy Building Materials 100 120.7 107.9 104.9 124.2 123.5
Decorating 100 113.9 102.3 103.0 112.8 116.2
Tools 100 109.8 104.7 104.2 109.6 110.1
Workwear & Safetywear 100 100.9 110.0 110.9 97.3 100.6
Ironmongery 100 125.3 115.2 117.8 122.3 123.7
Landscaping 100 130.4 93.8 91.4 155.5 140.6
Plumbing, Heating & Electrical 100 113.4 122.7 129.5 120.1 117.2
Renewables & Water Saving 100 69.0 69.1 77.1 73.2 68.7
Kitchens & Bathrooms 100 115.2 111.6 114.6 116.3 117.6
Miscellaneous 100 120.5 111.4 113.9 115.7 112.4
Services 100 112.4 100.7 98.9 117.3 116.1
same
Contents www.bmbi.co.uk [email protected] @theBMBI
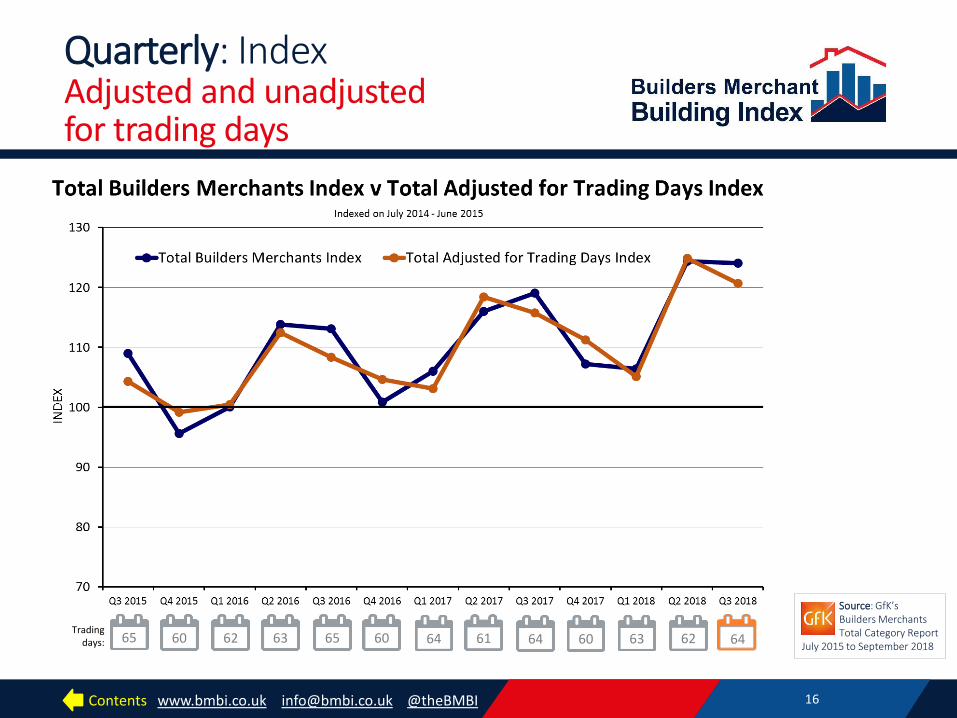
Quarterly: Index Adjusted and unadjusted for trading days
Trading days:
16
Source: GfK’s Builders Merchants Total Category Report July 2015 to September 2018
1) Paste chart 2) Set height to
12.7, 3) Set horizontal to
1.07, vertical to 3.8
4) Crop from the top to fit
5) Copy trading days box, update value and realign all of them
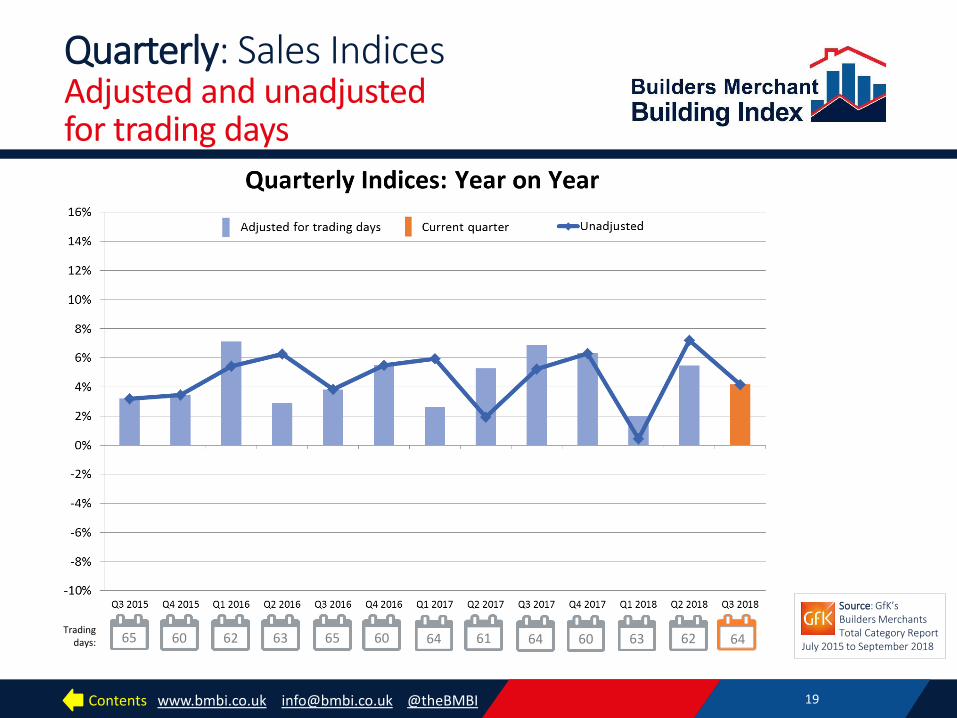
60 62 63 65 60 64 64 61 64 60 63 65 62
Contents www.bmbi.co.uk [email protected] @theBMBI
Quarterly: Index and Categories Q3 2018 index
17
1) Paste chart 2) Set height to 13.3, 3) Set horizontal to
0.64, vertical to 4.45
Source: GfK’s Builders Merchants Total Category Report July 2015 to September 2018
(One less trading day this year)
Categories outperforming
Categories underperforming
Contents www.bmbi.co.uk [email protected] @theBMBI
Quarterly: Index and Categories Quarterly indices
18
1) Paste chart 2) Set height to 13.3, 3) Set horizontal to 0.64,
vertical to 4.45
Source: GfK’s Builders Merchants Total Category Report July 2015 to September 2018
Contents www.bmbi.co.uk [email protected] @theBMBI
Quarterly: Sales Indices Adjusted and unadjusted for trading days
19
1) Paste chart 2) Set height to 12.4 3) Set horizontal to
1.63, vertical to 4.0 4) Crop from the top 5) Add another trading
days box, group and shrink to fit (or copy from previous slide)
Trading days:
Source: GfK’s Builders Merchants Total Category Report July 2015 to September 2018
60 62 63 65 60 64 64 61 64 60 63 65 62
Contents www.bmbi.co.uk [email protected] @theBMBI
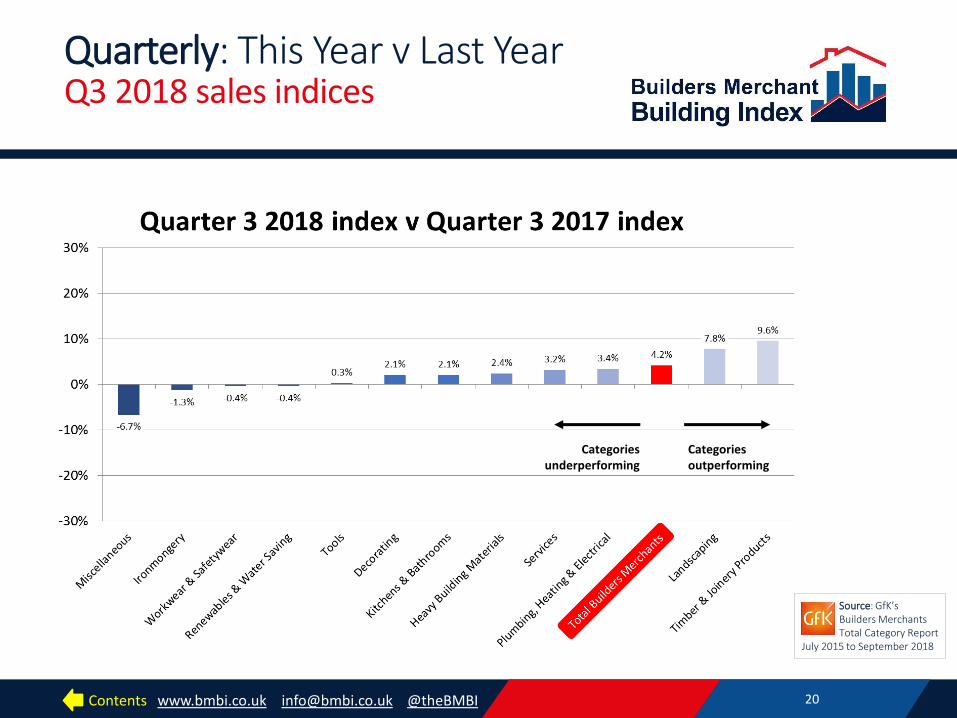
Quarterly: This Year v Last Year Q3 2018 sales indices
20
1) Paste chart 2) Set height to 13.3 3) Set horizontal to
0.64, vertical to 4.45
Source: GfK’s Builders Merchants Total Category Report July 2015 to September 2018
(One less trading day this year)
Categories outperforming
Categories underperforming
(One more trading day this year)
Contents www.bmbi.co.uk [email protected] @theBMBI
Quarterly: Quarter on Quarter Q3 2018 sales indices
21
1) Paste chart 2) Set height to
13.3 3) Set horizontal
to 0.64, vertical to 4.45
Source: GfK’s Builders Merchants Total Category Report July 2015 to September 2018
(Two more trading days in Q3)
Categories outperforming
Categories underperforming
Contents www.bmbi.co.uk [email protected] @theBMBI
Quarterly: Quarter on Quarter Q3 2018 average sales a day indices
22
1) Paste chart 2) Set height to
13.3 3) Set horizontal
to 0.64, vertical to 4.45
Source: GfK’s Builders Merchants Total Category Report July 2015 to September 2018
Average sales a day indices
(Two more trading days in Q3)
Categories outperforming
Categories underperforming
Contents www.bmbi.co.uk [email protected] @theBMBI
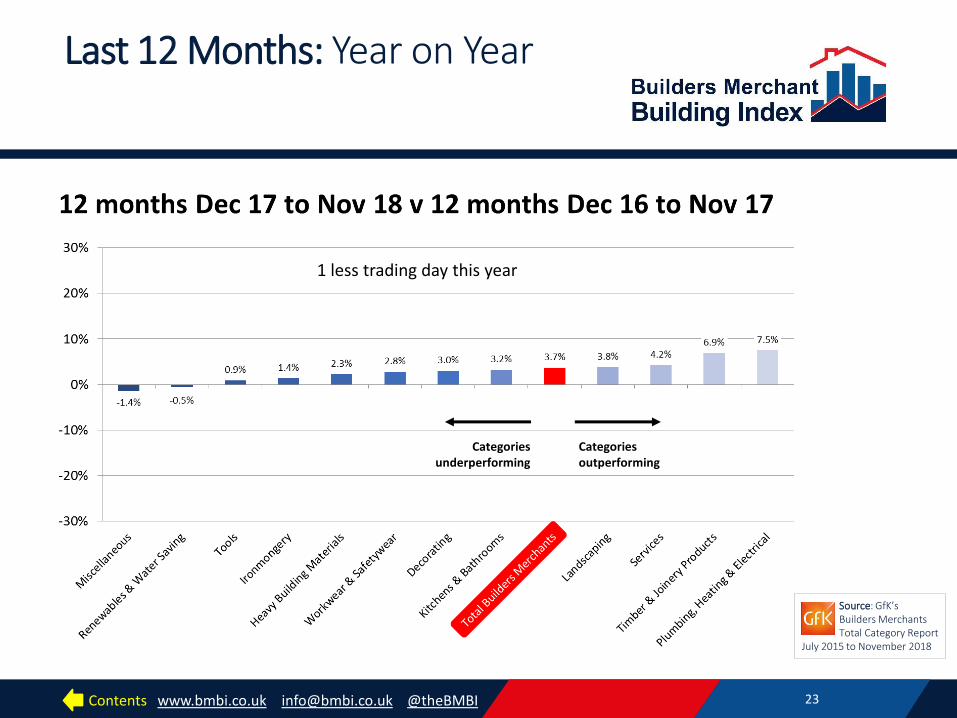
Last 12 Months: Year on Year
23
1) Paste chart 2) Set height to 13.3 3) Set horizontal to
0.64, vertical to 4.45
Source: GfK’s Builders Merchants Total Category Report July 2015 to November 2018
(One less trading day in July 2017 to June 2018)
Last 12 Months: Year on Year Rolling 12 months sales indices
Categories outperforming
Categories underperforming
1 less trading day this year
Contents www.bmbi.co.uk [email protected] @theBMBI
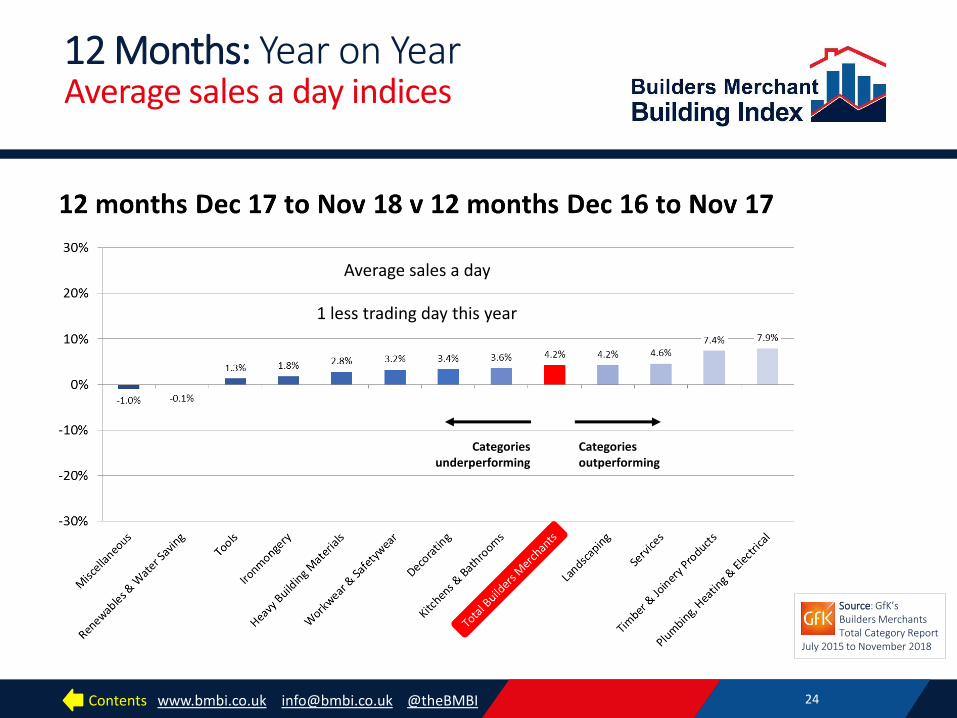
12 Months: Year on Year Average sales a day indices
24
1) Paste chart 2) Set height to 13.3 3) Set horizontal to
0.64, vertical to 4.45
Source: GfK’s Builders Merchants Total Category Report July 2015 to November 2018
(One less trading day in July 2017 to June 2018)
Last 12 Months: Year on Year Rolling 12 months sales indices
Categories outperforming
Categories underperforming
Average sales a day
1 less trading day this year
Contents www.bmbi.co.uk [email protected] @theBMBI 25
Source: GfK’s Builders Merchants Total Category Report July 2015 to November 2018
1) Paste chart 2) Set height to 8.0 3) Set horizontal to
0.35, vertical to 6.0 4) Send to back to
reveal X and Y axes 5) Update months on
X axis
1) Paste chart 2) Set height to 8.0 3) Set horizontal to 12.5
vertical to 6.0 4) Send to back to
reveal X and Y axis 5) Update months on X
axis
Indexed on July 2014 – June 2015 Indexed on July 2014 – June 2015
Monthly: Indices November 2018
100
160
150
140
60
50
80
70
130
90
110
120
100
60
80
70
130
90
110
120
140
100
60
80
70
130
90
110
120
140
100
60
80
70
130
90
110
120
140
100
60
80
70
130
90
110
120
140
Aug May Feb Nov Aug May Feb Nov Aug May Nov Feb Nov Aug 2018 2017 2016 2015
Aug May Feb Nov Aug May Feb Nov Aug May Nov Feb Nov Aug 2018 2017 2016 2015
Aug May Feb Nov Aug May Feb Nov Aug May Nov Feb Nov Aug 2018 2017 2016 2015
Contents www.bmbi.co.uk [email protected] @theBMBI 26
Source: GfK’s Builders Merchants Total Category Report July 2015 to November 2018
Indexed on July 2014 – June 2015 Indexed on July 2014 – June 2015
Monthly: Indices November 2018
1) Paste chart 2) Set height to 8.0 3) Set horizontal to
0.35, vertical to 6.0 4) Send to back to
reveal X and Y axes 5) Update months on
X axis
1) Paste chart 2) Set height to 8.0 3) Set horizontal to 12.5
vertical to 6.0 4) Send to back to
reveal X and Y axis 5) Update months on X
axis
100
60
80
70
130
90
110
120
140
100
60
80
70
130
90
110
120
140
Aug May Feb Nov Aug May Feb Nov Aug May Nov Feb Nov Aug 2018 2017 2016 2015
Aug May Feb Nov Aug May Feb Nov Aug May Nov Feb Nov Aug 2018 2017 2016 2015
Contents www.bmbi.co.uk [email protected] @theBMBI 27
Source: GfK’s Builders Merchants Total Category Report July 2015 to November 2018
Indexed on July 2014 – June 2015 Indexed on July 2014 – June 2015
Monthly: Indices November 2018
100
160
150
140
60
50
80
70
130
90
110
120
1) Paste chart 2) Set height to 8.0 3) Set horizontal to
0.35, vertical to 6.0 4) Send to back to
reveal X and Y axes 5) Update months on
X axis
1) Paste chart 2) Set height to 8.0 3) Set horizontal to 12.5
vertical to 6.0 4) Send to back to
reveal X and Y axis 5) Update months on X
axis
100
60
80
70
130
90
110
120
140
100
60
80
70
130
90
110
120
140
Aug May Feb Nov Aug May Feb Nov Aug May Nov Feb Nov Aug 2018 2017 2016 2015
Aug May Feb Nov Aug May Feb Nov Aug May Nov Feb Nov Aug 2018 2017 2016 2015
Contents www.bmbi.co.uk [email protected] @theBMBI 28
Source: GfK’s Builders Merchants Total Category Report July 2015 to November 2018
Indexed on July 2014 – June 2015
Indexed on July 2014 – June 2015
Monthly: Indices November 2018
Scale below is 7pt Calibri
(body) not images
100
160
150
140
60
50
80
70
130
90
110
120
100
140
60
80
70
130
90
110
120
150
Scale 180-50: 1) Paste chart 2) Unlock the
aspect ratio 3) Set height to
12.1, width to 12.28
4) Set horizontal to 0.35, vertical to 3.0
5) Send image to back
6) Crop top to fit 7) Align value
indices to axis 8) Amend months
manually, adding an extra text box every month
100
160
150
140
60
50
80
70
130
90
110
120
170
180 Scale 150-60: (Does not align with Landscaping)
1) Paste chart 2) Unlock aspect ratio 3) Set height to 8.44
and width to 12.28 4) Set horizontal to
12.5, vertical to 5.71 5) Send to back to
reveal Y axis 6) Amend months
manually, adding an extra text box every three months
Aug May Feb Nov Aug May Feb Nov Aug May Nov Feb Nov Aug 2018 2017 2016 2015
Aug May Feb Nov Aug May Feb Nov Aug May Nov Feb Nov Aug 2018 2017 2016 2015
Contents www.bmbi.co.uk [email protected] @theBMBI 29
Source: GfK’s Builders Merchants Total Category Report July 2015 to November 2018
1) Paste chart 2) Set height to 8.0 3) Set horizontal to
12.5, vertical to 6.0 4) Send to back to
reveal Y axis 5) Copy and paste
latest months
1) Paste chart 2) Unlock aspect ratio 3) Set height to 9.96,
width to 12.28 4) Set horizontal to
0.35, vertical to 5.66
5) Send to back and ensure heading, legend and Y axis labels align
6) Copy and paste latest months
Indexed on July 2014 – June 2015
Indexed on July 2014 – June 2015
Monthly: Indices November 2018
100
60
80
70
130
90
110
120
140
100
40
60
50
80
70
130
90
110
120
140
Aug May Feb Nov Aug May Feb Nov Aug May Nov Feb Nov Aug 2018 2017 2016 2015
Aug May Feb Nov Aug May Feb Nov Aug May Nov Feb Nov Aug 2018 2017 2016 2015
Contents www.bmbi.co.uk [email protected] @theBMBI 30
Source: GfK’s Builders Merchants Total Category Report July 2015 to November 2018
1) Paste chart 2) Set height to 8.0 3) Set horizontal to
0.35, vertical to 6.0
4) Send to back to reveal Y axis
1) Paste chart 2) Set height to 8.0 3) Set horizontal to 12.5
vertical to 6.0 4) Send to back to
reveal Y axis
Indexed on July 2014 – June 2015 Indexed on July 2014 – June 2015
Monthly: Indices November 2018
100
160
150
140
60
50
80
70
130
90
110
120
100
60
80
70
130
90
110
120
140
100
60
80
70
130
90
110
120
140
Aug May Feb Nov Aug May Feb Nov Aug May Nov Feb Nov Aug 2018 2017 2016 2015
Aug May Feb Nov Aug May Feb Nov Aug May Nov Feb Nov Aug 2018 2017 2016 2015
Contents www.bmbi.co.uk [email protected] @theBMBI
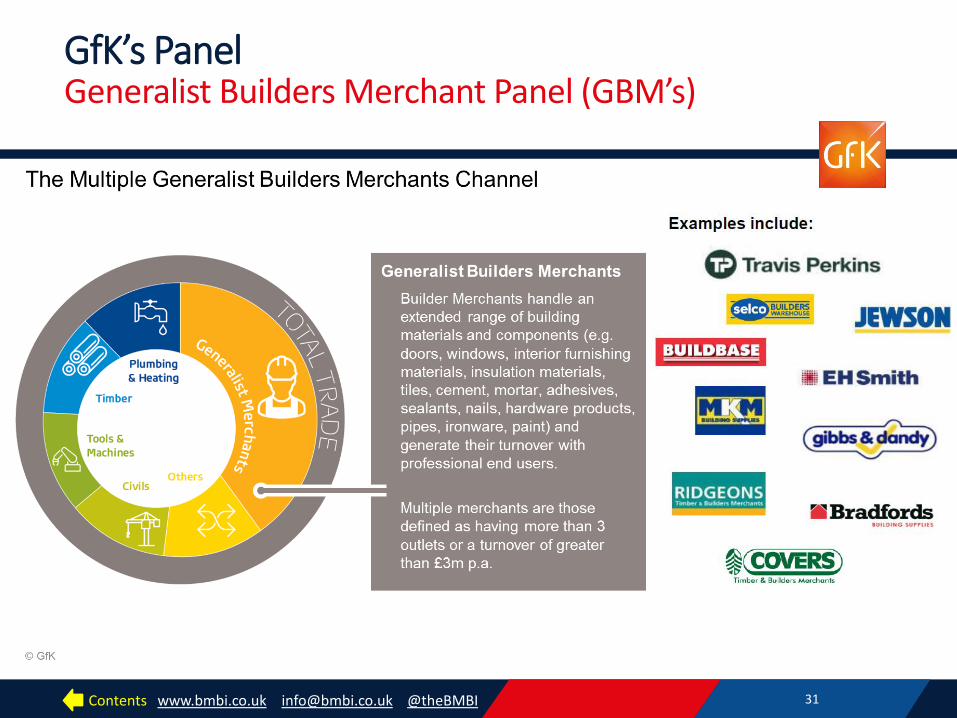
GfK’s Panel Generalist Builders Merchant Panel (GBM’s)
31
This is a composite image. Circle and panel are one part (screen shot of PowerPoint page, logos a separate part (GfK’s PDF). This to give the best reproduction of the circle whilst ensuring the layout of the logos is not too wide for the page
same
Contents www.bmbi.co.uk [email protected] @theBMBI
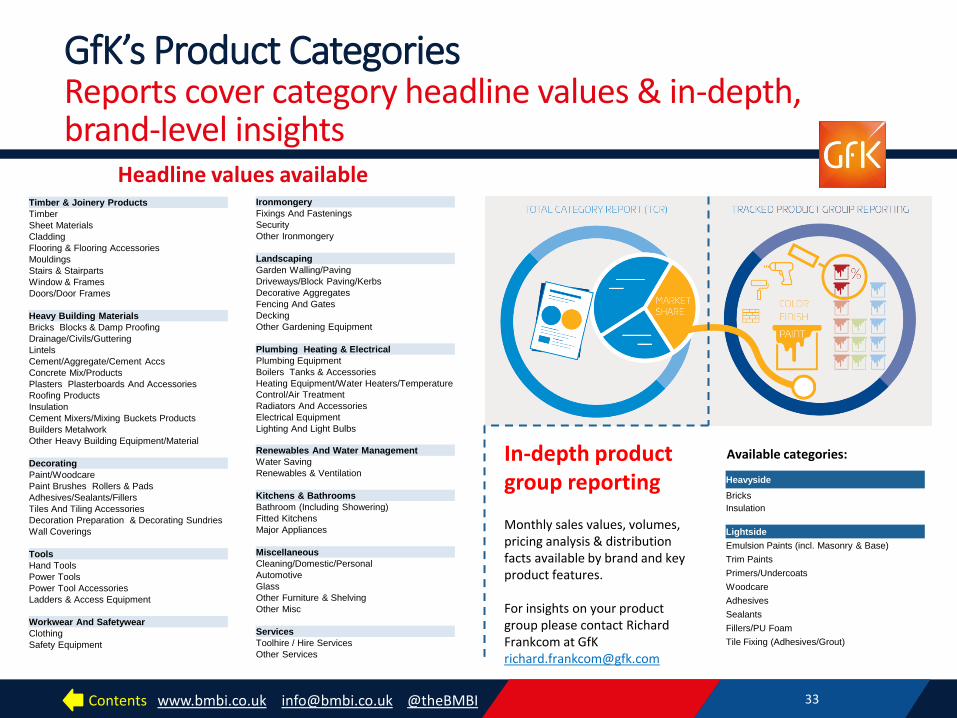
GfK’s Product Categories Reports cover category headline values & in-depth, brand-level insights
33
Timber & Joinery Products
Timber
Sheet Materials
Cladding
Flooring & Flooring Accessories
Mouldings
Stairs & Stairparts
Window & Frames
Doors/Door Frames
Heavy Building Materials
Bricks Blocks & Damp Proofing
Drainage/Civils/Guttering
Lintels
Cement/Aggregate/Cement Accs
Concrete Mix/Products
Plasters Plasterboards And Accessories
Roofing Products
Insulation
Cement Mixers/Mixing Buckets Products
Builders Metalwork
Other Heavy Building Equipment/Material
Decorating
Paint/Woodcare
Paint Brushes Rollers & Pads
Adhesives/Sealants/Fillers
Tiles And Tiling Accessories
Decoration Preparation & Decorating Sundries
Wall Coverings
Tools
Hand Tools
Power Tools
Power Tool Accessories
Ladders & Access Equipment
Workwear And Safetywear
Clothing
Safety Equipment
Ironmongery
Fixings And Fastenings
Security
Other Ironmongery
Landscaping
Garden Walling/Paving
Driveways/Block Paving/Kerbs
Decorative Aggregates
Fencing And Gates
Decking
Other Gardening Equipment
Plumbing Heating & Electrical
Plumbing Equipment
Boilers Tanks & Accessories
Heating Equipment/Water Heaters/Temperature
Control/Air Treatment
Radiators And Accessories
Electrical Equipment
Lighting And Light Bulbs
Renewables And Water Management
Water Saving
Renewables & Ventilation
Kitchens & Bathrooms
Bathroom (Including Showering)
Fitted Kitchens
Major Appliances
Miscellaneous
Cleaning/Domestic/Personal
Automotive
Glass
Other Furniture & Shelving
Other Misc
Services
Toolhire / Hire Services
Other Services
Heavyside
Bricks
Insulation
Lightside
Emulsion Paints (incl. Masonry & Base)
Trim Paints
Primers/Undercoats
Woodcare
Adhesives
Sealants
Fillers/PU Foam
Tile Fixing (Adhesives/Grout)
Headline values available
In-depth product group reporting
Monthly sales values, volumes, pricing analysis & distribution facts available by brand and key product features. For insights on your product group please contact Richard Frankcom at GfK [email protected]
Available categories:

Contents www.bmbi.co.uk [email protected] @theBMBI
Contact us For further information
34
Lucia Di Stazio Managing Director [email protected] +44 (0) 1453 521621
Tom Rigby Business Development Manager [email protected] +44 (0) 7392 081276
Nyssa Patel Industry Analyst / Economist [email protected] +44 (0) 24 7685 4994
Richard Frankcom Key Account Director [email protected] +44 (0) 20 7890 9543
same