Embed Size (px)
Citation preview

1
The table above displays a current view of performance against a range of standards for Nottingham North & East, Nottingham West and Rushcliffe Clinical Commissioning Groups. Indicators where a national standard has not been defined are not traffic lighted. A summary of key issues and concerns can be found overleaf.
NHS Nottingham North & East CCG Monthly Quality & Performance Report
July 2017
Summary (Pages 1 to 2) Key Issues and Concerns
Improvement and Assessment
Framework (Page 3 to 7)
CCG Improvement and Assessment
Framework
Level 1 (Page 8 to 12) Summary of CCG Performance
Level 2 (Page 13 to 43) Summary of Provider Performance
Quality Premium (Page 44) CCG Quality Premium
BCF (Page 45 to 48) Better Care Fund
The above table displays the standards contained within the CCG Improvement and Assessment Framework where either one or more of the South Nottinghamshire CCGs are currently performing within the lowest quartile. Commentary relating to these standards is contained within the IAF section of this performance report.
CCG Improvement and Assessment Framework - Lowest Quartiles
NNE NW Rush
CancerPeople with urgent GP referral having first definitive treatment for cancer
within 62 days of referralQ2 16/17 H 82.3% 73.4% 82.6% 80.2%
Reliance on specialist inpatient care for people with a learning disability
and/or autism (per 1 million pop.)Q2 16/17 L 84 84 84
Neonatal mortality and stillbirths (per 1000 births) 2014 L 7.1 3.1 9.1 2.9
Choices in maternity services 2015 H 62.8 61.6 64.8
Urgent & Emergency
Care
Achievement of milestones in the delivery of an integrated urgent care
serviceAug-16 H 1 1 1
Urgent & Emergency
Care
Percentage of patients admitted, transferred or discharged from A&E within
4 hoursNov-16 H 88.4% 81.7% 81.4% 79.8%
Primary Medical
CarePrimary care access Q3 16/17 H 0.0% 0.0% 0.0%
BE
TT
ER
CA
RE
Learning Disability
Maternity
Lowest Quartile
Theme Area Indicator Name
Latest
Data
Period
Better Is
(H/L)England
Performance
Area Indicator Standard NNE NW Rush NNE NW Rush
4 Hour Standard % Achievement - A&E and Eye Cas 95% May-17 84.20% 84.46% 81.23% 84.40% 84.39% 83.22%
Left without being seen 5% May-17 3.50% 3.04% 2.75% 3.47% 2.89% 3.13%
Unplanned Re-attendance rate 5% May-17 1.28% 1.03% 0.87% 1.15% 1.07% 0.94%
Time to initial assessment (95th percentile) 15 mins May-17 01:09 01:11 01:08 01:07 01:10 01:05
Time to treatment decision (median) 60 mins May-17 00:51 00:55 00:51 00:47 00:55 00:48
Time to departure (admitted) (95th percentile) 4 hours May-17 10:31 10:04 09:39 09:48 09:41 09:06
Time to departure (non-admitted) (95th percentile) 4 hours May-17 04:40 04:42 05:07 04:47 04:43 04:50
Time to departure (admitted & non-admitted) (95th percentile) 4 hours May-17 06:48 06:57 07:02 06:26 06:42 06:34
Cancer 2ww 93% May-17 95.54% 96.30% 92.13% 93.85% 94.50% 92.94%
Cancer 31d DTT 96% May-17 95.06% 95.74% 93.51% 95.14% 91.76% 94.66%
62d Urg RTT 85% May-17 81.63% 92.59% 81.25% 76.40% 86.96% 80.46%
Cancer 2ww - Breast Symptoms 93% May-17 100.00% 100.00% 80.00% 96.43% 100.00% 90.00%
Diagnostics % patients waiting longer than 6 weeks 1% May-17 1.12% 1.17% 0.54% 0.75% 0.78% 0.41%
Red 1 calls responded to within 8 minutes 75% May-17 77.14% 66.67% 63.64% 71.37% 64.55% 60.78%
Red 2 calls responded to within 8 minutes 75% May-17 42.65% 45.65% 41.37% 48.99% 47.84% 44.23%
Red 1 calls responded to within 19 minutes 95% May-17 100.00% 96.97% 100.00% 98.91% 98.48% 96.81%
Red 2 calls responded to within 19 minutes 95% May-17 90.54% 92.36% 85.68% 90.04% 91.99% 85.68%
MRSA 0 Jun-17 0 0 0 0 0 0
C-Diff - YTD standard: NNE=12 NW=5 Rush=6 <<< notes Jun-17 5 4 1 11 13 6
Admitted % 90% May-17 86.32% 84.15% 84.13% 85.66% 83.55% 82.93%
Non-Admitted % 95% May-17 96.01% 96.06% 96.70% 96.13% 95.60% 96.15%
Incomplete % 92% May-17 95.75% 95.64% 95.82% 95.67% 95.48% 95.48%
Incomplete number of 52 week waiters 0 May-17 0 1 1 0 2 2
Care Programme Approach: 7 day follow up 100% Q4 2016-17 91% 100% 100% 96% 97% 100%
Crisis Resolution Home Treatment: Gate kept by CR Teams 100% Q4 2016-17 95% 92% 89% 99% 97% 96%
IAPT IAPT - Standard: NNE = 1.25% NW = 1.25% Rush = 1.25% <<< notes Apr-17 1.45% 1.41% 1.54% 1.45% 1.41% 1.54%
Treated within two weeks % 50% May-17 100.00% 100.00% 75.00% 100.00% 66.67%
Incomplete waiting less than two weeks % 50% May-17 0.00% 100.00% 0.00% 100.00% 100.00%
Dementia Dementia Diagnosis Rate 67% Mar-17 70.43% 74.85% 79.00%
YTD
A&E
Cancer
Waiting
Times
Latest
data
period
RTT
Ambulance
HCAIs
Latest period dataCCG Performance Snapshot
EIP
Mental
Health

2
Summary – Key issues and concerns
CCG Improvement and Assessment Framework CCG performance against IAF indicators is available on pages 3-6. Individual CCG’s performance against IAF Mental Health Transformation areas is shown on page 7.
CCG Indicators out of trajectory - Cancer (page 8) – Performance for May 2017 highlights that Nottingham North & East CCG is below standard for
the following pathway - 62 Day Urgent RTT (81.63% against a standard of 85%) 62 Day Urgent RTT - Screening Service (50% against a standard of 90%) 31 Day DTT (95.06% against a standard of 96%) 31 Day DTT - Subsequent treatment: Drugs (95% against a standard of 98%)
A&E (Page 11) – Nottingham North & East CCG failed to achieve the A&E standard for May 2017 with performance at 75.97% against a standard of 95%
NUH Indicators out of trajectory -
Cancer (Page 13-14) – The following pathways failed to meet their respective standards during May 2017 -
62 Day Urgent RTT - 76.12% (standard = 85%)
2 Week Wait - 92.97% (standard = 93%) A&E (Page 16-17) – June 2017 A&E performance was below standard at 81.60% Cancelled Operations (Page 18) - NUH breached the threshold for % of ‘on the day’ cancelled operations with
performance at 0.91%. There were also 6 cancelled operations that were not rebooked within 28 days Appointment Slot Issues (Page 19) - NUH had a ratio of 0.17 slot issues per successful booking in April 2017 which
is a breach of the 0.04 standard NHS E-Referrals (Page 19) - Of patients waiting to arrange an appointment, 36% were waiting less than 7 working
days which is below the 95% standard, 54% were waiting less than 14 working days which is below the 100% standard
Ambulance Handovers (Page 21) - Performance for May 2017 shows that 380 handovers took longer than 30 minutes and 25 exceeded 60 minutes. This is against a standard of 0
Venous Thromboembolism (Page 21) - March 2017 performance shows that 94.96% of eligible patients were assessed for VTE within 24 hours which is below the 95% standard
Pressure Ulcers (Page 23) - NUH failed to meet the standard for the reduction of grade 3 pressure ulcers in March 2017
Falls (Page 23) - May 2017 performance for falls was above the threshold of 0.98 with 1.00 falls per 1000 occupied bed days resulting in harm at NUH
SFHT (Page 25-26) - Sherwood Forest Hospitals Trust performance is available on pages 25-26
Circle (Page 27-31) - Circle performance is available on pages 27-31
NHCT (Page 32-34) - Nottinghamshire Health Care Trust performance is available on pages 32-34
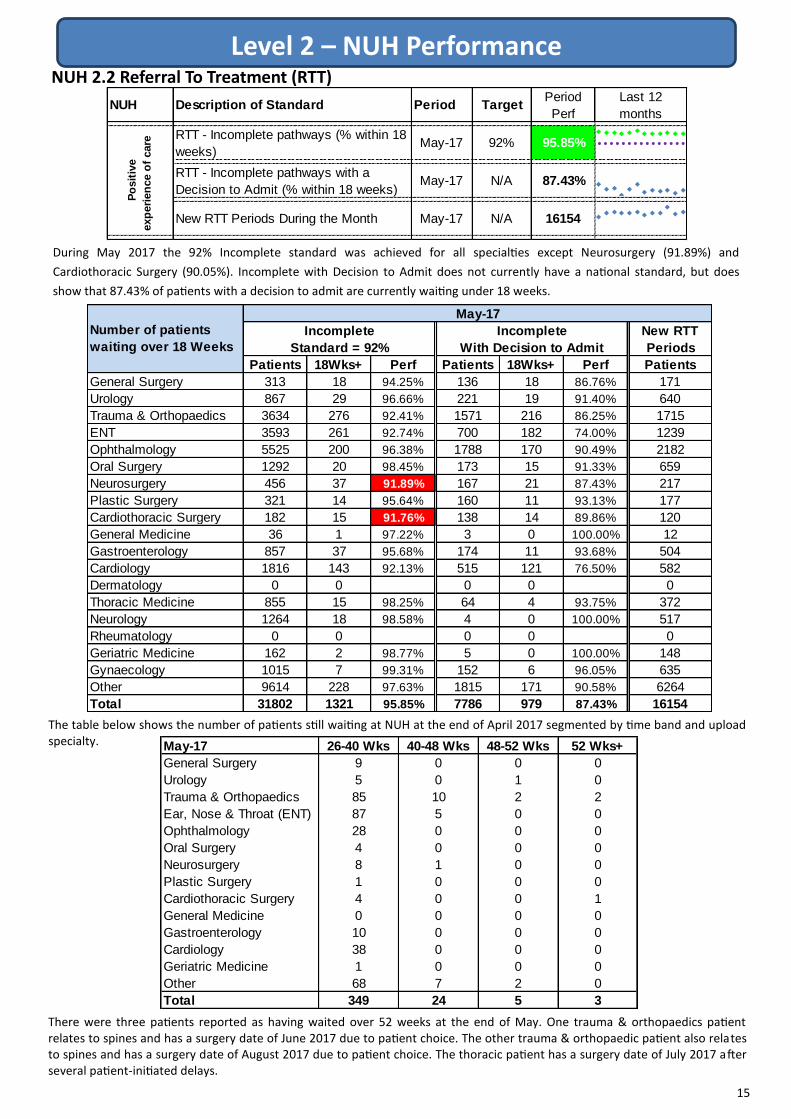
EMAS (Page 35-40) – Red 1 and Red 2 performance remains below standard for the 8 and 19 minute targets. Comparative
performance and outcomes across ambulance trusts is shown on pages 39 & 40
Arriva (Page 41) - Performance for Arriva patient transport services is now available
NHS 111 (Page 42-43) – Performance is available for the key NHS 111 indicators
Quality Premium (Page 44) - Performance against the quality premium is summarised for the CCG
Better Care Fund (Page 45-48) - BCF monitoring at Nottinghamshire County Local Authority Level

3
CCG Improvement and Assessment Framework
The table above shows how each CCG is performing for the IAF indicators within the Better Health section. None of the three CCGs are currently within the lowest quartile nationally for any of these indicators.
The table above shows how each CCG is performing for the IAF indicators within the Sustainability section.
Lowest Quartile
CCG Improvement and Assessment Framework
The CCG Improvement and Assessment Framework (IAF) is intended to align key national objectives and priorities whilst providing a focal point for joint work, support and dialogue between NHS England and CCGs.
The IAF is a tool with which to measure CCG performance against the “triple aim” outlined by NHS England. These aims are:
1. Improving the health and wellbeing of the whole population 2. Better quality for all patients, through care redesign 3. Better value for taxpayers in a financially sustainable system Below is how the three South Nottinghamshire CCGs are presently performing against the indicators within the IAF and also how their performance compares against the average for England. There are no fixed targets to meet within the IAF, rather the focus is that CCGs meet and perform beyond the expectations that are relative to their individual positions.
NNE NW Rush
Smoking Maternal smoking at delivery Q2 16/17 L 10.4% 11.6% 9.7% 5.2%
Child Obesity Percentage of children aged 10-11 classified as overweight or obese 2014/15 L 33.2% 31.4% 31.2% 21.1%
Diabetes patients that have achieved all the NICE recommended treatment
targets: Three for adults and one for children2014/15 H 39.8% 37.8% 39.7% 40.1%
People with diabetes diagnosed less than a year who attend a structured
education course2014/15 H 5.7% 7.0% 8.3% 4.1%
Falls Injuries from falls in people aged 65 and over (per 100,000 pop.) Jun-16 L 1985 2258 2145 2044
Utilisation of the NHS e-referral service to enable choice at first routine
elective referralSep-16 H 51.1% 95.4% 88.7% 101.6%
Personal health budgets (per 100,000 pop.) Q2 16/17 H 18.7 8.6 8.4 8.0
Percentage of deaths which take place in hospital Q1 16/17 <> 47.1% 51.6% 50.9% 44.8%
People with a long-term condition feeling supported to manage their
condition(s)2016 H 64.3% 66.1% 70.1% 65.4%
Inequality in unplanned hospitalisation for chronic ambulatory care sensitive
conditionsQ4 15/16 L 929 958 759 800
Inequality in emergency admissions for urgent care sensitive conditions Q4 15/16 L 2168 1943 1798 1520
Anti-microbial resistance: appropriate prescribing of antibiotics in primary
careSep-16 <> 1.1 1 0.9 0.90
Anti-microbial resistance: Appropriate prescribing of broad spectrum
antibiotics in primary careSep-16 <> 9.1% 10.6% 9.0% 8.6%
Carers Quality of life of carers 2016 H 80.0% 82.2% 79.3% 83.7%
Anti-microbial
Resistance
Health Inequalities
BE
TT
ER
HE
ALT
H
Diabetes
Personalisation and
choice
Theme Area Indicator Name
Latest
Data
Period
EnglandPerformanceBetter Is
(H/L)
NNE NW Rush
Financial plan 2016 <> GREEN GREEN GREEN
In-year financial performance Q2 16/17 <> AMBER GREEN GREEN
Outcomes in areas with identified scope for improvement Q2 16/17 H Not Incl. Not Incl. Not Incl.
Expenditure in areas with identified scope for improvement Q2 16/17 H Not Incl. Not Incl. Not Incl.
Local digital roadmap in place Q3 16/17 <> YES YES YES
Digital interactions between primary and secondary care Q3 16/17 H 73.1% 67.8% 69.0%
Estates Strategy Local strategic estates plan (SEP) in place 2016-17 YES YES YES
Better Is
(H/L)Theme Area Indicator Name
Latest
Data
Period
England
Paper-free at the
point of care
SU
ST
AIN
AB
ILIT
Y
Financial
sustainability
Allocative efficiency
Performance

4
CCG Improvement and Assessment Framework
The table above shows how each CCG is performing for the IAF indicators within the Better Care section. Rushcliffe CCG are in the lowest quartile nationally for four of these indicators. Further information relating to underperformance of these indicators can be found overleaf.
Lowest Quartile
The table above shows how each CCG is performing for the IAF indicators within the Well Led section.
NNE NW Rush
Probity & corporate
governanceProbity and corporate governance Q2 16/17 H
Fully
Complia
Fully
Complia
Fully
Complia
Staff engagement index (1 to 5 - 5 good) 2015 H 3.8 3.9 3.9 3.9
Progress against workforce race equality standard (0 = equality) 2015 L 0.2 0.2 0.2 0.2
CCGs’ local
relationshipsEffectiveness of working relationships in the local system 2015/16 H 71.8% 81.5% 84.1%
Quality of leadership Quality of CCG leadership Q2 16/17 <> GREEN GREEN GREEN
Better Is
(H/L)Indicator Name
Latest
Data
Period
EnglandPerformance
WE
LL L
ED Workforce
engagement
Theme Area
NNE NW Rush
Care Ratings Provision of high quality care Q3 16/17 H 62 64 63
Cancers diagnosed at early stage 2014 H 50.7% 52.1% 57.4% 51.7%
People with urgent GP referral having first definitive treatment for cancer
within 62 days of referralQ2 16/17 H 82.3% 73.4% 82.6% 80.2%
One-year survival from all cancers 2013 H 70.2% 69.6% 69.0% 71.0%
Cancer patient experience 2015 H 87.0% 89.0% 87.3% 86.8%
Improving Access to Psychological Therapies recovery rate Sep-16 H 48.4% 56.2% 55.4% 63.8%
People with first episode of psychosis starting treatment with a NICE-
recommended package of care treated within 2 weeks of referralNov-16 H 77.2% 78.6% 77.8% 100.0%
Children and young people’s mental health services transformation Q2 16/17 H 75.0% 75.0% 75.0%
Crisis care and liaison mental health services transformation Q2 16/17 H 52.5% 52.5% 52.5%
Out of area placements for acute mental health inpatient care -
transformationQ2 16/17 H 87.5% 87.5% 87.5%
Reliance on specialist inpatient care for people with a learning disability
and/or autism (per 1 million pop.)Q2 16/17 L 84 84 84
Proportion of people with a learning disability on the GP register receiving an
annual health check2015/16 H 37.1% 33.9% 41.6% 35.0%
Neonatal mortality and stillbirths (per 1000 births) 2014 L 7.1 3.1 9.1 2.9
Women’s experience of maternity services 2015 H 82.2 77.4 77.4
Choices in maternity services 2015 H 62.8 61.6 64.8
Estimated diagnosis rate for people with dementia Nov-16 H 68.0% 70.7% 74.0% 80.0%
Dementia care planning and post-diagnostic support 2015/16 H 81.5% 80.3% 80.8%
Achievement of milestones in the delivery of an integrated urgent care
serviceAug-16 H 1 1 1
Emergency admissions for urgent care sensitive conditions (per 100,000
pop.)Q4 15/16 L 2359 2145 2232 1621
Percentage of patients admitted, transferred or discharged from A&E within
4 hoursNov-16 H 88.4% 81.7% 81.4% 79.8%
Delayed transfers of care per 100,000 population Nov-16 L 15.0 7.8 6.3 8.2
Population use of hospital beds following emergency admission (days per
1000 pop.)Q1 16/17 L 1.0 1.10 1.1 1.0
Management of long term conditions (emergency admissions per 100,000
pop.)Q4 15/16 L 795 773 776 563
Patient experience of GP services H1 2016 H 85.2% 84.3% 89.9% 88.2%
Primary care access Q3 16/17 H 0.0% 0.0% 0.0%
Primary care workforce (FTE per 1000 weighted patients) H1 2016 H 1 1.1 0.93 1.33
Elective Access Patients waiting 18 weeks or less from referral to hospital treatment Nov-16 H 90.6% 95.7% 95.8% 95.8%
NHS Continuing
HealthcarePeople eligible for standard NHS Continuing Healthcare (per 50,000 pop.) Q2 16/17 <> 46.2 48.4 36.2 41.1
Better Is
(H/L)
Performance
Mental Health
Theme Area Indicator Name
Latest
Data
Period
England
BE
TT
ER
CA
RE
Cancer
Primary Medical
Care
Dementia
Urgent & Emergency
Care
Learning Disability
Maternity

5
CCG Improvement and Assessment Framework
Nottingham North & East CCG was in the lowest quartile nationally in Quarter 2 of 2016-17 for Reliance on specialist inpatient care for people with a learning disability and/or autism (per 1 million pop.) Rather than individual CCGs being measured, the performance of the Nottinghamshire Transforming Care Partnership is assessed as a whole. The footprint of this organisation encompasses 7 CCGs, 2 Local Authorities, and NHS England Specialised Commissioning. Performance across the cluster has improved from the Quarter 1 of 2016-17 position of 87 people with a learning disability and/or autism (per 1 million population) relying on specialist inpatient care. Trajectories have been agreed with the area team to improve performance to 57 people by the end of 2017/18 and to 36 people come the end of 2018/19. Actions are being taken to ensure this trajectory is met. These include:
Commissioners continuing to liaise regularly with inpatient units and other members of the multi-disciplinary team to expedite discharges where this is clinically indicated.
Commissioners continuing to carry out blue light reviews as necessary with the aim of avoiding admissions where possible or expediting discharge.
A new City and County wide Care and Treatment Review service with new enhanced specification has been commissioned. This started on the 2nd of January.
Meetings are taking place to finalise the Intensive Community Assessment and Treatment Team service which will be in place by quarter 1 of 2017/18.
Nottingham North & East CCG was in the lowest quartile nationally in August 2016 for the Achievement of milestones in the delivery of an integrated urgent care service. This performance is shared across the three South Nottinghamshire CCGs. There are 8 key elements to achieving fully Integrated Urgent Care services. These are:
A single call to get an appointment Out of hours Data can be shared between providers The capacity for NHS 111 and Out of hours is jointly planned The Summary Care Record (SCR) is available in the hub and elsewhere Care plans and special patient notes are shared Appointments can be made to in-hours GPs There is joint governance across Urgent and Emergency Care Suitable calls are transferred to a Clinical Hub containing GPs and other health care professionals.
The three South Nottinghamshire CCGs have consistently been within the lowest national quartile for the percentage of patients meeting the 4 hour A&E waiting time target. This is because most people attending A&E from Nottingham North & East CCG, Nottingham West CCG, and Rushcliffe CCG present at Nottingham University Hospitals which has continually struggled to meet high overall demand and therefore performs below standard. Further information relating to issues affecting A&E at NUH can be found within Level 2 of the performance report on pages 16 and 17.
All three South Nottinghamshire CCGs scored 0% when measured on the ability of their practices to offer full provision for pre-bookable appointments on Saturdays and Sundays, plus on each weekday for at least 1.5 hours either before 8am or after 6pm. However, in Quarter 3 of 2016/17 some practices within the three CCGs were able to offer partial provision. 50% of Nottingham North & East CCG practices, and 75% of Nottingham West CCG and Rushcliffe CCG practices were able to offer partial provision of access to pre-bookable appointments either at weekends or early mornings and evenings during the week.
NNE NW Rush
Reliance on specialist inpatient care for people with a learning disability
and/or autism (per 1 million pop.)Q2 16/17 L 84 84 84Learning Disability
Area Indicator Name
Latest
Data
Period
Better Is
(H/L)England
Performance
NNE NW Rush
Urgent & Emergency
Care
Achievement of milestones in the delivery of an integrated urgent care
serviceAug-16 H 1 1 1
Area Indicator Name
Latest
Data
Period
Better Is
(H/L)England
Performance
NNE NW Rush
Urgent & Emergency
Care
Percentage of patients admitted, transferred or discharged from A&E within
4 hoursNov-16 H 88.4% 81.7% 81.4% 79.8%
Area Indicator Name
Latest
Data
Period
Better Is
(H/L)England
Performance
NNE NW Rush
Primary Medical
CarePrimary care access Q3 16/17 H 0.0% 0.0% 0.0%
Area Indicator Name
Latest
Data
Period
Better Is
(H/L)England
Performance

6
CCG Improvement and Assessment Framework
Nottingham West CCG was within the bottom quartile for the Choices in maternity services indicator having scored 61.6 in 2015. The performance is calculated from a CQC survey of which answers to six questions reflecting several points across the care pathway are used. Scores are adjusted for age and for parity (the number of times a woman has given birth). The national maternity review ’Better Births’, published in February 2016, sets out a five year plan for improving maternity services. Commissioners and NUH have been working closely over the past 18 months to progress a number of pathway improvements in relation to maternity care and therefore are well placed to begin implementation of Better Births.
Nottingham West CCG was within the bottom quartile for Neonatal mortality and stillbirths (per 1000 births) in 2014. During Quarter 2 of 2016/17 (the time period in the IAF) 9.7% (23 smokers) of women were smokers at the time of delivery. Other challenges remain around information sharing across the maternity service as community midwives use SystmOne whilst the hospital maternity service at NUH uses Medway. Plans are afoot to roll Medway out into the community. The national maternity review ’Better Births’, published in February 2016, sets out a five year plan for improving maternity services. Commissioners and NUH have been working closely over the past 18 months to progress a number of pathway improvements in relation to maternity care and therefore are well placed to begin implementation of Better Births.
NNE NW Rush
Neonatal mortality and stillbirths (per 1000 births) 2014 L 7.1 3.1 9.1 2.9
Area Indicator Name
Latest
Data
Period
Better Is
(H/L)England
Performance
Maternity
NNE NW Rush
Choices in maternity services 2015 H 62.8 61.6 64.8
Area Indicator Name
Latest
Data
Period
Better Is
(H/L)England
Performance
Maternity
NNE NW Rush
CancerPeople with urgent GP referral having first definitive treatment for cancer
within 62 days of referralQ2 16/17 H 82.3% 73.4% 82.6% 80.2%
Area Indicator Name
Latest
Data
Period
Better Is
(H/L)England
Performance
Nottingham North & East CCG was within the bottom quartile for People with urgent GP referral having a first definitive treatment for cancer within 62 days of referral in Quarter 2 of 2016/17. The CCG achieved 73.4% with the national average at 82.3%. Most patients from the CCG use cancer services at NUH which have continually failed to meet the 85% target for 62 day RTT. Actions are in place to improve performance at the provider which should in turn lift NNE’s performance. These actions can be found in section 2 of this report on page 13.

7
CCG Improvement and Assessment Framework
To deliver improvements in ratings across the CCGIAF overall rating and
transformation measures CCGs should ensure that by 2020 they –
1. Commission additional psychological therapies so that at least 25% of people with
anxiety and depression access treatment each year, the majority of which is integrated
with physical healthcare.
2. Deliver better employment support for people with mental health problems; with improved
employment support in psychological therapies services and a doubling of Individual
Placement Support for people with severe mental illness in secondary care services.
3. Commission additional high-quality mental health services for children and young
people, so that at least an extra 70,000 people nationally are able to access services by
2020. This should include all areas being part of CYP IAPT by 2018.
4. Ensure all women can access evidence-based specialist perinatal mental health care
locally.
5. Implement a suicide reduction plan together with local government and other local
partners that reduces suicide rates by 10% against the 2016/17 baseline.
6. Expand capacity so that more than 60% of people experiencing a first episode of
psychosis receive treatment within two weeks of referral.
7. Commission community eating disorder teams so that children and young people to
receive treatment within four weeks of referral for routine cases, and one week for urgent
cases.
8. Commission effective 24/7 mental health crisis response services in all areas; Crisis
Response and Home Treatment Teams as an alternative to acute admissions, supporting
the elimination of out of area placements for nonspecialist acute care.
9. At least half of all acute hospitals locally should meet the ‘core 24’ standard for mental
health liaison as a minimum, with the remainder aiming for this level.
The table above shows the progress each CCG has made against the three mental health transformation areas contained within the CCG Improvement and Assessment Framework. The three areas are self-assessed and updated quarterly to reflect the ongoing transformation programme taking place within mental health services. Below is a list of expected improvements that CCGs are measured against to formulate the percentages shown above:
Transformation AreaNottingham North and
East CCG
Children and Young
People's Mental Health
Crisis Care
Out of Area PlacementsCompliance w ith a self-assessed list of minimum service expectations for Out of Area
Placements, w eighted to reflect preparedness for transformation
Rushcliffe CCG
75%
53%
88%
75% 75%
53% 53%
88% 88%
Nottingham West CCG
Compliance w ith a self-assessed list of minimum service expectations for Children and
Young People’s Mental Health, w eighted to reflect preparedness for transformation
Compliance w ith a self-assessed list of minimum service expectations for Crisis Care,
w eighted to reflect preparedness for transformation

Level 1 – Summary of CCG Performance
8
1.1 Cancer - CCG
All three South Nottinghamshire CCGs experienced breaches of standard for April 2017. Please see the table below for a breakdown of patients seen and breaches by CCG.
NHS Nottingham North & East CCG failed four standards in May 2017, details of the breaches for these pathways are below. 62 Day Urgent RTT: 9 Breaches
6 x NUH - 3x Complex Case, 3x Capacity
2 x NUH (First seen at Circle) - 1x Complex Case, 1x Patient Unfit
1 x Circle (First seen at NUH) - 1x Complex Case
62 Day Urgent RTT– Screening Service: 1 Breach
1 x NUH - 1x Complex Case
31 Day DTT: 4 Breaches
4 x NUH - 3x Capacity, 1x Patient Unsuitable
31 Day DTT: Subs - Drugs: 1 Breach
1 x Derby - 1x Patient Unfit
CCG Description of Standard Period Target CCGPeriod
Perf
Last 12
months
2017/18
YTD
NNE 81.63% 76.40%
NW 92.59% 86.96%
Rush 81.25% 80.46%
NNE 50.00% 83.33%
NW 100.00% 100.00%
Rush N/A N/A
NNE 50.00% N/A 60.00%
NW 100.00% N/A 50.00%
Rush 100.00% N/A 100.00%
NNE 95.06% 95.14%
NW 95.74% 91.76%
Rush 93.51% 94.66%
NNE 100.00% 90.91%
NW 100.00% 100.00%
Rush 91.67% 95.45%
NNE 95.00% 94.44%
NW 100.00% 100.00%
Rush 100.00% 100.00%
NNE 100.00% 97.14%
NW 100.00% 100.00%
Rush 100.00% 100.00%
NNE 95.54% 93.85%
NW 96.30% 94.50%
Rush 92.13% 92.94%
NNE 100.00% 96.43%
NW 100.00% 100.00%
Rush 80.00% 90.00%
Pre
ven
tin
g p
eo
ple
fro
m d
yin
g p
rem
atu
rely
94%
Cancer 2ww May-17 93%
Cancer 2ww - Breast Symptoms 93%
Cancer 31d DTT - Subs: Radiotherapy May-17
May-17
96%
Cancer 31d DTT - Subs: Surgery May-17 94%
Cancer 31d DTT - Subs: Drugs May-17 98%
Cancer 31d DTT May-17
Po
sit
ive
exp
eri
en
ce o
f
care
62d Urg RTT Cons Upgrade May-17 N/A
62d Urg RTT May-17 85%
62d Urg RTT - Screening Service May-17 90%
Patients
seenBreaches %
Patients
seenBreaches %
Patients
seenBreaches %
62d Urg RTT 49 9 81.63% 27 2 92.59% 48 9 81.25%
62d Urg RTT - Screening Service 2 1 50.00% 2 0 100.00% 0 0
62d Urg RTT Cons Upgrade 2 1 50.00% 1 0 100.00% 2 0 100.00%
Cancer 31d DTT 81 4 95.06% 47 2 95.74% 77 5 93.51%
Cancer 31d DTT - Subs: Surgery 14 0 100.00% 8 0 100.00% 12 1 91.67%
Cancer 31d DTT - Subs: Drugs 20 1 95.00% 10 0 100.00% 15 0 100.00%
Cancer 31d DTT - Subs:
Radiotherapy14 0 100.00% 9 0 100.00% 13 0 100.00%
Cancer 2ww 448 20 95.54% 243 9 96.30% 356 28 92.13%
Cancer 2ww - Breast Symptoms 12 0 100.00% 14 0 100.00% 10 2 80.00%
Nottingham North & East Nottingham West Rushcliffe

Level 1 – Summary of CCG Performance
9
1.1 Cancer - CCG (Cont.) Cancer 62 Day Urgent RTT - Long Waiters
The indicator above displays the number of 62 Day Urgent RTT patients who have been waiting 104 days and longer. This is measured by CCG and encompasses patients being treated by all providers. In May 2017, Nottingham North & East CCG had 2 patients treated who were waiting 104 days or longer whilst on a 62 Day Urgent RTT pathway. Details are below: Patient 1 - 171 Days - Complex Case Patient 2 - 106 Days - Complex Case
CCG Description of Standard Period Standard CCG PatientsLast 12
Months
2017/18
YTD
NNE 2 4
NW 0 0
Rush 2 5
Positive
Experience
of Care
Cancer 62 Day Urg RTT - Patients
Waiting 104+ DaysMay-17 0
Level 1 – Summary of CCG Performance
10
1.2 Referral To Treatment (RTT) - CCG
Referral to Treatment Standards Nottingham North & East CCG achieved the 92% Incomplete standard in May 2017 with performance at 95.75%. However, three specialties did not meet this standard, Neurosurgery (86.96%), Cardiothoracic Surgery (82.35%), and General Medicine (89.19%). The table below shows the performance of individual specialties for Nottingham North & East CCG in May 2017:
Referral to Treatment - Activity v Plan
The above table shows the number of completed admitted and non-admitted pathways during the month. In May 2017,
Nottingham North & East CCG was above plan by 0.25% for completed admitted pathways. Meanwhile completed pathways
for non-admitted patients was above plan by 12.40%.
CCG Description of Standard Period Target CCGPeriod
Perf
Last 12
months
NNE 95.75%
NW 95.64%
Rush 95.82%
NNE 89.58%
NW 90.44%
Rush 90.16%
NNE 3736
NW 2474
Rush 2744Po
sit
ive e
xp
eri
en
ce o
f care RTT - Incomplete pathways (% within 18
weeks)May-17 92%
RTT - Incomplete pathways with a
Decision to Admit (% within 18 weeks)May-17 N/A
New RTT Periods During the Month May-17 N/A
CCG Description of Standard Period CCG Activity Plan % DiffLast 12
months
NNE 804 802 0.25%
NW 492 514 -4.28%
Rush 687 695 -1.15%
NNE 2456 2185 12.40%
NW 1699 1294 31.30%
Rush 1879 1791 4.91%
Acti
vit
y v
Pla
n RTT - Completed Pathways for Admitted
PatientsMay-17
RTT - Completed Pathways for Non-
Admitted PatientsMay-17
New RTT
Periods
Patients 18Wks+ Perf Patients 18Wks+ Perf Patients
180 7 96.11% 60 5 91.67% 103
236 7 97.03% 53 3 94.34% 163
814 34 95.82% 380 20 94.74% 384
650 52 92.00% 115 39 66.09% 251
1053 31 97.06% 324 28 91.36% 421
0 0 0 0 0
23 3 86.96% 6 2 66.67% 11
42 3 92.86% 18 3 83.33% 22
17 3 82.35% 14 3 78.57% 9
37 4 89.19% 2 2 0.00% 23
432 28 93.52% 71 3 95.77% 213
337 22 93.47% 68 18 73.53% 125
399 28 92.98% 226 24 89.38% 216
270 5 98.15% 13 0 100.00% 112
166 6 96.39% 1 0 100.00% 58
101 2 98.02% 1 0 100.00% 62
49 0 100.00% 0 0 42
408 5 98.77% 95 3 96.84% 256
2034 68 96.66% 377 37 90.19% 1267
7248 308 95.75% 1824 190 89.58% 3738
Plastic Surgery
Nottingham North & East
Incomplete
Standard = 92%
Incomplete
With Decision to Admit
General Surgery
Urology
Trauma & Orthopaedics
ENT
Ophthalmology
Oral Surgery
Neurosurgery
Number of patients
waiting over 18 Weeks
Total
Cardiothoracic Surgery
General Medicine
Gastroenterology
Cardiology
Dermatology
Thoracic Medicine
Neurology
Rheumatology
Geriatric Medicine
Gynaecology
Other

Level 1 – Summary of CCG Performance
11
1.3 A&E 4 hour waiting time standard - CCG
NUH performance for A&E Type 1 (consultant-led 24 hour service with full resuscitation facilities) waiting times was below standard during May 2017, which caused failure to achieve 95% for all three South Nottinghamshire CCGs. The performance above does not take into account performance in the Eye Casualty department. Please see Level 2 (page 13-14) for details of actions to improve NUH performance.
The graphs below show the level of A&E Type 1 performance at each CCG since April 2013 and the volume of attendances in the lower graph.
CCG Description of Standard Period Target CCGPeriod
Perf
Last 12
months
2017/18
YTD
NNE 75.97% 78.04%
NW 76.75% 77.16%
Rush 75.95% 77.92%
Positive
experience
of care
A&E waiting time (Type 1 Only) May-17 95%
0%
10%
20%
30%
40%
50%
60%
70%
80%
90%
100%
Ap
r-1
3
Jun
-13
Au
g-1
3
Oct
-13
Dec
-13
Feb
-14
Ap
r-1
4
Jun
-14
Au
g-1
4
Oct
-14
Dec
-14
Feb
-15
Ap
r-1
5
Jun
-15
Au
g-1
5
Oct
-15
Dec
-15
Feb
-16
Ap
r-1
6
Jun
-16
Au
g-1
6
Oct
-16
Dec
-16
Feb
-17
Ap
r-1
7
A&E Type 1 4hr Achievement by CCG
Nottingham North & EastNottingham WestRushcliffeStandard
0
500
1000
1500
2000
2500
3000
Ap
r-1
3
Jun
-13
Au
g-1
3
Oct
-13
Dec
-13
Feb
-14
Ap
r-1
4
Jun
-14
Au
g-1
4
Oct
-14
Dec
-14
Feb
-15
Ap
r-1
5
Jun
-15
Au
g-1
5
Oct
-15
Dec
-15
Feb
-16
Ap
r-1
6
Jun
-16
Au
g-1
6
Oct
-16
Dec
-16
Feb
-17
Ap
r-1
7
A&E Type 1 Attendances by CCG
Nottingham North & East Nottingham West Rushcliffe

Level 1 – Summary of CCG Performance
12
1.5 Healthcare Associated Infections (HCAIs) - CCG
Nottingham North & East CCG experienced no cases of MRSA in May 2017.
May’s standard for Clostridium Difficile infections was within the threshold with 3 cases against a standard of 3.
1.4 Diagnostics Waiting Times - CCG
In May 2017 Nottingham North & East CCG failed to achieve the 1% national standard with performance at 1.12%. Nottingham West CCG were also outside the standard with performance at 1.17%, however, Rushcliffe CCG achieved the standard with performance at 0.54%. Nottingham North & East’s failure to meet the target was due to people waiting longer than 6+ weeks for echocardiography and gastroscopy at NUH.
1.6 Continuing Healthcare - CCG
NHS Continuing Healthcare is the name given to a package of care that is arranged and funded solely by the NHS for individuals who are not in hospital and have been assessed as having a "primary health need".
The Continuing Healthcare indicators include activity that is both fast track and non-fast track. The eligible totals are taken from snapshot figures. Quarter 4 of 2016-17 shows that Nottingham North & East CCG had 69 CHC packages that were newly agreed as eligible in the quarter. Meanwhile, the CCG had 158 eligible CHC packages at the end of the quarter.
CCG Period CCG Eligible Previous Perf
NNE 69
NW 51
Rush 71
NNE 158
NW 78
Rush 124
Continuin
g
Healthcare
Description of Standard
CHC - Newly Eligible in Quarter
CHC - Number Eligible at end of
Quarter
Q4 16-17
Q4 16-17
May-17 NNE 0 0 0 0
May-17 NW 0 0 0 0
May-17 Rush 0 0 0 0
May-17 NNE 3 3 7 6
May-17 NW 1 7 3 9
May-17 Rush 2 5 4 5
Period
Perf
HC
AIs
MRSA
C-Diff
YTD
Standard
2017/18
YTDCCG Description of Standard Period
Period
StandardLast 12 monthsCCG
CCG Description of Standard Period Target CCGPeriod
Perf
Last 12
months
NNE 1.12%
NW 1.17%
Rush 0.54%
1%
Positive
experience
of care
Diagnostics (% of patients waiting over
six weeks)May-17

Level 2 – NUH Performance
13
NUH 2.1 Cancer Waiting Times
In May 2017, NUH failed to achieve the Cancer 62 day standard with performance at 76.12% against the national standard of 85%, the standard has not been achieved in any of the last 12 months. The 2 week wait 93% standard was also not met with performance at 92.97% in May. NUH achieved all other cancer standards in May 2017.
62 Day Urgent RTT - 104+ Day Waiters—Patients seen during the month
During May 2017 NUH had seen 11 patients who had waited over 104 days. Reasons for the long waits were as follows - 4 x Late Tertiary 3 x Complex Case 1 x Patient Unfit 1 x Capacity
62 Day Urgent RTT - 104+ Day Waiters - Patients still waiting at the end of the month From May 2017 CCGs are required to report to trusts via a letter the number of patients waiting 104 days or more from urgent GP referral to first definitive treatment. As at the end of April 2017 NUH had 25 patients waiting 104 days or more, this compares to 32 at the end of March 2017. Any outcomes and learning from RCAs will also be reported in the future.
May-17 Q4 2016-17
62d Urg RTT 85% 76.12% 74.86% 77.18%
62d Urg RTT - Screening Service 90% 96.30% 95.21% 96.00%
62d Urg RTT Cons Upgrade N/A 74.36% 79.49% 77.42%
Cancer 31d DTT 96% 96.23% 96.50% 96.17%
Cancer 31d DTT - Subs: Surgery 94% 95.45% 91.34% 94.87%
Cancer 31d DTT - Subs: Drugs 98% 98.85% 99.49% 98.83%
Cancer 31d DTT - Subs: Radiotherapy 94% 99.19% 98.48% 98.64%
Cancer 2ww 93% 92.97% 94.97% 93.08%
Cancer 2ww - Breast Symptoms 93% 94.68% 93.73% 91.50%
2017/18
YTD
PeriodP
reven
tin
g p
eo
ple
fro
m d
yin
g p
rem
atu
rely
Po
sit
ive
exp
eri
en
ce
of
care
NUH Description of Standard TargetLast 12
months
NUH Description of Standard Period Standard PatientsLast 12
Months
2017/18
YTD
Positive
Experience
of Care
Cancer 62 Day Urg RTT - Patients
Waiting 104+ DaysMay-17 0 9 16

Level 2 – NUH Performance
14
NUH 2.1 Cancer Waiting Times (cont.) Cancer 62 day RTT Performance by Tumour Site
The above table shows the performance of 62 day cancer (excluding rare cancers) at NUH for all patients by tumour site for May
2017. There are two tumour sites where performance has been consistently below standard over the last 12 months—Lower
Gastrointestinal and Lung.
Escalation Due to continued below standard performance a Remedial Action Plan (RAP) is in place for 62 day, actions include - Focus on Lung, Upper GI, Lower GI Lung - Increase diagnostic and outpatient capacity Lung - Improve pathway management, reporting and escalation of patient pathways and administration UGI - Reduce new appointment waiting time to maximum of 10 days - offer increased 2ww slots UGI - Escalate patients wishing to book appointments outside of 10 days UGI - Secure additional capacity UGI - Provide NUH consultant presence at Kings Mill to help navigate patients towards NUH in a more timely fashion UGI - Increase cohort of endoscopists able to perform UGI endoscopies LGI - Implementation of 7 day testing for histo for GI patients. LGI - Recruit to administrative vacancies to reduce typing turnaround for all patients on 2ww pathway LGI - Increased capacity for flexi to support faster diagnostics pathways
Patients % Chart Patients %
Brain/Central Nervous System May-17 85% 0.5 100% 2 50.00%
Breast May-17 85% 42.5 90.59% 353 95.47%
Gynaecological May-17 85% 10 85.00% 122 85.25%
Haematological (Excluding Acute
Leukaemia)May-17 85% 12 91.67% 137.5 86.18%
Head & Neck May-17 85% 14.5 68.97% 130 71.92%
Lower Gastrointestinal May-17 85% 19.5 56.41% 174 55.46%
Lung May-17 85% 23 63.04% 260.5 53.93%
Other May-17 85% 0 N/A 12.5 64.00%
Sarcoma May-17 85% 2.5 60.00% 29 72.41%
Skin May-17 85% 1 0.00% 23.5 51.06%
Upper Gastrointestinal May-17 85% 11.5 65.22% 154.5 65.37%
Urological (Excluding Testicular) May-17 85% 41 79.27% 417.5 79.76%
Total (Excluding Rare Cancers) May-17 85% 178 76.12% 1816 75.22%
Last 12 MonthsNUH Tumour Site Period Standard
Latest Period
Ca
nce
r 6
2 D
ay R
TT
Pe
rfo
rma
nce
by T
um
ou
r S
ite
fo
r a
ll C
CG
pa
tie
nts
at N
UH
(A
dm
itte
d
& N
on
Ad
mitte
d)
Level 2 – NUH Performance
15
NUH 2.2 Referral To Treatment (RTT)
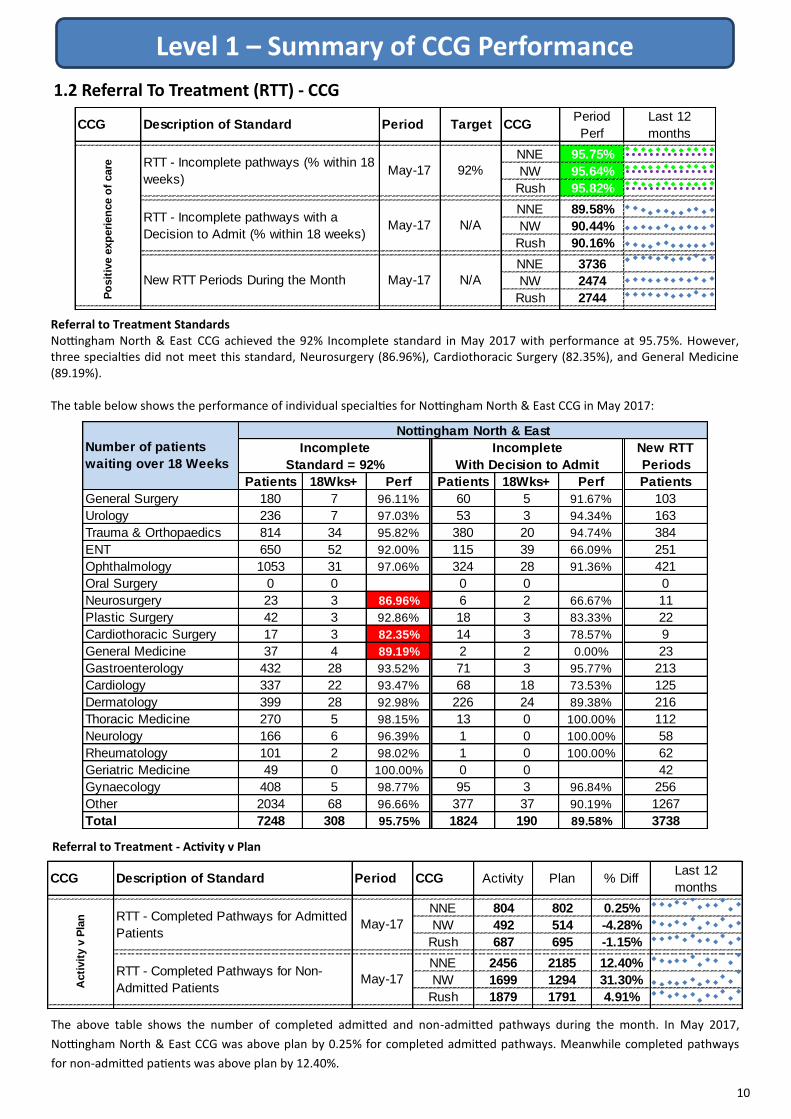
During May 2017 the 92% Incomplete standard was achieved for all specialties except Neurosurgery (91.89%) and
Cardiothoracic Surgery (90.05%). Incomplete with Decision to Admit does not currently have a national standard, but does
show that 87.43% of patients with a decision to admit are currently waiting under 18 weeks.
The table below shows the number of patients still waiting at NUH at the end of April 2017 segmented by time band and upload specialty.
NUH Description of Standard Period TargetPeriod
Perf
Last 12
months
RTT - Incomplete pathways (% within 18
weeks)May-17 92% 95.85%
.RTT - Incomplete pathways with a
Decision to Admit (% within 18 weeks)May-17 N/A 87.43%
.
New RTT Periods During the Month May-17 N/A 16154
Po
sit
ive
exp
eri
en
ce o
f care
New RTT
Periods
Patients 18Wks+ Perf Patients 18Wks+ Perf Patients
313 18 94.25% 136 18 86.76% 171
867 29 96.66% 221 19 91.40% 640
3634 276 92.41% 1571 216 86.25% 1715
3593 261 92.74% 700 182 74.00% 1239
5525 200 96.38% 1788 170 90.49% 2182
1292 20 98.45% 173 15 91.33% 659
456 37 91.89% 167 21 87.43% 217
321 14 95.64% 160 11 93.13% 177
182 15 91.76% 138 14 89.86% 120
36 1 97.22% 3 0 100.00% 12
857 37 95.68% 174 11 93.68% 504
1816 143 92.13% 515 121 76.50% 582
0 0 0 0 0
855 15 98.25% 64 4 93.75% 372
1264 18 98.58% 4 0 100.00% 517
0 0 0 0 0
162 2 98.77% 5 0 100.00% 148
1015 7 99.31% 152 6 96.05% 635
9614 228 97.63% 1815 171 90.58% 6264
31802 1321 95.85% 7786 979 87.43% 16154Total
Other
Gynaecology
Geriatric Medicine
Rheumatology
Neurology
Thoracic Medicine
Dermatology
Cardiology
Gastroenterology
General Medicine
Cardiothoracic Surgery
Plastic Surgery
Neurosurgery
Oral Surgery
May-17
Incomplete
Standard = 92%
Incomplete
With Decision to Admit
Ophthalmology
ENT
Trauma & Orthopaedics
Urology
General Surgery
Number of patients
waiting over 18 Weeks
May-17 26-40 Wks 40-48 Wks 48-52 Wks 52 Wks+
General Surgery 9 0 0 0
Urology 5 0 1 0
Trauma & Orthopaedics 85 10 2 2
Ear, Nose & Throat (ENT) 87 5 0 0
Ophthalmology 28 0 0 0
Oral Surgery 4 0 0 0
Neurosurgery 8 1 0 0
Plastic Surgery 1 0 0 0
Cardiothoracic Surgery 4 0 0 1
General Medicine 0 0 0 0
Gastroenterology 10 0 0 0
Cardiology 38 0 0 0
Geriatric Medicine 1 0 0 0
Other 68 7 2 0
Total 349 24 5 3
There were three patients reported as having waited over 52 weeks at the end of May. One trauma & orthopaedics patient relates to spines and has a surgery date of June 2017 due to patient choice. The other trauma & orthopaedic patient also relates to spines and has a surgery date of August 2017 due to patient choice. The thoracic patient has a surgery date of July 2017 after several patient-initiated delays.

Level 2 – NUH Performance
16
NUH 2.3.1 A&E 4 hour waiting time standard
In June 2017 the national 95% performance level was not met with NUH performance at 81.60%, the standard has not been met in any of the last 12 months. There is a Remedial Action Plan (RAP) in place. Actions being taken to improve performance are bulleted below -
Deliver 95% non-admitted performance
Reduce non-admitted breaches related to medical wait to be seen to less than 20%
Revised pathways in place for ‘GP expect’ attendances to ED to reduce overcrowding within the department. Further modelling required to understand impact on performance
Implementation of Band 7 at front door to deliver ‘Luton model’ to increase % of patients seen by primary care to 20%
Review of function of ‘Green team’ following effective implementation of front door model and pathways for GP expects. Modelling will confirm breach reduction through reduction in WTBS caused by high department occupancy or cubicle space
Adoption of ‘Home First’ mantra through effective engagement between acute and community teams
Review of LJU model to ensure maximum impact on ability to reduce breaches. To be monitored by a reduction in admitted and non-admitted breaches with trajectory set once modelled
Achievement against trajectories which will reduce the wait to be seen in the department through a reduction in handover time and time for IAU cycle to be completed
Revision and implementation of ED consultant rotas to improve overnight and weekend cover
Domain Description of Standard Target Jun-17Last 12
months
2017/18
YTD
A&E waiting time - QMC + Eye Cas 95% 81.60% 81.21%
A&E waiting time - QMC only 95% 79.30% 79.08%
A&E waiting time - Eye Cas only 95% 99.52% 99.07%
Positiv
e
experience o
f
care
0%
10%
20%
30%
40%
50%
60%
70%
80%
90%
100%
Ap
r-1
4
May
-14
Jun
-14
Jul-
14
Au
g-1
4
Sep
-14
Oct
-14
No
v-1
4
Dec
-14
Jan
-15
Feb
-15
Mar
-15
Ap
r-1
5
May
-15
Jun
-15
Jul-
15
Au
g-1
5
Sep
-15
Oct
-15
No
v-1
5
Dec
-15
Jan
-16
Feb
-16
Mar
-16
Ap
r-1
6
May
-16
Jun
-16
Jul-
16
Au
g-1
6
Sep
-16
Oct
-16
No
v-1
6
Dec
-16
Jan
-17
Feb
-17
Mar
-17
Ap
r-1
7
May
-17
Jun
-17
Jul-
17
Au
g-1
7
Sep
-17
Oct
-17
No
v-1
7
Dec
-17
Jan
-18
Feb
-18
Mar
-18
NUH - A&ENational TrajectoryLocal TrajectoryPerformance
Contract Query Notice, which was raised on 21/06/2012, closed on 01/08/2013 as NUH made 95% standard in 3 consecutive months
Contract Query Notice raised on 05/08/2014
Contract Query Notice closed on 13/05/2015 due to improved performance in April and May
Remedial Action Plan raised on 12/01/2016

Level 2 – NUH Performance
17
NUH 2.3.1 A&E 4 hour waiting time standard (cont.)
NUH 2.3.2 A&E 12 Hour Trolley Waits
The chart below shows A&E performance and attendances at NUH between 1st July 2016 and 25th June 2017.
As well as the Remedial Action Plan there continues to be bi-weekly monitoring of the updated System Resilience Plan, which is centred around the following themes - Front Door
New model of front door primary care Development of integrated urgent care
Internal Flow NUH led actions to embed Safer bundle across Trust wards Multi agency discharge events have taken in place on Trust wards, these have identified opportunities for improvement
External Flow Focus on interface with external capacity for medically fit for discharge patients System-wide capacity and flow review
Enablers Development of system wide dashboard Development of System Resilience Group process for allocation of resilience funding
During May 2017 there were no breaches of the 12 hour trolley wait standard at NUH.
0
100
200
300
400
500
600
700
800
900
1000
0%
10%
20%
30%
40%
50%
60%
70%
80%
90%
100%
Jul-16 Aug-16 Sep-16 Oct-16 Nov-16 Dec-16 Jan-17 Feb-17 Mar-17 Apr-17 May-17 Jun-17A
tte
nd
ance
s
Pe
rfo
rman
ce
NUH A&E Performance Jul16-Jun17Attendances BreachesPerformance Standard
NUH Description of Standard Period Target
NUH
Responsible
Breaches in
period
NUH Responsible
Breaches:
Last 12 months
NUH
Responsible
Breaches
YTD
Non-NUH
Responsible
Breaches
YTD
Number of 12 hour trolley waits in A&E May-17 0 0 0 0

Level 2 – NUH Performance
18
NUH 2.4 Cancelled Operations
In total, there were 331 cancelled operations in May 2017 of which 84 were on the day of admission and 247 were cancelled
prior to the day of admission, this equates to a total of 3.60% elective admissions being cancelled either on the day or prior to
the day of admission.
The cancelled operations national standard was not achieved in May 2017 in which there were 84 ‘on the day’ cancellations.
6 cancelled operations were not rebooked within 28 days which is a breach of the no tolerance national standard.
The table below shows the number of on the day cancellations at NUH broken down by reason.
The table below shows the total number of cancelled operations for NUH over the most recent 12 month period available.
Over the past 12 months, list overrun - clinical reasons and replaced by an emergency patient are the most common reasons
given for on the day cancellations at NUH. Staffing and administrative error are also cited by NUH as frequent reasons for
cancellation.
NUH 2.5 Diagnostics Waiting Times
NUH achieved the Diagnostics standard for the sixteenth consecutive month in May 2017 with performance at 0.77%. There
were 56 breaches in May with 37 relating to Cardiology - echocardiography, 11 to Gastroscopy, 4 to Respiratory physiology -
sleep studies, 2 to Audiology - audiology assessments, 1 to Colonoscopy, and 1 to Flexi sigmoidoscopy.
NUH Description of Standard Period TargetPeriod
Perf
Last 12
months
Diagnostics (% of patients waiting over
six weeks)May-17 1% 0.77%
NUH Description of Standard Period TargetPeriod
Perf
Last 12
months
Cancelled Ops - % of elect act May-17 0.8% 0.91%
Cancelled Operations - Rebooked 28
days+May-17 0 6
Number of urgent operations cancelled
for a second timeMay-17 0 0
Positiv
e
experience o
f
care
Jun-16 Jul-16 Aug-16 Sep-16 Oct-16 Nov-16 Dec-16 Jan-17 Feb-17 Mar-17 Apr-17 May-17Last 12
Months
On the day Cancelled Operations 62 67 47 26 27 45 61 71 40 46 45 84 621
Prior to the day Cancelled Operations 185 236 274 218 187 204 193 280 263 294 214 247 2795
Total Cancelled Operations 247 303 321 244 214 249 254 351 303 340 259 331 3416
Reason for Cancellation Jun-16 Jul-16 Aug-16 Sep-16 Oct-16 Nov-16 Dec-16 Jan-17 Feb-17 Mar-17 Apr-17 May-17Last 12
Months
Administrative Error 6 12 10 7 4 3 7 4 7 2 8 2 80
Equipment Unavailable 8 3 9 2 0 1 0 4 4 2 0 18 56
Hospital Clinical Cancellation 0 0 0 0 0 0 0 0 0 0 0 0 0
External Issues 0 0 0 0 0 0 0 0 0 0 0 0 0
ICU/HDU Bed Unavailable 5 2 5 0 1 2 2 1 0 0 0 5 23
List overrun - clinical reasons 3 7 13 7 11 14 7 19 8 15 11 15 133
List overrun - non-clinical reasons 9 2 0 1 1 0 1 0 0 2 0 2 31
Other 0 26 2 2 0 12 22 2 2 0 1 9 79
Replaced by emergency patient 9 7 3 2 1 7 9 6 12 6 22 8 104
Replaced by other patient 3 1 0 0 0 1 0 0 0 0 0 0 5
Staffing 15 7 3 1 7 1 9 26 3 12 3 7 98
Theatre unavailable 0 0 0 0 0 0 0 0 0 0 0 0 1
Ward Bed Unavailable 4 0 2 4 2 4 4 9 4 7 0 18 68
Unknown 0 0 0 0 0 0 0 0 0 0 0 0 6
Total 62 67 47 26 27 45 61 71 40 46 45 84 684

Level 2 – NUH Performance
19
NUH 2.7 NHS E-Referral Report
NUH 2.6 Appointment Slot Issues
During the appointment booking process, the NHS e-Referral Service will allow the referral to enter the Appointment Slot Issues process if there are no slots available for booking at the time of the appointment search. The above indicator displays the ratio of slot issues per successful Directly Bookable Service (DBS) booking. It is not necessarily the same as the ratio of patients encountering slot issues, as some patients may encounter multiple issues. NUH failed to meet the slot unavailability standard of 0.04 issues per successful DBS booking with performance at 0.17. The specialties with the largest number of slot issues are: Ear, Nose, and Throat - 266 slot issues Ophthalmology - 234 slot issues Two week wait - 170 slot issues Child and Adolescent Services - 144 slot issues Neurology - 109 slot issues Gastrointestinal and Liver - 88 slot issues
NUH Description of Standard Period TargetPeriod
Perf
Last 12
months
2017/18
YTD
Ratio of slot issues per successful DBS
bookingApr-17 0.04 0.17 0.17
NUH Description of Standard Period TargetPeriod
Perf
Last 12
months
Patients waiting less than 7 working
days to arrange an appointmentMay-17 95% 36%
Patients waiting less than 14 working
days to arrange an appointmentMay-17 100% 54%
NH
S E
-
Refe
rral A
SIs
The NHS E-Referral report details how long it takes the Trust to contact patients who have had slot issues. During May 2017, 648 patients had slot issues with 236 patients waiting less than 7 working days. However, 412 were waiting longer than 7 working days and 297 patients were waiting beyond 14 working days. The main issue is within ENT where 322 patients were waiting over 7 days and 252 over 14 days.

Level 2 – NUH Performance
20
NUH 2.8 Delayed Transfers of Care
The number of days delayed in April 2017 was below the average of 1522 per month during 2016/17 with 891 days delayed during the month.
As of April 2017, providers are no longer required to provide a snapshot figure of the number of current delays in their statutory reporting.
The above table shows that NUH has been deemed responsible for the majority of DTOCs in April 2017. The most common reason for delays was due to a lack of capacity in further non acute NHS care with a total of 473 days delayed during the month. Additionally, patient or family choice also caused a sizeable number of delays during the month with 198 total days delayed throughout April 2017.
There is a threshold of 3.5% for the rate of delays affecting occupied bed days during the month. NUH experienced delayed transfers of care in 2.0% of all occupied bed days in April 2017. This is the sixth time in the last 12 months that NUH has achieved the target.
Nottingham University
Hospitals
Reason For Delay
March 2017
NHS Responsible
for Delay
Social Care
Responsible for
Delay
Both NHS & Social
Care Responsible
for Delay
A) Completion of assessment 0 12 0
B) Public Funding 0 0 0
C) Further non acute NHS care
(including intermediate care, rehab, etc)473 0 0
Di) Aw aiting Residential Care Home
Placement70 0 0
Dii) Aw aiting Nursing Home Placement 33 0 0
E) Care package in ow n home 34 0 30
F) Community Equipment/adaptions 15 0 0
G) Patient or family choice 198 0 0
H) Disputes 0 0 0
I) Housing - patients not covered by
NHS and Community Care Act26 0 0
O) Other 0 0 0
Total 849 12 30
Number of Days Delayed (total during month)
NUH Description of Standard Period TargetPeriod
Perf
Last 12
months
DToC - Acute/Non-Acute 18+ - Days
DelayedApr-17 Minimum 891
Domain Description of Standard Period TargetPeriod
Perf
Last 12
months
DToC - % Rate of Occupied Bed Days Apr-17 3.5% 2.0%

Level 2 – NUH Performance
21
NUH 2.11 Ambulance Handovers
NUH 2.10 Mixed Sex Accommodation Breaches (MSA)
Ambulance handovers to the Emergency Department (ED) remain above the national standards, the key reasons for this include: High levels of occupancy in ED cubicles Continuing increase in ambulance attendances There are a high proportion of vacancies To improve performance there is an action plan in place.
During May 2017, there were no Mixed Sex Accommodation breaches at NUH.
NUH 2.9 Healthcare Associated Infections (HCAIs)
Please be aware that the trust will only be penalised for MRSAs that are considered avoidable and Clostridium Difficile infections that are considered to be due to lapses in care. During May 2017 NUH had 10 Clostridium Difficile infections. Information is currently forthcoming as to how many of these were avoidable. Year to date there has been 13 Clostridium Difficile infections against a standard of 14. NUH had 0 cases of MRSA during May 2017. Year to date there has been 0 cases of MRSA that were deemed clinically avoidable.
NUH 2.12 Venous Thromboembolism (VTE)
March 2017 performance is below standard with performance at 94.96% of eligible patients for VTE assessed within 24 hours. Actions to improve performance include - VTE Clinical Nurse Specialist commenced her role on the 31st October 2016. Key focus on initiatives to drive compliance
with 95% standard. Undertaking ward visits to areas with poorer compliance VTE risk assessment will move to Nervecentre from early 2017 - easier access to complete, review, and update Review of clinically low-risk exempt cohorts to identify whether further groups should be cohorted out Performance can be accessed in real-time across the Trust via Qlikview. Wards can be made aware of patients approaching
24 hours
AllAvoidable /
LapseAll
Avoidable /
Lapse
MRSA (Full year standard = 0) May-17 0 0 0 0 0
C-Diff(YTD standard = 14)
(Current month standard = 7)May-17 14 10 TBC 13 0
2017/18 YTDLast 12 months
Avoidable / Lapse
HC
AIs
NUH Description of Standard PeriodYTD
Standard
Period Perf
NUH Description of Standard Period TargetPeriod
Perf
Last 12
months
2016/17
YTD
Percentage of patients assessed for risk
of VTE on admissionMar-17 95% 94.96% 94.22%
NUH Description of Standard Period TargetPeriod
Perf
Last 12
months
Mixed Sex Accommodation Breaches May-17 0 0
NUH Description of Standard Period TargetPeriod
Perf
Last 12
months
Ambulance A&E handovers over 30
minutesMay-17 0 380
Ambulance A&E handovers over 60
minutesMay-17 0 25
Am
bula
nce
Handovers

Level 2 – NUH Performance
22
NUH 2.14 Publication of Formulary
NUH 2.13 Friends & Family Test The Friends and Family score is calculated using the proportion of patients who would strongly recommend minus those who
would not recommend, or who are indifferent.
NUH failed to achieve the Friends and Family Test response rate standards for Maternity Questions 1-3 during April 2017.
The Trusts’ formulary is published by the Nottinghamshire Area Prescribing Committee. The formulary aims to provide
information on medicines available to prescribers in Nottinghamshire reflecting safe, evidence-based and cost-effective choices.
NUH 2.15 Duty of Candour breaches
NUH have had no Duty of Candour breaches during 2016/17.
NUH 2.16 Never Events
There were no Never Events reported in May 2017. Year-to-date NUH has experienced 0 Never Events.
NUH Description of Standard Period TargetPeriod
Perf
Last 12
months
Publication of Formulary Mar-17 Yes Yes
NUH Description of Standard Period TargetPeriod
Perf
Last 12
months
2016/17
YTD
Duty of Candour Breaches Mar-17 0 0 0
NUH TargetApr-17
Perf
Last 12
months
2017/18
YTD
% Recommended 68% 93.78% 93.78%
Number of Responses 2203 2203
Response Rate 20% 27.96% 27.96%
% Recommended 68% 97.58% 97.58%
Number of Responses 3519 3519
Response Rate 30% 37.23% 37.23%
% Recommended 99.34% 99.34%
Number of Responses 151 151
Response Rate 25% 22.30% 22.30%
% Recommended 100% 100%
Number of Responses 94 94
Response Rate 25% 13.88% 13.88%
% Recommended 96.64% 96.64%
Number of Responses 149 149
Response Rate 25% 22.01% 22.01%
% Recommended 99.53% 99.53%
Number of Responses 214 214
Response Rate 25% 31.61% 31.61%
Description of Standard
Friends &
Fam
ily T
est
A&E: How likely are you to recommend
our A&E department to friends and family
if they needed similar care or treatment?
Inpatient: How likely are you to
recommend our w ard to friends and
family if they needed similar care or
treatment?
Maternity Q1: How likely are you to
recommend our antenatal service to
friends and family if they needed similar
care or treatment?
Maternity Q2: How likely are you to
recommend our labour w ard to friends
and family if they needed similar care or
treatment?
Maternity Q3: How likely are you to
recommend our postnatal w ard to friends
and family if they needed similar care or
treatment?
Maternity Q4: How likely are you to
recommend our postnatal community
service to friends and family if they
needed similar care or treatment?
NUH Description of Standard Period TargetPeriod
Perf
Last 12
months
2017/18
YTD
Never Events May-17 0 0 0

Level 2 – NUH Performance
23
NUH 2.19 Falls
NUH 2.17 Summary Hospital Level Mortality Indicator (SHMI)
The Summary Hospital Level Mortality Indicator (SHMI) standard has been achieved during March 2017.
NUH 2.18 Pressure Ulcers
NUH 2.20 Mandatory Training
The Trust failed to achieve the Falls per 1000 Occupied Bed Days resulting in harm indicator for May 2017 with performance at
1.00 against a standard of 0.98. The standard was revised from 1.70 to 0.98 in June 2016.
The Trust are failing to achieve the rolling 12 months standard of 90% to May 2017 with performance at 86%.
To improve performance, a new approach to mandatory training went live from April 2017 which will create more choice for
individuals to complete their mandatory training. On-going monitoring at specialty level is also taking place.
NUH 2.21 Appraisals
The Trust has a target to deliver appraisals to 90% of staff over a rolling 12 month period. The past rolling twelve months from
June 2016 — May 2017 period is achieving the 90% standard with performance at 90%. Monthly performance for May 2017 is
not currently available.
NUH failed to achieve the standard for the reduction grade 3 pressure ulcers but did meet the target for the reduction in grade 2
and 4 pressure ulcers during March 2017.
NUH Description of Standard Period TargetPeriod
Perf
Last 12
months
2016/17
YTD
Summary Hospital Level Mortality
Indicator (SHMI)Mar-17
Not higher
than expected1.03 1.04
NUH Description of Standard Period TargetPeriod
Perf
Last 12
months
Reduction of grade 2 Pressure Ulcers
per 1000 Occupied Bed DaysMar-17 0.33 0.27
Reduction of grade 3 Pressure Ulcers
per 1000 Occupied Bed DaysMar-17 0.06 0.11
Reduction of grade 4 Pressure Ulcers
per 1000 Occupied Bed DaysMar-17 0.00 0.00P
ressure
Ulc
ers
NUH Description of Standard Period TargetPeriod
Perf
Last 12
months
2017/18
YTD
Falls per 1000 Occupied Bed Days
resulting in harmMay-17 0.98 1.00 1.10
Falls
NUH Description of Standard Period Target PerfRolling 12
Months
Mandatory Training12 Months
to May-1790% 86%
NUH Description of Standard Period Target PerfRolling 12
Months
Rolling 12
Months
Appraisals May-17 90% N/A 91%

24
Leve
l 2 –
NU
H P
erf
orm
ance
NU
H P
ee
r H
os
pit
al P
erf
orm
an
ce
Pe
er
Pe
rfo
rman
ce
Ple
ase
no
te t
hat
th
e in
dic
ato
rs in
th
e ta
ble
ab
ove
may
sh
ow
diff
eren
t p
erio
ds
to t
he
sam
e in
dic
ato
rs in
th
e re
st o
f Le
vel 2
, th
is is
bec
ause
dat
a fo
r p
eer
ho
spit
als
is o
nly
ava
ilab
le o
nce
it is
mad
e p
ub
lic, w
her
eas
we
can
ob
tain
NU
H d
ata
dir
ect
fro
m t
he
tru
st.
NU
H h
ave
ach
ieve
d t
he
targ
et f
or
11
of
the
16
ind
icat
ors
th
at h
ave
nati
on
al t
arge
ts.
Of
the
ind
icat
ors
NU
H f
aile
d, t
he
follo
win
g n
um
ber
of
oth
er t
rust
s al
so f
aile
d t
hat
ind
icat
or
– A
&E
Ach
ieve
men
t =
10
ou
t o
f 1
2, C
ance
r 6
2 d
ay U
rgen
t R
TT =
9 o
ut
of
12
, Can
cer
62
day
Urg
ent
RTT
- C
on
sult
ant
Up
grad
e =
10
ou
t o
f 1
2, C
ance
r 2
we
ek w
ait:
Bre
ast
Sym
pto
ms
= 5
ou
t o
f 1
0, R
TT A
dm
itted
= 1
1 o
ut
of
12
.
Ind
icato
rT
arg
et
Bas
isP
eri
od
Cam
bridge
Univ
ers
ity
Hospita
ls F
T
Centr
al
Mancheste
r
Univ
ers
ity
Hospita
ls F
T
Lancashire
Teachin
g
Hospita
ls F
T
Leeds
Teachin
g
Hospita
ls
Nottin
gham
Univ
ers
ity
Hospita
ls
Oxfo
rd
Radclif
fe
Hospita
ls
Royal
Liv
erp
ool
and
Bro
adgre
en
Univ
ers
ity
Hospita
ls
Sheff
ield
Teachin
g
Hospita
ls F
T
South
am
pto
n
Univ
ers
ity
Hospita
ls
The
New
castle
Upon T
yne
Hospita
ls F
T
Univ
ers
ity
Hospita
l
Birm
ingham
FT
Univ
ers
ity
Hospita
ls
Bristo
l FT
Univ
ers
ity
Hospita
ls o
f
Leic
este
r
A&
E a
chie
vem
ent
95%
Month
Apr-
17
97.3
2%
93.6
9%
90.2
7%
91.7
2%
82.2
5%
88.8
4%
90.8
9%
91.8
9%
89.4
5%
95.0
7%
82.6
9%
82.3
1%
81.0
3%
Cancer
62d U
rg R
TT
85%
Month
Apr-
17
78.6
4%
82.6
1%
81.0
7%
72.9
6%
78.5
2%
86.4
1%
86.3
6%
83.5
7%
84.4
3%
86.8
2%
66.2
4%
76.8
0%
83.8
8%
Cancer
62d U
rg R
TT-S
cre
enin
g S
erv
ice
90%
Month
Apr-
17
100.0
0%
100.0
0%
100.0
0%
90.9
1%
95.6
5%
89.6
6%
91.4
9%
100.0
0%
94.2
9%
91.8
4%
92.3
1%
66.6
7%
95.0
0%
Cancer
62d U
rg R
TT-C
ons U
pgra
de
94%
Month
Apr-
17
60.0
0%
91.6
7%
93.5
5%
77.7
8%
82.6
1%
100.0
0%
100.0
0%
71.7
4%
87.5
0%
75.0
0%
91.5
7%
93.1
0%
66.6
7%
Cancer
31d D
TT
96%
Month
Apr-
17
96.1
9%
96.5
9%
97.3
9%
96.3
9%
96.1
0%
98.3
7%
97.0
4%
98.4
7%
97.6
0%
98.1
2%
97.8
2%
91.1
8%
96.0
8%
Cancer
31d D
TT -
Subs: S
urg
ery
94%
Month
Apr-
17
94.7
4%
86.6
7%
95.9
5%
94.5
1%
94.1
2%
94.3
8%
95.0
0%
100.0
0%
96.7
7%
95.5
0%
97.3
9%
82.6
1%
85.5
3%
Cancer
31d D
TT -
Subs: D
rugs
98%
Month
Apr-
17
98.3
9%
100.0
0%
100.0
0%
100.0
0%
98.8
1%
100.0
0%
100.0
0%
99.4
8%
99.2
3%
99.2
2%
98.4
8%
99.1
4%
98.7
3%
Cancer
31d D
TT -
Subs: R
adio
thera
py
94%
Month
Apr-
17
95.7
1%
99.1
4%
100.0
0%
97.9
4%
98.7
5%
96.8
5%
99.4
4%
98.9
3%
98.3
6%
98.1
3%
95.0
5%
Cancer
2w
w93%
Month
Apr-
17
94.5
1%
90.3
2%
94.9
6%
93.3
8%
93.1
8%
92.3
6%
94.8
5%
95.1
5%
92.1
7%
94.2
9%
91.7
9%
95.0
7%
93.2
9%
Cancer
2w
w -
Bre
ast S
ym
pto
ms
93%
Month
Apr-
17
95.0
0%
92.5
5%
93.3
0%
88.6
8%
100.0
0%
93.1
4%
93.3
7%
81.7
3%
89.8
9%
94.6
4%
89.5
8%
Dia
gnostic
Test W
T1%
Month
Apr-
17
0.9
1%
3.0
4%
0.9
7%
0.4
3%
0.3
5%
1.2
1%
10.9
3%
0.9
5%
0.9
9%
0.9
8%
0.6
2%
1.4
4%
0.8
5%
DToC
- A
cute
/Non-A
cute
18+
Min
imum
Month
Apr-
17
61
34
75
63
30
110
11
95
107
44
58
32
29
Friends &
Fam
ily -
A&
E (
% R
ecom
mended)
Local
Month
Apr-
17
95.2
1%
89.7
9%
85.7
9%
88.0
6%
93.7
8%
88.9
3%
83.6
4%
88.4
7%
95.8
9%
90.3
6%
85.7
1%
83.1
9%
94.4
3%
Friends &
Fam
ily -
A&
E (
Response R
ate
)20%
Month
Apr-
17
21.8
1%
12.4
9%
10.2
5%
24.3
9%
27.9
6%
21.2
5%
19.8
4%
22.9
7%
2.8
9%
5.5
2%
10.6
5%
15.8
6%
13.8
3%
Friends &
Fam
ily -
IP (
% R
ecom
mended)
Local
Month
Apr-
17
96.4
7%
95.4
4%
92.3
7%
95.3
3%
97.5
7%
95.4
2%
92.4
3%
95.8
5%
96.6
3%
97.2
1%
96.8
0%
97.1
7%
97.2
7%
Friends &
Fam
ily -
IP (
Response R
ate
)20%
Month
Apr-
17
11.1
1%
25.6
2%
26.6
2%
34.3
5%
37.4
8%
20.4
5%
28.8
5%
30.4
1%
20.8
5%
14.6
4%
14.2
3%
34.6
0%
32.3
9%
MR
SA
Local
YTD
Mar-
17
38
113
66
23
17
01
3
C-D
iff
Local
YTD
Mar-
17
47
74
57
116
93
53
54
110
38
74
92
31
60
MS
A B
reaches
Min
imum
Month
May-1
70
00
00
00
00
00
93
MS
A B
reach R
ate
(per
1000 f
in c
ons e
ps)
Min
imum
Month
May-1
70.0
00.0
00.0
00.0
00.0
00.0
00.0
00.0
00.0
00.0
00.0
00.7
30.1
2
RTT -
Adm
itted
90%
Month
Apr-
17
69.7
4%
82.9
6%
70.3
8%
76.0
2%
80.3
1%
72.7
7%
71.9
7%
87.2
6%
83.2
9%
90.2
1%
84.3
8%
72.3
8%
76.4
3%
RTT -
Non a
dm
itted
95%
Month
Apr-
17
90.2
0%
92.4
4%
82.2
4%
88.8
5%
96.8
3%
85.6
9%
89.1
7%
93.7
0%
91.2
1%
95.4
3%
86.2
4%
89.1
6%
87.5
4%
RTT -
Incom
ple
te92%
Month
Apr-
17
90.9
9%
92.0
0%
83.8
1%
87.8
8%
95.6
4%
89.9
3%
88.8
0%
95.2
8%
92.0
6%
93.8
3%
92.4
8%
91.1
3%
91.3
0%

Level 2 – SFHFT Performance
25
SFHFT 2.1 Cancer Waiting Times
SFHT failed to achieve the standard for Cancer 62 day RTT (79.87% against standard of 85%), Cancer 62 day RTT - Screening
Service (83.33% against standard of 90%), and Cancer 31 day DTT Subsequent Treatment: Surgery (90.91% against standard of
94%). Aside from this, SFHT achieved all other targets for Cancer in May 2017.
SFHFT 2.2 Referral To Treatment (RTT)
SFHT achieved the Incomplete 92% standard during May 2017 with performance at 93.00%. Incomplete pathways with a
decision to admit does not have a national standard but shows that 86.01% of incomplete patients who have a decision to
admit are waiting less than 18 weeks. In May 2017, there were 6258 new RTT pathways started at SFHT.
SFHT Description of Standard Period TargetPeriod
Perf
Last 12
months
2017/18
YTD
62d Urg RTT May-17 85% 79.87% 82.73%
62d Urg RTT - Screening Service May-17 90% 83.33% 92.31%
62d Urg RTT Cons Upgrade May-17 N/A 80.65% 87.76%
Cancer 31d DTT May-17 96% 98.40% 98.65%
Cancer 31d DTT - Subs: Surgery May-17 94% 90.91% 97.62%
Cancer 31d DTT - Subs: Drugs May-17 98% 100.00% 97.17%
Cancer 31d DTT - Subs: Radiotherapy May-17 94% N/A N/A
Cancer 2ww May-17 93% 95.59% 94.06%
Cancer 2ww - Breast Symptoms May-17 93% 97.87% 94.74%
Pre
ven
tin
g p
eo
ple
fro
m d
yin
g p
rem
atu
rely
Po
sit
ive
exp
eri
en
ce
of
care
Domain Description of Standard Period TargetPeriod
Perf
Last 12
months
RTT - Incomplete pathways (% within 18
weeks)May-17 92% 93.00%
.RTT - Incomplete pathways with a
Decision to Admit (% within 18 weeks)May-17 N/A 86.01%
.
New RTT Periods During the Month May-17 N/A 7258
Po
sit
ive
exp
eri
en
ce o
f care

Level 2 – SFHFT Performance
26
SFHFT 2.4 A&E 4 hour waiting time standard
SFHT achieved the 95% A&E standard during June 2017 with performance at 96.67%. Year to date performance is also above
the standard at 96.04%.
SFHT 2.3 Diagnostics Waiting Times
SFHT achieved the 1% diagnostics standard for May 2017 with performance at 0.47%. There were 23 breaches in May with 5
relating to MRI, 4 to Computed Tomography, 4 to Sleep Studies, 3 to Cystoscopy, 2 to Audiology, 2 to Gastroscopy, 1 to
Echocardiography, 1 to Colonoscopy, and 1 to Flexi Sigmoidoscopy.
SFHT Description of Standard Period TargetPeriod
Perf
Last 12
months
Diagnostics (% of patients waiting over
six weeks)May-17 1% 0.47%
SFHT Description of Standard Period TargetPeriod
Perf
Last 12
months
2016/17
YTD
A&E waiting time - KMH (inc CNCS) +
NewarkJun-17 95% 96.67% 96.04%
A&E waiting time - KMH (inc. CNCS) Jun-17 95% 96.14% 95.41%
A&E waiting time - Newark Jun-17 95% 99.37% 99.23%
Po
sit
ive
exp
eri
en
ce o
f care

Level 2 – Circle Performance
27
Circle 2.1 Cancer
Circle achieved all three standards during May 2017. A breakdown of performance for these standards can be found below.
The graph above shows a breakdown of how long patients at Circle waited on the 2 week wait pathway in May 2017. Please note
that this is the total days waited and not the number of days over 14 waited. Patients seen within 14 days are not shown. The
Cancer 31 day DTT Performance by Tumour Site
The above table shows the performance of 31 day cancer at Circle for all patients by tumour site for May 2017 and for the last
twelve months. It should be noted that small numbers for tumour sites besides skin have a negligible impact upon overall 31 day
DTT performance for the last 12 months. Circle achieved the standard in May 2017 with performance at 96.97% meeting the 96%
target. Over the last twelve months, performance is 92.04% which is below the national standard.
Domain Description of Standard Target May-17 Q4 2016-17Last 12
months
2017/18
YTD
62d Urg RTT 85% 88.03% 81.45% 83.96%
Cancer 31d DTT 96% 96.97% 94.70% 95.65%
Cancer 2ww 93% 95.34% 95.88% 93.98%
Pre
venting p
eople
from
dyin
g
pre
matu
rely
0
1
2
3
4
5
6
7
8
9
10
11
12
13
14
15
0 1 2 3 4 5 6 7 8 9
10
11
12
13
14
15
16
17
18
19
20
21
22
23
24
25
26
27
28
29
30
31
32
33
34
35
36
37
38
39
40
41
42
43
44
45
46
47
48
49
50
+
Nu
mb
er
of
Re
ferr
als
Wait (Days)
Circle - Cancer 2ww - May 2017
778 Patients Seen Within 14 Days
Patients % Chart Patients %
GynaecologicalMay-17 96% 3 100.00% 9 100.00%
Lower GastrointestinalMay-17 96% 2 50.00% 22 90.91%
OtherMay-17 96% 1 100.00% 2 100.00%
SarcomaMay-17 96% 0 N/A 2 100.00%
SkinMay-17 96% 59 98.31% 550 91.64%
Upper GastrointestinalMay-17 96% 0 N/A 5 100.00%
UrologicalMay-17 96% 1 100.00% 13 100.00%
All CancersMay-17 96% 66 96.97% 603 92.04%
Circle Tumour Site
Ca
nce
r 3
1 D
ay
DT
T P
erf
orm
an
ce b
y T
um
ou
r S
ite fo
r
all
CC
G P
atie
nts
at C
ircl
e (
Ad
mitt
ed
& N
on
-Ad
mitt
ed
)
Period StandardLast 12 MonthsLatest Period

Level 2 – Circle Performance
28
Circle 2.1 Cancer (cont.)
Cancer 62 day RTT Performance by Tumour Site
The above table shows the performance of 62 day cancer (excluding rare cancers) at Circle for all patients by tumour site for May
2017 and for the past twelve months. There are two tumour sites where performance has regularly been below standard over the
last 12 months—Lower Gastrointestinal and Urological.
During May 2017, 62 day RTT performance at Circle achieved the 85% national standard with performance at 88.03%.
Performance over the past twelve months is however below the standard at 84.82%.
Patients % Charts Patient %
BreastMay-17 85% 0 N/A 0.5 0.00%
GynaecologicalMay-17 85% 2 100.00% 37.5 84.00%
HaemotologicalMay-17 85% 0 N/A 3 66.67%
Head & NeckMay-17 85% 0 N/A 0 N/A
Lower GastrointestinalMay-17 85% 6.5 46.15% 50 62.00%
LungMay-17 85% 0 N/A 3 50.00%
OtherMay-17 85% 1 100.00% 2 50.00%
SarcomaMay-17 85% 0 N/A 2 50.00%
SkinMay-17 85% 35 100.00% 313 93.61%
Upper GastrointestinalMay-17 85% 4.5 66.67% 43.5 66.67%
UrologicalMay-17 85% 9.5 78.95% 112 80.80%
All Cancers (Excl. Rare
Cancers)May-17 85% 58.5 88.03% 566.5 84.82%
Cancer
62 D
ay R
TT
Perf
orm
ance b
y T
um
our
Site f
or
all
CC
G P
atients
(Adm
itte
d &
Non-A
dm
itte
d)
Period StandardLatest Period Last 12 Months
Circle Tumour Site

Level 2 – Circle Performance
29
Circle 2.2 RTT
The only national standard for 2017/18 is the Incomplete 92% of patients to be waiting less than 18 weeks at the end of the
month. Circle have achieved this for each of the last 12 months.
The table below shows Incomplete, Incomplete With Decision to Admit and New RTT Periods by specialty:
One specialty breached the 92% Incomplete standard in May 2017, this was General Medicine.
Please note RTT performance is reported at provider level not contract level. Therefore Ophthalmology is included for
completeness although not commissioned via this contract.
Circle Description of Standard Period TargetPeriod
Perf
Last 12
months
RTT - Incomplete pathways (% within 18
weeks)May-17 92% 95.01%
.RTT - Incomplete pathways with a
Decision to Admit (% within 18 weeks)May-17 N/A 92.88%
.
New RTT Periods During the Month May-17 N/A 5749
Po
sit
ive
exp
eri
en
ce o
f care
New RTT
Periods
Patients 18Wks+ Perf Patients 18Wks+ Perf Patients
237 13 94.51% 61 7 88.52% 161
385 14 96.36% 68 3 95.59% 226
1777 93 94.77% 817 50 93.88% 1062
0 0 0 0 0
13 0 100.00% 13 0 100.00% 11
0 0 0 0 0
0 0 0 0 0
0 0 0 0 0
0 0 0 0 0
255 22 91.37% 39 6 84.62% 144
1598 123 92.30% 68 7 89.71% 743
24 0 100.00% 0 0 31
2335 123 94.73% 1103 101 90.84% 1328
628 37 94.11% 3 1 66.67% 210
0 0 0 0 0
627 12 98.09% 12 2 83.33% 331
0 0 0 0 0
812 19 97.66% 330 15 95.45% 780
1311 43 96.72% 381 14 96.33% 722
10002 499 95.01% 2895 206 92.88% 5749
Plastic Surgery
Month = May-17
Incomplete
Standard = 92%
Incomplete
With Decision to Admit
General Surgery
Urology
Trauma & Orthopaedics
ENT
Ophthalmology
Oral Surgery
Neurosurgery
Number of patients
waiting over 18 Weeks
Total
Cardiothoracic Surgery
General Medicine
Gastroenterology
Cardiology
Dermatology
Thoracic Medicine
Neurology
Rheumatology
Geriatric Medicine
Gynaecology
Other

Level 2 – Circle Performance
30
Circle 2.4 Cancelled Operations
During May 2017, Circle achieved the 0.8% national standard with 0.51% of operations cancelled. Of the operations that were
cancelled, all of them were rebooked within 28 days which is within the 5% standard.
The table below shows that the main reason for cancellation during the last 12 months is staffing followed by other.
Circle 2.3 Diagnostics Waiting Times
Circle achieved the Diagnostics standard in April 2017, during the month there were no breaches of the six week standard.
Circle 2.5 Complaints
Circle had 18 complaints during April 2017. Circle have a culture of encouraging patients to raise concerns and any complaints
made are used to increase the quality of clinical care and provide the best possible patient experience.
Circle Description of Standard Period TargetPeriod
Perf
Last 12
months
Diagnostics (% of patients waiting over
six weeks)Apr-17 1% 0.00%
Circle Description of Standard Period TargetPeriod
Perf
Last 12
months
2017/18
YTD
Cancelled Ops - % of elect act May-17 0.8% 0.51% 0.60%
Cancelled Operations - Rebooked 28
days+May-17 5% 0.00% 0.00%
Number of urgent operations cancelled
for a second timeMay-17 0 0 0
Positiv
e
experience o
f
care
Reason for Cancellation Jun-16 Jul-16 Aug-16 Sep-16 Oct-16 Nov-16 Dec-16 Jan-17 Feb-17 Mar-17 Apr-17 May-17Last 12
Months
Administrative Error 1 0 0 0 0 1 2 2 0 1 0 1 8
Clinical Priority 1 0 0 0 3 1 0 0 0 0 0 2 7
Equipment 2 0 0 0 0 0 0 0 0 0 0 1 3
ICU/HDU Bed Unavailable 0 0 0 0 0 1 0 0 0 0 0 0 1
Other 3 0 0 0 2 1 2 3 0 0 0 4 15
Staffing 1 0 6 2 0 1 5 0 0 4 9 0 28
Theatre Time 0 0 0 1 0 0 0 0 0 0 0 0 1
Ward Bed Unavailable 0 0 0 0 0 0 0 0 0 0 0 0 0
Total 8 0 6 3 5 5 9 5 0 5 9 8 63
Circle Description of Standard Period StandardPeriod
Perf
Last 12
months
2017/18
YTD
Patient
ExperienceNumber of Complaints Apr-17 Minimum 18 18

Level 2 – Circle Performance
31
Circle 2.6 HCAIs
Circle have not had any cases of MRSA or C-Diff during the last 12 months.
Circle 2.7 Venous Thromboembolism (VTE) Risk Assessment
Circle achieved the VTE risk assessment standard in March 2017 with performance at 98.57%.
Circle 2.8 Never Events
There were no Never Events reported during April 2017.
Circle 2.9 Friends & Family Test (FFT)
There are currently no national standards for the FFT. However, Circle are consistently achieving high scores amongst both
inpatients and outpatients.
Circle Description of Standard Period StandardPeriod
Perf
Last 12
months
MRSA Bacteraemia Apr-17 0 0
C Difficile Apr-17 0 0
HC
AIs
Circle Description of Standard Period TargetPeriod
Perf
Last 12
months
2017/18
YTD
Never Events Apr-17 0 0 0
Circle Description of Standard Period TargetPeriod
Perf
Last 12
months
2016/17
YTD
Percentage of patients assessed for risk
of VTE on admissionMar-17 95% 98.57% 98.23%
Circle Description of Standard Period Basis Standard PerformanceLast 12
months
FFT - Inpatient Score Apr-17 Monthly N/A 93.9
FFT - Inpatient Response Rate Apr-17 Monthly N/A 47.45%
FFT - Outpatient Score Apr-17 Monthly N/A 83.4
FFT - Outpatient Response Rate Apr-17 Monthly N/A 17.44%Friends &
Fam
ily T
est
(FF
T)

Level 2 – NHCT Performance
32
NHCT 2.1 IAPT
IAPT - Patient Moving Towards Recovery (Recovery Rate)
The recovery rate is the number of people who are moving to recovery, divided by the number of people who have completed treatment, minus the number of people who have completed treatment who were not at “caseness” at initial assessment. An individual is said to be at caseness when their outcome score exceeds the accepted threshold for a standardised measure of symptoms. The CCG has an IAPT recovery rate standard of 50%. During April 2017, Nottingham North & East CCG achieved the 50% standard with performance at 65.65%.
The CCGs have set a target for 3.76% of patients who have depression and/or anxiety disorders to be seen each quarter during 2017/18. This equates to 194 patients per month for Nottingham North & East, 126 for Nottingham West and 127 for Rushcliffe. Nottingham North & East CCG are achieving the required quarterly of 1.25% in Quarter 1 with performance at 1.45% (currently awaiting validation for final figures). The CCG is averaging 225 patients treated per month during the quarter.
NHCT 2.2 Early Intervention in Psychosis
There is a national target for 50% of patients referred onto the early intervention in psychosis pathway to be treated within 2 weeks with a NICE-recommended package of care. In May 2017, 100% of Nottingham North & East CCG patients started treatment within two weeks following referral. The CCG has achieved the standard nine times in the last twelve months. At the time of reporting, 0% of Nottingham North & East CCG patients awaiting EIP treatment were waiting less than 2 weeks.. The three months rolling performance for Nottingham North & East CCG shows that 66.67% of patients started treatment within two weeks following referral.
NHCT Description of Standard CCG Target Apr-17Last 12
months
NNE 1.25% 1.45%
NW 1.25% 1.41%
Rush 1.25% 1.54%
IAP
T The percentage of people who have
depression and/or anxiety disorders who
receive psychological therapies
NHCT Description of Standard CCG Target Apr-17Last 12
months
NNE 50% 65.65%
NW 50% 62.67%
Rush 50% 58.82%
IAP
T
IAPT Recovery Rates
CCG Description of Standard Period Target CCGMonthly
Referrals
Monthly
Perf
Last 12
months
Rolling 3
Months
NNE 3 100.00% 66.67%
NW 0 N/A 100.00%
Rush 1 100.00% 88.89%
NNE 1 0.00% 16.67%
NW 0 N/A 100.00%
Rush 1 100.00% 100.00%Positi
ve E
xperience
of C
are
Early Intervention in Psychosis (% of patients
aw aiting treatment w ith a NICE-recommended
package of care w ithin 2 w eeks of referral)
May-17 50%
Early Intervention in Psychosis (% of patients
starting treatment w ith a NICE-recommended
package of care w ithin 2 w eeks of referral)
May-17 50%

Level 2 – NHCT Performance
33
NHCT 2.5 Dementia During the planning round completed by CCGs in April 2016, Nottingham North & East CCG set ambitions to maintain their Dementia Diagnosis Rate at a minimum of 67% throughout 2016/17.
The table below shows that as at the end of March 2017 Nottingham North & East CCG has a Dementia Diagnosis Rate of 70%, which is above the 67% plan.
NHCT 2.4 Care Programme Approach
CPA is usually for patients that have severe mental health problems and is a particular way of assessing, planning and reviewing their mental health needs. There should be a formal written care plan outlining any risks and including details of what should happen in an emergency or crisis, this should be reviewed annually. The Trust failed to achieve the percentage of patients receiving follow-up contact within 7 days of discharge during February 2017, this is the eighth time the standard has not been achieved in the last twelve months. The primary reason for the below standard performance has been patients not responding to communication from services to enable follow-up to take place within required timeframe. The Trust maintain a proactive and committed approach to ensure that patients are followed up within a timely manner. During February 2017 all patients not communicated with inside 7 days were successfully followed up after.
NHCT 2.3 Children and Young Person’s Mental Health - Eating Disorder
Children and Young Person’s Mental Health - Eating Disorder is a new quarterly collection. Due to the low volume of referrals for these services, CCGs performance is to be measured on a rolling 6 months basis. The expectation is that by 2020, CCGs wil l have achieved a minimum of 95% of referrals waiting less than 1 week for urgent referrals, and 4 weeks for routine cases.
In the six months to the end of Quarter 4 2016-17, 0% of completed routine cases for Nottingham North & East CCG were seen within 4 weeks. Meanwhile, 100% of incomplete routine cases were currently waiting less than 4 weeks at the time of reporting.
NHCT Description of Standard Plan Mar-17Last 12
months
Nottingham North & East 67% 70%
Nottingham West 67% 75%
Rushcliffe 67% 79%
Dementia
Diagnosis
Rate
NHCT Description of StandardRolling six
months to
Standard
(By 2020)CCG
No. of
Referrals
6 Month
Rolling PerfPrevious Perf
Q4 16-17 95% NNE 1 0.00%
Q4 16-17 95% NW 2 100.00%
Q4 16-17 95% Rush 3 66.67%
Q4 16-17 95% NNE 3 100.00%
Q4 16-17 95% NW 5 60.00%
Q4 16-17 95% Rush 6 83.33%
Q4 16-17 95% NNE 1 100.00%
Q4 16-17 95% NW 0 N/A
Q4 16-17 95% Rush 0 N/A
Q4 16-17 95% NNE 0 N/A
Q4 16-17 95% NW 0 N/A
Q4 16-17 95% Rush 0 N/A
Positiv
e E
xperience o
f C
are
CYP ED pathways (routine cases)
completed (< 4 weeks)
CYP ED pathways (routine cases)
incomplete (< 4 weeks)
CYP ED pathways (urgent cases)
completed (< 1 week)
CYP ED pathways (urgent cases)
incomplete (< 1 week)
NHCT Description of Standard Period Standard Period PerfLast 12
months
% of patients having a review last 12
monthsFeb-17 95.0% 96.20%
% of patients receiving follow-up contact
within 7 days of dischargeFeb-17 95.0% 91.10%
CP
A

Level 2 – NHCT Performance
34
NHCT 2.6 Delayed Transfers of Care
NHCT achieved the 7.5% standard for Delayed Transfers of Care during February 2017 with performance at 1.90%. Patients
have been delayed 273 days during February 2017, which is below the 2016-17 average of 746.
A reason for delay breakdown of the DTOCs for February 2017 is shown below, this also shows whether the NHS or Social Care
was responsible for the delay.
NHCT Description of Standard Period Standard Period PerfLast 12
months
DToC - % of Non-Acute Admissions Feb-17 7.5% 1.90%
DToC - Number of Days Delayed Feb-17 Minimum 273
DT
oC
Nottinghamshire Healthcare
Trust
Reason For Delay
February 2017
Number of
Patients
Delayed (last
Thursday of
month
snapshot)
Number of
Days Delayed
(total during
month)
Number of
Patients
Delayed (last
Thursday of
month
snapshot)
Number of
Days Delayed
(total during
month)
Number of
Patients
Delayed (last
Thursday of
month
snapshot)
Number of
Days Delayed
(total during
month)
A) Completion of assessment 0 0 0 0 1 28
B) Public Funding 0 0 0 0 0 9
C) Further non acute NHS care
(including intermediate care, rehab, etc)3 91 0 0 0 0
Di) Aw aiting Residential Care Home
Placement1 28 1 15 0 0
Dii) Aw aiting Nursing Home Placement 0 0 0 0 0 0
E) Care package in ow n home 0 5 0 5 0 0
F) Community Equipment/adaptions 0 0 0 0 0 0
G) Patient or family choice 6 76 0 0 0 0
H) Disputes 0 0 0 0 0 0
I) Housing - patients not covered by
NHS and Community Care Act2 16 0 0 0 0
Total 12 216 1 20 1 37
NHS Responsible for DelaySocial Care Responsible for
Delay
Both NHS & Social Care
Responsible for Delay

Level 2 – EMAS Performance
35
Monthly Performance of the Ambulance Indicators Red 8 minutes and Red 19 minutes
Performance against standard for Red 1 and Red 2 calls.
The chart above shows EMAS Red call volumes for the three South Nottinghamshire CCGs, comparing 2017-18 volumes to the
same periods of 2016-17. All three South Nottinghamshire CCGs have seen an increase in call volumes; Nottingham North & East
has increased by 16.61%, Nottingham West by 16.70% and Rushcliffe by 21.72%.
The table above shows the EMAS performance for local CCGs against the Red 1 and Red 2 standards. During May 2017 Nottingham North & East CCG achieved the Red 1 8 minute 75% standard with performance at 77.14% from 35 responses. The CCG has achieved the standard five times in the last twelve months. The CCG however failed to achieve the Red 2 8 minute 75% standard. During May 2017 there were 687 responses of which 42.65% arrived within 8 minutes, 90.54% arrived within 19 minutes which is below the standard of 95%.
Responses Performance Responses Performance
M&A 64 71.88% 135 77.04%
N&S 43 53.49% 79 55.70%
City 152 89.47% 285 84.91%
NNE 35 77.14% 70 80.00%
NW 33 66.67% 57 63.16%
Rush 22 63.64% 46 65.22%
M&A 64 100% 134 100%
N&S 43 93.02% 79 89.87%
City 152 100% 285 100%
NNE 35 100% 70 100%
NW 33 96.97% 57 96.49%
Rush 22 100% 46 100%
M&A 1131 60.57% 2217 58.10%
N&S 631 42.47% 1242 41.95%
City 2222 64.85% 4170 64.53%
NNE 687 42.65% 1389 42.84%
NW 471 45.65% 978 46.22%
Rush 452 41.37% 857 42.01%
M&A 1130 93.72% 2214 92.50%
N&S 631 71.32% 1240 71.05%
City 2217 94.05% 4162 94.07%
NNE 687 90.54% 1388 90.13%
NW 471 92.36% 978 92.02%
Rush 447 85.68% 849 87.28%
Red 1 - Life
threatening
requiring
defibrillation
Call timer starts
w hen the 999 call is
connected to the
sw itchboard
Red 2 - Life
threatening
Call timer starts at
earliest of the
follow ing 1. The
point at w hich the
chief complaint of
the call has been
identif ied; 2. A
vehicle has been
assigned to the call;
3. A 60 second cap
from the Call
Connect time
8 Minute Response Time 75%
19 Minute Response Time 95%
8 Minute Response Time 75%
19 Minute Response Time 95%
Year to DateCCG Level Description of Standard Target
Last 12
months
performance
CCGMay 2017
0
200
400
600
800
1000
1200
Apr May Jun Jul Aug Sep Oct Nov Dec Jan Feb Mar
EMAS Call Volumes - Red Calls only - South Nottinghamshire CCGsComparison Between Years
NNE 16-17 NW 16-17 Rush 16-17NNE 17-18 NW 17-18 Rush 17-18
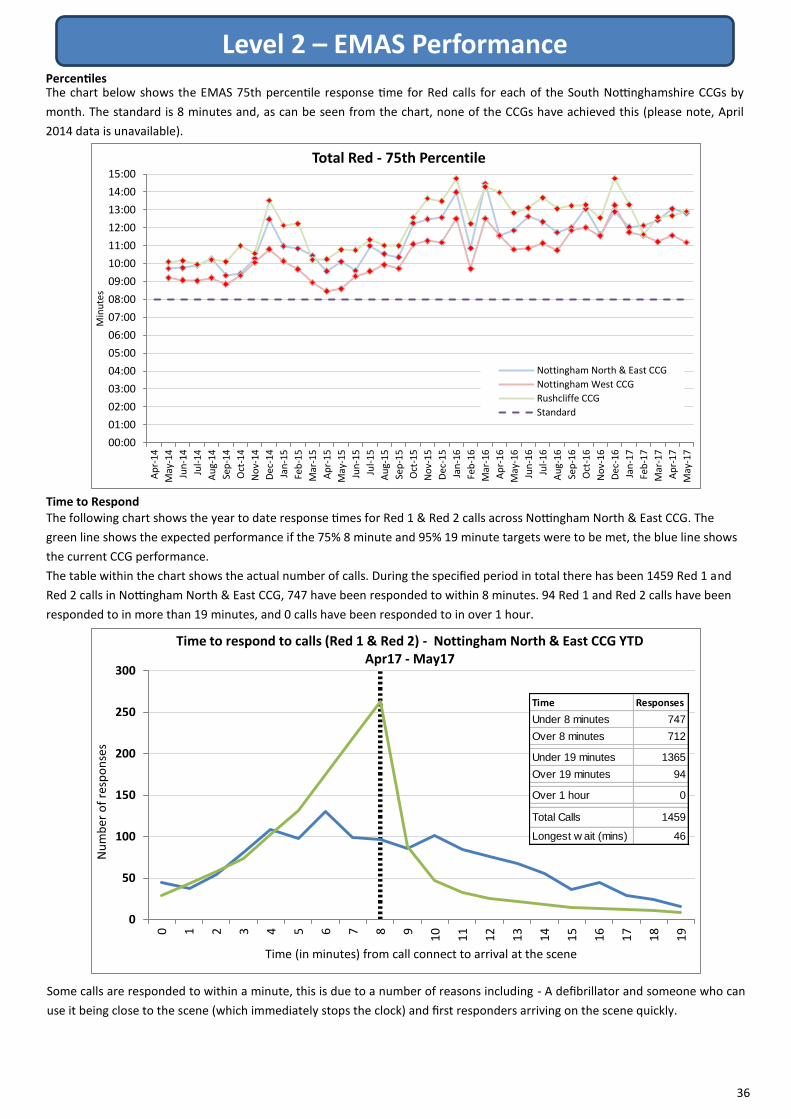
Level 2 – EMAS Performance
36
Percentiles The chart below shows the EMAS 75th percentile response time for Red calls for each of the South Nottinghamshire CCGs by
month. The standard is 8 minutes and, as can be seen from the chart, none of the CCGs have achieved this (please note, April
2014 data is unavailable).
Time to Respond The following chart shows the year to date response times for Red 1 & Red 2 calls across Nottingham North & East CCG. The
green line shows the expected performance if the 75% 8 minute and 95% 19 minute targets were to be met, the blue line shows
the current CCG performance.
The table within the chart shows the actual number of calls. During the specified period in total there has been 1459 Red 1 and
Red 2 calls in Nottingham North & East CCG, 747 have been responded to within 8 minutes. 94 Red 1 and Red 2 calls have been
responded to in more than 19 minutes, and 0 calls have been responded to in over 1 hour.
Some calls are responded to within a minute, this is due to a number of reasons including - A defibrillator and someone who can
use it being close to the scene (which immediately stops the clock) and first responders arriving on the scene quickly.
00:00
01:00
02:00
03:00
04:00
05:00
06:00
07:00
08:00
09:00
10:00
11:00
12:00
13:00
14:00
15:00
Ap
r-1
4
May
-14
Jun
-14
Jul-
14
Au
g-1
4
Sep
-14
Oct
-14
No
v-1
4
Dec
-14
Jan
-15
Feb
-15
Mar
-15
Ap
r-1
5
May
-15
Jun
-15
Jul-
15
Au
g-1
5
Sep
-15
Oct
-15
No
v-1
5
Dec
-15
Jan
-16
Feb
-16
Mar
-16
Ap
r-1
6
May
-16
Jun
-16
Jul-
16
Au
g-1
6
Sep
-16
Oct
-16
No
v-1
6
Dec
-16
Jan
-17
Feb
-17
Mar
-17
Ap
r-1
7
May
-17
Min
ute
s
Total Red - 75th Percentile
Nottingham North & East CCG
Nottingham West CCG
Rushcliffe CCG
Standard
0
50
100
150
200
250
300
0 1 2 3 4 5 6 7 8 9
10
11
12
13
14
15
16
17
18
19
Nu
mb
er o
f re
spo
nse
s
Time (in minutes) from call connect to arrival at the scene
Time to respond to calls (Red 1 & Red 2) - Nottingham North & East CCG YTD Apr17 - May17
Time Responses
Under 8 minutes 747
Over 8 minutes 712
Under 19 minutes 1365
Over 19 minutes 94
Over 1 hour 0
Total Calls 1459
Longest w ait (mins) 46

Level 2 – EMAS Performance
37
Remedial Action Plan
To improve EMAS performance, a Remedial Action Plan (RAP) which details issues and actions is in place. These are shown below -
Issue - Demand - Increased Red Activity Actions Level of clinical input into the Clinical Assessment Team (CAT) desk to be increased CAT desk ability to triage Red 999 calls to be protected , this will enable more calls to be downgraded to Green Collaboration with Derbyshire Health United to pilot a Ambulance Liaison Desk in NHS 111, utilising EMAS Clinical Hub staff, to
reduce number of calls transferred to EMAS Peer review of current activity/demand to identify any additional actions required Issue - Resources - Resource Availability Actions Increase utilisation of Private and Voluntary Ambulance Services, whilst ensuring patient safety - Ongoing collaboration with
Police and Fire services to provide additional Community First Responders Development of a workforce plan and trajectory to ensure 2193 WTE staff trained and operational by March 2017 - this has
been aided by an overseas recruitment campaign that took place in early October Reduction of the number of staff on alternative duties to support operational delivery Devolve resource planning function to the responsibility of the divisional management teams Dispatch to Disposition allows up to an additional 180 seconds for calls (excluding Red 1s) to be triaged allowing extra time to
determine the most clinically appropriate response required for the patient Issue - Quality & Performance - Improved Performance Actions Analysis of the impact of revised Ambulance Quality Indicators on Red performance Monitor impact of capacity management plan on performance and quality Issue - Handovers - Handover Delays Actions Work with commissioners and providers in Leicestershire to implement actions specific to that area Ensure rollout programme of 164 defibrillators matches requirements of each division, reduce vehicle downtime
Non-Conveyance Rates
The table above shows the proportion of EMAS responses resulting in non-conveyance for the three South Notts CCGs. There is a target to increase the proportion of emergency calls closed by telephone advice, and the number of incidents to be treated at the scene or conveyed to a destination that is not A&E. In May 2017, Nottingham North & East CCG saw 14.51% of calls closed by telephone advice and 28.96% of incidents managed without the need for transport to A&E. Year to date the CCG has seen a decrease of 0.71% in the proportion of calls closed by telephone advice compared to the previous year. There has also been a 2.83% decrease in the proportion of incidents not resulting in conveyance to A&E compared to the previous year.
CCG Description of Standard Period CCG TargetPeriod
Perf
Last 12
months
17/18
YTD
16/17
YTD
NNE 14.51% 13.39% 14.10%
NW 11.60% 12.46% 14.69%
Rush 13.83% 14.07% 15.61%
NNE 28.96% 28.65% 31.48%
NW 31.26% 30.10% 35.13%
Rush 31.74% 32.36% 36.11%
Increase
Proportion
Increase
Proportion
Proportion of calls closed by telephone
advice (%)
Proportion of incidents managed without
need for transport to Accident and
Emergency Departments (%)
Am
bula
nce May-17
May-17

Level 2 – EMAS Performance
38
The table below shows the average times of ambulance turnover for the latest month at QMC and City hospital.
The pre-handover time is the responsibility of the hospital and is the time between the ambulance arriving at the hospital and
the patient being handed over. The post-handover time is the responsibility of EMAS and is the time between the patient being
handed over and the ambulance being ready for the next call.
Turnaround times
The main issue affecting performance remains outflow from the Emergency Department (ED), patients are continuing to wait in ED for inpatient beds. This creates capacity issues within Majors and the Initial Assessment Unit (IAU), which are then unable to receive all Majors referrals, with the exception of direct to Resus and Children’s. Subsequently, staff are unable to move away from the Majors area, and the escalation process to move staff to IAU can not be enacted. Actions to improve performance include -
Actively recruiting to nursing vacancies, any current shortfall covered by agency staff Reduction in ambulance waiting space caused by building works is monitored on a daily basis to ensure safe and
effective transfers If the ambulance crew is waiting more than 10 minutes then there is an internal escalation to the ED Nurse in charge An additional 30 minute escalation to nurse in charge to reduce chances of 60 minute turnaround delays
NUH Description of Standard Period StandardPeriod
Perf
Last 12
months
Queens Medical Centre - Pre-Handover May-17<15mins = G
>20Mins = R16:21
Queens Medical Centre - Post-Handover May-17<15mins = G
>20Mins = R14:10
Queens Medical Centre - Total May-17<30mins = G
>40Mins = R30:31
Nottingham City Hospital - Pre-Handover May-17<15mins = G
>20Mins = R19:31
Nottingham City Hospital - Post-Handover May-17<15mins = G
>20Mins = R12:44
Nottingham City Hospital - Total May-17<30mins = G
>40Mins = R32:15
Am
bula
nce H
andover
Tim
es
(in m
inute
s)

39
Leve
l 2 –
EM
AS
Pe
rfo
rman
ce
Am
bu
lan
ce
Se
rvic
e P
erf
orm
an
ce
Co
mp
ari
so
n
Am
bu
lan
ce S
erv
ice
Pe
rfo
rman
ce C
om
par
iso
n:
Syst
em
Ind
icat
ors
Ou
t o
f 1
1 A
mb
ula
nce
ser
vice
’ EM
AS
are
ran
ked
9th
or
wo
rse
in 0
ou
t o
f th
e 1
1 m
on
thly
ind
icat
ors
an
d 0
ou
t o
f th
e 4
yea
r to
dat
e in
dic
ato
rs s
ho
wn
ab
ove
. EM
AS
are
faili
ng
to a
chie
ve
the
stan
dar
ds
for
Pro
po
rtio
n o
f R
ed 1
cal
ls r
esp
on
ded
to
wit
hin
8 m
inu
tes
mo
nth
ly (
72
.25
%),
Pro
po
rtio
n o
f R
ed 2
cal
ls r
esp
on
ded
to
wit
hin
8 m
inu
tes
mo
nth
ly (
58
.31
%),
an
d
Pro
po
rtio
n o
f C
ateg
ory
A c
alls
res
po
nd
ed t
o w
ith
in 1
9 m
inu
tes
mo
nth
ly (
86
.68
%).
Sys
tem
In
dic
ato
rs
Are
aIn
dic
ato
r
Late
st
Mo
nth
= A
pr-
17
Pe
rio
dT
arg
et
EM
AS
Ran
k
(ou
t o
f 11)
1 =
Be
st
11 =
Wo
rst
East
Mid
lands
Am
bula
nce
Serv
ice
East of
Engla
nd
Am
bula
nce
Serv
ice
Isle
of
Wig
ht
London
Am
bula
nce
Serv
ice
Nort
h E
ast
Am
bula
nce
Serv
ice
Nort
h W
est
Am
bula
nce
Serv
ice
South
Centr
al
Am
bula
nce
Serv
ice
South
East
Coast
Am
bula
nce
Serv
ice
South
Weste
rn
Am
bula
nce
Serv
ice
West
Mid
lands
Am
bula
nce
Serv
ice
York
shire
Am
bula
nce
Serv
ice
Month
75%
672.2
5%
73.6
4%
77.7
8%
79.2
3%
73.1
4%
70.0
8%
75.9
2%
70.8
3%
YTD
75%
672.2
5%
73.6
4%
77.7
8%
79.2
3%
73.1
4%
70.0
8%
75.9
2%
70.8
3%
Month
414.2
14.2
15.3
11.5
13.1
15.4
13.6
14.4
Month
75%
758.3
1%
64.7
9%
77.8
3%
73.5
7%
60.6
9%
68.9
4%
74.5
6%
56.1
7%
YTD
75%
758.3
1%
64.7
9%
77.8
3%
73.5
7%
60.6
9%
68.9
4%
74.5
6%
56.1
7%
Month
95%
886.6
8%
92.3
4%
95.3
5%
95.5
4%
90.0
5%
92.5
4%
95.8
6%
91.4
1%
YTD
95%
886.6
8%
92.3
4%
95.3
5%
95.5
4%
90.0
5%
92.5
4%
95.8
6%
91.4
1%
Month
40.4
%0.8
%1.7
%0.7
%0.6
%1.2
%0.2
%1.3
%1.4
%0.4
%0.2
%
YTD
40.4
%0.8
%1.7
%0.7
%0.6
%1.2
%0.2
%1.3
%1.4
%0.4
%0.2
%
Media
nM
onth
82
11
01
13
32
11
95th
Perc
entil
eM
onth
826
74
219
28
531
55
35
99th
Perc
entil
eM
onth
875
63
14
52
72
98
40
89
114
30
45
Media
nM
onth
811
74
67
76
7
95th
Perc
entil
eM
onth
522
22
15
16
27
23
18
22
99th
Perc
entil
eM
onth
636
32
21
33
47
48
29
33
Cate
gory
A
Calls
Call
Abandonm
ent
Pro
port
ion o
f calls
abandoned b
efo
re b
ein
g a
nsw
ere
d
Tim
e to a
nsw
er
call
(in s
econds)
Tim
e to tre
atm
ent fo
r C
ate
gory
A
calls
(in
min
ute
s)
95th
centil
e o
f re
sponse tim
e f
or
Red 1
calls
(in
min
ute
s)
Pro
port
ion o
f R
ed 2
calls
responded to w
ithin
8 m
inute
s
Pro
port
ion o
f R
ed 1
calls
responded to w
ithin
8 m
inute
s
Pro
port
ion o
f C
ate
gory
A c
alls
responded to w
ithin
19
min
ute
s
Tim
elin
ess

40
Clin
ica
l O
utc
om
es
Leve
l 2 –
EM
AS
Pe
rfo
rman
ce
Am
bu
lan
ce
Se
rvic
e P
erf
orm
an
ce
Co
mp
ari
so
n
Am
bu
lan
ce S
erv
ice
Pe
rfo
rman
ce C
om
par
iso
n:
Clin
ical
Ou
tco
me
s
On
ly t
he
Uts
tein
gro
up
is s
ho
wn
in t
he
Car
dia
c A
rre
st in
dic
ato
rs. T
he
'Uts
tein
co
mp
arat
or
gro
up
' pro
vid
es a
co
mp
arab
le a
nd
sp
ecifi
c m
easu
re o
f th
e m
anag
emen
t o
f ca
rdia
c ar
rest
s
for
the
sub
set
of
pati
ents
wh
ere
tim
ely
and
eff
ecti
ve e
mer
gen
cy c
are
can
par
ticu
larl
y im
pro
ve s
urv
ival
(e.
g. 9
99
cal
ls w
her
e th
e ar
rest
was
no
t w
itn
ess
ed a
nd
th
e p
atien
t m
ay h
ave
gon
e in
to a
rres
t se
vera
l ho
urs
bef
ore
th
e 9
99
cal
l are
exc
lud
ed f
rom
th
e U
tste
in c
om
par
ato
r gr
ou
p fi
gure
).
Ou
t o
f 1
1 A
mb
ula
nce
ser
vice
’ EM
AS
are
ran
ked
9th
or
wo
rse
in 1
ou
t o
f th
e 6
mo
nth
ly in
dic
ato
rs a
nd
1 o
ut
of
the
6 y
ear
to d
ate
ind
icat
ors
sh
ow
n a
bo
ve.
Are
aIn
dic
ato
r
Late
st
Mo
nth
= J
an
-17
Pe
rio
d
EM
AS
Ran
k
(ou
t o
f 11)
1 =
Be
st
11 =
Wo
rst
East
Mid
lands
Am
bula
nce
Serv
ice
East of
Engla
nd
Am
bula
nce
Serv
ice
Isle
of
Wig
ht
London
Am
bula
nce
Serv
ice
Nort
h E
ast
Am
bula
nce
Serv
ice
Nort
h W
est
Am
bula
nce
Serv
ice
South
Centr
al
Am
bula
nce
Serv
ice
South
East
Coast
Am
bula
nce
Serv
ice
South
Weste
rn
Am
bula
nce
Serv
ice
West
Mid
lands
Am
bula
nce
Serv
ice
York
shire
Am
bula
nce
Serv
ice
Month
946.3
4%
63.6
4%
0.0
0%
48.4
4%
50.0
0%
53.7
0%
38.7
8%
51.5
2%
46.9
4%
48.5
7%
57.1
4%
YTD
748.1
2%
56.3
9%
31.5
8%
53.1
0%
62.1
1%
56.7
4%
41.3
6%
52.1
7%
46.2
1%
46.2
2%
53.6
8%
Month
527.0
3%
22.5
8%
0.0
0%
15.2
5%
32.0
0%
20.3
7%
31.8
2%
10.7
1%
27.0
8%
25.7
1%
38.1
0%
YTD
10
22.8
1%
28.7
2%
26.3
2%
24.1
3%
35.7
5%
24.7
1%
24.5
2%
21.5
1%
23.3
3%
23.2
6%
35.2
7%
Month
849.6
1%
49.8
4%
57.1
4%
57.6
9%
49.2
6%
52.9
3%
51.3
4%
59.0
3%
38.7
4%
58.0
1%
43.8
5%
YTD
752.5
3%
50.0
3%
66.2
9%
61.5
1%
56.6
7%
52.6
8%
51.7
9%
64.2
8%
36.1
3%
57.4
7%
45.0
1%
Month
698.2
3%
98.9
7%
100.0
0%
96.8
8%
96.2
5%
100.0
0%
99.8
0%
94.9
1%
96.2
8%
96.9
2%
99.1
2%
YTD
498.7
1%
99.0
2%
98.0
4%
96.5
9%
97.7
1%
99.6
8%
98.7
8%
95.8
0%
94.8
6%
97.1
2%
98.7
1%
Month
287.0
4%
90.3
2%
#########
80.1
9%
81.8
2%
83.0
1%
82.6
1%
76.7
7%
69.5
4%
83.7
8%
80.0
0%
YTD
292.0
6%
92.1
2%
40.0
0%
89.7
2%
89.9
7%
79.5
3%
86.9
7%
89.6
9%
71.7
5%
86.9
1%
84.6
9%
Month
485.1
5%
93.8
9%
60.0
0%
73.0
3%
88.1
6%
84.9
8%
82.6
1%
65.6
3%
67.3
6%
78.3
2%
85.7
1%
YTD
484.0
5%
91.0
7%
58.9
3%
71.4
4%
83.0
8%
86.9
3%
74.4
3%
67.2
8%
75.5
9%
80.5
6%
87.3
1%
Pro
port
ion o
f patie
nts
who w
ere
resuscita
ted
who h
ad r
etu
rn o
f sponta
neous c
ircula
tion
on a
rriv
al a
t hospita
l
Pro
port
ion o
f patie
nts
who w
ere
dis
charg
ed
from
hospita
l aliv
e f
ollo
win
g r
esuscita
tion b
y
am
bula
nce s
erv
ice f
ollo
win
g a
card
iac a
rrest
Retu
rn o
f
Sponta
neous
Circula
tion
Surv
ival t
o
Dis
charg
e
Card
iac
Arr
est
(Uts
tein
gro
up)
Str
oke
Pro
port
ion o
f FA
ST p
ositi
ve p
atie
nts
pote
ntia
lly e
ligib
le f
or
str
oke
thro
mboly
sis
arr
ivin
g a
t a h
ypera
cute
str
oke
unit
with
in
60 m
inute
s
Pro
port
ion o
f suspecte
d s
troke
patie
nts
assessed f
ace to
face w
ho r
eceiv
ed a
n a
ppro
priate
care
bundle
Acute
STEM
I
Pro
port
ion o
f patie
nts
with
definite
ST-e
levatio
n m
yocard
ial
infa
rctio
n w
ho r
eceiv
ed p
rim
ary
angio
pla
sty
with
in 1
50
min
ute
s o
f call
connectin
g to a
mbula
nce s
erv
ice
Pro
port
ion o
f patie
nts
with
ST-e
levatio
n m
yocard
ial i
nfa
rctio
n
who r
eceiv
ed a
n a
ppro
priate
care
bundle

Level 2 – Arriva Performance
41
Arriva Patient Transport Services
The table above shows the Arriva Patient Transport Service (PTS) performance over the past 12 months for the 5 KPIs for Nottinghamshire. The performance for KPI1, the time in which a patient spends in the vehicle split by the distance that the patient lives from the point of care, has achieved each standard for this month. This includes the standard that patients within 10 miles of the point of care spend no longer than 60 minutes on the vehicle. Prior to this, this standard had failed once in the previous twelve months. KPI2, KPI3 and KPI5 have been below their relevant standards every recorded month over the last year. To improve performance Arriva have created a Service Improvement Plan for Nottinghamshire which has identified several areas for improvement - Improve partnership working along the patient pathway
Improve partnership working with points of care
Reduce number of aborted journeys at hospital for hospital triggered reason codes
Reduction in Crew wait times for patient at pick up from Unit
On the day patient transport changes - changes to patient clinic locations and patient collection points
Support the discharge pathway to improve the co-ordination of transport & TTOs
Improve understanding of mobility types when booking journeys
Confirmation required on the Patient support provided when a clinic has closed but the patient is not yet due to be collected by transport
Renal transport
Improve Renal performance Improve call centre performance
Improve site/HPs access to Cleric to book transport and making patients ready for collection
Reduce the number of abandoned calls and call waiting times into the Call Centre Improve performance of patient inward KPIs
Patients travelling in on crews first run not always meeting KPIs Improve internal performance management processes
The resource vs. demand peaks are only escalated on the day of travel, resulting in third party resources being engaged too late to be optimised efficiently and meet demand
More focus needed on how individual roles support and impact the KPIs Internal communication
Improve the internal communication & resolution of reoccurring service delivery issues that impact the KPIs
May-16 Jun-16 Jul-16 Aug-16 Sep-16 Oct-16 Nov-16 Dec-16 Jan-17 Feb-17 Mar-17 Apr-17 May-17
Patients w ithin 10 miles spend no longer than 60
mins on the vehicle96.0% 96.0% 96.0% 96.0% 95.7% 96.7% 95.8% 96.1% 96.3% 96.4% 96.7% 96.5% 95.7%
10-35 miles spend no longer than 90 minutes on
the vehicle95.0% 95.0% 96.0% 95.0% 95.0% 95.2% 94.1% 94.6% 95.5% 95.9% 96.0% 95.6% 95.5%
35-80 miles spend no longer than 120 minutes on
the vehicle91.0% 91.0% 96.0% 96.0% 91.8% 92.5% 90.2% 90.1% 93.6% 90.5% 91.6% 95.5% 93.8%
KPI 2Arrival Times at
Point of Care
Patients shall arrive w ithin 60 minutes prior to their
appointment/zone time at the point of care80.0% 79.0% 76.0% 76.0% 74.4% 78.2% 72.0% 70.1% 69.6% 69.5% 73.4% 72.5% 67.2%
OP Return patients shall be collected w ithin 60
mins of request or agreed transport/or zone time72.0% 72.0% 65.0% 68.0% 68.1% 71.0% 65.0% 64.1% 65.4% 63.9% 66.3% 68.9% 62.0%
Discharge patients shall be collected w ithin 120
mins of request or agreed transport/or zone time66.0% 61.0% 56.0% 56.0% 62.0% 60.0% 53.6% 52.2% 55.2% 53.1% 52.5% 59.1% 48.4%
Calls requesting PTS answ ered w ithin 10 seconds
by a booking agent, not an automated message48.0% 40.0% 41.0% 55.0% 29.3% 32.1% 46.1% 49.7% 33.6% 58.9% 50.7% 59.0% 60.8%
Maximum percentage of calls requesting Non-
Emergency PTS are abandoned15.0% 22.0% 17.0% 12.0% 26.7% 28.4% 16.3% 15.1% 22.1% 9.4% 11.1% 11.2% 8.5%
Nottinghamshire Patient Transport Service (PTS) Summary
Departure times
from Point of
Care
Time on Vehicle
- Patients w ithin
a certain radius
of the point of
care
Customer
Service
KPI 3
KPI 1
KPI 5

42
Leve
l 2 -
NH
S 1
11
Pe
rfo
rman
ce
Acc
ess
& Q
ua
lity,
Co
sts
and
Pati
en
t Ex
pe
rie
nce
Pe
rfo
rman
ce C
om
par
iso
n
No
ttin
gham
shir
e ar
e p
erfo
rmin
g w
ith
in t
he
top
10
fo
r 2
of
the
4 P
atien
t Ex
per
ien
ce in
dic
ato
rs. 9
0%
of
pati
ents
rep
ort
ed t
o b
e v
ery
or
fair
ly s
atisfi
ed w
ith
th
e 1
11
exp
erie
nce
, th
is
com
par
es
to 8
8%
wit
h t
he
nei
ghb
ou
rin
g ar
ea o
f D
erb
ysh
ire
Co
un
ty.
Ac
ce
ss
& Q
uali
ty,
Co
sts
an
d P
ati
en
t E
xp
eri
en
ce
The
follo
win
g p
age
s d
etai
l per
form
ance
of
key
ind
icat
ors
fo
r th
e N
HS
11
1 s
ervi
ce a
cro
ss t
he
Mid
lan
ds
and
Eas
t re
gio
n.
All
dat
a is
ap
pro
xim
ate
as D
erb
ysh
ire
Hea
lth
Un
ited
(D
HU
) as
sign
cal
ls b
ased
on
th
e ST
D C
od
e/lo
cati
on
of
mo
bile
ph
on
e m
ast,
an
d t
her
efo
re t
her
e w
ill b
e cr
oss
bo
rder
cal
ls a
nd
resi
den
ts o
f o
ther
are
as c
allin
g fr
om
wit
hin
No
ttin
gham
shir
e in
clu
ded
in t
he
figu
res.
Ad
diti
on
ally
th
e p
ho
ne
syst
em is
un
able
to
iden
tify
th
e lo
cati
on
of
5-1
0%
of
all c
alls
nati
on
ally
, th
ese
calls
are
allo
cate
d t
o a
ny
on
e o
f th
e 1
11
cen
tres
wh
o a
nsw
er
them
un
der
th
eir
loca
l co
ntr
acts
(th
is s
ho
uld
bal
ance
ou
t as
oth
er p
rovi
der
s w
ill a
nsw
er c
alls
fro
m N
otti
ngh
amsh
ire
resi
den
ts).
DH
U a
re w
ork
ing
to p
rovi
de
CC
G le
vel r
epo
rts
bu
t th
e sa
me
cav
eats
as
abo
ve w
ill a
pp
ly.
NC
A =
No
t cu
rren
tly
avai
lab
le
Are
aIn
dic
ato
r
Late
st
Mo
nth
= F
eb
-17
No
tts
Ran
k
(ou
t o
f 17)
1 =
Be
st
17 =
Wo
rst
Lincolnshire
Luton
Nottinghamshire
Derbyshire
Great Yarmouth
Hertfordshire
Norfolk
Suffolk
South Essex
North Essex
Northamptonshire
Milton Keynes
West Midlands
Cambridgeshire &
Peterborough
Leicstershire &
Rutland
Staffordshire
Bedfordshire
-239
226
246
271
307
335
344
269
272
252
283
234
200
327
209
278
137
-239
226
224
258
296
235
299
269
266
248
283
234
198
207
209
252
137
14
1%
1%
2%
2%
1%
2%
4%
1%
1%
1%
2%
1%
1%
1%
2%
2%
2%
13
94%
92%
91%
90%
95%
95%
89%
93%
94%
92%
89%
95%
93%
96%
90%
92%
91%
782%
81%
86%
89%
82%
78%
80%
85%
86%
87%
91%
82%
87%
79%
92%
80%
72%
-22%
15%
24%
29%
24%
22%
23%
21%
23%
25%
25%
21%
25%
23%
25%
30%
14%
11
62%
32%
48%
47%
50%
75%
63%
48%
50%
44%
42%
50%
49%
72%
40%
76%
33%
900:0
1:4
300:0
1:2
400:0
0:5
200:0
0:3
700:0
3:3
600:0
0:4
700:0
1:2
300:0
0:5
000:0
2:3
700:0
4:2
500:0
0:1
900:0
0:5
500:0
0:4
100:0
0:4
500:0
0:1
900:0
0:0
100:0
1:2
3
-N
CA
NC
AN
CA
NC
AN
CA
NC
AN
CA
NC
AN
CA
NC
AN
CA
NC
AN
CA
NC
AN
CA
NC
AN
CA
13
8%
10%
13%
15%
12%
6%
8%
11%
11%
14%
15%
11%
13%
7%
15%
7%
9%
13
43%
50%
32%
36%
33%
67%
49%
50%
28%
28%
31%
45%
49%
60%
30%
40%
49%
-00:1
3:1
600:3
3:5
400:1
4:1
800:1
4:4
400:1
6:0
000:1
0:0
700:1
2:5
400:1
2:5
600:1
5:3
600:1
8:0
000:1
5:0
600:1
3:3
500:1
2:5
300:1
0:4
500:1
4:5
400:1
1:1
700:3
1:0
1
Costs
-35%
24%
27%
26%
27%
27%
26%
22%
28%
26%
27%
22%
24%
29%
30%
28%
14%
95%
8%
6%
7%
7%
4%
5%
8%
5%
5%
7%
11%
5%
6%
5%
5%
6%
11
90%
88%
90%
88%
90%
92%
91%
85%
93%
91%
88%
81%
91%
88%
90%
93%
90%
11
87%
83%
88%
91%
90%
89%
90%
87%
91%
90%
90%
84%
89%
88%
90%
90%
85%
981%
77%
81%
80%
81%
83%
83%
69%
85%
82%
80%
62%
83%
81%
79%
85%
79%
% h
andlin
g tim
e b
y c
linic
al s
taff
Patie
nt
Experience
% d
issatis
fied w
ith 1
11 e
xperience
% v
ery
or
fairly
satis
fied w
ith 1
11 e
xperience
% c
alle
rs w
ho f
ully
com
plie
d w
ith a
dvic
e
% c
alle
rs w
here
pro
ble
m r
esolv
ed o
r im
pro
ved
% c
alls
answ
ere
d in
60 s
econds
Calls
via
111 p
er
year
per
1,0
00 p
eople
Calls
per
year
per
1,0
00 p
eople
Access &
Qualit
y
Avera
ge w
arm
tra
nsfe
r tim
e (
secs)
(clin
icia
n p
icku
p)
Avera
ge N
HS
111 li
ve tra
nsfe
r tim
e (
min
s)
% tra
nsfe
rred c
alls
live tra
nsfe
rred
% a
nsw
ere
d c
alls
tra
nsfe
rred to c
linic
al a
dvis
or
% a
nsw
ere
d c
alls
triaged
% a
bandoned c
alls
(aft
er
30 s
econds w
aiti
ng tim
e)
Avera
ge e
pis
ode le
ngth
% c
all
backs
with
in 1
0 m
inute
s
% a
nsw
ere
d c
all
passed f
or
call
back

43
Leve
l 2 -
NH
S 1
11
Pe
rfo
rman
ce
Syst
em
Imp
act
Pe
rfo
rman
ce C
om
par
iso
n
The
abo
ve t
able
loo
ks a
t th
e sy
stem
imp
act
of
the
11
1 s
ervi
ce. A
s ca
n b
e se
en 1
0%
of
calls
en
ded
wit
h a
n A
mb
ula
nce
bei
ng
dis
pat
ched
. 7%
of
pati
ents
wer
e re
com
men
ded
to
att
en
d
A&
E, t
his
is a
sim
ilar
leve
l of
per
form
ance
to
th
at s
een
acr
oss
th
e M
idla
nd
s an
d E
ast.
Th
e re
com
men
dati
on
s to
att
end
as
wel
l as
no
t to
att
end
oth
er s
erv
ices
var
y b
etw
een
No
ttin
gham
shir
e an
d o
ther
Mid
lan
ds
and
Eas
t ar
eas.
On
ly 3
% o
f N
otti
ngh
amsh
ire
pati
ents
we
re r
eco
mm
end
ed t
o a
tte
nd
oth
er s
ervi
ces,
th
is in
clu
de
s sp
eci
alis
t p
racti
tio
ner
s in
clu
din
g
mid
wiv
es,
ch
ild p
rote
ctio
n, s
oci
al s
ervi
ces
and
op
tici
ans,
th
is c
om
par
es
to 7
% o
f D
erb
ysh
ire
pati
ents
.
Sys
tem
Im
pac
t
NC
A =
No
t cu
rren
tly
avai
lab
le
Are
a
Late
st
Mo
nth
= F
eb
-17
No
tts
Ran
k
(ou
t o
f 17)
1 =
Be
st
17 =
Wo
rst
Lincolnshire
Luton
Nottinghamshire
Derbyshire
Great Yarmouth
Hertfordshire
Norfolk
Suffolk
South Essex
North Essex
Northamptonshire
Milton Keynes
West Midlands
Cambridgeshire &
Peterborough
Leicstershire &
Rutland
Staffordshire
Bedfordshire
13
11%
9%
10%
9%
8%
7%
9%
10%
8%
7%
9%
9%
9%
9%
10%
10%
8%
-7%
6%
7%
7%
5%
6%
6%
7%
7%
6%
8%
9%
7%
7%
7%
6%
8%
-51%
48%
50%
53%
51%
52%
50%
55%
55%
54%
57%
53%
52%
55%
52%
50%
45%
-37%
34%
33%
35%
29%
36%
31%
38%
36%
34%
42%
37%
37%
33%
35%
35%
30%
-11%
9%
11%
13%
18%
12%
15%
11%
16%
17%
12%
10%
12%
17%
13%
10%
9%
-3%
4%
5%
4%
4%
4%
4%
5%
3%
3%
2%
7%
4%
5%
5%
5%
7%
-2%
3%
3%
7%
6%
4%
3%
3%
5%
5%
2%
1%
5%
1%
3%
4%
2%
-29%
34%
30%
24%
31%
31%
32%
24%
26%
29%
24%
28%
27%
28%
27%
29%
37%
-1%
1%
2%
1%
1%
2%
1%
1%
2%
1%
1%
1%
1%
1%
2%
0%
1%
-5%
4%
5%
6%
5%
5%
6%
5%
7%
6%
5%
6%
6%
5%
5%
5%
5%
-5%
2%
11%
8%
7%
2%
5%
4%
4%
9%
9%
3%
7%
2%
12%
3%
2%
-17%
26%
13%
9%
18%
22%
20%
15%
14%
13%
9%
18%
13%
21%
8%
20%
29%
-
% o
f calls
not tr
iaged
Syste
m
Impact
-
% R
ecom
mended to d
enta
l / p
harm
acy
-
% R
ecom
mended to s
peak
to p
rim
ary
and c
om
munity
care
Of
whic
h -
% R
ecom
mended to c
onta
ct prim
ary
and c
om
munity
care
-
% R
ecom
mended n
on c
linic
al
-
% R
ecom
mended h
om
e c
are
Of
whic
h -
% G
iven h
ealth
info
rmatio
n
Ind
icato
r
111 d
ispositi
ons: %
Not re
com
mended to a
ttend o
ther
serv
ice
111 d
ispositi
ons: %
Recom
mended to a
ttend o
ther
serv
ice
111 d
ispositi
ons: %
Recom
mended to a
ttend p
rim
ary
and
com
munity
care
111 d
ispositi
ons: %
Recom
mended to a
ttend A
&E
111 d
ispositi
ons: %
Am
bula
nce d
ispatc
hes

Quality Premium
44
The Quality Premium is £5 per head of running cost population and will be payable to CCGs in 2016/17 based on the quality of health services commissioned during 2015/16. This will be based on several measures that cover a combination of national and local priorities. This initial value will be reduced if providers, from which the CCG commissions services, are unable to meet the 4 key areas of the NHS Constitution and pledges for its population. As well as achieving the above there are 3 prerequisites for the Quality Premium to be payable. A CCG will not achieve a quality premium if it: a. is not considered in a manner that is consistent with Managing Public Money during 2015/16; or b. Incurs an unplanned deficit during 2015/16, or requires unplanned financial support to avoid being in this position; or c. Incurs a qualified audit in respect of 2015/16. The table below provides an overview of the Quality Premium for the CCG.
Nottingham North & East
£130,535
Percentage
of Quality
Premium
Potential
ValueAchieve by
Latest
Performance
Latest
Period
Available
Trend Award
Premature
Mortality10% £72,520
Less than
or equal to1984.6
2015 Calendar
Year2116.9 2014 £0
Unplanned hospitalisation for chronic ambulatory care
sensitive conditions
Less than
or equal to1000 2015/16 788.6 2015/16
Unplanned hospitalisation for asthma, diabetes and
epilepsy in children
Less than
or equal to1000 2015/16 164.9 2015/16
Emergency admissions for acute conditions that
should not usually require hospital admission
Less than
or equal to1000 2015/16 1137.1 2015/16
Emergency admissions for children with lower
respiratory tract infection
Less than
or equal to1000 2015/16 388.2 2015/16
Avoidable Emergency Admissions Composite 10% £72,520Less than
or equal to1000 2015/16 887.5 2015/16 £72,520
10% £72,520More than
or equal to22.52% 2015/16 23.39%
Apr-15 -
Mar-16£72,520
10% £72,520 Less than 2709 2015/16 2421 Mar-16 £72,520
Improvement in coding of patients attending A&EMore than
or equal to90% 2015/16 98.60%
Apr-15 -
Mar-16
Reduction in the number of patients with A&E 4 hour
breaches who have attended with a mental health need
More than
or equal to89.63% 2015/16 72.12%
Apr-15 -
Mar-16
10% £72,520 Less than 0.157 2015/16 0.228 2015/16 £0
10% £72,520 Less than 37.3% 31-Mar-16 37.3% 2014/15 £72,520
5% £36,260More than
or equal to6.5 Q4 2015/16 5 2015/16 £0
5% £36,260Less than
or equal to1.10 2015/16 1.11 2013/14 £0
3% £21,756 Less than 12.23% 2015/16 13.51% 2013/14 £0
2% £14,504 Validated Yes 2015/16
Local
Measure 1C3.9
Patients who have had an acute stroke who spend 90%
or more of their stay on a stroke unit10% £72,520 More than 89.2% 2015/16 90.2% 2015/16 £72,520
Local
Measure 2C5.4
Incidence of healthcare associated infection (HCAI)
Clostridium Difficile10% £72,520
Less than
(YTD)47
Less than 47
by 2015/1632
Apr-15 -
Mar-16£72,520
100% £725,195 £435,117
Percentage
of Quality
Premium
Potential
ReductionAchieve by
Latest
Performance
Latest
Period
Available
Trend Reduction
RTT -30% -£130,535More than
or equal to92% 2015/16 97.33%
Apr-15 -
Mar-16£0
A&E -30% -£130,535More than
or equal to95% 2015/16 89.55%
Apr-15 -
Mar-16-£130,535
Cancer -20% -£87,023More than
or equal to93% 2015/16 91.67%
Apr-15 -
Mar-16-£87,023
Ambulance -20% -£87,023More than
or equal to75% 2015/16 69.12%
Apr-15 -
Mar-16-£87,023
-100% -£435,117 -£304,582
CCG Name
Measure
Reducing NHS-responsible delayed transfers of care (days delayed
per 100,000 population)
Improvement in the health-related quality of life for people with a
long-term mental health condition
Reduction in the number of people with severe mental illness who
are smokers
Urgent &
Emergency
Care Menu
Mental
Health
Menu
An increase in the level of discharges at weekends and bank
holidays
Reducing Potential Years of Life Lost (PYLL) from causes
considered amenable to healthcare over time
Quality Premium
Forecast
N/A
A&E 5%
Increase the proportion of adults with secondary mental health
conditions who are in paid employment
Reduction in the number of antibiotics prescribed in primary care
Composite
Measure
Performance
Needed
N/A
£0£36,260
N/A
Performance
Needed
Improving
Antibiotic
Prescribing
Patients on incomplete pathways (yet to start treatment) should
have been waiting no more than 18 weeks from referral
Total
Reduction in the proportion of broad spectrum antibiotics prescribed
in primary care
Secondary care providers validating their total antibiotic prescription
data
Total
Patients should be admitted, transferred or discharged within four
hours of their arrival at an A&E department
Maximum two week (14-day) wait from urgent GP referral to first
outpatient appointment for suspected cancer
Red 1 ambulance calls resulting in an emergency response arriving
within 8 minutes (Total EMAS not CCG)
NHS Constitution Right and Pledges

Better Care Fund
45
The Better Care Fund creates a local single pooled budget to incentivise the NHS and local government to work more closely
together around people, placing their well-being as the focus of health and care services.
The BCF is a critical part of the NHS 2 year operational plans and the 5 year strategic plans as well as local government planning.
Within the BCF there are six indicators as shown below, which are supported by a range of schemes that contribute towards
delivery of the required standards.
Please note, the data is monitored and reported at Nottinghamshire County Local Authority level in line with the requirements
of the BCF. Therefore commentary may relate to organisations other than the CCG to which this report relates.
The latest data available is for February 2017.
REF Indicator 2016/17 Target
2016/17 (to date)
RAG rating
and trend
BCF1 (pg 5)
Total non-elective admissions in to hospital (general & acute), all-age, per 100,000 population
19,707 Q4
February 2017
6,878.76
R
BCF2 (pg 9)
Permanent admissions of older people (aged 65 and over) to residential and nursing care homes, per 100,000 population
578.9 January
2017 561
G
BCF3 (pg 12)
Proportion of older people (65 and over) who were still at home 91 days after discharge from hospital into reablement / rehabilitation services
91.2% 80.63%
YTD R
BCF4 (pg 14)
Delayed transfers of care (delayed days) from hospital per 100,000 population (average per month)
1,101.5 Q4
February 2017 243
G
BCF5 (pg 19)
Percentage of users satisfied that the adaptations met their identified needs
75% 100%
Q3 G
BCF5 (pg 19)
BCF5: Question 32 from the GP Patient Survey: In the last 6 months, have you had enough support from local services or organisations to help manage long-term health condition(s)
65.4% 64.4% (July)
R
BCF6 (pg 20)
Permanent admissions of older people (aged 65 and over) to residential and nursing care homes directly from a hospital setting per 100 admissions of older people (aged 65 and over) to residential and nursing care homes
34% 23.4% G

Better Care Fund
46
BCF 1 - Total non-elective admissions into hospitals (general and acute), all ages
Numerator All non-elective admissions into hospital (all ages)
Denominator Nottinghamshire resident population Reporting Monthly, two months in arrears (targets quarterly). Low values are good.
Source Secondary Uses Service (SUS), NHS England.
Comments
Monitored by CCG boards and System Resilience Groups
This data is provisional from SUS (national data published monthly by NHS England)
SUS data is not currently available for CCGs outside of Nottinghamshire, MAR data presented as a
proxy
Change of definition in 2016/17 - no longer expressed as a rate per 100,000 population
R
▲
February 2017
6,878.76
Current RAG
Rating and Trend
19,743
20,038
19,866
19,707
21,457 (Proxy)
21,679 (Proxy)
23,176 (Proxy)
Apr 16 - Jun 16
Jul 16 - Sep 16
Oct 16 - Dec 16
Jan 17 - Mar 17
Planned Actual

Better Care Fund
47
BCF 3 - Proportion of older people (65 and over) who were still at home 91 days after discharge from
hospital into reablement / rehabilitation services

Better Care Fund
48
BCF 5 - Question 32 from the Patient GP Survey: In the last 6 months, have you had enough support from
local services or organisations to help manage long-term health condition(s)
Question 32 from the GP Patient Survey: In the last 6 months, have you had enough support from local services or organisations to help manage long-term health condition(s)
2013/14 Baseline 65.8%
2014/15 target 67.1%
2015/16 target 68.5%
2015/16 actual 64.4%
2016/17 target 65.4%
Latest performance (July 2016 weighted) 64.4%
Reporting Data is reported six monthly, four months in arrears. High values are good
Source NHS England six monthly reporting