Embed Size (px)
Citation preview
Monthly Labor Review • August 2010 17
Time-Use Surveys
Time-use surveys: issues in datacollection on multitasking
Secondary-activity reports from the American Time UseSurvey are not as good as those from the FamilyInteraction, Social Capital, and Trends in Time Usesurvey; statistical analysis reveals that the differenceis attributable to the fact that such reports arerequested in the former, but volunteered in the latter
Robert W. DragoandJay C. Stewart
Robert W. Drago is research direc-tor at the Institute for Women’s Policy Research, Washington, DC; Jay C. Stewart is Division Chief, Division of Productivity Research and Program Develop-ment, Office of Productivity and Technology, Bureau of Labor Statistics. E-mail: [email protected] or [email protected]
Time-use surveys collect informa-tion on how people spend their time. In the American Time
Use Survey (ATUS), as in many other time-use surveys, respondents are asked to report sequentially what they did on the day before the interview. The reports they provide offer a detailed look at how Americans spend their time. However, the picture is not complete because the ATUS does not have information on multitask-ing (secondary activities).
Why might researchers be interested in multitasking? First, researchers study-ing work-life balance are interested in the extent to which people, especially women, multitask to get more out of their day. Second, researchers who wish to measure household production would want to in-clude household work that is done as a sec-ondary activity. Third, for many questions, it is important to capture all episodes of a particular activity. For example, researchers interested in the causes of obesity may want to examine eating as a secondary activity or which activities people combine with eating when it is the primary activity. Fourth, sec-ondary activities can provide a more com-plete picture of childcare, because much
childcare is done as a secondary activity. The ATUS already collects information on passive childcare (having children “in your care” while doing something else), but does not capture ac-tivities such as reading to and playing with chil-dren while waiting or traveling (as a passenger).
Although the ATUS does not ask respond-ents to report secondary activities, the infor-mation is recorded if the respondent volunteers that he or she was doing something else at the same time. However, only the primary activity is coded. For example, if the respondent reports eating as a primary activity and watching tele-vision as a secondary activity, both activities are recorded but only eating is coded. Surveys that systematically collect information on second-ary activities (for example, the Australian Gov-ernment’s time-use survey and some of the ear-lier U.S. surveys) do so by asking respondents, “What else were you doing?”
It is well known that respondents are more likely to report information when they are directly asked to do so than when they must volunteer to give the information.1 Thus, one would expect the former approach to result in better information on secondary activities than the latter. But when respondents report a secondary activity, it can be either simulta-neous with the primary activity or sequential.
Time-Use Surveys
18 Monthly Labor Review • August 2010
The question “What else were you doing?” is designed to collect information about activities that are done at the same time as the primary activity (simultaneous activities), such as listening to the radio while driving or reading to a child while riding the subway. Howev-er, respondents may find it convenient to report certain short-duration activities as secondary, even though they were really the primary activity. For example, if a respondent interrupts his or her dinner prepara-tion to answer the phone, these activities should be recorded as cooking, talking on the phone, and cook-ing. Instead, the respondent might report the single activity of cooking and report talking on the phone as a secondary activity.
In a perfect world, respondents would identify all sequential activities as primary, taking the time to report the starting and stopping times, whom they were with, and where they were. Only true simulta-neous activities would be reported as secondary (or ignored if secondary activities are not collected). But interviewers and respondents are not perfect: it may be less burdensome for respondents to report short-duration sequential activities as secondary activities rather than as primary activities because they do not have to provide any additional information about the activity. Thus, secondary-activity reports almost certainly include short-duration sequential activities that respondents did not report separately, as well as true simultaneous activities. However, the collec-tion of secondary activities could help respondents recall their primary activities more accurately. Con-sequently, it is not clear how the quality of primary-activity reports is affected by the collection of sec-ondary activities.
The extent to which respondents report short-du-ration sequential activities as secondary may depend, in part, on the survey’s procedures. For example, when faced with a volunteered secondary-activity report, ATUS interviewers are instructed to “try to break apart [secondary] activities [into primary activities] if you can but do not challenge the [respondent].”2 All time-use surveys entail some interaction between interview-ers and respondents, to clarify respondents’ reporting of their activities. However, one would expect to see less reporting of sequential activities as secondary in the ATUS than might be the case if interviewers were not so instructed or if the ATUS used leave-behind pa-per diaries, which allow respondents to choose how to report these activities. If there is no mechanism for collecting secondary activities (either requested or vol-
unteered), one might expect respondents to be more likely to report a short-duration sequential activity as primary.
An earlier study by Ragne Kitterod sheds light on this is-sue.3 She used a unique survey from a Norwegian survey that collected diaries for two consecutive days. On the first day, respondents were asked to report only primary activities; on the second day, they were asked to report secondary activities as well. Kitterod’s empirical findings strongly suggest that the pattern of primary-activity reports differs across the two diary days. When women with children were asked to report secondary activities, the most common ones reported were socializing (136 minutes per day), watching television (87 minutes), providing childcare (48 minutes), and engaging in other leisure activities (23 minutes). When respondents were not asked to report secondary activities, a slightly greater amount of primary-activity time was reported for these ac-tivities, with 4 additional minutes of socializing, 6 additional minutes watching television, 12 additional minutes provid-ing childcare, and 4 additional minutes engaging in other leisure activities. The pattern for men with children is similar, except that, contrary to expectation, they report more time socializing as a primary activity when secondary activities are collected.
Kitterod’s findings still leave unanswered the question of whether the ATUS approach leads respondents to report more sequential activities as primary activities. Here, it is important to note that the ATUS approach is not comparable to that used in the Norwegian study. As noted, the ATUS in-terviewers ask respondents to determine whether activities are truly simultaneous. In contrast, respondents to the Nor-wegian survey were instructed on the first day to list “only one task during each period.”4 It is possible that respondents reported more short-duration sequential and simultaneous activities as primary activities on the first day, when there was no secondary-activity option. In addition, keep in mind that the diaries were leave-behind diaries, which means that there was no interviewer to prompt the respondent to break apart activities.
The purpose of the study presented in this article is to examine alternative approaches to collecting information on secondary activities and the implications for collecting information on primary activities. The study addresses two issues:
1. How is the quality of information on secondary activi-ties affected by the method of collection?
2. How does the collection of information on secondary activities affect the quality of primary-activity reports?
For this study, the 2006 ATUS secondary-activity reports were
Monthly Labor Review • August 2010 19
specially coded, making it possible to compare those re-ports with secondary-activity reports from the 1998–99 Family Interaction, Social Capital, and Trends in Time Use (FISCT) survey, the most recent time-use survey that asks respondents to report secondary activities.5
Data
The ATUS is a stratified three-stage sample drawn from households that recently completed their participation in the Current Population Survey (CPS). CPS households are stratified on the basis of their characteristics, and ATUS sample households are randomly selected from the result-ing strata. One individual is then randomly selected from the list of adult (15 years or older) household members. All adults in the household have the same probability of selection. The survey is designed to be nationally repre-sentative of the civilian noninstitutional population 15 years and older.
The ATUS is sponsored by the Bureau of Labor Sta-tistics and is conducted by the U.S. Census Bureau via computer-assisted telephone interviewing (CATI). All ATUS respondents are assigned an initial diary day and are called the next day. If a complete interview is not obtained on the initial interview day, subsequent contact attempts are made on the same day of subsequent weeks. This pro-cedure maintains the assignment of respondents to days of the week.
The ATUS core time diary is similar to time diaries of other surveys. The respondent is asked to describe his or her day sequentially from 4 a.m. “yesterday” through 4 a.m. “today.” The respondent describes each activity, which the interviewer either records verbatim or, for a limited set of commonly performed, unambiguously de-fined activities (such as sleeping or watching television), enters an activity precode. The verbatim responses are coded to a three-tiered scheme, going from major activ-ity categories, to subcategories, to descriptions of specific actions that together are considered to make up a single third-tier activity. As noted earlier, only the primary activity is coded and interviewers ask respondents to break apart secondary activities into primary activities. For each activity reported, the ATUS interviewer records either the ending time or the duration of the activity. The interviewer also asks where the respondent was and whom the respondent was with, unless the activity is sleeping, grooming, a personal activity, “refused” (none of your business, and so forth), or “don’t know.” For paid work, respondents are asked to report where they were, but not whom they were with.
After the time diary has been completed, the ATUS in-terviewer asks several summary questions, including ques-tions on passive childcare that obtain information which cannot readily be obtained from the core time diary. These questions ask about times or activities during which chil-dren under 13 were “in your care.” In 2006 and 2007, the “Eating and Health” module in the ATUS collected infor-mation about eating and drinking as a secondary activity, along with other information.
For this study, the Census Bureau coded secondary ac-tivities reported in the 2006 ATUS data. Each secondary activity was coded by two independent coders and was adjudicated when there were differences (as is done in coding primary activities). Coding was performed by the same team that codes the primary activities in the ATUS, thereby ensuring that the coding of secondary activities is of high quality and is consistent with that of primary activities.
The FISCT was conducted between March 1998 and March 1999, and its sample of 1,151 respondents is rep-resentative of the population 18 years and older. FISCT interviews were conducted via CATI from the Survey Research Center at the University of Maryland. The in-formation on primary activities collected in the FISCT diaries is similar to that collected in the ATUS, although the FISCT reference day runs from midnight to midnight, rather than from 4 a.m. to 4 a.m. The difference in ref-erence period should not matter much, except that the FISCT captures fewer episodes of sleep. For example, an individual who always goes to sleep after midnight, but before 4 a.m., will have one sleep episode per day in the FISCT and two in the ATUS.
To make ATUS data comparable with FISCT data, respondents under the age of 18 years were excluded, reducing the ATUS sample to 12,200 respondents. Be-cause the ATUS excludes individuals reporting fewer than five episodes on the reference day, the three FISCT respondents reporting fewer than five episodes were ex-cluded from the analyses, resulting in a sample of 1,148 respondents. All of the analyses use sample weights, except where explicitly stated otherwise. Weighting is necessary for comparability, because it corrects for strat-ification of the samples and ensures correct day-of-week representation.6
The FISCT collects information on secondary activities through the question “What else were you doing?” FISCT data also include a small number of tertiary activities that respondents reported, in addition to both primary and secondary activities, during a given episode. Tertiary ac-tivities are present in a weighted 3.1 percent of all FISCT
Time-Use Surveys
20 Monthly Labor Review • August 2010
episodes. ATUS data include some tertiary activities, but they were not coded; therefore, tertiary activities in both the FISCT and the ATUS are ignored here. The FISCT does not collect starting and stopping times separately for sec-ondary activities, so durations are assumed to be the same as for the corresponding primary activities.
Activity codes in the ATUS are more detailed than those in the FISCT (462 categories compared with 93). To make the codes more comparable, the activity codes in both datasets were collapsed into 13 major categories. Although some of these categories are not standard (due to differences across the surveys), they are consistently de-fined across the two surveys. (See the appendix.)
Before proceeding, it is worth noting some selection issues that could complicate the analysis. An individual’s propensity to report secondary activities may be corre-lated with how busy he or she is, although it is not clear which way the correlation goes. On the one hand, busy people’s time may be more valuable, making it more cost-ly for them to report secondary activities. On the other hand, they may want to tell the interviewer how busy their lives are. The same factors come into play when they decide whether or not to participate in the survey. There is no research on how being busy might affect the reporting of secondary activities, but research by Katha-rine Abraham, Aaron Maitland, and Suzanne Bianchi finds that busy people are no less likely to participate in the ATUS.7 What does seem to matter is the degree to which individuals have strong ties to their communities. Those with weaker ties are less likely to participate, but that is due mainly to the lower probability of contacting these individuals. On the basis of a propensity-score re-weighting of the data, Abraham, Maitland, and Bianchi conclude that, despite the low response rate in the ATUS, there is no evidence of systematic bias. Thus, the analysis will proceed as though there is little or no systematic bias in the propensity of busy people to report secondary activities.
Respondents also may differ with respect to the level of detail they provide. Again, the effects of the differences are ambiguous. Conscientious respondents provide a lot of detail, so one would expect them to report both more primary and more secondary activities than less conscien-tious respondents. However, they also may make a greater effort to correctly report short-duration sequential activi-ties as primary, rather than reporting them as secondary. The latter type of respondent would tend to reduce the number of secondary activities reported, but increase the number of primary activities.
In addition to the issues discussed thus far, the sample
selection process for the two surveys likely generated some differences in the samples obtained. The ATUS sample is drawn from households that recently completed their participation in the CPS, whereas FISCT respondents were selected by random-digit dialing. It is not clear how these differences would affect the decisions to participate in the surveys.8 Differences in the assignment of respondents to days of the week also could affect comparisons. In contrast to the ATUS contact strategy of preassigning each selected individual to a specific day of the week and calling on the same day of the week on subsequent contact attempts, the FISCT calls on consecutive days until the individual is reached. If people are less likely to respond to a survey on busy days (or on days that they are mostly away from home), then the FISCT will oversample busy days (or days when the person is away from home).9
Weighting should correct for biases that are related to the (observable) characteristics used to generate the weights. However, nothing can be done if selection pro-pensities are related to unobservable characteristics.
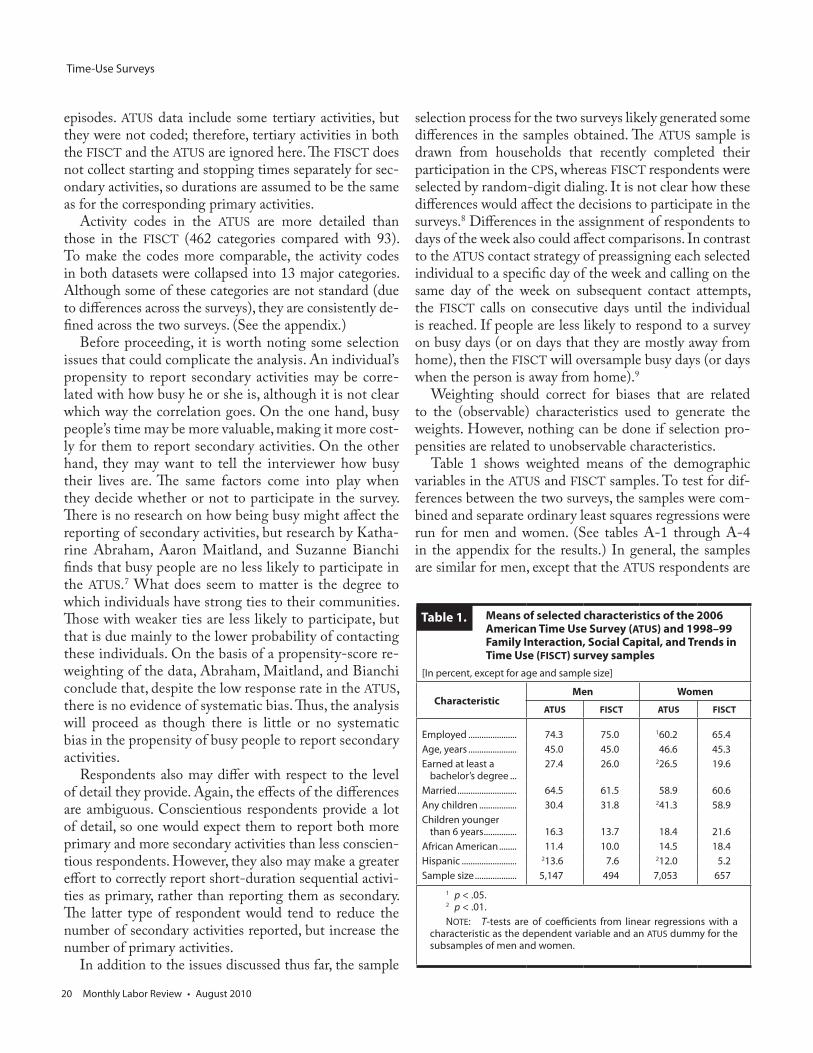
Table 1 shows weighted means of the demographic variables in the ATUS and FISCT samples. To test for dif-ferences between the two surveys, the samples were com-bined and separate ordinary least squares regressions were run for men and women. (See tables A-1 through A-4 in the appendix for the results.) In general, the samples are similar for men, except that the ATUS respondents are
Means of selected characteristics of the 2006 American Time Use Survey (ATUS) and 1998–99 Family Interaction, Social Capital, and Trends in Time Use (FISCT) survey samples
[In percent, except for age and sample size]
CharacteristicMen Women
ATUS FISCT ATUS FISCT
Employed ...................... 74.3 75.0 160.2 65.4Age, years ...................... 45.0 45.0 46.6 45.3Earned at least a
bachelor’s degree ...27.4 26.0 226.5 19.6
Married ........................... 64.5 61.5 58.9 60.6Any children ................. 30.4 31.8 241.3 58.9Children younger
than 6 years ............... 16.3 13.7 18.4 21.6African American ........ 11.4 10.0 14.5 18.4Hispanic ......................... 213.6 7.6 212.0 5.2Sample size ................... 5,147 494 7,053 657
1 p < .05.2 p < .01. NOTE: T-tests are of coefficients from linear regressions with a
characteristic as the dependent variable and an ATUS dummy for the subsamples of men and women.
Table 1.
Monthly Labor Review • August 2010 21
more likely to be Hispanic. Compared with women in the FISCT, women in the ATUS are more likely to be Hispanic, to be more highly educated, not to be employed, and not to have children in the household. Tests for whether the weighted samples included more diaries from any particu-lar weekday were uniformly insignificant, except that men in the FISCT sample were less likely to have completed a diary on a Tuesday.10
Analysis
The first step in analyzing secondary-activity data is to document differences between the ATUS and the FISCT in reporting such activities, using the number of episodes as a measure of quality. The implicit assumption, which is fairly standard among time-use researchers, is that a larger number of episodes implies more detail and thus higher quality. As before, ordinary least squares regressions were run on the combined ATUS-FISCT dataset, with the de-pendent variable being the number of primary-activity episodes. The main variable of interest is the indicator variable for whether the observation is from the ATUS. To control for differences between the two datasets, the regressions included variables for Hispanic ethnicity, edu-cation, employment status, and the presence of children in the household.11 An indicator variable for whether the diary day was a Tuesday was included, because Tuesdays were underrepresented in the male sample for the FISCT. To account for the greater number of sleep episodes re-ported in the ATUS (because of the difference in reference periods), a variable for the number of sleep episodes as a primary activity was included. Finally, the regressions include a measure of interviewer tenure, because ATUS in-terviewers were more experienced than FISCT interview-ers and one would expect more experienced interviewers to collect more detailed responses.
In the ATUS data, interviewer identifiers made it pos-sible to construct interviewer tenure from the 2003–06 call-history files. Tenure is equal to the number of months between the interviewer’s initial ATUS interview (some-times dating to January of 2003) and the current month in 2006. This measure slightly underestimates actual experi-ence, because some ATUS interviewers were collecting test data for several months before “live” data collection start-ed in January of 2003. For the FISCT, which does not have interviewer identifiers, interviewer tenure was constructed under the assumption that there was no interviewer turn-over; thus, tenure is simply the number of months from the beginning of the survey (March 1998) to the current survey month. This measure tends to overestimate inter-
viewer tenure to the extent that there was turnover among FISCT interview staff. The mean of the tenure variable is 28.7 months for the ATUS and 5.5 months for the FISCT.12 Tenure is specified as a quadratic in order to account for possible diminishing returns.
ATUS respondents reported an average of 20.14 pri-mary-activity episodes, while FISCT respondents aver-aged 18.43 episodes. As expected, secondary activities in the ATUS are relatively rare, averaging 0.45 episode per respondent. In contrast, FISCT respondents report-ed an average of 8.74 secondary-activity episodes per respondent. Using the simple regression analysis just described results in differences in both the number of primary-activity episodes and the number of second-ary-activity episodes that are significant at the 1-per-cent level. Adding the quadratic control for interviewer experience decreases the ATUS coefficient from 1.7 to 0.97, suggesting that much of the difference between the two surveys is in fact due to the greater experience levels of ATUS interviewers.13 Adding controls for sleep episodes, Hispanic origin, education, employment, chil-dren, and a Tuesday diary day drops the coefficient to a still-significant 0.80. For the count of secondary activi-ties, the ATUS regression coefficient varies from –8.29 with no controls to –8.50 with all of the controls and is uniformly significant.
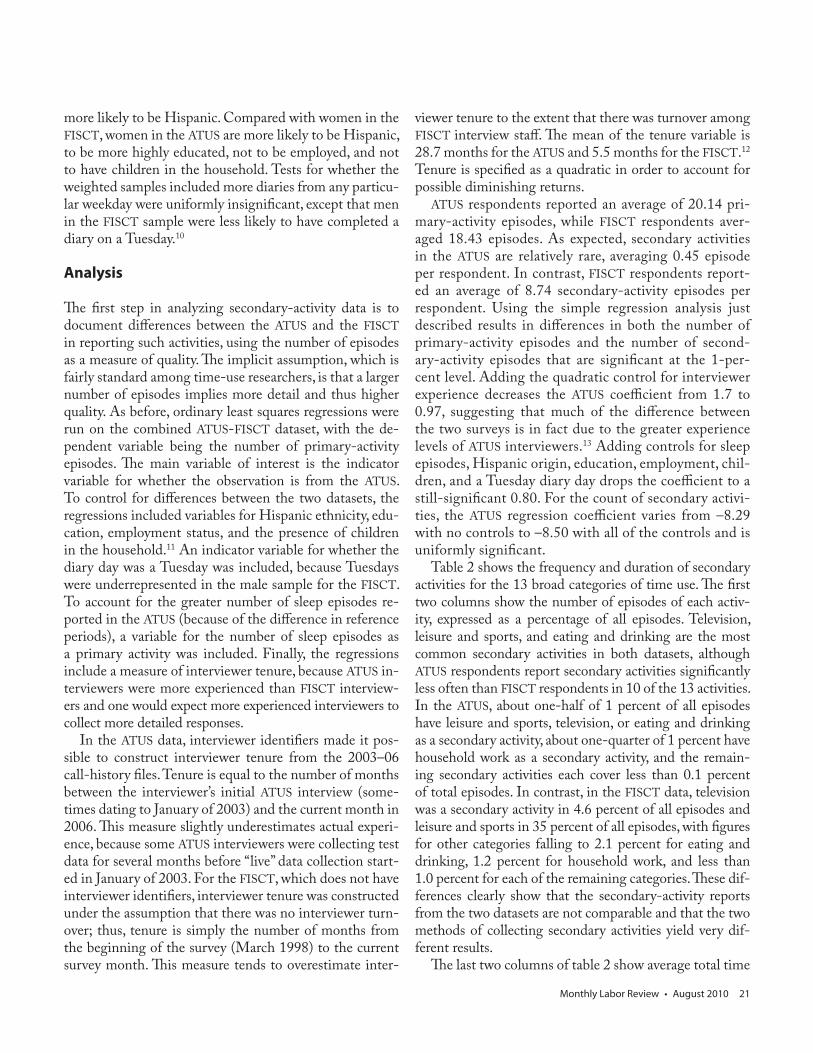
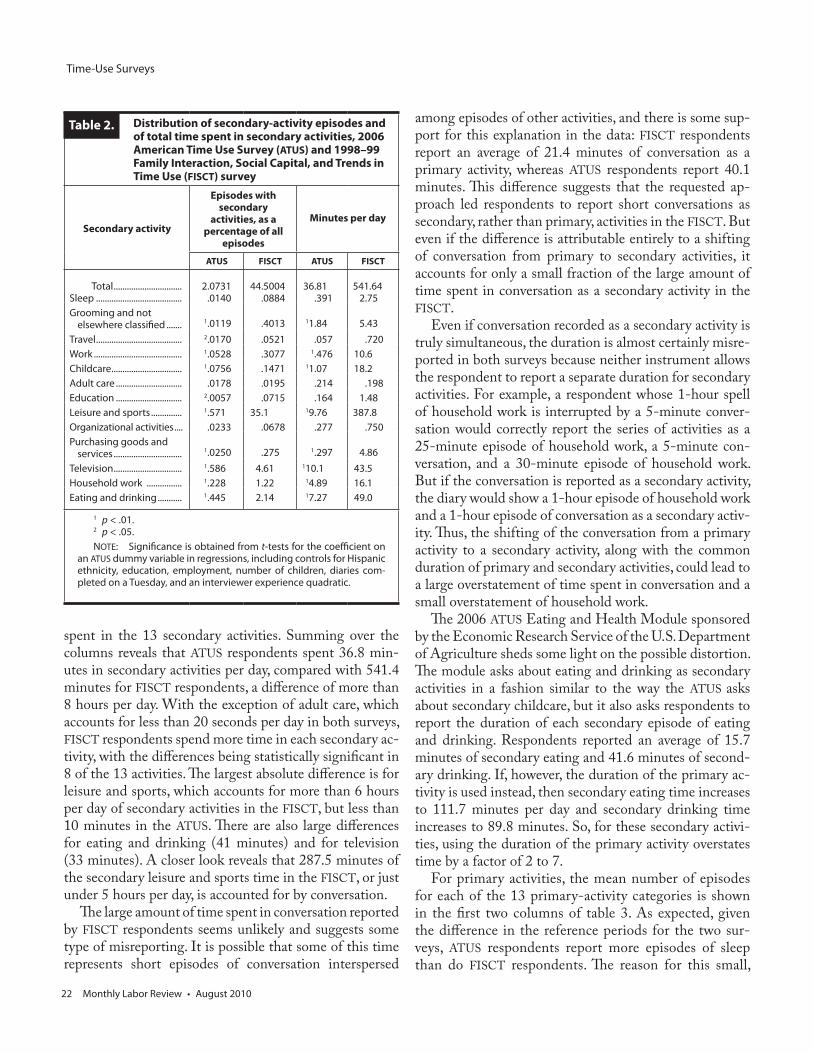
Table 2 shows the frequency and duration of secondary activities for the 13 broad categories of time use. The first two columns show the number of episodes of each activ-ity, expressed as a percentage of all episodes. Television, leisure and sports, and eating and drinking are the most common secondary activities in both datasets, although ATUS respondents report secondary activities significantly less often than FISCT respondents in 10 of the 13 activities. In the ATUS, about one-half of 1 percent of all episodes have leisure and sports, television, or eating and drinking as a secondary activity, about one-quarter of 1 percent have household work as a secondary activity, and the remain-ing secondary activities each cover less than 0.1 percent of total episodes. In contrast, in the FISCT data, television was a secondary activity in 4.6 percent of all episodes and leisure and sports in 35 percent of all episodes, with figures for other categories falling to 2.1 percent for eating and drinking, 1.2 percent for household work, and less than 1.0 percent for each of the remaining categories. These dif-ferences clearly show that the secondary-activity reports from the two datasets are not comparable and that the two methods of collecting secondary activities yield very dif-ferent results.
The last two columns of table 2 show average total time
Time-Use Surveys
22 Monthly Labor Review • August 2010
spent in the 13 secondary activities. Summing over the columns reveals that ATUS respondents spent 36.8 min-utes in secondary activities per day, compared with 541.4 minutes for FISCT respondents, a difference of more than 8 hours per day. With the exception of adult care, which accounts for less than 20 seconds per day in both surveys, FISCT respondents spend more time in each secondary ac-tivity, with the differences being statistically significant in 8 of the 13 activities. The largest absolute difference is for leisure and sports, which accounts for more than 6 hours per day of secondary activities in the FISCT, but less than 10 minutes in the ATUS. There are also large differences for eating and drinking (41 minutes) and for television (33 minutes). A closer look reveals that 287.5 minutes of the secondary leisure and sports time in the FISCT, or just under 5 hours per day, is accounted for by conversation.
The large amount of time spent in conversation reported by FISCT respondents seems unlikely and suggests some type of misreporting. It is possible that some of this time represents short episodes of conversation interspersed
among episodes of other activities, and there is some sup-port for this explanation in the data: FISCT respondents report an average of 21.4 minutes of conversation as a primary activity, whereas ATUS respondents report 40.1 minutes. This difference suggests that the requested ap-proach led respondents to report short conversations as secondary, rather than primary, activities in the FISCT. But even if the difference is attributable entirely to a shifting of conversation from primary to secondary activities, it accounts for only a small fraction of the large amount of time spent in conversation as a secondary activity in the FISCT.
Even if conversation recorded as a secondary activity is truly simultaneous, the duration is almost certainly misre-ported in both surveys because neither instrument allows the respondent to report a separate duration for secondary activities. For example, a respondent whose 1-hour spell of household work is interrupted by a 5-minute conver-sation would correctly report the series of activities as a 25-minute episode of household work, a 5-minute con-versation, and a 30-minute episode of household work. But if the conversation is reported as a secondary activity, the diary would show a 1-hour episode of household work and a 1-hour episode of conversation as a secondary activ-ity. Thus, the shifting of the conversation from a primary activity to a secondary activity, along with the common duration of primary and secondary activities, could lead to a large overstatement of time spent in conversation and a small overstatement of household work.
The 2006 ATUS Eating and Health Module sponsored by the Economic Research Service of the U.S. Department of Agriculture sheds some light on the possible distortion. The module asks about eating and drinking as secondary activities in a fashion similar to the way the ATUS asks about secondary childcare, but it also asks respondents to report the duration of each secondary episode of eating and drinking. Respondents reported an average of 15.7 minutes of secondary eating and 41.6 minutes of second-ary drinking. If, however, the duration of the primary ac-tivity is used instead, then secondary eating time increases to 111.7 minutes per day and secondary drinking time increases to 89.8 minutes. So, for these secondary activi-ties, using the duration of the primary activity overstates time by a factor of 2 to 7.
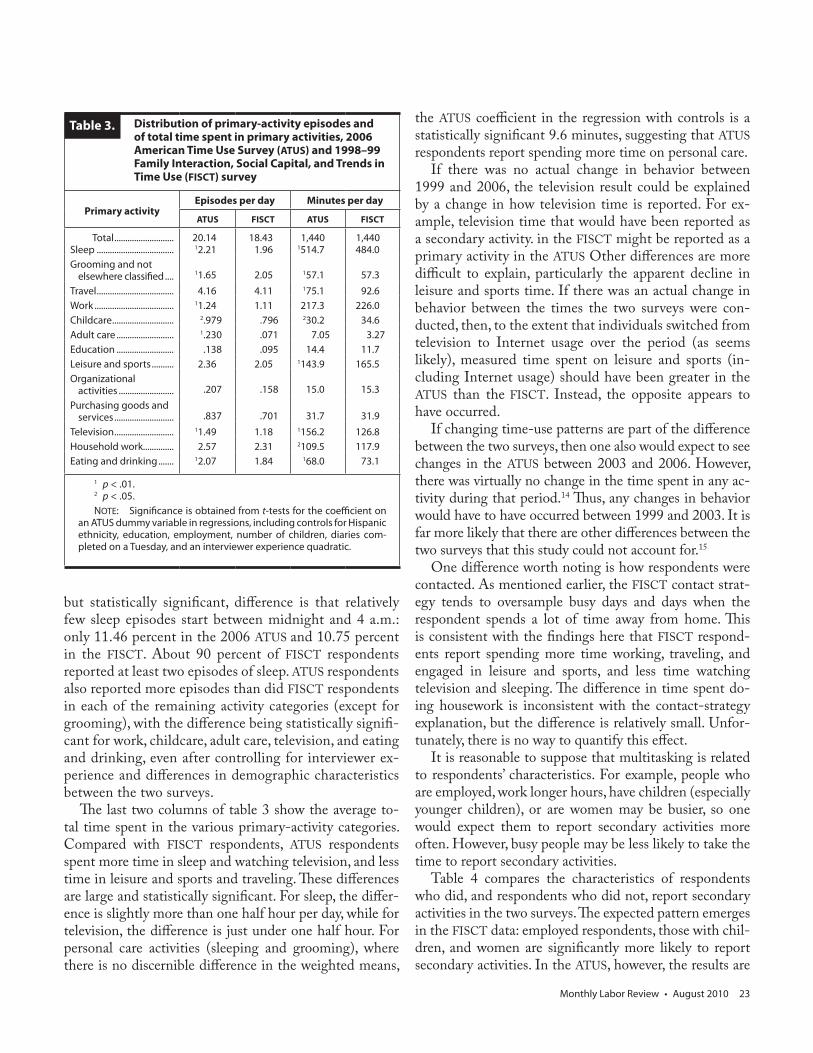
For primary activities, the mean number of episodes for each of the 13 primary-activity categories is shown in the first two columns of table 3. As expected, given the difference in the reference periods for the two sur-veys, ATUS respondents report more episodes of sleep than do FISCT respondents. The reason for this small,
Distribution of secondary-activity episodes and of total time spent in secondary activities, 2006 American Time Use Survey (ATUS) and 1998–99 Family Interaction, Social Capital, and Trends in Time Use (FISCT) survey
Secondary activity
Episodes with secondary
activities, as a percentage of all
episodes
Minutes per day
ATUS FISCT ATUS FISCT
Total ...............................Sleep .......................................
2.0731.0140
44.5004.0884
36.81.391
541.642.75
Grooming and not elsewhere classified ....... 1.0119 .4013 11.84 5.43
Travel ....................................... 2.0170 .0521 .057 .720Work ........................................ 1.0528 .3077 1.476 10.6Childcare ................................ 1.0756 .1471 11.07 18.2Adult care .............................. .0178 .0195 .214 .198Education .............................. 2.0057 .0715 .164 1.48Leisure and sports .............. 1.571 35.1 19.76 387.8Organizational activities .... .0233 .0678 .277 .750Purchasing goods and
services ............................... 1.0250 .275 1.297 4.86Television ............................... 1.586 4.61 110.1 43.5Household work ................ 1.228 1.22 14.89 16.1Eating and drinking ........... 1.445 2.14 17.27 49.0
1 p < .01.2 p < .05.NOTE: Significance is obtained from t-tests for the coefficient on
an ATUS dummy variable in regressions, including controls for Hispanic ethnicity, education, employment, number of children, diaries com-pleted on a Tuesday, and an interviewer experience quadratic.
Table 2.
Monthly Labor Review • August 2010 23
but statistically significant, difference is that relatively few sleep episodes start between midnight and 4 a.m.: only 11.46 percent in the 2006 ATUS and 10.75 percent in the FISCT. About 90 percent of FISCT respondents reported at least two episodes of sleep. ATUS respondents also reported more episodes than did FISCT respondents in each of the remaining activity categories (except for grooming), with the difference being statistically signifi-cant for work, childcare, adult care, television, and eating and drinking, even after controlling for interviewer ex-perience and differences in demographic characteristics between the two surveys.
The last two columns of table 3 show the average to-tal time spent in the various primary-activity categories. Compared with FISCT respondents, ATUS respondents spent more time in sleep and watching television, and less time in leisure and sports and traveling. These differences are large and statistically significant. For sleep, the differ-ence is slightly more than one half hour per day, while for television, the difference is just under one half hour. For personal care activities (sleeping and grooming), where there is no discernible difference in the weighted means,
the ATUS coefficient in the regression with controls is a statistically significant 9.6 minutes, suggesting that ATUS respondents report spending more time on personal care.
If there was no actual change in behavior between 1999 and 2006, the television result could be explained by a change in how television time is reported. For ex-ample, television time that would have been reported as a secondary activity. in the FISCT might be reported as a primary activity in the ATUS Other differences are more difficult to explain, particularly the apparent decline in leisure and sports time. If there was an actual change in behavior between the times the two surveys were con-ducted, then, to the extent that individuals switched from television to Internet usage over the period (as seems likely), measured time spent on leisure and sports (in-cluding Internet usage) should have been greater in the ATUS than the FISCT. Instead, the opposite appears to have occurred.
If changing time-use patterns are part of the difference between the two surveys, then one also would expect to see changes in the ATUS between 2003 and 2006. However, there was virtually no change in the time spent in any ac-tivity during that period.14 Thus, any changes in behavior would have to have occurred between 1999 and 2003. It is far more likely that there are other differences between the two surveys that this study could not account for.15
One difference worth noting is how respondents were contacted. As mentioned earlier, the FISCT contact strat-egy tends to oversample busy days and days when the respondent spends a lot of time away from home. This is consistent with the findings here that FISCT respond-ents report spending more time working, traveling, and engaged in leisure and sports, and less time watching television and sleeping. The difference in time spent do-ing housework is inconsistent with the contact-strategy explanation, but the difference is relatively small. Unfor-tunately, there is no way to quantify this effect.
It is reasonable to suppose that multitasking is related to respondents’ characteristics. For example, people who are employed, work longer hours, have children (especially younger children), or are women may be busier, so one would expect them to report secondary activities more often. However, busy people may be less likely to take the time to report secondary activities.
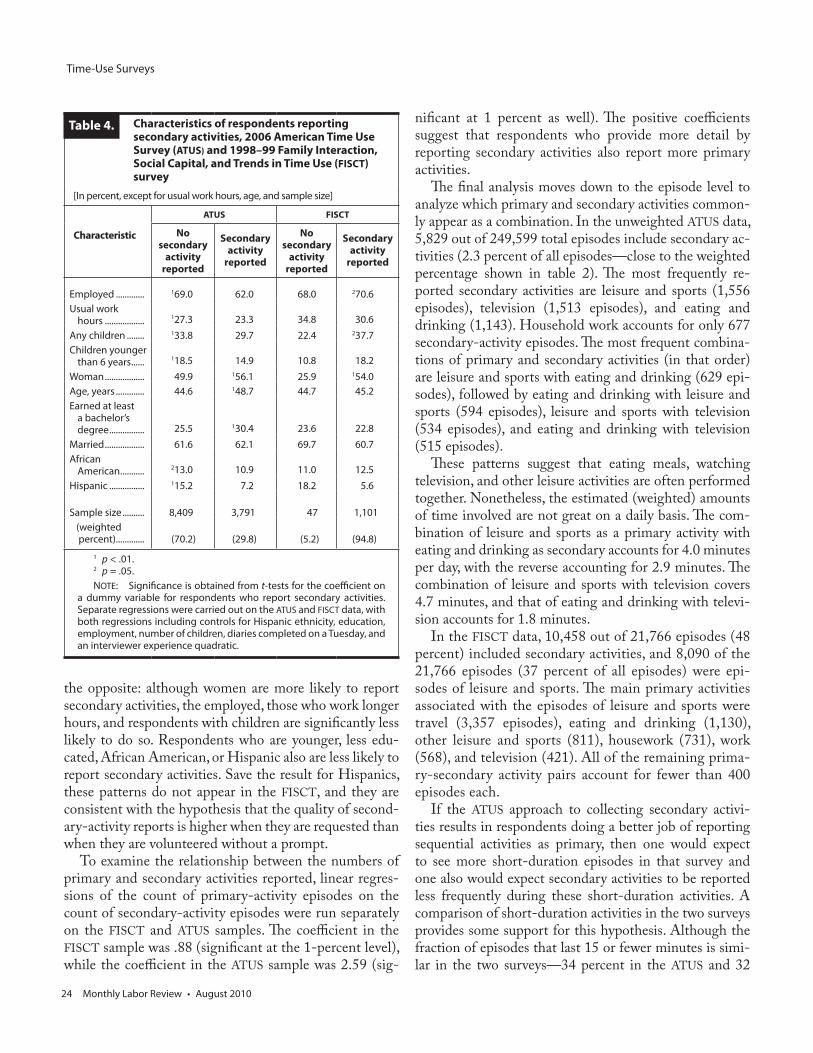
Table 4 compares the characteristics of respondents who did, and respondents who did not, report secondary activities in the two surveys. The expected pattern emerges in the FISCT data: employed respondents, those with chil-dren, and women are significantly more likely to report secondary activities. In the ATUS, however, the results are
Distribution of primary-activity episodes and of total time spent in primary activities, 2006 American Time Use Survey (ATUS) and 1998–99 Family Interaction, Social Capital, and Trends in Time Use (FISCT) survey
Primary activityEpisodes per day Minutes per day
ATUS FISCT ATUS FISCT
Total ...........................Sleep ...................................
20.1412.21
18.431.96
1,4401514.7
1,440484.0
Grooming and not elsewhere classified .... 11.65 2.05 157.1 57.3
Travel ................................... 4.16 4.11 175.1 92.6Work .................................... 11.24 1.11 217.3 226.0Childcare ............................ 2.979 .796 230.2 34.6Adult care .......................... 1.230 .071 7.05 3.27Education .......................... .138 .095 14.4 11.7Leisure and sports .......... 2.36 2.05 1143.9 165.5Organizational
activities ......................... .207 .158 15.0 15.3Purchasing goods and
services ........................... .837 .701 31.7 31.9Television ........................... 11.49 1.18 1156.2 126.8Household work.............. 2.57 2.31 2109.5 117.9Eating and drinking ....... 12.07 1.84 168.0 73.1
1 p < .01.2 p < .05.NOTE: Significance is obtained from t-tests for the coefficient on
an ATUS dummy variable in regressions, including controls for Hispanic ethnicity, education, employment, number of children, diaries com-pleted on a Tuesday, and an interviewer experience quadratic.
Table 3.
Time-Use Surveys
24 Monthly Labor Review • August 2010
the opposite: although women are more likely to report secondary activities, the employed, those who work longer hours, and respondents with children are significantly less likely to do so. Respondents who are younger, less edu-cated, African American, or Hispanic also are less likely to report secondary activities. Save the result for Hispanics, these patterns do not appear in the FISCT, and they are consistent with the hypothesis that the quality of second-ary-activity reports is higher when they are requested than when they are volunteered without a prompt.
To examine the relationship between the numbers of primary and secondary activities reported, linear regres-sions of the count of primary-activity episodes on the count of secondary-activity episodes were run separately on the FISCT and ATUS samples. The coefficient in the FISCT sample was .88 (significant at the 1-percent level), while the coefficient in the ATUS sample was 2.59 (sig-
nificant at 1 percent as well). The positive coefficients suggest that respondents who provide more detail by reporting secondary activities also report more primary activities.
The final analysis moves down to the episode level to analyze which primary and secondary activities common-ly appear as a combination. In the unweighted ATUS data, 5,829 out of 249,599 total episodes include secondary ac-tivities (2.3 percent of all episodes—close to the weighted percentage shown in table 2). The most frequently re-ported secondary activities are leisure and sports (1,556 episodes), television (1,513 episodes), and eating and drinking (1,143). Household work accounts for only 677 secondary-activity episodes. The most frequent combina-tions of primary and secondary activities (in that order) are leisure and sports with eating and drinking (629 epi-sodes), followed by eating and drinking with leisure and sports (594 episodes), leisure and sports with television (534 episodes), and eating and drinking with television (515 episodes).
These patterns suggest that eating meals, watching television, and other leisure activities are often performed together. Nonetheless, the estimated (weighted) amounts of time involved are not great on a daily basis. The com-bination of leisure and sports as a primary activity with eating and drinking as secondary accounts for 4.0 minutes per day, with the reverse accounting for 2.9 minutes. The combination of leisure and sports with television covers 4.7 minutes, and that of eating and drinking with televi-sion accounts for 1.8 minutes.
In the FISCT data, 10,458 out of 21,766 episodes (48 percent) included secondary activities, and 8,090 of the 21,766 episodes (37 percent of all episodes) were epi-sodes of leisure and sports. The main primary activities associated with the episodes of leisure and sports were travel (3,357 episodes), eating and drinking (1,130), other leisure and sports (811), housework (731), work (568), and television (421). All of the remaining prima-ry-secondary activity pairs account for fewer than 400 episodes each.
If the ATUS approach to collecting secondary activi-ties results in respondents doing a better job of reporting sequential activities as primary, then one would expect to see more short-duration episodes in that survey and one also would expect secondary activities to be reported less frequently during these short-duration activities. A comparison of short-duration activities in the two surveys provides some support for this hypothesis. Although the fraction of episodes that last 15 or fewer minutes is simi-lar in the two surveys—34 percent in the ATUS and 32
Characteristics of respondents reporting secondary activities, 2006 American Time Use Survey (ATUS) and 1998–99 Family Interaction, Social Capital, and Trends in Time Use (FISCT) survey
[In percent, except for usual work hours, age, and sample size]
Characteristic
ATUS FISCT
No secondary
activity reported
Secondary activity
reported
No secondary
activity reported
Secondary activity
reported
Employed ............. 169.0 62.0 68.0 270.6Usual work
hours .................. 127.3 23.3 34.8 30.6Any children ........ 133.8 29.7 22.4 237.7Children younger
than 6 years ...... 118.5 14.9 10.8 18.2Woman .................. 49.9 156.1 25.9 154.0Age, years ............. 44.6 148.7 44.7 45.2Earned at least
a bachelor’s degree ................ 25.5 130.4 23.6 22.8
Married .................. 61.6 62.1 69.7 60.7African
American ........... 213.0 10.9 11.0 12.5Hispanic ................ 115.2 7.2 18.2 5.6
Sample size .......... 8,409 3,791 47 1,101 (weighted percent) ............. (70.2) (29.8) (5.2) (94.8)
1 p < .01.2 p = .05. NOTE: Significance is obtained from t-tests for the coefficient on
a dummy variable for respondents who report secondary activities. Separate regressions were carried out on the ATUS and FISCT data, with both regressions including controls for Hispanic ethnicity, education, employment, number of children, diaries completed on a Tuesday, and an interviewer experience quadratic.
Table 4.
Monthly Labor Review • August 2010 25
percent in the FISCT—secondary activities are reported relatively less frequently in the ATUS than in the FISCT. In the ATUS, short-duration episodes are less likely to have a secondary activity than is the full sample (1 percent and 2.3 percent, respectively), whereas secondary activities are equally likely in short- and long-duration episodes in the FISCT (49 percent compared with 48 percent). Moreover, when secondary activities are reported, the types of activi-ties differ across the two subsamples: ATUS respondents report participating in leisure and sports (27 percent), eat-ing and drinking (19 percent), and television (18 percent), whereas FISCT respondents report participating mainly in leisure and sports (86 percent), with listening to the radio and engaging in conversation accounting for 52 percent and 46 percent, respectively, of these episodes.
With regard to household work, the unweighted FISCT data yield 297 episodes of household work reported as a secondary activity. Many of these episodes (134) involved household work as both the primary and the secondary activity. Most other episodes of household work as a sec-ondary activity were associated with the primary activ-ity of watching television (43 episodes) or of leisure and sports (38 episodes). ATUS respondents reported an aver-age of 5 minutes of household work as a secondary activ-ity, whereas FISCT respondents reported 16 minutes. The 16.1 minutes they spent performing household work as a secondary activity was done mainly in conjunction with household work (7.7 minutes), television (2.5 minutes), leisure and sports (2.4 minutes), or childcare (1.8 minutes) as primary activities. FISCT respondents also reported that they participated in a leisure activity during about 25 per-cent of the time they spent performing household work as a primary activity (30.4 minutes out of 117.9 minutes, on a weighted basis).
These results suggest that the ATUS underestimates the time spent on household work because it misses house-hold work done as a secondary activity. The amount of time missed is less than 10 percent of the time spent in household work as a primary activity, but this omission may be important for researchers who are interested in valuing household production. At first blush, these results suggest that the public ATUS data may miss as much as 16 minutes of household work as a secondary activity. But almost half (7.7 minutes) of the secondary household work reported in the FISCT has already been counted as household produc-tion, because the primary activity was also household work. Moreover, it would be reasonable to discount the value of the remaining secondary household worktime—especially when the primary activity was leisure.16 If one follows the usual, though admittedly ad hoc, approach of dividing the
duration of the episode equally among the reported activi-ties, the missed secondary household worktime amounts to 4 minutes per day. Of course, if household work that is done as a secondary activity is discounted in this way, then it would make sense also to discount household work done as a primary activity when the secondary activity is some-thing other than household work.
Another component of household production is second-ary childcare. One study compared the two approaches to collecting data on this component and showed that the ATUS “in your care” questions identify far more childcare time—over 5 hours per day more—than do traditional secondary-activity reports.17 The study identified two pos-sible reasons for the difference. First, the ATUS questions specifically ask about childcare, whereas the standard ap-proach to collecting secondary activities is to ask, “What else were you doing?” Second, the concept of childcare dif-fers between the two approaches. The ATUS question spe-cifically asks about time the respondent spent with children in his or her care (passive childcare), whereas the standard approach is more activity oriented. It is likely that respond-ents do not view passive childcare as an activity per se.
For parents of children under the age of 18 years, sec-ondary childcare time in the FISCT averages three-quar-ters of an hour per day. The ATUS measure, which includes only care of children under 13 years, averages 4.64 hours per day. Even if the ATUS average is recomputed to include 13- to 17-year-olds (as the FISCT measure does, assuming zero minutes of “in your care” time for this group), it is still quite a bit larger than the FISCT estimate of 3.35 hours per day for the same age group of 13- to 17-year-olds. The FISCT estimate of secondary childcare is therefore 2.63 hours per day less than the ATUS estimate for parents or, assuming that one-third of all adults are parents, 53 minutes less per day for an average adult. If the desired concept of secondary childcare includes passive childcare, then the FISCT substantially underestimates the amount of time spent in secondary childcare.
Discussion
The evidence presented here clearly shows that second-ary-activity reports from the ATUS are not comparable to secondary-activity reports from the FISCT or from other time-use surveys that explicitly request data on second-ary activities. Further, by every available indicator, the quality of secondary-activity reports from the ATUS is not as good as that for the FISCT. Episodes of secondary activities in the ATUS are reported an average of less than one-twentieth as often as in the FISCT and account for a
Time-Use Surveys
26 Monthly Labor Review • August 2010
little more than a half-hour per day, compared with over 9 hours in the latter survey. Clearly, respondents provide substantially more information about secondary activities when asked to do so than when the information must be volunteered. Further, respondents who report secondary activities when asked are also those who may lead the busiest lives, while respondents who volunteer such infor-mation seem to be those who are willing to provide more detail. All of these differences provide cause for concern regarding the validity, accuracy, veracity, and general use-fulness of secondary-activity reports from the ATUS. That said, the FISCT data likely overstate the amount of time spent in secondary activities, because FISCT respondents report some short-duration activities as secondary and the FISCT does not collect durations separately for secondary activities.
Less clear is the extent to which the collection of sec-ondary activities affects the reporting of primary activities, although the available evidence points toward better report-ing of primary activities with the ATUS approach, which includes asking respondents to break apart simultaneous-activity reports if possible. Kitterod’s research suggests that, even without an ATUS-type prompt, omitting the collection of secondary-activity reports might improve the quality of primary-activity reports because respondents may then be more likely to correctly report short-duration sequen-tial activities as primary, rather than secondary, activities.18
Consistent with her research, the results presented here show that ATUS respondents report more primary activities than do FISCT respondents, even after controlling for inter-viewer experience and sampling differences. Thus, activities that account for a large fraction of secondary-activity time in the FISCT—such as conversation, television, and eating and drinking—may really be sequential primary activities. Moreover, the analysis presented here indicates that ATUS respondents spend a statistically significant greater amount of time in conversation and television as primary activities than do FISCT respondents (about 20 and 30 minutes more per day, respectively). FISCT respondents report more time eating as a primary activity, but the difference, though also statistically significant, is only 5 minutes per day. The dif-ferences for conversation and television are consistent with respondents shifting secondary activities into primary-activity reports when no secondary-activity option is ex-plicitly provided.
There are two main implications of this study’s find-ings. First, regardless of whether or not data on secondary activities are systematically collected, it is important to ask respondents to break apart activities; such requests make respondents more likely to report short-duration sequen-
tial activities as primary rather than secondary. Second, if secondary activities are requested, it is important to col-lect information on their duration. Results from the ATUS “Eating and Health” module clearly show that there is a potential to grossly overestimate time spent in secondary activities, unless data on the duration of the secondary ac-tivity are collected separately.
Whether or not data on secondary activities should be systematically collected depends on the goals of the sur-vey. If one of the goals is to provide information for the construction of satellite accounts to the National Income and Product Accounts, then one must consider the effect on measured time spent in household production activi-ties.19 Compared with FISCT respondents, ATUS respond-ents report 8 fewer minutes per day of household work as a primary activity. This finding echoes Kitterod’s that re-spondents reported less household work as a primary ac-tivity when they could not report secondary activities. The FISCT uncovers more household production as a secondary activity, but half of this time already was counted because the primary activity also was household production.
The systematic collection of secondary activities should not be viewed as a substitute for the “in your care” child-care questions in the ATUS. Respondents do not appear to view passive childcare as an activity per se and tend not to report that type of care unless specifically asked. For the purpose of generating satellite accounts that in-corporate the value of household production time, the secondary-childcare information that is collected in the ATUS is more relevant than traditional secondary-activity reports because passive childcare represents unpaid work that traditional activity-based measures miss.20
Finally, even if it were possible to collect data on second-ary activities perfectly, it is not clear how to analyze such data. One article notes that, even when they are available, secondary-activity data are seldom analyzed.21 Currently, there is no consensus among time-use researchers on how to incorporate secondary activities into their analyses. In some instances, it might be reasonable to double count the time spent in simultaneous activities. For example, a parent who reads to her child while riding the subway is truly en-gaged in two activities, and neither activity is compromised by the other. But in most cases it makes sense to limit the day to 24 hours.22 To see why, consider a respondent who reports that she was ironing clothes while watching televi-sion. Presumably, this respondent would be less productive than a similar respondent who was not watching television while ironing. Thus, it would make sense to divide the time spent doing the simultaneous activities into time spent watching television and time spent ironing. One rela-
Monthly Labor Review • August 2010 27
tively crude strategy for dealing with secondary activities is to split the duration of an episode evenly between the primary and the secondary activities.23 Therefore, before
considering the collection of secondary-activity data in the ATUS, researchers will have to give serious thought to how the data will be analyzed.
Notes
ACKNOWLEDGMENT: Thanks go to the National Science Founda-tion, American Statistical Association, and Bureau of Labor Statistics for providing a fellowship under which Robert Drago performed much of the empirical analysis required for this article. Thanks also to Vanessa Wight of the University of Maryland for providing a crosswalk between the two datasets that was used to help develop the harmonized coding scheme. Dori Allard, Jill Lacey, and Anne Polivka gave helpful comments.
1 F. J. Fowler, Survey Research Methods, Applied Social Research Methods series, vol. 1 (Newbury Park, CA, Sage Publications, 1993).
2 American Time Use Survey Jefferson Telephone Center Interviewer Manual, Sept. 13, 2007, version.
3 Ragne H. Kitterod, “Does the recording of parallel activities in time use diaries affect the way people report their main activities?” So-cial Indicators Research, November 2001, pp. 145–78.
4 Ibid., p. 174.5 See John P. Robinson, Suzanne M. Bianchi, and Stanley Presser,
Family Interaction, Social Capital, and Trends in Time Use (FISCT), 1998–1999 (College Park, MD, University of Maryland Survey Re-search Center [producer], 1999; and Ann Arbor, MI, Inter-university Consortium for Political and Social Research [distributor], 2001).
6 Relevant weights are designated as TUFINLWGT in the ATUS and DAYWT in the FISCT. The ATUS weight corrects for seasonality; the FISCT weight does not. A check revealed that only 20.0 percent of the weighted FISCT observations were from December, January, and February, whereas 29.2 percent were from September through Novem-ber. However, summer is the season that is most likely to be differ-ent from the others, and 24.7 percent of FISCT observations are from June, July, or August. The 24.7-percent figure is close to the 25-percent figure that a uniform seasonal distribution of survey administration would yield.
7 Katharine G. Abraham, Aaron Maitland, and Suzanne M. Bian-chi, “Nonresponse in the American Time Use Survey,” Public Opinion Quarterly, vol. 70, no. 5 (special issue), 2006, pp. 676–703.
8 One would expect individuals who were selected for the ATUS to be more willing to respond, compared with those selected for the FISCT, because ATUS respondents participated in the CPS. But many of those who were selected to participate in the ATUS refused because of survey fatigue. One study conducted a response analysis survey of ATUS respondents and nonrespondents, and found that about one-third of nonrespondents did not respond to the ATUS because they felt that they had done enough by participating in the CPS. (See Grace E. O’Neill and Jessica R. Sincavage, Response Analysis Survey: A Qualitative Look at Response and Nonresponse in the American Time Use Survey (Bureau of Labor Statistics, 2004). Household members who were not the CPS respondent may actually have a lower propensity to respond to surveys than does the population, on average, because people with a higher propensity to participate in surveys are more likely to be the CPS respondent. Many of these people were in the CPS only because someone else in the household was willing to provide a proxy response.
9 Jay C. Stewart, “Assessing the Bias Associated with Alternative
Contact Strategies in Telephone Time-Use Surveys,” Survey Methodol-ogy, December 2002, pp. 157–68.
10 A weighted 11.1 percent of male FISCT, and 15.6 percent of male ATUS, respondents were surveyed with Tuesday as the reference day. A uniform distribution of days would yield a figure of 14.3 percent for male FISCT participants, which is closer to the ATUS figure.
11 Note that a regression with gender as the dependent variable and the ATUS dummy as an independent variable did not yield a significant coefficient, so gender is not controlled for in what follows.
12 The FISCT measure is less precise than that of the ATUS, because the former fails to account for interviewer turnover. Nonetheless, an alternative approach that substitutes average tenure (about 5 months in the FISCT) for all FISCT interviewers yielded a marginally lower t-statistic when the number of daily diary episodes was regressed against a dummy for the ATUS and the experience variable.
13 The experience quadratic achieves a maximum at 38.6 months, or 3.2 years, of experience in the regression with no other controls, and 31.7 months, or 2.6 years, in the regression with controls, suggesting that experience effects indeed taper off.
14 See “American Time Use Survey—2006 Results,” news release (Bureau of Labor Statistics, June 28, 2007), table 12, “Average hours per day spent in primary activities for the civilian population, 2003–06 quarterly and annual averages,” on the Internet at www.bls.gov/news.release/archives/atus_06032008.pdf (visited Aug. 30, 2010).
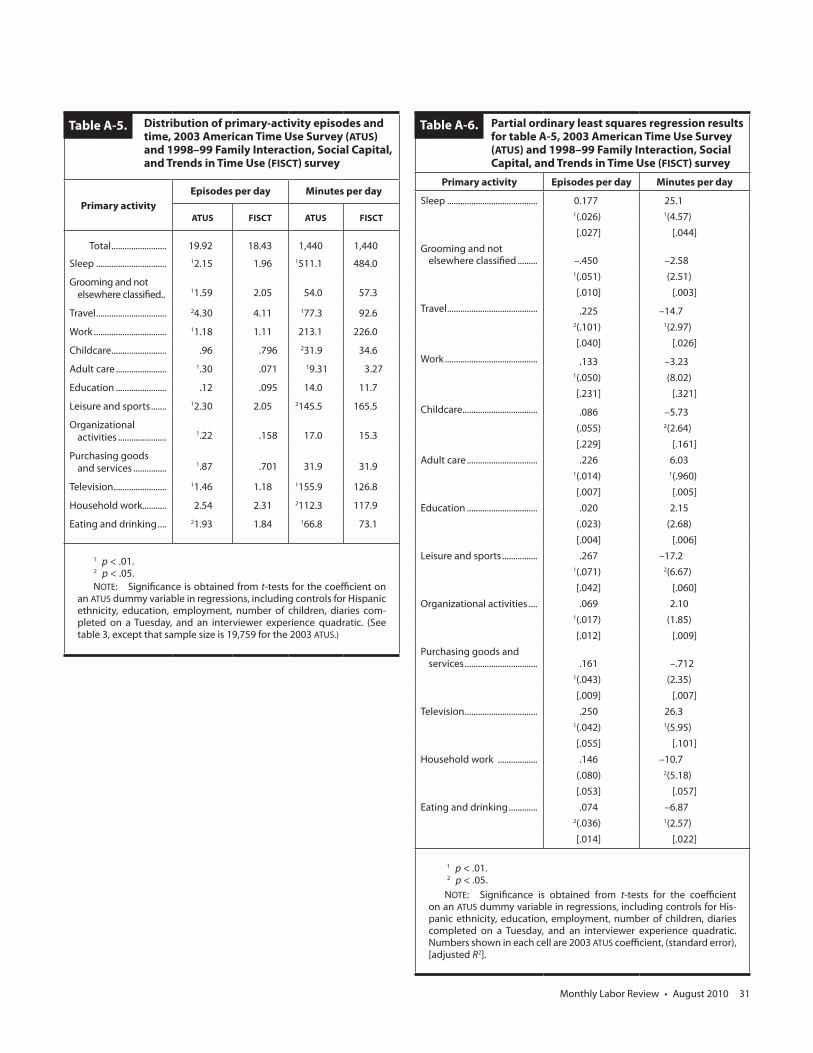
15 As a further comparison, the results shown in table 3 were rep-licated with the FISCT and the 2003 ATUS primary-activity data. The pattern of differences was virtually identical to that appearing in table 3, although far more of the differences were found to be significant, presumably because the 2003 ATUS sample was almost twice as large as the 2006 sample. (See tables A–5 and A-6 in the appendix.)
16 It may also be reasonable to discount the household work done as a primary activity when leisure is the secondary activity, because the individual is not devoting his or her full attention to household work. We do not do so, however: because ATUS respondents likely engaged in secondary activities even though those activities were not reported, it is not possible to do similar discounting in that survey.
17 Mary Dorinda Allard, Suzanne Bianchi, Jay Stewart, and Vanessa R. Wight, “Comparing childcare measures in the ATUS and earlier time-diary studies,” Monthly Labor Review, May 2007, pp. 27–36. The au-thors found no difference between the two approaches in the amount of time spent in childcare as a primary activity.
18 Kitterod, “Does the recording of parallel activities?”19 See, for example, J. Steven Landefeld and Stephanie H. McCulla,
“Accounting for Nonmarket Household Production within a National Accounts Framework,” Review of Income and Wealth, September 2000, pp. 289–307.
20 Nancy Folbre and Jayoung Yoon, “The value of unpaid child care in the U.S. in 2003,” in Jean Kimmel (Ed.), How do we spend our time? Evidence from the American Time Use Survey (Kalamazoo, MI, W. E. Upjohn Institute, 2008), pp. 33–58.
21 Michelle J. Budig and Nancy Folbre, “Activity, Proximity, or Re-sponsibility? Measuring Parental Child Care Time,” in Nancy Folbre and Michael Bittman (Eds.), Family Time: The Social Organization of
Time-Use Surveys
28 Monthly Labor Review • August 2010
Care (New York: Routledge, 2004), pp. 51–68. 22 Suzanne M. Bianchi, John P. Robinson, and Melissa A. Milkie,
Changing Rhythms of American Family Life (New York, Russell Sage Foundation, 2006).
23 Robert Drago, Robert Caplan, David Costanza, Tanya Brubaker, Darnell Cloud, Naomi Harris, Russell Kashian, and T. Lynn Riggs, “New estimates of working time for elementary school teachers,” Monthly Labor Review, April 1999, pp. 31–40.
APPENDIX: Harmonization and subsidiary results
Harmonization of activity codes
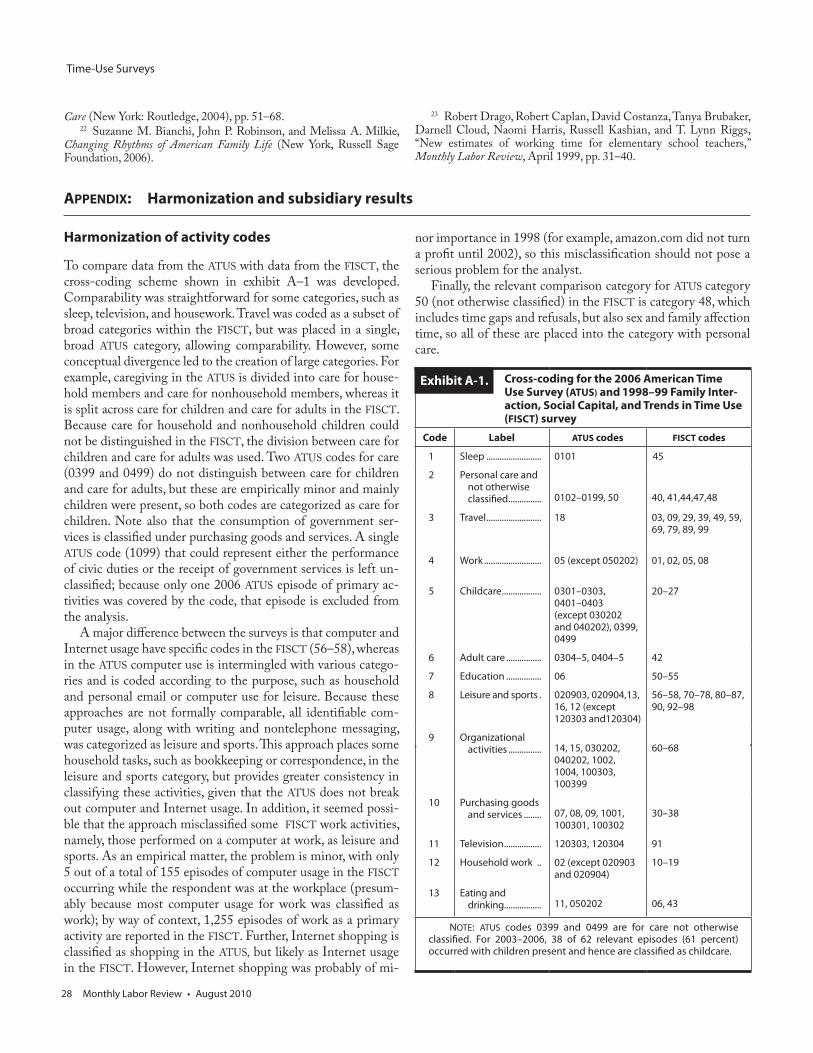
To compare data from the ATUS with data from the FISCT, the cross-coding scheme shown in exhibit A–1 was developed. Comparability was straightforward for some categories, such as sleep, television, and housework. Travel was coded as a subset of broad categories within the FISCT, but was placed in a single, broad ATUS category, allowing comparability. However, some conceptual divergence led to the creation of large categories. For example, caregiving in the ATUS is divided into care for house-hold members and care for nonhousehold members, whereas it is split across care for children and care for adults in the FISCT. Because care for household and nonhousehold children could not be distinguished in the FISCT, the division between care for children and care for adults was used. Two ATUS codes for care (0399 and 0499) do not distinguish between care for children and care for adults, but these are empirically minor and mainly children were present, so both codes are categorized as care for children. Note also that the consumption of government ser-vices is classified under purchasing goods and services. A single ATUS code (1099) that could represent either the performance of civic duties or the receipt of government services is left un-classified; because only one 2006 ATUS episode of primary ac-tivities was covered by the code, that episode is excluded from the analysis.
A major difference between the surveys is that computer and Internet usage have specific codes in the FISCT (56–58), whereas in the ATUS computer use is intermingled with various catego-ries and is coded according to the purpose, such as household and personal email or computer use for leisure. Because these approaches are not formally comparable, all identifiable com-puter usage, along with writing and nontelephone messaging, was categorized as leisure and sports. This approach places some household tasks, such as bookkeeping or correspondence, in the leisure and sports category, but provides greater consistency in classifying these activities, given that the ATUS does not break out computer and Internet usage. In addition, it seemed possi-ble that the approach misclassified some FISCT work activities, namely, those performed on a computer at work, as leisure and sports. As an empirical matter, the problem is minor, with only 5 out of a total of 155 episodes of computer usage in the FISCT occurring while the respondent was at the workplace (presum-ably because most computer usage for work was classified as work); by way of context, 1,255 episodes of work as a primary activity are reported in the FISCT. Further, Internet shopping is classified as shopping in the ATUS, but likely as Internet usage in the FISCT. However, Internet shopping was probably of mi-
nor importance in 1998 (for example, amazon.com did not turn a profit until 2002), so this misclassification should not pose a serious problem for the analyst.
Finally, the relevant comparison category for ATUS category 50 (not otherwise classified) in the FISCT is category 48, which includes time gaps and refusals, but also sex and family affection time, so all of these are placed into the category with personal care.
Cross-coding for the 2006 American Time Use Survey (ATUS) and 1998–99 Family Inter-action, Social Capital, and Trends in Time Use (FISCT) survey
Code Label ATUS codes FISCT codes
1 Sleep ......................... 0101 45
2 Personal care and not otherwise classified ............... 0102–0199, 50 40, 41,44,47,48
3 Travel ......................... 18 03, 09, 29, 39, 49, 59, 69, 79, 89, 99
4 Work .......................... 05 (except 050202) 01, 02, 05, 08
5 Childcare .................. 0301–0303, 0401–0403(except 030202 and 040202), 0399, 0499
20–27
6 Adult care ................ 0304–5, 0404–5 42
7 Education ................ 06 50–55
8 Leisure and sports . 020903, 020904,13, 16, 12 (except 120303 and120304)
56–58, 70–78, 80–87, 90, 92–98
9 Organizational activities ............... 14, 15, 030202,
040202, 1002, 1004, 100303, 100399
60–68
10 Purchasing goods and services ........ 07, 08, 09, 1001,
100301, 10030230–38
11 Television ................. 120303, 120304 91
12 Household work .. 02 (except 020903 and 020904)
10–19
13 Eating and drinking................. 11, 050202 06, 43
NOTE: ATUS codes 0399 and 0499 are for care not otherwise classified. For 2003–2006, 38 of 62 relevant episodes (61 percent) occurred with children present and hence are classified as childcare.
Exhibit A-1.
Monthly Labor Review • August 2010 29
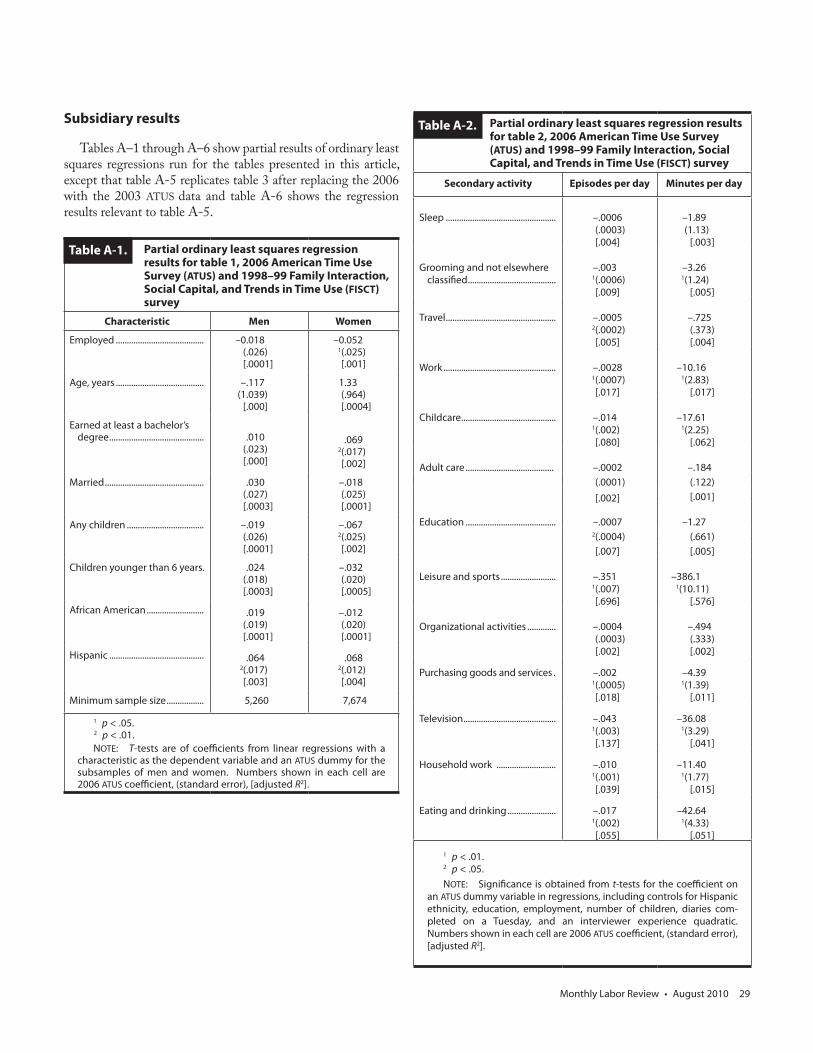
Subsidiary results
Tables A–1 through A–6 show partial results of ordinary least squares regressions run for the tables presented in this article, except that table A-5 replicates table 3 after replacing the 2006 with the 2003 ATUS data and table A-6 shows the regression results relevant to table A-5.
Partial ordinary least squares regression results for table 1, 2006 American Time Use Survey (ATUS) and 1998–99 Family Interaction, Social Capital, and Trends in Time Use (FISCT) survey
Characteristic Men Women
Employed ........................................ –0.018(.026)[.0001]
–0.0521(.025)[.001]
Age, years ........................................ –.117(1.039)
[.000]
1.33(.964)[.0004]
Earned at least a bachelor’s degree ........................................... .010
(.023)[.000]
.0692(.017)[.002]
Married ............................................. .030(.027)[.0003]
–.018(.025)[.0001]
Any children ................................... –.019(.026)[.0001]
–.0672(.025)[.002]
Children younger than 6 years. .024(.018)[.0003]
–.032(.020)[.0005]
African American .......................... .019(.019)[.0001]
–.012(.020)[.0001]
Hispanic ........................................... .0642(.017)[.003]
.0682(.012)[.004]
Minimum sample size ................. 5,260 7,674
1 p < .05. 2 p < .01.
NOTE: T-tests are of coefficients from linear regressions with a characteristic as the dependent variable and an ATUS dummy for the subsamples of men and women. Numbers shown in each cell are 2006 ATUS coefficient, (standard error), [adjusted R2].
Table A-1.
Partial ordinary least squares regression results for table 2, 2006 American Time Use Survey (ATUS) and 1998–99 Family Interaction, Social Capital, and Trends in Time Use (FISCT) survey
Secondary activity Episodes per day Minutes per day
Sleep .................................................. –.0006(.0003)[.004]
–1.89(1.13)
[.003]
Grooming and not elsewhere classified ........................................
–.0031(.0006)[.009]
–3.261(1.24)
[.005]
Travel .................................................. –.00052(.0002)[.005]
–.725(.373)[.004]
Work ................................................... –.00281(.0007)[.017]
–10.161(2.83)
[.017]
Childcare ........................................... –.0141(.002)[.080]
–17.611(2.25)
[.062]
Adult care ........................................ –.0002 –.184(.0001) (.122)[.002] [.001]
Education ......................................... –.0007 –1.272(.0004) (.661)[.007] [.005]
Leisure and sports ......................... –.3511(.007)[.696]
–386.11(10.11)
[.576]
Organizational activities ............. –.0004(.0003)[.002]
–.494(.333)[.002]
Purchasing goods and services . –.0021(.0005)[.018]
–4.391(1.39)
[.011]
Television .......................................... –.0431(.003)[.137]
–36.081(3.29)
[.041]
Household work ........................... –.0101(.001)[.039]
–11.401(1.77)
[.015]
Eating and drinking ...................... –.0171(.002)[.055]
–42.641(4.33)
[.051]
1 p < .01.2 p < .05.NOTE: Significance is obtained from t-tests for the coefficient on
an ATUS dummy variable in regressions, including controls for Hispanic ethnicity, education, employment, number of children, diaries com-pleted on a Tuesday, and an interviewer experience quadratic. Numbers shown in each cell are 2006 ATUS coefficient, (standard error), [adjusted R2].
Table A-2.
Time-Use Surveys
30 Monthly Labor Review • August 2010
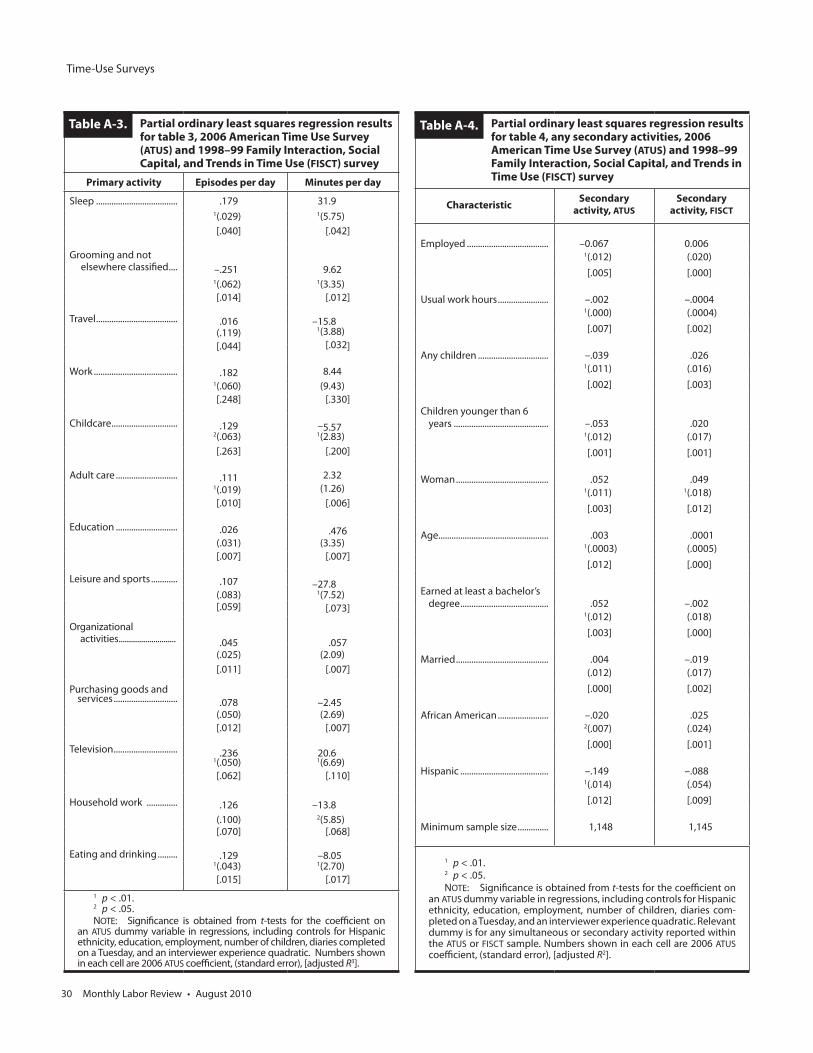
Partial ordinary least squares regression results for table 3, 2006 American Time Use Survey (ATUS) and 1998–99 Family Interaction, Social Capital, and Trends in Time Use (FISCT) survey
Primary activity Episodes per day Minutes per day
Sleep ..................................... .179 31.91(.029) 1(5.75)[.040] [.042]
Grooming and not elsewhere classified .... –.251 9.62
1(.062) 1(3.35)[.014] [.012]
Travel ..................................... .016 –15.8(.119) 1(3.88)[.044] [.032]
Work ...................................... .182 8.441(.060) (9.43)[.248] [.330]
Childcare .............................. .129 –5.572(.063) 1(2.83)[.263] [.200]
Adult care ............................ .111 2.321(.019) (1.26)[.010] [.006]
Education ............................ .026 .476(.031) (3.35)[.007] [.007]
Leisure and sports ............ .107 –27.8(.083) 1(7.52)[.059] [.073]
Organizational activities ............................ .045 .057
(.025) (2.09)[.011] [.007]
Purchasing goods and services ............................. .078 –2.45
(.050) (2.69)[.012] [.007]
Television ............................. .236 20.61(.050) 1(6.69)[.062] [.110]
Household work .............. .126 –13.8(.100) 2(5.85)[.070] [.068]
Eating and drinking ......... .129 –8.051(.043) 1(2.70)[.015] [.017]
1 p < .01.2 p < .05. NOTE: Significance is obtained from t-tests for the coefficient on
an ATUS dummy variable in regressions, including controls for Hispanic ethnicity, education, employment, number of children, diaries completed on a Tuesday, and an interviewer experience quadratic. Numbers shown in each cell are 2006 ATUS coefficient, (standard error), [adjusted R3].
Table A-3. Partial ordinary least squares regression results for table 4, any secondary activities, 2006 American Time Use Survey (ATUS) and 1998–99 Family Interaction, Social Capital, and Trends in Time Use (FISCT) survey
CharacteristicSecondary
activity, ATUSSecondary
activity, FISCT
Employed ..................................... –0.067 0.0061(.012) (.020)[.005] [.000]
Usual work hours ....................... –.002 –.00041(.000) (.0004)[.007] [.002]
Any children ................................ –.039 .0261(.011) (.016)[.002] [.003]
Children younger than 6 years ........................................... –.053 .020
1(.012) (.017)[.001] [.001]
Woman .......................................... .052 .0491(.011) 1(.018)[.003] [.012]
Age.................................................. .003 .00011(.0003) (.0005)[.012] [.000]
Earned at least a bachelor’s degree ........................................ .052 –.002
1(.012) (.018)[.003] [.000]
Married .......................................... .004 –.019(.012) (.017)[.000] [.002]
African American ....................... –.020 .0252(.007) (.024)[.000] [.001]
Hispanic ........................................ –.149 –.0881(.014) (.054)[.012] [.009]
Minimum sample size .............. 1,148 1,145
1 p < .01.2 p < .05.NOTE: Significance is obtained from t-tests for the coefficient on
an ATUS dummy variable in regressions, including controls for Hispanic ethnicity, education, employment, number of children, diaries com-pleted on a Tuesday, and an interviewer experience quadratic. Relevant dummy is for any simultaneous or secondary activity reported within the ATUS or FISCT sample. Numbers shown in each cell are 2006 ATUS coefficient, (standard error), [adjusted R2].
Table A-4.
Monthly Labor Review • August 2010 31
Partial ordinary least squares regression results for table A-5, 2003 American Time Use Survey (ATUS) and 1998–99 Family Interaction, Social Capital, and Trends in Time Use (FISCT) survey
Primary activity Episodes per day Minutes per day
Sleep ......................................... 0.177 25.11(.026) 1(4.57)[.027] [.044]
Grooming and not elsewhere classified ......... –.450 –2.58
1(.051) (2.51)[.010] [.003]
Travel ......................................... .225 –14.72(.101) 1(2.97)[.040] [.026]
Work .......................................... .133 –3.231(.050) (8.02)[.231] [.321]
Childcare .................................. .086 –5.73(.055) 2(2.64)[.229] [.161]
Adult care ................................ .226 6.031(.014) 1(.960)[.007] [.005]
Education ................................ .020 2.15(.023) (2.68)[.004] [.006]
Leisure and sports ................ .267 –17.21(.071) 2(6.67)[.042] [.060]
Organizational activities .... .069 2.101(.017) (1.85)[.012] [.009]
Purchasing goods and services ................................. .161 –.712
1(.043) (2.35)[.009] [.007]
Television ................................. .250 26.31(.042) 1(5.95)[.055] [.101]
Household work .................. .146 –10.7(.080) 2(5.18)[.053] [.057]
Eating and drinking ............. .074 –6.872(.036) 1(2.57)[.014] [.022]
1 p < .01. 2 p < .05.
NOTE: Significance is obtained from t-tests for the coefficient on an ATUS dummy variable in regressions, including controls for His-panic ethnicity, education, employment, number of children, diaries completed on a Tuesday, and an interviewer experience quadratic. Numbers shown in each cell are 2003 ATUS coefficient, (standard error), [adjusted R2].
Table A-6. Distribution of primary-activity episodes and time, 2003 American Time Use Survey (ATUS) and 1998–99 Family Interaction, Social Capital, and Trends in Time Use (FISCT) survey
Primary activityEpisodes per day Minutes per day
ATUS FISCT ATUS FISCT
Total .........................
Sleep ................................
19.9212.15
18.43
1.96
1,4401511.1
1,440
484.0
Grooming and not elsewhere classified.. 11.59 2.05 54.0 57.3
Travel ................................ 24.30 4.11 177.3 92.6
Work ................................. 11.18 1.11 213.1 226.0
Childcare ......................... .96 .796 231.9 34.6
Adult care ....................... 1.30 .071 19.31 3.27
Education ....................... .12 .095 14.0 11.7
Leisure and sports ....... 12.30 2.05 2145.5 165.5
Organizational activities ...................... 1.22 .158 17.0 15.3
Purchasing goods and services ............... 1.87 .701 31.9 31.9
Television ........................ 11.46 1.18 1155.9 126.8
Household work........... 2.54 2.31 2112.3 117.9
Eating and drinking .... 21.93 1.84 166.8 73.1
1 p < .01. 2 p < .05.
NOTE: Significance is obtained from t-tests for the coefficient on an ATUS dummy variable in regressions, including controls for Hispanic ethnicity, education, employment, number of children, diaries com-pleted on a Tuesday, and an interviewer experience quadratic. (See table 3, except that sample size is 19,759 for the 2003 ATUS.)
Table A-5.