Embed Size (px)
Citation preview
Monthly Labor Review • November 2011 37
Gender Distribution Across Industries and Jobs
Job and industry gender segregation: NAICS categories and EEO–1 job groups
An examination of gender segregation by jobs and industryreveals that industries classified in NAICS and job groupslisted in the 2008 EEO–1 National Survey of Private Employersare more gender segregated than the total workforce;the largest contribution to gender segregation is attributableto differences in diversity across NAICS subcategories
Bliss Cartwright,Patrick Ronald Edwards,andQi Wang
Bliss Cartwright is a social science research specialist, Patrick Ronald Edwards is the Director of the Program Research and Surveys Division, and Qi Wang is a survey statistician, all in the Office of Re-search, Information and Planning, U.S. Equal Employment Oppor-tunity Commission, Washington, DC. Email: [email protected]
How are men and women distributed across job groups and industries? This article uses the 2008 EEO–1
National Survey of Private Employers1 to explore the effects of industries and job groups on gender differences. The focus is the question, Which segments of the labor force contribute the most to gender segre-gation in the United States?2 Of particular interest are the industry categories of the North American Industrial Classification System (NAICS), in relation to which the question becomes, Is gender segregation most likely in goods-producing industries or service-providing industries, and in which sectors does it occur?
The examination of gender segregation by jobs and industry is important for sev-eral reasons. First, it provides a benchmark for testing the impact of equal employment efforts, whether by legal enforcement, pri-vate litigation, or corporate human resource practices. Second, it plays a prominent role in the examination of gender wage gaps. Early human capital models of wage distributions focused largely on the char-acteristics of individual employees, such as schooling, work experience, and skill
levels. Later models incorporated differences in the proportion of men and women within and across occupations.3 Current research has expanded human capital models to explore gender distributions in both occupations and industries, including the effects of classifying occupations at different levels of aggregation.4 The presentation that follows can be viewed, in part, as an attempt to focus attention on the measurement implications of aggregating and disaggregating industry classifications.
The article is divided into (1) a brief in-troduction to the EEO–1 Survey of Private Employers, (2) a short description of entropy diversity measures, and (3) the crux of the arti-cle: a presentation of the empirical results from the 2008 survey based on the 2007 revision of NAICS.5
Description of EEO–1 data
The Equal Employment Opportunity Com-mission operates a data collection system that collects data from all private employers in the United States with more than 100 employees and from Federal contractors with 50 or more employees and contracts of $50,000 or more. Title VII of the Civil Rights Act of 1964, as
Gender Distribution Across Industries and Jobs
38 Monthly Labor Review • November 2011
amended, allows the Commission to collect data for, and publish, EEO–1 reports. These annual reports indicate the composition of employers’ workforces by gender and by race and ethnic categories.6 In 2008, more than 68,300 employers submitted individual establishment and head-quarters reports for more than 250,650 reporting units with about 62.2 million employees.7 The reports present data on 10 major job categories: executive or senior-level officials, first- or midlevel officials, professionals, techni-cians, salesworkers, office and clerical workers, craftwork-ers, operatives, laborers, and service workers.8 Race and ethnic designations used in the 2008 EEO–1 report are Hispanic or Latino and, if neither, White, Black or Afri-can American, Asian, Native Hawaiian or Other Pacific Islander, and American Indian or Alaskan Native, plus a category for two or more races. In addition to the work-force data provided by the employer, information about each establishment is added to the database. Such infor-mation includes the establishment’s 2007 NAICS code, county code, and metropolitan area code.9 The remainder of the article examines 19 private sector industries (or sectors) classified by NAICS two-digit code, 85 industries classified by three-digit code, and 279 industries classified by four-digit code.10
Measuring occupational segregation
The discussion that follows utilizes two indexes attributed to the Dutch economist Henri Theil: his entropy index (E) and information theory index (H). E measures gender diversity as the difference from an even 50-percent split between men and women. H is a measure of segregation examining to what extent different units (such as jobs or industries) have either all men or all women. The next two subsections describe, in more detail, how E and H are interpreted. (See the appendix for the mathematical for-mulas for E and H.)
Group diversity. The index E ranges from zero (no di-versity) to 1.0 (complete diversity).11 The minimum value of E indicates that only one group is present and all other groups are absent. The maximum value of E indicates that all groups are evenly distributed. In expressing gender segregation, E reaches a minimum value of 0.0 when there are either no women or no men—that is, when the pro-portion of women is 0.0 or the proportion of women is 1.0.12 E reaches a maximum value of 1.0 when there is an even distribution of the genders (that is, when the propor-tion of women is 0.5 and the proportion of men is 0.5).13 Note that E is a measure of the diversity, rather than the
composition, of the group. A low value of E could result from either a predominance of men or a predominance of women.
Group segregation. The H index is a measure of segre-gation based on the diversity index E. Regarded as “the average difference between total and within-unit diversity divided by the total diversity . . . [and] a measure of the proportion of total diversity attributable to between-unit differences,”14 H ranges from 0.0 when each unit has the same diversity as the overall diversity to 1.0 when each unit has no diversity. For example, if all subindustries in a particular group have a 50–50 split between men and women, then each subindustry has an E value of 1.0 (com-plete diversity), the overall group has an E value of 1.0 (complete diversity), and the average difference in diver-sity between the group and the subindustries is an H value of 0.0. By contrast, if one or more subindustries have only men or only women employees (represented by an E value of 0.0), then the average difference in diversity between the overall group and the subindustries increases and the H value increases.
One of the advantages of the H index is that it can be partitioned into within- and between-unit components.15
The discussion that follows divides H into two compo-nents: an H value between industries and an H value within industries and between job groups. Each of these compo-nents can be expressed as a percentage of the overall H value. This approach quantifies how much particular in-dustries and jobs contribute to overall gender segregation.
2008 EEO–1 results
This section examines the results from the 2008 EEO–1 survey. First, the contributions to overall gender segre-gation are analyzed on the basis of the percentage of H. Then the role of particular NAICS industries is examined in more detail. Finally, the role of specific EEO–1 job groups is considered. At each stage, two questions are asked: Which is more important, within-group differenc-es in diversity or between-group differences in diversity? and Which industries or job groups contribute the most to differences in gender diversity? Of particular interest are the relative contributions of goods-producing and service-providing industries, as well as the relative con-tributions of the craft, operative, and clerical job groups.
Overall results. The following tabulation summarizes the overall gender statistics obtained from the 2008 survey:
Monthly Labor Review • November 2011 39
Category Value Total employees ................................................. 48,837,691Men ........................................................................ 25,644,805Women. .................................................................. 23,192,886Percent women........................................................ 47.49E ............................................................................. .9982H ............................................................................. .2170Percent of H index................................................... 100.0
The total population reporting represents slightly under 50 million employees, almost evenly divided between women and men. Women employees make up 47.49 percent, for an E value of 0.9982. The overall H index is 0.2170, indi-cating that the organizational units—either industries or job groups (or both)—are about one-fifth more gender segregated (less gender diverse) than the total popula-tion reporting. The tabulation represents 100.0 percent of the overall H index. The remaining tables and tabulations describe the contributions of various industries and job groups to the overall H percentage.16
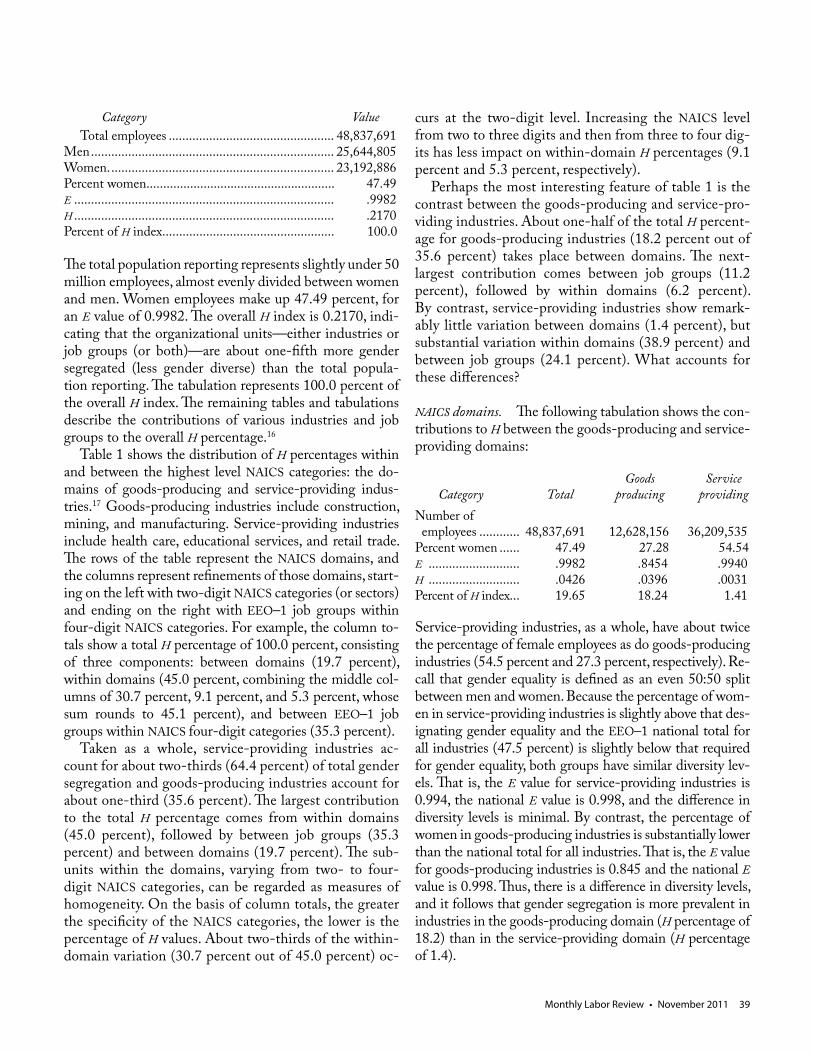
Table 1 shows the distribution of H percentages within and between the highest level NAICS categories: the do-mains of goods-producing and service-providing indus-tries.17 Goods-producing industries include construction, mining, and manufacturing. Service-providing industries include health care, educational services, and retail trade. The rows of the table represent the NAICS domains, and the columns represent refinements of those domains, start-ing on the left with two-digit NAICS categories (or sectors) and ending on the right with EEO–1 job groups within four-digit NAICS categories. For example, the column to-tals show a total H percentage of 100.0 percent, consisting of three components: between domains (19.7 percent), within domains (45.0 percent, combining the middle col-umns of 30.7 percent, 9.1 percent, and 5.3 percent, whose sum rounds to 45.1 percent), and between EEO–1 job groups within NAICS four-digit categories (35.3 percent).
Taken as a whole, service-providing industries ac-count for about two-thirds (64.4 percent) of total gender segregation and goods-producing industries account for about one-third (35.6 percent). The largest contribution to the total H percentage comes from within domains (45.0 percent), followed by between job groups (35.3 percent) and between domains (19.7 percent). The sub-units within the domains, varying from two- to four-digit NAICS categories, can be regarded as measures of homogeneity. On the basis of column totals, the greater the specificity of the NAICS categories, the lower is the percentage of H values. About two-thirds of the within-domain variation (30.7 percent out of 45.0 percent) oc-
curs at the two-digit level. Increasing the NAICS level from two to three digits and then from three to four dig-its has less impact on within-domain H percentages (9.1 percent and 5.3 percent, respectively).
Perhaps the most interesting feature of table 1 is the contrast between the goods-producing and service-pro-viding industries. About one-half of the total H percent-age for goods-producing industries (18.2 percent out of 35.6 percent) takes place between domains. The next-largest contribution comes between job groups (11.2 percent), followed by within domains (6.2 percent). By contrast, service-providing industries show remark-ably little variation between domains (1.4 percent), but substantial variation within domains (38.9 percent) and between job groups (24.1 percent). What accounts for these differences?
NAICS domains. The following tabulation shows the con-tributions to H between the goods-producing and service-providing domains:
Goods Service Category Total producing providing
Number of employees ............ 48,837,691 12,628,156 36,209,535Percent women ...... 47.49 27.28 54.54E ........................... .9982 .8454 .9940H ........................... .0426 .0396 .0031Percent of H index... 19.65 18.24 1.41
Service-providing industries, as a whole, have about twice the percentage of female employees as do goods-producing industries (54.5 percent and 27.3 percent, respectively). Re-call that gender equality is defined as an even 50:50 split between men and women. Because the percentage of wom-en in service-providing industries is slightly above that des-ignating gender equality and the EEO–1 national total for all industries (47.5 percent) is slightly below that required for gender equality, both groups have similar diversity lev-els. That is, the E value for service-providing industries is 0.994, the national E value is 0.998, and the difference in diversity levels is minimal. By contrast, the percentage of women in goods-producing industries is substantially lower than the national total for all industries. That is, the E value for goods-producing industries is 0.845 and the national E value is 0.998. Thus, there is a difference in diversity levels, and it follows that gender segregation is more prevalent in industries in the goods-producing domain (H percentage of 18.2) than in the service-providing domain (H percentage of 1.4).
Gender Distribution Across Industries and Jobs
40 Monthly Labor Review • November 2011
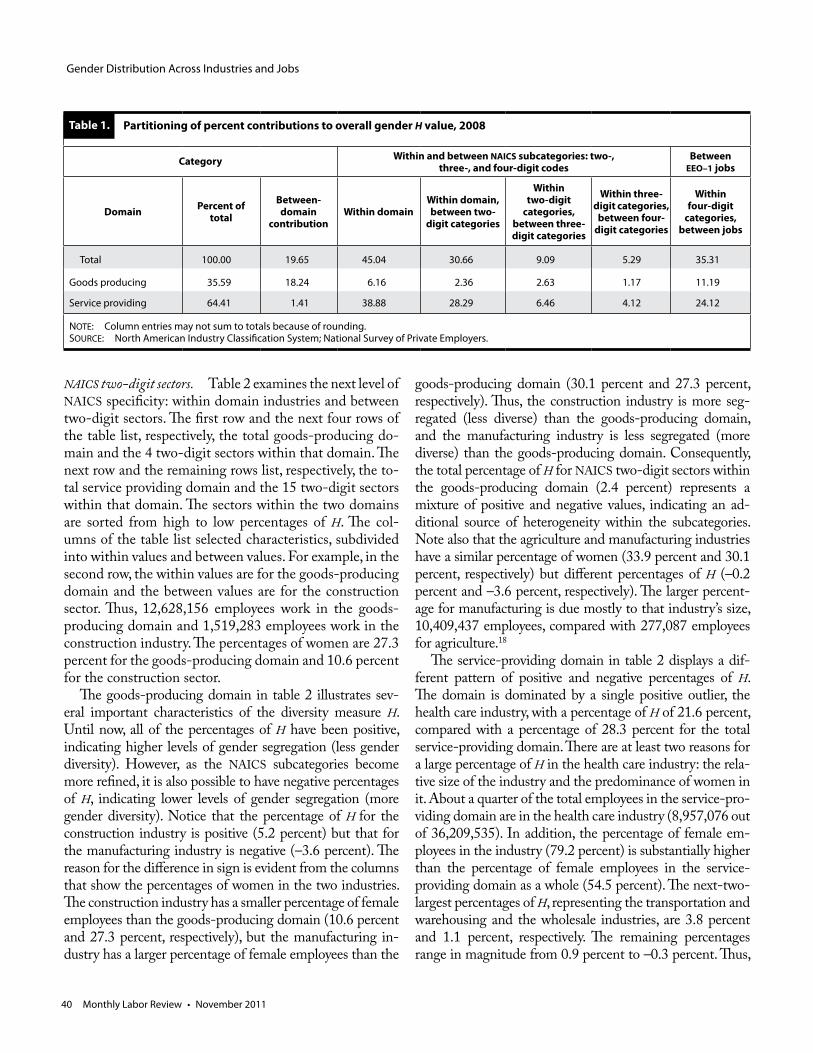
NAICS two-digit sectors. Table 2 examines the next level of NAICS specificity: within domain industries and between two-digit sectors. The first row and the next four rows of the table list, respectively, the total goods-producing do-main and the 4 two-digit sectors within that domain. The next row and the remaining rows list, respectively, the to-tal service providing domain and the 15 two-digit sectors within that domain. The sectors within the two domains are sorted from high to low percentages of H. The col-umns of the table list selected characteristics, subdivided into within values and between values. For example, in the second row, the within values are for the goods-producing domain and the between values are for the construction sector. Thus, 12,628,156 employees work in the goods-producing domain and 1,519,283 employees work in the construction industry. The percentages of women are 27.3 percent for the goods-producing domain and 10.6 percent for the construction sector.
The goods-producing domain in table 2 illustrates sev-eral important characteristics of the diversity measure H. Until now, all of the percentages of H have been positive, indicating higher levels of gender segregation (less gender diversity). However, as the NAICS subcategories become more refined, it is also possible to have negative percentages of H, indicating lower levels of gender segregation (more gender diversity). Notice that the percentage of H for the construction industry is positive (5.2 percent) but that for the manufacturing industry is negative (–3.6 percent). The reason for the difference in sign is evident from the columns that show the percentages of women in the two industries. The construction industry has a smaller percentage of female employees than the goods-producing domain (10.6 percent and 27.3 percent, respectively), but the manufacturing in-dustry has a larger percentage of female employees than the
goods-producing domain (30.1 percent and 27.3 percent, respectively). Thus, the construction industry is more seg-regated (less diverse) than the goods-producing domain, and the manufacturing industry is less segregated (more diverse) than the goods-producing domain. Consequently, the total percentage of H for NAICS two-digit sectors within the goods-producing domain (2.4 percent) represents a mixture of positive and negative values, indicating an ad-ditional source of heterogeneity within the subcategories. Note also that the agriculture and manufacturing industries have a similar percentage of women (33.9 percent and 30.1 percent, respectively) but different percentages of H (–0.2 percent and –3.6 percent, respectively). The larger percent-age for manufacturing is due mostly to that industry’s size, 10,409,437 employees, compared with 277,087 employees for agriculture.18
The service-providing domain in table 2 displays a dif-ferent pattern of positive and negative percentages of H. The domain is dominated by a single positive outlier, the health care industry, with a percentage of H of 21.6 percent, compared with a percentage of 28.3 percent for the total service-providing domain. There are at least two reasons for a large percentage of H in the health care industry: the rela-tive size of the industry and the predominance of women in it. About a quarter of the total employees in the service-pro-viding domain are in the health care industry (8,957,076 out of 36,209,535). In addition, the percentage of female em-ployees in the industry (79.2 percent) is substantially higher than the percentage of female employees in the service-providing domain as a whole (54.5 percent). The next-two-largest percentages of H, representing the transportation and warehousing and the wholesale industries, are 3.8 percent and 1.1 percent, respectively. The remaining percentages range in magnitude from 0.9 percent to –0.3 percent. Thus,
Category Within and between NAICS subcategories: two-, three-, and four-digit codes
Between EEO–1 jobs
Domain Percent of total
Between- domain
contributionWithin domain
Within domain, between two-
digit categories
Within two-digit
categories, between three-digit categories
Within three-digit categories,
between four-digit categories
Within four-digit
categories, between jobs
Total 100.00 19.65 45.04 30.66 9.09 5.29 35.31
Goods producing 35.59 18.24 6.16 2.36 2.63 1.17 11.19
Service providing 64.41 1.41 38.88 28.29 6.46 4.12 24.12
NOTE: Column entries may not sum to totals because of rounding.SOURCE: North American Industry Classification System; National Survey of Private Employers.
Table 1. Partitioning of percent contributions to overall gender H value, 2008
Monthly Labor Review • November 2011 41
H Contributions within NAICS domains and between NAICS two-digit sectors, 2008
Domain
NAICS sector Number of employees Percent women E
Percentage of H
Code Title Within domain
Between sectors
Within domain
Between sectors
Within domain
Betweensectors
Total goods producing . . . . . . . . . 12,628,156 . . . . . . . . . . . . 2.36
Goods producing 23 Construction 12,628,156 1,519,283 27.3 10.6 .845 .486 5.16
Goods producing 21
Mining, quarrying, and oil and gas extraction 12,628,156 422,349 27.3 14.1 .845 .588 1.03
Goods producing 11
Agriculture, forestry, fishing, and hunting 12,628,156 277,087 27.3 33.9 .845 .924 –.21
Goods producing 31–33 Manufacturing 12,628,156 10,409,437 27.3 30.1 .845 .882 –3.62
Total service providing . . . . . . . . . 36,209,535 . . . . . . . . . . . . 28.29
Service providing 62
Health care and social assistance 36,209,535 8,957,076 54.5 79.2 .994 .738 21.64
Service providing 48–49
Transportation and warehousing 36,209,535 2,496,978 54.5 26.3 .994 .832 3.83
Service providing 42 Wholesale trade 36,209,535 1,385,410 54.5 32.8 .994 .913 1.06
Service providing 22 Utilities 36,209,535 508,076 54.5 25.1 .994 .813 .87
Service providing 52 Finance and insurance 36,209,535 3,286,521 54.5 60.3 .994 .969 .78
Service providing 54
Professional, scientific, and technical services 36,209,535 3,051,639 54.5 42.0 .994 .982 .36
Service providing 61 Educational services 36,209,535 364,890 54.5 63.3 .994 .948 .16
Service providing 56
Administrative and support and waste management and remediation services 36,209,535 2,722,718 54.5 44.4 .994 .991 .08
Service providing 51 Information 36,209,535 1,971,877 54.5 44.8 .994 .992 .03
Service providing 53
Real estate and rental and leasing 36,209,535 441,074 54.5 44.8 .994 .992 .01
Service providing 71
Arts, entertainment, and recreation 36,209,535 871,047 54.5 46.8 .994 .997 –.02
Service providing 55
Management of companies and enterprises 36,209,535 454,706 54.5 50.2 .994 1.000 –.03
Service providing 81
Other services (except public administration) 36,209,535 784,741 54.5 52.8 .994 .998 –.03
Service providing 72
Accommodation and food services 36,209,535 3,023,260 54.5 51.3 .994 1.000 –.16
Service providing 44-45 Retail trade 36,209,535 5,889,522 54.5 51.5 .994 .999 –.30
SOURCE: North American Industry Classification System; National Survey of Private Employers.
Table 2.
Gender Distribution Across Industries and Jobs
42 Monthly Labor Review • November 2011
unlike the goods-producing domain, the service-providing domain, with the exception of the health care industry, is relatively homogeneous, with few large positive percentages of H and no large negative percentages.
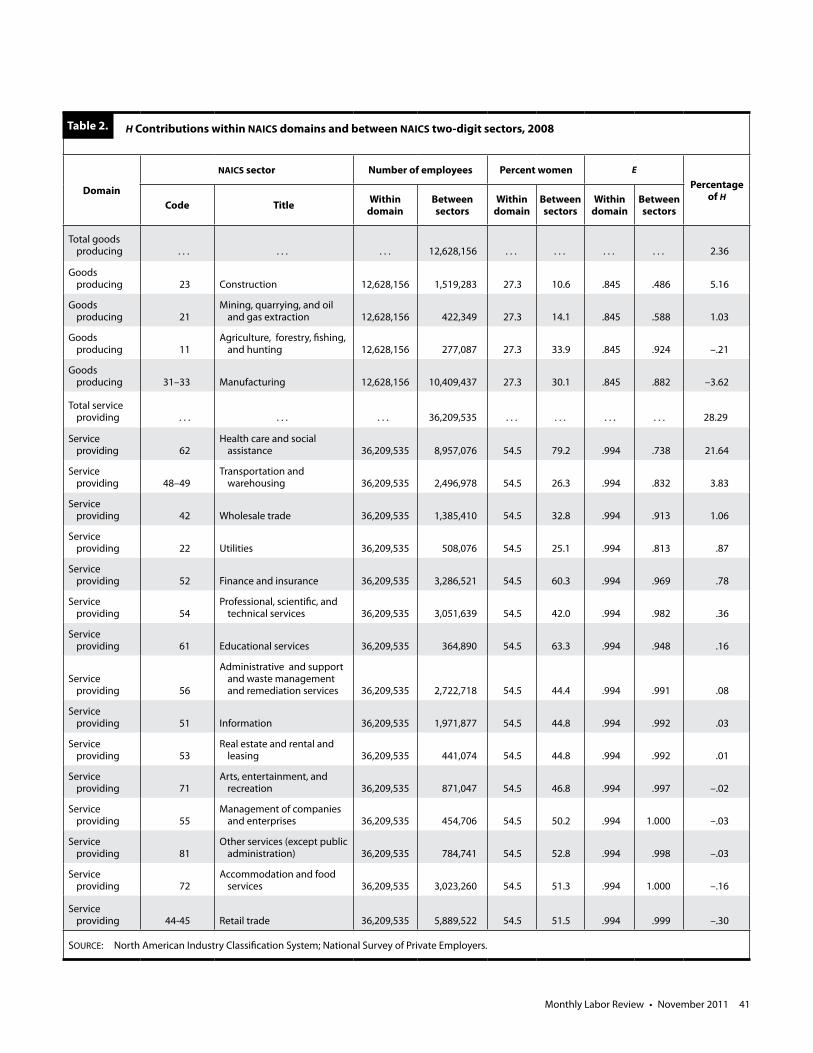
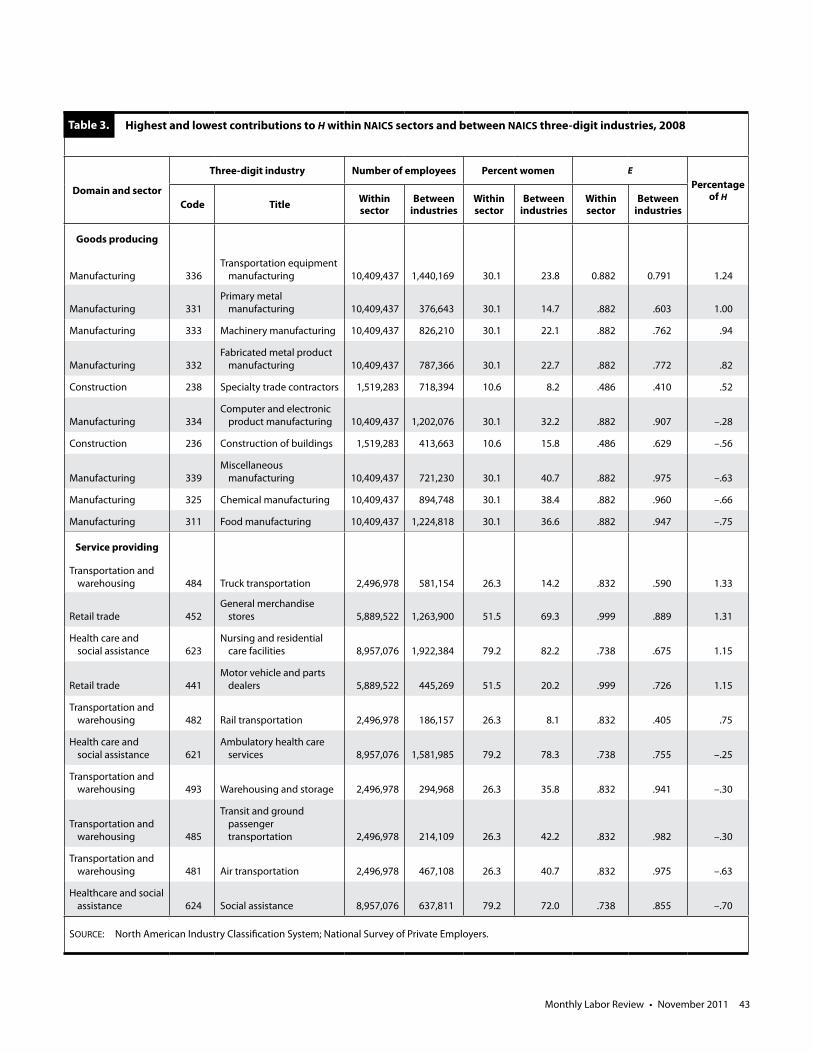
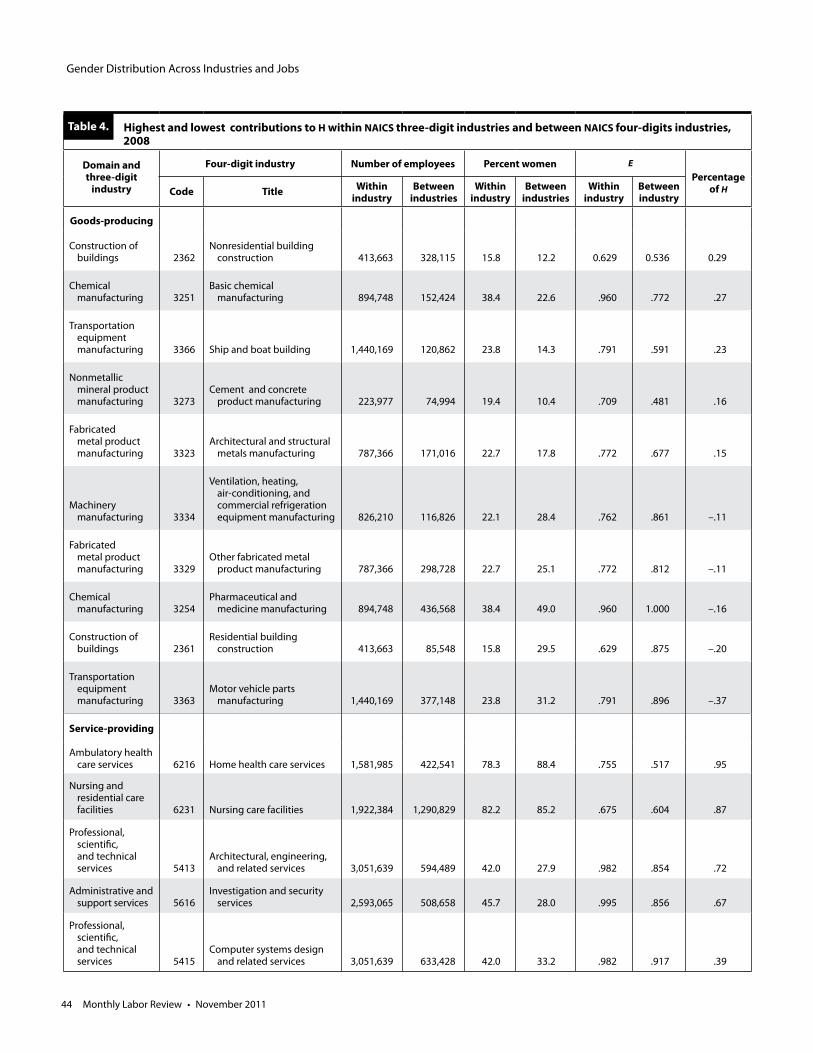
NAICS three- and four-digit categories. Tables 3 and 4 re-peat the column format of table 2, but extend the display to three- and four-digit NAICS industries, respectively. Given the large number of such industries, the rows of the two tables are restricted to the five largest and five smallest percentages of H within the goods-producing and service-providing domains. For example, among the goods-producing industries, the three-digit transporta-tion equipment manufacturing industry has the highest percentage of H (1.2 percent) and the three-digit food manufacturing industry has the lowest (–0.8 percent). Among the service-providing industries, the three-digit truck transportation industry has the highest percentage of H (1.3 percent) and the three-digit social assistance in-dustry has the lowest (–0.7 percent).
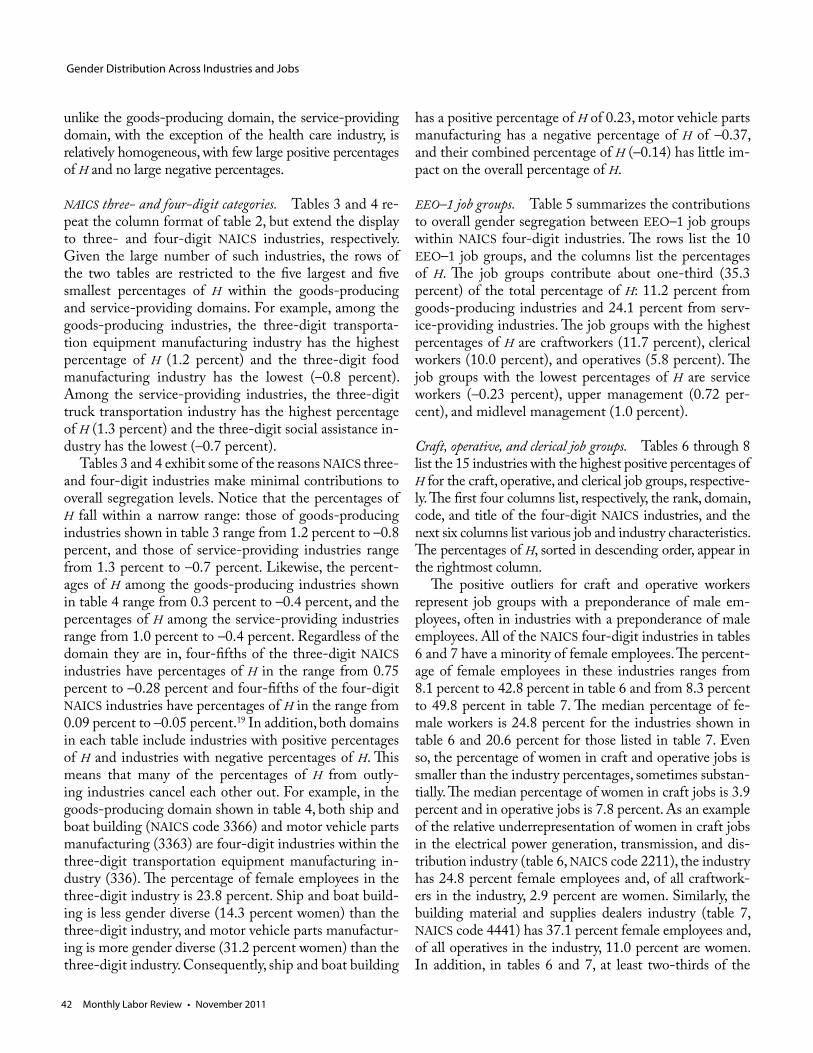
Tables 3 and 4 exhibit some of the reasons NAICS three- and four-digit industries make minimal contributions to overall segregation levels. Notice that the percentages of H fall within a narrow range: those of goods-producing industries shown in table 3 range from 1.2 percent to –0.8 percent, and those of service-providing industries range from 1.3 percent to –0.7 percent. Likewise, the percent-ages of H among the goods-producing industries shown in table 4 range from 0.3 percent to –0.4 percent, and the percentages of H among the service-providing industries range from 1.0 percent to –0.4 percent. Regardless of the domain they are in, four-fifths of the three-digit NAICS industries have percentages of H in the range from 0.75 percent to –0.28 percent and four-fifths of the four-digit NAICS industries have percentages of H in the range from 0.09 percent to –0.05 percent.19 In addition, both domains in each table include industries with positive percentages of H and industries with negative percentages of H. This means that many of the percentages of H from outly-ing industries cancel each other out. For example, in the goods-producing domain shown in table 4, both ship and boat building (NAICS code 3366) and motor vehicle parts manufacturing (3363) are four-digit industries within the three-digit transportation equipment manufacturing in-dustry (336). The percentage of female employees in the three-digit industry is 23.8 percent. Ship and boat build-ing is less gender diverse (14.3 percent women) than the three-digit industry, and motor vehicle parts manufactur-ing is more gender diverse (31.2 percent women) than the three-digit industry. Consequently, ship and boat building
has a positive percentage of H of 0.23, motor vehicle parts manufacturing has a negative percentage of H of –0.37, and their combined percentage of H (–0.14) has little im-pact on the overall percentage of H.
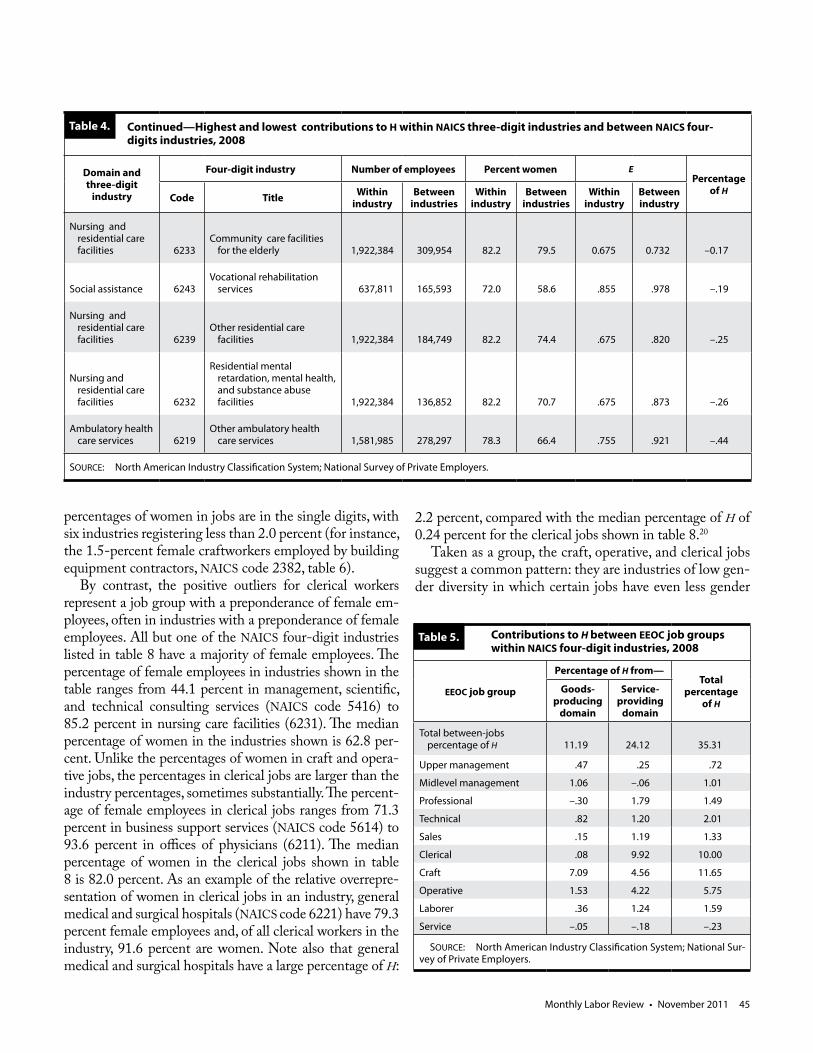
EEO–1 job groups. Table 5 summarizes the contributions to overall gender segregation between EEO–1 job groups within NAICS four-digit industries. The rows list the 10 EEO–1 job groups, and the columns list the percentages of H. The job groups contribute about one-third (35.3 percent) of the total percentage of H: 11.2 percent from goods-producing industries and 24.1 percent from serv-ice-providing industries. The job groups with the highest percentages of H are craftworkers (11.7 percent), clerical workers (10.0 percent), and operatives (5.8 percent). The job groups with the lowest percentages of H are service workers (–0.23 percent), upper management (0.72 per-cent), and midlevel management (1.0 percent).
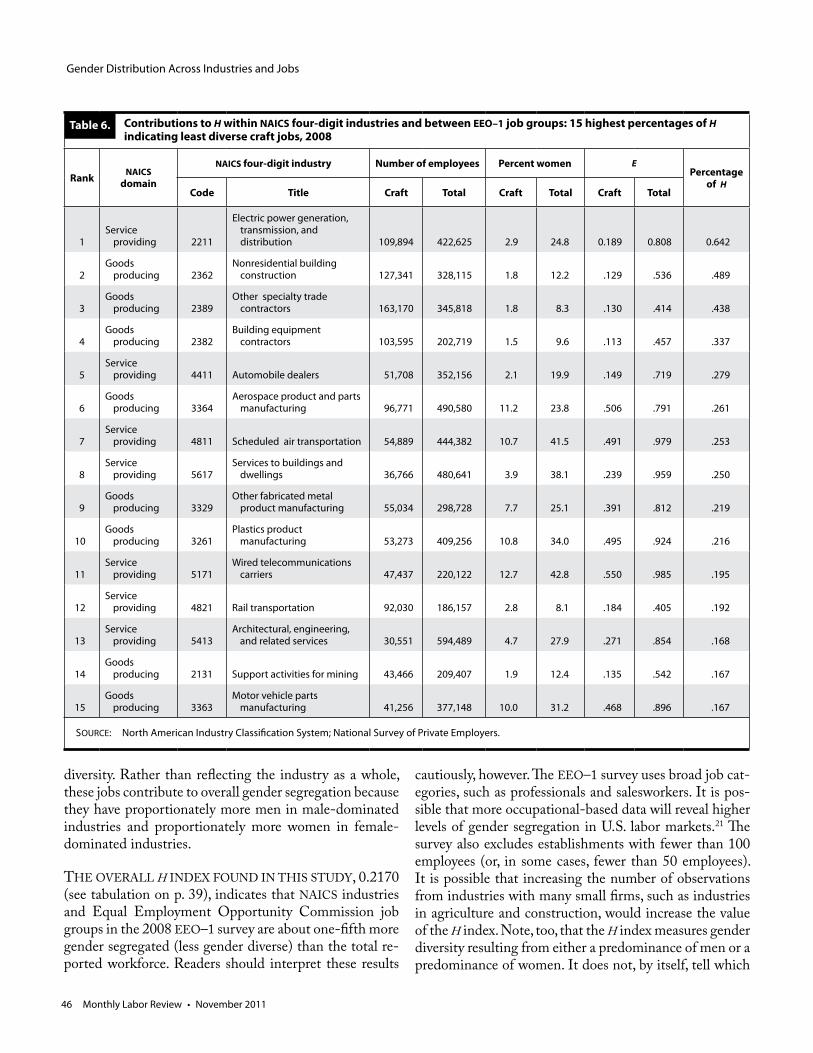
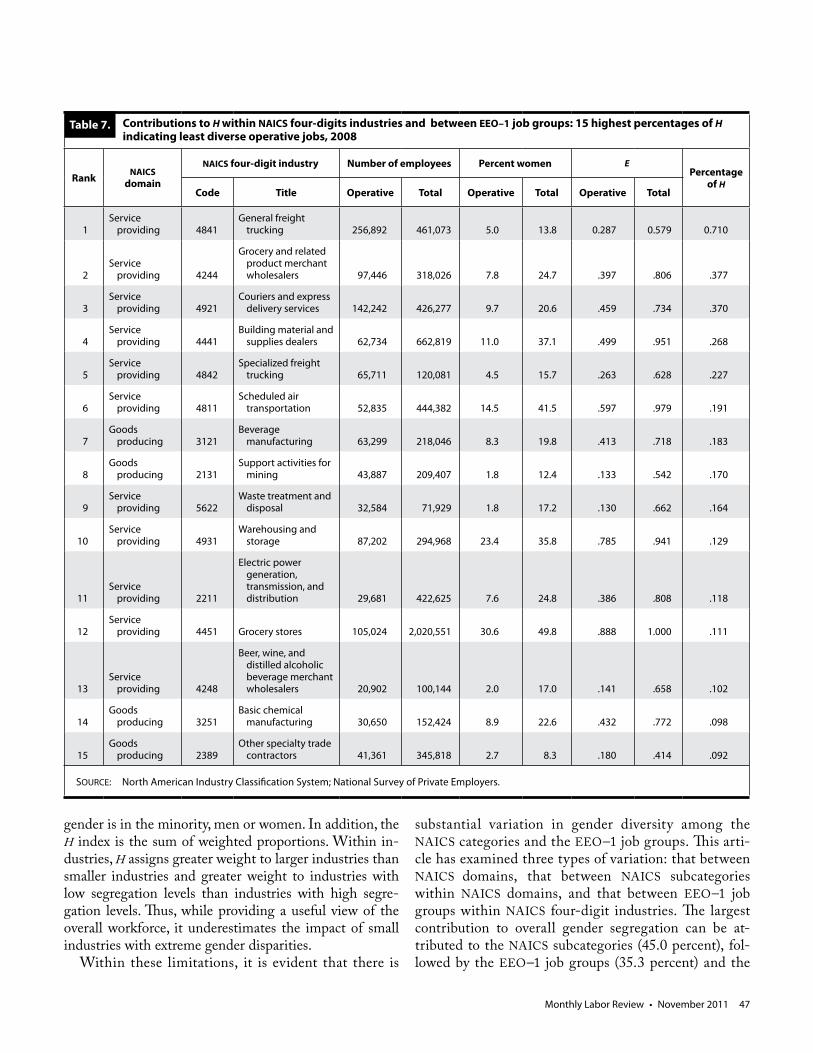
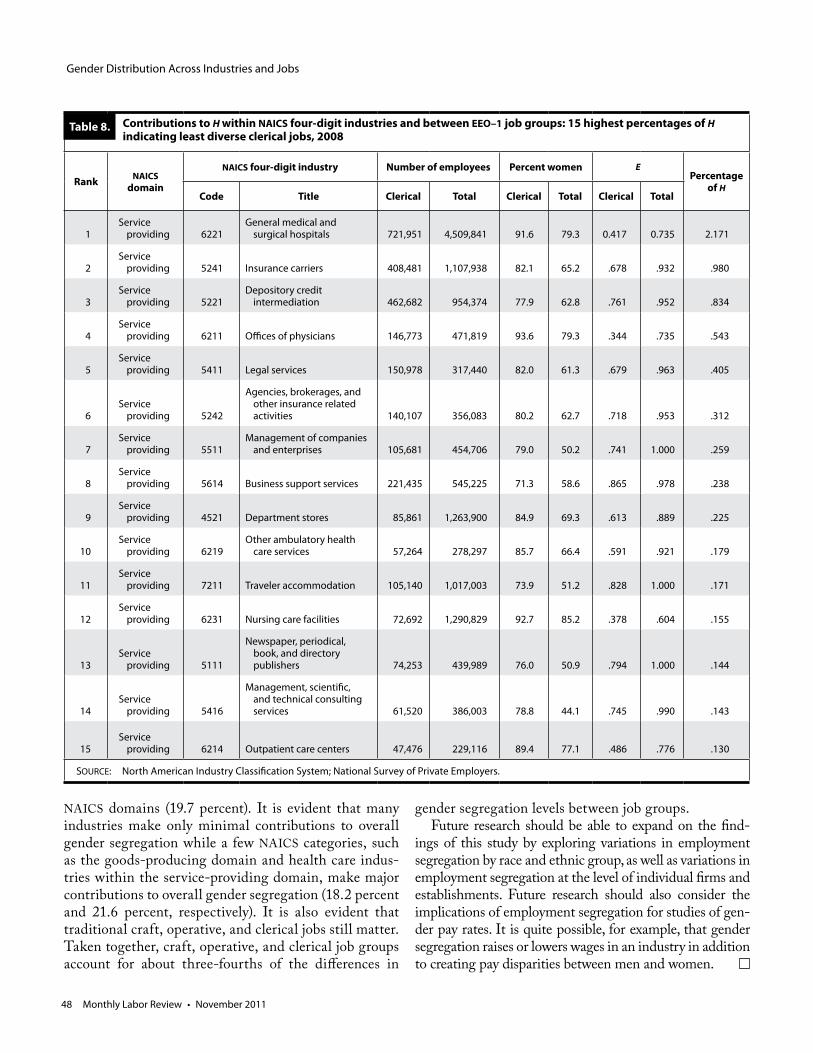
Craft, operative, and clerical job groups. Tables 6 through 8 list the 15 industries with the highest positive percentages of H for the craft, operative, and clerical job groups, respective-ly. The first four columns list, respectively, the rank, domain, code, and title of the four-digit NAICS industries, and the next six columns list various job and industry characteristics. The percentages of H, sorted in descending order, appear in the rightmost column.
The positive outliers for craft and operative workers represent job groups with a preponderance of male em-ployees, often in industries with a preponderance of male employees. All of the NAICS four-digit industries in tables 6 and 7 have a minority of female employees. The percent-age of female employees in these industries ranges from 8.1 percent to 42.8 percent in table 6 and from 8.3 percent to 49.8 percent in table 7. The median percentage of fe-male workers is 24.8 percent for the industries shown in table 6 and 20.6 percent for those listed in table 7. Even so, the percentage of women in craft and operative jobs is smaller than the industry percentages, sometimes substan-tially. The median percentage of women in craft jobs is 3.9 percent and in operative jobs is 7.8 percent. As an example of the relative underrepresentation of women in craft jobs in the electrical power generation, transmission, and dis-tribution industry (table 6, NAICS code 2211), the industry has 24.8 percent female employees and, of all craftwork-ers in the industry, 2.9 percent are women. Similarly, the building material and supplies dealers industry (table 7, NAICS code 4441) has 37.1 percent female employees and, of all operatives in the industry, 11.0 percent are women. In addition, in tables 6 and 7, at least two-thirds of the
Monthly Labor Review • November 2011 43
Highest and lowest contributions to H within NAICS sectors and between NAICS three-digit industries, 2008
Domain and sector
Three-digit industry Number of employees Percent women E
Percentage of H
Code Title Within sector
Between industries
Within sector
Between industries
Within sector
Between industries
Goods producing
Manufacturing 336Transportation equipment
manufacturing 10,409,437 1,440,169 30.1 23.8 0.882 0.791 1.24
Manufacturing 331Primary metal
manufacturing 10,409,437 376,643 30.1 14.7 .882 .603 1.00
Manufacturing 333 Machinery manufacturing 10,409,437 826,210 30.1 22.1 .882 .762 .94
Manufacturing 332Fabricated metal product
manufacturing 10,409,437 787,366 30.1 22.7 .882 .772 .82
Construction 238 Specialty trade contractors 1,519,283 718,394 10.6 8.2 .486 .410 .52
Manufacturing 334Computer and electronic
product manufacturing 10,409,437 1,202,076 30.1 32.2 .882 .907 –.28
Construction 236 Construction of buildings 1,519,283 413,663 10.6 15.8 .486 .629 –.56
Manufacturing 339Miscellaneous
manufacturing 10,409,437 721,230 30.1 40.7 .882 .975 –.63
Manufacturing 325 Chemical manufacturing 10,409,437 894,748 30.1 38.4 .882 .960 –.66
Manufacturing 311 Food manufacturing 10,409,437 1,224,818 30.1 36.6 .882 .947 –.75
Service providing
Transportation and warehousing 484 Truck transportation 2,496,978 581,154 26.3 14.2 .832 .590 1.33
Retail trade 452General merchandise
stores 5,889,522 1,263,900 51.5 69.3 .999 .889 1.31
Health care and social assistance 623
Nursing and residential care facilities 8,957,076 1,922,384 79.2 82.2 .738 .675 1.15
Retail trade 441Motor vehicle and parts
dealers 5,889,522 445,269 51.5 20.2 .999 .726 1.15
Transportation and warehousing 482 Rail transportation 2,496,978 186,157 26.3 8.1 .832 .405 .75
Health care and social assistance 621
Ambulatory health care services 8,957,076 1,581,985 79.2 78.3 .738 .755 –.25
Transportation and warehousing 493 Warehousing and storage 2,496,978 294,968 26.3 35.8 .832 .941 –.30
Transportation and warehousing 485
Transit and ground passenger transportation 2,496,978 214,109 26.3 42.2 .832 .982 –.30
Transportation and warehousing 481 Air transportation 2,496,978 467,108 26.3 40.7 .832 .975 –.63
Healthcare and social assistance 624 Social assistance 8,957,076 637,811 79.2 72.0 .738 .855 –.70
SOURCE: North American Industry Classification System; National Survey of Private Employers.
Table 3.
Gender Distribution Across Industries and Jobs
44 Monthly Labor Review • November 2011
Domain and three-digit
industry
Four-digit industry Number of employees Percent women EPercentage
of HCode Title Within industry
Between industries
Within industry
Between industries
Within industry
Between industry
Goods-producing
Construction of buildings 2362
Nonresidential building construction 413,663 328,115 15.8 12.2 0.629 0.536 0.29
Chemical manufacturing 3251
Basic chemical manufacturing 894,748 152,424 38.4 22.6 .960 .772 .27
Transportation equipment manufacturing 3366 Ship and boat building 1,440,169 120,862 23.8 14.3 .791 .591 .23
Nonmetallic mineral product manufacturing 3273
Cement and concrete product manufacturing 223,977 74,994 19.4 10.4 .709 .481 .16
Fabricated metal product manufacturing 3323
Architectural and structural metals manufacturing 787,366 171,016 22.7 17.8 .772 .677 .15
Machinery manufacturing 3334
Ventilation, heating, air-conditioning, and commercial refrigeration equipment manufacturing 826,210 116,826 22.1 28.4 .762 .861 –.11
Fabricated metal product manufacturing 3329
Other fabricated metal product manufacturing 787,366 298,728 22.7 25.1 .772 .812 –.11
Chemical manufacturing 3254
Pharmaceutical and medicine manufacturing 894,748 436,568 38.4 49.0 .960 1.000 –.16
Construction of buildings 2361
Residential building construction 413,663 85,548 15.8 29.5 .629 .875 –.20
Transportation equipment manufacturing 3363
Motor vehicle parts manufacturing 1,440,169 377,148 23.8 31.2 .791 .896 –.37
Service-providing
Ambulatory health care services 6216 Home health care services 1,581,985 422,541 78.3 88.4 .755 .517 .95
Nursing and residential care facilities 6231 Nursing care facilities 1,922,384 1,290,829 82.2 85.2 .675 .604 .87
Professional, scientific, and technical services 5413
Architectural, engineering, and related services 3,051,639 594,489 42.0 27.9 .982 .854 .72
Administrative and support services 5616
Investigation and security services 2,593,065 508,658 45.7 28.0 .995 .856 .67
Professional, scientific, and technical services 5415
Computer systems design and related services 3,051,639 633,428 42.0 33.2 .982 .917 .39
Table 4. Highest and lowest contributions to H within NAICS three-digit industries and between NAICS four-digits industries, 2008
Monthly Labor Review • November 2011 45
percentages of women in jobs are in the single digits, with six industries registering less than 2.0 percent (for instance, the 1.5-percent female craftworkers employed by building equipment contractors, NAICS code 2382, table 6).
By contrast, the positive outliers for clerical workers represent a job group with a preponderance of female em-ployees, often in industries with a preponderance of female employees. All but one of the NAICS four-digit industries listed in table 8 have a majority of female employees. The percentage of female employees in industries shown in the table ranges from 44.1 percent in management, scientific, and technical consulting services (NAICS code 5416) to 85.2 percent in nursing care facilities (6231). The median percentage of women in the industries shown is 62.8 per-cent. Unlike the percentages of women in craft and opera-tive jobs, the percentages in clerical jobs are larger than the industry percentages, sometimes substantially. The percent-age of female employees in clerical jobs ranges from 71.3 percent in business support services (NAICS code 5614) to 93.6 percent in offices of physicians (6211). The median percentage of women in the clerical jobs shown in table 8 is 82.0 percent. As an example of the relative overrepre-sentation of women in clerical jobs in an industry, general medical and surgical hospitals (NAICS code 6221) have 79.3 percent female employees and, of all clerical workers in the industry, 91.6 percent are women. Note also that general medical and surgical hospitals have a large percentage of H:
2.2 percent, compared with the median percentage of H of 0.24 percent for the clerical jobs shown in table 8.20
Taken as a group, the craft, operative, and clerical jobs suggest a common pattern: they are industries of low gen-der diversity in which certain jobs have even less gender
Domain and three-digit
industry
Four-digit industry Number of employees Percent women EPercentage
of HCode Title Within
industryBetween
industriesWithin
industryBetween
industriesWithin
industryBetween industry
Nursing and residential care facilities 6233
Community care facilities for the elderly 1,922,384 309,954 82.2 79.5 0.675 0.732 –0.17
Social assistance 6243Vocational rehabilitation
services 637,811 165,593 72.0 58.6 .855 .978 –.19
Nursing and residential care facilities 6239
Other residential care facilities 1,922,384 184,749 82.2 74.4 .675 .820 –.25
Nursing and residential care facilities 6232
Residential mental retardation, mental health, and substance abuse facilities 1,922,384 136,852 82.2 70.7 .675 .873 –.26
Ambulatory health care services 6219
Other ambulatory health care services 1,581,985 278,297 78.3 66.4 .755 .921 –.44
SOURCE: North American Industry Classification System; National Survey of Private Employers.
Continued—Highest and lowest contributions to H within NAICS three-digit industries and between NAICS four-digits industries, 2008
Table 4.
Contributions to H between EEOC job groups within NAICS four-digit industries, 2008
EEOC job group
Percentage of H from—Total
percentage of H
Goods-producing
domain
Service- providing
domain
Total between-jobs percentage of H 11.19 24.12 35.31
Upper management .47 .25 .72
Midlevel management 1.06 –.06 1.01
Professional –.30 1.79 1.49
Technical .82 1.20 2.01
Sales .15 1.19 1.33
Clerical .08 9.92 10.00
Craft 7.09 4.56 11.65
Operative 1.53 4.22 5.75
Laborer .36 1.24 1.59
Service –.05 –.18 –.23
SOURCE: North American Industry Classification System; National Sur-vey of Private Employers.
Table 5.
Gender Distribution Across Industries and Jobs
46 Monthly Labor Review • November 2011
diversity. Rather than reflecting the industry as a whole, these jobs contribute to overall gender segregation because they have proportionately more men in male-dominated industries and proportionately more women in female-dominated industries.
THE OVERALL H INDEX FOUND IN THIS STUDY, 0.2170 (see tabulation on p. 39), indicates that NAICS industries and Equal Employment Opportunity Commission job groups in the 2008 EEO–1 survey are about one-fifth more gender segregated (less gender diverse) than the total re-ported workforce. Readers should interpret these results
cautiously, however. The EEO–1 survey uses broad job cat-egories, such as professionals and salesworkers. It is pos-sible that more occupational-based data will reveal higher levels of gender segregation in U.S. labor markets.21 The survey also excludes establishments with fewer than 100 employees (or, in some cases, fewer than 50 employees). It is possible that increasing the number of observations from industries with many small firms, such as industries in agriculture and construction, would increase the value of the H index. Note, too, that the H index measures gender diversity resulting from either a predominance of men or a predominance of women. It does not, by itself, tell which
Contributions to H within NAICS four-digit industries and between EEO–1 job groups: 15 highest percentages of H indicating least diverse craft jobs, 2008
Rank NAICSdomain
NAICS four-digit industry Number of employees Percent women EPercentage
of HCode Title Craft Total Craft Total Craft Total
1Service
providing 2211
Electric power generation, transmission, and distribution 109,894 422,625 2.9 24.8 0.189 0.808 0.642
2Goods
producing 2362Nonresidential building
construction 127,341 328,115 1.8 12.2 .129 .536 .489
3Goods
producing 2389Other specialty trade
contractors 163,170 345,818 1.8 8.3 .130 .414 .438
4Goods
producing 2382Building equipment
contractors 103,595 202,719 1.5 9.6 .113 .457 .337
5Service
providing 4411 Automobile dealers 51,708 352,156 2.1 19.9 .149 .719 .279
6Goods
producing 3364Aerospace product and parts
manufacturing 96,771 490,580 11.2 23.8 .506 .791 .261
7Service
providing 4811 Scheduled air transportation 54,889 444,382 10.7 41.5 .491 .979 .253
8Service
providing 5617Services to buildings and
dwellings 36,766 480,641 3.9 38.1 .239 .959 .250
9Goods
producing 3329Other fabricated metal
product manufacturing 55,034 298,728 7.7 25.1 .391 .812 .219
10Goods
producing 3261Plastics product
manufacturing 53,273 409,256 10.8 34.0 .495 .924 .216
11Service
providing 5171Wired telecommunications
carriers 47,437 220,122 12.7 42.8 .550 .985 .195
12Service
providing 4821 Rail transportation 92,030 186,157 2.8 8.1 .184 .405 .192
13Service
providing 5413Architectural, engineering,
and related services 30,551 594,489 4.7 27.9 .271 .854 .168
14Goods
producing 2131 Support activities for mining 43,466 209,407 1.9 12.4 .135 .542 .167
15Goods
producing 3363Motor vehicle parts
manufacturing 41,256 377,148 10.0 31.2 .468 .896 .167
SOURCE: North American Industry Classification System; National Survey of Private Employers.
Table 6.
Monthly Labor Review • November 2011 47
Contributions to H within NAICS four-digits industries and between EEO–1 job groups: 15 highest percentages of H indicating least diverse operative jobs, 2008
Rank NAICSdomain
NAICS four-digit industry Number of employees Percent women EPercentage
of H Code Title Operative Total Operative Total Operative Total
1Service
providing 4841General freight
trucking 256,892 461,073 5.0 13.8 0.287 0.579 0.710
2Service
providing 4244
Grocery and related product merchant wholesalers 97,446 318,026 7.8 24.7 .397 .806 .377
3Service
providing 4921Couriers and express
delivery services 142,242 426,277 9.7 20.6 .459 .734 .370
4Service
providing 4441Building material and
supplies dealers 62,734 662,819 11.0 37.1 .499 .951 .268
5Service
providing 4842Specialized freight
trucking 65,711 120,081 4.5 15.7 .263 .628 .227
6Service
providing 4811Scheduled air
transportation 52,835 444,382 14.5 41.5 .597 .979 .191
7Goods
producing 3121Beverage
manufacturing 63,299 218,046 8.3 19.8 .413 .718 .183
8Goods
producing 2131Support activities for
mining 43,887 209,407 1.8 12.4 .133 .542 .170
9Service
providing 5622Waste treatment and
disposal 32,584 71,929 1.8 17.2 .130 .662 .164
10Service
providing 4931Warehousing and
storage 87,202 294,968 23.4 35.8 .785 .941 .129
11Service
providing 2211
Electric power generation, transmission, and distribution 29,681 422,625 7.6 24.8 .386 .808 .118
12Service
providing 4451 Grocery stores 105,024 2,020,551 30.6 49.8 .888 1.000 .111
13Service
providing 4248
Beer, wine, and distilled alcoholic beverage merchant wholesalers 20,902 100,144 2.0 17.0 .141 .658 .102
14Goods
producing 3251Basic chemical
manufacturing 30,650 152,424 8.9 22.6 .432 .772 .098
15Goods
producing 2389Other specialty trade
contractors 41,361 345,818 2.7 8.3 .180 .414 .092
SOURCE: North American Industry Classification System; National Survey of Private Employers.
Table 7.
gender is in the minority, men or women. In addition, the H index is the sum of weighted proportions. Within in-dustries, H assigns greater weight to larger industries than smaller industries and greater weight to industries with low segregation levels than industries with high segre-gation levels. Thus, while providing a useful view of the overall workforce, it underestimates the impact of small industries with extreme gender disparities.
Within these limitations, it is evident that there is
substantial variation in gender diversity among the NAICS categories and the EEO–1 job groups. This arti-cle has examined three types of variation: that between NAICS domains, that between NAICS subcategories within NAICS domains, and that between EEO–1 job groups within NAICS four-digit industries. The largest contribution to overall gender segregation can be at-tributed to the NAICS subcategories (45.0 percent), fol-lowed by the EEO–1 job groups (35.3 percent) and the
Gender Distribution Across Industries and Jobs
48 Monthly Labor Review • November 2011
NAICS domains (19.7 percent). It is evident that many industries make only minimal contributions to overall gender segregation while a few NAICS categories, such as the goods-producing domain and health care indus-tries within the service-providing domain, make major contributions to overall gender segregation (18.2 percent and 21.6 percent, respectively). It is also evident that traditional craft, operative, and clerical jobs still matter. Taken together, craft, operative, and clerical job groups account for about three-fourths of the differences in
gender segregation levels between job groups.Future research should be able to expand on the find-
ings of this study by exploring variations in employment segregation by race and ethnic group, as well as variations in employment segregation at the level of individual firms and establishments. Future research should also consider the implications of employment segregation for studies of gen-der pay rates. It is quite possible, for example, that gender segregation raises or lowers wages in an industry in addition to creating pay disparities between men and women.
Contributions to H within NAICS four-digit industries and between EEO–1 job groups: 15 highest percentages of H indicating least diverse clerical jobs, 2008
Rank NAICSdomain
NAICS four-digit industry Number of employees Percent women EPercentage
of HCode Title Clerical Total Clerical Total Clerical Total
1Service
providing 6221General medical and
surgical hospitals 721,951 4,509,841 91.6 79.3 0.417 0.735 2.171
2Service
providing 5241 Insurance carriers 408,481 1,107,938 82.1 65.2 .678 .932 .980
3Service
providing 5221Depository credit
intermediation 462,682 954,374 77.9 62.8 .761 .952 .834
4Service
providing 6211 Offices of physicians 146,773 471,819 93.6 79.3 .344 .735 .543
5Service
providing 5411 Legal services 150,978 317,440 82.0 61.3 .679 .963 .405
6Service
providing 5242
Agencies, brokerages, and other insurance related activities 140,107 356,083 80.2 62.7 .718 .953 .312
7Service
providing 5511Management of companies
and enterprises 105,681 454,706 79.0 50.2 .741 1.000 .259
8Service
providing 5614 Business support services 221,435 545,225 71.3 58.6 .865 .978 .238
9Service
providing 4521 Department stores 85,861 1,263,900 84.9 69.3 .613 .889 .225
10Service
providing 6219Other ambulatory health
care services 57,264 278,297 85.7 66.4 .591 .921 .179
11Service
providing 7211 Traveler accommodation 105,140 1,017,003 73.9 51.2 .828 1.000 .171
12Service
providing 6231 Nursing care facilities 72,692 1,290,829 92.7 85.2 .378 .604 .155
13Service
providing 5111
Newspaper, periodical, book, and directory publishers 74,253 439,989 76.0 50.9 .794 1.000 .144
14Service
providing 5416
Management, scientific, and technical consulting services 61,520 386,003 78.8 44.1 .745 .990 .143
15Service
providing 6214 Outpatient care centers 47,476 229,116 89.4 77.1 .486 .776 .130
SOURCE: North American Industry Classification System; National Survey of Private Employers.
Table 8.
Monthly Labor Review • November 2011 49
Notes
ACKNOWLEDGMENT: The authors are employees of the U.S. Equal Employment Opportunity Commission; however, the views expressed in this article do not necessarily reflect the views of that agency or the U.S. government. The authors thank Lisa Catanzarite, Frank Dobbin, Alexandra Kalev, L. Fraser Jackson, Sean F. Reardon, Barbara Reskin, Donald Tomaskovic-Devey, and Kim A. Weeden for comments on an earlier version of the article presented at the 2009 Annual Meeting of the American Sociological Association.
1 Officially known as Standard Form 100, Employer Information Report EEO–1.
2 The concept of segregation is used here in the tradition of social science studies, which measure degrees of concentration by a particular group. It is not intended to represent situations in which one group is entirely excluded from jobs or employment opportunities.
3 For an extensive review of research prior to 2000, see Astrid Kunze, “The Determination of Wages and the Gender Wage Gap: A Survey,” Discussion Paper No. 193 (Bonn, Germany, Institute for the Study of Labor, August 2000), http://ssrn.com/abstract=251995.
4 See Kimberly Bayard, Judith Hellerstein, David Neumark, and Kenneth Troske, “New Evidence on Sex Segregation and Sex Differ-ences in Wages from Matched Employee-Employer Data,” Journal of Labor Economics, October 2003, pp. 887–922.
5 North American Industry Classification System: United States, 2007 (Executive Office of the President, Office of Management and Budget, 2007).
6 Private employers required to file are (a) those with 100 or more employees and (b) those with 50 or more employees and which (1) have a federal contract or first-tier subcontract worth $50,000 or more, or (2) act as depositories of federal funds in any amount, or (3) act as issuing and paying agents for U.S. Savings Bonds and Notes. Single-establishment employers submit only one EEO–1 report, while those employers whose business was conducted at more than one location submit a companywide consolidated report, a headquarters report, and individual reports for each establishment with 50 or more employees. Employment figures may be reported for any pay period in the third quarter ( July through September). Given these eligibility require-ments, industries composed largely of small establishments, such as the agriculture and construction industries, tend to be underrepresented in the survey.
7 For more details, see “Job Patterns For Minorities And Women In Private Industry (EEO–1)” (U.S. Equal Employment Opportunity Com-mission, no date), http://www.eeoc.gov/eeoc/statistics/employment/jobpat-eeo1/index.cfm.
8 See EEO–1 instruction booklet, “EEO–1 Terms Applicable to All Reporting Formats,” section 5, “Description of Job categories,” http://www.eeoc.gov/employers/eeo1survey/2007instructions.cfm.
9 The Equal Employment Opportunity Commission obtains and maintains EEO–1 reports pursuant to its authority under section 709, Title VII, of the Civil Rights Act of 1964, as amended, 42 U.S.C. 2000e–8. Paragraph (e) of that section prohibits the Commission and its employees from disclosing EEO–1 reports to the public. Violation of the prohibition is punishable by fine and imprisonment. Aggregated data are available to the public.
10 The coding of NAICS domains and sectors is based on “BLS Stand-ard for Sector Aggregation Titles for NAICS” (U.S. Bureau of Labor Sta-
tistics, Oct. 20, 2008), http://www.bls.gov/bls/naics_aggregation.htm. (For background on NAICS classifications, see Teresa L. Morisi, “Recent changes in the national Current Employment Statistics sur-vey,” Monthly Labor Review, June 2003, pp. 3–13, http://www.bls.gov/opub/mlr/2003/06/art1full.pdf; Carole A. Ambler and James E. Kristoff, “Introducing the North American Industry Classification System,” Government Information Quarterly, vol. 15, no. 3, 1998, pp. 263–273; and John Murphy, “Introducing the North American In-dustry Classification System,” Monthly Labor Review, July 1998, pp. 43–47, http://www.bls.gov/opub/mlr/1998/07/rpt1full.pdf.)
Excluded from the discussion that follows is the public administra-tion sector (NAICS codes 921 and above). Also excluded are NAICS four-digit industries occupying the lower 5 percent of one or more of three size measures (industries with fewer than 15 companies, fewer than 27 individual establishments, or fewer than 4,841 total employees). This requirement eliminated such industries as cattle ranching (NAICS 1121), forest nurseries (1132), fishing (1141), water sightseeing transportation (4872), lessors of nonfinancial intangible assets (5331), and RV (recre-ational vehicle) parks (7212). Several other four-digit industries, such as timber tract operations (NAICS 1131) and local messengers (4922) were eliminated because they violated Equal Employment Opportunity Commission disclosure rules. (Specifically, a single employer had 80 per-cent or more of the employees in the industry.)
11 To obtain an upper limit of 1.0, the entropy index E is adjusted, or normalized, to reflect the number M of groups. In the case of gender inequality, there are two groups and the adjustment factor is the natural logarithm of 2, or, mathematically, ln(2). For example, for women,
where W denotes the proportion of women (in an occupation, an in-dustry, a job group, or, in general, any kind of population). Thus, if W = 0.5, then ln(1/.05) = 0.6931 = ln(2), and it follows that E = 0.5, or, in words, the contribution to E for women is 0.5. (See the appendix for a fuller discussion of E.)
12 Note that ln(1/0), which is normally undefined, is defined as 0 in this case. Thus, when the proportion of women is 0.0, the value of E for women is (0) × [ln(1/0)] = 0.0, the value of E for men is (1) × (ln(1/1)) = 0.0, and the total value of E is 0.0.
13 When the proportion of women is 0.5, the value of E for women is (.5) × (ln2(1/.5)) = 0.5, the value of E for men is also (.5) × (ln2(1/.5)) = 0.5, and the total value of E is 1.0.
14 See Sean F. Reardon and Glenn Firebaugh, “Measures of Mul-tigroup Segregation,” Sociological Methodology, vol. 32, no. 1, 2002, pp. 33–67, quote from p. 45.
15 For a proof of the decomposition of H, based on its relationship to the likelihood-ratio chi-squared statistic (G2), see Sean F. Reardon, John T. Yun, and Tamela McNulty Eitle, “The Changing Structure of School Segregation: Measurement and Evidence of Multiracial Met-ropolitan-Area School Segregation, 1989–1995,” Demography, August 2000, pp. 351–364, especially p. 363. For a discussion of within and between measures, see Reardon and Firebaugh, “Measures of Multi-group Segregation,” p. 55; and Reardon, Yun, and Eitle, “The Changing Structure of School Segregation,” p. 355.
16 Hereafter, the phrase “contributions to gender segregation” will be used to describe components of H that vary by job and industry. Recall that the word “segregation” in this context refers to the degree of
ln(1/ )[ ],ln(2)
WE W= ×
Gender Distribution Across Industries and Jobs
50 Monthly Labor Review • November 2011
gender concentration (that is, the opposite of gender diversity), rather than the concept of total exclusion common in legal discussions.
17 For NAICS sectors within these two domains, see table 2.18 Recall that the eligibility requirements for participation in the
EEO–1 survey tend to underestimate the number of employees in in-dustries, such as agriculture, with many small establishments.
19 Not shown in either table 3 or table 4. The H statistics cited rep-resent the values calculated between the 10th and 90th deciles of the overall H distributions; by contrast, tables 3 and 4 list only the indus-
tries with the highest and lowest contributions to H.20 The general medical and surgical hospitals industry is also an
outlier in the professional job group, with an industry percentage of 79.3 percent women, a job group percentage of 83.3 percent women, and a percentage of H of 1.5 percent.
21 See Kim A. Weeden and Jesper B. Sorensen, “A Framework for Analyzing Industrial and Occupational Sex Segregation in the United States,” in Maria Charles and David B. Grusky, Occupational Ghettos: The Worldwide Segregation of Women and Men (Stanford, CA, Stanford University Press, 2004), pp. 245–294.
The E index, known as Theil’s entropy index, is a meas-ure of inequality or diversity expressed by the formula
where M is the number of groups and π is the proportion of persons in a particular group. Theil’s H index,
is a sum of weighted proportions, where U is the number of organizational units (such as industries or job groups), tu is the number of persons in the unit, T is the number of persons in the population, E is the population diversity index, and Eu is the unit diversity index.
With the subscript i denoting industries and j EEO–1 job groups, within and between relationships can be expressed as
Overall H = HB (value of H between industries) + HW (value of H within industries and between jobs),
or, more mathematically,
The HW index, the last term on the right, can also be ex-pressed as
This equation underscores several important character-istics of HW indexes. Because HW is directly related to ti /T, the relative size of an industry contributes to HW. With other relationships held constant, larger industries affect the magnitude of HW more than smaller indus-tries do. Likewise, Ei /E is directly related to HW. Again with other relationships held constant, integrated indus-tries affect the magnitude of HW more than segregated industries do. That is, more diverse industries increase the value of HW, and less diverse industries decrease the value of HW.
APPENDIX: Formulas for segregation indexes
1
1ln( ),M
mmm
E π π=
=∑
1
( )( )( ),U
u u
u
t E EHT E=
−=∑
1 1 1 1 1
( ) ( )( )( )( ) ( )( ) ( )( .I J I I J
ij ij ij i iji i
i j i i j
t E E t E Et E ET E T E T E= = = = =
− −−= +∑ ∑ ∑ ∑∑ ).
1 1
( )HW ( ) .
I Jij i iji i
i j i i
t E Et ETE t E= =
−=∑ ∑