Embed Size (px)
Citation preview

16 Monthly Labor Review • June 2010
Multifactor Productivity
Michael J. Harper,Bhavani Khandrika,Randal Kinoshita,andSteven Rosenthal
The share of U.S. employment devot-ed to services has increased steadily over time. The largest share of non-
manufacturing industries, the service sector has grown at the expense of the manufac-turing sector, which now represents 12 per-cent of business sector employment. The growth of services has led researchers and policymakers to demand more and better data on service and other nonmanufactur-ing industries in order to get a clearer pic-ture of overall economic growth.
Productivity growth, or output per unit of input, is a key component of economic growth. Changes in what is produced are partly explained by changes in the inputs into production; the portion that is not explained by the inputs used is called pro-ductivity, of which there are two measures. Labor productivity, measured as output per hour worked by all employed persons, de-scribes contributions to output made by capital and other measurable and nonmeas-urable inputs. Multifactor productivity, measured as output per unit of labor, capi-tal, and other measurable inputs, describes the intangible influences on labor produc-tivity, such as improvements in efficiency and technology.
Nonmanufacturing industry contributions to multifactor productivity, 1987–2006
To overcome data deficiencies in measuring trends in U.S.nonmanufacturing productivity, the Bureau of Labor Statistics,the Bureau of Economic Analysis, and the Census Bureau haveexpanded and improved the measurement of service sectorand other data; even with these changes, many nonmanufacturingindustries continue to exhibit negative productivity trends
Michael J. Harper is Associate Commissioner, Bhavani Khandrika and Randal Kinoshita are economists, and Steven Rosenthal is a supervisory economist, in the Office of Productivity and Technology, Bureau of Labor Statistics. Email: [email protected], [email protected], [email protected], or [email protected]
Researchers have long been concerned with the “productivity paradox,” a term in-spired by Robert Solow’s assertion that “you can see the computer age everywhere but in the productivity statistics.”1 Since Solow made that statement, productivity statis-tics have improved and the effects of the late 1990s Internet revolution did show up in productivity statistics, particularly in the computer and electronics industry. How-ever, even with improvements in measures, a number of studies, including the one to be presented here, show negative productivity growth rates in nonmanufacturing indus-tries, implying that a productivity paradox still exists. In this article, the term refers to an industry that exhibits negligible or negative productivity growth rates, despite evidence of large investments in research, innovation, computer technology, and the like that are expected to spur productivity growth. The paradox has been present in recent decades for many service and other nonmanufactur-ing industries. Still, this focus on industries in which productivity growth appears negli-gible or negative, despite anecdotal evidence to the contrary, is not reason enough to state that the data for all industries with negative productivity are unreliable. Nor does a posi-

Monthly Labor Review • June 2010 17
tive trend in multifactor productivity growth rates rule out data problems.
Nonetheless, as the nonmanufacturing sector contin-ues to expand its relative importance in the economy, re-searchers have called for better data to tackle measurement problems that have stymied analysis. Historically, Federal data collection focused on the goods-producing industries through the 1990s; data on service-related industries were sparse. The main obstacles to measuring services were the wide range of service commodities and the related concep-tual difficulties in measuring what each industry produced. Because of these problems, either service sector data in national accounts and productivity statistics did not cover the industries or output was measured with data on inputs or input costs, thus reducing the reliability of productivity measures.
In the 1990s, several economists drew attention to the consequences of having poor-quality data for service-providing industries.2 Federal Reserve economists Carol Corrado and Lawrence Slifman presented evidence in support of Alan Greenspan’s statements that productiv-ity trends, stagnating near 1 percent from 1973 to 1995, were being underestimated.3 Zvi Griliches’s 1994 presi-dential address to the American Economic Association questioned the absence of aggregate productivity growth despite sustained expenditures on research and develop-ment and rapid progress in information technology. Grili-ches noted that more than three-quarters of investment in information technology was directed at the “unmeas-urable” sectors, such as construction; trade; finance, insur-ance, and real estate; other services; and consumer and government purchases. He also called for better funding of statistical agencies and better measurement of services.4 Subsequently, the Boskin Commission expressed con-cerns about the mismeasurement of the Consumer Price Index and related effects on productivity measures.5 BLS economists also took it upon themselves to analyze this productivity paradox by using multifactor productivity measures.6
Three measurement problems were identified as af-fecting productivity: the need to improve the coverage of service price indexes in the BLS Producer Price In-dex program, the need to expand detailed service out-put measures in Census Bureau business surveys, and inconsistencies between BLS and Bureau of Economic Analysis (BEA) output measures. Funding was provided for statistical agencies to initiate data improvements in these areas. Since 2001, the BLS has developed many new producer price indexes in services and the Census Bu-reau has expanded the coverage, detail, and frequency of
data collected for services. As a result, the BEA annual in-dustry accounts based on the improved Census data now provide a more reliable source for intermediate inputs, as well as outputs, for services and other nonmanufacturing industries. Improvements made by government statistical agencies in the area of nonmanufacturing industries were based on guidance from the research community, most notably through a series of Brookings Institute seminars organized by Jack Triplett and Barry Bosworth. Proceed-ings of the seminar in 2004 and a subsequent update in 2007 inform BLS improvements.7
All these improvements have expanded coverage and raised the quality of BLS industry data sets. The BLS regu-larly publishes quarterly labor productivity measures for the business and nonfarm business sectors, as well as an-nual multifactor productivity measures for the private business and private nonfarm business sectors; the manu-facturing, durable manufacturing, and nondurable man-ufacturing sectors; and manufacturing industries.8 The first BLS multifactor productivity measures, major-sector measures that built on a 1979 research study,9 were pub-lished in 1983. In 1996, regular publication of multifactor productivity measures for manufacturing industry groups that match National Income and Product Accounts (NIPA) sectors began, based on a line of research followed by William Gullickson and Michael Harper.10 Efforts to expand these results by using the same methodology for difficult-to-measure industries in the nonmanufacturing sector have been limited by data of less-than-desired qual-ity and a paucity of detailed data. Multifactor productiv-ity measures require more detailed data on capital, energy, materials, and services than do data on labor productivity. These detailed data are often unavailable or less accurate than data that are published at a more aggregate level.
The nonmanufacturing industry productivity measures presented in this article are not published regularly, be-cause of continuing concerns about the quality of the data and the persistent trends in negative productivity growth rates, primarily in construction and a variety of service in-dustries. The data set is designed to complement the man-ufacturing multifactor productivity measures that the BLS does publish regularly, in order to provide a more com-plete picture of the private business sector. There are 42 nonmanufacturing industries, including goods-producing industries (for example, farms, mining, and construction) and service-providing industries (such as utilities;11 trans-portation; information; trade; finance, insurance, and real estate; and business and personal services). The industry categories reflect NIPA sectors, which are the basis of the BEA’s measurement of the Nation’s gross domestic prod-

Multifactor Productivity
18 Monthly Labor Review • June 2010
uct (GDP). The data correspond roughly to the two- and three-digit North American Industrial Classification Sys-tem (NAICS) level of detail and cover the years from 1987 through 2006. The industries are identified by their NAICS codes.
The data set used in this article differs from data sets used by Gullickson and Harper in previous BLS studies of the nonmanufacturing sector.12 The data on output and purchased intermediate inputs are based on data pub-lished by the BEA and, where available, the BLS. Previ-ously, real output was based on input-output tables. In addition, as mentioned in the previous paragraph, the data set described here is based on NAICS, whereas the earlier one was based on the Standard Industrial Clas-sification (SIC) system. Furthermore, the study presented here applies a concept of sectoral output to industry-level data; sectoral output equals gross output minus transac-tions between establishments within the sector in ques-tion. Earlier studies used a gross output measure at the industry level.13
The article proceeds by reviewing the model that under-lies multifactor productivity measures. Nonmanufactur-ing industry concepts, sources, and methods are presented in the context of other BLS productivity measures. This discussion provides the basis for describing the trends in detailed data for 42 industries and how these trends differ from those found in previous BLS analyses. The data also are compared with regularly published private business sector productivity measures and examined in light of the productivity speedup exhibited in the late 1990s. Further-more, industry-level multifactor productivity measures are compared against major-sector productivity measures to identify the industries that contribute to productivity growth in a given sector. The analysis includes background information on the mismatch between anecdotal evidence that productivity has increased and findings indicating that productivity trends are negative. Compared with ear-lier BLS research, the results presented show a reduction in the share of industries that exhibit negative productivity trends. This improvement to the data will allow the BLS to update the nonmanufacturing industry productivity data series on a periodic basis and thereby respond to contin-ued demand from data users, even though the data are not of sufficiently high quality to publish in a regular news release format.
The model
The nonmanufacturing industry multifactor productivity measures presented in this article are based on the growth
accounting methods of the earlier BLS studies. The con-cepts, sources, and methods used are similar to those used for the annual published measures of multifactor produc-tivity in the manufacturing sector.14 Multifactor produc-tivity measures describe the relationship between output in real terms and the inputs involved in the production of output. Multifactor productivity indexes are derived by di-viding an output index by an index of the combined inputs of capital, labor, and the intermediate inputs of energy, ma-terials, and purchased business services. These inputs are known collectively by the acronym KLEMS, for the first let-ter of each input (with K substituting for C in “capital”).15
The multifactor productivity measures for nonmanufac-turing industries maintain the same concepts of output and labor input used in the regularly produced BLS meas-ures for NIPA manufacturing industries. These concepts differ from the major-sector measures of private busi-nesses in two important ways. First, the concept of labor input used for industry-level measures is hours at work of employed persons. This concept is narrower than the one used for major-sector measures of private business and nonfarm business; such measures account for labor com-position in addition to hours at work. Second, the con-cept of output used is one of sectoral output rather than value-added output. A sectoral concept of output and in-put categorizes intermediate goods and services used by an industry as inputs when those goods and services are purchased from outside of that industry. A sectoral con-cept also categorizes intermediate goods and services pro-duced by an industry as part of output when those goods or services are purchased by another industry that uses them as inputs. This sectoral concept contrasts with the value-added concept of output used for private business and private nonfarm business multifactor productivity measures; these measures include capital and labor input, but do not include any purchased intermediate goods or services in either input or output.
BLS multifactor productivity measures are formulated with the use of traditional growth accounting equations developed for the total national economy by Solow16 and by Dale Jorgenson and Zvi Griliches.17 The Solow ap-proach was extended to the study of industries by Evsey Domar,18 Ernst Berndt and David Wood,19 and Jorgen-son, Frank Gollop, and Barbara Fraumeni.20 The approach involves the use of superlative index numbers, as described by W. Erwin Diewert.21 Specifically, the BLS uses an an-nually chained Tőrnqvist index to combine most subcat-egories of inputs.
The multifactor productivity growth rate is calculated as a residual, namely, the observed rate of change of an in-

Monthly Labor Review • June 2010 19
dustry’s output that cannot be accounted for by the rate of change of combined inputs. In the process of building up an index of combined inputs, the BLS weights together the rates of change of capital, labor, and intermediate in-puts (energy, materials, and purchased business services), using factor cost shares as weights. The shares for each period are the averages of those for the previous and cur-rent years, recalculated for every period. Intermediate in-puts are chained and combined with the rates of change of capital and labor inputs in order to obtain an index of combined inputs. The rate of change of multifactor pro-ductivity is then measured as
,
++++−=
SSw
MMw
EEw
LLw
KKw
AA
smelk
&&&&&&&
where a dot over a variable denotes a derivative with respect to time and the variables and weights22 used for factors in these equations are as follows:
A = multifactor productivity,Q = sectoral output,K = capital input,L = labor input,E = energy input, M = materials input,S = purchased business services input,
kw = weight for capital,lw = weight for labor,ew = weight for energy,mw = weight for materials, andsw = weight for business services.
This article also draws on recent collaborative work between the BLS and the BEA on a production account framework. The framework proposed by Fraumeni, Harp-er, Susan Powers, and Robert Yuskavage23 was designed to unify concepts underlying the BEA’s NIPA and input-output tables and BLS multifactor productivity measures. The production account framework assumes that estab-lishments have been grouped into industries, traces nomi-nal flows for a detailed array of commodities, uses corre-sponding price indexes to describe the deflation of outputs and inputs, and describes the construction of aggregate productivity trends from the detailed information. The production account framework has improved consistency in data series across agencies when calculating multifactor productivity. Taken together, the nonmanufacturing and manufacturing industry data reported herein constitute an industry-level production account for the private busi-ness sector.
Data sources and methods
Multifactor productivity measures for nonmanufacturing industries combine data from the BEA and the BLS to produce measures of sectoral output divided by input that combines
1. hours at work of persons employed by the industry, 2. capital services employed by nonmanufacturing estab-
lishments, and3. purchases of energy, materials, and business services
from outside each industry.
The multifactor productivity measures in this article are developed and presented for 42 nonmanufacturing indus-tries classified according to the NIPA industry classification and consisting of two- to three-digit NAICS industries. For 35 of the 42 industries, data for output and for energy, materials, and services inputs are based on BEA data on gross output and annual industry accounts, respectively, as described by Eric Strassner, Gabriel Medeiros, and George Smith.24 The data for the 7 other nonmanufactur-ing industries are based on output from the BLS. These industries are oil and gas extraction (NAICS 211); mining, except oil and gas (NAICS 212); utilities (NAICS 22); air transportation (NAICS 481); publishing industries (NAICS 511); accommodation (NAICS 721); and food services and drinking places (NAICS 722).
Data from these sources are adjusted to match the con-cept of sectoral output and to make industry coverage consistent with that of the private business sector. First, using its own data, the BLS adjusts BEA output to remove intraindustry transactions. Second, nonprofit institutions are excluded from output.
Data on hours at work per employed person are con-sistent with all other published major-sector productivity measures. Data on the paid hours of production workers are obtained from the BLS Current Employment Statis-tics (CES) program and converted to hours at work with data from the National Compensation Survey (NCS) and the Hours at Work Survey. Hours at work for nonproduc-tion workers are estimated with data from the Current Population Survey (CPS), the CES, and the NCS. The hours at work of proprietors and unpaid family workers are ob-tained from the CPS. Data are reported on a jobs basis and incorporate hours at work on all jobs. The industry-level measures of hours at work are not adjusted for changes in labor composition (as are the measures of hours used by the BLS for private business and private nonfarm busi-ness multifactor productivity). Instead, changes in labor
Multifactor Productivity
20 Monthly Labor Review • June 2010
composition in the private business and private nonfarm business sectors are measured by shifts in the age and edu-cational attainment of the workforce.
Data on capital services by industry are consistent with all major-sector multifactor productivity measures (that is, measures for private business and nonfarm business sec-tors and NIPA manufacturing industries).25 Capital meas-ures for nonmanufacturing industries are constructed at the same level of detail as the BEA published industry measures of output and capital stock. Capital is defined as equipment (including software), structures, inventories, and land. The BLS uses BEA data on investment by de-tailed asset type for each industry. The BLS capital model for each industry aggregates across vintages (for deprecia-ble asset types) and then across asset types. Aggregation across asset types involves estimating rental prices and constructing annually chained Tőrnqvist indexes,26 using the methodology originally described by Jorgenson and Griliches.27 The BLS uses detailed BEA data on the com-ponents of property income in constructing these rental prices. Within the equipment category, the BLS provides additional details for information processing equipment and software, a category composed of four broad classes of assets: computers and related equipment, software, com-munications equipment, and other information processing equipment and software (medical equipment and related instruments, electromedical instruments, nonmedical in-struments, photocopying and related equipment, and of-fice and accounting machinery).
The input indexes for each of the five industry groups (capital services, hours, energy, materials, and purchased business services) are combined into one input index by means of Tőrnqvist aggregation. Labor share is based on labor compensation, and capital share is derived from capital income;28 both are part of industry value added, the difference between an industry’s gross output and the cost of intermediate inputs. Total costs are constrained to equal the sum of the values of the nonmanufacturing in-dustry groups’ sectoral output.
Because data series lack detail or contain data that are not based on NAICS, estimates are used for a number of variables for years previous to 1997. Many property in-come series lack data from before 1997. For 1987 to 1997, property income data are estimated by applying 1997 SIC-to-NAICS conversion factors to SIC data and adjusting the resulting figures to the estimated NAICS totals for 1997. A similar procedure was applied to the data used to calculate inventories and land before 1997 and hours worked be-fore 2002. Also, intermediate input data were less detailed in years prior to 1997, and separate data series were not
published for energy, materials, and purchased business services, so the aggregate data series are linked to data for more recent years.
The NIPA-level nonmanufacturing multifactor produc-tivity data presented here complement the NIPA-level manufacturing multifactor productivity data that the BLS regularly publishes. This article presents the regularly published BLS data for manufacturing industries, thereby completing the picture of the relationship between private business sector productivity and the manufacturing and nonmanufacturing industries that make up the sector.29
Basic results
Data results point to a number of negative growth rates, some of which reflect earlier findings, and a few highly positive growth rates. The growth rates presented here also reflect the well-known story of the bump-up in pro-ductivity that occurred in the late 1990s and continued through the first decade of the 2000s. Private business sec-tor multifactor productivity rose 0.5 percent per year from 1990 to 1995, 1.3 percent per year from 1995 to 2000, and 1.5 percent per year from 2000 to 2006. Productivity growth during the second half of the 1990s outpaced that of previous periods because of advances in technology.
Annual multifactor productivity growth rates for the NIPA-level nonmanufacturing industry groupings (111 to 811, based on NAICS industry codes) for 1987 through 2006 are shown in table 1 and illustrated graphically in chart 1. Over the period examined, the average annual compound multifactor productivity growth rates for 42 nonmanufacturing industries were positive or zero for 25 of the 42 industries and negative for 17 industries. Of the 17 industries reporting negative productivity over the 20-year period, 2 recorded declines of more than 1.0 percent per year: rental and leasing services (NAICS 532 and 533), reporting the lowest growth rate, –2.3 percent, and legal services (NAICS 5411), with a growth rate of –1.7 percent. Among other industries with long-term negative produc-tivity growth rates were construction (NAICS 23), hospi-tals and nursing and residential care facilities (NAICS 622 and 623), and transit and ground passenger transportation (NAICS 485).
The persistently negative multifactor productivity trends presented here echo findings of earlier BLS stud-ies. Gullickson and Harper’s first study reported 14 of 32 nonmanufacturing industries with negative multifac-tor productivity growth rates from 1977 to 1992; their subsequent analysis of 1977–97 data identified negative growth in 13 industries.30 These earlier studies used the

Monthly Labor Review • June 2010 21
Table 1. Multifactor productivity growth for 42 nonmanufacturing industries, compound annual rates of change,1987–2006 [In percent]
1997 NAICS code Industry All years,
1987–2006The 1990s Before and after 2000
1990–95 1995–2000 1987–2000 2000–06
111, 112 Farms............................................................................................................................ 1.5 –0.2 3.5 1.5 1.4113–115 Forestry, fishing, and related activities............................................................ –.7 –3.2 1.0 –1.8 1.8
211 Oil and gas extraction........................................................................................... –.6 2.1 –1.9 .1 –2.0212 Mining, except oil and gas................................................................................... 1.7 2.5 3.4 2.8 –.6213 Support activities for mining.............................................................................. –.4 .8 –1.6 .1 –1.622 Utilities........................................................................................................................ .7 1.5 .7 1.2 –.223 Construction............................................................................................................. –.9 –.3 –1.3 –.6 –1.7
42 Wholesale trade....................................................................................................... 1.6 1.8 2.7 1.8 1.244, 45 Retail trade................................................................................................................. 2.2 1.5 2.9 2.1 2.4481 Air transportation................................................................................................... 2.0 3.0 2.4 1.4 3.2482 Rail transportation.................................................................................................. 2.6 4.4 .6 2.1 3.6483 Water transportation............................................................................................. .6 2.0 .2 1.5 –1.3484 Truck transportation.............................................................................................. 1.0 2.0 –.7 1.3 .4485 Transit and ground passenger transportation............................................. –.8 –1.0 –.4 –.7 –1.0486 Pipeline transportation......................................................................................... 1.0 –.3 1.1 .8 1.3487, 488, 492 Other transportation and support activities................................................. .8 –1.3 1.7 –.2 3.1493 Warehousing and storage.................................................................................... 2.7 4.0 2.5 3.4 1.4
511 Publishing industries (includes software)...................................................... 1.9 1.4 3.4 2.0 1.6512 Motion picture and sound recording industries.......................................... –.4 –2.1 –1.0 –1.7 2.4513 Broadcasting and telecommunications.......................................................... 1.9 1.7 –.7 1.0 3.8514 Information and data processing services..................................................... .7 –.9 –2.7 –1.4 5.1521, 522 Federal Reserve banks, credit intermediation, and related activities... –.3 –2.9 –2.7 –2.1 3.7523 Securities, commodity contracts, and investments.................................... 7.2 7.5 12.8 7.7 6.3524 Insurance carriers and related activities......................................................... –.6 .1 –.1 .4 –2.5525 Funds, trusts, and other financial vehicles..................................................... –.7 –.2 –1.9 –1.0 .0531 Real estate.................................................................................................................. .3 .7 .3 .0 1.1532, 533 Rental and leasing services and lessors of intangible assets.................. –2.3 –1.2 –3.6 –1.5 –4.15411 Legal services........................................................................................................... –1.7 –2.8 –1.5 –1.2 –2.75415 Computer systems design and related services.......................................... 2.9 3.6 5.1 4.0 .75412–5414, 5416–5419 Miscellaneous professional, scientific, and technical services................ .4 –.8 .9 .3
.6
55 Management of companies and enterprises................................................ –.2 –.7 –.4 .0 –.6561 Administrative and support services............................................................... .0 –.9 –1.2 –.6 1.4562 Waste management and remediation services........................................... .5 –.7 1.2 .5 .4
61 Educational services............................................................................................... –.1 .1 .3 .0 –.2621 Ambulatory health care services....................................................................... –.7 –3.0 –.3 –1.2 .6622, 623 Hospitals and nursing and residential care facilities.................................. –.9 –1.0 –1.9 –1.2 –.1624 Social assistance...................................................................................................... 1.2 .4 2.2 .9 1.9
711, 712 Performing arts, spectator sports, museums, and related activities.... 1.0 1.5 .4 1.3 .4713 Amusements, gambling, and recreation industries................................... .0 –1.5 –.3 –.1 .2721 Accommodation...................................................................................................... .4 2.7 1.3 1.2 –1.3722 Food services and drinking places.................................................................... –.1 –.9 .1 –.3 .3
81 Other services, except government................................................................. –.5 –.2 –1.3 –.8 .0
SIC industry classification, which provides more detail for industries involving trade (SIC 50–59) and for finance, in-surance, and real estate (SIC 60–67). SIC and NAICS indus-tries are not directly comparable, and data concepts and methods differ between the earlier Gullickson-Harper estimates and the estimates presented here. Nonetheless, the broad categories of industries with negative multifac-tor productivity growth rates between the earlier studies, on the one hand, and this study, on the other, are similar.
Negative growth rates in all studies can be found in con-struction, transit, insurance, and some service industries.
Among the 42 NIPA industries, 6 exhibited average an-nual multifactor productivity growth rates of 2.0 percent per year or higher. Securities, commodity contracts, and investments (NAICS 523) had by far the highest growth rate: 7.2 percent. In hindsight, this percentage could be reflective of an overheated financial market. Computer systems design (NAICS 5415) and warehousing and stor-

Multifactor Productivity
22 Monthly Labor Review • June 2010
Chart 1. Trends in multifactor productivity for farm and nonmanufacturing industries, compound annual rates of change, 1987–2006
Industry
Percent
FarmsForestry, fishing, and related activities
Oil and gas extractionMining, except oil and gas
Support activities for miningUtilities
ConstructionWholesale trade
Retail tradeAir transportationRail transportation
Water transportationTruck transportation
Transit and ground passenger transportationPipeline transportation
Other transportation and support activitiesWarehousing and storage
Publishing industries (includes software)Motion picture and sound recording industries
Broadcasting and telecommunicationsInformation and data processing services
Federal Reserve banks, credit intermediation, and related activitiesSecurities, commodity contracts, and investments
Insurance carriers and related activitiesFunds, trusts, and other financial vehicles
Real estateRental and leasing services and lessors of intangible assets
Legal servicesComputer systems design and related services
Miscellaneous professional, scientific, and technical servicesManagement of companies and enterprises
Administrative and support servicesWaste management and remediation services
Educational servicesAmbulatory health care services
Hospitals and nursing and residential care facilitiesSocial assistance
Performing arts, spectator sports, museums, and related activitiesAmusements, gambling, and recreation industries
AccommodationFood services and drinking places
Other services, except government
–3 –2 –1 0 1 2 3 4 5 6 7 8

Monthly Labor Review • June 2010 23
age (NAICS 493) also showed strong growth: 2.9 percent and 2.7 percent per year, respectively.
Over time, fewer industries exhibited negative multifac-tor productivity growth rates. This finding is consistent with the acceleration of productivity growth in the pri-vate business sector since 1995. From 1990 to 1995, of 42 industries, 21 exhibited negative multifactor productivity trends. The number fell to 19 industries for the 1995–2000 period and to 14 for 2000–06. This trend tracks the positive growth in private business multifactor productiv-ity mentioned earlier.
The 42 nonmanufacturing industries are grouped into 9 sectors, and the components of multifactor productiv-ity growth rates are presented, for the 9 nonmanufacturing sectors and for manufacturing, in table 2. At this aggregate level, only 2 of 9 sectors—construction and mining—re-ported negative productivity growth rates over the 1987–2006 period referenced in the table. Even though many individual service industries showed negative growth, all services combined exhibited essentially zero growth dur-ing the period examined. Overall output and input growth for all sectors over the near-20-year period were positive.
The percentage-point contributions of inputs into over-all input growth are presented in a Solow-type break-down. The information sector, followed by far by the fi-nance, insurance, and real estate sector, saw the greatest percentage-point contribution to input growth, a contri-bution that came mostly from information technology input growth. By contrast, labor input growth declined in industries facing strong international competition—farming, mining, manufacturing, and utilities—contribut-
ing negatively to total input.
Domar contributions
One way to determine the consistency of industry-level productivity growth rates is to see how they add up at a more aggregate level, such as the level of the private busi-ness sector. Accounting for private business sector pro-ductivity by considering contributions from industries that make up the sector is done with the use of Domar contributions. Evsey Domar’s application of the Solow growth accounting framework to industry data provided an analytical tool for showing how each industry contrib-utes to aggregate multifactor productivity growth.31 It is his proposal to establish a measurement convention for industry output and input that the BLS uses as the basis of its industry and manufacturing productivity measures. This measurement convention counts industry output as final output plus intermediate output delivered to estab-lishments outside of the industry and counts an indus-try’s inputs as those inputs obtained from sources outside of the industry. Furthermore, deliveries of intermediates from one establishment to another within an industry are not counted in either outputs or inputs for that indus-try. Output and input measures that are consistent with these conventions are called sectoral outputs and inputs.32 Domar then derived weights that could be used to ac-count for aggregate multifactor productivity in terms of industry contributions, noting that this approach led to a narrower scope of outputs and inputs at higher levels of aggregation. Domar percentage-point contributions for
Table 2. Multifactor productivity, output, and input growth, and percentage-point contribution of individual input categories to total input growth, compound annual rates of change ,1987–2006 [In percent]
Sector
Growth Percentage-point contribution to input growth, by type of input
Multifactor productivity Output Total input
Information processing equipment
and software capital input
Other capital input Labor input Intermedi-
ate inputs
Farms................................................................................ 1.38 1.62 0.24 0.04 0.18 –0.19 0.21Mining............................................................................. –.05 .58 .63 .13 –.08 –.23 .82Construction................................................................. –.94 1.80 2.77 .16 .20 .91 1.33Manufacturing............................................................. 1.37 2.49 1.10 .21 .16 –.35 1.08Transportation.............................................................. 1.26 3.23 1.95 .33 .01 .68 .91Information................................................................... 1.82 6.62 4.71 1.19 .36 .27 2.83Utilities............................................................................ .73 1.14 .40 .31 .37 –.24 –.19Trade................................................................................ 2.08 4.41 2.27 .31 .40 .33 1.22Finance, insurance, and real estate....................... .79 4.23 3.41 .67 .79 .44 1.47Services........................................................................... –.03 4.02 4.05 .44 .20 1.42 1.95
NOTE: Sum of percentage-point contributions of inputs may not equal total input growth because of independent rounding.
Multifactor Productivity
24 Monthly Labor Review • June 2010
all industries roughly sum to multifactor productivity for the overall private business sector.33
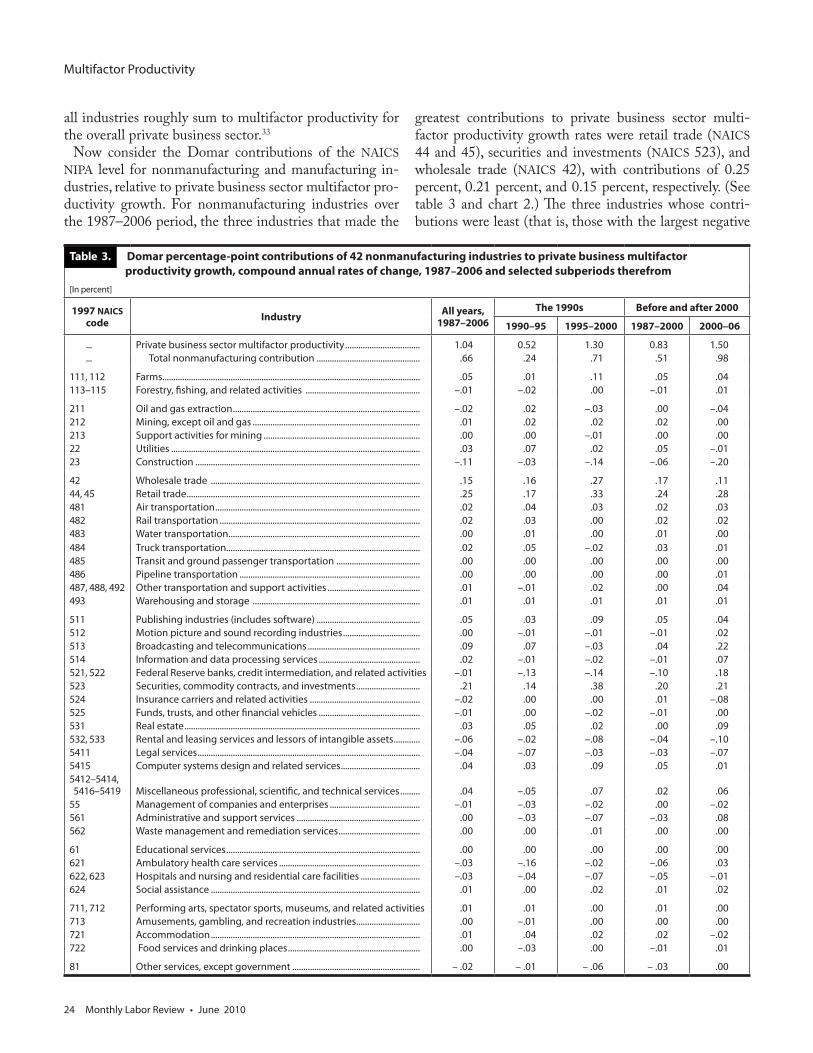
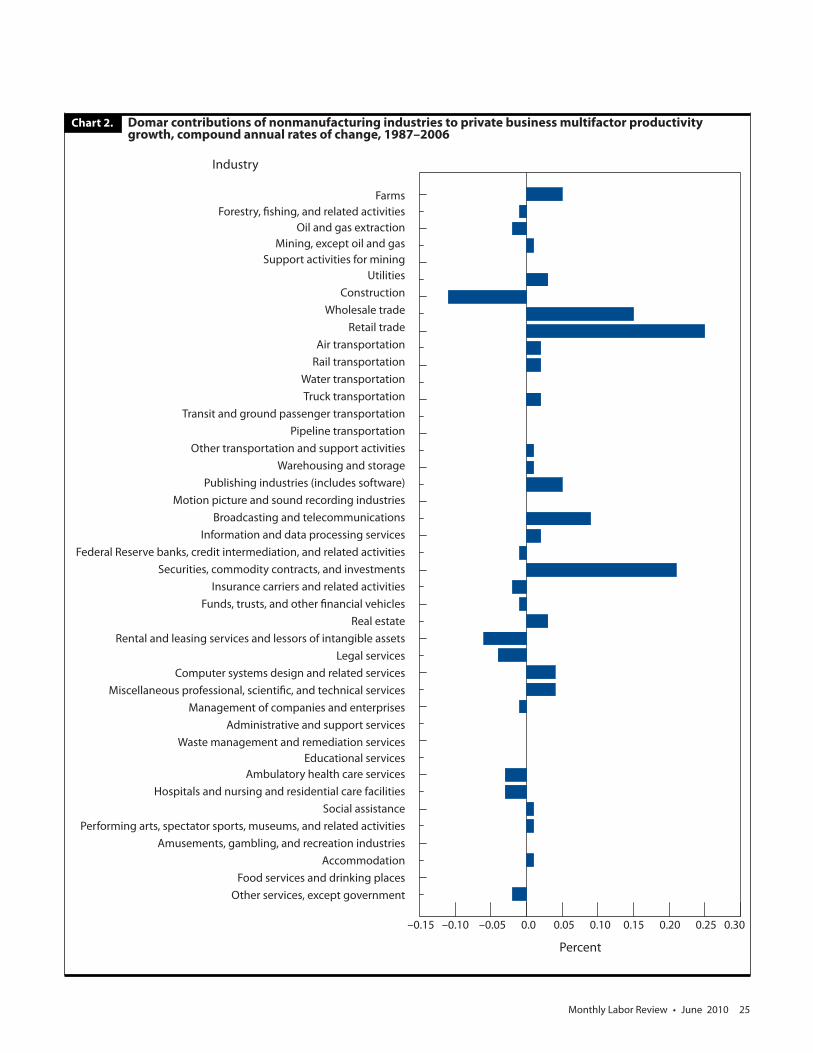
Now consider the Domar contributions of the NAICS NIPA level for nonmanufacturing and manufacturing in-dustries, relative to private business sector multifactor pro-ductivity growth. For nonmanufacturing industries over the 1987–2006 period, the three industries that made the
greatest contributions to private business sector multi-factor productivity growth rates were retail trade (NAICS 44 and 45), securities and investments (NAICS 523), and wholesale trade (NAICS 42), with contributions of 0.25 percent, 0.21 percent, and 0.15 percent, respectively. (See table 3 and chart 2.) The three industries whose contri-butions were least (that is, those with the largest negative
Table 3. Domar percentage-point contributions of 42 nonmanufacturing industries to private business multifactor productivity growth, compound annual rates of change, 1987–2006 and selected subperiods therefrom [In percent]
1997 NAICS code Industry All years,
1987–2006The 1990s Before and after 2000
1990–95 1995–2000 1987–2000 2000–06
... Private business sector multifactor productivity .................................. 1.04 0.52 1.30 0.83 1.50 ... Total nonmanufacturing contribution ............................................... .66 .24 .71 .51 .98
111, 112 Farms..................................................................................................................... .05 .01 .11 .05 .04113–115 Forestry, fishing, and related activities .................................................... –.01 –.02 .00 –.01 .01
211 Oil and gas extraction ..................................................................................... –.02 .02 –.03 .00 –.04212 Mining, except oil and gas ............................................................................ .01 .02 .02 .02 .00213 Support activities for mining ....................................................................... .00 .00 –.01 .00 .0022 Utilities ................................................................................................................. .03 .07 .02 .05 –.0123 Construction ...................................................................................................... –.11 –.03 –.14 –.06 –.20
42 Wholesale trade ............................................................................................... .15 .16 .27 .17 .1144, 45 Retail trade .......................................................................................................... .25 .17 .33 .24 .28481 Air transportation ............................................................................................. .02 .04 .03 .02 .03482 Rail transportation ........................................................................................... .02 .03 .00 .02 .02483 Water transportation ....................................................................................... .00 .01 .00 .01 .00484 Truck transportation........................................................................................ .02 .05 –.02 .03 .01485 Transit and ground passenger transportation ...................................... .00 .00 .00 .00 .00486 Pipeline transportation .................................................................................. .00 .00 .00 .00 .01487, 488, 492 Other transportation and support activities .......................................... .01 –.01 .02 .00 .04493 Warehousing and storage ............................................................................ .01 .01 .01 .01 .01
511 Publishing industries (includes software) ............................................... .05 .03 .09 .05 .04512 Motion picture and sound recording industries ................................... .00 –.01 –.01 –.01 .02513 Broadcasting and telecommunications ................................................... .09 .07 –.03 .04 .22514 Information and data processing services .............................................. .02 –.01 –.02 –.01 .07521, 522 Federal Reserve banks, credit intermediation, and related activities –.01 –.13 –.14 –.10 .18523 Securities, commodity contracts, and investments ............................. .21 .14 .38 .20 .21524 Insurance carriers and related activities .................................................. –.02 .00 .00 .01 –.08525 Funds, trusts, and other financial vehicles .............................................. –.01 .00 –.02 –.01 .00531 Real estate ........................................................................................................... .03 .05 .02 .00 .09532, 533 Rental and leasing services and lessors of intangible assets ............ –.06 –.02 –.08 –.04 –.105411 Legal services ..................................................................................................... –.04 –.07 –.03 –.03 –.075415 Computer systems design and related services .................................... .04 .03 .09 .05 .015412–5414, 5416–5419 Miscellaneous professional, scientific, and technical services ......... .04 –.05 .07 .02 .0655 Management of companies and enterprises ......................................... –.01 –.03 –.02 .00 –.02561 Administrative and support services ........................................................ .00 –.03 –.07 –.03 .08562 Waste management and remediation services ..................................... .00 .00 .01 .00 .00
61 Educational services ........................................................................................ .00 .00 .00 .00 .00621 Ambulatory health care services ................................................................ –.03 –.16 –.02 –.06 .03622, 623 Hospitals and nursing and residential care facilities ........................... –.03 –.04 –.07 –.05 –.01624 Social assistance ............................................................................................... .01 .00 .02 .01 .02
711, 712 Performing arts, spectator sports, museums, and related activities .01 .01 .00 .01 .00713 Amusements, gambling, and recreation industries ............................. .00 –.01 .00 .00 .00721 Accommodation ............................................................................................... .01 .04 .02 .02 –.02722 Food services and drinking places ............................................................ .00 –.03 .00 –.01 .01
81 Other services, except government .......................................................... – .02 – .01 – .06 – .03 .00
Monthly Labor Review • June 2010 25
FarmsForestry, fishing, and related activities
Oil and gas extractionMining, except oil and gas
Support activities for miningUtilities
ConstructionWholesale trade
Retail tradeAir transportationRail transportation
Water transportationTruck transportation
Transit and ground passenger transportationPipeline transportation
Other transportation and support activitiesWarehousing and storage
Publishing industries (includes software)Motion picture and sound recording industries
Broadcasting and telecommunicationsInformation and data processing services
Federal Reserve banks, credit intermediation, and related activitiesSecurities, commodity contracts, and investments
Insurance carriers and related activitiesFunds, trusts, and other financial vehicles
Real estateRental and leasing services and lessors of intangible assets
Legal servicesComputer systems design and related services
Miscellaneous professional, scientific, and technical servicesManagement of companies and enterprises
Administrative and support servicesWaste management and remediation services
Educational servicesAmbulatory health care services
Hospitals and nursing and residential care facilitiesSocial assistance
Performing arts, spectator sports, museums, and related activitiesAmusements, gambling, and recreation industries
AccommodationFood services and drinking places
Other services, except government
Chart 2. Domar contributions of nonmanufacturing industries to private business multifactor productivity growth, compound annual rates of change, 1987–2006
Industry
Percent
–0.15 –0.10 –0.05 0.0 0.05 0.10 0.15 0.20 0.25 0.30

Multifactor Productivity
26 Monthly Labor Review • June 2010
contributions) were construction (NAICS 23), rental and leasing services and lessors of intangible assets (NAICS 532 and 533), and legal services (NAICS 5411). The contribu-tions of these industries to the private business sector’s multifactor productivity growth rate were –0.11, –0.06, and –0.04, respectively.
Table 3 also presents data over shorter periods and is thus able to highlight which industries contributed to the speedup in multifactor productivity that took place in the late 1990s. For the period 1995–2000, productivity growth was largest in securities and investments, wholesale trade, and retail trade. From 2000 to 2006, an additional major contributor to multifactor productivity growth for the pri-vate business sector was broadcasting and telecommuni-cations (NAICS 513).
In manufacturing industries (see table 4), only one in-dustry stands out as a large contributor to overall private business sector multifactor productivity growth rates: computers and electronics (NAICS 334), over all years, but especially after 1995.
The impact of negative multifactor productivity growth rates at the industry level on major sector multifactor productivity growth can be roughly measured through Domar contributions. Whether the negative measure be due to measurement error or actual trends, an analysis using Domar percentage-point contributions provides a snapshot of the cumulative effect of all industries on multifactor productivity growth. The next section presents further adjustments to improve the comparability of in-dustry and sector productivity trends.
Production accounts and Domar contributions
The BEA-BLS collaborative project conducted by Fraume-ni, Harper, Powers, and Yuskavage linked the concepts of gross domestic product for the total economy and the BLS measure of private business sector inputs and outputs.34 Their research showed that the BLS manufacturing indus-try and business sector multifactor productivity measures, constructed from the same underlying data on real flows of inputs and outputs, fit within the NIPA framework. Many of the data series used in preparing the nonmanufacturing industry measures in the BLS data set presented here are derived from the same data sources as those underlying the published BLS multifactor productivity measures for the private business sector. As a result, the nonmanufacturing industry data presented are consistent with the BEA NIPA data and can be used in comparing industry and major-sector productivity trends.
The relationship between industry trends and major
sector multifactor productivity trends can be seen in table 5, in which Domar contributions are tabulated and then labor composition is assessed. First, the industry percentage-point contributions from tables 3 and 4 are used to produce a total industry measure. This Domar contribution measure presents a slightly faster growth trend compared with the published private business sector productivity growth rates for the same period.35 The percentage-point differences between the growth rates of total industry contributions and the published private business sector multifactor productivity growth rates are no more than two-tenths of a percentage point.
An underlying difference between the total industry contribution growth rate and the private business sector multifactor productivity growth rate is a methodological one. The industry-level multifactor productivity growth rates account for labor composition, or the improvement in workers’ skills and education, whereas the private business sector multifactor productivity growth rate does not account for labor composition, because labor composition effects are measured separately. Table 5 presents an adjusted private business sector multifactor productivity growth rate in which labor composition effects are accounted for—that is, have not been removed. The total industry contribution is very close to the adjusted private business sector trend, this time by no more than two-tenths of a percentage point in the opposite direction.
Information technology
Domar contribution analysis provides a reasonably good breakdown of private business productivity into industries’ contributions. Combining industry results with private business results creates a production account that enables the examination of complex issues concerning the sources of productivity growth. A good example is the role of information technology in explaining changes in aggregate productivity growth.
Like similar data sets recently constructed,36 the ones described in this article can be used to estimate two dif-ferent information technology influences, both of which contribute to multifactor and labor productivity growth in the private business sector. (See table 6.) Drawing on BLS data for the private business sector,37 the Solow con-tribution of growing information technology capital per worker is the contribution of information technology capital to industries that use information technology. This contribution was 0.5 percent from 1990 to 1995, 0.9 per-cent from 1995 to 2000, and 0.6 percent from 2000 to

Monthly Labor Review • June 2010 27
finding and examine some possible explanations of the continued strength of productivity since 2000.39
The challenge of negative trends
This section reviews possible explanations for negative productivity growth rates and develops a thought ex-periment that holds all negative productivity growth rate trends to zero and recalculates private business sector pro-ductivity. This type of analysis was first developed by Cor-rado and Slifman to determine the possible implications of negative productivity growth rate trends at the industry level.40
It is important to state that there are numerous
2006. The second measure of the influence of informa-tion technology is the Domar contribution of NAICS 334, the computers and electronics industry.38 This contribu-tion is the contribution of productivity advances in in-dustries that produce information technology. The Domar contribution accelerated from 0.5 in 1990–95 to 0.9 in 1995–2000, before falling to just 0.2 during 2000–06. The 1995–2000 increase in both the Solow and the Domar contribution was found to explain much of the speedup in multifactor productivity during that period, but the post-2000 reductions in the combined information technology effect leave the further acceleration unexplained, at least in a context that seeks to account for growth. Stephen Oliner, Daniel Sichel, and Kevin Stiroh report a similar
Table 5. Domar percentage-point contributions to multifactor productivity growth compared with published measures for the private business sector, compound annual rates of change, 1987–2006 and selected subperiods[In percent]
Period Years
Domar contributions Private business sector measures
Nonmanu-facturing industries
Manufacturing industries
All industries in private busi-
ness sector1
Published pri-vate business
multifactor productivity
growth
Labor compo-sition effects
Private busi-ness multifac-tor productiv-
ity adjusted for labor composi-
tion effects
All years 1987–2006.......... 0.66 0.54 1.20 1.04 0.37 1.41 The 1990s 1990–95........... .24 .54 .78 .52 .43 .95 ... 1995–2000...... .71 .79 1.50 1.30 .26 1.56Before and after 2000 1987–2000...... .51 .53 1.04 .83 .36 1.19
... 2000–06........... .98 .56 1.54 1.50 .38 1.881 Sum of manufacturing and nonmanufacturing contributions.
Table 4. Domar percentage-point contributions of manufacturing industries to private business multifactor productivity, growth, compound annual rates of change, 1987–2006 and selected subperiods[In percent]
1997 NAICS code Industry
All years, The 1990s Before and after 20001987–2006 1990–95 1995–2000 1987–2000 2000–06
... Private business sector multifactor productivity.......................... 1.04 0.52 1.30 0.83 1.50 ... Total manufacturing contribution................................................. .54 .54 .79 .53 .56311, 312 Food, beverage, and tobacco............................................................... –.02 .12 –.13 –.03 .02313, 314 Textiles.......................................................................................................... .01 .01 .02 .01 .01315, 316 Apparel and leather................................................................................. .01 .04 .00 .02 .01321 Wood............................................................................................................. .00 –.01 .00 .00 .01322 Paper.............................................................................................................. .00 –.01 .00 .00 .02323 Printing.......................................................................................................... .00 .00 .00 .00 .01324 Petroleum and coal.................................................................................. –.01 .02 .00 .01 –.04325 Chemicals.................................................................................................... .00 –.05 .00 –.03 .06
326 Plastics and rubber................................................................................... .02 .01 .03 .02 .01327 Leather.......................................................................................................... .01 .01 .01 .01 .00331 Primary metals........................................................................................... .01 .00 .01 .01 .02332 Fabricated metals...................................................................................... .02 .04 .00 .01 .02333 Machinery.................................................................................................... .00 –.06 –.03 –.02 .05334 Computers and electronics................................................................... .50 .51 .91 .61 .24335 Electrical equipment................................................................................ –.02 –.03 –.02 –.03 .01336 Transportation equipment.................................................................... .02 –.02 .02 –.03 .12337 Furniture....................................................................................................... .00 .01 .00 .00 .00339 Miscellaneous manufacturing.............................................................. .02 .00 .02 .02 .02

Multifactor Productivity
28 Monthly Labor Review • June 2010
Table 6. Percentage-point contributions to labor productivity growth in the private business sector, compound annual rates of change, 1987–2006 and selected subperiods[In percent]
All years,1987–2006
The 1990s Before and after 2000 Most recent year,
2005–061990–95 1995–2000 1987–2000 2000–06
Output per hour of all persons............................................................ 2.3 1.5 2.7 2.0 2.8 1.1
Contribution of capital intensity......................................................... .8 .6 1.1 .8 .9 .2 Contribution of all other capital services..................................... .2 .1 .2 .2 .3 –.2 Contribution of information processing equipment and software (Solow contribution of information technology)......................................................................................... .6 .5 .9 .6 .6 .3Contribution of labor composition.................................................... .4 .4 .3 .4 .4 .3Multifactor productivity......................................................................... 1.0 .5 1.3 .8 1.5 .5Contribution of computers and electronics (NAICS 334; Domar contribution of information technology)................... .5 .5 .9 .6 .2 .3Addendum: total contribution of information technology1..... 1.1 1.0 1.8 1.2 .8 .6
Measure
0422 (Bureau of Labor Statistics, May 24, 2007); and “Multifactor Productiv-ity Trends in Manufacturing, 2005,” news release USDL 07–0822 (Bureau of Labor Statistics, June 7, 2007).
1 Total contribution of information technology = sum of the Solow and Domar contributions.
SOURCES: “Multifactor Productivity Trends, 2005,” news release USDL 07–
circumstances that can lead to bona fide declines in productivity. Often, productivity declines during cyclical downturns if workers are kept on while production declines or if economies of scale are lost, to name two reasons. Negative productivity due to a cyclical downturn is not likely to persist for more than a decade, however. Negative productivity growth also manifests itself in industries that experience declining demand. When declines persist because of newer technologies or competition from imports, firms may not make the investments required to acquire new technologies, whereupon they become less productive. Finally, the productivity growth of an industry group might be negative when substantial structural changes result in relatively more growth in less productive establishments.
However, a negative productivity trend may be an indication that something is amiss in the measurement process. The sign of an industry productivity trend has been viewed as a test of the reliability of the measure of real output upon which the trend is based. The reasoning is grounded in the idea that when there is evidence of technological progress in an industry, productivity can be expected to rise. Under this assumption, a negative productivity trend could be a “red flag” for data problems. Input (particularly labor hours) is relatively straightforward to measure, compared with output, which can be problematic for conceptual reasons, the foremost of which is perhaps that identifying the basic output unit is not an easy task in many nonmanufacturing industries. To further complicate matters, quality adjustment is problematic in industries that are constantly undergoing improvements in quality, such as better computer hardware. Suspicion falls
more heavily on the output measures if the methodology involves assumptions that bypass the conceptual issues. For example, some real output trends are derived by deflating nominal output with an input price index. When output and input measures are the same, productivity change is zero.
Three previous thought experiments have been carried out. In one study, Corrado and Slifman broke down business sector output per hour into contributions from major industry groups.41 The resulting labor productivity trends for 1977–97 were negative for 9 of 11 industry groups within business and personal services and also for construction. Corrado and Slifman’s “benchmark thought experiment” consisted of raising all of the negative productivity industries to zero. They concluded that this adjustment would have raised business sector productivity trends by about 0.4 percentage point per year over the entire period.
In another study, covering the 1977–92 period, BLS researchers Gullickson and Harper found significant negative multifactor productivity trends in construction, banks, utilities, and health services. Their analogous “thought experiment effect” also led to a 0.4-percentage-point increase in business productivity.42
When Gullickson and Harper revisited the productivity topic in 2002 with improved nipa data, they found that the significant negative multifactor productivity trends for 1977–97 in construction and health services were still present.43 Negative trends for banking and utilities had moderated, and insurance carriers that previously had shown a positive trend developed an important negative trend. Overall, the “thought experiment effect” still raised

Monthly Labor Review • June 2010 29
productivity trends by about 0.3 percentage point yearly. In a slight variation of this type of analysis, Triplett and
Bosworth found negative trends in labor productivity for education, amusement and recreation, hotels, insurance, local transit, and construction from 1995 to 2001. They also found negative multifactor productivity growth rates in some industries, notably health and educational services. Unlike either Slifman and Corrado or Gullickson and Harper, Triplett and Bosworth did not engage in a thought experiment that set negative trends to zero in order to then recalculate aggregate productivity. Instead, they concluded that “statistical agencies should take negative productivity growth rates as an indicator of areas in which they need to allocate resources to improve measurement,”44 but emphasized that a positive productivity trend does not validate the data.
Negative multifactor productivity growth trends persist for a large proportion of nonmanufacturing industries in the data set presented in this article. To see whether the situation has improved, a thought experiment raising negative multifactor productivity growth trends to zero is conducted. The experiment accounts for the fact that some industry-level outputs are shipped to other industries; to the extent that this happens, measurement error would have no impact on private business sector output or multifactor productivity. To exclude these intermediate outputs from the experiment, the (negative) Domar contribution for each industry with negative multifactor productivity is multiplied by the ratio of (a) the industry’s shipments to final demand to (b) the industry’s sectoral output. These reduced negative contributions are then summed up to obtain the results displayed in the following tabulation, which shows the possible effects of negative productivity growth rates in nonmanufacturing industries on private business multifactor productivity from 1987 to 2006 and selected subperiods therefrom (figures shown are compound annual rates of change):45
Period or subperiod PercentAll years, 1987–2006........ -0.26 The 1990s: 1990–95...................... -.38 1995–2000.................. -.45 Before and after 2000: 1987–2000.................. -.29 2000–06...................... -.35
To obtain these results, the nonmanufacturing industries with negative multifactor productivity trends over the 1987–2006 period were identified and the extent to which
each such industry contributed to slowing aggregate multifactor productivity trends over time was estimated. Negative industry output trends were adjusted sufficiently to pull up each negative industry multifactor productivity trend to zero.
For the entire 1987–2006 period, overall negative nonmanufacturing industry multifactor productivity at the private business sector level would depress the aggregate multifactor productivity trends by 0.26 percentage point. That is, private business sector multifactor productivity growth rates would be a quarter of a percentage point higher if there were no negative productivity at the industry level. The depressing effect on private business sector productivity would be 0.29 percent for 1987–2000 and 0.35 percent for 2000–06. The rate for the pre-2000 period is similar to that of Gullickson and Harper’s most recent result of 0.3 percent for the 20 years from 1977 to 1997.46 If problems with source data were the reason for negative trends, improvements in source data made since 2000 should have had a perceptible effect on the trends in some industries, but the data show otherwise. The fact that there is not even a slight dampening in negative productivity trends after 2000 is an indication that problems may remain in measuring some outputs or that something else is responsible for negative productivity.
Significant disagreements among researchers remain on how to measure output for many industries, and consensus is lacking as well on fundamental issues surrounding other measurement concepts. Among the more difficult measurement problems are those in the health care (NAICS 621–623) and financial (NAICS 521–525) sectors. Multifactor productivity trends for these industries are puzzling, with several long-term negative trends but a positive 7.2-percent trend for securities, commodities, and investments (NAICS 523). The issues relating to banking and credit intermediation (NAICS 521 and 522) are particularly difficult, and researchers are divided as to the best approach to dealing with them. The chief difficulty is that the nominal value of output is difficult to define in banking, and removing price change effects also is problematic.
THE WORK PRESENTED IN THIS ARTICLE highlights the continuing paradox that many nonmanufacturing industries continue to show negative productivity growth rates, even as the quality of output and input measures has improved. Domar contribution analysis, together with the thought experiment that uses the new BLS data set to analyze the implications of negative industry productivity growth, contributes to a comprehensive view

Multifactor Productivity
30 Monthly Labor Review • June 2010
of how private business sector multifactor productivity trends can be derived from individual industries. This nonmanufacturing data set, based on NAICS, expands upon, and is complementary to, the NAICS manufacturing data set on multifactor productivity regularly published by the BLS. As shown here, the new data set explains multifactor productivity growth and provides the basis for a production account up to the level of the private business sector. The BLS plans to issue these results periodically to help researchers and experts understand the sources of
economic growth.BLS economists continue to have concerns, however,
about some industry productivity measures. The long-term trend of negative productivity for some industries, coupled with unresolved conceptual and methodological issues, may affect output measures for those industries. Some results may be less reliable than others. In pursuing research and analysis in this area in the future, the BLS will strive to improve data sources for nonmanufacturing industries whenever possible.
Notes
ACKNOWLEDGMENT: The authors thank Lucy Eldridge and Susan Powers for comments, Lisa Usher for supplying data from the BLS Industry Productivity Studies program, and Susan Fleck for extensive editorial contributions to this article.
1 Robert Solow, “We’d Better Watch Out,” New York Times Book Review, July 12, 1987, p. 36.
2 The situation was actually noticed earlier. Zvi Griliches, “Pro-ductivity, R&D, and the Data Constraint,” American Economic Review, March 1994, pp. 1–23, provides a list of earlier studies, including The Stigler committee report on government price statistics (National Bureau of Economic Research, 1961); Richard Ruggles, “The United States Na-tional Income Accounts, 1947–1977: Their Conceptual Basis and Evo-lution” (the Ruggles report), in Murray F. Foss (ed.), The U.S. National Income and Product Accounts: Selected Topics (Chicago, University of Chi-cago Press, 1983), pp. 15–106; and Albert Rees and others, Measurement and Interpretation of Productivity (Washington, dc, National Academy of Sciences, 1979).
3 Carol Corrado and Lawrence Slifman, “Decomposition of Pro-ductivity and Unit Costs,” American Economic Review, Papers and Pro-ceedings, vol. 89, May 1999, pp. 328–32.
4 Griliches, “Productivity, R&D, and the Data Constraint.” 5 Michael Boskin, Ellen Dulberger, Robert Gordon, Zvi Griliches,
and Dale Jorgenson, Toward a More Accurate Measure of the Cost of Living: Final Report to the Senate Finance Committee from the Advisory Commission to Study the Consumer Price Index, Dec. 4, 1996, on the In-ternet at www.ssa.gov/history/reports/boskinrpt.html (visited Mar. 17, 2010).
6 See William Gullickson and Michael J. Harper, “Possible measurement bias in aggregate productivity growth,” Monthly Labor Review, February 1999, pp. 47–67; and “Bias in aggregate productivity trends revisited,” Monthly Labor Review, March 2002, pp. 32–40.
7 Jack Triplett and Barry Bosworth, Productivity in the U.S. Serv-ices Sector (Washington, DC, The Brookings Institution, 2004); and “Is the 21st Century Productivity Expansion Still in Services? And What Should Be Done About It?” paper presented at the January 2007 meet-ing of the American Economic Association, Washington, DC, on the Internet at www.brookings.edu/~/media/Files/rc/papers/2007/01_productivity_bosworth/01_productivity_bosworth.pdf (visited Mar. 17, 2010).
8 The BLS prepares both major sector and detailed industry produc-
tivity data. For labor productivity, major sectors range from business and nonfarm business sectors to manufacturing sectors; for multifactor productivity, detailed industries cut across private business and non-farm business sectors through manufacturing industries at the two- and three-digit NAICS levels. Detailed industries consist of four-digit industries throughout the domestic economy. The BLS publishes both labor and multifactor measures. BLS multifactor productivity measures for detailed industries undergird major sector measures in general and the nonmanufacturing sector measures presented here. BLS labor pro-ductivity data are on the Internet at www.bls.gov/lpc, multifactor pro-ductivity data at www.bls.gov/mfp.
9 J. R. Norsworthy, Michael J. Harper, and Kent Kunze, “The Slow-down in Productivity Growth: Analysis of Some Contributing Fac-tors”, Brookings Papers on Economic Activity, no. 2 (Washington, DC, The Brookings Institution, 1979), pp. 387–421.
10 See Gullickson and Harper, “Possible measurement bias” and “Bias in aggregate productivity.”
11 Utilities may be categorized as a goods-producing or service-providing industry, depending on the activity in question. For example, the conversion of coal to energy or of sewage to gray water could be considered a goods-producing activity, whereas the delivery of utilities is a service.
12 Gullickson and Harper, “Possible measurement bias” and “Bias in aggregate productivity.”
13 The sectoral output concept is used at the industry level to apply the BLS model of multifactor productivity more accurately.
14 See “Multifactor Productivity Trends in Manufacturing, 2006,” news release USDL 08-0857 (Bureau of Labor Statistics, May 1, 2008), on the Internet at www.bls.gov/news.release/archives/prod5_05012008.pdf (visited Mar. 17, 2010).
15 The KLEMS model measures the factor intensity of the five inputs listed. Intermediate inputs from outside an industry contribute to total production, or output, inside that industry. Thus, an industry’s output includes both intermediate and final output, and an industry’s input includes only intermediate inputs that are from outside the industry. At a more aggregate level of private business and nonfarm business sectors, a value-added concept of output, typically called final output, is used. Intermediate inputs cannot be disaggregated by sector or added to final output, because major sectors produce a majority of the do-mestic economic output. The KLEMS model of multifactor productivity analysis for industry-level production was first presented in William Gullickson and Michael J. Harper, “Multifactor productivity in U.S.

Monthly Labor Review • June 2010 31
manufacturing, 1949–83,” Monthly Labor Review, October 1987, pp. 18–28, on the Internet at www.bls.gov/opub/mlr/1987/10/art3full.pdf (visited Mar. 17, 2010).
16 Robert Solow, “Technical Change and the Aggregate Produc-tion Function,” Review of Economics and Statistics, August 1957, pp. 312–20.
17 Dale Jorgenson and Zvi Griliches, “The Expansion of Pro-ductivity Change,” Review of Economic Studies, July 1967, pp. 249–83.
18 Evsey Domar, “On the Measurement of Technological Change,” Economic Journal, December 1961, pp. 709–29.
19 Ernst Berndt and David Wood, “Technology, Prices and the De-rived Demand for Energy,” Review of Economics and Statistics, August 1975, pp. 259–68.
20 Dale Jorgenson, Frank Gollop, and Barbara Fraumeni, Produc-tivity and U.S. Economic Growth (Cambridge, MA, Harvard University Press, 1987).
21 W. Erwin Diewert, “Exact and Superlative Index Numbers,” Journal of Econometrics, 1976, pp. 115–146.
22 The sum of the weights is assumed to be unity.23 Barbara Fraumeni, Michael Harper, Susan Powers, and Robert
Yuskavage, “An Aggregate BEA/BLS Production Account: A First Step and Theoretical Considerations,” in Dale Jorgenson, Steven Landefeld, and William Nordhaus, A New Architecture for the U.S. National Ac-counts, Studies in Income and Wealth, vol. 66 (Chicago, University of Chicago Press, 2006), pp. 355–435.
24 Eric Strassner, Gabriel Medieros, and George Smith, “Annual Industry Accounts: Introducing KLEMS Input Estimates, 1997–2003,” Survey of Current Business, September 2005, pp. 31–65.
25 Michael Harper, “Estimating Capital Inputs for Productivity Measurement: An Overview of U.S. Concepts and Methods,” Interna-tional Statistical Review, no. 3, 1999, pp. 327–37.
26 The chained Tőrnqvist index is a chain of antilogarithms of growth rates. The antilogarithms are computed as weighted aver-ages of differences in successive logarithms of the input indexes. The weights, which change each year, are 2-year averages of re-spective inputs’ shares of total input costs for the 2 years being compared.
27 See Jorgenson and Griliches, “The Expansion of Productivity Change.” Further specifics on the BLS aggregation methods are de-tailed in Harper, “Estimating Capital Inputs.”
28 Labor compensation equals wages and salaries of employees, plus employers’ contributions to social insurance and private benefit plans and all other fringe benefits, in current dollars. An estimate of the wages, salaries, and supplemental payments for the self-em-ployed and unpaid family workers is included. Capital income is corporate capital income plus imputed noncorporate capital income. Corporate capital income equals corporate capital consumption al-lowances, plus corporate profits, plus corporate inventory valuation adjustment, plus corporate net interest, plus business transfer pay-ments, plus the part of indirect business taxes associated with capital (property taxes and motor vehicle taxes). Noncorporate capital in-come equals total cost, less corporate capital income, less total labor
compensation.29 “Multifactor Productivity Trends in Manufacturing, 2005,”
news release USDL 07-0822 (Bureau of Labor Statistics, June 7, 2007).
30 Gullickson and Harper, “Possible Measurement Bias,” p. 56; and “Bias in Aggregate Productivity,” p. 35.
31 Domar, “Measurement of Technological Change.”32 Frank Gollop, “Growth Accounting in an Open Economy,” in A.
Dogramici (ed.), Developments in Econometric Analyses of Productivity (Boston, Klumer Nijhoff, 1982).
33 An industry’s Domar contribution to aggregate multifactor productivity growth is the industry’s multifactor productivity growth multiplied by its Domar weight. Each industry’s Domar weight is the ratio of the industry’s current-dollar value of production to aggregate current-dollar value added. Domar showed that, although the weights sum to more than unity, the sum of industry contributions will equate to aggregate multifactor productivity.
34 Fraumeni, Harper, Powers, and Yuskavage, “An Aggregate BEA/BLS Production Account.”
35 “Multifactor Productivity Trends, 2005,” news release USDL 07-0422 (Bureau of Labor Statistics, May 24, 2007).
36 See Stephen Oliner and Daniel Sichel, “The Resurgence of Growth in the Late 1990s: Is Information Technology the Story?” Journal of Economic Perspectives, fall 2000, pp. 3–22; and Dale Jor-genson, Kevin Stiroh, and Mun Ho, “Growth of U.S. Industries and Investments in Information Technology and Higher Edu-cation,” in Carol Corrado, John Haltiwanger, and Daniel Sichel (eds.), Measuring Capital in the New Economy: Studies in Income and Wealth, vol. 65 (Chicago, University of Chicago Press, 2005), pp. 403–72.
37 “Multifactor Productivity Trends, 2006,” news release USDL 08-0410 (Bureau of Labor Statistics, Mar. 27, 2008).
38 This contribution is based on Multifactor Productivity Trends in Manufacturing, 2005, and is shown to one decimal place in table 6.
39 Stephen Oliner, Daniel Sichel, and Kevin Stiroh, “Explaining a Productive Decade,” Brookings Papers on Economic Activity, fall 2007, pp. 81–137.
40 Corrado and Slifman, “Decomposition of Productivity.” 41 Ibid.42 Gullickson and Harper, “Possible Measurement Bias.” 43 Gullickson and Harper, “Bias in Aggregate Productivity.” 44 Triplett and Bosworth, Productivity in the U.S. Services Sector, p.
331.45 Percentage-point contributions are weighted on the basis of the
ratio of the industry’s value of production to aggregate value added. The sum of negative weights for each period or subperiod represents only those industries that have a negative percentage-point contribu-tion for that period or subperiod.
46 Gullickson and Harper, “Bias in Aggregate Productivity.”


![Bell Ringer: What is the artist implying?. The Study of American Government [Chapter 1]](https://img.pdfslide.us/doc/110x75/56649f355503460f94c53e36/bell-ringer-what-is-the-artist-implying-the-study-of-american-government.jpg)


