Embed Size (px)
Citation preview

Monthly Fact SheetMay 2016

Understanding The Factsheet
Yield to Maturity/ Portfolio Yield
Modified Duration
Standard Deviation
Sharpe Ratio
Beta
AUM
Holdings
Nature of Scheme
Rating Profile
Fund Manager
Application Amount for Fresh Subscription/Minimum Investment
Minimum Additional Amount
SIP
NAV
Benchmark
Entry Load
Exit Load
An employee of the asset management company such as a mutual fund or life insurer, who manages investments of the scheme. He is usually part of a larger team of fund managers and research analysts.
This is the minimum investment amount for a new investor in a mutual fund scheme.
This is the minimum investment amount for an existing investor in a mutual fund scheme.
SIP or systematic investment plan works on the principle of making periodic investments of a fixed sum. It works similar to a recurring bank deposit. For instance, an investor may opt for an SIP that invests Rs 500 every 15th of the month in an equity fund for a period of three years.
The NAV or the net asset value is the total asset value per unit ofthe mutual fund after deducting all related and permissible expenses. The NAV is calculated at the end of every business day. It is the value at which the investor enters or exits the mutual fund.
A group of securities, usually a market index, whose performance is used as a standard or benchmark to measure investment performance of mutual funds, among other investments. Some typical benchmarks include the Nifty, Sensex, BSE200, BSE500, 10-Year Gsec.
A mutual fund may have a sales charge or load at the time of entry and/or exit to compensate the distributor/agent.
Entry load is charged at the time an investor purchases the units of a mutual fund. The entry load is added to the prevailing NAV at the time of investment. For instance, if the NAV is Rs 100 and the entry load is 1%, the investor will enter the fund at Rs 101.
Note: SEBI, vide circular dated june 30, 2009 has abolished entry load and mandated that the upfront commission to distributors will be paid by the investor directly to the distributor, based on his assessment of various factors including the service rendered by the distributor
Exit load is charged at the time an investor redeems the units of a mutual fund. The exit load is deducted from the prevailing NAV at the time of redemption. For instance if the NAV is Rs.100 and the exit load is 1%,the redemption price would be Rs.99 per unit.
The Yield to Maturity or the YTM is the rate of return anticipated on a bond if held until maturity. YTM is expressed as an annual rate. The YTM factors in the bond's current market price, par value, coupon interest rate and time to maturity. Portfolio yield is weighted average YTM of the securities.
Modified duration is the price sensitivity and the percentage change in price for a unit change in yield.
Standard deviation is a statistical measure of the range of an investment’s performance. When a mutual fund has a high standard deviation, its means its range of performance is wide, implying greater volatility.
The Sharpe Ratio, named after its founder, the Nobel Laureate William Sharpe, is a measure of risk-adjusted returns. It is calculated using standard deviation and excess return to determine reward per unit of risk.
Beta is a measure of an investment’s volatility vis-à-vis the market. Beta of less than 1 means that the security will be less volatile than the market. A beta of greater than 1 implies that the security's price will be more volatile than the market.
AUM or assets under management refers to the recent / updated cumulative market value of investments managed by a mutual fund or any investment firm.
The holdings or the portfolio is a mutual fund’s latest or updated reported statement of investments/securities. These are usually displayed in terms of percentage to net assets or the rupee value or both. The objective is to give investors an idea of where their money is being invested by the fund manager.
The investment objective and underlying investments determine the nature of the mutual fund scheme. For instance, a mutual fund that aims at generating capital appreciation by investing in stockmarkets is an equity fund or growth fund. Likewise, a mutual fund that aims at capital preservation by investing in debt markets is a debt fund or income fund. Each of these categories may have sub-categories.
Mutual funds invest in securities after evaluating their creditworthiness as disclosed by the ratings. A depiction of the mutual fund in various investments based on their ratings becomes the rating profile of the fund. Typically, this is a feature of debt funds.

Contents
EQUITY
HYBRID
INCOME & LIQUID
Franklin India Bluechip Fund (FIBCF). . . . . . . . . . . . . . . . . . . . . . . . . . . . . . . . . . . . . . . . . . . . . . . . . . . . . . . . . . . . . . . . . . . . . . 6
Templeton India Growth Fund (TIGF). . . . . . . . . . . . . . . . . . . . . . . . . . . . . . . . . . . . . . . . . . . . . . . . . . . . . . . . . . . . . . . . . . . . . . 7
Franklin India Prima Plus (FIPP) . . . . . . . . . . . . . . . . . . . . . . . . . . . . . . . . . . . . . . . . . . . . . . . . . . . . . . . . . . . . . . . . . . . . . . . . . 8
Franklin India Prima Fund (FIPF) . . . . . . . . . . . . . . . . . . . . . . . . . . . . . . . . . . . . . . . . . . . . . . . . . . . . . . . . . . . . . . . . . . . . . . . . . 9
Franklin India Flexi Cap Fund (FIFCF) . . . . . . . . . . . . . . . . . . . . . . . . . . . . . . . . . . . . . . . . . . . . . . . . . . . . . . . . . . . . . . . . . . . . 10
Franklin India High Growth Companies Fund (FIHGCF) . . . . . . . . . . . . . . . . . . . . . . . . . . . . . . . . . . . . . . . . . . . . . . . . . . . . . . . 11
Franklin Asian Equity Fund (FAEF) . . . . . . . . . . . . . . . . . . . . . . . . . . . . . . . . . . . . . . . . . . . . . . . . . . . . . . . . . . . . . . . . . . . . . . 12
Franklin India Opportunities Fund (FIOF) . . . . . . . . . . . . . . . . . . . . . . . . . . . . . . . . . . . . . . . . . . . . . . . . . . . . . . . . . . . . . . . . . . 13
Franklin Build India Fund (FBIF). . . . . . . . . . . . . . . . . . . . . . . . . . . . . . . . . . . . . . . . . . . . . . . . . . . . . . . . . . . . . . . . . . . . . . . . . 13
Templeton India Equity Income Fund (TIEIF) . . . . . . . . . . . . . . . . . . . . . . . . . . . . . . . . . . . . . . . . . . . . . . . . . . . . . . . . . . . . . . . 14
Franklin India Taxshield (FIT). . . . . . . . . . . . . . . . . . . . . . . . . . . . . . . . . . . . . . . . . . . . . . . . . . . . . . . . . . . . . . . . . . . . . . . . . . . 15
Franklin India Smaller Companies Fund (FISCF) . . . . . . . . . . . . . . . . . . . . . . . . . . . . . . . . . . . . . . . . . . . . . . . . . . . . . . . . . . . . 16
Franklin India Index Fund - NSE Nifty Plan (FIIF) . . . . . . . . . . . . . . . . . . . . . . . . . . . . . . . . . . . . . . . . . . . . . . . . . . . . . . . . . . . . 17
Franklin Infotech Fund (FIF). . . . . . . . . . . . . . . . . . . . . . . . . . . . . . . . . . . . . . . . . . . . . . . . . . . . . . . . . . . . . . . . . . . . . . . . . . . . 17
Franklin India Balanced Fund (FIBF) . . . . . . . . . . . . . . . . . . . . . . . . . . . . . . . . . . . . . . . . . . . . . . . . . . . . . . . . . . . . . . . . . . . . . 18
Franklin India Pension Plan (FIPEP) . . . . . . . . . . . . . . . . . . . . . . . . . . . . . . . . . . . . . . . . . . . . . . . . . . . . . . . . . . . . . . . . . . . . . . 19
Franklin India Monthly Income Plan (FIMIP) . . . . . . . . . . . . . . . . . . . . . . . . . . . . . . . . . . . . . . . . . . . . . . . . . . . . . . . . . . . . . . . 20
Franklin India Corporate Bond Opportunities Fund (FICBOF) . . . . . . . . . . . . . . . . . . . . . . . . . . . . . . . . . . . . . . . . . . . . . . . . . . . 21
Franklin India Income Opportunities Fund (FIIOF) . . . . . . . . . . . . . . . . . . . . . . . . . . . . . . . . . . . . . . . . . . . . . . . . . . . . . . . . . . . 22
Franklin India Dynamic Accrual Fund (FIDA) . . . . . . . . . . . . . . . . . . . . . . . . . . . . . . . . . . . . . . . . . . . . . . . . . . . . . . . . . . . . . . . 23
Franklin India Treasury Management Account (FITMA) . . . . . . . . . . . . . . . . . . . . . . . . . . . . . . . . . . . . . . . . . . . . . . . . . . . . . . 24
Franklin India Income Builder Account (FIIBA) . . . . . . . . . . . . . . . . . . . . . . . . . . . . . . . . . . . . . . . . . . . . . . . . . . . . . . . . . . . . . 25
Franklin India Ultra Short Bond Fund (FIUBF) . . . . . . . . . . . . . . . . . . . . . . . . . . . . . . . . . . . . . . . . . . . . . . . . . . . . . . . . . . . . . . 26
Franklin India Government Securities Fund (FIGSF) . . . . . . . . . . . . . . . . . . . . . . . . . . . . . . . . . . . . . . . . . . . . . . . . . . . . . . . . . 27
Franklin India Short Term Income Plan (FISTIP). . . . . . . . . . . . . . . . . . . . . . . . . . . . . . . . . . . . . . . . . . . . . . . . . . . . . . . . . . . . . 28
Franklin India Savings Plus Fund (FISPF) . . . . . . . . . . . . . . . . . . . . . . . . . . . . . . . . . . . . . . . . . . . . . . . . . . . . . . . . . . . . . . . . . 29
Franklin India Low Duration Fund (FILDF) . . . . . . . . . . . . . . . . . . . . . . . . . . . . . . . . . . . . . . . . . . . . . . . . . . . . . . . . . . . . . . . . . 30
Franklin India Cash Management Account (FICMA) . . . . . . . . . . . . . . . . . . . . . . . . . . . . . . . . . . . . . . . . . . . . . . . . . . . . . . . . . 30
Franklin India Banking & PSU Debt Fund (FIBPDF) . . . . . . . . . . . . . . . . . . . . . . . . . . . . . . . . . . . . . . . . . . . . . . . . . . . . . . . . . . 31
Scheme Performance. . . . . . . . . . . . . . . . . . . . . . . . . . . . . . . . . . . . . . . . . . . . . . . . . . . . . . . . . . . . . . . . . . . . . . . . . . . . . 35
SIP Returns. . . . . . . . . . . . . . . . . . . . . . . . . . . . . . . . . . . . . . . . . . . . . . . . . . . . . . . . . . . . . . . . . . . . . . . . . . . . . . . . . . . . . 41
Dividend/Bonus History/Fund Managers Industry Experience . . . . . . . . . . . . . . . . . . . . . . . . . . . . . . . . . . . . . . . . . . . . . 44
3Franklin Templeton Investmentswww.franklintempletonindia.com
Market Update . . . . . . . . . . . . . . . . . . . . . . . . . . . . . . . . . . . . . . . . . . . . . . . . . . . . . . . . . . . . . . . . . . . . . . . . . . . . . . . . . . . . . . 4
Franklin India Multi – Asset Solution Fund (FIMAS) . . . . . . . . . . . . . . . . . . . . . . . . . . . . . . . . . . . . . . . . . . . . . . . . . . . . . . . . . 31
Franklin India Dynamic PE Ratio Fund of Funds (FIDPEF) . . . . . . . . . . . . . . . . . . . . . . . . . . . . . . . . . . . . . . . . . . . . . . . . . . . . . 32
Franklin India Life Stage Fund of Funds (FILSF). . . . . . . . . . . . . . . . . . . . . . . . . . . . . . . . . . . . . . . . . . . . . . . . . . . . . . . . . . . . . 33
Franklin India Feeder - Franklin U S Opportunities Fund (FIF-FUSOF) . . . . . . . . . . . . . . . . . . . . . . . . . . . . . . . . . . . . . . . . . . . . 34
Franklin India Feeder - Franklin European Growth Fund (FIF-FEGF) . . . . . . . . . . . . . . . . . . . . . . . . . . . . . . . . . . . . . . . . . . . . . . 34
FUND OF FUNDS

Equity Market Snap Shot
Anand Radhakrishnan, CIO – Franklin Equity
Global
INDIAIndian equity indices continued to rise for the 3rd consecutive month led by upbeat 4QFY16 results posted by some of the key companies, strong domestic inflows and signs of revival shown by certain high frequency indicators (tractor sales, auto sales, consumer credit growth). Frontline indices (BSE Sensex and S&P Nifty) added 4.14% and 3.95% respectively while S&P BSE Mid Cap (2.93%) and S&P BSE Small cap indices (1.11%) lagged the broader indices during the month. Among the sectoral indices, capital goods was among the top gainers due to buoyant 4QFY16 results posted by some key players. Banking sector also gained as markets cheered greater disclosures by the banks despite higher provisions in 4QFY16. Meanwhile healthcare and oil & gas sector were among the bottom performers as disappointing 4QFY16 results reported by major companies in the sector, weighed on the performance of respective indices.
Indian markets received a net FPI flow of $385.69 mn or INR 25.82 bn in equity in May. Domestic institutional investors cumulatively bought equity worth INR 71 bn in May.
Macroeconomic data during the month was varied. Trade deficit at a 5-year low, robust GDP growth of 7.9%YoY for 4QFY16 and improvement in manufacturing PMI were some of the positives. However, uptick in CPI inflation (food inflation continued to rise) led to market expectation of RBI holding the rates in the June policy meet. Further, the IIP for March also showed weaker trend.
India's index of industrial production (IIP) moderated to 0.1%YoY in March vs a rise of 2%YoY in February. On a sectoral basis electricity grew by 11.3%, while manufacturing and mining contracted by 1.2% and 0.1% respectively. Capital goods continued to show a weaker trend (-15.4%) and consumer non-durables (-4.4%) showed a weak trend, even as consumer durables clocked 8.7%. For the fiscal year FY16, IIP recorded a growth of 2.4% vs 2.8% in the last fiscal. India's manufacturing PMI rose to 50.7 in May from 50.5 in previous month as output softened while new orders expanded at a faster pace. Cost inflation climbed to the strongest since March 2015.
India's trade deficit declined to $4.8 bn in April, a five year low. While exports continued to contract owing to the weak external demand and sliding global
4Franklin Templeton Investmentswww.franklintempletonindia.com
Global equity indices showed mixed trends amidst varied cues, wherein developed markets (MSCI AC world) outperformed their emerging market peers (MSCI Emerging Markets) recording -0.19% and -3.90% respectively. A rebound in crude oil prices buoyed most markets across the globe. US equity market represented by Nasdaq rose 3.62% on account of upbeat domestic housing data and a rally in financial, technology, energy and materials shares. Japanese equity market represented by Nikkei rose 3.41% helped by sporadic weakness in the yen, uptick in crude oil prices and some optimistic US economic data. European equity markets posted healthy gains led by progress on talks towards securing a debt-relief deal for Greece and a sharp uptrend in prices of export driven companies, which benefitted due to weakening euro. Meanwhile, Brazil's Bovespa was among the worst performing indices and corrected 10% during the month. Anticipation of lower growth due to country's tattered finances coupled with growing expectations that the US Federal Reserve could raise interest rates dragged the Brazilian equity markets.
Crude oil prices rose in May on account of easing of global glut. Also, larger-than-expected fall in US crude supplies supported the gains. Brent crude strengthened to about $49.89/bbl by the end of May rising by 4.5% during the month. Gold prices which were under pressure due to prospect of an imminent rate hike, tumbled post U.S. Federal Reserve chief Janet Yellen's statement regarding raising interest rates. Gold ended the month at $1215.33/oz, recording a 6% loss. Metals also corrected during the month, with Nickel and Aluminium losing 10.9% and 7.4% respectively. Zinc, Copper and Lead prices also fell during the month.
Monthly Change %
S&P BSE Sensex 4.14
Nifty 50 3.95
Nifty 500 3.27
Nifty Free Float Midcap 100 0.74
S&P BSE SmallCap 1.11
commodity prices, the sharper pace of contraction in imports (especially capital goods and electronic goods), contributed to the overall decline in trade deficit.
Data released at the end of month showed, India's GDP growth for 4QFY16 came in at 7.9%YoY from 7.3%YoY in the previous quarter. For FY16, GDP growth was 7.6%, in line with the advance estimates. The increase in GDP growth was on account of higher private consumption, though investments remained weak.
OUTLOOKWhile there are concerns regarding lack of revival in investment, diminutive progress on GST and the absence of rapid job creation, we believe that there has been substantial focus on stimulating activity in various sectors viz. roads, power, irrigation, defence, ports and railways, by way of higher budget allocations. Further, with improvement in key macroeconomic indicators and government focused on the fiscal consolidation, the building blocks for economic growth seem to gradually fall in place. While the pace of recovery could be slower than expected, nevertheless, the same is likely to be consumption led and would be driven by domestic demand. We believe that pay commission related hikes for government sector employees, improvement in rural sector in case of normal monsoons and expected moderation in inflation which could bode well for further monetary policy easing, would be instrumental in driving consumption growth.
The 4QFY16 results were in line with the expectations barring a few misses. With nominal GDP growth now improving facilitated by the rising WPI and GDP deflator, corporate revenue growth is likely to trend up. Also, improving consumer discretionary demand coupled with higher public spending in key infrastructure sectors would benefit corporate earnings. This along with tailwinds from transmission of rate cuts (trickling down to lending rate) would augur well for reducing cost of capital for companies leading to margin expansion and subsequent profit growth in the medium term. Given the negligible difference in the valuation gap between large caps and midcaps, we suggest systematic investments in diversified equity funds to participation in Indian growth story. Further, as the mid cap companies offer opportunities to participate in the domestic demand growth theme, the investors could consider mid and small cap equity funds for long term growth potential.
Monthly Change %
MSCI AC World Index -0.19
FTSE Eurotop 100 1.49
MSCI AC Asia Pacific -1.56
Dow Jones 0.08
Nasdaq 3.62
S&P 500 1.53
Xetra DAX 2.23
CAC 40 1.73
FTSE 100 -0.18
Hang Seng -1.20
Nikkei 3.41
KOSPI -0.54
@ Nifty Midcap 100 has been renamed as Nifty Free Float Midcap 100 w.e.f. April 01, 2016 and CRISIL Balanced Fund Index has been renamed as CRISIL Balanced Fund – Aggressive Index w.e.f. April 04, 2016.
Templeton Equity View : Renewed Confidence
Chetan Sehgal, CIO - India, Emerging Markets
There has been a marked change in perception towards the Emerging Markets
over the last few months. From a low point, prices of securities and
commodities seem to have stabilized after hitting low points in the early part of
the year. The stabilization in the markets has probably enabled the US Fed to
continue on its path of normalization of rates and market participants are now
expecting some rate increases. However, the Emerging Markets seem to have
taken that into consideration as asset prices have continued to rally. We suspect
that a lot of the normalization is predicated on the assumption that China would
be able to continue on its path of adjusting the economy, without severe shocks.
The Indian Banking system seems to have weathered the storm and efforts are
now underway to tackle the malaise. The advent of the monsoons may well
renew the optimism towards the economy which seems to be coming into its
own.
Monthly Change %

Fixed Income Market Snap ShotSantosh Kamath, CIO - Fixed Income
Long maturity government bond yields in the US and Asian countries marginally rose by 2 to 5 bps in May on expectation of a rate hike by the US Federal Reserve in June. Investor optimism towards riskier Asian equities also aided the fall in bond prices. The news flow on slowdown in Chinese economic growth and concerns around interest rate hike by the Federal Reserve weighed on investor sentiments. However, these apprehensions were countered to some extent by factors such as rising crude oil prices and bailout talks for Greece between Eurozone's finance ministers and the IMF, thereby supporting market sentiments.
European bond yields slipped during May due to lacklustre growth data for retail sales and private sector expansion. Fears of Brexit also weighed on market sentiments. But the fall in yields was largely attributable to the progress in the Greek bailout talks. The Greek 10-year bond yield fell by a massive 127 bps during the month and others including Germany, Italy, Spain and France saw a 10-13 bps fall in the bond yields. Bank of England retained its interest rate at record low of 0.50% and kept the size of its asset purchase unchanged at GBP 375 billion. Australian Central Bank cut rates in May, thereby echoing concerns on weakness in global growth.
· RBI's Second Bimonthly Monetary Policy Review :The uptick in the domestic headline inflation seen in April 2016 along with other factors such as future implementation of the 7th Pay Commission (could lead to a rise in demand-led inflation) and firming up of global commodity prices (fuel price inflation) lends an upside risk bias to the existing inflation forecast. Despite this observation, the RBI has kept the inflation trajectory projection unchanged at 4-6% for 2016-17 even as it has raised the lower range of inflation forecast (90% confidence interval) from 2% (April) to 3% in June. This is on account of expectations that an above-average monsoon together with improvement in the supply management measures and introduction of an e-trading portal for agriculture should aid in moderating any spike in the food price inflation going ahead. The RBI also notes that there has been no satisfactory transmission of rate cuts by the banks, a critical parameter for growth revival.
Nevertheless, the RBI expects the domestic recovery to be initially led by consumption demand. Increasing public capital expenditure is likely to augment the private sector investments which would in turn propel another leg of growth recovery for the economy. Overall, the RBI maintains an accommodative policy stance while actively monitoring domestic macroeconomic growth progress and global financial market developments for cues on further policy action.
Domestically, the bond yields remained flat during the month. 10-year benchmark bond yield marginally rose 2.5 bps on an up-tick in the inflation data and rise in crude prices. Concerns over declining overseas participation in the Indian debt market weighed on the markets. The 10-year benchmark bond yield closed the month at 7.46%. Foreign Portfolio Investor (FPI) flows into the domestic fixed income market again turned negative in May (USD 0.65 bn) after positive flows seen in April. The debt market has witnessed FPI outflows in three out of five months in 2016.
Fixed income market overview:Liquidity: Systemic liquidity remained comfortable during the month on inflows from government's spending and fund infusions by the RBI through Repo auctions and OMOs. The daily average liquidity deficit further eased to INR 1018 bn in May. Call rates continued hovering around Repo rate in the range of 6.40%-6.55% during the month, on better liquidity conditions.
Rupee weakened by nearly 1.4% in May 2016 as dollar strengthened on expectation of rate hike by the Federal Reserve in June. FPIs pulled out funds from the Indian equity market on concerns around the change in India's tax treaty with Mauritius. This concern weakened Rupee in the initial part of the month. However, rising crude prices and positive US economic data aided global risk appetite during the last week of May, thereby leading to a decent FPI flow into Indian equity markets. This in turn helped Rupee to reduce losses against a strengthening Dollar. Forex reserves for the week ended 20th May 2016 stood at USD 360.9 bn, up by USD 9.3 bn from May 2015 levels. Yield curve movement:Yield curve largely remained flattish in May falling by about 2-5 bps in the shorter end of the curve. The belly of the curve rose 3-5 bps. Long end of the yield curve was flat with a mild downward shift from April end levels. Demand
5Franklin Templeton Investmentswww.franklintempletonindia.com
for long maturity papers from domestic institutional investors has kept the yields lower, leading to a flatter yield curve. Overall, the gilt yield curve continues to offer attractive investment opportunities in the medium term maturity space.
Macro:Inflation: CPI inflation for the 12-month period ended in April 2016 quickened to 5.39% up from 4.83% seen in March. This was attributable to the rise in food price inflation index which stood at 6.32% for April, up from 5.21% in March. Inflation in pulses was steady even as sugar inflation rose to a high single digit number from the previous month. WPI inflation turned positive in April 2016 at 0.34%, after a prolonged deflation (up from -0.85% in March 2016). Fuel continued to witness deflation even as manufacturing segment showed a modest rise in inflation. However, primary articles inflation rate rose in April to 2.34% (from 2.13% in March). The rise in food price inflation on account of drought conditions seen so far may subside if the expectation of above-normal monsoon materializes. However, firming up of global commodity prices, especially crude oil and metals in future, may pose a threat to easing of domestic inflation.
Deficit:Deficit: Trade deficit (merchandise) for April 2016 fell to a 5-year low of USD 4.84 bn, down from USD 5.07 bn seen in March 2016. The falling trend in exports de-growth continued in April (-6.57% YoY) even as imports fell 23.1% (YoY) in April 2016. Overall, the domestic exports growth mirrors the weak exports trend seen in major global economies. Non-petroleum exports fell by 3.7% (YoY) in April 2016. Fall in oil imports (-24%) and non-oil imports (-23%) for April 2016 (YoY) supported the fall in trade deficit.
Debt Outlook:
• The latest release of GDP growth numbers reiterates the fact that India continues to be one of the fastest growing major economies. Positive factors such as the fiscal deficit target being met for FY16 and improving trade deficit figures are however being contrasted by a rise in the consumer inflation and weak industrial production data. Some of the key influencing factors for RBI to continue with its accommodative policy stance this year include progress of monsoon in the country, the resultant impact on inflation as well as transmission of earlier rate cuts by the banks. RBI is taking efforts to bring the systemic liquidity deficit to a neutral level as seen in the form of open market operations being conducted in April and May.
• As transmission of rate cuts takes place going ahead, the resultant reduction in the cost of capital for Indian companies portends an improvement in profitability, which in turn augurs well for the credit environment. Our corporate bond funds continue to offer higher yields, thereby providing higher accrual income opportunities for short-to-medium term. The funds continue to remain well-positioned to participate in the opportunities offered by the widening of corporate yield spreads.
• On the global front, we are faced with a softer global growth along with some events that can lend short term volatility to the market. Another round of rate hike by the US Federal Reserve, fears of Britain exiting the European Union along with anemic growth conditions in major economies may impact risk sentiments in the near term. Domestically, a pick-up in the commercial and passenger vehicle sales indicates a nascent recovery in growth. Revival in the commodity prices, especially crude oil, may bring along an upside risk to domestic inflation. However, a robust monsoon is expected cool off the food price inflation and availability of unutilized industrial capacity could keep output prices subdued even as demand picks up. This in turn may provide room for RBI to cut rates going ahead. We see a possibility of 25 to 50 bps rate cuts in this financial year. We thus remain bullish on medium-to-long duration segment and recommend investors (who can withstand volatility) to consider duration bond / gilt funds for medium to long term.
10 Year Gilt
Call rates
Exchange rate (Rs./$)
31-May-16
7.61
6.20-6.25%
67.26
29-Apr-16
7.64
6.60-6.65%
66.33

6
Franklin India Bluechip Fund FIBCF
INVESTMENT STYLE
FUND MANAGER
Anand Radhakrishnan & Roshi Jain (w.e.f. May 02, 2016)
VOLATILITY MEASURES (3 YEARS)Standard Deviation 4.45%Beta 0.98Sharpe Ratio* 0.61
* Annualised. Risk-free rate assumed to be 6.54% (FBIL OVERNIGHT MIBOR)
#EXPENSE RATIO : 2.21%#EXPENSE RATIO (DIRECT) : 1.37%
MINIMUM INVESTMENT/MULTIPLES FOR NEW INVESTORS
` 5000/1
ADDITIONAL INVESTMENT/MULTIPLES FOR EXISTING INVESTORS
` 1000/1
LOAD STRUCTURE
ENTRY LOAD NilEXIT LOAD In respect of each purchase of Units - 1% if the Units are redeemed/switched-out within one year of allotment
PORTFOLIO
Company Name No. ofshares
Market Value` Lakhs
% ofassets
Company Name No. ofshares
Market Value` Lakhs
% ofassets
1 Year 3 Year 5 Year 7 Year 10 Year Since jan 97
Past performance may or may not be sustained in future. Returns greater than 1 year period are compounded annualized. Dividends assumed to be reinvested and Bonus is
adjusted. Load is not taken into consideration. On account of difference in the type/category, asset allocation or investment strategy, inception dates, performances of these
funds are not strictly comparable. Please refer to www.franklintempletonindia.com for details on performance of all schemes (including Direct Plans). B: Benchmark, AB:
Additional Benchmark.
Sector Allocation - Total Assets Product Label
* Top 10 holdings
SIP - If you had invested 10000 every month in FIBCF`
As on May 31, 2016
The fund manager seeks steady andconsistent growth by focusing on well established, large size companies
NAV as of May 31, 2016
Growth PlanDividend PlanDirect - Growth PlanDirect - Dividend Plan
Franklin Templeton Investmentswww.franklintempletonindia.com
Auto
Tata Motors Ltd* 4500000 20684.25 2.87
Hero Motocorp Ltd 500000 15494.50 2.15
Bajaj Auto Ltd 520000 13615.42 1.89
Mahindra & Mahindra Ltd 1000000 13223.00 1.83
Tata Motors Ltd DVR 800000 2516.00 0.35
Auto Ancillaries
Exide Industries Ltd 5200000 8541.00 1.18
Banks
HDFC Bank Ltd* 4700000 55549.30 7.71
ICICI Bank Ltd* 14000000 34251.00 4.75
Indusind Bank Ltd* 2850000 31431.23 4.36
Yes Bank Ltd* 2700000 27891.00 3.87
Kotak Mahindra Bank Ltd 2750000 20530.13 2.85
Axis Bank Ltd 3700000 19062.40 2.64
State Bank Of India 4700000 9632.65 1.34
Bank Of Baroda 4700000 6711.60 0.93
Punjab National Bank Ltd 4000000 3160.00 0.44
Cement
Grasim Industries Ltd 370000 16120.72 2.24
Ultratech Cement Ltd 440000 14197.48 1.97
Acc Ltd 880000 13455.64 1.87
Construction Project
Larsen And Toubro Ltd* 2050000 30207.78 4.19
Consumer Non Durables
Asian Paints Ltd 1100000 10833.35 1.50
Marico Ltd 3647020 9088.37 1.26
ITC Ltd 2500000 8776.25 1.22
United Breweries Ltd 1000000 7256.00 1.01
Finance
Housing Development Finance
Corporation Ltd 900000 11139.30 1.55
Industrial Products
Cummins India Ltd 1300000 10400.00 1.44
Minerals/Mining
Coal India Ltd 3500000 10199.00 1.41
` 364.1111` 38.7441
` 374.3548` 40.0606
Total amount Invested (Rs) 120,000 360,000 600,000 840,000 1,200,000 2,310,000
Total value as on Mar 31, 2016 (Rs) 118,683 429,638 817,814 1,281,466 2,256,007 25,678,360
Returns -2.03% 11.84% 12.35% 11.86% 12.13% 21.46%
Total value of B:S&P BSE Sensex 114,624 383,196 724,800 1,093,213 1,787,924 8,658,894
B:S&P BSE Sensex Returns -8.21% 4.10% 7.49% 7.41% 7.74% 12.30%
Total value of AB:Nifty 50 115,374 389,546 734,998 1,110,053 1,825,804 8,682,698
AB:Nifty 50 Returns -7.07% 5.19% 8.05% 7.84% 8.14% 12.32%
# The rates specified are the actual average expenses charged for the month of May 2016 . T h e a b o v e r a t i o includes the Service tax on Investment Management Fees .The above ratio also includes, proportionate charge in respect sales beyond T-15 cities subject to maximum of 30 bps on daily net assets, wherever applicable
FUND SIZE (AUM)
Month End ` 7209.33 crores
Monthly Average ` 6957.18 crores
BENCHMARK
S&P BSE SENSEX
INVESTMENT OBJECTIVEThe investment objective of Bluechip Fund is primarily to provide medium to long term capital appreciation.
DATE OF ALLOTMENT
December 1, 1993
TURNOVER
Portfolio Turnover 12.64%
This product is suitable for investors who are seeking*:
• Long term capital appreciation
• A fund that invests in large cap stocks
derao tM e
wo
L
LOW HIGH
Moderately
Investors understand that their principal will be at Moderately High risk
Riskometer
*Investors should consult their financial advisers if in doubt about whether the product is suitable for them.
TYPE OF SCHEME
An Open-end Growth Fund
Total Equity Holding 681,971.28 94.60
Call,cash and other current asset 38,961.97 5.40
TotalAsset 720,933.25 100.00
Oil
Oil & Natural Gas Corp Ltd 6100000 12855.75 1.78
Petroleum Products
Reliance Industries Ltd 2050000 19635.93 2.72
Bharat Petroleum Corporation Ltd 1500000 14707.50 2.04
Indian Oil Corp Ltd 450000 1872.45 0.26
Pharmaceuticals
Dr Reddy'S Laboratories Ltd* 660000 21008.46 2.91
Cadila Healthcare Ltd 3700000 12446.80 1.73
Sun Pharmaceutical Industries Ltd 1500000 11441.25 1.59
Lupin Ltd 300000 4424.25 0.61
Power
Power Grid Corp Of India Ltd 7000000 10500.00 1.46
Retailing
Aditya Birla Fashion And Retail Ltd 2496000 3288.48 0.46
Services
Aditya Birla Nuvo Ltd 500000 5229.75 0.73
Software
Infosys Ltd* 3700000 46200.05 6.41
Cognizant Technology (USA)* 760000 31884.14 4.42
HCL Technologies Ltd 2150000 15905.70 2.21
Wipro Ltd 2200000 11999.90 1.66
Tata Consultancy Services Ltd 280000 7194.32 1.00
Telecom - Services
Bharti Airtel Ltd* 7800000 27409.20 3.80
Total Equity Holding 681971.28 94.60
28.88%
15.70%
9.09%
6.84%
6.07%
5.03%
4.99%
4.19%
3.80%
1.78%
1.55%
1.46%
1.44%
1.41%
1.18%
0.73%
0.46%
5.40%
BANKS
SOFTWARE
AUTO
PHARMACEUTICALS
CEMENT
PETROLEUM PRODUCTS
CONSUMER NON DURABLES
CONSTRUCTION PROJECT
TELECOM - SERVICES
OIL
FINANCE
POWER
INDUSTRIAL PRODUCTS
MINERALS/MINING
AUTO ANCILLARIES
SERVICES
RETAILING
CALL,CASH AND OTHER CURRENT ASSET
Auto
Tata Motors Ltd., DVR 425648 1338.66 2.75
Maruti Suzuki India Ltd. 20000 832.32 1.71
Auto Ancillaries
Apollo Tyres Ltd. 495000 774.43 1.59
Balkrishna Industries Ltd. 80000 532.92 1.09
Banks
HDFC Bank Ltd.* 350000 4136.65 8.49
ICICI Bank Ltd.* 1600000 3914.40 8.03
Federal Bank Ltd.* 3613550 1891.69 3.88
Cement
Grasim Industries Ltd.* 50000 2178.48 4.47
JK Cement Ltd. 251563 1464.22 3.00
Chemicals
Tata Chemicals Ltd.* 1544900 6669.33 13.68
Construction
J. Kumar Infraprojects Ltd. 158000 386.63 0.79
Finance
Bajaj Holdings and Investment Ltd.* 439948 6721.09 13.79
Tata Investment Corp. Ltd.* 559785 2917.32 5.98
Equitas Holdings Ltd. 431554 697.18 1.43
Oil
7
Templeton India Growth Fund TIGF
* Annualised. Risk-free rate assumed to be 6.54% (FBIL OVERNIGHT MIBOR)
LOAD STRUCTURE
ENTRY LOAD NilEXIT LOAD In respect of each purchase of Units - 1% if the Units are redeemed/switched-out within one year of allotment
PORTFOLIO
Company Name No. ofshares
Market Value` Lakhs
% ofassets
Company Name No. ofshares
Market Value` Lakhs
% ofassets
1 Year 3 Year 5 Year 7 Year 10 Year Since Inception
Past performance may or may not be sustained in future. Returns greater than 1 year period are compounded annualized. Dividends assumed to be reinvested and Bonus is adjusted. Load is not taken into consideration. On account of difference in the type/category, asset allocation or investment strategy, inception dates, performances of these funds are not strictly comparable. Please refer to www.franklintempletonindia.com for details on performance of all schemes (including Direct Plans). B: Benchmark, AB: Additional Benchmark.
Sector Allocation - Total Assets Product Label
* Top 10 holdings
SIP - If you had invested 10000 every month in TIGF `
As on May 31, 2016
Franklin Templeton Investmentswww.franklintempletonindia.com
Total amount Invested (Rs) 120,000 360,000 600,000 840,000 1,200,000 2,350,000
Total value as on Mar 31, 2016 (Rs) 116,025 426,772 810,908 1,235,815 2,183,550 18,480,021
Returns -6.09% 11.38% 12.00% 10.85% 11.52% 18.24%
Total value of B:S&P BSE Sensex 114,624 383,196 724,800 1,093,213 1,787,924 8,983,992
B:S&P BSE Sensex Returns -8.21% 4.10% 7.49% 7.41% 7.74% 12.24%
Total value of B:MSCI India Value 118,840 381,468 672,493 963,253 1,581,303 N.A
B:MSCI India Value Returns -1.79% 3.80% 4.51% 3.86% 5.39% N.A
Total value of AB:Nifty 50 115,374 389,546 734,998 1,110,053 1,825,804 9,025,777
AB:Nifty 50 Returns -7.07% 5.19% 8.05% 7.84% 8.14% 12.28%
Oil & Natural Gas Corp. Ltd. 465995 982.08 2.01
Cairn India Ltd. 295000 428.19 0.88
Petroleum Products
Reliance Industries Ltd.* 260000 2490.41 5.11
Pharmaceuticals
Dr. Reddy's Laboratories Ltd.* 65400 2081.75 4.27
Alkem Laboratories Ltd. 32598 411.84 0.84
Software
Infosys Ltd.* 450000 5618.93 11.53
Textiles - Cotton
Vardhman Textiles Ltd. 70600 597.28 1.23
Transportation
Great Eastern Shipping Co. Ltd. 118000 362.85 0.74
Total Equity Holding 47428.64 97.29
This product is suitable for investors who are seeking*:
• Long term capital appreciation
• A fund that invests predominantly in large cap stocks – a value fund
derao tM e
wo
L
LOW HIGH
Moderately
Investors understand that their principal will be at Moderately High risk
Riskometer
*Investors should consult their financial advisers if in doubt about whether the product is suitable for them.
ADDITIONAL INVESTMENT/MULTIPLES FOR EXISTING INVESTORS
` 1000/1
MINIMUM INVESTMENT/MULTIPLES FOR NEW INVESTORS
` 5000/1
#EXPENSE RATIO : 2.73%#EXPENSE RATIO (DIRECT) : 2.07%
# The rates specified are the actual average expenses charged for the month of May 2016 . T h e a b o v e r a t i o includes the Service tax on Investment Management Fees .The above ratio also includes, proportionate charge in respect sales beyond T-15 cities subject to maximum of 30 bps on daily net assets, wherever applicable
**S&P BSE Sensex #MSCI India Value
VOLATILITY MEASURES (3 YEARS)Standard Deviation 5.21%Beta 1.11** 0.97#Sharpe Ratio* 0.47
TURNOVER
Portfolio Turnover 7.32%
FUND MANAGER
Chetan Sehgal
DATE OF ALLOTMENT
September 10, 1996
INVESTMENT OBJECTIVE
The Investment Objective of the Scheme is to provide long-term capital growth to its Unitholders.
INVESTMENT STYLE
Templeton Equity Portfolio Managersadopt a long term disciplined approachto investing and use the widely knownphilosophy of ‘value investing’
NAV as of May 31, 2016
Growth Plan ` 186.4264Dividend Plan ` 58.5852Direct - Growth Plan ` 190.5281Direct - Dividend Plan ` 60.0555
FUND SIZE (AUM)
Month End ` 487.51 crores
Monthly Average ` 474.10 crores
TYPE OF SCHEME
An Open-end Growth Fund
BENCHMARK
S&P BSE SENSEX
MSCI India Value Index
Total Equity Holding 47,428.64 97.29
Call,cash and other current asset 1,322.74 2.71
TotalAsset 48,751.38 100.00
21.20%
20.39%
13.68%
11.53%
7.47%
5.11%
5.11%
4.45%
2.89%
2.68%
1.23%
0.79%
0.74%
2.71%
FINANCE
BANKS
CHEMICALS
SOFTWARE
CEMENT
PHARMACEUTICALS
PETROLEUM PRODUCTS
AUTO
OIL
AUTO ANCILLARIES
TEXTILES - COTTON
CONSTRUCTION
TRANSPORTATION
CALL,CASH AND OTHER CURRENT

8
Franklin India Prima Plus FIPP
* Annualised. Risk-free rate assumed to be 6.54% (FBIL OVERNIGHT MIBOR)
PORTFOLIO
Company Name No. ofshares
Market Value` Lakhs
% ofassets
Company Name No. ofshares
Market Value` Lakhs
% ofassets
1 Year 3 Year 5 Year 7 Year 10 Year Since Inception
Past performance may or may not be sustained in future. Returns greater than 1 year period are compounded annualized. Dividends assumed to be reinvested and Bonus is adjusted. Load is not taken into consideration. On account of difference in the type/category, asset allocation or investment strategy, inception dates, performances of these funds are not strictly comparable. Please refer to www.franklintempletonindia.com for details on performance of all schemes (including Direct Plans). B: Benchmark, AB: Additional Benchmark.
Sector Allocation - Total Assets
Product Label
* Top 10 holdings
SIP - If you had invested 10000 every month in FIPP `
This is a Simple and Performing scheme which is eligible for distribution by new cadre of distributors.
As on May 31, 2016
Franklin Templeton Investmentswww.franklintempletonindia.com
Auto Tata Motors Ltd* 4520000 20776.18 2.62Hero Motocorp Ltd 510000 15804.39 1.99Mahindra & Mahindra Ltd 945000 12495.74 1.58TVS Motor Co Ltd 2900000 8254.85 1.04Auto Ancillaries Amara Raja Batteries Ltd 1340000 11250.64 1.42Exide Industries Ltd 5750000 9444.38 1.19Balkrishna Industries Ltd 1030000 6861.35 0.87Apollo Tyres Ltd 3750000 5866.88 0.74Banks HDFC Bank Ltd* 5120000 60513.28 7.64ICICI Bank Ltd* 13800000 33761.70 4.26Indusind Bank Ltd* 2900000 31982.65 4.04Yes Bank Ltd* 2550000 26341.50 3.32Axis Bank Ltd* 3940000 20298.88 2.56Kotak Mahindra Bank Ltd 2700000 20156.85 2.54Federal Bank Ltd 18300000 9580.05 1.21Karur Vysya Bank Ltd 1930000 8908.88 1.12State Bank Of India 3720000 7624.14 0.96Punjab National Bank Ltd 2980000 2354.20 0.30Cement Ultratech Cement Ltd 440000 14197.48 1.79Grasim Industries Ltd 200000 8713.90 1.10Acc Ltd 555000 8486.23 1.07Chemicals Pidilite Industries Ltd 1400000 9887.50 1.25Aarti Industries Ltd 600000 3116.10 0.39Construction Project Larsen And Toubro Ltd* 1625000 23945.19 3.02Voltas Ltd 2700000 9069.30 1.14Consumer Durables Bata India Ltd 1550000 8872.20 1.12Consumer Non Durables United Breweries Ltd 1880000 13641.28 1.72Marico Ltd 3800000 9469.60 1.20ITC Ltd 2100000 7372.05 0.93Asian Paints Ltd 600000 5909.10 0.75Jubilant Foodworks Ltd 540000 5581.71 0.70Hindustan Unilever Ltd 500000 4241.00 0.54United Spirits Ltd 150000 3705.15 0.47Finance Housing Development Finance Corporation Ltd 700000 8663.90 1.09Credit Analysis & Research Ltd 580000 5767.81 0.73Equitas Holdings Ltd 3000000 4846.50 0.61Gas Gujarat State Petronet Ltd 4200000 5565.00 0.70
Total amount Invested (Rs) 120,000 360,000 600,000 840,000 1,200,000 2,570,000
Total value as on Mar 31, 2016 (Rs) 118,943 471,463 939,680 1,500,864 2,650,659 44,285,000
Returns -1.63% 18.34% 18.00% 16.29% 15.14% 22.30%
Total value of B:Nifty 500 115,322 406,207 768,407 1,152,644 1,884,267 12,161,499
B:Nifty 500 Returns -7.15% 8.01% 9.84% 8.89% 8.73% 12.77%
Total value of AB:Nifty 50 115,374 389,546 734,998 1,110,053 1,825,804 10,695,132
AB:Nifty 50 Returns -7.07% 5.19% 8.05% 7.84% 8.14% 11.79%
Industrial Capital Goods Crompton Greaves Consumer Electricals Ltd 1500000 1984.50 0.25Industrial Products Cummins India Ltd 1185000 9480.00 1.20Skf India Ltd 640000 7916.48 1.00Greaves Cotton Ltd 3550000 4824.45 0.61Shakti Pumps India Ltd 400000 630.40 0.08Media & Entertainment Jagran Prakashan Ltd 3400000 5751.10 0.73Minerals/Mining Gujarat Mineral Dev Corp Ltd 2180000 1440.98 0.18Petroleum Products Bharat Petroleum Corporation Ltd 1570000 15393.85 1.94Pharmaceuticals Dr Reddy'S Laboratories Ltd* 650000 20690.15 2.61Cadila Healthcare Ltd 3835000 12900.94 1.63Torrent Pharmaceuticals Ltd 900000 12075.75 1.52Sun Pharmaceutical Industries Ltd 1360000 10373.40 1.31Ipca Laboratories Ltd 497059 2136.86 0.27Retailing Aditya Birla Fashion And Retail Ltd 5500000 7246.25 0.91Software Infosys Ltd* 2750000 34337.88 4.33HCL Technologies Ltd 2378870 17598.88 2.22Cognizant Technology (USA) 370000 15522.54 1.96Wipro Ltd 1920000 10472.64 1.32Tata Consultancy Services Ltd 290000 7451.26 0.94Telecom - Services Bharti Airtel Ltd* 8880000 31204.32 3.94Tata Communications Ltd 1475000 6744.44 0.85Textile Products Arvind Ltd 3100000 9902.95 1.25Transportation Gujarat Pipavav Port Ltd 6400000 10249.60 1.29Gateway Distriparks Ltd 1500000 4418.25 0.56Unlisted Quantum Information Services 38000 0.60 0.00Numero Uno International Ltd 73500 0.01 0.00Quantum Information Systems 45000 0.00 0.00Total Equity Holding 734,075.99 92.65
#Awaiting Listing
*Investors should consult their financial advisers if in doubt about whether the product is suitable for them.
This product is suitable for investors who are seeking*:
• Long term capital appreciation
• Primarily a large cap fund with some allocation to small / mid cap stocks
derao tM e
wo
L
LOW HIGH
Moderately
Investors understand that their principal will be at Moderately High risk
Riskometer
LOAD STRUCTURE
ENTRY LOAD NilEXIT LOAD In respect of each purchase of Units - 1% if the Units are redeemed/switched-out within one year of allotment
` 1000/1
ADDITIONAL INVESTMENT/MULTIPLES FOR EXISTING INVESTORS
` 5000/1
MINIMUM INVESTMENT/MULTIPLES FOR NEW INVESTORS
#EXPENSE RATIO : 2.29%#EXPENSE RATIO (DIRECT) : 1.15%
# The rates specified are the actual average expenses charged for the month of May 2016 . T h e a b o v e r a t i o includes the Service tax on Investment Management Fees .The above ratio also includes, proportionate charge in respect sales beyond T-15 cities subject to maximum of 30 bps on daily net assets, wherever applicable
INVESTMENT STYLE
T h e f u n d m a n a g e r s e e k s c a p i t a l appreciation over the long-term byfocusing on wealth creating companies(companies that generate return on capital in excess of their cost of capital) across all sectors.
TURNOVER
Portfolio Turnover 12.82%
NAV as of May 31, 2016
Growth Plan ` 454.9931Dividend Plan ` 34.9443Direct - Growth Plan ` 468.4782Direct - Dividend Plan ` 36.1254
FUND MANAGER
Anand Radhakrishnan & R. Janakiraman
DATE OF ALLOTMENT
September 29, 1994
INVESTMENT OBJECTIVE
The investment objective of Prima Plus is to provide growth of capital plus regular dividend through a diversified portfolio of equities, fixed income securities and money market instruments.
FUND SIZE (AUM)
Month End ` 7923.15 crores
Monthly Average ` 7594.73 crores
VOLATILITY MEASURES (3 YEARS)Standard Deviation 4.37%Beta 0.90Sharpe Ratio* 1.07
TYPE OF SCHEME
An Open-end growth scheme
BENCHMARK
Nifty 500
Total Equity Holding 734,075.99 92.65
Call,cash and other current asset 58,239.48 7.35
TotalAsset 792,315.47 100.00
27.96%
10.78%
7.34%
7.24%
6.30%
4.79%
4.22%
4.17%
3.96%
2.88%
2.43%
1.94%
1.85%
1.64%
1.25%
1.12%
0.92%
0.73%
0.70%
0.25%
0.18%
0.00%
7.35%
BANKS
SOFTWARE
PHARMACEUTICALS
AUTO
CONSUMER NON DURABLES
TELECOM - SERVICES
AUTO ANCILLARIES
CONSTRUCTION PROJECT
CEMENT
INDUSTRIAL PRODUCTS
FINANCE
PETROLEUM PRODUCTS
TRANSPORTATION
CHEMICALS
TEXTILE PRODUCTS
CONSUMER DURABLES
RETAILING
MEDIA & ENTERTAINMENT
GAS
INDUSTRIAL CAPITAL GOODS
MINERALS/MINING
UNLISTED
CALL,CASH AND OTHER CURRENT
This product is suitable for investors who are seeking*:
• Long term capital appreciation
• A fund that invests in mid and small cap stocks
derao tM e
wo
L
LOW HIGH
Moderately
Investors understand that their principal will be at Moderately High risk
Riskometer
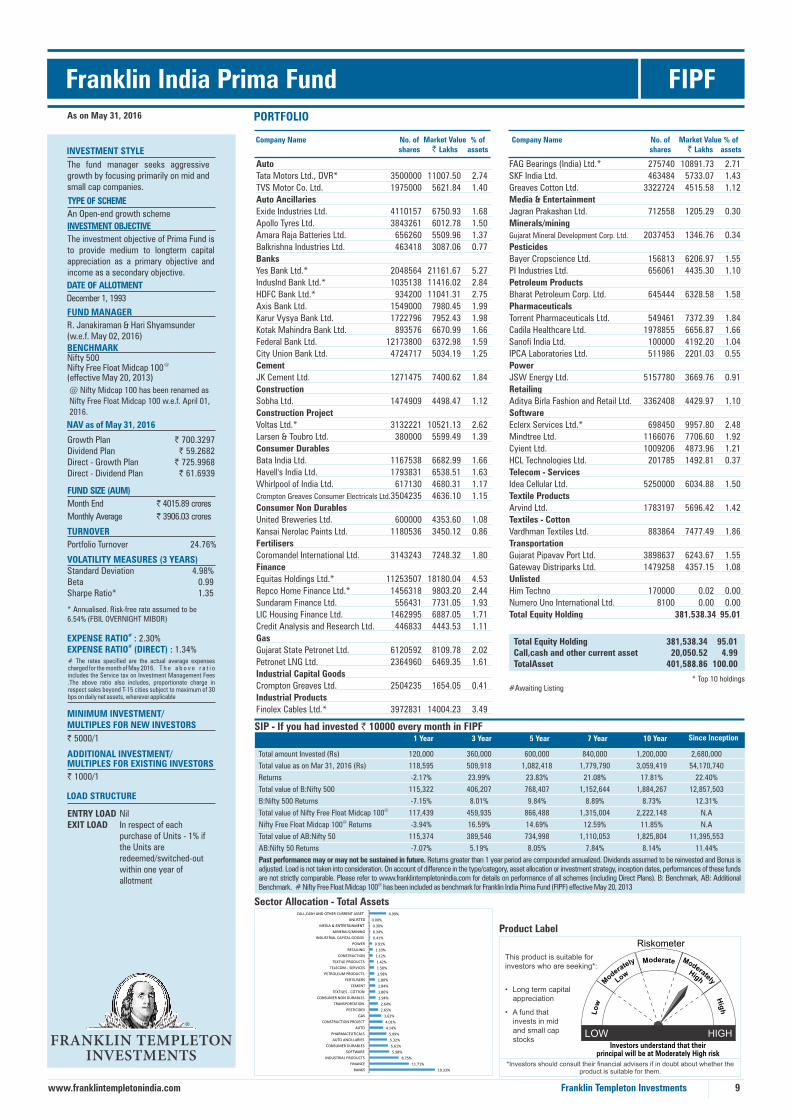
9
Franklin India Prima Fund FIPFPORTFOLIO
Company Name No. ofshares
Market Value` Lakhs
% ofassets
Company Name No. ofshares
Market Value` Lakhs
% ofassets
Past performance may or may not be sustained in future. Returns greater than 1 year period are compounded annualized. Dividends assumed to be reinvested and Bonus is adjusted. Load is not taken into consideration. On account of difference in the type/category, asset allocation or investment strategy, inception dates, performances of these funds are not strictly comparable. Please refer to www.franklintempletonindia.com for details on performance of all schemes (including Direct Plans). B: Benchmark, AB: Additional
@Benchmark. # Nifty Free Float Midcap 100 has been included as benchmark for Franklin India Prima Fund (FIPF) effective May 20, 2013
Sector Allocation - Total Assets
Product Label
SIP - If you had invested 10000 every month in FIPF`
* Annualised. Risk-free rate assumed to be 6.54% (FBIL OVERNIGHT MIBOR)
LOAD STRUCTURE
ENTRY LOAD NilEXIT LOAD In respect of each purchase of Units - 1% if the Units are redeemed/switched-out within one year of allotment
As on May 31, 2016
Franklin Templeton Investmentswww.franklintempletonindia.com
1 Year 3 Year 5 Year 7 Year 10 Year Since Inception
Total amount Invested (Rs) 120,000 360,000 600,000 840,000 1,200,000 2,680,000
Total value as on Mar 31, 2016 (Rs) 118,595 509,918 1,082,418 1,779,790 3,059,419 54,170,740
Returns -2.17% 23.99% 23.83% 21.08% 17.81% 22.40%
Total value of B:Nifty 500 115,322 406,207 768,407 1,152,644 1,884,267 12,857,503
B:Nifty 500 Returns -7.15% 8.01% 9.84% 8.89% 8.73% 12.31%@Total value of Nifty Free Float Midcap 100 117,439 459,935 866,488 1,315,004 2,222,148 N.A
@Nifty Free Float Midcap 100 Returns -3.94% 16.59% 14.69% 12.59% 11.85% N.A
Total value of AB:Nifty 50 115,374 389,546 734,998 1,110,053 1,825,804 11,395,553
AB:Nifty 50 Returns -7.07% 5.19% 8.05% 7.84% 8.14% 11.44%
FAG Bearings (India) Ltd.* 275740 10891.73 2.71
SKF India Ltd. 463484 5733.07 1.43
Greaves Cotton Ltd. 3322724 4515.58 1.12
Media & Entertainment
Jagran Prakashan Ltd. 712558 1205.29 0.30
Minerals/mining
Gujarat Mineral Development Corp. Ltd. 2037453 1346.76 0.34
Pesticides
Bayer Cropscience Ltd. 156813 6206.97 1.55
PI Industries Ltd. 656061 4435.30 1.10
Petroleum Products
Bharat Petroleum Corp. Ltd. 645444 6328.58 1.58
Pharmaceuticals
Torrent Pharmaceuticals Ltd. 549461 7372.39 1.84
Cadila Healthcare Ltd. 1978855 6656.87 1.66
Sanofi India Ltd. 100000 4192.20 1.04
IPCA Laboratories Ltd. 511986 2201.03 0.55
Power
JSW Energy Ltd. 5157780 3669.76 0.91
Retailing
Aditya Birla Fashion and Retail Ltd. 3362408 4429.97 1.10
Software
Eclerx Services Ltd.* 698450 9957.80 2.48
Mindtree Ltd. 1166076 7706.60 1.92
Cyient Ltd. 1009206 4873.96 1.21
HCL Technologies Ltd. 201785 1492.81 0.37
Telecom - Services
Idea Cellular Ltd. 5250000 6034.88 1.50
Textile Products
Arvind Ltd. 1783197 5696.42 1.42
Textiles - Cotton
Vardhman Textiles Ltd. 883864 7477.49 1.86
Transportation
Gujarat Pipavav Port Ltd. 3898637 6243.67 1.55
Gateway Distriparks Ltd. 1479258 4357.15 1.08
Unlisted
Him Techno 170000 0.02 0.00
Numero Uno International Ltd. 8100 0.00 0.00
Total Equity Holding 381,538.34 95.01
Auto
Tata Motors Ltd., DVR* 3500000 11007.50 2.74
TVS Motor Co. Ltd. 1975000 5621.84 1.40
Auto Ancillaries
Exide Industries Ltd. 4110157 6750.93 1.68
Apollo Tyres Ltd. 3843261 6012.78 1.50
Amara Raja Batteries Ltd. 656260 5509.96 1.37
Balkrishna Industries Ltd. 463418 3087.06 0.77
Banks
Yes Bank Ltd.* 2048564 21161.67 5.27
IndusInd Bank Ltd.* 1035138 11416.02 2.84
HDFC Bank Ltd.* 934200 11041.31 2.75
Axis Bank Ltd. 1549000 7980.45 1.99
Karur Vysya Bank Ltd. 1722796 7952.43 1.98
Kotak Mahindra Bank Ltd. 893576 6670.99 1.66
Federal Bank Ltd. 12173800 6372.98 1.59
City Union Bank Ltd. 4724717 5034.19 1.25
Cement
JK Cement Ltd. 1271475 7400.62 1.84
Construction
Sobha Ltd. 1474909 4498.47 1.12
Construction Project
Voltas Ltd.* 3132221 10521.13 2.62
Larsen & Toubro Ltd. 380000 5599.49 1.39
Consumer Durables
Bata India Ltd. 1167538 6682.99 1.66
Havell's India Ltd. 1793831 6538.51 1.63
Whirlpool of India Ltd. 617130 4680.31 1.17
Crompton Greaves Consumer Electricals Ltd. 3504235 4636.10 1.15
Consumer Non Durables
United Breweries Ltd. 600000 4353.60 1.08
Kansai Nerolac Paints Ltd. 1180536 3450.12 0.86
Fertilisers
Coromandel International Ltd. 3143243 7248.32 1.80
Finance
Equitas Holdings Ltd.* 11253507 18180.04 4.53
Repco Home Finance Ltd.* 1456318 9803.20 2.44
Sundaram Finance Ltd. 556431 7731.05 1.93
LIC Housing Finance Ltd. 1462995 6887.05 1.71
Credit Analysis and Research Ltd. 446833 4443.53 1.11
Gas
Gujarat State Petronet Ltd. 6120592 8109.78 2.02
Petronet LNG Ltd. 2364960 6469.35 1.61
Industrial Capital Goods
Crompton Greaves Ltd. 2504235 1654.05 0.41
Industrial Products
Finolex Cables Ltd.* 3972831 14004.23 3.49
* Top 10 holdings#Awaiting Listing
*Investors should consult their financial advisers if in doubt about whether the product is suitable for them.
ADDITIONAL INVESTMENT/MULTIPLES FOR EXISTING INVESTORS
` 1000/1
MINIMUM INVESTMENT/MULTIPLES FOR NEW INVESTORS
` 5000/1
#EXPENSE RATIO :
2.30%#EXPENSE RATIO (DIRECT) : 1.34%
# The rates specified are the actual average expenses charged for the month of May 2016 . T h e a b o v e r a t i o includes the Service tax on Investment Management Fees .The above ratio also includes, proportionate charge in respect sales beyond T-15 cities subject to maximum of 30 bps on daily net assets, wherever applicable
VOLATILITY MEASURES (3 YEARS)Standard Deviation 4.98%Beta 0.99Sharpe Ratio* 1.35
INVESTMENT OBJECTIVE
The investment objective of Prima Fund is to provide medium to longterm capital appreciation as a primary objective and income as a secondary objective.
INVESTMENT STYLE
The fund manager seeks aggressivegrowth by focusing primarily on mid andsmall cap companies.
TURNOVER
Portfolio Turnover 24.76%
NAV as of May 31, 2016
Growth Plan ` 700.3297Dividend Plan ` 59.2682Direct - Growth Plan ` 725.9968Direct - Dividend Plan ` 61.6939
FUND MANAGER
R. Janakiraman & Hari Shyamsunder (w.e.f. May 02, 2016)
DATE OF ALLOTMENT
December 1, 1993
FUND SIZE (AUM)
Month End ` 4015.89 crores
Monthly Average ` 3906.03 crores
TYPE OF SCHEME
An Open-end growth scheme
BENCHMARKNifty 500
@Nifty Free Float Midcap 100(effective May 20, 2013)
Total Equity Holding 381,538.34 95.01Call,cash and other current asset 20,050.52 4.99TotalAsset 401,588.86 100.00
@ Nifty Midcap 100 has been renamed as
Nifty Free Float Midcap 100 w.e.f. April 01,
2016.
19.33%
11.71%
8.75%
5.98%
5.61%
5.32%
5.09%
4.14%
4.01%
3.63%
2.65%
2.64%
1.94%
1.86%
1.84%
1.80%
1.58%
1.50%
1.42%
1.12%
1.10%
0.91%
0.41%
0.34%
0.30%
0.00%
4.99%
BANKS
FINANCE
INDUSTRIAL PRODUCTS
SOFTWARE
CONSUMER DURABLES
AUTO ANCILLARIES
PHARMACEUTICALS
AUTO
CONSTRUCTION PROJECT
GAS
PESTICIDES
TRANSPORTATION
CONSUMER NON DURABLES
TEXTILES - COTTON
CEMENT
FERTILISERS
PETROLEUM PRODUCTS
TELECOM - SERVICES
TEXTILE PRODUCTS
CONSTRUCTION
RETAILING
POWER
INDUSTRIAL CAPITAL GOODS
MINERALS/MINING
MEDIA & ENTERTAINMENT
UNLISTED
CALL,CASH AND OTHER CURRENT ASSET

This product is suitable for investors who are seeking*:
• Long term capital appreciation
• A fund that invests in stocks of companies across the market cap range
derao tM e
wo
L
LOW HIGH
Moderately
Investors understand that their principal will be at Moderately High risk
Riskometer
10
Franklin India Flexi Cap Fund FIFCFPORTFOLIO
Company Name No. ofshares
Market Value` Lakhs
% ofassets
Company Name No. ofshares
Market Value` Lakhs
% ofassets
Sector Allocation - Total Assets
Product Label
SIP - If you had invested 10000 every month in FIFCF`
* Annualised. Risk-free rate assumed to be 6.54% (FBIL OVERNIGHT MIBOR)
LOAD STRUCTURE
ENTRY LOAD NilEXIT LOAD In respect of each purchase of Units - 1% if the Units are redeemed/switched-out within one year of allotment
This is a Simple and Performing scheme which is eligible for distribution by new cadre of distributors.
* Top 10 holdings
Past performance may or may not be sustained in future. Returns greater than 1 year period are compounded annualized. Dividends assumed to be reinvested and Bonus is adjusted. Load is not taken into consideration. On account of difference in the type/category, asset allocation or investment strategy, inception dates, performances of these funds are not strictly comparable. Please refer to www.franklintempletonindia.com for details on performance of all schemes (including Direct Plans). B: Benchmark, AB: Additional Benchmark.
As on May 31, 2016
Franklin Templeton Investmentswww.franklintempletonindia.com
Petronet Lng Ltd 1475100 4035.14 1.41
Industrial Products
Skf India Ltd 270387 3344.55 1.17
Greaves Cotton Ltd 1808796 2458.15 0.86
Petroleum Products
Bharat Petroleum Corporation Ltd 750000 7353.75 2.57
Pharmaceuticals
Dr Reddy'S Laboratories Ltd* 257880 8208.58 2.87
Torrent Pharmaceuticals Ltd 470148 6308.21 2.20
Cadila Healthcare Ltd 1437500 4835.75 1.69
Sun Pharmaceutical Industries Ltd 500000 3813.75 1.33
Retailing
Aditya Birla Fashion And Retail Ltd 858000 1130.42 0.39
Services
Aditya Birla Nuvo Ltd 165000 1725.82 0.60
Software
Cognizant Technology (USA)* 340000 14263.96 4.98
Infosys Ltd* 971188 12126.74 4.23
HCL Technologies Ltd 760000 5622.48 1.96
Tata Consultancy Services Ltd 150000 3854.10 1.35
Mindtree Ltd 447020 2954.36 1.03
Telecom - Services
Bharti Airtel Ltd 1800000 6325.20 2.21
Idea Cellular Ltd 3787819 4354.10 1.52
Transportation
Gujarat Pipavav Port Ltd 3068480 4914.17 1.72
Total Equity Holding 266380.11 92.99
1 Year 3 Year 5 Year 7 Year 10 Year Since Inception
Total amount Invested (Rs) 120,000 360,000 600,000 840,000 1,200,000 1,330,000
Total value as on Mar 31, 2016 (Rs) 117,022 461,022 915,873 1,447,190 2,525,816 3,172,103
Returns -4.57% 16.76% 16.95% 15.27% 14.25% 14.85%
Total value of B:Nifty 500 115,322 406,207 768,407 1,152,644 1,884,267 2,285,512
B:Nifty 500 Returns -7.15% 8.01% 9.84% 8.89% 8.73% 9.38%
Total value of AB:Nifty 50 115,374 389,546 734,998 1,110,053 1,825,804 2,246,365
AB:Nifty 50 Returns -7.07% 5.19% 8.05% 7.84% 8.14% 9.09%
Auto
Tata Motors Ltd DVR* 2602293 8184.21 2.86
Mahindra & Mahindra Ltd 550000 7272.65 2.54
Maruti Suzuki India Ltd 133036 5536.43 1.93
TVS Motor Co Ltd 1449436 4125.82 1.44
Hero Motocorp Ltd 125000 3873.63 1.35
Auto Ancillaries
Amara Raja Batteries Ltd 643500 5402.83 1.89
Balkrishna Industries Ltd 516132 3438.21 1.20
Exide Industries Ltd 42110 69.17 0.02
Banks
HDFC Bank Ltd* 2225250 26300.23 9.18
Axis Bank Ltd* 2565000 13214.88 4.61
Indusind Bank Ltd* 941396 10382.19 3.62
Yes Bank Ltd* 998596 10315.50 3.60
Kotak Mahindra Bank Ltd* 1275000 9518.51 3.32
ICICI Bank Ltd 2350000 5749.28 2.01
State Bank Of India 2136000 4377.73 1.53
Cement
Grasim Industries Ltd 175000 7624.66 2.66
Ultratech Cement Ltd 150000 4840.05 1.69
Construction Project
Larsen And Toubro Ltd* 809000 11921.02 4.16
Consumer Durables
Titan Co Ltd 1097009 3954.72 1.38
Consumer Non Durables
Glaxosmithkline Consumer Healthcare Ltd 80244 4611.06 1.61
Kansai Nerolac Paints Ltd 1259938 3682.17 1.29
United Spirits Ltd 110000 2717.11 0.95
Kaveri Seed Co Ltd 220655 962.28 0.34
Finance
Repco Home Finance Ltd 505000 3399.41 1.19
Credit Analysis & Research Ltd 250000 2486.13 0.87
Gas
Gujarat State Petronet Ltd 3615883 4791.04 1.67
*Investors should consult their financial advisers if in doubt about whether the product is suitable for them.
#EXPENSE RATIO : 2.31%#EXPENSE RATIO (DIRECT) : 1.50%
# The rates specified are the actual average expenses charged for the month of May 2016 . T h e a b o v e r a t i o includes the Service tax on Investment Management Fees .The above ratio also includes, proportionate charge in respect sales beyond T-15 cities subject to maximum of 30 bps on daily net assets, wherever applicable
ADDITIONAL INVESTMENT/MULTIPLES FOR EXISTING INVESTORS
` 1000/1
MINIMUM INVESTMENT/MULTIPLES FOR NEW INVESTORS
` 5000/1
TURNOVER
Portfolio Turnover 20.30%
NAV as of May 31, 2016
Growth Plan ` 62.4641Dividend Plan ` 16.0445Direct - Growth Plan ` 63.9346Direct - Dividend Plan ` 16.4981
FUND MANAGERLakshmikanth Reddy & R. Janakiraman (w.e.f. May 02, 2016)
DATE OF ALLOTMENT
March 2, 2005
INVESTMENT OBJECTIVE
FIFCF is an open-end diversified equity fund that seeks to provide medium to long-term capital appreciation by investing in s tocks ac ross the ent i re market capitalisation range.
INVESTMENT STYLE
The fund manager will invest in companies based on a research driven, bottom-up stock selection process, irrespective of their market capitalization and sectors.
VOLATILITY MEASURES (3 YEARS)Standard Deviation 4.50%Beta 0.92Sharpe Ratio* 1.03
FUND SIZE (AUM)
Month End ` 2864.49 crores
Monthly Average ` 2791.87 crores
TYPE OF SCHEME
An Open-end Diversified Equity Fund
BENCHMARK
Nifty 500
Total Equity Holding 266,380.11 92.99
Call,cash and other current asset 20,069.05 7.01
TotalAsset 286,449.16 100.00
27.88%
13.55%
10.12%
8.09%
4.35%
4.18%
4.16%
3.73%
3.11%
3.08%
2.57%
2.05%
2.03%
1.72%
1.38%
0.60%
0.39%
7.01%
BANKS
SOFTWARE
AUTO
PHARMACEUTICALS
CEMENT
CONSUMER NON DURABLES
CONSTRUCTION PROJECT
TELECOM - SERVICES
AUTO ANCILLARIES
GAS
PETROLEUM PRODUCTS
FINANCE
INDUSTRIAL PRODUCTS
TRANSPORTATION
CONSUMER DURABLES
SERVICES
RETAILING
CALL,CASH AND OTHER CURRENT ASSET

This product is suitable for investors who are seeking*:
• Long term capital appreciation
• A fund that invests in stocks of companies / sectors with high growth rates or above average potential
derao tM e
wo
L
LOW HIGH
Moderately
Investors understand that their principal will be at Moderately High risk
Riskometer
Franklin India High Growth Companies Fund FIHGCFPORTFOLIO
Company Name No. ofshares
Market Value` Lakhs
% ofassets
Company Name No. ofshares
Market Value` Lakhs
% ofassets
Sector Allocation - Total Assets
Product Label
SIP - If you had invested 10000 every month in FIHGCF `
* Top 10 holdings
Past performance may or may not be sustained in future. Returns greater than 1 year period are compounded annualized. Dividends assumed to be reinvested and Bonus is adjusted. Load is not taken into consideration. On account of difference in the type/category, asset allocation or investment strategy, inception dates, performances of these funds are not strictly comparable. Please refer to www.franklintempletonindia.com for details on performance of all schemes (including Direct Plans). B: Benchmark, AB: Additional Benchmark.
* Annualised. Risk-free rate assumed to be 6.54% (FBIL OVERNIGHT MIBOR)
ENTRY LOAD NilEXIT LOAD 1% if redeemed/switched- out within two years of allotment
11
As on May 31, 2016
Franklin Templeton Investmentswww.franklintempletonindia.com
Auto
Tata Motors Ltd DVR* 9500000 29877.50 6.57
TVS Motor Co Ltd* 6800000 19356.20 4.26
Mahindra & Mahindra Ltd 1050000 13884.15 3.05
Maruti Suzuki India Ltd 165000 6866.64 1.51
Bajaj Auto Ltd 125000 3272.94 0.72
Banks
State Bank Of India* 19000000 38940.50 8.56
HDFC Bank Ltd* 3250000 38411.75 8.45
ICICI Bank Ltd* 15000000 36697.50 8.07
Axis Bank Ltd* 6750000 34776.00 7.65
Bank Of Baroda 5750000 8211.00 1.81
Federal Bank Ltd 15000000 7852.50 1.73
Punjab National Bank Ltd 4500000 3555.00 0.78
Cement
Ultratech Cement Ltd 275000 8873.43 1.95
Orient Cement Ltd 3700000 5945.90 1.31
JK Lakshmi Cement Ltd 1200000 4067.40 0.89
Construction
ITD Cementation India Ltd 1700000 2221.05 0.49
Construction Project
Larsen And Toubro Ltd* 1250000 18419.38 4.05
Consumer Durables
Whirlpool Of India Ltd* 2009000 15236.26 3.35
Consumer Non Durables
United Spirits Ltd 100000 2470.10 0.54
Finance
Equitas Holdings Ltd 4000000 6462.00 1.42
Gas
Gail India Ltd 900000 3334.05 0.73
Hotels/Resorts & Other Recreational Activities
EIH Ltd 4000000 4246.00 0.93
Industrial Products
Skf India Ltd 575000 7112.46 1.56
FAG Bearings (India) Ltd 150000 5925.00 1.30
KEI Industries Ltd 3300000 3534.30 0.78
Timken India Ltd 550000 3012.90 0.66
Pesticides
Bayer Cropscience Ltd 159793 6324.93 1.39
Petroleum Products
Indian Oil Corp Ltd 250000 1040.25 0.23
Pharmaceuticals
Sanofi India Ltd 156000 6539.83 1.44
Retailing
Aditya Birla Fashion And Retail Ltd 7589000 9998.51 2.20
Software
Cognizant Technology (USA) 325000 13634.67 3.00
Tech Mahindra Ltd 2138288 11554.24 2.54
Hexaware Technologies Ltd 1160000 2518.36 0.55
Telecom - Services
Bharti Airtel Ltd* 5200000 18272.80 4.02
Idea Cellular Ltd* 14000000 16093.00 3.54
Transportation
Gujarat Pipavav Port Ltd 900000 1441.35 0.32
Total Equity Holding 419,979.83 92.37
*Investors should consult their financial advisers if in doubt about whether the product is suitable for them.
INVESTMENT STYLE
The fund manager seeks high growth by focussing on companies/sectors with high growth rates or potential.
INVESTMENT OBJECTIVEFIHGCF is an open-end diversified equity fund that seeks to achieve capita l appreciation through investments in Indian companies/sectors with high growth rates or potential.
DATE OF ALLOTMENT
July 26, 2007
FUND MANAGER
Roshi Jain & Anand Radhakrishnan
(w.e.f. May 02, 2016)
#EXPENSE RATIO : 2.30%1.02%#EXPENSE RATIO (DIRECT) :
# The rates specified are the actual average expenses charged for the month of May 2016 . T h e a b o v e r a t i o includes the Service tax on Investment Management Fees . The above ratio also includes, proportionate charge in respect sales beyond T-15 cities subject to maximum of 30 bps on daily net assets, wherever applicable
LOAD STRUCTURE
ADDITIONAL INVESTMENT/MULTIPLES FOR EXISTING INVESTORS
` 1000/1
MINIMUM INVESTMENT/MULTIPLES FOR NEW INVESTORS
` 5000/1
NAV as of May 31, 2016
Growth Plan ` 29.0640Dividend Plan ` 22.1405Direct - Growth Plan ` 30.0873Direct - Dividend Plan ` 22.9891
TURNOVER
Portfolio Turnover 32.03%
VOLATILITY MEASURES (3 YEARS)Standard Deviation 5.34%Beta 1.06Sharpe Ratio* 1.09
FUND SIZE (AUM)
Month End ` 4546.67 crores
Monthly Average ` 4347.90 crores
TYPE OF SCHEME
An Open-end Diversified Equity Fund
BENCHMARK
Nifty 500
Total Equity Holding 419,979.83 92.37
Call,cash and other current asset 34,686.69 7.63
TotalAsset 454,666.52 100.00
1 Year 3 Year 5 Year 7 Year Since Inception
Total amount Invested (Rs) 120,000 360,000 600,000 840,000 1,050,000
Total value as on Mar 31, 2016 (Rs) 114,813 484,107 1,018,795 1,631,820 2,316,310
Returns -7.92% 20.23% 21.32% 18.64% 17.45%
Total value of B:Nifty 500 115,322 406,207 768,407 1,152,644 1,563,697
B:Nifty 500 Returns -7.15% 8.01% 9.84% 8.89% 8.87%
Total value of AB:Nifty 50 115,374 389,546 734,998 1,110,053 1,505,236
AB:Nifty 50 Returns -7.07% 5.19% 8.05% 7.84% 8.03%
37.05%
16.11%
7.56%
6.09%
4.31%
4.15%
4.05%
3.35%
2.20%
1.44%
1.42%
1.39%
0.93%
0.73%
0.54%
0.49%
0.32%
0.23%
7.63%
BANKS
AUTO
TELECOM - SERVICES
SOFTWARE
INDUSTRIAL PRODUCTS
CEMENT
CONSTRUCTION PROJECT
CONSUMER DURABLES
RETAILING
PHARMACEUTICALS
FINANCE
PESTICIDES
HOTELS/RESORTS & OTHER RECREATIONAL ACTIVITIES
GAS
CONSUMER NON DURABLES
CONSTRUCTION
TRANSPORTATION
PETROLEUM PRODUCTS
CALL,CASH AND OTHER CURRENT ASSET

This product is suitable for investors who are seeking*:
• Long term capital appreciation
• A fund that invests in stocks of Asian companies / sectors (excluding Japan)
derao tM e
wo
L
LOW HIGH
Moderately
Investors understand that their principal will be at High risk
Riskometer
Franklin Asian Equity Fund FAEFPORTFOLIO
Company Name No. ofshares
Market Value` Lakhs
% ofassets
Company Name No. ofshares
Market Value` Lakhs
% ofassets
Sector Allocation - Total Assets
SIP - If you had invested 10000 every month in FAEF `
Product Label
Past performance may or may not be sustained in future. Returns greater than 1 year period are compounded annualized. Dividends assumed to be reinvested and Bonus is adjusted. Load is not taken into consideration. On account of difference in the type/category, asset allocation or investment strategy, inception dates, performances of these funds are not strictly comparable. Please refer to www.franklintempletonindia.com for details on performance of all schemes (including Direct Plans). B: Benchmark, AB: Additional Benchmark.
* Annualised. Risk-free rate assumed to be 6.54% (FBIL OVERNIGHT MIBOR)
ENTRY LOAD NilEXIT LOAD 1% if redeemed/switched- out within three years of allotment
12
* Top 10 holdings
As on May 31, 2016
*Includes service tax on investment management fees
Franklin Templeton Investmentswww.franklintempletonindia.com
Auto Hyundai Motor Co (South Korea) 2669 210.26 2.09Tata Motors Ltd 18325 84.23 0.84Banks Kasikornbank PCL (Thailand) 72051 238.59 2.37Shinhan Financial (South Korea) 10551 235.66 2.34HDFC Bank Ltd 18304 216.33 2.15Yes Bank Ltd 17751 183.37 1.82BK Central Asia (Indonesia) 284861 182.09 1.81Chinatrust Financial Holding Co (Taiwan) 452553 159.40 1.58DBS Group Holdings (Singapore) 20446 154.37 1.53Security Bank (Philippines) 47264 137.90 1.37Cement Siam Cement (Thailand) 19812 180.41 1.79Construction China Overseas Land & Investment (Hong Kong) 62196 125.31 1.24Consumer Durables Titan Co Ltd 33000 118.97 1.18LG Household & Health Care (South Korea) 167 99.59 0.99Largan Precision (Taiwan) 1485 83.20 0.83Nestle Lanka (Sri Lanka) 7500 81.70 0.81Giant Manufacturing Co (Taiwan) 14255 57.11 0.57Consumer Non Durables L'occitane International SA (Hong Kong) 164890 187.63 1.86Samsonite (Hong Kong) 72600 145.33 1.44Hindustan Unilever Ltd 15852 134.46 1.33Nestle (Malaysia) 7709 95.36 0.95Universal Robina (Philippines) 30900 86.60 0.86Diversified Consumer Service Tal Education Group (USA) 2509 95.13 0.94Finance AIA Group (Hong Kong)* 103124 404.83 4.02Meritz Fire & Marine Insurance (South Korea)* 29295 262.22 2.60Singapore Exchange (Singapore) 43336 163.59 1.62Mahindra & Mahindra Financial Services Ltd 43000 138.27 1.37Motilal Oswal Financial Services Ltd 38500 127.44 1.26Ping An Insurance (Hong Kong) 31310 94.08 0.93Credit Analysis & Research Ltd 1851 18.41 0.18Hardware Taiwan Semiconductor Manufacturing (Taiwan)* 272178 877.37 8.70Samsung Electronics (South Korea)* 910 663.97 6.59Silergy Corp (Taiwan) 21570 171.50 1.70Ennoconn Corp (Taiwan) 11749 107.45 1.07Hotels/Resorts & Other Recreational Activities Indian Hotels Co Ltd 88750 104.37 1.04Industrial Products Cummins India Ltd 15581 124.65 1.24Bharat Forge Ltd 11364 85.84 0.85
*Investors should consult their financial advisers if in doubt about whether the product is suitable for them.
Media & Entertainment Naver Corp ( South Korea)* 600 243.96 2.42Surya Citra (Indonesia) 1234500 203.35 2.02Jagran Prakashan Ltd 77491 131.08 1.30Major Cineplex (Thailand) 170000 100.75 1.00BEC World (Thailand) 706 0.33 0.00Pharmaceuticals Sun Pharmaceutical Industries Ltd* 36500 278.40 2.76Retailing Alibaba Group (USA)* 6173 335.72 3.33CP All PCL (Thailand) 212100 198.53 1.97Techtronics Industries (Hong Kong) 59800 161.33 1.60Matahari Department Store (Indonesia) 115000 107.30 1.06Poya Co (Taiwan) 8000 60.47 0.60Trent Ltd 1419 23.19 0.23Software Tencent Holdings (Hong Kong)* 30600 456.69 4.53Baidu INC (ADR)* 2518 312.90 3.10Cognizant Technology (USA) 5650 237.03 2.35Textile Products Page Industries Ltd 176 24.28 0.24Transportation Citrip.com (USA)* 8698 268.16 2.66Total Equity Holding 9780.43 97.00
LOAD STRUCTURE
ADDITIONAL INVESTMENT/MULTIPLES FOR EXISTING INVESTORS
` 1000/1
MINIMUM INVESTMENT/MULTIPLES FOR NEW INVESTORS
` 5000/1
#EXPENSE RATIO : 2.95%#EXPENSE RATIO (DIRECT) : 2.21%
# The rates specified are the actual average expenses charged for the month of May 2016 . T h e a b o v e r a t i o includes the Service tax on Investment Management Fees .The above ratio also includes, proportionate charge in respect sales beyond T-15 cities subject to maximum of 30 bps on daily net assets, wherever applicable
VOLATILITY MEASURES (3 YEARS)Standard Deviation 3.38%Beta 0.83Sharpe Ratio* -0.14
TURNOVER
Portfolio Turnover 32.01%
FUND MANAGER
Roshi Jain
DATE OF ALLOTMENT
January 16, 2008
INVESTMENT OBJECTIVEFAEF is an open-end diversified equity fund that seeks to provide medium to long term appreciation through investments primarily in Asian Companies / sectors (excluding Japan) with long term potential across market capitalisation.
INVESTMENT STYLE
The fund manager seeks long term appre-ciation by focussing on Asian Companies/Sectors (excluding Japan) with long term growth potential.
NAV as of May 31, 2016
Growth Plan ` 15.8213Dividend Plan ` 12.0032Direct - Growth Plan ` 16.1548Direct - Dividend Plan ` 12.2607
FUND SIZE (AUM)
Month End ` 100.83 crores
Monthly Average ` 99.44 crores
TYPE OF SCHEME
An Open-end Diversified Equity Fund
BENCHMARK
MSCI Asia (ex-Japan)
Total Equity Holding 9,780.43 97.00
Call,cash and other current asset 302.11 3.00
TotalAsset 10,082.54 100.00
1 Year 3 Year 5 Year 7 Year Since Inception
Total amount Invested (Rs) 120,000 360,000 600,000 840,000 990,000
Total value as on Mar 31, 2016 (Rs) 120,814 376,851 702,396 1,086,356 1,380,872
Returns 1.26% 3.00% 6.24% 7.23% 7.89%
Total value of B:MSCI Asia (ex Japan) 117,068 357,639 665,541 1,041,250 1,327,276
B:MSCI Asia (ex Japan) Returns -4.50% -0.43% 4.10% 6.04% 6.96%
Total value of AB:Nifty 50 115,374 389,546 734,998 1,110,053 1,412,176
AB:Nifty 50 Returns -7.07% 5.19% 8.05% 7.84% 8.42%
18.05%
14.95%
11.99%
9.98%
8.79%
6.74%
6.45%
4.37%
2.92%
2.76%
2.66%
2.09%
1.79%
1.24%
1.04%
0.94%
0.24%
3.00%
HARDWARE
BANKS
FINANCE
SOFTWARE
RETAILING
MEDIA & ENTERTAINMENT
CONSUMER NON DURABLES
CONSUMER DURABLES
AUTO
PHARMACEUTICALS
TRANSPORTATION
INDUSTRIAL PRODUCTS
CEMENT
CONSTRUCTION
HOTELS/RESORTS & OTHER RECREATIONAL ACTIVITIES
DIVERSIFIED CONSUMER SERVICE
TEXTILE PRODUCTS
CALL,CASH AND OTHER CURRENT ASSET

This product is suitable for investors who are seeking*:
• Long term capital appreciation
• A fund that takes concentrated stock or sector exposures based on four themes
derao tM e
wo
L
LOW HIGH
Moderately
Investors understand that their principal will be at Moderately High risk
Riskometer
Franklin India Opportunities Fund FIOF
Franklin Build India Fund FBIF
13
PORTFOLIO - TOP 10 HOLDINGS
Company Name No. ofshares
Market Value` Lakhs
% ofassets
Company Name No. ofshares
Market Value` Lakhs
% ofassets
INVESTMENT STYLE
DATE OF ALLOTMENT
February 21, 2000FUND MANAGERR Janakiraman & Hari Shyamsunder (w.e.f. May 02, 2016)
#EXPENSE RATIO : 2.77%#EXPENSE RATIO (DIRECT) : 2.05%
TURNOVER
Portfolio Turnover 21.87%
ENTRY LOAD NilEXIT LOAD In respect of each purchase
of Units - 1% if the Units are redeemed/switched-out within one year of allotment
LOAD STRUCTURE
Product Label
INVESTMENT STYLE
DATE OF ALLOTMENT
September 4, 2009FUND MANAGERRoshi Jain & Anand Radhakrishnan(w.e.f. May 02, 2016)
#EXPENSE RATIO : 2.77%#EXPENSE RATIO (DIRECT) : 1.44%
TURNOVER
Portfolio Turnover 41.37%
` 5000/1
MINIMUM INVESTMENT/MULTIPLES FOR NEW INVESTORS
ENTRY LOAD NilEXIT LOAD 1% if redeemed/switched-
out within two years of allotment
LOAD STRUCTURE
Company Name No. ofshares
Market Value` Lakhs
% ofassets
Company Name No. ofshares
Market Value` Lakhs
% ofassets
As on May 31, 2016
PORTFOLIO - TOP 10 HOLDINGSAs on May 31, 2016
The fund manager seeks long term capitalappreciation by focusing on companies that operate in the space where India has a strong competitive advantage, companies that are globally competitive and those that are grossly undervalued or have high growth potential
Sector allocation - Total assets
* Top 10 holdings
* Top 10 holdings
Franklin Templeton Investmentswww.franklintempletonindia.com
Product LabelSector Allocation - Total Assets
VOLATILITY MEASURES (3 YEARS)Standard Deviation 5.96%Beta 1.18Sharpe Ratio* 1.15
* Annualised. Risk-free rate assumed to be 6.54%(FBIL OVERNIGHT MIBOR)
# The rates specified are the actual average expenses charged for the month of May 2016 . T h e a b o v e r a t i o includes the Service tax on Investment Management Fees .The above ratio also includes, proportionate charge in respect sales beyond T-15 cities subject to maximum of 30 bps on daily net assets, wherever applicable
# The rates specified are the actual average expenses charged for the month of May 2016 . T h e a b o v e r a t i o includes the Service tax on Investment Management Fees .The above ratio also includes, proportionate charge in respect sales beyond T-15 cities subject to maximum of 30 bps on daily net assets, wherever applicable
Growth Plan ` 29.2559Dividend Plan ` 19.8382Direct - Growth Plan ` 30.3453Direct - Dividend Plan ` 20.6869
Auto
Tata Motors Ltd.* 500000 2298.25 4.20
Banks
HDFC Bank Ltd.* 301393 3562.16 6.50
Yes Bank Ltd.* 236818 2446.33 4.47
ICICI Bank Ltd.* 828495 2026.91 3.70
State Bank of India* 880000 1803.56 3.29
Axis Bank Ltd.* 340000 1751.68 3.20
Construction Project
Larsen & Toubro Ltd.* 166500 2453.46 4.48
Finance
Equitas Holdings Ltd.* 1247117 2014.72 3.68
Pharmaceuticals
Dr. Reddy's Laboratories Ltd.* 48948 1558.06 2.84
Software
Infosys Ltd.* 164724 2056.83 3.75
Auto
TVS Motor Co. Ltd.* 925000 2633.01 4.43
Tata Motors Ltd., DVR* 825000 2594.63 4.37
Banks
Axis Bank Ltd.* 1000000 5152.00 8.67
ICICI Bank Ltd.* 2000000 4893.00 8.23
HDFC Bank Ltd.* 400000 4727.60 7.95
State Bank of India* 2200000 4508.90 7.59
Construction Project
Larsen & Toubro Ltd.* 200000 2947.10 4.96
Consumer Durables
Whirlpool of India Ltd.* 265000 2009.76 3.38
Telecom - Services
Bharti Airtel Ltd.* 675000 2371.95 3.99
Idea Cellular Ltd.* 2000000 2299.00 3.87
NAV as of May 31, 2016
For SIP returns of this fund please refer to Scheme Performance/ SIP returns section
For SIP returns of this fund please refer to Scheme Performance/ SIP returns section
*Investors should consult their financial advisers if in doubt about whether the product is suitable for them.
This product is suitable for investors who are seeking*:
• Long term capital appreciation
• A fund that invests in Infrastructure and allied sectors
derao tM e
wo
L
LOW HIGH
Moderately
Investors understand that their principal will be at High risk
Riskometer
*Investors should consult their financial advisers if in doubt about whether the product is suitable for them.
ADDITIONAL INVESTMENT/MULTIPLES FOR EXISTING INVESTORS` 1000/1
INVESTMENT OBJECTIVEThe investment objective of Franklin India Opportunities Fund (FIOF) is to generate capital appreciation by capitalizing on the long-term growth opportunities in the Indian economy.
ADDITIONAL INVESTMENT/MULTIPLES FOR EXISTING INVESTORS
` 1000/1
` 5000/1
MINIMUM INVESTMENT/MULTIPLES FOR NEW INVESTORS
VOLATILITY MEASURES (3 YEARS)Standard Deviation 5.07%Beta 1.07Sharpe Ratio* 0.84* Annualised. Risk-free rate assumed to be 6.54%(FBIL OVERNIGHT MIBOR)
Growth Plan ` 56.6593Dividend Plan ` 18.8044Direct - Growth Plan ` 57.6785Direct - Dividend Plan ` 19.1720FUND SIZE (AUM)
Month End ` 547.79 croresMonthly Average ` 526.48 crores
FUND SIZE (AUM)Month End ` 594.33 croresMonthly Average ` 572.92 crores
INVESTMENT OBJECTIVEThe Scheme seeks to achieve capital appreciation through investments in companies engaged either directly or indirectly in infrastructure-related activities.
TYPE OF SCHEME
An Open-end Diversified scheme
TYPE OF SCHEMEAn Open-end Equity Fund
NAV as of May 31, 2016
BENCHMARKS&P BSE 200
BENCHMARKNifty 500
Total Equity Holding 52,537.50 95.91
Call,cash and other current asset 2,241.12 4.09
TotalAsset 54,778.62 100.00
Total Equity Holding 56,058.70 94.32
Call,cash and other current asset 3,374.56 5.68
TotalAsset 59,433.26 100.00
25.35%
10.79%
9.50%
6.83%
6.72%
5.57%
4.44%
4.17%
4.05%
3.68%
2.78%
2.24%
2.10%
1.81%
1.53%
1.40%
1.36%
0.98%
0.60%
0.00%
4.09%
BANKS
SOFTWARE
AUTO
CONSTRUCTION PROJECT
PHARMACEUTICALS
CONSUMER DURABLES
CONSUMER NON DURABLES
CEMENT
TELECOM - SERVICES
FINANCE
PETROLEUM PRODUCTS
OIL
INDUSTRIAL PRODUCTS
GAS
AUTO ANCILLARIES
RETAILING
CONSTRUCTION
TRANSPORTATION
INDUSTRIAL CAPITAL GOODS
UNLISTED
CALL,CASH AND OTHER CURRENT ASSET
38.55%
13.71%
7.86%
7.32%
5.43%
5.21%
4.96%
2.27%
1.50%
1.40%
1.38%
1.27%
1.16%
1.13%
0.55%
0.40%
0.22%
5.68%
BANKS
AUTO
TELECOM - SERVICES
CEMENT
INDUSTRIAL PRODUCTS
CONSUMER DURABLES
CONSTRUCTION PROJECT
POWER
PESTICIDES
PETROLEUM PRODUCTS
AUTO ANCILLARIES
FERROUS METALS
HOTELS/RESORTS & OTHER RECREATIONAL ACTIVITIES
PHARMACEUTICALS
CONSTRUCTION
TRANSPORTATION
RETAILING
CALL,CASH AND OTHER CURRENT ASSET

Templeton India Equity Income Fund TIEIFPORTFOLIO
Company Name No. ofshares
Market Value` Lakhs
% ofassets
Company Name No. ofshares
Market Value` Lakhs
% ofassets
Sector Allocation - Total Assets
SIP - If you had invested 10000 every month in TIEIF`
Product Label
Past performance may or may not be sustained in future. Returns greater than 1 year period are compounded annualized. Dividends assumed to be reinvested and Bonus is adjusted. Load is not taken into consideration. On account of difference in the type/category, asset allocation or investment strategy, inception dates, performances of these funds are not strictly comparable. Please refer to www.franklintempletonindia.com for details on performance of all schemes (including Direct Plans). B: Benchmark, AB: Additional Benchmark.
* Annualised. Risk-free rate assumed to be 6.54% (FBIL OVERNIGHT MIBOR)
MINIMUM INVESTMENT/MULTIPLES FOR NEW INVESTORS
` 5000/1
ADDITIONAL INVESTMENT/MULTIPLES FOR EXISTING INVESTORS` 1000/1
LOAD STRUCTURE
ENTRY LOAD NilEXIT LOAD In respect of each purchase of Units - 1% if the Units are redeemed/switched-out within one year of allotment
14
* Top 10 holdings
As on May 31, 2016
Franklin Templeton Investmentswww.franklintempletonindia.com
Oil & Natural Gas Corp Ltd 875000 1844.06 2.05
Petroleum Products
Reliance Industries Ltd 280000 2681.98 2.99
Pharmaceuticals
Dr Reddy'S Laboratories Ltd 75000 2387.33 2.66
Medy-Tox Inc (South Korea) 5370 1331.32 1.48
Alkem Laboratories Ltd 47012 593.95 0.66
Retailing
GS Home Shopping (South Korea) 15000 1562.90 1.74
LG Fashion (South Korea) 50000 677.68 0.75
Semiconductors
Novatek Microelectronics Corporation (Taiwan) 677438 1513.96 1.69
Software
Infosys Ltd* 420000 5244.33 5.84
Travelsky Technology (Hong Kong) 2334000 2970.74 3.31
Transportation
Cosco Pacific (Hong Kong)* 4534552 3093.62 3.44
Great Eastern Shipping Co Ltd 118000 362.85 0.40
Total Equity Holding 87,940.85 97.90
VOLATILITY MEASURES (3 YEARS)Standard Deviation 4.41%Beta 0.83Sharpe Ratio* 0.44
TURNOVER
Portfolio Turnover 7.98%
#EXPENSE RATIO : 2.57%#EXPENSE RATIO (DIRECT) : 1.95%
# The rates specified are the actual average expenses charged for the month of May 2016 . T h e a b o v e r a t i o includes the Service tax on Investment Management Fees .The above ratio also includes, proportionate charge in respect sales beyond T-15 cities subject to maximum of 30 bps on daily net assets, wherever applicable
FUND MANAGERChetan Sehgal &Vikas Chiranewal (Dedicated for investments in foreign securities)
DATE OF ALLOTMENT
May 18, 2006
INVESTMENT OBJECTIVETIEIF is an open-end diversified equity fund that seeks to provide a combination of regular income and long-term capital appreciation by investing primarily in stocks that have a current or potentially attractive dividend yield.
INVESTMENT STYLE
Templeton Equity Portfolio Managers adopt a long term disciplined approach of investing and use the value style of investing along with focus on stocks with attractive dividend yields, both in India and overseas.
This product is suitable for investors who are seeking*:
• Long term capital appreciation
• A fund that focuses on Indian and emerging market stocks - a value fund taking into account dividend yield of stocks
derao tM e
wo
L
LOW HIGH
Moderately
Investors understand that their principal will be at Moderately High risk
Riskometer
*Investors should consult their financial advisers if in doubt about whether the product is suitable for them.
FUND SIZE (AUM)
Month End ` 898.23 crores
Monthly Average ` 874.34 crores
TYPE OF SCHEME
An Open-end Diversified Equity Fund
Growth Plan ` 33.3904Dividend Plan ` 14.0846Direct - Growth Plan ` 34.0290Direct - Dividend Plan ` 14.3955
NAV as of May 31, 2016
BENCHMARKS&P BSE 200
Total Equity Holding 87,940.85 97.90
Call,cash and other current asset 1,882.21 2.10
TotalAsset 89,823.06 100.00
1 Year 3 Year 5 Year 7 Year Since Inception
Total amount Invested (Rs) 120,000 360,000 600,000 840,000 1,190,000
Total value as on Mar 31, 2016 (Rs) 117,865 417,319 806,368 1,269,649 2,219,509
Returns -3.29% 9.84% 11.78% 11.60% 12.09%
Total value of B:S&P BSE 200 115,368 401,867 759,078 1,141,856 1,858,098
B:S&P BSE 200 Returns -7.08% 7.28% 9.35% 8.63% 8.70%
Total value of AB:Nifty 50 115,374 389,546 734,998 1,110,053 1,804,895
AB:Nifty 50 Returns -7.07% 5.19% 8.05% 7.84% 8.15%
Auto
Tata Motors Ltd DVR* 1458906 4588.26 5.11
Auto Ancillaries
Mahle-Metal Leve (Brazil)* 1100000 4822.68 5.37
Apollo Tyres Ltd 940500 1471.41 1.64
Banks
ICICI Bank Ltd* 2325000 5688.11 6.33
HDFC Bank Ltd* 478300 5653.03 6.29
Federal Bank Ltd 5300000 2774.55 3.09
Cement
Grasim Industries Ltd* 135500 5903.67 6.57
JK Cement Ltd 479975 2793.69 3.11
Chemicals
Tata Chemicals Ltd* 2045021 8828.36 9.83
Construction
J Kumar Infraprojects Ltd 158000 386.63 0.43
Consumer Non Durables
Uni-President Enterprises Corp (Taiwan) 706969 904.29 1.01
Embotelladora Andina Sa (Chile) 200000 385.14 0.43
Finance
Bajaj Holdings And Investment Ltd* 705473 10777.51 12.00
Tata Investment Corp Ltd* 757863 3949.60 4.40
Equitas Holdings Ltd 814394 1315.65 1.46
Industrial Capital Goods
Chongqing Machinery And Electric
Company (Hong Kong) 13780000 1012.80 1.13
Minerals/Mining
Coal India Ltd 125000 364.25 0.41
Oil
Cairn India Ltd 1416818 2056.51 2.29
17.86%
15.71%
9.83%
9.68%
9.15%
7.01%
5.11%
4.80%
4.34%
3.85%
2.99%
2.49%
1.69%
1.44%
1.13%
0.43%
0.41%
2.10%
FINANCE
BANKS
CHEMICALS
CEMENT
SOFTWARE
AUTO ANCILLARIES
AUTO
PHARMACEUTICALS
OIL
TRANSPORTATION
PETROLEUM PRODUCTS
RETAILING
SEMICONDUCTORS
CONSUMER NON DURABLES
INDUSTRIAL CAPITAL GOODS
CONSTRUCTION
MINERALS/MINING
CALL,CASH AND OTHER CURRENT ASSET

Industrial Products
Greaves Cotton Ltd. 1715000 2330.69 1.09
SKF India Ltd. 175000 2164.66 1.01
Cummins India Ltd. 270000 2160.00 1.01
Shakti Pumps India Ltd. 100000 157.60 0.07
Media & Entertainment
Jagran Prakashan Ltd. 1600000 2706.40 1.26
Minerals/mining
Gujarat Mineral Development Corp. Ltd. 1069110 706.68 0.33
Petroleum Products
Bharat Petroleum Corp. Ltd. 420000 4118.10 1.92
Pharmaceuticals
Dr. Reddy's Laboratories Ltd.* 183000 5825.07 2.71
Cadila Healthcare Ltd. 1080000 3633.12 1.69
Torrent Pharmaceuticals Ltd. 270000 3622.73 1.69
Sun Pharmaceutical Industries Ltd. 350000 2669.63 1.24
IPCA Laboratories Ltd. 106941 459.74 0.21
Retailing
Aditya Birla Fashion and Retail Ltd. 1332000 1754.91 0.82
Software
Infosys Ltd.* 875000 10925.69 5.09
Wipro Ltd. 615000 3354.52 1.56
HCL Technologies Ltd. 399000 2951.80 1.38
Tata Consultancy Services Ltd. 85000 2183.99 1.02
Telecom - Services
Bharti Airtel Ltd.* 2190000 7695.66 3.59
Tata Communications Ltd. 400000 1829.00 0.85
Textile Products
Arvind Ltd. 750000 2395.88 1.12
Transportation
Gujarat Pipavav Port Ltd. 1850000 2962.78 1.38
Gateway Distriparks Ltd. 260000 765.83 0.36
Unlisted
Quantum Information Services 3500 0.06 0.00
Globsyn Technologies Ltd. 30000 0.00 0.00
Numero Uno International Ltd. 2900 0.00 0.00
Total Equity Holding 200,531.28 93.43
FITPORTFOLIO
Company Name No. ofshares
Market Value` Lakhs
% ofassets
Company Name No. ofshares
Market Value` Lakhs
% ofassets
Sector Allocation - Total Assets
SIP - If you had invested 10000 every month in FIT `
Product Label
Past performance may or may not be sustained in future. Returns greater than 1 year period are compounded annualized. Dividends assumed to be reinvested and Bonus is adjusted. Load is not taken into consideration. On account of difference in the type/category, asset allocation or investment strategy, inception dates, performances of these funds are not strictly comparable. Please refer to www.franklintempletonindia.com for details on performance of all schemes (including Direct Plans). B: Benchmark, AB: Additional Benchmark.
15
* Top 10 holdings
Franklin India TaxshieldThis is a Simple and Performing scheme which is eligible for distribution by new cadre of distributors.
* Annualised. Risk-free rate assumed to be 6.54% (FBIL OVERNIGHT MIBOR)
1 Year 3 Year 5 Year 7 Year 10 Year Since Inception
As on May 31, 2016
Franklin Templeton Investmentswww.franklintempletonindia.com
Auto
Mahindra & Mahindra Ltd.* 420000 5553.66 2.59
Tata Motors Ltd. 1100000 5056.15 2.36
Hero Motocorp Ltd. 115000 3563.74 1.66
TVS Motor Co. Ltd. 750000 2134.88 0.99
Maruti Suzuki India Ltd. 50000 2080.80 0.97
Auto Ancillaries
Amara Raja Batteries Ltd. 370000 3106.52 1.45
Exide Industries Ltd. 1500000 2463.75 1.15
Balkrishna Industries Ltd. 280000 1865.22 0.87
Apollo Tyres Ltd. 1100000 1720.95 0.80
Banks
HDFC Bank Ltd.* 1670000 19737.73 9.20
Axis Bank Ltd.* 1920000 9891.84 4.61
IndusInd Bank Ltd.* 770000 8491.95 3.96
Yes Bank Ltd.* 720000 7437.60 3.47
Kotak Mahindra Bank Ltd.* 707155 5279.27 2.46
ICICI Bank Ltd. 2100000 5137.65 2.39
Karur Vysya Bank Ltd. 615000 2838.84 1.32
Federal Bank Ltd. 4900000 2565.15 1.20
State Bank of India 1060000 2172.47 1.01
Cement
Ultra Tech Cement Ltd. 123000 3968.84 1.85
ACC Ltd. 155000 2370.03 1.10
Grasim Industries Ltd. 50000 2178.48 1.01
Chemicals
Pidilite Industries Ltd. 650000 4590.63 2.14
Aarti Industries Ltd. 175000 908.86 0.42
Construction Project
Larsen & Toubro Ltd.* 425000 6262.59 2.92
Voltas Ltd. 750000 2519.25 1.17
Consumer Durables
Havell's India Ltd. 700000 2551.50 1.19
Bata India Ltd. 445000 2547.18 1.19
Crompton Greaves Consumer Electricals Ltd. 500000 661.50 0.31
Consumer Non Durables
United Breweries Ltd. 350000 2539.60 1.18
Marico Ltd. 958808 2389.35 1.11
ITC Ltd. 600000 2106.30 0.98
Asian Paints Ltd. 200000 1969.70 0.92
Jubilant Foodworks Ltd. 122817 1269.50 0.59
Finance
Credit Analysis and Research Ltd. 160000 1591.12 0.74
Equitas Holdings Ltd. 191391 309.19 0.14
Gas
Gujarat State Petronet Ltd. 1000000 1325.00 0.62
Total amount Invested (Rs) 120,000 360,000 600,000 840,000 1,200,000 2,040,000
Total value as on Mar 31, 2016 (Rs) 118,313 467,353 931,296 1,510,145 2,680,662 15,501,535
Returns -2.60% 17.72% 17.63% 16.46% 15.35% 20.95%
Total value of B:Nifty 500 115,322 406,207 768,407 1,152,644 1,884,267 7,267,038
B:Nifty 500 Returns -7.15% 8.01% 9.84% 8.89% 8.73% 13.52%
Total value of AB:Nifty 50 115,374 389,546 734,998 1,110,053 1,825,804 6,605,171
AB:Nifty 50 Returns -7.07% 5.19% 8.05% 7.84% 8.14% 12.57%
#Awaiting Listing
INVESTMENT STYLE
The fund manager seeks steady growth by maintaining a diversified portfolio of equities across sectors and market cap ranges.
INVESTMENT OBJECTIVEThe primary objective for Franklin India Taxshield is to provide medium to long term growth of capital along with income tax rebate.
TURNOVER
Portfolio Turnover 21.16%
VOLATILITY MEASURES (3 YEARS)Standard Deviation 4.37%Beta 0.90Sharpe Ratio* 1.04
#EXPENSE RATIO : 2.42%#EXPENSE RATIO (DIRECT) : 1.50%
# The rates specified are the actual average expenses charged for the month of May 2016 . T h e a b o v e r a t i o includes the Service tax on Investment Management Fees .The above ratio also includes, proportionate charge in respect sales beyond T-15 cities subject to maximum of 30 bps on daily net assets, wherever applicable
MINIMUM INVESTMENT/MULTIPLES FOR NEW INVESTORS
` 500/500
ADDITIONAL INVESTMENT/MULTIPLES FOR EXISTING INVESTORS
` 500/500
LOAD STRUCTURE
ENTRY LOAD NilEXIT LOAD Nil
TAX BENEFITS
LOCK-IN-PERIOD
Growth Plan ̀ 433.9255Dividend Plan ` 41.1213Direct - Growth Plan ` 445.5044Direct - Dividend Plan ` 42.3843
NAV as of May 31, 2016
FUND MANAGER
Lakshmikanth Reddy & R. Janakiraman(w.e.f. May 02, 2016)
DATE OF ALLOTMENT
April 10, 1999
*Investors should consult their financial advisers if in doubt about whether the product is suitable for them.
This product is suitable for investors who are seeking*:
• Long term capital appreciation
• An ELSS fund offering tax benefits under Section 80C of the Income Tax Act
derao tM e
wo
L
LOW HIGH
Moderately
Investors understand that their principal will be at Moderately High risk
Riskometer
FUND SIZE (AUM)
Month End ` 2146.41 crores
Monthly Average ` 2081.58 crores
TYPE OF SCHEME
An Open-End Equity Linked Savings Scheme
BENCHMARKNifty 500
Total Equity Holding 200,531.28 93.43
Call,cash and other current asset 14,109.81 6.57
TotalAsset 214,641.09 100.00
29.61%
9.05%
8.57%
7.55%
4.79%
4.44%
4.27%
4.09%
3.97%
3.17%
2.68%
2.56%
1.92%
1.74%
1.26%
1.12%
0.89%
0.82%
0.62%
0.33%
0.00%
6.57%
BANKS
SOFTWARE
AUTO
PHARMACEUTICALS
CONSUMER NON DURABLES
TELECOM - SERVICES
AUTO ANCILLARIES
CONSTRUCTION PROJECT
CEMENT
INDUSTRIAL PRODUCTS
CONSUMER DURABLES
CHEMICALS
PETROLEUM PRODUCTS
TRANSPORTATION
MEDIA & ENTERTAINMENT
TEXTILE PRODUCTS
FINANCE
RETAILING
GAS
MINERALS/MINING
UNLISTED
CALL,CASH AND OTHER CURRENT ASSET

FISCFPORTFOLIO
Company Name No. ofshares
Market Value` Lakhs
% ofassets
Company Name No. ofshares
Market Value` Lakhs
% ofassets
SIP - If you had invested 10000 every month in FISCF `
Past performance may or may not be sustained in future. Returns greater than 1 year period are compounded annualized. Dividends assumed to be reinvested and Bonus is adjusted. Load is not taken into consideration. On account of difference in the type/category, asset allocation or investment strategy, inception dates, performances of these funds are not strictly comparable. Please refer to www.franklintempletonindia.com for details on performance of all schemes (including Direct Plans). B: Benchmark, AB: Additional Benchmark.
16
* Annualised. Risk-free rate assumed to be 6.54% (FBIL OVERNIGHT MIBOR)
Franklin India Smaller Companies FundAs on May 31, 2016
Franklin Templeton Investmentswww.franklintempletonindia.com
Auto Tata Motors Ltd., DVR* 2107798 6629.02 2.24Auto Ancillaries Amara Raja Batteries Ltd. 437741 3675.27 1.24L.G. Balakrishnan & Brothers Ltd. 545076 2476.28 0.84Banco Products India Ltd. 1731834 2272.17 0.77Banks Yes Bank Ltd.* 848884 8768.97 2.96HDFC Bank Ltd.* 519107 6135.33 2.07IndusInd Bank Ltd. 506427 5585.13 1.88Axis Bank Ltd. 1025000 5280.80 1.78Karur Vysya Bank Ltd. 1125253 5194.17 1.75City Union Bank Ltd. 4076000 4342.98 1.47ICICI Bank Ltd. 1000000 2446.50 0.83Cement Ramco Cements Ltd. 1163565 5721.25 1.93JK Lakshmi Cement Ltd. 1117063 3786.29 1.28Heidelbergcement India Ltd. 2560499 2609.15 0.88Chemicals Atul Ltd.* 349620 6569.53 2.22Deepak Nitrite Ltd. 6413886 5281.84 1.78Commercial Services Nesco Ltd. 204576 3207.85 1.08Construction Sobha Ltd. 1223470 3731.58 1.26KNR Constructions Ltd. 514545 2857.78 0.96Brigade Enterprises Ltd. 1732745 2583.52 0.87Ahluwalia Contracts Ltd. 773476 2111.59 0.71Cera Sanitaryware Ltd. 49852 998.76 0.34Consolidated Construction Consortium Ltd. 2334565 75.87 0.03Construction Project Voltas Ltd.* 2101523 7059.02 2.38Consumer Durables Hitachi Home & Life Solutions Ltd. 232279 2985.48 1.01Blue Star Ltd. 674877 2813.90 0.95Century Plyboards India Ltd. 1300000 2119.00 0.72Consumer Non Durables Berger Paints India Ltd. 1463030 4137.45 1.40Jyothy Laboratories Ltd. 998810 2817.64 0.95Kaveri Seed Co. Ltd. 296845 1294.54 0.44Ferrous Metals Pennar Industries Ltd. 5389354 2376.71 0.80Finance Equitas Holdings Ltd.* 8887515 14357.78 4.85Repco Home Finance Ltd.* 1048368 7057.09 2.38Motilal Oswal Financial Services Ltd. 886727 2935.07 0.99Geojit BNP Paribas Financial Services Ltd. 4933494 1914.20 0.65Gas Aegis Logistics Ltd. 183278 210.04 0.07Industrial Capital Goods Lakshmi Machine Works Ltd. 144321 4953.39 1.67Triveni Turbine Ltd. 2544053 2714.50 0.92
Voltamp Transformers Ltd. 186295 1489.43 0.50Industrial Products Finolex Cables Ltd.* 3925585 13837.69 4.67FAG Bearings (India) Ltd.* 186136 7352.37 2.48Finolex Industries Ltd. 1527252 5924.97 2.00Greaves Cotton Ltd. 3600653 4893.29 1.65SKF India Ltd. 358682 4436.72 1.50Timken India Ltd. 691922 3790.35 1.28Carborundum Universal Ltd. 1653426 3728.48 1.26M.M. Forgings Ltd. 789341 3542.96 1.20Grindwell Norton Ltd. 314348 2133.95 0.72Swaraj Engines Ltd. 163551 1810.84 0.61Shakti Pumps India Ltd. 328709 518.05 0.17Media & Entertainment TV Today Network 1386024 4185.79 1.41Navneet Education Ltd. 4555056 3969.73 1.34HT Media Ltd. 4545617 3672.86 1.24Entertainment Network India Ltd. 384563 2922.49 0.99Jagran Prakashan Ltd. 887581 1501.34 0.51Minerals/mining Gujarat Mineral Development Corp. Ltd. 1365533 902.62 0.30Pesticides PI Industries Ltd. 439761 2973.00 1.00Petroleum Products Gulf Oil Lubricants India Ltd. 994506 5416.08 1.83Pharmaceuticals J.B. Chemicals & Pharmaceuticals Ltd. 1500396 3820.76 1.29IPCA Laboratories Ltd. 270034 1160.88 0.39Software Eclerx Services Ltd.* 582409 8303.41 2.80NIIT Technologies Ltd. 857917 4166.04 1.41Mindtree Ltd. 574264 3795.31 1.28Cyient Ltd. 723252 3492.95 1.18Telecom - Services Bharti Airtel Ltd. 376459 1322.88 0.45Textile Products Himatsingka Seide Ltd. 1528746 3367.83 1.14Transportation Gujarat Pipavav Port Ltd. 3071651 4919.25 1.66VRL Logistics Ltd. 1016283 2813.07 0.95Navkar Corp. Ltd. 985653 1972.29 0.67Total Equity Holding 270,225.08 91.19
* Top 10 holdings
TURNOVER
Portfolio Turnover 16.11%
LOAD STRUCTURE
ENTRY LOAD NilEXIT LOAD 1% if the Units are redeemed/switched-out within one year of allotment
ADDITIONAL INVESTMENT/MULTIPLES FOR EXISTING INVESTORS
` 1000/1
MINIMUM INVESTMENT/MULTIPLES FOR NEW INVESTORS
` 5000/1
#EXPENSE RATIO : 2.37%#EXPENSE RATIO (DIRECT) : 1.24%
# The rates specified are the actual average expenses charged for the month of May 2016 . T h e a b o v e r a t i o includes the Service tax on Investment Management Fees .The above ratio also includes, proportionate charge in respect sales beyond T-15 cities subject to maximum of 30 bps on daily net assets, wherever applicable
VOLATILITY MEASURES (3 YEARS)Standard Deviation 5.19%Beta 0.90Sharpe Ratio* 1.61
FUND MANAGERR. Janakiraman & Hari Shyamsunder(w.e.f. May 02, 2016)
DATE OF ALLOTMENTJanuary 13, 2006 (Launched as a closed end scheme, the scheme was converted into an open end scheme effective January 14, 2011).
INVESTMENT OBJECTIVEThe Fund seeks to provide long-term capital appreciation by investing in mid and small cap companies.
INVESTMENT STYLE
Growth Plan ` 41.6758Dividend Plan ` 24.3900Direct - Growth Plan ` 43.1674Direct - Dividend Plan ` 25.4021
NAV as of May 31, 2016
Product Label
*Investors should consult their financial advisers if in doubt about whether the product is suitable for them.
This product is suitable for investors who are seeking*:
• Long term capital appreciation
• A fund that invests primarily in small and mid-cap companies
derao tM e
wo
L
LOW HIGH
Moderately
Investors understand that their principal will be at Moderately High risk
Riskometer
FUND SIZE (AUM)
Month End ` 2963.23 crores
Monthly Average ` 2859.53 crores
Sector Allocation - Total Assets
TYPE OF SCHEME
An Open – end Diversified Equity Fund
BENCHMARK@Nifty Free Float Midcap 100
Total Equity Holding 270,225.08 91.19
Call,cash and other current asset 26,097.83 8.81
TotalAsset 296,322.91 100.00
1 Year 3 Year Since Inception
Total amount Invested (Rs) 120,000 360,000 630,000
Total value as on Mar 31, 2016 (Rs) 118,885 540,022 1,276,238
Returns -1.72% 28.22% 27.18%@Total value of B:Nifty Free Float Midcap 100 117,439 459,935 915,177
@B:Nifty Free Float Midcap 100 Returns -3.94% 16.59% 14.18%
Total value of AB:Nifty 50 115,374 389,546 776,981
AB:Nifty 50 Returns -7.07% 5.19% 7.92%
@ Nifty Midcap 100 has been renamed as
Nifty Free Float Midcap 100 w.e.f. April 01,
2016.
17.54%
12.74%
8.86%
6.67%
5.48%
4.17%
4.09%
4.00%
3.28%
3.09%
2.84%
2.78%
2.67%
2.38%
2.24%
1.83%
1.68%
1.14%
1.08%
1.00%
0.80%
0.45%
0.30%
0.07%
8.81%
INDUSTRIAL PRODUCTS
BANKS
FINANCE
SOFTWARE
MEDIA & ENTERTAINMENT
CONSTRUCTION
CEMENT
CHEMICALS
TRANSPORTATION
INDUSTRIAL CAPITAL GOODS
AUTO ANCILLARIES
CONSUMER NON DURABLES
CONSUMER DURABLES
CONSTRUCTION PROJECT
AUTO
PETROLEUM PRODUCTS
PHARMACEUTICALS
TEXTILE PRODUCTS
COMMERCIAL SERVICES
PESTICIDES
FERROUS METALS
TELECOM - SERVICES
MINERALS/MINING
GAS
CALL,CASH AND OTHER CURRENT ASSET

Software
Infosys Ltd.* 320000 3995.68 23.92
Tata Consultancy Services Ltd.* 128500 3301.68 19.77
Wipro Ltd.* 270000 1472.72 8.82
Tech Mahindra Ltd.* 184000 994.24 5.95
Cyient Ltd.* 200000 965.90 5.78
Cognizant Technology (USA)* 20000 825.35 4.94
HCL Technologies Ltd.* 105000 776.79 4.65
Eclerx Services Ltd.* 40000 570.28 3.41
Oracle Financial Services Software Ltd.* 15000 519.91 3.11
NIIT Technologies Ltd. 100000 485.60 2.91
MakemyTrip (USA) 45000 441.89 2.65
Firstsource Solutions Ltd. 400000 159.00 0.95
INVESTMENT STYLE
The fund manager follows a passive style of equity investing
FUND MANAGER
Varun Sharma (w.e.f. Nov 30, 2015)
MINIMUM INVESTMENT/MULTIPLES FOR NEW INVESTORS
` 5000/1
ADDITIONAL INVESTMENT/MULTIPLES FOR EXISTING INVESTORS
` 1000/1
LOAD STRUCTURE
ENTRY LOAD NilEXIT LOAD 1% (if redeemed/switched- out within 30 days from date of allotment)
PORTFOLIO - TOP 10 HOLDINGS
Company Name No. ofshares
Market Value` Lakhs
% ofassets
Franklin India Index Fund - NSE NIFTY Plan FIIF
Franklin Infotech Fund FIF
17
INVESTMENT STYLE
INVESTMENT OBJECTIVE
The fund manager seeks growth of capital by focusing on companies in the information technology sector
DATE OF ALLOTMENTAugust 22, 1998
FUND MANAGER Anand Radhakrishnan, Varun Sharma (w.e.f. Nov 30, 2015)
PORTFOLIO TURNOVER 15.49%
LOAD STRUCTURE
Company Name No. ofshares
Market Value` Lakhs
% ofassets
As on May 31, 2016
As on May 31, 2016
* Top 10 Holdings
Product Label
Hexaware Technologies Ltd. 40000 86.84 0.52
Unlisted
Brillio Technologies Pvt Ltd 970000 0.10 0.00
Total Equity Holding 14595.98 87.39
Foreign Mutual Fund Units
FTIF - Franklin Technology Fund, Class I* 127117.73 1325.98 7.94
Franklin Templeton Investmentswww.franklintempletonindia.com
Company Name No. ofshares
Market Value` Lakhs
% ofassets
ENTRY LOAD NilEXIT LOAD 1% if redeemed/switched- out within two years of allotment
* Top 10 Holdings
Company Name No. ofshares
Market Value` Lakhs
% ofassets
Larsen & Toubro Ltd.* 62886 926.66 4.02
Tata Motors Ltd.* 148355 681.91 2.96
Axis Bank Ltd.* 127805 658.45 2.86
The investment objective of Franklin Infotech Fund is to provide longterm capital appreciation by investing primarily in the information technology industry.
PORTFOLIO
Infosys Ltd.* 153145 1912.25 8.31
HDFC Bank Ltd.* 151170 1786.68 7.76
ITC Ltd.* 431800 1515.83 6.58
Housing Development Finance Corp. Ltd.* 121162 1499.62 6.51
Reliance Industries Ltd.* 126686 1213.46 5.27
ICICI Bank Ltd.* 444895 1088.44 4.73
Tata Consultancy Services Ltd.* 40831 1049.11 4.56
For SIP returns of this fund please refer to Scheme Performance/ SIP returns section
For SIP returns of this fund please refer to Scheme Performance/ SIP returns section
*Investors should consult their financial advisers if in doubt about whether the product is suitable for them.
# EXPENSE RATIO : 1.06%#EXPENSE RATIO (DIRECT) : 0.65%
# The rates specified are the actual average expenses charged for the month of May 2016 . The above ratio includes the Service tax on Investment Management Fees .The above ratio also includes, proportionate charge in respect sales beyond T-15 cities subject to maximum of 30 bps on daily net assets, wherever applicable
Growth Plan ` 64.5848Dividend Plan ` 64.5848Direct - Growth Plan ` 65.3345Direct - Dividend Plan ` 65.3345
TRACKING ERROR (for 3 year period) : 0.44%
NAV as of May 31, 2016
Note : Sector allocation as per Nifty 50
DATE OF ALLOTMENTAugust 4, 2000
ADDITIONAL INVESTMENT/MULTIPLES FOR EXISTING INVESTORS ` 1000/1
MINIMUM INVESTMENT/MULTIPLES FOR NEW INVESTORS ` 5000/1
#EXPENSE RATIO : 2.78%#EXPENSE RATIO (DIRECT) : 2.16%
# The rates specified are the actual average expenses charged for the month of May 2016 . The above ratio includes the Service tax on Investment Management Fees .The above ratio also includes, proportionate charge in respect sales beyond T-15 cities subject to maximum of 30 bps on daily net assets, wherever applicable
VOLATILITY MEASURES (3 YEARS)Standard Deviation 5.55%Beta 0.88Sharpe Ratio* 0.80
* Annualised. Risk-free rate assumed to be 6.54% (FBIL OVERNIGHT MIBOR)
Growth Plan ` 117.1292Dividend Plan ` 24.3239Direct - Growth Plan ` 119.3167Direct - Dividend Plan ` 24.7851
NAV as of May 31, 2016
This product is suitable for investors who are seeking*:
• Long term capital appreciation
• A fund that invests in stocks of companies in the Information Technology sector
derao tM e
wo
L
LOW HIGH
Moderately
Investors understand that their principal will be at High risk
Riskometer
Product Label
*Investors should consult their financial advisers if in doubt about whether the product is suitable for them.
Investors understand that their principal will be at Moderately High risk
INVESTMENT OBJECTIVE
The Investment Objective of the Scheme is to invest in companies whose securities are included in the Nifty and subject to tracking errors, endeavouring to attain results commensurate with the Nifty 50 under NSE Nifty Plan.
FUND SIZE (AUM)
Month End ` 230.24 crores
Monthly Average ` 218.29 crores
FUND SIZE (AUM)
Month End ` 167.02 crores
Monthly Average ` 164.19 crores
Sector Allocation - Total Assets
TYPE OF SCHEME
An Open-end Index linked growth Scheme
TYPE OF SCHEME
An Open-end growth scheme
BENCHMARKNifty 50
BENCHMARKS&P BSE Information Technology
Total Equity Holding 22,831.21 99.16
Call,cash and other current asset 192.38 0.84
TotalAsset 23,023.59 100.00
Total Asset 15,921.96 95.33
Call,cash and other current asset 779.67 4.67
TotalAsset 16,701.63 100.00
87.39%
7.94%
0.00%
4.67%
SOFTWARE
FOREIGN MUTUAL FUND UNITS
UNLISTED
CALL,CASH AND OTHER CURRENT ASSET
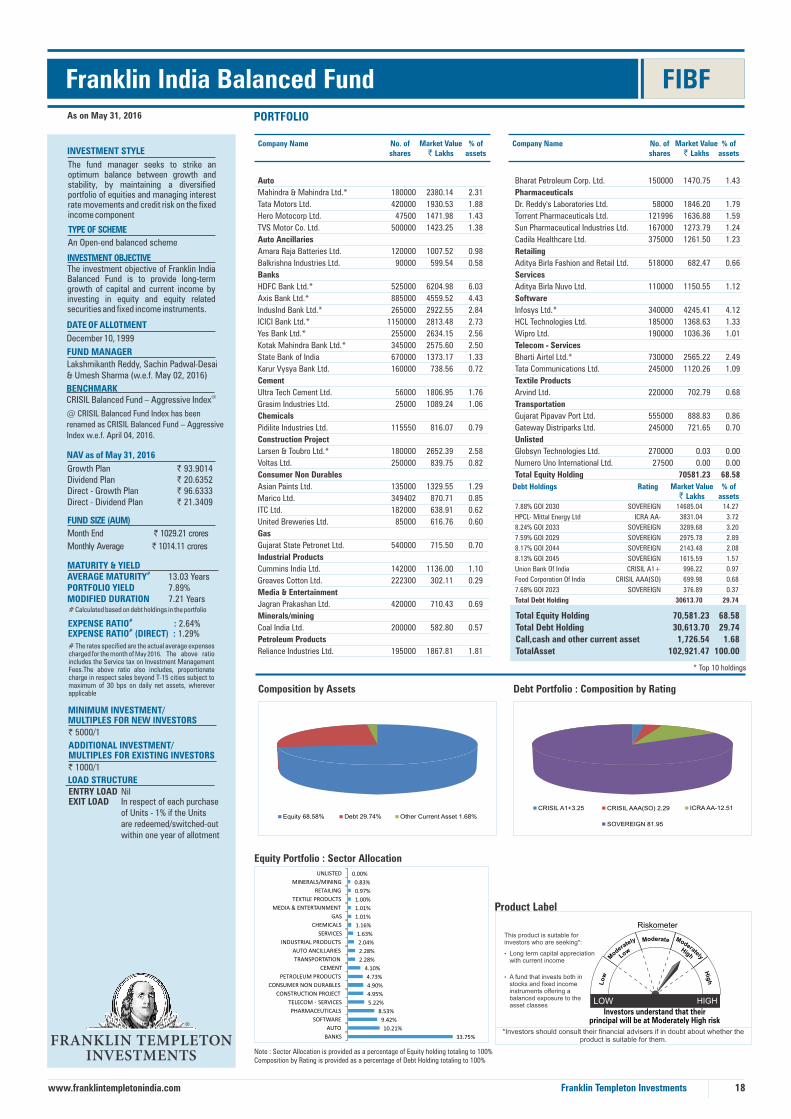
As on May 31, 2016 PORTFOLIO
Company Name No. ofshares
Market Value` Lakhs
% ofassets
Company Name No. ofshares
Market Value` Lakhs
% ofassets
18
INVESTMENT STYLE
INVESTMENT OBJECTIVEThe investment objective of Franklin India Balanced Fund is to provide long-term growth of capital and current income by investing in equity and equity related securities and fixed income instruments.
The fund manager seeks to strike an optimum balance between growth and stability, by maintaining a diversified portfolio of equities and managing interest rate movements and credit risk on the fixed income component
Franklin Templeton Investmentswww.franklintempletonindia.com
FIBF
Debt Holdings Rating Market Value` Lakhs
% ofassets
Growth Plan ` 93.9014Dividend Plan ` 20.6352Direct - Growth Plan ` 96.6333Direct - Dividend Plan ` 21.3409
NAV as of May 31, 2016
Franklin India Balanced Fund
*Investors should consult their financial advisers if in doubt about whether the product is suitable for them.
This product is suitable for investors who are seeking*:
• Long term capital appreciation with current income
• A fund that invests both in stocks and fixed income instruments offering a balanced exposure to the asset classes
derao tM e
wo
L
LOW HIGH
Moderately
Investors understand that their principal will be at Moderately High risk
Riskometer
Product Label
MATURITY & YIELD#AVERAGE MATURITY 13.03 Years
7.89%PORTFOLIO YIELDMODIFIED DURATION 7.21 Years
#EXPENSE RATIO : 2.64%#EXPENSE RATIO (DIRECT) : 1.29%
# The rates specified are the actual average expenses charged for the month of May 2016 . The above ratio includes the Service tax on Investment Management Fees .The above ratio also includes, proportionate charge in respect sales beyond T-15 cities subject to maximum of 30 bps on daily net assets, wherever applicable
* Top 10 holdings
Auto
Mahindra & Mahindra Ltd.* 180000 2380.14 2.31
Tata Motors Ltd. 420000 1930.53 1.88
Hero Motocorp Ltd. 47500 1471.98 1.43
TVS Motor Co. Ltd. 500000 1423.25 1.38
Auto Ancillaries
Amara Raja Batteries Ltd. 120000 1007.52 0.98
Balkrishna Industries Ltd. 90000 599.54 0.58
Banks
HDFC Bank Ltd.* 525000 6204.98 6.03
Axis Bank Ltd.* 885000 4559.52 4.43
IndusInd Bank Ltd.* 265000 2922.55 2.84
ICICI Bank Ltd.* 1150000 2813.48 2.73
Yes Bank Ltd.* 255000 2634.15 2.56
Kotak Mahindra Bank Ltd.* 345000 2575.60 2.50
State Bank of India 670000 1373.17 1.33
Karur Vysya Bank Ltd. 160000 738.56 0.72
Cement
Ultra Tech Cement Ltd. 56000 1806.95 1.76
Grasim Industries Ltd. 25000 1089.24 1.06
Chemicals
Pidilite Industries Ltd. 115550 816.07 0.79
Construction Project
Larsen & Toubro Ltd.* 180000 2652.39 2.58
Voltas Ltd. 250000 839.75 0.82
Consumer Non Durables
Asian Paints Ltd. 135000 1329.55 1.29
Marico Ltd. 349402 870.71 0.85
ITC Ltd. 182000 638.91 0.62
United Breweries Ltd. 85000 616.76 0.60
Gas
Gujarat State Petronet Ltd. 540000 715.50 0.70
Industrial Products
Cummins India Ltd. 142000 1136.00 1.10
Greaves Cotton Ltd. 222300 302.11 0.29
Media & Entertainment
Jagran Prakashan Ltd. 420000 710.43 0.69
Minerals/mining
Coal India Ltd. 200000 582.80 0.57
Petroleum Products
Reliance Industries Ltd. 195000 1867.81 1.81
DATE OF ALLOTMENT
December 10, 1999
FUND MANAGER
Lakshmikanth Reddy, Sachin Padwal-Desai & Umesh Sharma (w.e.f. May 02, 2016)
FUND SIZE (AUM)
Month End ` 1029.21 crores
Monthly Average ` 1014.11 crores
MINIMUM INVESTMENT/MULTIPLES FOR NEW INVESTORS
` 5000/1
ADDITIONAL INVESTMENT/MULTIPLES FOR EXISTING INVESTORS
` 1000/1
LOAD STRUCTUREENTRY LOAD NilEXIT LOAD In respect of each purchase of Units - 1% if the Units are redeemed/switched-out within one year of allotment
Equity Portfolio : Sector Allocation
Debt Portfolio : Composition by RatingComposition by Assets
Equity 68.58% Debt 29.74% Other Current Asset 1.68%
Bharat Petroleum Corp. Ltd. 150000 1470.75 1.43
Pharmaceuticals
Dr. Reddy's Laboratories Ltd. 58000 1846.20 1.79
Torrent Pharmaceuticals Ltd. 121996 1636.88 1.59
Sun Pharmaceutical Industries Ltd. 167000 1273.79 1.24
Cadila Healthcare Ltd. 375000 1261.50 1.23
Retailing
Aditya Birla Fashion and Retail Ltd. 518000 682.47 0.66
Services
Aditya Birla Nuvo Ltd. 110000 1150.55 1.12
Software
Infosys Ltd.* 340000 4245.41 4.12
HCL Technologies Ltd. 185000 1368.63 1.33
Wipro Ltd. 190000 1036.36 1.01
Telecom - Services
Bharti Airtel Ltd.* 730000 2565.22 2.49
Tata Communications Ltd. 245000 1120.26 1.09
Textile Products
Arvind Ltd. 220000 702.79 0.68
Transportation
Gujarat Pipavav Port Ltd. 555000 888.83 0.86
Gateway Distriparks Ltd. 245000 721.65 0.70
Unlisted
Globsyn Technologies Ltd. 270000 0.03 0.00
Numero Uno International Ltd. 27500 0.00 0.00
Total Equity Holding 70581.23 68.58
7.88% GOI 2030 SOVEREIGN 14685.04 14.27
HPCL- Mittal Energy Ltd ICRA AA- 3831.04 3.72
8.24% GOI 2033 SOVEREIGN 3289.68 3.20
7.59% GOI 2029 SOVEREIGN 2975.78 2.89
8.17% GOI 2044 SOVEREIGN 2143.48 2.08
8.13% GOI 2045 SOVEREIGN 1615.59 1.57
Union Bank Of India CRISIL A1+ 996.22 0.97
Food Corporation Of India CRISIL AAA(SO) 699.98 0.68
7.68% GOI 2023 SOVEREIGN 376.89 0.37
Total Debt Holding 30613.70 29.74
TYPE OF SCHEME
An Open-end balanced scheme
BENCHMARK@CRISIL Balanced Fund – Aggressive Index
# Calculated based on debt holdings in the portfolio
Note : Sector Allocation is provided as a percentage of Equity holding totaling to 100%Composition by Rating is provided as a percentage of Debt Holding totaling to 100%
Total Equity Holding 70,581.23 68.58
Total Debt Holding 30,613.70 29.74
Call,cash and other current asset 1,726.54 1.68
TotalAsset 102,921.47 100.00
CRISIL A1+3.25 CRISIL AAA(SO) 2.29 ICRA AA-12.51
SOVEREIGN 81.95
@ CRISIL Balanced Fund Index has been
renamed as CRISIL Balanced Fund – Aggressive
Index w.e.f. April 04, 2016.
33.75%
10.21%
9.42%
8.53%
5.22%
4.95%
4.90%
4.73%
4.10%
2.28%
2.28%
2.04%
1.63%
1.16%
1.01%
1.01%
1.00%
0.97%
0.83%
0.00%
BANKS
AUTO
SOFTWARE
PHARMACEUTICALS
TELECOM - SERVICES
CONSTRUCTION PROJECT
CONSUMER NON DURABLES
PETROLEUM PRODUCTS
CEMENT
TRANSPORTATION
AUTO ANCILLARIES
INDUSTRIAL PRODUCTS
SERVICES
CHEMICALS
GAS
MEDIA & ENTERTAINMENT
TEXTILE PRODUCTS
RETAILING
MINERALS/MINING
UNLISTED

This product is suitable for investors who are seeking*:
• Long term capital appreciation
• A hybrid fund investing upto 40% in equities and the balance in high quality fixed income instruments
derao tM e
wo
L
LOW HIGH
Moderately
Investors understand that their principal will be at Moderately High risk
Riskometer
As on May 31, 2016 PORTFOLIO
Company Name No. ofshares
Market Value` Lakhs
% ofassets
Company Name No. ofshares
Market Value` Lakhs
% ofassets
Equity Portfolio : Sector Allocation Product Label
19
* Top 10 holdings
INVESTMENT STYLE
INVESTMENT OBJECTIVEThe Fund seeks to provide investors regular income under the Dividend Plan and capital appreciation under the Growth Plan.
DATE OF ALLOTMENTMarch 31, 1997FUND MANAGERLakshmikanth Reddy, Sachin Padwal-Desai & Umesh Sharma (w.e.f. May 02, 2016)
MINIMUM INVESTMENT/MULTIPLES FOR NEW INVESTORS
` 500/1ADDITIONAL INVESTMENT/MULTIPLES FOR EXISTING INVESTORS
` 500/1
SIP - If you had invested 10000 every month in FIPEP `
Past performance may or may not be sustained in future. Returns greater than 1 year period are compounded annualized. Dividends assumed to be reinvested and Bonus is adjusted. Load is not taken into consideration. On account of difference in the type/category, asset allocation or investment strategy, inception dates, performances of these funds are not strictly comparable. Please refer to www.franklintempletonindia.com for details on performance of all schemes (including Direct Plans). B: Benchmark, AB: Additional Benchmark. ## Benchmark: 40% Nifty 500 + 60% Crisil Composite Bond Fund Index
10 Year Since Inception
Franklin India Pension Plan
LOAD STRUCTURE
ENTRY LOAD NilEXIT LOAD 3%, if redeemed before the age of 58 years (subject to lock-in period) and target amount Nil, if redeemed after the age of 58 yearsTAX BENEFITS
LOCK-IN PERIOD & MINIMUM TARGET INVESTMENT
All subscriptions in FIPEP are locked in for a period of 3 full financial years. Minimum target investment ` 10,000 before the age of 60 years.*Conditions Apply
1 Year 3 Year 5 Year 7 Year
Debt Holdings Rating Market Value
(Rs. in Lakhs)
% of
Assets
The fund manager seeks steady capital appreciation by maintaining a diversified portfolio of equities and seeks to earn regular income on the fixed income component by managing interest rate movements and credit risk.
Franklin Templeton Investmentswww.franklintempletonindia.com
FIPEP
Total amount Invested (Rs) 120,000 360,000 600,000 840,000 1,200,000 2,280,000Total value as on Mar 31, 2016 (Rs) 122,200 437,484 828,928 1,278,910 2,092,689 8,390,294Returns 3.42% 13.09% 12.89% 11.81% 10.72% 12.31%Total value of Benchmark ## 121,707 414,643 766,884 1,157,677 1,895,518 N.ABenchmark ## Returns 2.65% 9.40% 9.76% 9.02% 8.85% N.ATotal value of AB:CRISIL 10 Year Gilt Index 126,186 414,016 737,318 1,088,209 1,713,956 N.AAB:CRISIL 10 Year Gilt Index Returns 9.71% 9.30% 8.18% 7.28% 6.93% N.A
#EXPENSE RATIO : 2.47%#EXPENSE RATIO (DIRECT) : 1.69%
# The rates specified are the actual average expenses charged for the month of May 2016 . The above r a t i o includes the Service tax on Investment Management Fees . The above ratio also includes, proportionate charge in respect sales beyond T-15 cities subject to maximum of 30 bps on daily net assets, wherever applicable
Growth Plan ` 103.3060Dividend Plan ` 17.7048Direct - Growth Plan ` 105.6300Direct - Dividend Plan ` 18.1220
NAV as of May 31, 2016
7.88% GOI 2030 SOVEREIGN 5024.63 13.89
8.24% GOI 2033 SOVEREIGN 4053.82 11.21
8.17% GOI 2044 SOVEREIGN 2969.88 8.21
8.13% GOI 2045 SOVEREIGN 2694.37 7.45
7.68% GOI 2023 SOVEREIGN 2512.63 6.95
HPCL- Mittal Energy Ltd ICRA AA- 2462.81 6.81
7.59% GOI 2029 SOVEREIGN 495.96 1.37
Total Debt Holding 20214.09 55.88
Auto
Tata Motors Ltd. 74940 344.46 0.95
Hero Motocorp Ltd. 11000 340.88 0.94
Mahindra & Mahindra Ltd. 25000 330.58 0.91
TVS Motor Co. Ltd. 115000 327.35 0.91
Auto Ancillaries
Amara Raja Batteries Ltd. 27000 226.69 0.63
Balkrishna Industries Ltd. 20000 133.23 0.37
Banks
HDFC Bank Ltd.* 105000 1241.00 3.43
IndusInd Bank Ltd.* 61000 672.74 1.86
ICICI Bank Ltd.* 240000 587.16 1.62
Kotak Mahindra Bank Ltd.* 70000 522.59 1.44
Axis Bank Ltd.* 93000 479.14 1.32
Yes Bank Ltd.* 37500 387.38 1.07
State Bank of India 150000 307.43 0.85
Karur Vysya Bank Ltd. 47000 216.95 0.60
Cement
Ultra Tech Cement Ltd. 10000 322.67 0.89
Chemicals
Pidilite Industries Ltd. 40000 282.50 0.78
Construction Project
Larsen & Toubro Ltd.* 32000 471.54 1.30
Voltas Ltd. 60000 201.54 0.56
Consumer Non Durables
Asian Paints Ltd. 34000 334.85 0.93
Marico Ltd. 100820 251.24 0.69
ITC Ltd. 42000 147.44 0.41
United Breweries Ltd. 15000 108.84 0.30
Gas
Gujarat State Petronet Ltd. 143000 189.48 0.52
Industrial Products
Cummins India Ltd. 32100 256.80 0.71
Greaves Cotton Ltd. 130000 176.67 0.49
Media & Entertainment
Jagran Prakashan Ltd. 167000 282.48 0.78
Minerals/mining
Coal India Ltd. 55000 160.27 0.44
Petroleum Products
Reliance Industries Ltd. 40000 383.14 1.06
Bharat Petroleum Corp. Ltd. 31000 303.96 0.84
Pharmaceuticals
Torrent Pharmaceuticals Ltd.* 36000 483.03 1.34
Dr. Reddy's Laboratories Ltd. 11000 350.14 0.97
Sun Pharmaceutical Industries Ltd. 36000 274.59 0.76
Cadila Healthcare Ltd. 72000 242.21 0.67
Retailing
Aditya Birla Fashion and Retail Ltd. 119600 157.57 0.44
Services
Aditya Birla Nuvo Ltd. 23000 240.57 0.67
Software
Infosys Ltd.* 80000 998.92 2.76
HCL Technologies Ltd. 36000 266.33 0.74
Wipro Ltd. 48000 261.82 0.72
Telecom - Services
Bharti Airtel Ltd.* 160000 562.24 1.55
Tata Communications Ltd. 50000 228.63 0.63
Textile Products
Arvind Ltd. 50000 159.73 0.44
Transportation
Gateway Distriparks Ltd. 71000 209.13 0.58
Gujarat Pipavav Port Ltd. 128000 204.99 0.57
Total Equity Holding 14630.85 40.45
Composition by Assets Debt Portfolio : Composition by Rating
*Investors should consult their financial advisers if in doubt about whether the product is suitable for them.
FUND SIZE (AUM)Month End ` 361.71 croresMonthly Average ` 357.08 crores
Equity 40.45% Debt 55.88% Other Current Asset 3.67% ICRA AA-12.18 SOVEREIGN 87.82
#AVERAGE MATURITY PORTFOLIO YIELD MODIFIED DURATION
16.35 years7.99%8.19 years
MATURITY & YIELD
TYPE OF SCHEME
An Open-end Tax Saving Fund
BENCHMARK40% Nifty 500+60% Crisil Composite Bond Fund Index
# Calculated based on debt holdings in the portfolio
Note : Sector Allocation is provided as a percentage of Equity holding totaling to 100%Composition by Rating is provided as a percentage of Debt Holding totaling to 100%
Total Equity Holding 14,630.85 40.45Total Debt Holding 20,214.09 55.88Call,cash and other current asset 1,325.96 3.67TotalAsset 36,170.90 100.00
This is a Simple and Performing scheme which is eligible for distribution by new cadre of distributors.
30.17%
10.44%
9.23%
9.18%
5.76%
5.41%
4.70%
4.60%
2.96%
2.83%
2.46%
2.21%
1.93%
1.93%
1.64%
1.30%
1.10%
1.09%
1.08%
BANKS
SOFTWARE
PHARMACEUTICALS
AUTO
CONSUMER NON DURABLES
TELECOM - SERVICES
PETROLEUM PRODUCTS
CONSTRUCTION PROJECT
INDUSTRIAL PRODUCTS
TRANSPORTATION
AUTO ANCILLARIES
CEMENT
CHEMICALS
MEDIA & ENTERTAINMENT
SERVICES
GAS
MINERALS/MINING
TEXTILE PRODUCTS
RETAILING
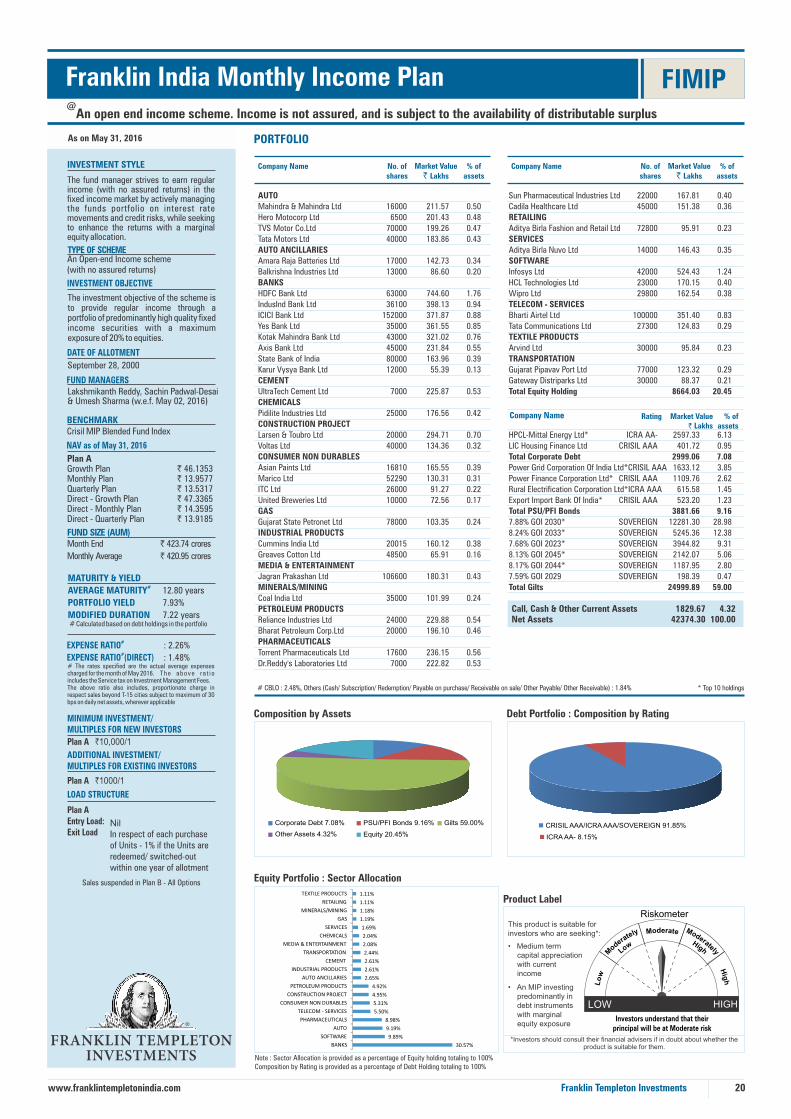
Sun Pharmaceutical Industries Ltd 22000 167.81 0.40
Cadila Healthcare Ltd 45000 151.38 0.36
RETAILING
Aditya Birla Fashion and Retail Ltd 72800 95.91 0.23
SERVICES
Aditya Birla Nuvo Ltd 14000 146.43 0.35
SOFTWARE
Infosys Ltd 42000 524.43 1.24
HCL Technologies Ltd 23000 170.15 0.40
Wipro Ltd 29800 162.54 0.38
TELECOM - SERVICES
Bharti Airtel Ltd 100000 351.40 0.83
Tata Communications Ltd 27300 124.83 0.29
TEXTILE PRODUCTS
Arvind Ltd 30000 95.84 0.23
TRANSPORTATION
Gujarat Pipavav Port Ltd 77000 123.32 0.29
Gateway Distriparks Ltd 30000 88.37 0.21
Total Equity Holding 8664.03 20.45
HPCL-Mittal Energy Ltd* ICRA AA- 2597.33 6.13
LIC Housing Finance Ltd CRISIL AAA 401.72 0.95
Total Corporate Debt 2999.06 7.08
Power Grid Corporation Of India Ltd* CRISIL AAA 1633.12 3.85
Power Finance Corporation Ltd* CRISIL AAA 1109.76 2.62
Rural Electrification Corporation Ltd* ICRA AAA 615.58 1.45
Export Import Bank Of India* CRISIL AAA 523.20 1.23
Total PSU/PFI Bonds 3881.66 9.16
7.88% GOI 2030* SOVEREIGN 12281.30 28.98
8.24% GOI 2033* SOVEREIGN 5245.36 12.38
7.68% GOI 2023* SOVEREIGN 3944.82 9.31
8.13% GOI 2045* SOVEREIGN 2142.07 5.06
8.17% GOI 2044* SOVEREIGN 1187.95 2.80
7.59% GOI 2029 SOVEREIGN 198.39 0.47
Total Gilts 24999.89 59.00
Call, Cash & Other Current Assets 1829.67 4.32Net Assets 42374.30 100.00
This product is suitable for investors who are seeking*:
• Medium term capital appreciation with current income
• An MIP investing predominantly in debt instruments with marginal equity exposure
Company Name No. ofshares
Market Value` Lakhs
% ofassets
Company Name No. ofshares
Market Value` Lakhs
% ofassets
FIMIPFranklin India Monthly Income Plan@
An open end income scheme. Income is not assured, and is subject to the availability of distributable surplus
Product Label
20
# CBLO : 2.48%, Others (Cash/ Subscription/ Redemption/ Payable on purchase/ Receivable on sale/ Other Payable/ Other Receivable) : 1.84% * Top 10 holdings
INVESTMENT STYLE
LOAD STRUCTURE
Plan AEntry Load:Exit Load
NilIn respect of each purchase of Units - 1% if the Units are redeemed/ switched-out within one year of allotment
Sales suspended in Plan B - All Options
As on May 31, 2016 PORTFOLIO
Franklin Templeton Investmentswww.franklintempletonindia.com
AUTO
Mahindra & Mahindra Ltd 16000 211.57 0.50
Hero Motocorp Ltd 6500 201.43 0.48
TVS Motor Co.Ltd 70000 199.26 0.47
Tata Motors Ltd 40000 183.86 0.43
AUTO ANCILLARIES
Amara Raja Batteries Ltd 17000 142.73 0.34
Balkrishna Industries Ltd 13000 86.60 0.20
BANKS
HDFC Bank Ltd 63000 744.60 1.76
IndusInd Bank Ltd 36100 398.13 0.94
ICICI Bank Ltd 152000 371.87 0.88
Yes Bank Ltd 35000 361.55 0.85
Kotak Mahindra Bank Ltd 43000 321.02 0.76
Axis Bank Ltd 45000 231.84 0.55
State Bank of India 80000 163.96 0.39
Karur Vysya Bank Ltd 12000 55.39 0.13
CEMENT
UltraTech Cement Ltd 7000 225.87 0.53
CHEMICALS
Pidilite Industries Ltd 25000 176.56 0.42
CONSTRUCTION PROJECT
Larsen & Toubro Ltd 20000 294.71 0.70
Voltas Ltd 40000 134.36 0.32
CONSUMER NON DURABLES
Asian Paints Ltd 16810 165.55 0.39
Marico Ltd 52290 130.31 0.31
ITC Ltd 26000 91.27 0.22
United Breweries Ltd 10000 72.56 0.17
GAS
Gujarat State Petronet Ltd 78000 103.35 0.24
INDUSTRIAL PRODUCTS
Cummins India Ltd 20015 160.12 0.38
Greaves Cotton Ltd 48500 65.91 0.16
MEDIA & ENTERTAINMENT
Jagran Prakashan Ltd 106600 180.31 0.43
MINERALS/MINING
Coal India Ltd 35000 101.99 0.24
PETROLEUM PRODUCTS
Reliance Industries Ltd 24000 229.88 0.54
Bharat Petroleum Corp.Ltd 20000 196.10 0.46
PHARMACEUTICALS
Torrent Pharmaceuticals Ltd 17600 236.15 0.56
Dr.Reddy's Laboratories Ltd 7000 222.82 0.53
Company Name Rating Market Value ` Lakhs
% ofassets
*Investors should consult their financial advisers if in doubt about whether the product is suitable for them.
derao tM e
wo
L
LOW HIGH
Moderately
Investors understand that their principal will be at Moderate risk
Riskometer
#EXPENSE RATIO#EXPENSE RATIO (DIRECT)
: 2.26%
: 1.48%# The rates specified are the actual average expenses charged for the month of May 2016 . The above r a t i o includes the Service tax on Investment Management Fees . The above ratio also includes, proportionate charge in respect sales beyond T-15 cities subject to maximum of 30 bps on daily net assets, wherever applicable
NAV as of May 31, 2016
Plan AGrowth Plan ` 46.1353Monthly Plan ` 13.9577Quarterly Plan ` 13.5317Direct - Growth Plan ` 47.3365Direct - Monthly Plan ` 14.3595Direct - Quarterly Plan ` 13.9185
FUND MANAGERS
DATE OF ALLOTMENT
September 28, 2000
INVESTMENT OBJECTIVE
The investment objective of the scheme is to provide regular income through a portfolio of predominantly high quality fixed income securities with a maximum exposure of 20% to equities.
ADDITIONAL INVESTMENT/MULTIPLES FOR EXISTING INVESTORS
Plan A `1000/1
MINIMUM INVESTMENT/MULTIPLES FOR NEW INVESTORS
Plan A `10,000/1
FUND SIZE (AUM)Month End ` 423.74 crores
Monthly Average ̀ 420.95 crores
Composition by Assets Debt Portfolio : Composition by Rating
The fund manager strives to earn regular income (with no assured returns) in the fixed income market by actively managing the funds portfolio on interest rate movements and credit risks, while seeking to enhance the returns with a marginal equity allocation.
TYPE OF SCHEMEAn Open-end Income scheme (with no assured returns)
BENCHMARKCrisil MIP Blended Fund Index
MATURITY & YIELD#AVERAGE MATURITY 12.80 years
PORTFOLIO YIELD 7.93%
MODIFIED DURATION 7.22 years# Calculated based on debt holdings in the portfolio
Equity Portfolio : Sector Allocation
Note : Sector Allocation is provided as a percentage of Equity holding totaling to 100%Composition by Rating is provided as a percentage of Debt Holding totaling to 100%
Corporate Debt 7.08% PSU/PFI Bonds 9.16% Gilts 59.00%
Other Assets 4.32% Equity 20.45%
CRISIL AAA/ICRA AAA/SOVEREIGN 91.85%
ICRA AA- 8.15%
Lakshmikanth Reddy, Sachin Padwal-Desai & Umesh Sharma (w.e.f. May 02, 2016)
30.57%
9.89%
9.19%
8.98%
5.50%
5.31%
4.95%
4.92%
2.65%
2.61%
2.61%
2.44%
2.08%
2.04%
1.69%
1.19%
1.18%
1.11%
1.11%
BANKS
SOFTWARE
AUTO
PHARMACEUTICALS
TELECOM - SERVICES
CONSUMER NON DURABLES
CONSTRUCTION PROJECT
PETROLEUM PRODUCTS
AUTO ANCILLARIES
INDUSTRIAL PRODUCTS
CEMENT
TRANSPORTATION
MEDIA & ENTERTAINMENT
CHEMICALS
SERVICES
GAS
MINERALS/MINING
RETAILING
TEXTILE PRODUCTS

Company Name Rating Market Value` Lakhs
% ofassets
Company Name Rating Market Value` Lakhs
% ofassets
FICBOF
21
As on May 31, 2016 PORTFOLIO
Product Label
# CBLO : 0.34%, Others (Cash/ Subscription/ Redemption/ Payable on purchase/ Receivable on sale/ Other Payable/ Other Receivable) : 1.74%* Top 10 holdings
Franklin Templeton Investmentswww.franklintempletonindia.com
Franklin India Corporate Bond Opportunities Fund
This product is suitable for investors who are seeking*:
• Medium to long term capital appreciation with current income
• A bond fund focusing on corporate securities
derao tM e
wo
L
LOW HIGH
Moderately
Investors understand that their principal will be at Moderate risk
Riskometer
*Investors should consult their financial advisers if in doubt about whether the product is suitable for them.
JSW Steel Ltd* CARE AA- 57990.12 8.41
Essel Infraprojects Ltd* BWR A-(SO) 38354.79 5.57
Dolvi Minerals And Metals Ltd* BWR A-(SO) 34289.09 4.98
Reliance Project Ventures And Management Pvt.ltd* BWR A+ (SO) 33490.00 4.86
Reliance Communications Enterprises Private Ltd* BWR A+ (SO) 29249.43 4.24
Renew Power Ventures Private Ltd* CARE A+ 28390.35 4.12
Tata Teleservices (maharashtra) Ltd* IND A+ 25234.98 3.66
Future Retail Ltd* CARE AA- 23826.18 3.46
DLF Ltd* ICRA A 22582.05 3.28
Nufuture Digital (india) Ltd* BWR A+ (SO) 22576.63 3.28
Hinduja Leyland Finance Ltd IND A+ 22467.74 3.26
JSW Energy Ltd CARE AA- 20979.59 3.04
Au Financiers (india) Private Ltd CRISIL A 18986.12 2.76
JSW Techno Projects Management Ltd BWR A(SO) 18779.86 2.73
OPJ Trading Private Ltd BWR BBB-(SO) 17173.67 2.49
Legitimate Asset Operators Private Ltd CARE A+(SO) 16933.65 2.46
ATC Telecom Infra Ltd BWR A+ 16838.25 2.44
Edelweiss Commodities Services Ltd ICRA AA 16700.99 2.42
Sprit Textiles Private Ltd BWR A+ (SO) 15218.08 2.21
IFMR Capital Finance Private Ltd ICRA A+ 12047.04 1.75
Au Financiers (india) Private Ltd IND A+ 12030.06 1.75
Dish Infra Services Private Ltd CARE A(SO) 11219.58 1.63
JSW Infrastructure Ltd CARE A+ 11000.31 1.60
Tata Bluescope Steel Ltd CARE AA(SO) 10966.54 1.59
Piramal Realty Private Ltd ICRA A+(SO) 10627.50 1.54
Hinduja Leyland Finance Ltd CARE A+ 10058.40 1.46
Reliance Inceptum Pvt Ltd BWR AA+(SO) 9781.81 1.42
SBK Properties Private Ltd ICRA AA-(SO) 9585.00 1.39
Au Housing Finance Ltd CRISIL A 9412.24 1.37
Bhavna Asset Operators Private Ltd BWR A+ (SO) 9317.83 1.35
Reliance Infrastructure Ltd IND AA-(SO) 8429.93 1.22
Ceat Ltd CARE AA- 7299.17 1.06
Essel Corporate Resources Pvt Ltd Privately Rated$ 7194.45 1.04
JSW Logistics Infrastructure Private Ltd BWR AA- (SO) 6600.94 0.96
Renew Power Ventures Private Ltd Privately Rated$ 6178.72 0.90
Ma Multi-trade Private Ltd BWR A+ (SO) 5023.21 0.73
Magma Fincorp Ltd CARE AA- 4688.04 0.68
LOAD STRUCTURE
ENTRY LOAD NilEXIT LOAD 3% if redeemed within 12
months from the date of allotment; 2% if redeemed after 12 months but within 24 months from the date of allotment; 1% if redeemed after 24 months but within 36 months from the date of allotment
CAP ON INVESTMENT
` 20 crores by an investor in each planper application per day
ADDITIONAL INVESTMENT/MULTIPLES FOR EXISTING INVESTORS
` 1000/1
MINIMUM INVESTMENT/MULTIPLES FOR NEW INVESTORS
` 5000/1
#EXPENSE RATIO : 1.82%#EXPENSE RATIO (DIRECT) : 0.95%
# The rates specified are the actual average expenses charged for the month of May 2016 . The above r a t i o includes the Service tax on Investment Management Fees . The above ratio also includes, proportionate charge in respect sales beyond T-15 cities subject to maximum of 30 bps on daily net assets, wherever applicable
Growth Plan ` 15.3570Dividend Plan ` 11.0802Direct - Growth Plan ` 15.8076Direct - Dividend Plan ` 11.4636
NAV as of May 31, 2016
FUND MANAGERSantosh Kamath & Sumit Gupta
DATE OF ALLOTMENT7th December 2011
INVESTMENT STYLE
2.05 years
11.01%
1.62 years
MATURITY & YIELD
AVERAGE MATURITY
PORTFOLIO YIELD
MODIFIED DURATION
INVESTMENT OBJECTIVE
The Fund seeks to provide regular income and capital appreciation through a focus on corporate securities.
FUND SIZE (AUM)
Month End ` 6891.36 crores
Monthly Average ` 6938.56 crores
Future Ideas Company Ltd BWR A+ (SO) 4353.24 0.63
Trent Hypermarket Ltd CARE AA(SO) 4156.04 0.60
HPCL-Mittal Energy Ltd ICRA AA- 3259.25 0.47
Hinduja Leyland Finance Ltd ICRA A+ 3120.09 0.45
Pri-media Services Private Ltd ICRA A(SO) 1688.22 0.24
Aasan Developers & Constructions Private Ltd ICRA A+(SO) 1212.39 0.18
ECL Finance Ltd CRISIL AA- 578.98 0.08
LIC Housing Finance Ltd CRISIL AAA 100.43 0.01
Total Corporate Debt 659990.94 95.77
Canara Bank CRISIL A1+ 9982.54 1.45
Axis Finance Ltd IND A1+ 2495.23 0.36
Housing Development Finance Corporation Ltd CRISIL A1+ 2365.37 0.34
Total Money Market Instruments 14843.14 2.15
TYPE OF SCHEME
An Open-end Income Fund
BENCHMARKCrisil Short Term Bond Fund Index Call, Cash & Other Current Assets 14301.75 2.08
Net Assets 689135.83 100.00
Composition by Assets Composition by Rating
Corporate Debt 95.77%
Money Market Instruments 2.15%
Other Assets 2.08%
CRISIL A1+/CRISIL AAA/IND A1+ 4.24%
BWR AA- (SO)/BWR AA+(SO)/CARE AA-/CARE AA(SO)/CRISIL AA-/ICRA AA/ICRA AA-/ICRA AA-(SO)/IND AA-(SO) 26.82%
BWR A(SO)/BWR A-(SO)/BWR A+ (SO)/CARE A(SO)/CARE A+/CARE A+(SO)/CRISIL A/ICRA A/ICRA A(SO)/ICRA A+/ICRAA+(SO)/IND A+ 64.50%
BWR BBB-(SO) 2.49% Privately Rated$ 1.94%

Company Name Rating Market Value` Lakhs
% ofassets
LOAD STRUCTURE
ENTRY LOAD NilEXIT LOAD 3% if redeemed within 12
months from the date of allotment; 2% if redeemed after 12 months but within 18 months from the date of allotment; 1% if redeemed after 18 months but within 24 months from the date of allotment.
FIIOFFranklin India Income Opportunities Fund
22
As on May 31, 2016 PORTFOLIO
# CBLO : 0.8%, Others (Cash/ Subscription/ Redemption/ Payable on purchase/ Receivable on sale/ Other Payable/ Other Receivable) : 1.97%* Top 10 holdings
Company Name Rating Market Value` Lakhs
% ofassets
Franklin Templeton Investmentswww.franklintempletonindia.com
Future Retail Ltd* CARE AA- 25783.10 8.23
Hinduja Leyland Finance Ltd* IND A+ 19369.81 6.18
Jindal Power Ltd* ICRA A- 18808.95 6.00
HPCL-Mittal Energy Ltd* ICRA AA- 17975.53 5.74
JSW Steel Ltd* CARE AA- 16965.85 5.41
JSW Energy Ltd* CARE AA- 16264.80 5.19
Renew Power Ventures Private Ltd* Privately Rated$ 15639.27 4.99
Reliance Project Ventures And
Management Pvt.ltd* BWR A+ (SO) 15609.77 4.98
Reliance Communications
Enterprises Private Ltd* BWR A+ (SO) 15229.88 4.86
DLF Ltd* ICRA A 15064.15 4.81
OPJ Trading Private Ltd BWR BBB-(SO) 10408.63 3.32
ATC Telecom Infra Ltd BWR A+ 8967.11 2.86
Legitimate Asset Operators Private Ltd CARE A+(SO) 7896.71 2.52
Tata Teleservices Ltd CARE A 6729.68 2.15
Reliance Inceptum Pvt Ltd BWR AA+(SO) 6623.10 2.11
Essel Corporate Resources Pvt Ltd Privately Rated$ 6563.36 2.09
Nufuture Digital (india) Ltd BWR A+ (SO) 6053.75 1.93
Ma Multi-trade Private Ltd BWR A+ (SO) 6027.85 1.92
ECL Finance Ltd CRISIL AA- 5789.82 1.85
JSW Logistics Infrastructure Private Ltd BWR AA- (SO) 5737.59 1.83
JSW Infrastructure Ltd CARE A+ 5574.48 1.78
Reliance Infrastructure Ltd IND AA-(SO) 5477.36 1.75
JSW Techno Projects Management Ltd BWR A(SO) 4765.04 1.52
SBK Properties Private Ltd ICRA AA-(SO) 4193.44 1.34
Magma Fincorp Ltd CARE AA- 4133.74 1.32
Equitas Finance Private Ltd IND A- 4025.37 1.28
Bhavna Asset Operators Private Ltd BWR A+ (SO) 3098.15 0.99
Future Consumer Enterprise Ltd CARE A- 3021.42 0.96
Future Ideas Company Ltd BWR A+ (SO) 2414.45 0.77
Albrecht Builder Private Ltd ICRA A+ 2256.67 0.72
Piramal Realty Private Ltd ICRA A+(SO) 2024.29 0.65
Au Housing Finance Ltd CRISIL A 1863.89 0.59
Pri-media Services Private Ltd ICRA A(SO) 1688.22 0.54
Hinduja Leyland Finance Ltd ICRA A+ 1315.01 0.42
IFMR Capital Finance Private Ltd ICRA A+ 1305.10 0.42
Dolvi Minerals And Metals Ltd BWR A-(SO) 1246.88 0.40
Hinduja Leyland Finance Ltd CARE A+ 1004.99 0.32
Total Corporate Debt 296917.19 94.76
Housing Development Finance
Corporation Ltd CRISIL A1+ 4730.74 3.00
National Bank For Agriculture And
Rural Development CRISIL A1+ 2497.20 0.80
Small Industries Development Bank Of India CARE A1+ 500.00 0.16
Total Money Market Instruments 7727.93 2.47
CAP ON INVESTMENT
` 20 crores by an investor in each planper application per day
ADDITIONAL INVESTMENT/MULTIPLES FOR EXISTING INVESTORS
` 1000/1
MINIMUM INVESTMENT/MULTIPLES FOR NEW INVESTORS
` 5000/1
#EXPENSE RATIO : 1.69%#EXPENSE RATIO (DIRECT) : 1.00%
# The rates specified are the actual average expenses charged for the month of May 2016 . The above r a t i o includes the Service tax on Investment Management Fees .The above ratio also includes, proportionate charge in respect sales beyond T-15 cities subject to maximum of 30 bps on daily net assets, wherever applicable
2.20 years
11.20%
1.84 years
MATURITY & YIELD
AVERAGE MATURITY
PORTFOLIO YIELD
MODIFIED DURATION
Growth Plan ` 17.4728Dividend Plan ` 10.9327Direct - Growth Plan ` 17.9793Direct - Dividend Plan ` 11.2338
NAV as of May 31, 2016
FUND MANAGER
Santosh Kamath & Sumit Gupta
DATE OF ALLOTMENTDecember 11, 2009
INVESTMENT STYLE
This product is suitable for investors who are seeking*:
• Medium term capital appreciation with current income
• A fund that invests across the yield curve - focusing on high accrual securities
derao tM e
wo
L
LOW HIGH
Moderately
Investors understand that their principal will be at Moderate risk
Riskometer
Product Label
*Investors should consult their financial advisers if in doubt about whether the product is suitable for them.
INVESTMENT OBJECTIVE
The Fund seeks to provide regular income and capital appreciation by investing in fixed income securities across the yield curve.
FUND SIZE (AUM)Month End ` 3133.30 croresMonthly Average ` 3162.05 crores
TYPE OF SCHEME
An Open-end Income Fund
BENCHMARKCrisil Short Term Bond Fund Index
Call, Cash & Other Current Assets 8684.69 2.77Net Assets 313329.81 100.00
Composition by Assets Composition by Rating
Corporate Debt 94.76%
Money Market Instruments 2.47%
Other Assets 2.77%
CARE A1+/CRISIL A1+ 5.24%
BWR AA- (SO)/BWR AA+(SO)/CARE AA-/CRISIL AA-/ICRA AA-/ICRA AA-(SO)/IND AA-(SO) 34.77%
BWR A(SO)/BWR A-(SO)/BWR A+ (SO)/CARE A/CARE A-/CARE A+/CARE A+(SO)/CRISIL A/ICRA A/ICRA A-/ICRA A(SO)/ICRA A+/ICRA A+(SO)/IND A-/IND A+ 49.58%
BWR BBB-(SO) 3.32% Privately Rated$ 7.09%

Company Name Rating Market Value` Lakhs
% ofassets
Company Name Rating Market Value` Lakhs
% ofassets
LOAD STRUCTURE
FIDAFranklin India Dynamic Accrual Fund
# CBLO : 2.55%, Others (Cash/ Subscription/ Redemption/ Payable on purchase/ Receivable on sale/ Other Payable/ Other Receivable) : 2.18%
Product Label
As on May 31, 2016 PORTFOLIO
$ Rated by SEBI Registered Agency
ENTRY LOAD NilEXIT LOAD 3% if redeemed within 12
months from the date of allotment;2% if redeemed after 12 months but within 24 months from the date of allotment;1% if redeemed after 24 months but within 36 months from the date of allotment;0.50% if redeemed after 36 months but within 48 months from the date of allotment
Reliance Broadcast Network Ltd* CARE AAA(SO) 7707.63 4.77
HPCL-Mittal Energy Ltd* ICRA AA- 7193.41 4.45
Future Retail Ltd* CARE AA- 7115.62 4.40
Renew Power Ventures Private Ltd* Privately Rated$ 6911.78 4.27
DLF Ltd* ICRA A 6527.66 4.04
Tata Teleservices (maharashtra) Ltd* IND A+ 5567.57 3.44
Essel Infraprojects Ltd* BWR A-(SO) 5305.94 3.28
Tata Teleservices Ltd* CARE A 5142.22 3.18
Dolvi Minerals And Metals Ltd* BWR A-(SO) 5112.19 3.16
Equitas Housing Finance Ltd* CRISIL A 5076.38 3.14
Bhavna Asset Operators Private Ltd BWR A+ (SO) 5037.97 3.12
Nufuture Digital (india) Ltd BWR A+ (SO) 4635.64 2.87
Sprit Textiles Private Ltd BWR A+ (SO) 4565.42 2.82
Essel Corporate Resources Pvt Ltd Privately Rated$ 4543.86 2.81
Reliance Inceptum Pvt Ltd BWR AA+(SO) 4483.33 2.77
Hinduja Leyland Finance Ltd ICRA A+ 4437.96 2.74
Piramal Realty Private Ltd ICRA A+(SO) 4048.57 2.50
Legitimate Asset Operators Private Ltd CARE A+(SO) 4024.28 2.49
Ma Multi-trade Private Ltd BWR A+ (SO) 4018.57 2.49
Reliance Communications
Enterprises Private Ltd BWR A+ (SO) 3933.54 2.43
OPJ Trading Private Ltd BWR BBB-(SO) 3643.59 2.25
Dish Infra Services Private Ltd CRISIL A- 3569.27 2.21
Reliance Infrastructure Ltd IND AA-(SO) 3451.62 2.13
Aasan Developers & Constructions Private Ltd ICRA A+(SO) 3132.01 1.94
Hinduja Leyland Finance Ltd IND A+ 3125.10 1.93
Au Financiers (india) Private Ltd IND A+ 3027.89 1.87
Reliance Project Ventures And
Management Pvt.ltd BWR A+ (SO) 3026.26 1.87
Essel Propack Ltd CARE AA- 3022.13 1.87
Future Consumer Enterprise Ltd CARE A- 3021.42 1.87
Jindal Power Ltd ICRA A- 3018.16 1.87
SBK Properties Private Ltd ICRA AA-(SO) 2995.31 1.85
Pri-media Services Private Ltd ICRA A(SO) 2476.05 1.53
IFMR Capital Finance Private Ltd ICRA A+ 2405.15 1.49
Future Ideas Company Ltd BWR A+ (SO) 2330.85 1.44
Indostar Capital Finance Ltd CARE AA- 2033.29 1.26
ATC Telecom Infra Ltd BWR A+ 1992.69 1.23
JSW Infrastructure Ltd CARE A+ 966.24 0.60
Renew Power Ventures Private Ltd CARE A+ 406.30 0.25
Total Corporate Debt 153032.90 94.65
Axis Finance Ltd IND A1+ 998.09 0.62
Total Money Market Instruments 998.09 0.62
FUND MANAGERSantosh Kamath, Umesh Sharma & Sachin Padwal - Desai (w.e.f. Feb 23, 2015)
ADDITIONAL INVESTMENT/MULTIPLES FOR EXISTING INVESTORS
` 1000/1
MINIMUM INVESTMENT/ MULTIPLES FOR NEW INVESTORS
` 10000/1
#EXPENSE RATIO : 1.76%#
EXPENSE RATIO (DIRECT) : 0.90%# The rates specified are the actual average expenses charged for the month of May 2016. The above ratio includes the Service tax on Investment Management Fees.The above ratio also includes, proportionate charge in respect sales beyond T-15 cities subject to maximum of 30 bps on daily net assets, wherever applicable
DATE OF ALLOTMENTMarch 5, 1997
INVESTMENT STYLE
*Investors should consult their financial advisers if in doubt about whether the product is suitable for them.
This product is suitable for investors who are seeking*:
• Medium term capital appreciation with current income
• A fund that focuses on fixed income securities with high accrual and potential for capital gains
derao tM e
wo
L
LOW HIGH
Moderately
Investors understand that their principal will be at Moderate risk
Riskometer
INVESTMENT OBJECTIVE
The primary investment objective of the Scheme is to generate a steady stream of income through investment in fixed income securities
FUND SIZE (AUM)
Month End ` 1616.88 crores
Monthly Average ` 1601.99 crores
23Franklin Templeton Investmentswww.franklintempletonindia.com
Growth Plan ` 51.8833Dividend Plan ` 11.6349Direct - Growth Plan ` 53.1756Direct - Dividend Plan ` 11.9687
NAV as of May 31, 2016
MATURITY & YIELDAVERAGE MATURITY 2.64 yearsPORTFOLIO YIELD 11.34%MODIFIED DURATION 2.12 years
TYPE OF SCHEME
An Open-end Income Fund
The fund manager strives to earn steady returns in the fixed income market by actively managing the funds portfolio on interest rate movements and credit risks
BENCHMARKCrisil Composite Bond Fund Index
* Top 10 holdings
Call, Cash & Other Current Assets 7656.97 4.74Net Assets 161687.96 100.00
Composition by Assets Composition by Rating
Corporate Debt 94.65%
Money Market Instruments 0.62%
CARE AAA(SO)/IND A1+ 10.12%
BWR AA+(SO)/CARE AA-/ICRA AA-/ICRA AA-(SO)/IND AA-(SO) 18.74%
BWR A-(SO)/BWR A+ (SO)/CARE A/CARE A-/CARE A+/CARE A+(SO)/CRISIL A/CRISIL A-/ICRA A/ICRA A-/ICRA A(SO)/ICRA A+/ICRA A+(SO)/IND A+ 61.81%
BWR BBB-(SO) 2.25%Other Assets 4.74% Privately Rated$ 7.09%

Company Name Rating Market Value` Lakhs
% ofassets
Company Name Rating Market Value` Lakhs
% ofassets
24
As on May 31, 2016 PORTFOLIO
Franklin Templeton Investmentswww.franklintempletonindia.com
*Investors should consult their financial advisers if in doubt about whether the product is suitable for them.
derao tM e
wo
L
LOW HIGH
Moderately
Investors understand that their principal will be at Low risk
RiskometerThis product is suitable for investors who are seeking*:
• Regular income for short term
• A liquid fund that invests in short term and money market instruments
Product Label
Franklin India Treasury Management Account FITMA
(ICRA)A1+mfs rating by ICRA*
JSW Techno Projects Management Ltd* BWR A(SO) 11211.86 3.92
Mahindra World City (jaipur) Ltd CRISIL A+ 8320.20 2.91
Tata Teleservices Ltd CARE A 8000.60 2.80
HPCL-Mittal Energy Ltd IND AA- 3990.97 1.39
Total Corporate Debt 31523.62 11.01
National Bank For Agriculture And Rural
Development* CRISIL A1+ 24122.72 8.43
Kotak Mahindra Bank Ltd* CRISIL A1+ 19166.89 6.70
Small Industries Development Bank Of India* CARE A1+ 17515.81 6.12
Power Finance Corporation Ltd* CRISIL A1+ 14724.91 5.15
S.D. Corporation Pvt Ltd* CARE A1+ 14688.03 5.13
National Fertilizers Ltd* CRISIL A1+ 12462.20 4.35
Tata Steel Ltd* IND A1+ 12234.39 4.27
Edelweiss Commodities Services Ltd* CRISIL A1+ 12009.81 4.20
Family Credit Ltd* CARE A1+ 9989.05 3.49
STCI Finance Ltd ICRA A1+ 9986.57 3.49
IDBI Bank CRISIL A1+ 9977.63 3.49
# CBLO : 0.15%, Others (Cash/ Subscription/ Redemption/ Payable on purchase/ Receivable on sale/ Other Payable/ Other Receivable) : 0.51% * Top 10 holdings
INVESTMENT STYLE
The fund manager strives to strike an optimum balance between steady income and high liquidity through a judicious mix of short term debt and money market instruments.
DATE OF ALLOTMENT
FITMA - R PlanFITMA- I PlanFITMA - SI Plan
April 29, 1998June 22, 2004September 2, 2005
FUND SIZE (AUM)
Month End ` 2861.97 crores
Monthly Average ` 2611.49 crores
INVESTMENT OBJECTIVE
The investment objective of the scheme is to provide current income along with high liquidity.
LOAD STRUCTURE
FITMA - SI PlanEntry LoadExit Load
NilNil
Sales suspended in Regular Plan & Institutional Plan
FUND MANAGER
Pallab Roy & Sachin Padwal-Desai
Tata Capital Housing Finance Ltd CRISIL A1+ 9969.77 3.48
HDFC Bank Ltd CRISIL A1+ 9908.14 3.46
Export Import Bank Of India CRISIL A1+ 9880.53 3.45
Reliance Capital Ltd ICRA A1+ 9354.99 3.27
Axis Finance Ltd IND A1+ 8933.89 3.12
Capital First Ltd CARE A1+ 7476.77 2.61
L&T Infrastructure Finance Company Ltd CARE A1+ 6957.57 2.43
Tata Motors Finance Ltd ICRA A1+ 4994.53 1.75
LIC Housing Finance Ltd CRISIL A1+ 4990.65 1.74
Aditya Birla Finance Ltd ICRA A1+ 4969.13 1.74
HDB Financial Services Ltd CARE A1+ 4948.26 1.73
Indian Railway Finance Corporation Ltd CRISIL A1+ 4581.81 1.60
Punjab And Sind Bank ICRA A1+ 3989.14 1.39
Union Bank Of India CRISIL A1+ 2490.56 0.87
JM Financial Products Ltd ICRA A1+ 2450.00 0.86
Total Money Market Instruments 252773.73 88.32
FITMA - Super Institutional Plan (Direct)
Growth Plan
Weekly Dividend Plan
Daily Dividend
` 2296.4719
` 1021.8278
` 1001.8518
NAV as of May 31, 2016
FITMA - R Plan
Growth Option
Weekly Option
Daily Dividend Option
` 3663.0339
` 1244.8085
` 1512.3400
FITMA - I Plan
Growth Option
Weekly Option
Daily Dividend Option
` 2358.2877
` 1055.1422
` 1000.6730
` 2291.8808
` 1021.5589
` 1000.7164
FITMA Super Institutional Plan
Growth Option
Weekly Dividend Option
Daily Dividend
ADDITIONAL INVESTMENT/MULTIPLES FOR EXISTING INVESTORS
FITMA - SI Plan - WDPFITMA - SI Plan - other options
` 1 lakh/1` 1000/1
R Plan: Regular Plan; I Plan: InstitutionalPlan; SI Plan - Super Institutional PlanWDP : Weekly Dividend Payout
MINIMUM INVESTMENT/MULTIPLES FOR NEW INVESTORSFITMA - SI Plan - WDPFITMA - SI Plan - other options
` 25 lakh/1`10,000/1
MATURITY & YIELDAVERAGE MATURITYPORTFOLIO YIELD MODIFIED DURATION
0.11 Years7.86%0.10 Years
#EXPENSE RATIO FITMA-R PlanFITMA-I PlanFITMA SI Plan
0.86%0.61%0.20%
#EXPENSE RATIO (DIRECT)
FITMA SI Plan 0.13%
# The rates specified are the actual average expenses charged for the month of The above ratio includes May 2016 .the Service tax on Investment Management Fees.The above ratio also includes, proportionate charge in respect sales beyond T-15 cities subject to maximum of 30 bps on daily net assets, wherever applicable
TYPE OF SCHEME
An Open-end Liquid scheme
BENCHMARKCrisil Liquid Fund Index
Call, Cash & Other Current Assets 1900.13 0.66Net Assets 286197.47 100.00
This is a Simple and Performing scheme which is eligible for distribution by new cadre of distributors.
Composition by RatingComposition by Assets
Corporate Debt 11.01%
Money Market Instruments 88.32%
Other Assets 0.66%
CARE A1+/CRISIL A1+/ICRA A1+/IND A1+ 88.99%
IND AA- 1.39%
BWR A(SO)/CARE A/CRISIL A+ 9.62%

Company Name Rating Market Value` Lakhs
% ofassets
Company Name Rating Market Value` Lakhs
% ofassets
25
As on May 31, 2016 PORTFOLIO
Franklin Templeton Investmentswww.franklintempletonindia.com
Franklin India Income Builder Account FIIBA
# CBLO : 1.44%, Others (Cash/ Subscription/ Redemption/ Payable on purchase/ Receivable on sale/ Other Payable/ Other Receivable) : 1.48% * Top 10 holdings
HPCL-Mittal Energy Ltd* ICRA AA- 7920.90 6.27
Reliance Broadcast Network Ltd* CARE AAA(SO) 7707.63 6.10
Dolvi Minerals And Metals Ltd* BWR A-(SO) 7231.88 5.72
Future Retail Ltd* CARE AA- 7116.88 5.63
DLF Ltd* ICRA A 7026.10 5.56
Legitimate Asset Operators Private Ltd* CARE A+(SO) 6492.74 5.14
Sprit Textiles Private Ltd* BWR A+ (SO) 6340.87 5.02
Reliance Project Ventures And
Management Pvt.Ltd* BWR A+ (SO) 6302.42 4.99
Pri-media Services Private Ltd ICRA A(SO) 5052.22 4.00
Reliance Infrastructure Ltd IND AA-(SO) 4935.57 3.90
Indostar Capital Finance Ltd CARE AA- 4476.43 3.54
Bhavna Asset Operators Private Ltd BWR A+ (SO) 3975.33 3.14
ATC Telecom Infra Ltd BWR A+ 3487.21 2.76
JSW Steel Ltd CARE AA- 3067.23 2.43
JSW Logistics Infrastructure Private Ltd BWR AA- (SO) 2996.85 2.37
Hinduja Leyland Finance Ltd IND A+ 2604.25 2.06
Jindal Power Ltd ICRA A- 2232.37 1.77
JSW Infrastructure Ltd CARE A+ 2229.79 1.76
OPJ Trading Private Ltd BWR BBB-(SO) 2179.34 1.72
Nufuture Digital (india) Ltd BWR A+ (SO) 2019.97 1.60
Cholamandalam Investment And
Finance Company Ltd ICRA AA 448.68 0.35
Tata Bluescope Steel Ltd CARE AA(SO) 106.26 0.08
Total Corporate Debt 95950.92 75.91
7.72% GOI 2025* SOVEREIGN 11550.60 9.14
8.27% GOI 2020* SOVEREIGN 7736.25 6.12
Total Gilts 19286.85 15.26
Canara Bank CRISIL A1+ 2497.68 1.98
Oriental Bank Of Commerce CRISIL A1+ 2496.28 1.97
Axis Finance Ltd IND A1+ 2495.23 1.97
Total Money Market Instruments 7489.19 5.92
*Investors should consult their financial advisers if in doubt about whether the product is suitable for them.
This product is suitable for investors who are seeking*:
• Medium term capital appreciation with current income
• A long bond fund – focuses on Corporate / PSU Bonds
Product Label
derao tM e
wo
L
LOW HIGH
Moderately
Investors understand that their principal will be at Moderate risk
Riskometer
DATE OF ALLOTMENTJune 23, 1997
FUND MANAGERSantosh Kamath & Sumit Gupta
MINIMUM INVESTMENT/MULTIPLES FOR NEW INVESTORS
Plan A : `10,000 / 1
LOAD STRUCTUREPlan A : Entry Load: NilExit Load: 0.50%, if redeemed within 1 year of allotment
Sales suspended in Plan B - All Options
#EXPENSE RATIO#EXPENSE RATIO (DIRECT)
: 2.02%: 1.38%
# The rates specified are the actual average expenses charged for the month of May 2016 . The above r a t i o includes the Service tax on Investment Management Fees.The above ratio also includes, proportionate charge in respect sales beyond T-15 cities subject to maximum of 30 bps on daily net assets, wherever applicable
NAV as of May 31, 2016
Plan AGrowth Plan ` 52.1618Annual Dividend Plan ` 16.9550Monthly Dividend Plan ` 15.5809Quarterly Dividend Plan ̀ 13.4401Half-yearly Dividend Plan ` 13.7167Direct - Growth Plan ` 53.6546Direct - Annual Dividend Plan ` 17.5309Direct - Monthly Dividend Plan ` 16.1010Direct - Quarterly Dividend Plan ` 13.8950Direct - Half-yearly Dividend Plan `14.3447
FUND SIZE (AUM)
Month End ` 1264.06 crores
Monthly Average ` 1279.64 crores
INVESTMENT OBJECTIVE
The investment objective of the Scheme is primarily to provide investors Regular income under the Dividend Plan and Capital appreciation under the Growth Plan. It is a scheme designed for investors seeking regular returns in the form of dividends or capital appreciation. Investing in quality bonds and debentures, the scheme has an active management style that emphasizes quality of debt, tapping opportunities from interest rate changes and deriving maximum value by targeting undervalued sectors.
ADDITIONAL INVESTMENT/MULTIPLES FOR EXISTING INVESTORS
MATURITY & YIELDAVERAGE MATURITY :PORTFOLIO YIELD MODIFIED DURATION :
3.28 years10.50%2.60 years
TYPE OF SCHEME
An Open-end Income scheme
BENCHMARKCrisil Composite Bond Fund Index
Call, Cash & Other Current Assets 3679.51 2.91Net Assets 126406.47 100.00
Composition by Assets Composition by Rating
Corporate Debt 75.91%
Gilts15.26%
Money Market Instruments 5.92%Other Assets 2.91%
CARE AAA(SO)/CRISIL A1+/IND A1+/SOVEREIGN 30.19%
BWR AA- (SO)/CARE AA-/CARE AA(SO)/ICRA AA/ICRA AA-/IND AA-(SO) 24.58%
BWR A-(SO)/BWR A+ (SO)/CARE A+/CARE A+(SO)/ICRA A/ICRA A-/ICRA A(SO)/IND A+43.51%
BWR BBB-(SO)1.72%

Product Label
This product is suitable for investors who are seeking*:
• Regular income for short term
• A fund that invests in short term debt and money market instruments
derao tM e
wo
L
LOW HIGH
Moderately
Investors understand that their principal will be at Moderate risk
Riskometer
*Investors should consult their financial advisers if in doubt about whether the product is suitable for them.
# CBLO : 0.37%, Others (Cash/ Subscription/ Redemption/ Payable on purchase/ Receivable on sale/ Other Payable/ Other Receivable) : 0.76%
JSW Energy Ltd* CARE AA- 36051.59 7.21
Edelweiss Commodities Services Ltd* ICRA AA 30329.22 6.06
Edelweiss Retail Finance Ltd* ICRA AA 27818.57 5.56
Albrecht Builder Private Ltd* ICRA A+ 25951.68 5.19
DLF Ltd* ICRA A 25045.25 5.01
Hinduja Leyland Finance Ltd* CARE A+ 18988.31 3.80
JSW Techno Projects Management Ltd* BWR A(SO) 18178.31 3.63
Au Financiers (india) Private Ltd IND A+ 17500.87 3.50
JSW Steel Ltd CARE AA- 12134.81 2.43
Ceat Ltd CARE AA- 9998.86 2.00
Reliance Infrastructure Ltd IND AA-(SO) 6666.29 1.33
Sprit Textiles Private Ltd BWR A+ (SO) 6330.45 1.27
Tata Teleservices Ltd CARE A 5500.41 1.10
Shriram Housing Finance Ltd IND AA 4997.28 1.00
Writers And Publishers Pvt Ltd BWR AA- (SO) 4939.09 0.99
Legitimate Asset Operators
Private Ltd CARE A+(SO) 4884.32 0.98
Essel Corporate Resources Pvt Ltd Privately Rated$ 3786.55 0.76
Sharda Solvent Ltd BWR AA- (SO) 3596.62 0.72
HPCL-Mittal Energy Ltd IND AA- 3492.10 0.70
Capital First Ltd CARE AA+ 2507.74 0.50
Toyota Financial Services India Ltd CRISIL AAA 1501.92 0.30
Total Corporate Debt 270200.22 54.02
Power Finance Corporation Ltd* CRISIL A1+ 34126.63 6.82
Punjab And Sind Bank* ICRA A1+ 30897.30 6.18
Oriental Bank Of Commerce* CRISIL A1+ 19994.41 4.00
Export Import Bank Of India CRISIL A1+ 17008.41 3.40 * Top 10 holdings $ Rated by SEBI Registered Agency
National Bank For Agriculture And
Rural Development CRISIL A1+ 14442.13 2.89
Tata Motors Finance Ltd ICRA A1+ 11750.66 2.35
IDBI Bank CRISIL A1+ 9973.92 1.99
Tata Capital Housing Finance Ltd CRISIL A1+ 9862.62 1.97
Housing Development Finance
Corporation Ltd CRISIL A1+ 9726.40 1.94
STCI Finance Ltd CRISIL A1+ 8580.16 1.72
Tata Steel Ltd IND A1+ 7658.93 1.53
Mahindra Rural Housing Finance Ltd IND A1+ 6868.29 1.37
Union Bank Of India CRISIL A1+ 4981.11 1.00
JM Financial Credit Solutions Ltd ICRA A1+ 4932.90 0.99
JM Financial Products Ltd ICRA A1+ 3767.32 0.75
JM Financial Ltd ICRA A1+ 3495.99 0.70
National Fertilizers Ltd CRISIL A1+ 3489.42 0.70
Small Industries Development Bank Of India CARE A1+ 3473.69 0.69
L&T Infrastructure Finance Company Ltd CARE A1+ 2981.81 0.60
Canara Bank CRISIL A1+ 2497.68 0.50
Capital First Ltd CARE A1+ 2492.26 0.50
Kotak Commodity Services Ltd ICRA A1+ 2483.52 0.50
ICICI Bank Ltd CRISIL A1+ 2468.79 0.49
Shapoorji Pallonji & Co Ltd ICRA A1+ 2425.77 0.48
Allahabad Bank CRISIL A1+ 2095.12 0.42
HDFC Bank Ltd CRISIL A1+ 1882.55 0.38
Total Money Market Instruments 224357.76 44.85
Company Name Rating Market Value` Lakhs
% ofassets
Company Name Rating Market Value` Lakhs
% ofassets
26
As on May 31, 2016 PORTFOLIO
Franklin Templeton Investmentswww.franklintempletonindia.com
FUND MANAGER
Pallab Roy & Sachin Padwal Desai
LOAD STRUCTURE
INVESTMENT OBJECTIVE
To provide a combination of regular income and high liquidity by investing primarily in a mix of short term debt and money market instruments.
INVESTMENT STYLE
The fund manager strives to strike an optimum balance between regular income and high liquidity through a judicious mix of short term debt and money market instruments.
Franklin India Ultra Short Bond Fund FIUBF
FUND SIZE (AUM)
Month End ` 5002.06 crores
Monthly Average ` 4835.16 crores
# The rates specified are the actual average expenses charged for the month of May 2016 . The above r a t i o includes the Service tax on Investment Management Fees.The above ratio also includes, proportionate charge in respect sales beyond T-15 cities subject to maximum of 30 bps on daily net assets, wherever applicable
#EXPENSE RATIO :
RP : 0.86%IP : 0.66%SIP : 0.30%
Entry Load:Exit Load:
NilNil
FIUBF - Retail PlanGrowth Option ` 19.8348Weekly Option ` 10.1128Daily Dividend Option ` 10.0507FIUBF - Institutional PlanGrowth Option ` 20.1732Daily Dividend Option ` 10.0011FIUBF Super Insitutional PlanGrowth Option ` 20.6363Weekly Option ` 10.0831Daily Dividend Option ` 10.0759FIUBF - Super Insitutional Plan (Direct)Growth Option ` 20.6839Weekly Option ` 10.0977Daily Dividend Option ` 10.0595
NAV as of May 31, 2016
DATE OF ALLOTMENTDecember 18,2007
MATURITY & YIELDAVERAGE MATURITYPORTFOLIO YIELD MODIFIED DURATION
0.43 years8.92%0.39 years
MINIMUM INVESTMENT/MULTIPLES FOR NEW INVESTORS:SIP : ` 10,000/1
ADDITIONAL INVESTMENT/MULTIPLES FOR EXISTING INVESTORS:SIP : ` 1000/1
RP-Retail Plan, IP-Institutional Plan,SIP-Super Institutional PlanSales suspended in Retail Plan & Institutional Plan
TYPE OF SCHEME
An Open-end Income scheme
BENCHMARKCrisil Liquid Fund Index
#EXPENSE RATIO (DIRECT)
SIP : 0.22%
Call, Cash & Other Current Assets 5648.33 1.13Net Assets 500206.32 100.00
Composition by Assets Composition by Rating
Corporate Debt 54.02%
Money Market Instruments 44.85%
Other Assets 1.13%
CARE A1+/CRISIL A1+/CRISIL AAA/ICRA A1+/IND A1+46.28%
BWR AA- (SO)/CARE AA-/CARE AA+/ICRA AA/IND AA/IND AA-/IND AA-(SO)28.49%
BWR A(SO)/BWR A+ (SO)/CARE A/CARE A+/CARE A+(SO)/ICRA A/ICRA A+/IND A+24.47%
Privately Rated$0.76%

# CBLO : 0.89%, Others (Cash/ Subscription/ Redemption/ Payable on purchase/ Receivable on sale/
Other Payable/ Other Receivable) : 5.02%
Company Name Rating Market Value` Lakhs
% ofassets
Company Name Rating Market Value` Lakhs
% ofassets
PORTFOLIO
8.24% GOI 2033 SOVEREIGN 2305.37 35.158.13% GOI 2045 SOVEREIGN 1858.19 28.338.17% GOI 2044 SOVEREIGN 1213.78 18.517.88% GOI 2030 SOVEREIGN 772.63 11.787.59% GOI 2029 SOVEREIGN 49.60 0.76Total Gilts 6199.56 94.53
Composite Plan (CP) / PF Plan (PF) Long Term Plan (LT)
# CBLO : 3.03%, Others (Cash/ Subscription/ Redemption/ Payable on purchase/ Receivable on sale/ Other Payable/ Other Receivable) : 2.43%
8.24% GOI 2033 SOVEREIGN 15153.27 40.908.17% GOI 2044 SOVEREIGN 9012.93 24.338.13% GOI 2045 SOVEREIGN 6142.33 16.587.88% GOI 2030 SOVEREIGN 4100.50 11.077.59% GOI 2029 SOVEREIGN 247.98 0.677.68% GOI 2023 SOVEREIGN 201.01 0.54Total Gilts 34858.02 94.09
Averagematurity
Portfolio Yield
FIGSF - CP/PF Plan:
FIGSF - LT:
21.38 years
20.56 years
7.80%
7.79%
9.47 years
9.33 years
27
As on May 31, 2016
Franklin Templeton Investmentswww.franklintempletonindia.com
FUND MANAGER
Sachin Padwal - Desai & Umesh Sharma
INVESTMENT OBJECTIVE
The Primary objective of the Scheme is to generate credit risk-free return through investments in sovereign securities issued by the Central Government and / or a State Government and / or any security unconditionally guaranteed by the central Government and / or State Government for repayment of Principal and Interest.
INVESTMENT STYLE
The fund manager strives to enhance
portfolio returns by actively managing the
portfolio duration and market volatility.
DATE OF ALLOTMENTFIGSF - CP: June 21, 1999 ,FIGSF - PF Plan: May 7, 2004FIGSF - LT: December 7, 2001
Franklin India Government Securities Fund
#EXPENSE RATIO : FIGSF - CP / FIGSF-PF Plan: 1.78%, (Direct): 0.67%FIGSF - LT: 1.74%, (Direct): 0.80%
# The rates specified are the actual average expenses charged for the month of May 2016 . The above r a t i o includes the Service tax on Investment Management Fees . The above ratio also includes, proportionate charge in respect sales beyond T-15 cities subject to maximum of 30 bps on daily net assets, wherever applicable
NAV as of May 31, 2016
FIGSF - CPGrowth Plan 50.3578 ̀ Dividend Plan 11.4078 ` FIGSF - LTGrowth Plan 35.3294 ̀ Dividend Plan 11.5212 ` FIGSF - PF PlanGrowth Plan 22.1184 ̀ Dividend Plan 22.1184 ` FIGSF - CP (Direct)Growth Plan 51.5770 ̀ Dividend Plan 11.8045 ` FIGSF - LT (Direct)Growth Plan 36.5460 ̀ Dividend Plan 11.9627 `
FUND SIZE (AUM)
FIGSF - CP/PFMonth End ` 65.58 croresMonthly Average ` 65.41 crores
FIGSF - LTMonth End ` 370.48 croresMonthly Average ` 378.84 crores
FIGSF
Product Label - FIGSF CP/PF/LT
This product is suitable for investors who are seeking*:
• Medium term capital appreciation with current income
• A fund thatinvests in Indiangovernmentsecurities
derao tM e
w
oL
LOW HIGH
Moderately
Investors understand that their principal will be at Moderate risk
Riskometer
*Investors should consult their financial advisers if in doubt about whether the product is suitable for them.
LOAD STRUCTURE
FIGSF-CP/PF: Entry Load: Nil Exit Load: In respect of each purchase of Units – 0.50% if the Units are redeemed/switched-out within 3 months of allotment
FIGSF-LT : Entry Load: Nil Exit Load: Nil
ADDITIONAL INVESTMENT/MULTIPLES FOR EXISTING INVESTORSFIGSF - CP/LT: ` 1000/1; FIGSF - PF Plan: ` 5000/1
MINIMUM INVESTMENT FOR NEW / EXISTING INVESTORSFIGSF - CP/LT: ` 10,000/1 (G); ` 25,000/1 (D); FIGSF-PF Plan: ` 25,000/1
TYPE OF SCHEME
An Open-end dedicated Gilts scheme
BENCHMARKCP & PF: I-SEC Composite Gilt Index LT: I-SEC Li-Bex
Modified Duration
Call, Cash & Other Current Assets 358.43 5.47Net Assets 6557.99 100.00
Call, Cash & Other Current Assets 2190.24 5.91Net Assets 37048.26 100.00
Composition by Rating
Composition by Assets - CP/PF
Gilts 94.53% Other Assets 5.47%
SOVEREIGN 100%
Composition by Assets - LT
Gilts 94.09% Other Assets 5.91%

Franklin India Short Term Income Plan FISTIP
Company Name Rating Market Value` Lakhs
% ofassets
Company Name Rating Market Value` Lakhs
% ofassets
# CBLO : 0.18%, Others (Cash/ Subscription/ Redemption/ Payable on purchase/ Receivable on sale/ Other Payable/ Other Receivable) : 1.71%
PORTFOLIOAs on May 31, 2016
DATE OF ALLOTMENT
FISTIPFISTIP-Institutional Plan
January 31, 2002September 6, 2005
FUND MANAGER
Santosh Kamath & Kunal Agrawal
MINIMUM INVESTMENT/MULTIPLES FOR NEW INVESTORS
Retail: `5000/1
ADDITIONAL INVESTMENT/MULTIPLES FOR EXISTING INVESTORS
Retail: `5000/1
LOAD STRUCTURE
Entry LoadExit Load
Sales suspended in Retail Plan -Bonus Option & Institutional Plan
28
Nil
Franklin Templeton Investmentswww.franklintempletonindia.com
MATURITY & YIELD
AVERAGE MATURITYPORTFOLIO YIELD MODIFIED DURATION
2.06 years11.07%1.72 years
INVESTMENT STYLE
DLF Ltd* ICRA A 50687.97 6.31
Sprit Textiles Private Ltd* BWR A+ (SO) 46130.25 5.74
Essel Corporate Resources Pvt Ltd* Privately Rated$ 41020.98 5.10
Reliance Project Ventures And
Management Pvt.ltd* BWR A+ (SO) 40534.51 5.04
Dolvi Minerals And Metals Ltd* BWR A-(SO) 39401.28 4.90
Future Retail Ltd* CARE AA- 37991.21 4.73
HPCL-Mittal Energy Ltd* ICRA AA- 37157.00 4.62
Hinduja Leyland Finance Ltd* CARE A+ 36189.42 4.50
ATC Telecom Infra Ltd* BWR A+ 28495.50 3.55
JSW Energy Ltd* CARE AA- 25918.97 3.23
Jindal Power Ltd ICRA A- 21909.27 2.73
Dish Infra Services Private Ltd CRISIL A- 21046.39 2.62
Reliance Broadcast Network Ltd CARE AAA(SO) 20470.51 2.55
Edelweiss Retail Finance Ltd ICRA AA 20257.32 2.52
Tata Teleservices (maharashtra) Ltd IND A+ 19739.58 2.46
JSW Steel Ltd CARE AA- 19536.93 2.43
Equitas Finance Private Ltd IND A- 19188.05 2.39
Bhavna Asset Operators Private Ltd BWR A+ (SO) 18852.29 2.35
OPJ Trading Private Ltd BWR BBB-(SO) 18626.56 2.32
Tata Teleservices Ltd CARE A 17983.55 2.24
Pri-media Services Private Ltd ICRA A(SO) 17176.30 2.14
Au Financiers (india) Private Ltd IND A+ 15992.70 1.99
Renew Power Ventures Private Ltd Privately Rated$ 13067.39 1.63
Albrecht Builder Private Ltd ICRA A+ 11283.34 1.40
ECL Finance Ltd CRISIL AA- 11000.65 1.37
JSW Infrastructure Ltd CARE A+ 9959.74 1.24
JSW Logistics Infrastructure Private Ltd BWR AA- (SO) 9642.40 1.20
Hinduja Leyland Finance Ltd ICRA A+ 8262.55 1.03
Reliance Communications Enterprises
Private Ltd BWR A+ (SO) 8068.81 1.00
JSW Techno Projects Management Ltd BWR A(SO) 7708.15 0.96
Reliance Infrastructure Ltd IND AA-(SO) 7476.15 0.93
Mahindra Lifespace Developers Ltd CRISIL AA- 7221.05 0.90
Reliance Inceptum Pvt Ltd BWR AA+(SO) 7132.57 0.89
Tata Bluescope Steel Ltd CARE AA(SO) 6269.63 0.78
Future Ideas Company Ltd BWR A+ (SO) 6076.21 0.76
NAV as of May 31, 2016
FISTIP - Retail PlanGrowth Plan ` 3104.6753Weekly Plan ` 1088.7987Monthly Plan ` 1190.4155Quarterly Plan ` 1239.2977 FISTIP - Retail Plan (Direct)Growth Plan ` 3194.6102Weekly Plan ` 1090.1295Monthly Plan ` 1225.4646Quarterly Plan ` 1276.4249
This product is suitable for investors who are seeking*:
• Regular income for medium term
• A fund that invests in short term corporate bonds including PTCs
derao tM e
wo
L
LOW HIGH
Moderately
Investors understand that their principal will be at Moderate risk
Riskometer
Product Label
*Investors should consult their financial advisers if in doubt about whether the product is suitable for them.
INVESTMENT OBJECTIVE
The objective of the Scheme is to provide investors stable returns by investing in fixed income securities.
FUND SIZE (AUM)
Month End ` 8036.86 croresMonthly Average ` 8091.73 crores
Hinduja Leyland Finance Ltd IND A+ 6067.93 0.76
Ma Multi-trade Private Ltd BWR A+ (SO) 5023.21 0.63
Essel Infraprojects Ltd BWR A-(SO) 4275.16 0.53
SBK Properties Private Ltd ICRA AA-(SO) 4193.44 0.52
Indostar Capital Finance Ltd CARE AA- 4166.07 0.52
Future Consumer Enterprise Ltd CARE A- 4018.17 0.50
Edelweiss Commodities Services Ltd ICRA AA 3542.63 0.44
Piramal Realty Private Ltd ICRA A+(SO) 3542.50 0.44
Mahindra Bebanco Developers Ltd CRISIL A 2505.74 0.31
Aasan Developers & Constructions
Private Ltd ICRA A+(SO) 2222.72 0.28
Essel Propack Ltd CARE AA- 2048.56 0.25
Magma Fincorp Ltd CARE AA- 2016.46 0.25
Cholamandalam Investment & Fin. Co. Ltd ICRA AA 900.47 0.11
Capital First Ltd CARE AA+ 501.55 0.06
Tata Power Ltd CRISIL AA- 500.83 0.06
Housing Development Finance Corporation Ltd CRISIL AAA 100.16 0.01
Total Corporate Debt 773100.80 96.19
Power Grid Corporation Of India Ltd CRISIL AAA 5070.12 0.63
Rural Electrification Corporation Ltd ICRA AAA 1436.35 0.18
Total PSU/PFI Bonds 6506.47 0.81
LIC Housing Finance Ltd CRISIL A1+ 8184.66 1.02
Export Import Bank Of India CRISIL A1+ 698.17 0.09
Total Money Market Instruments 8882.82 1.11
#EXPENSE RATIO#EXPENSE RATIO (Institutional)#EXPENSE RATIO (Direct)
: 1.56%: 1.18%: 0.88%
# The rates specified are the actual average expenses charged for the month of May 2016 . The above r a t i o includes the Service tax on Investment Management Fees . The above ratio also includes, proportionate charge in respect sales beyond T-15 cities subject to maximum of 30 bps on daily net assets, wherever applicable
TYPE OF SCHEME
An Open-end Income scheme
BENCHMARKCrisil Short Term Bond Fund Index
Composition by RatingComposition by Assets
Corporate Debt 96.19% PSU/PFI Bonds 0.81%
Money Market Instruments 1.11% Other Assets 1.89%
* Top 10 holdings
Call, Cash & Other Current Assets 15195.92 1.89Net Assets 803686.01 100.00
CARE AAA(SO)/CRISIL A1+/CRISIL AAA/ICRA AAA6.37%
BWR AA- (SO)/BWR AA+(SO)/CARE AA-/CARE AA(SO)/CARE AA+/CRISIL AA-/ICRA AA/ICRA AA-/ICRA AA-(SO)/IND AA-(SO)25.82%
BWR A(SO)/BWR A-(SO)/BWR A+ (SO)/CARE A/CARE A-/CARE A+/CRISIL A/CRISIL A-/ICRA A/ICRA A-/ICRA A(SO)/ICRA A+/ICRA A+(SO)/IND A-/IND A+58.77%
BWR BBB-(SO)2.32%
Privately Rated$6.73%

# CBLO : 1.74%, Others (Cash/ Subscription/ Redemption/ Payable on purchase/ Receivable on sale/ Other Payable/ Other Receivable) : 2.9%
Edelweiss Commodities Services Ltd* ICRA AA 2527.44 8.31
Housing Development Finance
Corporation Ltd* CRISIL AAA 2506.59 8.24
Kotak Mahindra Prime Ltd* CRISIL AAA 2295.47 7.55
Trent Hypermarket Ltd* CARE AA(SO) 1384.54 4.55
Cholamandalam Investment And
Finance Company Ltd ICRA AA 1246.32 4.10
Toyota Financial Services India Ltd CRISIL AAA 1001.28 3.29
Tata Teleservices Ltd CARE A 804.74 2.65
Total Corporate Debt 11766.38 38.68
Rural Electrification Corporation Ltd* CRISIL AAA 2506.48 8.24
National Bank For Agriculture And
Rural Development CRISIL AAA 1110.78 3.65
Small Industries Development
Bank Of India CARE AAA 1005.07 3.30
Total PSU/PFI Bonds 4622.32 15.20
ICICI Bank Ltd* CRISIL A1+ 2468.79 8.12
Canara Bank* CRISIL A1+ 2455.30 8.07
State Bank Of Hyderabad* ICRA A1+ 2443.91 8.03
Export Import Bank Of India* CRISIL A1+ 1795.28 5.90
HDFC Bank Ltd* CRISIL A1+ 1486.22 4.89
STCI Finance Ltd CRISIL A1+ 1170.02 3.85
Union Bank Of India CRISIL A1+ 498.11 1.64
Small Industries Development Bank Of India CARE A1+ 300.00 0.99
Total Money Market Instruments 12617.64 41.48
Company Name Rating Market Value` Lakhs
% ofassets
Company Name Rating Market Value` Lakhs
% ofassets
29
As on May 31, 2016 PORTFOLIO
Franklin Templeton Investmentswww.franklintempletonindia.com
INVESTMENT OBJECTIVE
The Primary objective of the Scheme is to provide income consistent with the prudent risk from a portfolio comprising substantially of floating rate debt instruments, fixed rate debt instruments swapped for floating rate return, and also fixed rate instruments and money market instruments.
INVESTMENT STYLE
The fund managers strive to minimise the risk arising from interest rate fluctuations
Franklin India Savings Plus Fund FISPF
Product Label
Pallab Roy & Sachin Padwal-Desai
FUND MANAGER
NAV as of May 31, 2016
Retail PlanGrowth Plan ` 27.8558Dividend Plan ` 11.2007Monthly Dividend ` 10.2095Institutional PlanDividend Plan ` 10.3726Retail Plan (Direct)Growth Plan ` 28.3577Dividend Plan ` 11.4087Monthly Dividend ` 10.3878
DATE OF ALLOTMENTRetail OptionInstitutional OptionSup. Institutional Option
Feb 11, 2002Sep 6, 2005May 9, 2007
FUND SIZE (AUM)Month End ` 304.19 croresMonthly Average ` 283.82 crores
LOAD STRUCTUREEntry LoadExit Load
NilNil (w.e.f. Apr 25, 2016)
Sales suspended in Institutional Plan &Super Institutional Plan
This product is suitable for investors who are seeking*:
•
•
short term
A fund that invests
floating and short term fixed rate debt instruments
Regular income for
primarily in
derao tM e
wo
L
LOW HIGH
Moderately
Investors understand that their principal will be at Moderately Low risk
Riskometer
*Investors should consult their financial advisers if in doubt about whether the product is suitable for them.
MATURITY & YIELDAVERAGE MATURITYPORTFOLIO YIELD MODIFIED DURATION
0.67 years7.95%0.57 years
MINIMUM INVESTMENT/MULTIPLES FOR NEW INVESTORSRetail Plan: `10,000/1
ADDITIONAL INVESTMENT/MULTIPLES FOR EXISTING INVESTORSRetail Plan: `1000/1
#EXPENSE RATIO0.86% (Retail) 0.84% (Institutional)
#EXPENSE RATIO (Direct): 0.20% (Retail)# The rates specified are the actual average expenses charged for the month of May 2016 . The above ra t i o includes the Service tax on Investment Management Fees .The above ratio also includes, proportionate charge in respect sales beyond T-15 cities subject to maximum of 30 bps on daily net assets, wherever applicable
TYPE OF SCHEME
An Open-end Income scheme
BENCHMARKCrisil Liquid Fund Index
* Top 10 holdings
Call, Cash & Other Current Assets 1412.95 4.64Net Assets 30419.29 100.00
Composition by RatingComposition by Assets
Corporate Debt 38.68% PSU/PFI Bonds 15.20%
Money Market Instruments 41.48% Other Assets 4.64%CARE A1+/CARE AAA/CRISIL A1+/CRISIL AAA/ICRA A1+80.40%
CARE AA(SO)/ICRA AA16.96%
CARE A 2.65%

# CBLO : 3.89%, Others (Cash/ Subscription/ Redemption/ Payable on purchase/ Receivable on sale/ Other Payable/ Other Receivable) : 0.66%
JSW Steel Ltd* CARE AA- 16988.73 9.54
Future Retail Ltd* CARE AA- 12113.40 6.80
Reliance Project Ventures And
Management Pvt.Ltd* BWR A+ (SO) 11817.05 6.63
DLF Ltd* ICRA A 11035.22 6.19
JSW Techno Projects Management Ltd* BWR A(SO) 10488.06 5.89
Sprit Textiles Private Ltd* BWR A+ (SO) 10145.38 5.69
Au Financiers (india) Private Ltd* IND A+ 8988.30 5.04
Reliance Infrastructure Ltd* IND AA-(SO) 7488.16 4.20
Bhavna Asset Operators Private Ltd* BWR A+ (SO) 7448.21 4.18
Legitimate Asset Operators Private Ltd CARE A+(SO) 4952.82 2.78
Equitas Finance Private Ltd IND A- 4587.65 2.57
Reliance Communications Enterprises
Private Ltd BWR A+ (SO) 4034.40 2.26
Nufuture Digital (india) Ltd BWR A+ (SO) 4007.79 2.25
Ceat Ltd CARE AA- 2699.69 1.52
Writers And Publishers Pvt Ltd BWR AA- (SO) 1813.34 1.02
Cholamandalam Investment & Fin. Co. Ltd ICRA AA 900.47 0.51
Total Corporate Debt 119508.67 67.08
* Top 10 holdings $ Rated by SEBI Registered Agency
LIC Housing Finance Ltd* CRISIL A1+ 13873.99 7.79
Export Import Bank Of India CRISIL A1+ 7248.43 4.07
Housing Development Finance Corporation Ltd CRISIL A1+ 7096.10 3.98
Hero Fincorp Ltd CRISIL A1+ 4969.28 2.79
Aditya Birla Finance Ltd ICRA A1+ 4969.13 2.79
HDFC Bank Ltd CRISIL A1+ 3467.85 1.95
ICICI Bank Ltd ICRA A1+ 2500.00 1.40
Mahindra Rural Housing Finance Ltd IND A1+ 2452.96 1.38
Axis Finance Ltd IND A1+ 1896.38 1.06
JM Financial Products Ltd ICRA A1+ 1075.74 0.60
Union Bank Of India CRISIL A1+ 996.22 0.56
Total Money Market Instruments 50546.07 28.37
Company Name Rating Market Value` Lakhs
% ofassets
Company Name Rating Market Value` Lakhs
% ofassets
30
As on May 31, 2016 PORTFOLIO
Franklin Templeton Investmentswww.franklintempletonindia.com
Franklin India Low Duration Fund FILDF
Product Label
This product is suitable for investors who are seeking*:
Regular income for short term
• An income fund focusing on low duration securities
* Investors should consult their financial advisers if in doubt about whether the product is suitable for them.
derao tM e
wo
L
LOW HIGH
Moderately
Investors understand that their principal will be at Moderate risk
Riskometer
•
DATE OF ALLOTMENT
February 7, 2000 - Monthly & Quarterly Dividend PlanJuly 26, 2010 - Growth Plan
FUND MANAGERS
Santosh Kamath & Kunal Agrawal
MINIMUM INVESTMENT/MULTIPLES FOR NEW INVESTORS
`25000/1 - Monthly & Quarterly Dividend Plan`10000/1 - Growth Plan
ADDITIONAL INVESTMENT/MULTIPLES FOR EXISTING INVESTORS
`5000/1 - Monthly & Quarterly Dividend Plan`1000/1 - Growth Plan
LOAD STRUCTURE
NilIn respect of each purchase of Units – 0.50% if the Units are redeemed/ switched-out within 3 months of allotment.
Entry LoadExit Load
AVERAGE MATURITYPORTFOLIO YIELD MODIFIED DURATION
MATURITY & YIELD
0.98 years9.90%0.80 years
#EXPENSE RATIO#EXPENSE RATIO (DIRECT)
: 0.78%: 0.48%
# The rates specified are the actual average expenses charged for the month of May 2016 . The above ratio includes the Service tax on Investment Management Fees .The above ratio also includes, proportionate charge in respect sales beyond T-15 cities subject to maximum of 30 bps on daily net assets, wherever applicable
FUND SIZE (AUM)
Month End ` 1781.66 crores
Monthly Average ` 1744.64 crores
INVESTMENT OBJECTIVE
The objective of the Scheme is to earn regular income for investors through investment primarily in highly rated debt securities.
Monthly Plan ` 10.5413Quarterly Plan ` 10.5131Growth Plan ` 17.0379Direct - Monthly Plan ` 10.6668Direct - Quarterly Plan ` 10.6403Direct - Growth Plan ` 17.2066
NAV as of May 31, 2016
TYPE OF SCHEME
An Open-end Income Fund
BENCHMARKCRISL Short Term Bond Fund Index
Call, Cash & Other Current Assets 8111.53 4.55Net Assets 178166.27 100.00
As on May 31, 2016
Franklin India Cash Management Account FICMA
# CBLO : 18.13%, Others (Cash/ Subscription/ Redemption/ Payable on purchase/ Receivable on sale/ Other Payable/ Other Receivable) : 0.52%
MINIMUM INVESTMENT/MULTIPLES FOR NEW INVESTORS
`1000/1
#EXPENSE RATIO#EXPENSE RATIO (DIRECT)
: 0.95%: 0.23%
# The rates specified are the actual average expenses charged for the month of May 2016 . The above ratio includes the Service tax on Investment Management Fees .The above ratio also includes, proportionate charge in respect sales beyond T-15 cities subject to maximum of 30 bps on daily net assets, wherever applicable
AVERAGE MATURITYPORTFOLIO YIELD MODIFIED DURATION
MATURITY & YIELD0.10 years7.28%0.09 years
FUND SIZE (AUM)Month End ` 73.08 croresMonthly Average ` 67.50 crores
Growth Plan ` 23.4220 Dividend Plan ` 10.0127Direct - Growth Plan ` 24.1037Direct - Dividend Plan ` 10.0102
NAV as of May 31, 2016
DATE OF ALLOTMENT
April 23, 2001
FUND MANAGERS
Pallab Roy, Umesh Sharma
INVESTMENT OBJECTIVE
The investment objective of the scheme is to provide income and liquidity consistent with the prudent risk from a portfolio comprising of money market and debt instruments.
BENCHMARKCrisil Liquid Fund Index.
ADDITIONAL INVESTMENT/MULTIPLES FOR EXISTING INVESTORS
`1000/1
LOAD STRUCTURE
NilNil
Entry LoadExit Load
Product Label
This product is suitable for investors who are seeking*:
•Regular income for short term
•A liquid fund that invests in short term and money market instruments
*Investors should consult their financial advisers if in doubt about whether the product is suitable for them.
derao tM e
wo
L
LOW HIGH
Moderately
Investors understand that their principal will be at Low risk
Riskometer
TYPE OF SCHEME
An Open-end Liquid scheme
Company Name Rating Market Value` Lakhs
% ofassets
Axis Finance Ltd* IND A1+ 598.86 8.19HDFC Bank Ltd* CRISIL A1+ 594.49 8.13National Bank For Agriculture And Rural Development* CRISIL A1+ 593.18 8.12Kotak Mahindra Bank Ltd* CRISIL A1+ 592.73 8.11Power Finance Corporation Ltd* CRISIL A1+ 591.06 8.09Small Industries Development Bank Of India* CARE A1+ 500.00 6.84Reliance Capital Ltd* ICRA A1+ 492.37 6.74Mahindra Rural Housing Finance Ltd* IND A1+ 490.59 6.71LIC Housing Finance Ltd* CRISIL A1+ 399.25 5.46Allahabad Bank* CRISIL A1+ 399.07 5.46Indian Railway Finance Corporation Ltd CRISIL A1+ 398.42 5.45Edelweiss Commodities Services Ltd CRISIL A1+ 295.32 4.04Total Money Market Instruments 5945.34 81.35
Call, Cash & Other Current Assets 1362.76 18.65Net Assets 7308.10 100.00
Composition by RatingComposition by Assets
Corporate Debt 67.08% Money Market Instruments 28.37%
Other Assets 4.55%
Composition by Assets
Money Market Instruments 81.35%Other Assets 18.65%
CRISIL A1+/ICRA A1+/IND A1+32.92%
BWR AA- (SO)/CARE AA-/ICRA AA/IND AA-(SO) 23.58%
BWR A(SO)/BWR A+ (SO)/CARE A+(SO)/ICRA A/IND A-/IND A+43.50%

Franklin India Banking & PSU Debt Fund FIBPDFAs on May 31, 2016
INVESTMENT OBJECTIVE
Umesh Sharma & Sachin Padwal-Desai
FUND MANAGER
NAV as of May 31, 2016
LOAD STRUCTURE
Entry LoadExit Load
NilNil (w.e.f. Apr 25, 2016)
The fund seeks to provide regular income through a portfolio of debt and money m a r ke t i n s t r u m e n t s c o n s i s t i n g predominantly of securities issued by entities such as Banks and Public Sector Undertakings (PSUs). However, there is no assurance or guarantee that the objective of the scheme will be achieved.
DATE OF ALLOTMENTApril 25, 2014
MINIMUM INVESTMENT/MULTIPLES FOR NEW INVESTORS
`5,000/1
PORTFOLIO
Company Name Rating Market Value` Lakhs
% ofassets
Company Name Rating Market Value` Lakhs
% ofassets
Small Industries Development Bank Of India* CARE AAA 1507.60 8.36
National Housing Bank* CRISIL AAA 1510.01 8.37
Power Finance Corporation Ltd* CRISIL AAA 1919.11 10.64
Power Grid Corporation Of India Ltd* CRISIL AAA 1925.85 10.68
Food Corporation Of India* CRISIL AAA(SO) 1992.25 11.05
Total PSU/PFI Bonds 15363.39 85.19
Cholamandalam Investment And
Finance Company Ltd ICRA AA 797.65 4.42
Kotak Mahindra Prime Ltd CRISIL AAA 199.61 1.11
Total Corporate Debt 997.25 5.53
National Thermal Power Corporation Ltd CRISIL AAA 1005.06 5.57
Rural Electrification Corporation Ltd* CRISIL AAA 1011.58 5.61
Indian Railway Finance Corporation Ltd* CRISIL AAA 1013.65 5.62
NHPC Ltd* CARE AAA 1018.18 5.65
Export Import Bank Of India* CRISIL AAA 1046.40 5.80
National Bank For Agriculture And
Rural Development* CRISIL AAA 1413.71 7.84
Growth Plan 11.9733 `Dividend Plan 10.5924 ` Direct - Growth Plan 12.1199 ` Direct - Dividend Plan 10.7162 `
FUND SIZE (AUM)Month End ` 180.34 crores
Monthly Average ` 179.52 crores
31Franklin Templeton Investmentswww.franklintempletonindia.com
TYPE OF SCHEME
An Open-end Income Fund
BENCHMARKCRISIL Composite Bond Fund Index
The applicable date is 7th June 2016.This product is suitable for investors who are seeking*:
• Long term capital appreciation
• A Fund of Funds investing in diversified asset classes through a mix of strategic and tactical allocation
wo
L
LOW HIGH
Moderately
Investors understand that their principal will be at Moderately High risk
Riskometer
As on May 31, 2016
PORTFOLIO COMPOSITION AND PERFORMANCE
How Does The Scheme Work?Franklin India Multi-Asset Solution Fund (FIMAS) is an open-end fund of fund scheme which seeks to provide an asset allocation solution to the investors. The asset allocation is dynamically managed across Equity, Debt, Gold and Money Market based on proprietary model. The fund proposes to primarily invest in Franklin Templeton's existing local equity, fixed income, liquid products and in domestic Gold ETFs. The proprietary model uses a mix of strategic and tactical allocation. The strategic allocation stems from a combination of quantitative and qualitative analysis and it determines long term allocation to different asset classes. In order to determine the tactical allocation, the model uses a combination of economic, valuation and momentum / sentiment indicators to determine the allocation towards a particular asset class/security. The fund dynamically changes its allocation to different asset classes on monthly basis.
MINIMUM INVESTMENT/MULTIPLES FOR NEW INVESTORS
` 5000
ADDITIONAL INVESTMENT/MULTIPLES FOR EXISTING INVESTORS
` 1000
LOAD STRUCTUREENTRY LOAD NilEXIT LOAD In respect of each purchase of Units -1% if redeemed within 3 year of allotment
DATE OF ALLOTMENT November 28, 2014
FUND MANAGERAnand Radhakrishnan(w.e.f. Feb 27, 2015)
The Fund seeks to achieve capital appreciation and diversification through a mix of strategic and tactical allocation to various asset classes such as equity, debt, gold and cash by investing in funds investing in these asset classes. However, there is no assurance or guarantee that the objective of the scheme will be achieved.
INVESTMENT OBJECTIVE
Product Label
#EXPENSE RATIO#EXPENSE RATIO (DIRECT)
: 1.87%: 0.09%
# The rates specified are the actual average expenses charged for the month of May 2016 . The above ratio includes the Service tax on Investment Management Fees . The above ratio also includes, proportionate charge in respect sales beyond T-15 cities subject to maximum of 30 bps on daily net assets, wherever applicable
Franklin India Multi – Asset Solution Fund FIMAS
Asset Allocation for June 2016.
Asset
Equity
Fixed Income
Gold
Cash
Instrument
Franklin India Bluechip Fund
Franklin India Short Term Income Plan
Goldman Sachs Gold ETF
Franklin India Treasury Management
Account
39.00%
38.50%
22.50%
0.00%
Total Portfolio Allocation
NAV as of May 31, 2016
Growth Plan ` 10.6777Dividend Plan ̀ 10.6777Direct - Growth Plan ` 10.9602Direct - Dividend Plan ` 10.9602
Company Name No. ofshares
Market Value` Lakhs
% ofassets
Mutual Fund Units/ETF
Franklin India Bluechip Fund 804,978.53 3013.48 37.03
Franklin India Short Term Income Plan 86,035.06 2748.48 33.78
Goldman Sachs Gold Exchange Traded
Scheme-GS Gold BeES 77,129.00 2040.52 25.08
Franklin India Treasury Management Account 13,088.07 300.56 3.69
Total Holding 8103.04 99.58
PORTFOLIO
derao tM e
*Investors should consult their financial advisers if in doubt about whether the product is suitable for them.
FIMAS asset allocation for June 2016 will be as follows.
FUND SIZE (AUM)Month End ` 81.37 croresMonthly Average ` 81.98 crores
TYPE OF SCHEME
An Open-end fund of funds scheme
BENCHMARK@CRISIL Balanced Fund – Aggressive Index
* Top 10 Holdings
Total Holding 8,103.04 99.58Call,cash and other current asset 33.97 0.42Total Asset 8,137.02 100.00
# CBLO : 6.15%, Others (Cash/ Subscription/ Redemption/ Payable on purchase/ Receivable on sale/Other Payable/ Other Receivable) : 3.13%
# The rates specified are the actual average expenses charged for the month of May 2016 . The above ratio includes the Service tax on Investment Management Fees .The above ratio also includes, proportionate charge in respect sales beyond T-15 cities subject to maximum of 30 bps on daily net assets, wherever applicable
#EXPENSE RATIO#EXPENSE RATIO (DIRECT)
: 0.96%: 0.40%
MATURITY & YIELDAVERAGE MATURITYPORTFOLIO YIELD MODIFIED DURATION
3.32 years7.91%2.61 years
Composition by Assets
Product Label - FIBPDF
*Investors should consult their financial advisers if in doubt about whether the product is suitable for them.
This product is suitable for investors who are seeking*:•
Regular Income for medium term
•An income fund that invests predominantly in debt and money market instruments issued by Banks and Public Sector Undertakings
derao tM e
wo
L
LOW HIGH
Moderately
Investors understand that their principal will be at Moderate risk
Riskometer
Call, Cash & Other Current Assets 1673.71 9.28Net Assets 18034.35 100.00
Corporate Debt 5.53%
PSU/PFI Bonds 85.19%
Other Assets 9.28%
Composition by Rating
CARE AAA/CRISIL AAA/CRISIL AAA(SO) 95.58%
ICRA AA 4.42%
@ CRISIL Balanced Fund Index has been renamed as
CRISIL Balanced Fund – Aggressive Index w.e.f. April 04, 2016.

MINIMUM INVESTMENT/MULTIPLES FOR NEW INVESTORS` 5000/1
ADDITIONAL INVESTMENT/MULTIPLES FOR EXISTING INVESTORS` 1000/1
ENTRY LOAD NilEXIT LOAD In respect of each purchase of Units -1% if redeemed within 1 year of allotment
LOAD STRUCTURE
DATE OF ALLOTMENT October 31, 2003
PORTFOLIO COMPOSITION AND PERFORMANCE
How Does The Scheme Work?
The scheme changes its Asset allocation based on the weighted average PE ratio of the NSE NIFTY Index. At higher PE levels, it reduces allocation to equities in order to minimise downside risk. Similarly at lower PE levels, it increases allocation to equities to capitalise on their upside potential. Historically, such a strategy of varying the allocation of equity and debt/money market instruments based on the PE ratio has delivered superior risk-adjusted returns over the long term, although there is no guarantee that will be repeated in the future. The equity component of the scheme is invested in Franklin India Bluechip Fund (FIBCF), an open end diversified equity scheme investing predominantly in large cap stocks and the debt/money market component is invested in Franklin India Short Term Income Plan (FISTIP), an open end income scheme investing in government securities, PSU bonds and corporate debt.
Asset Allocation for June 2016.
FIDPEFFranklin India Dynamic PE Ratio Fund of Funds
If weighted averagePE ratio of NSE
Nifty falls inthis band...
Upto 1212 - 1616 - 2020 - 2424 - 28
Above 28
...the equitycomponentwill be...(%)
90 - 10070 - 9050 - 7030 - 5010 - 300 - 10
0 - 1010 - 3030 - 5050 - 7070 - 9090 - 100
...and the debtcomponent
will be ... (%)
FIDPEF's Investment strategy
As on May 31, 2016
The weighted average PE ratio of NSE Nifty as on 31.05.2016 was 20.94. Hence, the asset allocation for the scheme in June 2016 will be...
Equity Fund : 50% Fixed Income Fund : 50%
The applicable date : 3rd June 2016.
To provide long-term capital appreciation with relatively lower volatility through a dynamically balanced portfolio of equity and income funds. The equity allocation (i.e. the allocation to the diversified equity fund) will be determined based on the month-end weighted average PE ratio of the Nifty 50 (NSE Nifty).
INVESTMENT OBJECTIVE
#EXPENSE RATIO : 1.68%#EXPENSE RATIO (DIRECT) : 0.53%
# The rates specified are the actual average expenses charged for the month of May 2016 . The above ratio includes the Service tax on Investment Management Fees . The above ratio also includes, proportionate charge in respect sales beyond T-15 cities subject to maximum of 30 bps on daily net assets, wherever applicable
INVESTMENT STYLE
The fund managers follow a dynamic Asset allocation strategy, determining the allocation to the underlying schemes based on the monthend weighted average PE ratio of the Nifty 50. Any change in Asset allocation due to change in the market PE ratio is done in the following month.
Past performance may or may not be sustained in future. Returns greater than 1 year period are compounded annualized. Dividends assumed to be reinvested and Bonus is adjusted. Load is not taken into consideration. On account of difference in the type/category, asset allocation or investment strategy, inception dates, performances of these funds are not strictly comparable. Please refer to www.franklintempletonindia.com for details on performance of all schemes (including Direct Plans). B: Benchmark, AB: Additional Benchmark.
1 year Since Inception3 year 5 year 7 year
SIP - If you had invested ` 10000 every month in FIDPEF
10 Year
Total amount Invested (Rs) 120,000 360,000 600,000 840,000 1,200,000 1,490,000
Total value as on Mar 31, 2016 (Rs) 121,146 419,221 779,353 1,200,618 2,087,212 3,434,079
Returns 1.78% 10.16% 10.41% 10.04% 10.67% 12.66%
Total value of B:S&P BSE Sensex Index 114,565 382,910 724,180 1,091,318 1,784,457 2,934,556
B:S&P BSE Sensex Returns -8.32% 4.05% 7.46% 7.36% 7.70% 10.36%@
Total value of B:CRISIL Balanced Fund – Aggressive Index 119,000 400,614 747,514 1,131,597 1,868,510 2,814,970@B:CRISIL Balanced Fund – Aggressive Index -1.55% 7.08% 8.73% 8.38% 8.58% 9.75%
Add Benchmark Value/Returns N.A N.A N.A N.A N.A N.A
NAV as of May 31, 2016
Growth Plan ` 64.6612Dividend Plan ` 37.1280Direct - Growth Plan ` 66.6695Direct - Dividend Plan ` 38.4448
FUND MANAGERAnand Radhakrishnan
FUND SIZE (AUM)Month End ` 755.14 croresMonthly Average ̀ 740.80 crores
TYPE OF SCHEMEOpen-end Fund-of-Funds scheme
BENCHMARK@CRISIL Balanced Fund – Aggressive Index
32Franklin Templeton Investmentswww.franklintempletonindia.com
Company Name No. ofshares
Market Value` Lakhs
% ofassets
Mutual Fund Units
Franklin India Bluechip Fund 10,341,595.63 38714.26 51.27
Franklin India Short Term Income Plan 1,153,032.32 36834.89 48.78
PORTFOLIO
Product Label
This product is suitable for investors who are seeking*:
• Long term capital appreciation
•
derao tM e
wo
L
LOW HIGH
Moderately
Investors understand that their principal will be at Moderately High risk
Riskometer
*Investors should consult their financial advisers if in doubt about whether the product is suitable for them.
A hybrid fund of funds investing in equity and debt mutual funds
Total Holding 75,549.15 100.05Call, Cash & Other Assets -34.87 -0.05TotalAsset 75,514.28 100.00
@ Nifty Midcap 100 has been renamed as Nifty Free Float Midcap 100 w.e.f. April 01, 2016 and CRISIL Balanced Fund Index has been renamed as CRISIL Balanced Fund – Aggressive Index w.e.f. April 04, 2016.
@ CRISIL Balanced Fund Index has been
renamed as CRISIL Balanced Fund –
Aggressive Index w.e.f. April 04, 2016.
100.05%
-0.05%
MUTUAL FUND UNITS
CALL, CASH & OTHER ASSETS

FILSFFranklin India Life Stage Fund of Funds
INVESTMENT STYLE
Load structure
Entry Load
Exit Load:
20’s Plan
50’s Plus Plan And
50’s Plus Floating
Rate Plan
30’s Plan
40’s Plan
Nil for all the plans
In respect of each purchase of Units - 1%
if redeemed within 1 year of allotment
In respect of each purchase of Units – 0.75%if redeemed within 1 year of allotmentIn respect of each purchase of Units – 0.75%if redeemed within 1 year of allotment
In respect of each purchase of Units – 1%if redeemed within 1 year of allotment
As on May 31, 2016
DATE OF ALLOTMENT
December 1, 2003July 9, 2004 (The 50s Plus Floating Rate Plan)
FUND MANAGER
Anand Radhakrishnan, Sachin Padwal-Desai & Pallab Roy
ADDITIONAL INVESTMENT/MULTIPLES FOR EXISTING INVESTORS` 1000/1
MINIMUM INVESTMENT FOR
SYSTEMATIC INVESTMENT PLANMinimum of 12 cheques of ` 2000 or more eachMinimum of 6 cheques of ` 4000 or more each
How Does The Scheme Work?The scheme invests in a combination of Franklin Templeton India’s equity and
income schemes, with a steady state allocation as shown below. The debt and
equity allocation is automatically rebalanced every 6 months to revert to the
steady state levels.
FILSF's Investment strategySteady State Asset Allocation
20s Plan
30s Plan
40s Plan
50s Plus Plan
50s FloatingRate Plan
80%
55%
35%
20%
20%
Equity
20%
45%
65%
80%
80%
DebtUnderlying schemes
FIBCF
50%
35%
20%
10%
15%
FIPF
15%
10%
10%
0%
0%
TIGF
15%
10%
5%
10%
5%
FIDA
10%
25%
35%
50%
0%
FIIBA
10%
20%
30%
30%
0%
FISPF
-
-
-
-
80%
The fund managers maintain the allocation to the underlying schemes by rebalancing the portfolio once in 6 months to the steady state levels. Moreover, based on market conditions, the portfolio managers can make a tactical allocation of 10% on either side of the steady state Asset allocation.
INVESTMENT OBJECTIVEThe primary objective is to generate superior risk adjusted returns to investors in line with their chosen asset allocation.
NAV as of May 31, 2016
20s Plan
30s Plan
40s Plan
50s Plus Plan
50s Plus Floating Rate Plan
Growth
` 64.3970
` 46.9763
` 38.0811
` 28.5869
` 30.5010
Dividend
` 29.6945
` 23.4325
` 15.3010
` 13.4659
` 14.4777
NAV as of May 31, 2016 (Direct)
20s Plan
30s Plan
40s Plan
50s Plus Plan
50s Plus Floating Rate Plan
Growth
` 65.3472
` 47.8055
` 38.8218
` 29.1785
` 30.9521
Dividend
` 30.1978
` 23.8438
` 15.5348
` 13.7182
` 14.6717
#EXPENSE RATIO20s Plan: 1.44%30s Plan: 1.53%40s Plan: 1.60%50s Plus Plan: 1.63%50s Plus FloatingRate Plan: 0.79%
(Direct) : 1.27%(Direct) : 1.06%(Direct) : 0.85%(Direct) : 0.93%
(Direct) : 0.47%# The rates specified are the actual average expenses charged for the month of May 2016 . The above r a t i o includes the Service tax on Investment Management Fees . The above ratio also includes, proportionate charge in respect sales beyond T-15 cities subject to maximum of 30 bps on daily net assets, wherever applicable
This product is suitable for investors who are seeking*:
• Long term capital appreciation
• A fund of funds investing in equity and debt mutual funds
derao tM e
wo
L
LOW HIGH
Moderately
Investors understand that their principal will be at Moderately High risk
Riskometer
Product Label - FILSF 20’s/30’s Plan
*Investors should consult their financial advisers if in doubt about whether the product is suitable for them.
This product is suitable for investors who are seeking*:
• Long term capital appreciation
• A fund of funds investing in equity and debt mutual funds
derao tM e
wo
L
LOW HIGH
Moderately
Investors understand that their principal will be at Moderately High risk
Riskometer
Product Label - FILSF 40’s/50’s + & 50’s+ Floating rate Plan
*Investors should consult their financial advisers if in doubt about whether the product is suitable for them.
MINIMUM INVESTMENT/MULTIPLES FOR NEW INVESTORS` 5000/1
33Franklin Templeton Investmentswww.franklintempletonindia.com
` 12.86 crores 6.70 crores`
12.71 crores` 10.06 crores` 33.73 crores`
TYPE OF SCHEMEOpen-end Fund-of-Funds scheme
BENCHMARK20s Plan - 65% S&P BSE Sensex + 15% Nifty 500 + 20% Crisil Composite Bond Fund Index;
30s Plan - 45%S&P BSE Sensex + 10% Nifty 500 + 45%Crisil Composite Bond Fund Index;
40s Plan - 25%S&P BSE Sensex + 10% Nifty 500 + 65% Crisil Composite Bond Fund Index;
50s Plus Plan - 20% S&P BSE Sensex+ 80% Crisil Composite Bond Fund Index;
50s Plus Floating Rate Plan - 20% S&P BSE Sensex + 80% Crisil Liquid Fund Index.
20s Plan:30s Plan:40s Plan:50s Plus Plan:50s Plus Floating Rate Plan
` 13.16 crores 6.84 crores`12.80 crores` 10.13 crores` 33.98 crores`
FUND SIZE (AUM) Month End
20s Plan:30s Plan:40s Plan:50s Plus Plan:50s Plus Floating Rate Plan
Monthly Average
Company Name No.of Shares
Market Value` Lakhs
% ofassets
PORTFOLIOFranklin India Life Stage Fund Of Funds - 20'S Plan Franklin India Life Stage Fund Of Funds - 30'S Plan^
Mutual Fund Units
Franklin India Bluechip Fund 176,090.42 659.20 50.08
Franklin India Prima Fund 27,245.78 197.80 15.03
Templeton India Growth Fund 102,871.19 196.00 14.89
Franklin India Dynamic Accrual Fund 241,913.47 128.64 9.77
Franklin India Income Builder Account 239,461.67 128.48 9.76
Total Holding 1310.13 99.54
Company Name No.of Shares
Market Value` Lakhs
% ofassets
Mutual Fund Units
Franklin India Bluechip Fund 64,242.27 240.49 35.15
Franklin India Dynamic Accrual Fund 316,591.95 168.35 24.61
Franklin India Income Builder Account 250,707.47 134.52 19.66
Franklin India Prima Fund 9,467.82 68.74 10.05
Templeton India Growth Fund 35,745.82 68.11 9.96
Total Holding 680.20 99.43
Company Name No.of Shares
Market Value` Lakhs
% ofassets
Franklin India Life Stage Fund Of Funds - 40'S Plan^ Franklin India Life Stage Fund Of Funds - 50'S Plus Plan
Mutual Fund Units
Franklin India Dynamic Accrual Fund 835431.33 444.25 34.71
Franklin India Income Builder Account 708809.98 380.31 29.72
Franklin India Bluechip Fund 68960.96 258.16 20.17
Franklin India Prima Fund 17783.59 129.11 10.09
Templeton India Growth Fund 33569.58 63.96 5.00
Total Holding 1275.78 99.68
Company Name No.of Shares
Market Value` Lakhs
% ofassets
Mutual Fund Units
Franklin India Dynamic Accrual Fund 946,222.11 503.16 49.68
Franklin India Income Builder Account 561,992.93 301.54 29.77
Franklin India Bluechip Fund 27,296.66 102.19 10.09
Templeton India Growth Fund 53,154.96 101.28 10.00
Total Holding 1,008.16 99.54
Company Name No.of Shares
Market Value` Lakhs
% ofassets
Franklin India Life Stage Fund Of Funds - 50'S Plus Floating Rate Plan^
Mutual Fund Units
Franklin India Savings Plus Fund 9,515,133.19 2698.27 79.42
Franklin India Bluechip Fund 137,330.10 514.10 15.13
Templeton India Growth Fund 89,365.17 170.27 5.01
Total Holding 3,382.64 99.56
Total Holding 3,382.64 99.56Call,cash and other current asset 14.94 0.44TotalAsset 3,397.58 100.00
Total Equity Holding 1,008.16 99.54Call,cash and other current asset 4.69 0.46TotalAsset 1,012.85 100.00
Total Holding 1,275.78 99.68Call,cash and other current asset 4.04 0.32TotalAsset 1,279.82 100.00
Total Holding 680.20 99.43Call,cash and other current asset 3.90 0.57TotalAsset 684.10 100.00
Total Holding 1,310.13 99.54Call,cash and other current asset 6.06 0.46TotalAsset 1,316.19 100.00

This product is suitable for investors who are seeking*:
• Long term capital appreciation
• A Fund of Funds investing in an overseas equity fund having exposure to Europe
derao tM e
wo
L
LOW HIGH
Moderately
Investors understand that their principal will be at High risk
Riskometer
This product is suitable for investors who are seeking*:
• Long term capital appreciation
• A fund of funds investing in an overseas equity fund
derao tM e
wo
L
LOW HIGH
Moderately
Investors understand that their principal will be at High risk
Riskometer
As on May 31, 2016 PORTFOLIO
Franklin India Feeder - Franklin European Growth Fund
FUND MANAGER (FOR FRANKLIN INDIA FEEDER - FRANKLIN EUROPEAN GROWTH FUND)Srikesh Nair (w.e.f. Nov 30, 2015)
FUND MANAGER (FOR FRANKLIN EUROPEAN GROWTH FUND)Uwe Zoellner Robert Mazzuoli
PLANSGrowth and Dividend (with Reinvestment & Payout Options) Direct – Growth and Dividend (with Reinvestment & Payout Options)
DATE OF ALLOTMENTMay 16, 2014
BENCHMARK
MSCI Europe Index
MINIMUM APPLICATION AMOUNT
`5,000 and in multiples of Re.1 thereafter
LOAD STRUCTUREEntry LoadExit Load
Nil1% if redeemed/switched-out within three years of allotment
Product Label As on May 31, 2016 PORTFOLIO
Company Name No. ofshares
Market Value` Lakhs
% ofassets
Past performance may or may not be sustained in future. Returns greater than 1 year period are compounded annualized. Dividends assumed to be reinvested and Bonus is adjusted. Load is not taken into consideration. On account of difference in the type/category, asset allocation or investment strategy, inception dates, performances of these funds are not strictly comparable. Please refer to www.franklintempletonindia.com for details on performance of all schemes (including Direct Plans). B: Benchmark, AB: Additional Benchmark.
1 Year Since Inception
SIP - If you had invested 10000 every month in FIF-FUSOF`
Franklin India Feeder - Franklin U.S. Opportunities Fund FIF-FUSOF
FUND MANAGER (FOR FRANKLIN INDIA FEEDER - FRANKLIN US OPPORTUNITIES FUND)
Srikesh Nair (w.e.f. May 02, 2016)FUND MANAGER (FOR FRANKLIN USOPPORTUNITIES FUND)Grant Bowers Conrad Herrmann
DATE OF ALLOTMENTFebruary 06, 2012
#EXPENSE RATIO#EXPENSE RATIO (DIRECT)
: 1.86%
: 0.96%
BENCHMARKRussell 3000 Growth Index
MINIMUM APPLICATION AMOUNT
`5,000 and in multiples of Re.1 thereafter
LOAD STRUCTURE
Entry LoadExit Load
Nil1% if redeemed/switched-out within three years of allotment
The Fund invests principally in equity securities of U.S. companies demonstrating a c c e l e r a t i n g g r o w t h , i n c r e a s i n g profitability, or above average growth or growth potential as compared to the overall economy.
INVESTMENT STYLE
34
FIF-FEGF
Product Label
Company Name No. ofshares
Market Value` Lakhs
% ofassets
Indian Investors in ` Franklin India Feeder-
Franklin EuropeanGrowth Fund
in $ FranklinEuropean
Growth Fund
invests inEuropean Companies
Indian Investorsin `
Franklin India Feeder - Franklin U.S. Opportunities
Fund
in $ Franklin U.S.Opportunities
Fund
invests in
US Companies
Franklin Templeton Investmentswww.franklintempletonindia.com
The Fund seeks to provide capital appreciation by investing predominantly in units of Franklin U. S. Opportunities Fund, an overseas Franklin Templeton mutual fund, which primarily invests in securities in the United States of America.
INVESTMENT OBJECTIVE
Total amount Invested (Rs) 120,000 360,000 500,000
Total value as on Mar 31, 2016 (Rs) 114,279 396,273 641,257
Returns -8.76% 6.34% 11.96%
Total value of B:Russell 3000 Growth 124,038 441,244 721,574
B:Russell 3000 Growth 6.33% 13.69% 17.80%
NAV as of May 31, 2016
Mutual Fund Units 3544752 70046.70 99.91
Mutual Fund Units
171718 3770.89 99.53
# The rates specified are the actual average expenses charged for the month of May 2016 . The above r a t i o includes the Service tax on Investment Management Fees . The above ratio also includes, proportionate charge in respect sales beyond T-15 cities subject to maximum of 30 bps on daily net assets, wherever applicable
#EXPENSE RATIO#EXPENSE RATIO (DIRECT)
: 1.85%
: 0.28%# The rates specified are the actual average expenses charged for the month of May 2016 . The above r a t i o includes the Service tax on Investment Management Fees . The above ratio also includes, proportionate charge in respect sales beyond T-15 cities subject to maximum of 30 bps on daily net assets, wherever applicable
Growth Plan ̀ 20.0151Dividend Plan ` 20.0151Direct - Growth Plan ` 20.7530Direct - Dividend Plan ̀ 20.7530
Growth Plan ̀ 8.9432Dividend Plan ` 8.9432Direct - Growth Plan ` 9.1848Direct - Dividend Plan ̀ 9.1848
NAV as of May 31, 2016
Franklin European Growth Fund, Class I (Acc)*
*Investors should consult their financial advisers if in doubt about whether the product is suitable for them.
*Investors should consult their financial advisers if in doubt about whether the product is suitable for them.
3 year
Growth and Dividend (with payout andreinvestment opiton)
PLANS
FUND SIZE (AUM)Month End ` 701.10 croresMonthly Average ` 687.29 crores
FUND SIZE (AUM)Month End ` 37.89 croresMonthly Average ` 37.70 crores
The Fund seeks to provide capita l appreciation by investing predominantly in units of Franklin European Growth Fund, an overseas equity fund which primarily invests in securities of issuers incorporated or having their principal business in European countries. However, there is no assurance or guarantee that the objective of the scheme will be achieved.
INVESTMENT OBJECTIVE
SIP - If you had invested ` 10000 every month in FIF-FEGF
Total amount Invested (Rs) 120,000 230,000
Total value as on Mar 31, 2016 (Rs) 116,151 218,489
Returns -5.92% -5.07%
Total value of B:MSCI Europe Index 114,289 217,314
B:MSCI Europe Index -8.74% -5.59%
TYPE OF SCHEME
An Open-end fund of funds scheme investing overseas
TYPE OF SCHEMEAn Open-end fund of funds scheme investing overseas
Past performance may or may not be sustained in future. Returns greater than 1 year period are compounded annualized. Dividends assumed to be reinvested and Bonus is adjusted. Load is not taken into consideration. On account of difference in the type/category, asset allocation or investment strategy, inception dates, performances of these funds are not strictly comparable. Please refer to www.franklintempletonindia.com for details on performance of all schemes (including Direct Plans). B: Benchmark, AB: Additional Benchmark.
Total Holding 3,770.89 99.53Call,cash and other current asset 17.73 0.47TotalAsset 3,788.62 100.00
Total Holding 70,046.70 99.91Call,cash and other current asset 63.03 0.09Total Asset 70,109.73 100.00
1 Year Since Inception
Franklin U.S. Opportunities Fund, Class I (Acc)

SCHEME PERFORMANCE
35Franklin Templeton Investmentswww.franklintempletonindia.com
Templeton India Growth Fund (TIGF) - Dividend OptionNAV as at Mar 31, 2016 : (Rs.) 55.7514Fund Manager: Chetan Sehgal
NAV Per unit (Rs.) B: S&P BSE Sensex AB:Nifty 50B: MSCI India ValueTIGF
Discrete 12 months performance
Mar 31, 2015 to Mar 31, 2016 (Last 1 year) 63.0585 -3.73% -9.36% -5.48% -8.86%
Mar 31, 2014 to Mar 31, 2015 49.0283 38.94% 24.89% 17.63% 26.65%
Mar 28, 2013 to Mar 31, 2014 46.9239 13.68% 18.85% 10.83% 17.98%
Compounded Annualised Growth Rate Performance
Last 2 years (Mar 31, 2014 to Mar 31, 2016) 15.63% 6.39% 5.43% 7.43%
Last 3 years (Mar 28, 2013 to Mar 31, 2016) 14.94% 10.36% 7.18% 10.80%
Last 5 years (Mar 31, 2011 to Mar 31, 2016) 51.9774 8.21% 5.43% 0.96% 5.81%
Last 10 years (Mar 31, 2006 to Mar 31, 2016) 38.4100 11.68% 8.42% 7.67% 8.56%
Last 15 years (Mar 30, 2001 to Mar 31, 2016) 11.3400 20.09% 13.87% 14.00% 13.55%
Since inception till Mar 31, 2016 10.0000 16.48% 10.75% N.A 11.02%
Current Value of Standard Investment of Rs 10000
Last 2 years 13376 11320 11118 11543
Last 3 years 15207 13454 12321 13618
Last 5 years 14843 13032 10487 13265
Last 10 years 30201 22466 20951 22743
Last 15 years 156293 70309 71461 67396
Since inception (10.9.1996) 197766 73779 N.A 77295
Franklin India Bluechip Fund (FIBCF) - Growth OptionNAV as at Mar 31, 2016 : (Rs.) 344.2319Fund Manager: Anand Radhakrishnan, Anand Vasudevan
NAV Per unit (Rs.) FIBCF AB: Nifty 50B: S&P BSE Sensex
Discrete 12 months performance
Mar 31, 2015 to Mar 31, 2016 (Last 1 year) 355.4964 -3.15% -9.36% -8.86%
Mar 31, 2014 to Mar 31, 2015 260.8636 36.28% 24.89% 26.65%
Mar 28, 2013 to Mar 31, 2014 225.3407 15.76% 18.85% 17.98%
Compounded Annualised Growth Rate Performance
Last 2 years (Mar 31, 2014 to Mar 31, 2016) 14.86% 6.39% 7.43%
Last 3 years (Mar 28, 2013 to Mar 31, 2016) 15.12% 10.36% 10.80%
Last 5 years (Mar 31, 2011 to Mar 31, 2016) 219.1105 9.45% 5.43% 5.81%
Last 10 years (Mar 31, 2006 to Mar 31, 2016) 111.8800 11.89% 8.42% 8.56%
Last 15 years (Mar 30, 2001 to Mar 31, 2016) 20.2500 20.77% 13.87% 13.55%
Since inception till Mar 31, 2016 10.0000 21.84% 9.56% 9.55%
Current Value of Standard Investment of Rs 10000
Last 2 years 13198 11320 11543
Last 3 years 15279 13454 13618
Last 5 years 15713 13032 13265
Last 10 years 30773 22466 22743
Last 15 years 170021 70309 67396
Since inception (1.12.1993) 825889 76960 76773
Franklin India Prima Fund (FIPF) - Growth Option
NAV as at Mar 31, 2016 : (Rs.) 650.7346
Fund Manager : R. Janakiraman, Roshi Jain
NAV Per unit (Rs.) B: Nifty 500 AB:Nifty 50B:Nifty Free Float
@Midcap 100FIPF
Discrete 12 months performance
Mar 31, 2015 to Mar 31, 2016 (Last 1 year) 662.5217 -1.78% -7.54% -1.91% -8.86%
Mar 31, 2014 to Mar 31, 2015 393.1705 68.51% 33.56% 50.96% 26.65%
Mar 28, 2013 to Mar 31, 2014 305.2336 28.81% 17.72% 16.36% 17.98%
NAV Per unit (Rs.) FIPP AB: Nifty 50B: Nifty 500
Franklin India Prima Plus (FIPP) - Growth OptionNAV as at Mar 31, 2016 : (Rs.) 432.2279Fund Manager: Anand Radhakrishnan, R. Janakiraman
Discrete 12 months performance
Mar 31, 2015 to Mar 31, 2016 (Last 1 year) 442.1925 -2.25% -7.54% -8.86%
Mar 31, 2014 to Mar 31, 2015 288.6880 53.17% 33.56% 26.65%
Mar 28, 2013 to Mar 31, 2014 237.7108 21.45% 17.72% 17.98%
Compounded Annualised Growth Rate Performance
Last 2 years (Mar 31, 2014 to Mar 31, 2016) 22.33% 11.11% 7.43%
Last 3 years (Mar 28, 2013 to Mar 31, 2016) 21.97% 13.23% 10.80%
Last 5 years (Mar 31, 2011 to Mar 31, 2016) 224.0997 14.02% 6.87% 5.81%
Last 10 years (Mar 31, 2006 to Mar 31, 2016) 113.2900 14.32% 8.28% 8.56%
Last 15 years (Mar 30, 2001 to Mar 31, 2016) 19.0400 23.12% 15.37% 13.55%
Since inception till Mar 31, 2016 10.0000 19.13% 8.62% 8.60%
Current Value of Standard Investment of Rs 10000
Last 2 years 14972 12349 11543
Last 3 years 18183 14537 13618
Last 5 years 19287 13946 13265
Last 10 years 38152 22170 22743
Last 15 years 227010 85551 67396
Since inception (29.9.1994) 432228 59291 59007
Discrete 12 months performance
Mar 31, 2015 to Mar 31, 2016 (Last 1 year) 62.3907 -4.41% -7.54% -8.86%
Mar 31, 2014 to Mar 31, 2015 41.0467 52.00% 33.56% 26.65%
Mar 28, 2013 to Mar 31, 2014 33.3781 22.97% 17.72% 17.98%
Compounded Annualised Growth Rate Performance
Last 2 years (Mar 31, 2014 to Mar 31, 2016) 20.51% 11.11% 7.43%
Last 3 years (Mar 28, 2013 to Mar 31, 2016) 21.26% 13.23% 10.80%
Last 5 years (Mar 31, 2011 to Mar 31, 2016) 33.0497 12.52% 6.87% 5.81%
Last 10 years (Mar 31, 2006 to Mar 31, 2016) 18.3000 12.53% 8.28% 8.56%
Since inception till Mar 31, 2016 10.0000 17.47% 12.06% 12.52%
Current Value of Standard Investment of Rs 10000
Last 2 years 14529 12349 11543
Last 3 years 17867 14537 13618
Last 5 years 18045 13946 13265
Last 10 years 32588 22170 22743
Since inception (2.3.2005) 59637 35348 36968
Franklin India Flexi Cap Fund (FIFCF) - Growth Option
NAV as at Mar 31, 2016 : (Rs.) 59.6368
Fund Manager: R. Janakiraman / Roshi Jain, Anand Vasudevan
NAV Per unit (Rs.) FIFCF AB: Nifty 50B: Nifty 500
Franklin India Opportunities Fund (FIOF) - Growth Option
NAV as at Mar 31, 2016 : (Rs.) 53.2212
Fund Manager: R JanakiramanNAV Per unit (Rs.) FIOF AB: Nifty 50B: S&P BSE 200 #
Compounded Annualised Growth Rate Performance
Last 2 years (Mar 31, 2014 to Mar 31, 2016) 28.61% 11.11% 21.65% 7.43%
Last 3 years (Mar 28, 2013 to Mar 31, 2016) 28.59% 13.23% 19.80% 10.80%
Last 5 years (Mar 31, 2011 to Mar 31, 2016) 267.5531 19.43% 6.87% 9.65% 5.81%
Last 10 years (Mar 31, 2006 to Mar 31, 2016) 196.8800 12.69% 8.28% 10.29% 8.56%
Last 15 years (Mar 30, 2001 to Mar 31, 2016) 18.1500 26.92% 15.37% 19.67% 13.55%
Since inception till Mar 31, 2016 10.0000 20.55% 9.53% N.A 9.55%
Current Value of Standard Investment of Rs 10000
Last 2 years 16551 12349 14807 11543
Last 3 years 21319 14537 17230 13618
Last 5 years 24322 13946 15861 13265
Last 10 years 33052 22170 26639 22743
Last 15 years 358531 85551 148109 67396
Since inception (1.12.1993) 650735 76442 N.A 76773
# Nifty Free Float Midcap 100 has been included as additional benchmark for Franklin India Prima
Fund (FIPF) effective May 20, 2013
# Index adjusted for the period February 21, 2000 to March 10, 2004 with the performance of ET Mindex.
Templeton India Equity Income Fund (TIEIF) - Growth Option
NAV as at Mar 31, 2016 : (Rs.) 32.3321
Fund Manager: Chetan Sehgal & Vikas Chiranewal
NAV Per unit (Rs.) TIEIF AB: Nifty 50B: S&P BSE 200
Discrete 12 months performance
Mar 31, 2015 to Mar 31, 2016 (Last 1 year) 33.0300 -2.11% -7.86% -8.86%
Mar 31, 2014 to Mar 31, 2015 24.6340 34.08% 31.93% 26.65%
Mar 28, 2013 to Mar 31, 2014 21.7965 13.02% 17.19% 17.98%
Compounded Annualised Growth Rate Performance
Last 2 years (Mar 31, 2014 to Mar 31, 2016) 14.54% 10.24% 7.43%
Last 3 years (Mar 28, 2013 to Mar 31, 2016) 13.99% 12.47% 10.80%
Last 5 years (Mar 31, 2011 to Mar 31, 2016) 20.8198 9.19% 6.49% 5.81%
Since inception till Mar 31, 2016 10.0000 12.62% 8.87% 8.72%
Current Value of Standard Investment of Rs 10000
Discrete 12 months performance
Mar 31, 2015 to Mar 31, 2016 (Last 1 year) 57.8824 -8.05% -7.86% -8.86%
Mar 31, 2014 to Mar 31, 2015 36.7295 57.59% 31.93% 26.65%
Mar 28, 2013 to Mar 31, 2014 30.3088 21.18% 17.19% 17.98%
Compounded Annualised Growth Rate Performance
Last 2 years (Mar 31, 2014 to Mar 31, 2016) 20.34% 10.24% 7.43%
Last 3 years (Mar 28, 2013 to Mar 31, 2016) 20.56% 12.47% 10.80%
Last 5 years (Mar 31, 2011 to Mar 31, 2016) 31.6798 10.92% 6.49% 5.81%
Last 10 years (Mar 31, 2006 to Mar 31, 2016) 21.2700 9.60% 8.71% 8.56%
Last 15 years (Mar 30, 2001 to Mar 31, 2016) 4.9500 17.14% 10.95% 13.55%
Since inception till Mar 31, 2016 10.0000 10.93% -0.22% 9.65%
Current Value of Standard Investment of Rs 10000
Last 2 years 14490 12156 11543
Last 3 years 17560 14246 13618
Last 5 years 16800 13702 13265
Last 10 years 25022 23073 22743
Last 15 years 107518 47591 67396
Since inception (21.2.2000) 53221 9645 44131
@ Nifty Midcap 100 has been renamed as Nifty Free Float Midcap 100 w.e.f. April 01, 2016 and CRISIL Balanced Fund Index has been renamed as CRISIL Balanced Fund – Aggressive Index w.e.f. April 04, 2016.
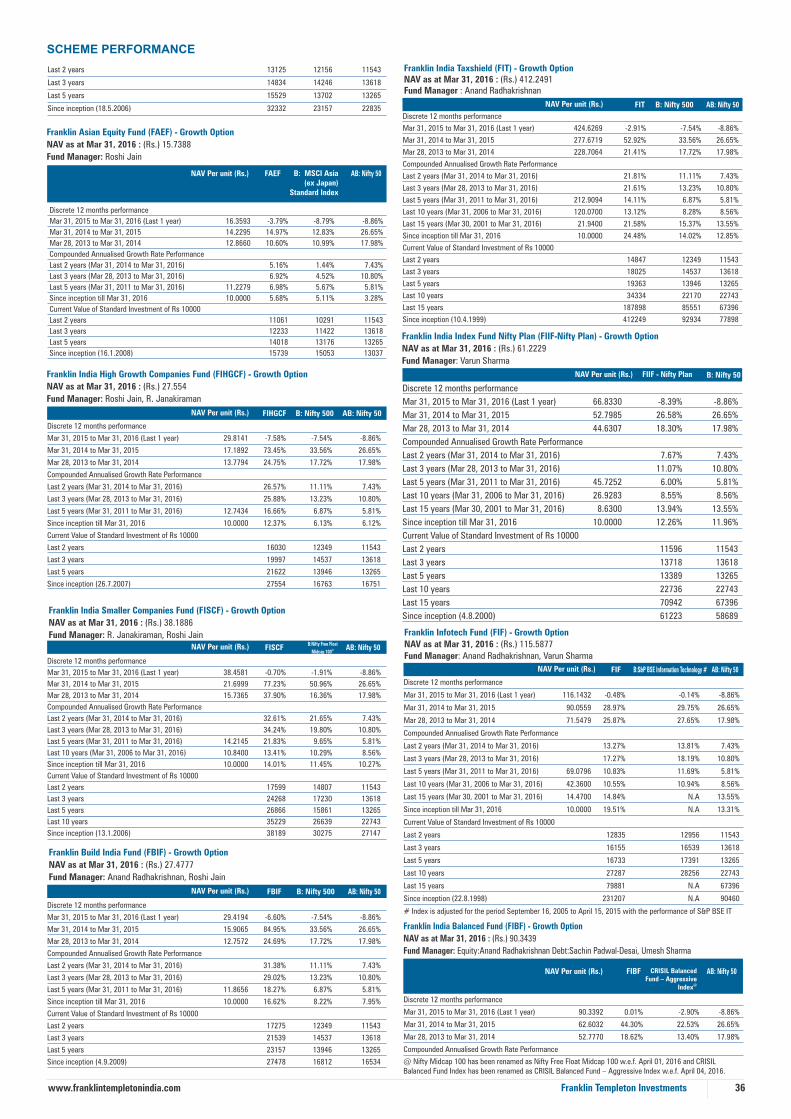
36Franklin Templeton Investmentswww.franklintempletonindia.com
SCHEME PERFORMANCE
Franklin Build India Fund (FBIF) - Growth Option
NAV as at Mar 31, 2016 : (Rs.) 27.4777
Fund Manager: Anand Radhakrishnan, Roshi Jain
NAV Per unit (Rs.) FBIF AB: Nifty 50B: Nifty 500
Discrete 12 months performance
Mar 31, 2015 to Mar 31, 2016 (Last 1 year) 29.4194 -6.60% -7.54% -8.86%
Mar 31, 2014 to Mar 31, 2015 15.9065 84.95% 33.56% 26.65%
Mar 28, 2013 to Mar 31, 2014 12.7572 24.69% 17.72% 17.98%
Compounded Annualised Growth Rate Performance
Last 2 years (Mar 31, 2014 to Mar 31, 2016) 31.38% 11.11% 7.43%
Last 3 years (Mar 28, 2013 to Mar 31, 2016) 29.02% 13.23% 10.80%
Last 5 years (Mar 31, 2011 to Mar 31, 2016) 11.8656 18.27% 6.87% 5.81%
Since inception till Mar 31, 2016 10.0000 16.62% 8.22% 7.95%
Current Value of Standard Investment of Rs 10000
Last 2 years 17275 12349 11543
Last 3 years 21539 14537 13618
Last 5 years 23157 13946 13265
Since inception (4.9.2009) 27478 16812 16534
Franklin Asian Equity Fund (FAEF) - Growth Option
NAV as at Mar 31, 2016 : (Rs.) 15.7388
Fund Manager: Roshi Jain
NAV Per unit (Rs.) B: MSCI Asia(ex Japan)
Standard Index
FAEF AB: Nifty 50
Discrete 12 months performance
Mar 31, 2015 to Mar 31, 2016 (Last 1 year) 16.3593 -3.79% -8.79% -8.86%
Mar 31, 2014 to Mar 31, 2015 14.2295 14.97% 12.83% 26.65%
Mar 28, 2013 to Mar 31, 2014 12.8660 10.60% 10.99% 17.98%
Compounded Annualised Growth Rate Performance
Last 2 years (Mar 31, 2014 to Mar 31, 2016) 5.16% 1.44% 7.43%
Last 3 years (Mar 28, 2013 to Mar 31, 2016) 6.92% 4.52% 10.80%
Last 5 years (Mar 31, 2011 to Mar 31, 2016) 11.2279 6.98% 5.67% 5.81%
Since inception till Mar 31, 2016 10.0000 5.68% 5.11% 3.28%
Current Value of Standard Investment of Rs 10000
Last 2 years 11061 10291 11543
Last 3 years 12233 11422 13618
Last 5 years 14018 13176 13265
Since inception (16.1.2008) 15739 15053 13037
Discrete 12 months performance
Mar 31, 2015 to Mar 31, 2016 (Last 1 year) 424.6269 -2.91% -7.54% -8.86%
Mar 31, 2014 to Mar 31, 2015 277.6719 52.92% 33.56% 26.65%
Mar 28, 2013 to Mar 31, 2014 228.7064 21.41% 17.72% 17.98%
Compounded Annualised Growth Rate Performance
Last 2 years (Mar 31, 2014 to Mar 31, 2016) 21.81% 11.11% 7.43%
Last 3 years (Mar 28, 2013 to Mar 31, 2016) 21.61% 13.23% 10.80%
Last 5 years (Mar 31, 2011 to Mar 31, 2016) 212.9094 14.11% 6.87% 5.81%
Last 10 years (Mar 31, 2006 to Mar 31, 2016) 120.0700 13.12% 8.28% 8.56%
Last 15 years (Mar 30, 2001 to Mar 31, 2016) 21.9400 21.58% 15.37% 13.55%
Since inception till Mar 31, 2016 10.0000 24.48% 14.02% 12.85%
Current Value of Standard Investment of Rs 10000
Last 2 years 14847 12349 11543
Last 3 years 18025 14537 13618
Last 5 years 19363 13946 13265
Last 10 years 34334 22170 22743
Last 15 years 187898 85551 67396
Since inception (10.4.1999) 412249 92934 77898
NAV Per unit (Rs.) FIT AB: Nifty 50B: Nifty 500
Franklin India Taxshield (FIT) - Growth OptionNAV as at Mar 31, 2016 : (Rs.) 412.2491Fund Manager : Anand Radhakrishnan
Franklin India High Growth Companies Fund (FIHGCF) - Growth Option
NAV as at Mar 31, 2016 : (Rs.) 27.554
Fund Manager: Roshi Jain, R. Janakiraman
NAV Per unit (Rs.) FIHGCF AB: Nifty 50B: Nifty 500
Discrete 12 months performance
Mar 31, 2015 to Mar 31, 2016 (Last 1 year) 29.8141 -7.58% -7.54% -8.86%
Mar 31, 2014 to Mar 31, 2015 17.1892 73.45% 33.56% 26.65%
Mar 28, 2013 to Mar 31, 2014 13.7794 24.75% 17.72% 17.98%
Compounded Annualised Growth Rate Performance
Last 2 years (Mar 31, 2014 to Mar 31, 2016) 26.57% 11.11% 7.43%
Last 3 years (Mar 28, 2013 to Mar 31, 2016) 25.88% 13.23% 10.80%
Last 5 years (Mar 31, 2011 to Mar 31, 2016) 12.7434 16.66% 6.87% 5.81%
Since inception till Mar 31, 2016 10.0000 12.37% 6.13% 6.12%
Current Value of Standard Investment of Rs 10000
Last 2 years 16030 12349 11543
Last 3 years 19997 14537 13618
Last 5 years 21622 13946 13265
Since inception (26.7.2007) 27554 16763 16751
Last 2 years 13125 12156 11543
Last 3 years 14834 14246 13618
Last 5 years 15529 13702 13265
Since inception (18.5.2006) 32332 23157 22835
NAV Per unit (Rs.) FIF AB: Nifty 50B:S&P BSE Information Technology #
Franklin Infotech Fund (FIF) - Growth Option
NAV as at Mar 31, 2016 : (Rs.) 115.5877
Fund Manager: Anand Radhakrishnan, Varun Sharma
Discrete 12 months performance
Mar 31, 2015 to Mar 31, 2016 (Last 1 year) 116.1432 -0.48% -0.14% -8.86%
Mar 31, 2014 to Mar 31, 2015 90.0559 28.97% 29.75% 26.65%
Mar 28, 2013 to Mar 31, 2014 71.5479 25.87% 27.65% 17.98%
Compounded Annualised Growth Rate Performance
Last 2 years (Mar 31, 2014 to Mar 31, 2016) 13.27% 13.81% 7.43%
Last 3 years (Mar 28, 2013 to Mar 31, 2016) 17.27% 18.19% 10.80%
Last 5 years (Mar 31, 2011 to Mar 31, 2016) 69.0796 10.83% 11.69% 5.81%
Last 10 years (Mar 31, 2006 to Mar 31, 2016) 42.3600 10.55% 10.94% 8.56%
Last 15 years (Mar 30, 2001 to Mar 31, 2016) 14.4700 14.84% N.A 13.55%
Since inception till Mar 31, 2016 10.0000 19.51% N.A 13.31%
Current Value of Standard Investment of Rs 10000
Last 2 years 12835 12956 11543
Last 3 years 16155 16539 13618
Last 5 years 16733 17391 13265
Last 10 years 27287 28256 22743
Last 15 years 79881 N.A 67396
Since inception (22.8.1998) 231207 N.A 90460
# Index is adjusted for the period September 16, 2005 to April 15, 2015 with the performance of S&P BSE IT
Franklin India Balanced Fund (FIBF) - Growth Option
NAV as at Mar 31, 2016 : (Rs.) 90.3439
Fund Manager: Equity:Anand Radhakrishnan Debt:Sachin Padwal-Desai, Umesh Sharma
Discrete 12 months performance
Mar 31, 2015 to Mar 31, 2016 (Last 1 year) 90.3392 0.01% -2.90% -8.86%
Mar 31, 2014 to Mar 31, 2015 62.6032 44.30% 22.53% 26.65%
Mar 28, 2013 to Mar 31, 2014 52.7770 18.62% 13.40% 17.98%
Compounded Annualised Growth Rate Performance
NAV Per unit (Rs.) CRISIL Balanced Fund – Aggressive
@Index
FIBF AB: Nifty 50
Franklin India Index Fund Nifty Plan (FIIF-Nifty Plan) - Growth Option
NAV as at Mar 31, 2016 : (Rs.) 61.2229
Fund Manager: Varun Sharma
NAV Per unit (Rs.) FIIF - Nifty Plan B: Nifty 50
Discrete 12 months performance
Mar 31, 2015 to Mar 31, 2016 (Last 1 year) 66.8330 -8.39% -8.86%
Mar 31, 2014 to Mar 31, 2015 52.7985 26.58% 26.65%
Mar 28, 2013 to Mar 31, 2014 44.6307 18.30% 17.98%
Compounded Annualised Growth Rate Performance
Last 2 years (Mar 31, 2014 to Mar 31, 2016) 7.67% 7.43%
Last 3 years (Mar 28, 2013 to Mar 31, 2016) 11.07% 10.80%
Last 5 years (Mar 31, 2011 to Mar 31, 2016) 45.7252 6.00% 5.81%
Last 10 years (Mar 31, 2006 to Mar 31, 2016) 26.9283 8.55% 8.56%
Last 15 years (Mar 30, 2001 to Mar 31, 2016) 8.6300 13.94% 13.55%
Since inception till Mar 31, 2016 10.0000 12.26% 11.96%
Current Value of Standard Investment of Rs 10000
Last 2 years 11596 11543
Last 3 years 13718 13618
Last 5 years 13389 13265
Last 10 years 22736 22743
Last 15 years 70942 67396
Since inception (4.8.2000) 61223 58689Franklin India Smaller Companies Fund (FISCF) - Growth Option
NAV as at Mar 31, 2016 : (Rs.) 38.1886
Fund Manager: R. Janakiraman, Roshi JainNAV Per unit (Rs.) FISCF AB: Nifty 50
B:Nifty Free Float @Midcap 100
Discrete 12 months performance
Mar 31, 2015 to Mar 31, 2016 (Last 1 year) 38.4581 -0.70% -1.91% -8.86%
Mar 31, 2014 to Mar 31, 2015 21.6999 77.23% 50.96% 26.65%
Mar 28, 2013 to Mar 31, 2014 15.7365 37.90% 16.36% 17.98%
Compounded Annualised Growth Rate Performance
Last 2 years (Mar 31, 2014 to Mar 31, 2016) 32.61% 21.65% 7.43%
Last 3 years (Mar 28, 2013 to Mar 31, 2016) 34.24% 19.80% 10.80%
Last 5 years (Mar 31, 2011 to Mar 31, 2016) 14.2145 21.83% 9.65% 5.81%
Last 10 years (Mar 31, 2006 to Mar 31, 2016) 10.8400 13.41% 10.29% 8.56%
Since inception till Mar 31, 2016 10.0000 14.01% 11.45% 10.27%
Current Value of Standard Investment of Rs 10000
Last 2 years 17599 14807 11543
Last 3 years 24268 17230 13618
Last 5 years 26866 15861 13265
Last 10 years 35229 26639 22743
Since inception (13.1.2006) 38189 30275 27147
@ Nifty Midcap 100 has been renamed as Nifty Free Float Midcap 100 w.e.f. April 01, 2016 and CRISIL Balanced Fund Index has been renamed as CRISIL Balanced Fund – Aggressive Index w.e.f. April 04, 2016.

SCHEME PERFORMANCE
37Franklin Templeton Investmentswww.franklintempletonindia.com
Franklin India Dynamic PE Ratio Fund of Funds (FIDPEF) - Growth OptionNAV as at Mar 31, 2016 : (Rs.) 62.5329Fund Manager : Anand Radhakrishnan
Discrete 12 months performance
Mar 31, 2015 to Mar 31, 2016 (Last 1 year) 61.5933 1.53% -9.36% -2.90% N.A
Mar 28, 2014 to Mar 31, 2015 49.6065 24.16% 25.15% 22.66% N.A
Mar 28, 2013 to Mar 28, 2014 44.5739 11.29% 18.60% 13.28% N.A
Compounded Annualised Growth Rate Performance
Last 2 years (Mar 28, 2014 to Mar 31, 2016) 12.20% 6.47% 9.08% N.A
Last 3 years (Mar 28, 2013 to Mar 31, 2016) 11.90% 10.36% 10.46% N.A
Last 5 years (Mar 31, 2011 to Mar 31, 2016) 40.6395 8.99% 5.43% 7.15% N.A
Last 10 years (Mar 31, 2006 to Mar 31, 2016) 21.3359 11.34% 8.42% 8.86% N.A
Since inception till Mar 31, 2016 10.0000 15.90% 14.13% 11.61% N.A
Current Value of Standard Investment of Rs 10000
Last 2 years 12606 11344 11910 N.A
Last 3 years 14029 13454 13491 N.A
Last 5 years 15387 13032 14132 N.A
Last 10 years 29309 22466 23379 N.A
Since inception (31.10.2003) 62533 51646 39143 N.A
NAV Per unit (Rs.) CRISIL Balanced Fund – Aggressive
@Index
FIDPEF AdditionalBenchmark
B: S&P BSESensex
Franklin India Pension Plan (FIPEP) - Growth Option
NAV as at Mar 31, 2016 : (Rs.) 100.4057Fund Manager Equity: Anand Radhakrishnan Debt:Sachin Padwal-Desai, Umesh Sharma
NAV Per unit (Rs.) Benchmark*FIPEP AB:Crisil 10 YearGilt Index
Discrete 12 months performance
Mar 31, 2015 to Mar 31, 2016 (Last 1 year) 98.0807 2.37% 1.95% 7.97%
Mar 31, 2014 to Mar 31, 2015 74.1104 32.34% 22.05% 14.57%
Mar 28, 2013 to Mar 31, 2014 67.1221 10.41% 9.75% -0.96%
Compounded Annualised Growth Rate Performance
Last 2 years (Mar 31, 2014 to Mar 31, 2016) 16.37% 11.53% 11.21%
Last 3 years (Mar 28, 2013 to Mar 31, 2016) 14.31% 10.90% 6.98%
Last 5 years (Mar 31, 2011 to Mar 31, 2016) 58.7186 11.31% 8.33% 6.90%
Last 10 years (Mar 31, 2006 to Mar 31, 2016) 39.1300 9.87% 8.55% 6.66%
Last 15 years (Mar 30, 2001 to Mar 31, 2016) 16.3600 12.85% N.A N.A
Since inception till Mar 31, 2016 10.0000 12.90% N.A N.A
Current Value of Standard Investment of Rs 10000
Last 2 years 13548 12443 12371
Last 3 years 14959 13656 12252
Last 5 years 17099 14929 13962
Last 10 years 25660 22724 19065
Last 15 years 61373 N.A N.A
Since inception (31.3.1997) 100406 N.A N.A
*40% Nifty 500 + 60% CRISIL Composite Bond Fund Index
Franklin India Life Stage Fund of Funds (FILSF) - Growth Option
NAV as at Mar 31, 2016 : (Rs.)
The 20s Plan: 61.3254 The 30s Plan: 45.1992 The 40s Plan: 36.9105
The 50s Plus Plan: 27.9148 The 50s Plus Floating Rate Plan: 29.8822
Fund Manager: Equity: Anand Radhakrishnan Debt: Sachin Padwal-Desai, Pallab Roy
Discrete 12 months performance
Mar 31, 2014 to
Mar 31, 2015
Mar 28, 2013to
Mar 31, 2014
Compounded Annualised Growth Rate Performance
Last 2 years
(Mar 31, 2014 to Mar 31,
2016)
Last 3 years
(Mar 28, 2013 to Mar 31,
2016)
Last 5 years
(Mar 31, 2011 to Mar 31,
2016)
Since inception
till Mar 31, 2016
Last
2 years
Last
3 years
Last
5 years
since
inception
Current Value of Standard Investment of Rs 10000 invested at the
beginning of the period
Last 10 years (Mar 31, 2006 to Mar 31,
2016)
Last 10
years
The 20s Plan - NAV Per Unit (Rs.)
The 20s Plan - Returns
Benchmark*
The 30s Plan - NAV Per Unit (Rs.)
The 30s Plan - Returns
Benchmark*
The 40s Plan - NAV Per Unit (Rs.)
The 40s Plan - Returns
Benchmark*
The 50s Plus Plan - NAV Per Unit (Rs.)
The 50s Plus Plan - Returns
Benchmark*
Additional Benchmark
The 50s Plus Floating Rate Plan - NAV Per Unit (Rs.)
The 50s Plus Floating Rate Plan - Returns
Benchmark*
Additional Benchmark
Mar 31, 2015 to
Mar 31, 2016 (Last 1 year)
62.2134
-1.43%
-5.63%
44.7475
1.01%
-1.35%
35.8722
2.89%
2.19%
26.7568
4.33%
4.65%
N.A
28.2131
5.92%
4.55%
N.A
45.6780
36.20%
24.42%
34.8477
28.41%
21.38%
29.0193
23.61%
19.26%
22.8475
17.11%
16.83%
N.A
24.6341
14.53%
12.26%
N.A
39.8352
14.67%
15.53%
31.2500
11.51%
12.00%
26.4863
9.56%
9.15%
21.4458
6.54%
7.14%
N.A
22.3440
10.25%
11.37%
N.A
15.78%
8.31%
13.81%
9.37%
12.71%
10.34%
10.47%
10.51%
N.A
10.08%
8.29%
N.A
15.41%
10.66%
13.04%
10.24%
11.65%
9.94%
9.15%
9.38%
N.A
10.14%
9.30%
N.A
37.1678
10.52%
6.51%
28.0881
9.97%
7.37%
23.2931
9.63%
8.02%
18.8232
8.19%
8.28%
N.A
19.5098
8.89%
8.19%
N.A
20.7136
11.46%
8.68%
16.8502
10.36%
8.67%
14.3724
9.88%
8.40%
12.3386
8.50%
8.02%
N.A
12.6401
8.98%
8.22%
N.A
10.0000
15.83%
12.78%
10.0000
13.00%
11.17%
10.0000
11.16%
9.64%
10.0000
8.68%
8.31%
N.A
10.0000
9.78%
9.12%
N.A
13426
11742
12970
11974
12719
12187
12218
12226
N.A
12130
11737
N.A
15395
13565
14464
13412
13936
13303
13016
13099
N.A
13374
13071
N.A
16500
13710
16092
14274
15846
14711
14830
14892
N.A
15317
14828
N.A
29606
23009
26824
22979
25682
22417
22624
21639
N.A
23641
22038
N.A
61325
44091
45199
36923
36911
31123
27915
26767
N.A
29882
27838
N.A
Inception: FILSF 20s Plan/30s Plan/40s Plan/50s plus Plan(1.12.2003); 50s plus Floating Rate Plan (9.7.2004)*Benchmark: The 20s Plan - 65% S&P BSE Sensex + 15% Nifty 500 + 20% Crisil Composite Bond Fund Index; The 30s Plan -
45%S&P BSE Sensex + 10% Nifty 500 + 45% Crisil Composite Bond Fund Index; The 40s Plan - 25% S&P BSE Sensex + 10%
Nifty 500 + 65% Crisil Composite Bond Fund Index; The 50s Plus Plan - 20% S&P BSE Sensex+ 80% Crisil Composite Bond Fund
Index; The 50s Plus Floating Rate Plan - 20% S&P BSE Sensex + 80% Crisil Liquid Fund Index.
Last 2 years (Mar 31, 2014 to Mar 31, 2016) 20.10% 9.06% 7.43%
Last 3 years (Mar 28, 2013 to Mar 31, 2016) 19.55% 10.46% 10.80%
Last 5 years (Mar 31, 2011 to Mar 31, 2016) 49.3944 12.82% 7.15% 5.81%
Last 10 years (Mar 31, 2006 to Mar 31, 2016) 28.1600 12.35% 8.86% 8.56%
Last 15 years (Mar 30, 2001 to Mar 31, 2016) 7.7700 17.75% N.A 13.55%
Since inception till Mar 31, 2016 10.0000 14.44% N.A 10.86%
Current Value of Standard Investment of Rs 10000
Last 2 years 14431 11897 11543
Last 3 years 17118 13491 13618
Last 5 years 18290 14132 13265
Last 10 years 32082 23379 22743
Last 15 years 116273 N.A 67396
Since inception (10.12.1999) 90344 N.A 53750
Franklin India Income Builder Account (FIIBA) - Plan A - Growth OptionNAV as at Mar 31, 2016 : (Rs.) 51.2905Fund Manager: Santosh Kamath, Sumit Gupta
NAV Per unit (Rs.) B: Crisil CompositeBond Fund Index
FIIBA AB: Crisil 10 yeargilt Index
Discrete 12 months performance
Mar 31, 2015 to Mar 31, 2016 (Last 1 year) 48.4648 5.83% 8.24% 7.97%
Mar 28, 2014 to Mar 31, 2015 42.7076 13.48% 14.67% 14.63%
Mar 28, 2013 to Mar 28, 2014 39.4955 8.13% 4.32% -1.01%
Compounded Annualised Growth Rate Performance
Last 2 years (Mar 28, 2014 to Mar 31, 2016) 9.53% 11.34% 11.19%
Last 3 years (Mar 28, 2013 to Mar 31, 2016) 9.07% 8.96% 6.98%
Last 5 years (Mar 31, 2011 to Mar 31, 2016) 32.0837 9.83% 8.77% 6.90%
Last 10 years (Mar 31, 2006 to Mar 31, 2016) 23.8858 7.94% 7.35% 6.66%
Last 15 years (Mar 30, 2001 to Mar 31, 2016) 16.0500 8.05% N.A N.A
Since inception till Mar 31, 2016 10.0000 9.09% N.A N.A
Current Value of Standard Investment of Rs 10000
Last 2 years 12010 12412 12377
Last 3 years 12986 12947 12252
Last 5 years 15986 15230 13962
Last 10 years 21473 20330 19065
Last 15 years 31957 N.A N.A
Since inception (23.6.1997) 51291 N.A N.A
Franklin India Dynamic Accrual Fund (FIDA) - Growth option(Fund name change W.E.F. 01 December 2014, Erstwhile Franklin India Income Fund)
NAV as at Mar 31, 2016 : (Rs.) 50.9008Fund Manager : Santosh Kamath, Umesh Sharma, Sachin Padwal-Desai
NAV Per unit (Rs.) B: Crisil CompositeBond Fund Index
FIDA AB:Crisil 10 yearGilt Index
Discrete 12 months performance
Mar 31, 2015 to Mar 31, 2016 (Last 1 year) 47.0032 8.29% 8.24% 7.97%
Mar 28, 2014 to Mar 31, 2015 41.3849 13.58% 14.67% 14.63%
Mar 28, 2013 to Mar 28, 2014 39.6936 4.26% 4.32% -1.01%
Compounded Annualised Growth Rate Performance
Last 2 years (Mar 28, 2014 to Mar 31, 2016) 10.84% 11.34% 11.19%
Last 3 years (Mar 28, 2013 to Mar 31, 2016) 8.61% 8.96% 6.98%
Last 5 years (Mar 31, 2011 to Mar 31, 2016) 33.4494 8.75% 8.77% 6.90%
Last 10 years (Mar 31, 2006 to Mar 31, 2016) 24.4861 7.59% 7.35% 6.66%
Last 15 years (Mar 30, 2001 to Mar 31, 2016) 16.7100 7.70% N.A N.A
Since inception till Mar 31, 2016 10.0000 8.90% N.A N.A
Current Value of Standard Investment of Rs 10000
Last 2 years 12299 12412 12377
Last 3 years 12823 12947 12252
Last 5 years 15217 15230 13962
Last 10 years 20788 20330 19065
Last 15 years 30461 N.A N.A
Since inception (5.3.1997) 50901 N.A N.A
@ Nifty Midcap 100 has been renamed as Nifty Free Float Midcap 100 w.e.f. April 01, 2016 and CRISIL Balanced Fund Index has been renamed as CRISIL Balanced Fund – Aggressive Index w.e.f. April 04, 2016.

SCHEME PERFORMANCE
38Franklin Templeton Investmentswww.franklintempletonindia.com
Franklin India Income Opportunities Fund (FIIOF) - Growth OptionNAV as at Mar 31, 2016 : (Rs.) 17.1218Fund Manager : Santosh Kamath, Sumit Gupta
NAV Per unit (Rs.) B: Crisil Short-Term Bond Fund Index
AB: Crisil 10 yeargilt Index
FIIOF
Discrete 12 months performance
Mar 31, 2015 to Mar 31, 2016 (Last 1 year) 16.1294 6.15% 8.47% 7.97%
Mar 28, 2014 to Mar 31, 2015 14.4138 11.90% 10.40% 14.63%
Mar 28, 2013 to Mar 28, 2014 13.2420 8.85% 8.78% -1.01%
Compounded Annualised Growth Rate Performance
Last 2 years (Mar 28, 2014 to Mar 31, 2016) 8.94% 9.38% 11.19%
Last 3 years (Mar 28, 2013 to Mar 31, 2016) 8.91% 9.18% 6.98%
Last 5 years (Mar 31, 2011 to Mar 31, 2016) 10.9683 9.30% 8.98% 6.90%
Since inception till Mar 31, 2016 10.0000 8.90% 8.16% 6.26%
Current Value of Standard Investment of Rs 10000
Last 2 years 11879 11975 12377
Last 3 years 12930 13027 12252
Last 5 years 15610 15382 13962
Since inception (11.12.2009) 17122 16404 14662
Discrete 12 months performance
Mar 31, 2015 to Mar 31, 2016 (Last 1 year) 10.3372 9.07% 8.47% 7.69%
Mar 28, 2014 to Mar 31, 2015 10.3088 10.13% 10.40% 8.82%
Mar 28, 2013 to Mar 28, 2014 10.3106 9.77% 8.78% 5.77%
Compounded Annualised Growth Rate Performance
Last 2 years (Mar 28, 2014 to Mar 31, 2016) 9.54% 9.38% 8.21%
Last 3 years (Mar 28, 2013 to Mar 31, 2016) 9.62% 9.18% 7.39%
Last 5 years (Mar 31, 2011 to Mar 31, 2016) 10.2708 9.79% 8.98% 7.43%
Last 10 years (Mar 31, 2006 to Mar 31, 2016) 10.1969 8.13% 8.24% 6.25%
Franklin India Low Duration Fund (FILDF) - Quarterly Dividend (QD)NAV as at Mar 31, 2016 : (Rs.) QD: 10.3379Fund Manager: Santosh Kamath & Kunal Agrawal
NAV Per unit (Rs.) B: Crisil Short-termBond Fund Index #
QD AB:Crisil 1 year T-Bill Index
Franklin India Government Securities Fund (FIGSF) - Growth - Composite Plan (CP)NAV as at Mar 31, 2016 : (Rs.) CP: 49.5294Fund Manager : Sachin Padwal-Desai, Umesh Sharma
NAV Per unit (Rs.) B: I-SecComposite
Index
CP AB: Crisil 10 Year
Gilt Index
Discrete 12 months performance
Mar 31, 2015 to Mar 31, 2016 (Last 1 year) 46.9042 5.60% 8.22% 7.97%
Mar 28, 2014 to Mar 31, 2015 39.0566 20.09% 15.72% 14.63%
Mar 28, 2013 to Mar 28, 2014 38.5661 1.27% 3.91% -1.01%
Compounded Annualised Growth Rate Performance
Last 2 years (Mar 28, 2014 to Mar 31, 2016) 12.54% 11.84% 11.19%
Last 3 years (Mar 28, 2013 to Mar 31, 2016) 8.66% 9.14% 6.98%
Last 5 years (Mar 31, 2011 to Mar 31, 2016) 33.4331 8.17% 9.17% 6.90%
Last 10 years (Mar 31, 2006 to Mar 31, 2016) 23.2095 7.87% 8.41% 6.66%
Last 15 years (Mar 30, 2001 to Mar 31, 2016) 13.1000 9.26% N.A N.A
Since inception till Mar 31, 2016 10.0000 10.00% N.A N.A
Current Value of Standard Investment of Rs 10000
Last 2 years 12681 12523 12377
Last 3 years 12843 13012 12252
Last 5 years 14814 15514 13962
Last 10 years 21340 22428 19065
Last 15 years 37809 N.A N.A
Since inception (21.6.1999) 49529 N.A N.A
Last 15 years (Mar 30, 2001 to Mar 31, 2016) 10.2100 7.68% N.A 6.17%
Since inception till Mar 31, 2016 10.0000 7.83% N.A 6.38%
Current Value of Standard Investment of Rs 10000
Last 2 years 12012 11975 11719
Last 3 years 13185 13027 12395
Last 5 years 15960 15382 14312
Last 10 years 21867 22089 18348
Last 15 years 30384 N.A 24583
Since inception (7.2.2000) 33809 N.A 27164
Franklin India Government Securities Fund (FIGSF) - Growth - PF PlanNAV as at Mar 31, 2016 : (Rs.) PF: 21.7545Fund Manager : Sachin Padwal - Desai & Umesh Sharma
Discrete 12 months performance
Mar 31, 2015 to Mar 31, 2016 (Last 1 year) 20.6015 5.60% 8.22% 7.97%
Mar 28, 2014 to Mar 31, 2015 17.1546 20.09% 15.72% 14.63%
Mar 28, 2013 to Mar 28, 2014 16.9392 1.27% 3.91% -1.01%
Compounded Annualised Growth Rate Performance
Last 2 years (Mar 28, 2014 to Mar 31, 2016) 12.54% 11.84% 11.19%
Last 3 years (Mar 28, 2013 to Mar 31, 2016) 8.66% 9.14% 6.98%
Last 5 years (Mar 31, 2011 to Mar 31, 2016) 14.6847 8.17% 9.17% 6.90%
Last 10 years (Mar 31, 2006 to Mar 31, 2016) 10.1890 7.87% 8.41% 6.66%
Since inception till Mar 31, 2016 10.0000 6.75% 7.32% 5.27%
Current Value of Standard Investment of Rs 10000
Last 2 years 12681 12523 12377
Last 3 years 12843 13012 12252
Last 5 years 14814 15514 13962
Last 10 years 21351 22428 19065
Since inception (7.5.2004) 21755 23180 18423
NAV Per unit (Rs.) B: I-SecComposite
Index
PF AB: Crisil 10 Year
Gilt Index
Franklin India Low Duration Fund (FILDF) - Monthly Dividend (MD)NAV as at Mar 31, 2016 : (Rs.) MD: 10.509Fund Manager: Santosh Kamath, Kunal Agrawal
NAV Per unit (Rs.) B: Crisil Short-termBond Fund Index #
MD AB:Crisil 1 year T-Bill Index
Discrete 12 months performance
Mar 31, 2015 to Mar 31, 2016 (Last 1 year) 10.5002 9.07% 8.47% 7.69%
Mar 28, 2014 to Mar 31, 2015 10.4556 10.13% 10.40% 8.82%
Mar 28, 2013 to Mar 28, 2014 10.3916 9.77% 8.78% 5.77%
Compounded Annualised Growth Rate Performance
Last 2 years (Mar 28, 2014 to Mar 31, 2016) 9.54% 9.38% 8.21%
Last 3 years (Mar 28, 2013 to Mar 31, 2016) 9.62% 9.18% 7.39%
Last 5 years (Mar 31, 2011 to Mar 31, 2016) 10.2974 9.79% 8.98% 7.43%
Last 10 years (Mar 31, 2006 to Mar 31, 2016) 10.2281 8.13% 8.24% 6.25%
Last 15 years (Mar 30, 2001 to Mar 31, 2016) 10.1800 7.67% N.A 6.17%
Since inception till Mar 31, 2016 10.0000 7.82% N.A 6.38%
Current Value of Standard Investment of Rs 10000
Last 2 years 12012 11975 11719
Last 3 years 13185 13027 12395
Last 5 years 15960 15382 14312
Last 10 years 21865 22089 18348
Last 15 years 30326 N.A 24583
Since inception (7.2.2000) 33745 N.A 27164
Franklin India Monthly Income Plan (FIMIP) - Growth optionNAV as at Mar 31, 2016 : (Rs.) 45.1647Fund Manager : Equity:Anand Radhakrishnan Debt:Sachin Padwal-Desai, Umesh Sharma
NAV Per unit (Rs.) B: Crisil MIPBlended Index
FIMIP AB: Crisil 10 YearGilt Index
Discrete 12 months performance
Mar 31, 2015 to Mar 31, 2016 (Last 1 year) 43.4074 4.05% 5.67% 7.97%
Mar 31, 2014 to Mar 31, 2015 35.4525 22.44% 16.45% 14.57%
Mar 28, 2013 to Mar 31, 2014 32.4459 9.27% 6.52% -0.96%
Compounded Annualised Growth Rate Performance
Last 2 years (Mar 31, 2014 to Mar 31, 2016) 12.85% 10.91% 11.21%
Last 3 years (Mar 28, 2013 to Mar 31, 2016) 11.61% 9.40% 6.98%
Last 5 years (Mar 31, 2011 to Mar 31, 2016) 27.9249 10.08% 8.50% 6.90%
Last 10 years (Mar 31, 2006 to Mar 31, 2016) 19.2878 8.87% 7.95% 6.66%
Last 15 years (Mar 30, 2001 to Mar 31, 2016) 10.6200 10.12% N.A N.A
Since inception till Mar 31, 2016 10.0000 10.21% N.A N.A
Current Value of Standard Investment of Rs 10000
Last 2 years 12739 12305 12371
Last 3 years 13920 13107 12252
Last 5 years 16174 15043 13962
Last 10 years 23416 21507 19065
Last 15 years 42528 N.A N.A
Since inception (28.9.2000) 45165 N.A N.A
Franklin India Low Duration Fund (FILDF) - GrowthNAV as at Mar 31, 2016 : (Rs.) 16.7539Fund Manager : Santosh Kamath, Kunal Agrawal
NAV Per unit (Rs.) B: Crisil Short-termBond Fund Index #
Growth AB:Crisil 1 year T-Bill Index
Discrete 12 months performance
Mar 31, 2015 to Mar 31, 2016 (Last 1 year) 15.3597 9.08% 8.47% 7.69%
Mar 28, 2014 to Mar 31, 2015 13.9392 10.19% 10.40% 8.82%
Mar 28, 2013 to Mar 28, 2014 12.6984 9.77% 8.78% 5.77%
Compounded Annualised Growth Rate Performance
Last 2 years (Mar 28, 2014 to Mar 31, 2016) 9.58% 9.38% 8.21%
Last 3 years (Mar 28, 2013 to Mar 31, 2016) 9.64% 9.18% 7.39%
Last 5 years (Mar 31, 2011 to Mar 31, 2016) 10.4906 9.80% 8.98% 7.43%
Since inception till Mar 31, 2016 10.0000 9.50% 8.68% 7.06%
Current Value of Standard Investment of Rs 10000
Last 2 years 12019 11975 11719
Last 3 years 13194 13027 12395
Last 5 years 15970 15382 14312
Since inception (26.7.2010) 16754 16053 14740
# Index adjusted for the period April 1, 2002 to November 29, 2010 with the performance of Crisil MIP Blended Index.
# Index adjusted for the period April 1, 2002 to November 29, 2010 with the performance of Crisil MIP Blended Index.
# Index adjusted for the period April 1, 2002 to November 29, 2010 with the performance of Crisil MIP Blended Index.

SCHEME PERFORMANCE
39Franklin Templeton Investmentswww.franklintempletonindia.com
Franklin India Savings Plus Fund (FISPF) - Growth Option
NAV as at Mar 31, 2016 : (Rs.) 27.5159
Fund Manager : Pallab Roy, Sachin Padwal-Desai
NAV Per unit (Rs.) B: Crisil LiquidFund Index
Retail AB:1 Crisil year T-Bill Index
Discrete 12 months performance
Mar 31, 2015 to Mar 31, 2016 (Last 1 year) 25.4538 8.10% 8.06% 7.69%
Mar 28, 2014 to Mar 31, 2015 23.3392 9.06% 9.06% 8.82%
Mar 28, 2013 to Mar 28, 2014 21.3514 9.31% 9.46% 5.77%
Compounded Annualised Growth Rate Performance
Last 2 years (Mar 28, 2014 to Mar 31, 2016) 8.53% 8.51% 8.21%
Last 3 years (Mar 28, 2013 to Mar 31, 2016) 8.79% 8.82% 7.39%
Last 5 years (Mar 31, 2011 to Mar 31, 2016) 17.9185 8.95% 8.63% 7.43%
Last 10 years (Mar 31, 2006 to Mar 31, 2016) 12.6098 8.11% 7.56% 6.25%
Since inception till Mar 31, 2016 10.0000 7.42% N.A 5.90%
Current Value of Standard Investment of Rs 10000
Last 2 years 11790 11785 11719
Last 3 years 12887 12900 12395
Last 5 years 15356 15132 14312
Last 10 years 21821 20743 18348
Since inception (11.2.2002) 27516 N.A 22500
Franklin India Ultra Short Bond Fund (FIUBF) - Growth Option
NAV as at Mar 31, 2016 : (Rs.) Regular: 19.5557 IP: 19.8826 SIP: 20.327
Fund Manager : Pallab Roy, Sachin Padwal-Desai
Discrete 12 months performance
Mar 31, 2015 to Mar 31,
2016 (Last 1 year)
Mar 28, 2014 to Mar 31,
2015
Mar 28, 2013 to Mar 28,
2014
Compounded AnnualisedGrowth Rate Performance
Last 2 years
(Mar 28, 2014 to Mar 31,
2016)
Last 3 years
(Mar 28, 2013 to Mar 31,
2016)
Last 5 years
(Mar 31, 2011 to Mar 31,
2016)
Current Value of Standard Investment of Rs 10000 invested
at the beginning of the period
Last 2
years
Last 3
years
Since Inception
Regular# - NAV Per Unit (Rs.)
Regular - Returns
IP# - NAV Per Unit (Rs.)
IP - Returns
SIP - NAV Per Unit (Rs.)
SIP - Returns
B: Crisil Liquid Fund Index
AB: Crisil 1 year T-Bill Index
# The plan is suspended for further subscription
17.9397
9.01%
18.2032
9.23%
18.5419
9.63%
8.06%
7.69%
16.4045
9.36%
16.6120
9.58%
16.8589
9.98%
9.06%
8.82%
14.9475
9.75%
15.1063
9.97%
15.2758
10.36%
9.46%
5.77%
9.13%
9.35%
9.75%
8.51%
8.21%
9.34%
9.55%
9.95%
8.82%
7.39%
12.5060
9.34%
12.5886
9.56%
12.6654
9.91%
8.63%
7.43%
11921
11969
12057
11785
11719
13083
13162
13307
12900
12395
19556
19883
20327
18499
16785
Since inception
till Mar 31, 2016
10.0000
8.43%
10.0000
8.64%
10.0000
8.93%
7.70%
6.45%
Last 5
years
15637
15794
16049
15132
14312
Franklin India Short Term Income Plan (FISTIP) - Growth - Retail
NAV as at Mar 31, 2016 : (Rs.) 3047.3199
Fund Manager : Santosh Kamath, Kunal Agrawal
NAV Per unit (Rs.) B: Crisil short-Term bondFund Index
Retail AB:1 year T-bill
Discrete 12 months performance
Mar 31, 2015 to Mar 31, 2016 (Last 1 year) 2,873.8473 6.04% 8.47% 7.69%
Mar 28, 2014 to Mar 31, 2015 2,568.8344 11.87% 10.40% 8.82%
Mar 28, 2013 to Mar 28, 2014 2,354.4352 9.11% 8.78% 5.77%
Compounded Annualised Growth Rate Performance
Last 2 years (Mar 28, 2014 to Mar 31, 2016) 8.87% 9.38% 8.21%
Last 3 years (Mar 28, 2013 to Mar 31, 2016) 8.95% 9.18% 7.39%
Last 5 years (Mar 31, 2011 to Mar 31, 2016) 1,953.5161 9.29% 8.98% 7.43%
Last 10 years (Mar 31, 2006 to Mar 31, 2016) 1,276.3364 9.08% 8.01% 6.25%
Since inception till Mar 31, 2016 1,000.0000 8.18% N.A 5.92%
Current Value of Standard Investment of Rs 10000
Last 2 years 11863 11975 11719
Last 3 years 12943 13027 12395
Last 5 years 15599 15382 14312
Last 10 years 23876 21620 18348
Since inception (31.1.2002) 30473 N.A 22601
Franklin India Treasury Management Account (FITMA) - Growth Option - Retail
NAV as at Mar 31, 2016 : (Rs.) 3619.47
Fund Manager : Pallab Roy, Sachin Padwal-Desai
NAV Per unit (Rs.) Retail# B:Crisil Liquid
Fund Index
AB:Crisil 1 Year
T-Bill Index
Discrete 12 months performance
Mar 23, 2016 to Mar 31, 2016 (1 Week) 3,609.9583 12.02% 13.65% 7.11%
Mar 16, 2016 to Mar 31, 2016 (2 Week) 3,604.9372 9.81% 10.95% 6.91%
Feb 29, 2016 to Mar 31, 2016 (1 Month) 3,592.9861 8.68% 9.85% 7.50%
Mar 31, 2015 to Mar 31, 2016 (Last 1 year) 3,362.1337 7.65% 8.06% 7.69%
Mar 28, 2014 to Mar 31, 2015 3,100.0308 8.45% 9.06% 8.82%
Mar 28, 2013 to Mar 28, 2014 2,844.5673 8.98% 9.46% 5.77%
Compounded Annualised Growth Rate Performance
Last 2 years (Mar 28, 2014 to Mar 31, 2016) 8.01% 8.51% 8.21%
Last 3 years (Mar 28, 2013 to Mar 31, 2016) 8.33% 8.82% 7.39%
Last 5 years (Mar 31, 2011 to Mar 31, 2016) 2,403.8849 8.52% 8.63% 7.43%
Last 10 years (Mar 31, 2006 to Mar 31, 2016) 1,743.0007 7.57% 7.56% 6.25%
Last 15 years (Mar 30, 2001 to Mar 31, 2016) 1,299.1000 7.06% N.A 6.17%
Since inception till Mar 31, 2016 1,000.0000 7.44% N.A 6.59%
Current Value of Standard Investment of Rs 10000
Last 2 years 11676 11785 11719
Last 3 years 12724 12900 12395
Last 5 years 15057 15132 14312
Last 10 years 20766 20743 18348
Last 15 years 27861 N.A 24583
Since inception (29.4.1998) 36195 N.A 31396
Franklin India Short Term Income Plan (FISTIP) - Growth - Institutional Plan (IP)
NAV as at Mar 31, 2016 : (Rs.) 2486.9382
Fund Manager : Santosh Kamath & Kunal Agrawal
Mar 28, 2013 to Mar 28, 2014 1,900.9428 9.48% 8.78% 5.77%
Compounded Annualised Growth Rate Performance
Last 2 years (Mar 28, 2014 to Mar 31, 2016) 9.26% 9.38% 8.21%
Last 3 years (Mar 28, 2013 to Mar 31, 2016) 9.33% 9.18% 7.39%
Last 5 years (Mar 31, 2011 to Mar 31, 2016) 1,570.0906 9.62% 8.98% 7.43%
Last 10 years (Mar 29, 2006 to Mar 31, 2016) 1,018.5633 9.32% 8.01% 6.25%
Since inception till Mar 31, 2016 1,000.0000 9.00% 7.72% 6.13%
Current Value of Standard Investment of Rs 10000
Last 2 years 11950 11975 11719
Last 3 years 13083 13027 12395
Last 5 years 15839 15382 14312
Last 10 years 24416 21627 18354
Since inception (6.9.2005) 24869 21942 18765
Franklin India Government Securities Fund (FIGSF) - Growth - Long Term Plan (LT)NAV as at Mar 31, 2016 : (Rs.) LT: 34.7266Fund Manager : Sachin Padwal - Desai & Umesh Sharma
NAV Per unit (Rs.) B: I-Sec Li-BEX
AB: Crisil 10 YearGilt Index
Discrete 12 months performance
Mar 31, 2015 to Mar 31, 2016 (Last 1 year) 32.8354 5.76% 7.26% 7.97%
Mar 28, 2014 to Mar 31, 2015 27.2580 20.46% 20.08% 14.63%
Mar 28, 2013 to Mar 28, 2014 27.0894 0.62% 1.60% -1.01%
Compounded Annualised Growth Rate Performance
Last 2 years (Mar 28, 2014 to Mar 31, 2016) 12.80% 13.41% 11.19%
Last 3 years (Mar 28, 2013 to Mar 31, 2016) 8.60% 9.34% 6.98%
Last 5 years (Mar 31, 2011 to Mar 31, 2016) 23.3403 8.26% 9.51% 6.90%
Last 10 years (Mar 31, 2006 to Mar 31, 2016) 15.6635 8.28% 8.76% 6.66%
Since inception till Mar 31, 2016 10.0000 9.08% N.A 6.92%
Current Value of Standard Investment of Rs 10000
Last 2 years 12740 12880 12377
Last 3 years 12819 13085 12252
Last 5 years 14878 15758 13962
Last 10 years 22170 23172 19065
Since inception (7.12.2001) 34727 N.A 26081
LT
NAV Per unit (Rs.) B: Crisil Short-Term Bond Fund
Index
IP# AB:1 year T-Bill Index
Discrete 12 months performance
Mar 31, 2015 to Mar 31, 2016 (Last 1 year) 2,336.5942 6.43% 8.47% 7.69%
Mar 28, 2014 to Mar 31, 2015 2,081.0802 12.28% 10.40% 8.82%
Franklin India Treasury Management Account (FITMA) - Growth Option - Institutional Plan (IP)NAV as at Mar 31, 2016 : (Rs.) IP: 2329.2676
Fund Manager : Pallab Roy & Sachin Padwal-Desai
NAV Per unit (Rs.) IP# B: Crisil Liquid
Fund Index
AB:Crisil 1 Year
T-Bill Index
Discrete 12 months performance
Mar 23, 2016 to Mar 31, 2016 (1 Week) 2,323.0196 12.27% 13.65% 7.11%
Mar 16, 2016 to Mar 31, 2016 (2 Week) 2,319.6776 10.06% 10.95% 6.91%
Feb 29, 2016 to Mar 31, 2016 (1 Month) 2,311.7347 8.93% 9.85% 7.50%
Mar 31, 2015 to Mar 31, 2016 (Last 1 year) 2,158.2758 7.92% 8.06% 7.69%
Mar 28, 2014 to Mar 31, 2015 1,985.0137 8.73% 9.06% 8.82%
Mar 28, 2013 to Mar 28, 2014 1,816.8879 9.25% 9.46% 5.77%
Compounded Annualised Growth Rate Performance
Last 2 years (Mar 28, 2014 to Mar 31, 2016) 8.28% 8.51% 8.21%

SCHEME PERFORMANCE
40Franklin Templeton Investmentswww.franklintempletonindia.com
Franklin India Cash Management Account (FICMA) - Growth OptionNAV as at Mar 31, 2016 : (Rs.) 23.1666Fund Manager : Pallab Roy, Umesh Sharma
AB:Crisil 1 year T-Bill Index
B: Crisil LiquidFund Index
FICMANAV Per unit (RS.)
Discrete performance
Mar 23, 2016 to Mar 31, 2016 (1 Week) 23.1153 10.13% 13.65% 7.11%
Mar 16, 2016 to Mar 31, 2016 (2 Week) 23.0877 8.32% 10.95% 6.91%
Feb 29, 2016 to Mar 31, 2016 (1 Month) 23.0179 7.61% 9.85% 7.50%
Mar 31, 2015 to Mar 31, 2016 (Last 1 year) 21.8303 6.12% 8.06% 7.69%
Mar 28, 2014 to Mar 31, 2015 20.4414 6.79% 9.06% 8.82%
Mar 28, 2013 to Mar 28, 2014 19.0581 7.26% 9.43% 5.75%
Compounded Annualised Growth Rate Performance
Last 2 years (Mar 28, 2014 to Mar 31, 2016) 6.42% 8.51% 8.21%
Last 3 years (Mar 28, 2013 to Mar 31, 2016) 6.70% 8.82% 7.39%
Last 5 years (Mar 31, 2011 to Mar 31, 2016) 16.6503 6.82% 8.63% 7.43%
Last 10 years (Mar 31, 2006 to Mar 31, 2016) 12.8281 6.08% 7.56% 6.25%
Since inception till Mar 31, 2016 10.0000 5.78% N.A 6.15%
Current Value of Standard Investment of Rs 10000
Last 2 years 11333 11785 11719
Last 3 years 12158 12900 12395
Last 5 years 13914 15132 14312
Last 10 years 18059 20743 18348
Since inception (23.4.2001) 23167 N.A 24411
NAV Per unit (Rs.) FICBOF B: Crisil Short-Term
Bond Fund Index
AB: Crisil 10 Year
Gilt Index
Franklin India Corporate Bond Opportunities Fund (FICBOF)- Growth OptionNAV as at Mar 31, 2016 : (Rs.) 15.084Fund Manager : Santosh Kamath & Sumit Gupta
Discrete 12 months performance
Mar 31, 2015 to Mar 31, 2016 (Last 1 year) 14.0972 7.00% 8.47% 7.97%
Mar 28, 2014 to Mar 31, 2015 12.5992 11.89% 10.40% 14.63%
Mar 28, 2013 to Mar 28, 2014 11.5773 8.83% 8.78% -1.01%
Compounded Annualised Growth Rate Performance
Last 2 years (Mar 28, 2014 to Mar 31, 2016) 9.36% 9.38% 11.19%
Last 3 years (Mar 28, 2013 to Mar 31, 2016) 9.19% 9.18% 6.98%
Since inception till Mar 31, 2016 10.0000 9.99% 9.12% 8.13%
Current Value of Standard Investment of Rs 10000
Last 2 years 11972 11975 12377
Last 3 years 13029 13027 12252
Since inception (7.12.2011) 15084 14576 14014
*20% Nifty 500 + 80% Crisil Short-Term Bond Fund Index
Franklin India Feeder - Franklin U.S. Opportunities Fund (FIF-FUSOF) - Growth OptionNAV as at Mar 31, 2016 : (Rs.) 19.3613Fund Manager : Roshi Jain
AdditionalBenchmark
B: Russell3000 Growth
FIF-FUSOFNAV Per unit (RS.)
Discrete 12 months performance
Mar 31, 2015 to Mar 31, 2016 (Last 1 year) 20.0490 -3.43% 7.42% N. A
Mar 28, 2014 to Mar 31, 2015 16.6347 20.53% 21.96% N. A
Mar 28, 2013 to Mar 28, 2014 12.3696 34.48% 35.00% N. A
Compounded Annualised Growth Rate Performance
Last 2 years (Mar 28, 2014 to Mar 31, 2016) 7.84% 14.38% N. A
Last 3 years (Mar 28, 2013 to Mar 31, 2016) 16.04% 20.85% N. A
Since inception till Mar 31, 2016 10.0000 17.25% 21.87% N. A
Current Value of Standard Investment of Rs 10000
Last 2 years 11639 13102 N. A
Last 3 years 15652 17687 N. A
Since inception (6.2.2012) 19361 22729 N. A
Franklin India Banking & PSU Debt Fund - Regular Plan - GrowthNAV as at Mar 31, 2016 : (Rs.) 11.8068Fund Manager: Sachin Padwal-Desai, Umesh Sharma
AB : CRISIL 10 Year
Gilt Index
B: Crisil Composite
Bond Fund Index
FIBPDFNAV Per unit (RS.)
Discrete 12 months performance
Mar 31, 2015 to Mar 31, 2016 (Last 1 year) 11.0232 7.11% 8.24% 7.97%
Compounded Annualised Growth Rate Performance
Since inception till Mar 31, 2016 10.0000 8.97% 11.37% 11.56%
Current Value of Standard Investment of Rs 10000
Since inception (25.4.2014) 11807 12317 12357
Franklin India Feeder - Franklin European Growth FundNAV as at Mar 31, 2016 : (Rs.) 8.5884Fund Manager: Srikesh Nair
AdditionalBenchmark
B: MSCI Europe Index
FIF-FEGFNAV Per unit (RS.)
Discrete 12 months performance
Mar 31, 2015 to Mar 31, 2016 (Last 1 year) 8.7147 -1.45% -5.52% N.A
Compounded Annualised Growth Rate Performance
Since inception till Mar 31, 2016 10.0000 -7.79% -4.48% N.A
Current Value of Standard Investment of Rs 10000
Since inception (16.5.2014) 8588 9175 N.A
Franklin India Treasury Management Account (FITMA) - Growth Option - Super Institutional Plan (SIP)NAV as at Mar 31, 2016 : (Rs.) 2262.1261
Fund Manager : Pallab Roy & Sachin Padwal-Desai
NAV Per unit (Rs.) SIP B: Crisil Liquid
Fund Index
AB: Crisil 1 Year
T-Bill Index
Discrete performance
Mar 23, 2016 to Mar 31, 2016 (1 Week) 2,255.8564 12.68% 13.65% 7.11%
Mar 16, 2016 to Mar 31, 2016 (2 Week) 2,252.4346 10.47% 10.95% 6.91%
Feb 29, 2016 to Mar 31, 2016 (1 Month) 2,244.3202 9.34% 9.85% 7.50%
Mar 31, 2015 to Mar 31, 2016 (Last 1 year) 2,087.4034 8.37% 8.06% 7.69%
Mar 28, 2014 to Mar 31, 2015 1,912.6231 9.14% 9.06% 8.82%
Mar 28, 2013 to Mar 28, 2014 1,745.3865 9.58% 9.46% 5.77%
Compounded Annualised Growth Rate Performance
Last 2 years (Mar 28, 2014 to Mar 31, 2016) 8.70% 8.51% 8.21%
Last 3 years (Mar 28, 2013 to Mar 31, 2016) 8.99% 8.82% 7.39%
Last 5 years (Mar 31, 2011 to Mar 31, 2016) 1,457.7409 9.18% 8.63% 7.43%
Last 10 years (Mar 31, 2006 to Mar 31, 2016) 1,032.3940 8.15% 7.56% 6.25%
Since inception till Mar 31, 2016 1,000.0000 8.02% 7.42% 6.14%
Current Value of Standard Investment of Rs 10000
Last 2 years 11827 11785 11719
Last 3 years 12961 12900 12395
Last 5 years 15518 15132 14312
Last 10 years 21911 20743 18348
Since inception (2.9.2005) 22621 21327 18786
# The plan is suspended for further subscription
NAV is as at beginning of the period.
Past performance may or may not be sustained in future. Returns greater than 1 year period are compounded annualized. Dividends assumed to be reinvested and Bonus is adjusted. Load is not taken into consideration. On account of difference in the type/category, asset allocation or investment strategy, inception dates, performances of these funds are not strictly comparable. Please refer to www.franklintempletonindia.com for details on performance of all schemes (including Direct Plans). B: Benchmark, AB: Additional Benchmark
W.e.f. November 30, 2015, Srikesh Nair has been appointed as Fund Manager, dedicated for making investments in Foreign Securities for Franklin Equity Funds (currently for Franklin Asian Equity Fund, Franklin India Bluechip Fund, Franklin India Prima Fund, Franklin India Prima Plus, Franklin India Flexi Cap Fund, Franklin India Opportunities Fund, Franklin India High Growth Companies Fund, Franklin Build India Fund, Franklin Infotech Fund, Franklin India Index Fund – NSE Nifty Plan, Franklin India Smaller Companies Fund and equity portion of Franklin India Monthly Income Plan).
Last 3 years (Mar 28, 2013 to Mar 31, 2016) 8.60% 8.82% 7.39%
Last 5 years (Mar 31, 2011 to Mar 31, 2016) 1,527.7787 8.79% 8.63% 7.43%
Last 10 years (Mar 31, 2006 to Mar 31, 2016) 1,093.9483 7.84% 7.56% 6.25%
Since inception till Mar 31, 2016 1,000.0000 7.44% 7.11% 5.96%
Current Value of Standard Investment of Rs 10000
Last 2 years 11734 11785 11719
Last 3 years 12820 12900 12395
Last 5 years 15246 15132 14312
Last 10 years 21292 20743 18348
Since inception (22.6.2004) 23293 22456 19781
Franklin India Multi-Asset Solution Fund - GrowthNAV as at Mar 31, 2016 : (Rs.) 10.3301Fund Manager: Anand Radhakrishnan
AdditionalBenchmark
B :CRISIL Balanced @
Fund – Aggressive IndexFIMASNAV Per unit (RS.)
Discrete 12 months performance
Mar 31, 2015 to Mar 31, 2016 (Last 1 year) 10.1921 1.35% -2.90% N.A
Compounded Annualised Growth Rate Performance
Since inception till Mar 31, 2016 10.0000 2.45% -1.64% N.A
Current Value of Standard Investment of Rs 10000
Since inception (28.11.2014) 10330 9781 N.A
@ Nifty Midcap 100 has been renamed as Nifty Free Float Midcap 100 w.e.f. April 01, 2016 and CRISIL Balanced Fund Index has been renamed as CRISIL Balanced Fund – Aggressive Index w.e.f. April 04, 2016.

41Franklin Templeton Investmentswww.franklintempletonindia.com
SIP RETURNS
1 Year 3 Year 5 Year 7 Year 10 Year Since Inception
Templeton India Growth Fund (TIGF) - Dividend OptionSIP - If you had invested 10000 every month in TIGF `
Total amount Invested (Rs) 120,000 360,000 600,000 840,000 1,200,000 2,350,000
Total value as on Mar 31, 2016 (Rs) 116,025 426,772 810,908 1,235,815 2,183,550 18,480,021
Returns -6.09% 11.38% 12.00% 10.85% 11.52% 18.24%
Total value of B:S&P BSE Sensex 114,624 383,196 724,800 1,093,213 1,787,924 8,983,992
B:S&P BSE Sensex Returns -8.21% 4.10% 7.49% 7.41% 7.74% 12.24%
Total value of B:MSCI India Value 118,840 381,468 672,493 963,253 1,581,303 N.A
B:MSCI India Value Returns -1.79% 3.80% 4.51% 3.86% 5.39% N.A
Total value of AB:Nifty 50 115,374 389,546 734,998 1,110,053 1,825,804 9,025,777
AB:Nifty 50 Returns -7.07% 5.19% 8.05% 7.84% 8.14% 12.28%
1 Year 3 Year 5 Year 7 Year 10 Year Since Inception
Franklin India Prima Fund (FIPF) - Growth OptionSIP - If you had invested 10000 every month in FIPF`
Total amount Invested (Rs) 120,000 360,000 600,000 840,000 1,200,000 2,680,000
Total value as on Mar 31, 2016 (Rs) 118,595 509,918 1,082,418 1,779,790 3,059,419 54,170,740
Returns -2.17% 23.99% 23.83% 21.08% 17.81% 22.40%
Total value of B:Nifty 500 115,322 406,207 768,407 1,152,644 1,884,267 12,857,503
B:Nifty 500 Returns -7.15% 8.01% 9.84% 8.89% 8.73% 12.31%
Total value of Nifty Midcap 100 117,439 459,935 866,488 1,315,004 2,222,148 N.A
Nifty Midcap 100 Returns -3.94% 16.59% 14.69% 12.59% 11.85% N.A
Total value of AB:Nifty 50 115,374 389,546 734,998 1,110,053 1,825,804 11,395,553
AB:Nifty 50 Returns -7.07% 5.19% 8.05% 7.84% 8.14% 11.44%
1 Year 3 Year 5 Year 7 Year 10 Year Since Inception
Franklin India Taxshield (FIT) - Growth OptionSIP - If you had invested 10000 every month in FIT `
Total amount Invested (Rs) 120,000 360,000 600,000 840,000 1,200,000 2,040,000
Total value as on Mar 31, 2016 (Rs) 118,313 467,353 931,296 1,510,145 2,680,662 15,501,535
Returns -2.60% 17.72% 17.63% 16.46% 15.35% 20.95%
Total value of B:Nifty 500 115,322 406,207 768,407 1,152,644 1,884,267 7,267,038
B:Nifty 500 Returns -7.15% 8.01% 9.84% 8.89% 8.73% 13.52%
Total value of AB:Nifty 50 115,374 389,546 734,998 1,110,053 1,825,804 6,605,171
AB:Nifty 50 Returns -7.07% 5.19% 8.05% 7.84% 8.14% 12.57%
Franklin India Opportunities Fund (FIOF) - Growth OptionSIP - If you had invested ` 10000 every month in FIOF
sinceInception
10 year7 year5 year3 year1 year
Total amount Invested (Rs) 120,000 360,000 600,000 840,000 1,200,000 1,930,000
Total value as on Mar 31, 2016 (Rs) 115,351 454,031 882,730 1,341,659 2,139,240 7,963,368
Returns -7.11% 15.68% 15.44% 13.15% 11.13% 15.90%
Total value of B:S&P BSE 200 # 115,368 401,867 759,078 1,141,856 1,878,899 5,039,222
B:S&P BSE 200 # Returns -7.08% 7.28% 9.35% 8.63% 8.68% 11.01%
Total value of AB:Nifty 50 115,374 389,546 734,998 1,110,053 1,825,804 5,927,037
AB:Nifty 50 Returns -7.07% 5.19% 8.05% 7.84% 8.14% 12.76%
1 Year 3 Year 5 Year 7 Year 10 Year Since Inception
Franklin India Flexi Cap Fund (FIFCF) - Growth OptionSIP - If you had invested 10000 every month in FIFCF `
Total amount Invested (Rs) 120,000 360,000 600,000 840,000 1,200,000 1,330,000
Total value as on Mar 31, 2016 (Rs) 117,022 461,022 915,873 1,447,190 2,525,816 3,172,103
Returns -4.57% 16.76% 16.95% 15.27% 14.25% 14.85%
Total value of B:Nifty 500 115,322 406,207 768,407 1,152,644 1,884,267 2,285,512
B:Nifty 500 Returns -7.15% 8.01% 9.84% 8.89% 8.73% 9.38%
Total value of AB:Nifty 50 115,374 389,546 734,998 1,110,053 1,825,804 2,246,365
AB:Nifty 50 Returns -7.07% 5.19% 8.05% 7.84% 8.14% 9.09%
SCHEME PERFORMANCE
Franklin Build India Fund (FBIF) - Growth OptionSIP - If you had invested ` 10000 every month in FBIF
Franklin India High Growth Companies Fund (FIHGCF) - Growth OptionSIP - If you had invested 10000 every month in FIHGCF `
1 Year 3 Year 5 Year 7 Year Since Inception
Total amount Invested (Rs) 120,000 360,000 600,000 840,000 1,050,000
Total value as on Mar 31, 2016 (Rs) 114,813 484,107 1,018,795 1,631,820 2,316,310
Returns -7.92% 20.23% 21.32% 18.64% 17.45%
Total value of B:Nifty 500 115,322 406,207 768,407 1,152,644 1,563,697
B:Nifty 500 Returns -7.15% 8.01% 9.84% 8.89% 8.87%
Total value of AB:Nifty 50 115,374 389,546 734,998 1,110,053 1,505,236
AB:Nifty 50 Returns -7.07% 5.19% 8.05% 7.84% 8.03%
Franklin India Smaller Companies Fund (FISCF) - Growth OptionSIP - If you had invested 10000 every month in FISCF `
1 Year 3 Year Since Inception
Total amount Invested (Rs) 120,000 360,000 630,000
Total value as on Mar 31, 2016 (Rs) 118,885 540,022 1,276,238
Returns -1.72% 28.22% 27.18%@Total value of B:Nifty Free Float Midcap 100 117,439 4,59,935 915,177
@Nifty Free Float Midcap 100 Returns -3.94% 16.59% 14.18%
Total value of AB:Nifty 50 115,374 389,546 776,981
AB:Nifty 50 Returns -7.07% 5.19% 7.92%
Franklin Asian Equity Fund (FAEF) - Growth OptionSIP - If you had invested 10000 every month in FAEF `
1 Year 3 Year 5 Year 7 Year Since Inception
Total amount Invested (Rs) 120,000 360,000 600,000 840,000 990,000
Total value as on Mar 31, 2016 (Rs) 120,814 376,851 702,396 1,086,356 1,380,872
Returns 1.26% 3.00% 6.24% 7.23% 7.89%
Total value of B:MSCI Asia (ex Japan) 117,068 357,639 665,541 1,041,250 1,327,276
B:MSCI Asia (ex Japan) Returns -4.50% -0.43% 4.10% 6.04% 6.96%
Total value of AB:Nifty 50 115,374 389,546 734,998 1,110,053 1,412,176
AB:Nifty 50 Returns -7.07% 5.19% 8.05% 7.84% 8.42%
Templeton India Equity Income Fund (TIEIF) - Growth OptionSIP - If you had invested 10000 every month in TIEIF `
1 Year 3 Year 5 Year 7 Year Since Inception
Total amount Invested (Rs) 120,000 360,000 600,000 840,000 1,190,000
Total value as on Mar 31, 2016 (Rs) 117,865 417,319 806,368 1,269,649 2,219,509
Returns -3.29% 9.84% 11.78% 11.60% 12.09%
Total value of B:S&P BSE 200 115,368 401,867 759,078 1,141,856 1,858,098
B:S&P BSE 200 Returns -7.08% 7.28% 9.35% 8.63% 8.70%
Total value of AB:Nifty 50 115,374 389,546 734,998 1,110,053 1,804,895
AB:Nifty 50 Returns -7.07% 5.19% 8.05% 7.84% 8.15%
1 Year 3 Year 5 Year Since Inception
Total amount Invested (Rs) 120,000 360,000 600,000 790,000
Total value as on Mar 31, 2016 (Rs) 116,326 513,742 1,084,659 1,533,560
Returns -5.63% 24.54% 23.92% 19.90%
Total value of B:Nifty 500 115,322 406,207 768,407 1,048,648
B:Nifty 500 Returns -7.15% 8.01% 9.84% 8.48%
Total value of AB:Nifty 50 115,374 389,546 734,998 1,012,058
AB:Nifty 50 Returns -7.07% 5.19% 8.05% 7.42%
Total amount Invested (Rs) 120,000 360,000 600,000 840,000 1,200,000 2,310,000
Total value as on Mar 31, 2016 (Rs) 118,683 429,638 817,814 1,281,466 2,256,007 25,678,360
Returns -2.03% 11.84% 12.35% 11.86% 12.13% 21.46%
Total value of B:S&P BSE Sensex 114,624 383,196 724,800 1,093,213 1,787,924 8,658,894
B:S&P BSE Sensex Returns -8.21% 4.10% 7.49% 7.41% 7.74% 12.30%
Total value of AB:Nifty 50 115,374 389,546 734,998 1,110,053 1,825,804 8,682,698
AB:Nifty 50 Returns -7.07% 5.19% 8.05% 7.84% 8.14% 12.32%
1 Year 3 Year 5 Year 7 Year 10 Year Since jan 97
Franklin India Bluechip Fund (FIBCF) - Growth OptionSIP - If you had invested 10000 every month in FIBCF `
1 Year 3 Year 5 Year 7 Year 10 Year Since Inception
Franklin India Prima Plus (FIPP) - Growth OptionSIP - If you had invested 10000 every month in FIPP `
Total amount Invested (Rs) 120,000 360,000 600,000 840,000 1,200,000 2,570,000
Total value as on Mar 31, 2016 (Rs) 118,943 471,463 939,680 1,500,864 2,650,659 44,285,000
Returns -1.63% 18.34% 18.00% 16.29% 15.14% 22.30%
Total value of B:Nifty 500 115,322 406,207 768,407 1,152,644 1,884,267 12,161,499
B:Nifty 500 Returns -7.15% 8.01% 9.84% 8.89% 8.73% 12.77%
Total value of AB:Nifty 50 115,374 389,546 734,998 1,110,053 1,825,804 10,695,132
AB:Nifty 50 Returns -7.07% 5.19% 8.05% 7.84% 8.14% 11.79%
@ Nifty Midcap 100 has been renamed as Nifty Free Float Midcap 100 w.e.f. April 01, 2016 and CRISIL Balanced Fund Index has been renamed as CRISIL Balanced Fund – Aggressive Index w.e.f. April 04, 2016.
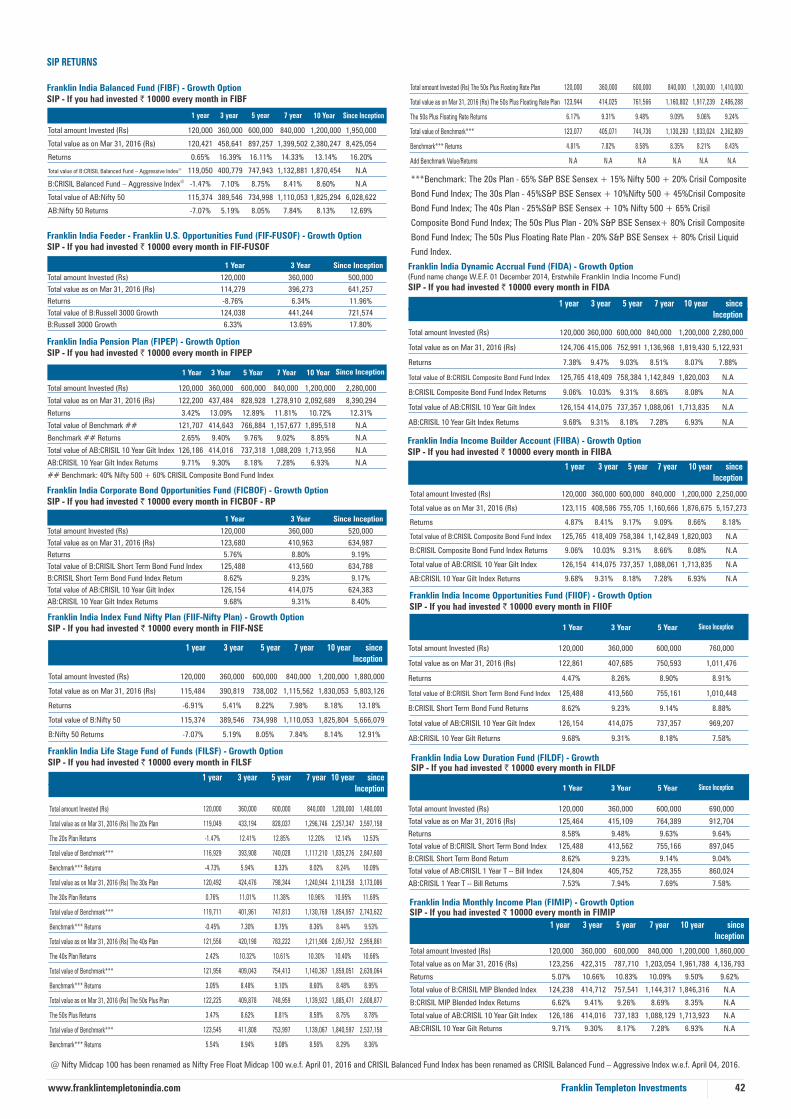
42
SIP RETURNS
Franklin Templeton Investmentswww.franklintempletonindia.com
1 Year 3 Year 5 Year 7 Year 10 Year Since Inception
Franklin India Pension Plan (FIPEP) - Growth OptionSIP - If you had invested 10000 every month in FIPEP `
Total amount Invested (Rs) 120,000 360,000 600,000 840,000 1,200,000 2,280,000
Total value as on Mar 31, 2016 (Rs) 122,200 437,484 828,928 1,278,910 2,092,689 8,390,294
Returns 3.42% 13.09% 12.89% 11.81% 10.72% 12.31%
Total value of Benchmark ## 121,707 414,643 766,884 1,157,677 1,895,518 N.A
Benchmark ## Returns 2.65% 9.40% 9.76% 9.02% 8.85% N.A
Total value of AB:CRISIL 10 Year Gilt Index 126,186 414,016 737,318 1,088,209 1,713,956 N.A
AB:CRISIL 10 Year Gilt Index Returns 9.71% 9.30% 8.18% 7.28% 6.93% N.A
## Benchmark: 40% Nifty 500 + 60% CRISIL Composite Bond Fund Index
Franklin India Balanced Fund (FIBF) - Growth OptionSIP - If you had invested ` 10000 every month in FIBF
1 year Since Inception3 year 5 year 7 year 10 Year
Total amount Invested (Rs) 120,000 360,000 600,000 840,000 1,200,000 1,950,000
Total value as on Mar 31, 2016 (Rs) 120,421 458,641 897,257 1,399,502 2,380,247 8,425,054
Returns 0.65% 16.39% 16.11% 14.33% 13.14% 16.20%
@Total value of B:CRISIL Balanced Fund – Aggressive Index 119,050 400,779 747,943 1,132,881 1,870,454 N.A@B:CRISIL Balanced Fund – Aggressive Index -1.47% 7.10% 8.75% 8.41% 8.60% N.A
Total value of AB:Nifty 50 115,374 389,546 734,998 1,110,053 1,825,294 6,028,622
AB:Nifty 50 Returns -7.07% 5.19% 8.05% 7.84% 8.13% 12.69%
Franklin India Index Fund Nifty Plan (FIIF-Nifty Plan) - Growth OptionSIP - If you had invested ` 10000 every month in FIIF-NSE
sinceInception
10 year7 year5 year3 year1 year
Total amount Invested (Rs) 120,000 360,000 600,000 840,000 1,200,000 1,880,000
Total value as on Mar 31, 2016 (Rs) 115,484 390,819 738,002 1,115,562 1,830,053 5,803,126
Returns -6.91% 5.41% 8.22% 7.98% 8.18% 13.18%
Total value of B:Nifty 50 115,374 389,546 734,998 1,110,053 1,825,804 5,666,079
B:Nifty 50 Returns -7.07% 5.19% 8.05% 7.84% 8.14% 12.91%
***Benchmark: The 20s Plan - 65% S&P BSE Sensex + 15% Nifty 500 + 20% Crisil Composite
Bond Fund Index; The 30s Plan - 45%S&P BSE Sensex + 10%Nifty 500 + 45%Crisil Composite
Bond Fund Index; The 40s Plan - 25%S&P BSE Sensex + 10% Nifty 500 + 65% Crisil
Composite Bond Fund Index; The 50s Plus Plan - 20% S&P BSE Sensex+ 80% Crisil Composite
Bond Fund Index; The 50s Plus Floating Rate Plan - 20% S&P BSE Sensex + 80% Crisil Liquid
Fund Index.
Franklin India Dynamic Accrual Fund (FIDA) - Growth Option(Fund name change W.E.F. 01 December 2014, Erstwhile Franklin India Income Fund)
SIP - If you had invested ` 10000 every month in FIDA
sinceInception
10 year7 year5 year3 year1 year
Total amount Invested (Rs) 120,000 360,000 600,000 840,000 1,200,000 2,280,000
Total value as on Mar 31, 2016 (Rs) 124,706 415,006 752,991 1,136,968 1,819,430 5,122,931
Returns 7.38% 9.47% 9.03% 8.51% 8.07% 7.88%
Total value of B:CRISIL Composite Bond Fund Index 125,765 418,409 758,384 1,142,849 1,820,003 N.A
B:CRISIL Composite Bond Fund Index Returns 9.06% 10.03% 9.31% 8.66% 8.08% N.A
Total value of AB:CRISIL 10 Year Gilt Index 126,154 414,075 737,357 1,088,061 1,713,835 N.A
AB:CRISIL 10 Year Gilt Index Returns 9.68% 9.31% 8.18% 7.28% 6.93% N.A
Franklin India Income Builder Account (FIIBA) - Growth OptionSIP - If you had invested ` 10000 every month in FIIBA
sinceInception
10 year7 year5 year3 year1 year
Total amount Invested (Rs) 120,000 360,000 600,000 840,000 1,200,000 2,250,000
Total value as on Mar 31, 2016 (Rs) 123,115 408,586 755,705 1,160,666 1,876,675 5,157,273
Returns 4.87% 8.41% 9.17% 9.09% 8.66% 8.18%
Total value of B:CRISIL Composite Bond Fund Index 125,765 418,409 758,384 1,142,849 1,820,003 N.A
B:CRISIL Composite Bond Fund Index Returns 9.06% 10.03% 9.31% 8.66% 8.08% N.A
Total value of AB:CRISIL 10 Year Gilt Index 126,154 414,075 737,357 1,088,061 1,713,835 N.A
AB:CRISIL 10 Year Gilt Index Returns 9.68% 9.31% 8.18% 7.28% 6.93% N.A
Franklin India Life Stage Fund of Funds (FILSF) - Growth OptionSIP - If you had invested ` 10000 every month in FILSF
1 year 3 year 5 year 7 year sinceInception
10 year
Total amount Invested (Rs)
Total value as on Mar 31, 2016 (Rs) The 20s Plan
The 20s Plan Returns
Total value of Benchmark***
Benchmark*** Returns
Total value as on Mar 31, 2016 (Rs) The 30s Plan
The 30s Plan Returns
Total value of Benchmark***
Benchmark*** Returns
Total value as on Mar 31, 2016 (Rs) The 40s Plan
The 40s Plan Returns
Total value of Benchmark***
Benchmark*** Returns
Total value as on Mar 31, 2016 (Rs) The 50s Plus Plan
The 50s Plus Returns
Total value of Benchmark***
Benchmark*** Returns
120,000
119,049
-1.47%
116,929
-4.73%
120,492
0.76%
119,711
-0.45%
121,556
2.42%
121,956
3.05%
122,225
3.47%
123,545
5.54%
360,000
433,194
12.41%
393,908
5.94%
424,476
11.01%
401,961
7.30%
420,198
10.32%
409,043
8.48%
409,878
8.62%
411,808
8.94%
600,000
828,037
12.85%
740,028
8.33%
798,344
11.38%
747,813
8.75%
783,222
10.61%
754,413
9.10%
748,959
8.81%
753,997
9.08%
840,000
1,296,746
12.20%
1,117,210
8.02%
1,240,944
10.96%
1,130,769
8.36%
1,211,906
10.30%
1,140,367
8.60%
1,139,922
8.58%
1,139,067
8.56%
1,200,000
2,257,347
12.14%
1,835,276
8.24%
2,118,258
10.95%
1,854,957
8.44%
2,057,752
10.40%
1,859,051
8.48%
1,885,471
8.75%
1,840,597
8.29%
1,480,000
3,597,158
13.53%
2,847,600
10.09%
3,173,086
11.69%
2,743,622
9.53%
2,959,861
10.66%
2,639,064
8.95%
2,608,877
8.78%
2,537,158
8.36%
Total amount Invested (Rs) The 50s Plus Floating Rate Plan
Total value as on Mar 31, 2016 (Rs) The 50s Plus Floating Rate Plan
The 50s Plus Floating Rate Returns
Total value of Benchmark***
Benchmark*** Returns
Add Benchmark Value/Returns
120,000
123,944
6.17%
123,077
4.81%
N.A
360,000
414,025
9.31%
405,071
7.82%
N.A
600,000
761,566
9.48%
744,736
8.58%
N.A
840,000
1,160,802
9.09%
1,130,293
8.35%
N.A
1,200,000
1,917,239
9.06%
1,833,024
8.21%
N.A
1,410,000
2,486,288
9.24%
2,362,809
8.43%
N.A
Franklin India Monthly Income Plan (FIMIP) - Growth OptionSIP - If you had invested ` 10000 every month in FIMIP
sinceInception
10 year7 year5 year3 year1 year
Total amount Invested (Rs) 120,000 360,000 600,000 840,000 1,200,000 1,860,000
Total value as on Mar 31, 2016 (Rs) 123,256 422,315 787,710 1,203,054 1,961,788 4,136,793
Returns 5.07% 10.66% 10.83% 10.09% 9.50% 9.62%
Total value of B:CRISIL MIP Blended Index 124,238 414,712 757,541 1,144,317 1,846,316 N.A
B:CRISIL MIP Blended Index Returns 6.62% 9.41% 9.26% 8.69% 8.35% N.A
Total value of AB:CRISIL 10 Year Gilt Index 126,186 414,016 737,183 1,088,129 1,713,923 N.A
AB:CRISIL 10 Year Gilt Returns 9.71% 9.30% 8.17% 7.28% 6.93% N.A
Franklin India Feeder - Franklin U.S. Opportunities Fund (FIF-FUSOF) - Growth OptionSIP - If you had invested 10000 every month in FIF-FUSOF`
1 Year 3 Year Since Inception
Total amount Invested (Rs) 120,000 360,000 500,000
Total value as on Mar 31, 2016 (Rs) 114,279 396,273 641,257
Returns -8.76% 6.34% 11.96%
Total value of B:Russell 3000 Growth 124,038 441,244 721,574
B:Russell 3000 Growth 6.33% 13.69% 17.80%
Franklin India Corporate Bond Opportunities Fund (FICBOF) - Growth OptionSIP - If you had invested ` 10000 every month in FICBOF - RP
1 Year 3 Year Since Inception
Total amount Invested (Rs) 120,000 360,000 520,000
Total value as on Mar 31, 2016 (Rs) 123,680 410,963 634,987
Returns 5.76% 8.80% 9.19%
Total value of B:CRISIL Short Term Bond Fund Index 125,488 413,560 634,788
B:CRISIL Short Term Bond Fund Index Return 8.62% 9.23% 9.17%
Total value of AB:CRISIL 10 Year Gilt Index 126,154 414,075 624,383
AB:CRISIL 10 Year Gilt Index Returns 9.68% 9.31% 8.40%Franklin India Income Opportunities Fund (FIIOF) - Growth OptionSIP - If you had invested 10000 every month in FIIOF `
1 Year 3 Year 5 Year Since Inception
Total amount Invested (Rs) 120,000 360,000 600,000 760,000
Total value as on Mar 31, 2016 (Rs) 122,861 407,685 750,593 1,011,476
Returns 4.47% 8.26% 8.90% 8.91%
Total value of B:CRISIL Short Term Bond Fund Index 125,488 413,560 755,161 1,010,448
B:CRISIL Short Term Bond Fund Returns 8.62% 9.23% 9.14% 8.88%
Total value of AB:CRISIL 10 Year Gilt Index 126,154 414,075 737,357 969,207
AB:CRISIL 10 Year Gilt Returns 9.68% 9.31% 8.18% 7.58%
Franklin India Low Duration Fund (FILDF) - GrowthSIP - If you had invested ` 10000 every month in FILDF
1 Year 3 Year 5 Year Since Inception
Total amount Invested (Rs) 120,000 360,000 600,000 690,000
Total value as on Mar 31, 2016 (Rs) 125,464 415,109 764,389 912,704
Returns 8.58% 9.48% 9.63% 9.64%
Total value of B:CRISIL Short Term Bond Index 125,488 413,562 755,166 897,045
B:CRISIL Short Term Bond Return 8.62% 9.23% 9.14% 9.04%
Total value of AB:CRISIL 1 Year T -- Bill Index 124,804 405,752 728,355 860,024
AB:CRISIL 1 Year T -- Bill Returns 7.53% 7.94% 7.69% 7.58%
@ Nifty Midcap 100 has been renamed as Nifty Free Float Midcap 100 w.e.f. April 01, 2016 and CRISIL Balanced Fund Index has been renamed as CRISIL Balanced Fund – Aggressive Index w.e.f. April 04, 2016.

43Franklin Templeton Investmentswww.franklintempletonindia.com
sinceInception
10 year7 year5 year3 year1 year
Total amount Invested (Rs) 120,000 360,000 600,000 840,000 1,200,000 1,700,000
Total value as on Mar 31, 2016 (Rs) 125,244 409,682 748,535 1,141,018 1,848,850 3,067,711
Returns 8.23% 8.59% 8.79% 8.61% 8.38% 7.91%
Total value of B:CRISIL Liquid Fund Index 125,122 409,631 746,135 1,130,756 1,807,878 N.A
B:CRISIL Liquid Fund Index Returns 8.04% 8.58% 8.66% 8.36% 7.95% N.A
Total value of AB:CRISIL 1 Year T - Bill Index 124,804 405,752 728,355 1,085,020 1,695,973 2,707,419
AB:CRISIL 1 Year T - Bill Index Returns 7.53% 7.94% 7.69% 7.20% 6.73% 6.29%
Franklin India Savings Plus Fund (FISPF) - Growth Option - RetailSIP - If you had invested ` 10000 every month in FISPF-RP
SIP returns are assuming investment made on first business day of every month. Past performance may or may not be sustained in future. Returns greater than 1 year period are compounded annualized. Dividends assumed to be reinvested and Bonus is adjusted. Load is not taken into consideration. On account of difference in the type/category, asset allocation or investment strategy, inception dates, performances of these funds are not strictly comparable. Please refer to www.franklintempletonindia.com for details on performance of all schemes (including Direct Plans). B: Benchmark, AB: Additional Benchmark
sinceInception
10 year7 year5 year3 year1 year
Total amount Invested (Rs) 120,000 360,000 600,000 840,000 1,200,000 1,700,000
Total value as on Mar 31, 2016 (Rs) 122,776 407,417 750,444 1,150,956 1,915,165 3,245,429
Returns 4.33% 8.21% 8.89% 8.85% 9.04% 8.63%
Total value of B:CRISIL Short-Term Bond Fund Index 125,488 413,560 755,161 1,144,244 1,848,809 N.A
B:CRISIL Short-Term Bond Fund Index Returns 8.62% 9.23% 9.14% 8.69% 8.38% N.A
Total value AB:of CRISIL 1 Year T-Bill Index 124,804 405,752 728,355 1,085,020 1,695,969 2,707,656
AB:of CRISIL 1 Year T-Bill Index Returns 7.53% 7.94% 7.69% 7.20% 6.73% 6.29%
Franklin India Short Term Income Plan (FISTIP) - Growth - RetailSIP - If you had invested ` 10000 every month in FISTIP - RP
1 year 3 year 5 year 7 year sinceInception
10 year
Franklin India Dynamic PE Ratio Fund of Funds (FIDPEF)SIP - If you had invested ` 10000 every month in FIDPEF
Total amount Invested (Rs) 120,000 360,000 600,000 840,000 1,200,000 1,490,000
Total value as on Mar 31, 2016 (Rs) 121,146 419,221 779,353 1,200,618 2,087,212 3,434,079
Returns 1.78% 10.16% 10.41% 10.04% 10.67% 12.66%
Total value of B:S&P BSE Sensex Index 114,565 382,910 724,180 1,091,318 1,784,457 2,934,556
B:S&P BSE Sensex Returns -8.32% 4.05% 7.46% 7.36% 7.70% 10.36%
@Total value of B:CRISIL Balanced Fund Index 119,000 400,614 747,514 1,131,597 1,868,510 2,814,970
B:CRISIL Balanced Fund Index Return -1.55% 7.08% 8.73% 8.38% 8.58% 9.75%
Add Benchmark Value/Returns N.A N.A N.A N.A N.A N.A
Franklin Infotech Fund (FIF)SIP - If you had invested ` 10000 every month in FIF
sinceInception
10 year7 year5 year3 year1 year
Total amount Invested (Rs) 120,000 360,000 600,000 840,000 1,200,000 2,120,000
Total value as on Mar 31, 2016 (Rs) 121,838 431,518 875,344 1,446,010 2,493,635 9,700,225
Returns 2.85% 12.14% 15.10% 15.25% 14.01% 15.35%
Total value of B:S&P BSE Information Technology Index # 124,242 440,831 909,009 1,502,199 2,563,242 N.A
B:S&P BSE Information Technology Index Returns # 6.63% 13.62% 16.64% 16.32% 14.52% N.A
Total value of AB:Nifty 50 115,374 389,546 734,998 1,110,053 1,825,732 7,308,014
AB:Nifty 50 Returns -7.07% 5.19% 8.05% 7.84% 8.14% 12.67%
Franklin India Ultra Short Bond Fund (FIUBF) - Growth Option - Retail*SIP - If you had invested ` 10000 every month in FIUBF-RP
Franklin India Government Securities Fund (FIGSF) - Growth - Composite Plan (CP)SIP - If you had invested ` 10000 every month in FIGSF-CP
Total amount Invested (Rs) 120,000 360,000 600,000 840,000 1,200,000 2,020,000
Total value as on Mar 31, 2016 (Rs) 124,934 418,227 751,347 1,115,853 1,813,154 4,317,017
Returns 7.74% 10.00% 8.94% 7.99% 8.00% 8.41%
Total value of B:I - Sec Composite Index 126,078 420,304 767,895 1,163,699 1,894,226 N.A
B:I - Sec Composite Index Returns 9.56% 10.33% 9.81% 9.16% 8.84% N.A
Total value of AB:CRISIL 10 Year Gilt Index 126,154 414,075 737,357 1,088,061 1,713,878 N.A
AB:CRISIL 10 Year Gilt Returns 9.68% 9.31% 8.18% 7.28% 6.93% N.A
sinceInception
10 year7 year5 year3 year1 year
Franklin India Government Securities Fund (FIGSF) - Growth - PF PlanSIP - If you had invested 10000 every month in FIGSF-PF`
Total amount Invested (Rs) 120,000 360,000 600,000 840,000 1,200,000 1,430,000
Total value as on Mar 31, 2016 (Rs) 124,934 418,227 751,345 1,115,849 1,813,204 2,319,673
Returns 7.74% 10.00% 8.94% 7.99% 8.01% 7.80%
Total value of B:I - Sec Composite Index 126,078 420,304 767,895 1,163,699 1,894,226 2,431,565
B:I - Sec Composite Index Returns 9.56% 10.33% 9.81% 9.16% 8.84% 8.54%
Total value of AB:CRISIL 10 Year Gilt Index 126,154 414,075 737,357 1,088,061 1,713,878 2,160,531
AB:CRISIL 10 Year Gilt Returns 9.68% 9.31% 8.18% 7.28% 6.93% 6.68%
sinceInception
10 year7 year5 year3 year1 year
Franklin India Government Securities Fund (FIGSF) - Growth - Long Term Plan (LT)SIP - If you had invested ` 10000 every month in FIGSF-LT
sinceInception
10 year7 year5 year3 year1 year
*B: Benchmark, AB: Additional Benchmark
Total amount Invested (Rs) 120,000 360,000 600,000 840,000 1,200,000 1,720,000
Total value as on Mar 31, 2016 (Rs) 125,095 419,061 753,178 1,119,260 1,834,000 3,187,010
Returns 8.00% 10.13% 9.04% 8.07% 8.22% 8.15%
Total value of B:I - Sec Li Bex 125,967 424,296 777,463 1,181,412 1,934,616 N.A
B:I - Sec Li Bex Returns 9.38% 10.98% 10.31% 9.59% 9.24% N.A
Total value of AB:CRISIL 10 Year Gilt Index 126,154 414,075 737,357 1,088,061 1,713,878 2,787,675
AB:CRISIL 10 Year Gilt Index Returns 9.68% 9.31% 8.18% 7.28% 6.93% 6.44%
FT India Feeder - Franklin European Growth Fund - Growth (FIF-FEGF)SIP - If you had invested ` 10000 every month in FIF-FEGF
sinceInception
1 year
Total amount Invested (Rs) 120,000 230,000
Total value as on Mar 31, 2016 (Rs) 116,151 218,489
Returns -5.92% -5.07%
Total value of B:MSCI Europe Index 114,289 217,314
B:MSCI Europe Index -8.74% -5.59%
sinceInception
7 year5 year3 year1 year
Total amount Invested (Rs) 120,000 360,000 600,000 840,000 1,000,000
Total value as on Mar 31, 2016 (Rs) 125,736 413,458 758,012 1,157,620 1,454,621
Returns 9.01% 9.21% 9.29% 9.02% 8.79%
Total value of B:CRISIL Liquid Fund Index 125,122 409,631 746,135 1,130,756 1,413,842
B:CRISIL Liquid Fund Index Returns 8.04% 8.58% 8.66% 8.36% 8.13%
Total value of AB:CRISIL 1 Year T - Bill Index 124,804 405,752 728,355 1,085,020 1,343,708
AB:CRISIL 1 Year T - Bill Index Returns 7.53% 7.94% 7.69% 7.20% 6.95%
Franklin India Multi-Asset Solution Fund - GrowthSIP - If you had invested ` 10000 every month in FIMAS
sinceInception
1 year
Total amount Invested (Rs) 120,000 170,000
Total value as on Mar 31, 2016 (Rs) 121,534 172,494
Returns 2.39% 1.98%
@Total value of B:CRISIL Balanced Fund – Aggressive Index 119,000 167,474
B:Crisil Balanced Fund Index -1.55% -2.00%
@ Nifty Midcap 100 has been renamed as Nifty Free Float Midcap 100 w.e.f. April 01, 2016 and CRISIL Balanced Fund Index has been renamed as CRISIL Balanced Fund – Aggressive Index w.e.f. April 04, 2016.

44
Past performance may or may not be sustained in future. ̂ Pursuant to payment of dividend, the NAV of the scheme will fall to the extent of payout and statutory levy (if applicable) • Past 12 months dividend history # Past 3 months dividend history $ Past 3 quarters dividend history ** Since inception. ***1:1 bonus.. Dividend distribution tax is taken into consideration wherever applicable while calculating the NAV performance. Dividend history given for Dividend plan/ option with frequency of Monthly & above dividend. For complete dividend history log on to www.franklintempletonindia.com
DIVIDEND^/BONUS HISTORYRecord Date
Rate perunit (`)
Record DateNAV* (`)
FIBCF**Feb 05, 2016Jan 16, 2015Jan 10, 2014Feb 08, 2013Jan 27, 2012Jan 21, 2011Jan 22, 2010Jan 21, 2009Jan 09, 2008Feb 07, 2007Jan 24, 2006Jan 19, 2005Feb 03, 2004Jul 30, 2003Mar 18, 2002Mar 09, 2001Nov 10, 2000Mar 14, 2000Jul 30, 1999Jan 01, 1997
TIGF**Dec 11, 2015Dec 12, 2014Dec 20, 2013Dec 21, 2012Dec 30, 2011Dec 16, 2010Dec 16, 2009Dec 10, 2008Dec 26, 2007Dec 20, 2006Dec 21, 2005Dec 8, 2004Feb 24, 2004Sep 16, 2003Apr 28, 2000
FIPP**Feb 26, 2016Feb 13, 2015Feb 21, 2014Feb 15, 2013Mar 02, 2012Feb 18, 2011Feb 19, 2010Feb 25, 2009Feb 13, 2008Mar 07, 2007Nov 15, 2006Nov 09, 2005Oct 27, 2004Mar 23, 2004Aug 19, 2003Mar 18, 2002Jan 19, 2001Oct 13, 2000Sep 10, 1999
FIPF**Jun 12, 2015Jun 13, 2014Jun 21, 2013Jun 22, 2012Jun 17, 2011Jun 18, 2010Jun 24, 2009Jun 18, 2008Jul 18, 2007Jul 19, 2006Jul 13, 2005Oct 5, 2004Jan 20, 2004Jun 27, 2003Mar 18, 2002Jan 17, 2001Sep 22, 2000Nov 3, 1999
FIFCF**Apr 01,2016Mar 27, 2015Mar 28, 2014Mar 8, 2013Mar 23, 2012Mar 18, 2011Mar 23, 2010Jul 29, 2009Mar 12, 2008May 9, 2007Mar 14, 2006
FIHGCFAug 28, 2015Aug 22, 2014Aug 23, 2013Jul 22, 2011Sep 24, 2010
TIEIF**Mar 11, 2016Sep 11, 2015Mar 13, 2015Sep 12, 2014Mar 14, 2014Sep 13, 2013Mar 15, 2013Sep 14, 2012Mar 16, 2012Sep 16, 2011Mar 11, 2011Sep 20, 2010Mar 12, 2010Aug 26, 2009May 21, 2008Nov 28, 2007Apr 18, 2007
FBIFJan 01, 2016Dec 26, 2014Dec 20, 2013Jan 04, 2013Sep 24, 2010
3.503.505.004.003.004.503.503.007.006.003.002.502.002.001.002.252.506.503.502.00
5.005.004.002.001.504.503.002.504.504.003.502.503.002.001.50
2.502.502.003.002.503.006.002.506.003.006.005.504.002.502.002.002.503.002.00
5.504.005.004.006.008.006.006.006.006.005.503.504.002.503.002.503.003.00
1.501.751.002.002.001.502.001.503.002.502.00
2.001.000.600.500.60
0.70 0.700.700.700.700.700.700.700.700.700.700.700.700.700.700.700.70
2.001.751.001.000.60
38.613944.208135.640638.870837.082543.035240.262423.468656.2212
46.3133.9424.0722.4315.4512.9314.0816.8550.3830.1712.03
61.445467.640649.050551.432139.954759.650451.572828.283360.5998
41.0735.9427.2927.1620.4814.45
32.527139.502425.312926.886626.313128.326331.170419.454338.9872
31.3238.8128.8523.0223.6318.1
15.3616.7917.4118.83
59.451948.171336.892234.698142.260848.137538.637648.845165.3063
48.1347.4934.9735.6420.7316.7815.2718.9326.34
16.755719.042613.672213.699214.101515.577416.739815.102118.161918.540417.4800
24.090220.810512.058212.333614.0782
13.740314.972216.378216.529112.970412.540213.431313.207813.148713.055215.013016.667514.690113.151015.099415.736212.3379
21.431022.217212.544613.124613.3353
Record DateRate per unit (`)
Individual /HUF and OthersRecord Date
NAV*(`)
FIT**Jan 22, 2016Jan 30, 2015Jan 24, 2014Jan 18, 2013Feb 03, 2012Jan 14, 2011Jan 15, 2010Dec 17, 2008Nov 14, 2007Jan 10, 2007Feb 15, 2006Mar 18, 2005Feb 24, 2004Mar 30, 2001May 24, 2000Mar 31, 2000
FIOF**Oct 30, 2015Oct 22, 2014Oct 18, 2013Oct 19, 2012Oct 21, 2011Oct 22, 2010Oct 28, 2009Sep 12, 2007Nov 29, 2006Sep 13, 2006Sep 14, 2005
FAEF**Nov 27, 2015Nov 18, 2013Nov 28, 2014
FIF**Oct 30,2015Oct 22, 2014Oct 18, 2013Oct 12, 2012Oct 21, 2011Oct 22, 2010Oct 28, 2009Aug 20, 2008Oct 24, 2007Nov 29, 2006Nov 23, 2005Mar 16, 2004Mar 24, 2000Jan 12, 2000Oct 8, 1999
FIBF**May 27, 2016May 29, 2015May 30, 2014May 24, 2013May 18, 2012May 20, 2011May 21, 2010May 27, 2009May 21, 2008May 23, 2007May 04, 2006Jun 15, 2005Nov 25, 2003
FIPEP**Jan 01, 2016Dec 26, 2014Jan 03, 2014Dec 21, 2012Dec 23, 2011Dec 16, 2010Dec 18, 2009Dec 16, 2009Dec 17, 2008Nov 14, 2007Dec 20, 2006Dec 21, 2005Dec 15, 2004Dec 23, 2003Mar 22, 2002Jul 13, 2001Mar 16, 2000Dec 14, 1998Dec 31, 1997
FIDPEFApr, 22, 2016Jan 29, 2016Oct 23, 2015Jul 31, 2015Apr 24, 2015Jan 23, 2015Oct 31, 2014Jul 25, 2014Apr 17, 2014Jan 17, 2014Oct 25, 2013Jul 19, 2013Apr 18, 2013Jan24, 2013Oct 12, 2012Jul 20, 2012Apr 20, 2012Jan 27, 2012Oct 21, 2011Jul 29, 2011Apr 21, 2011Nov 19, 2010Nov 11, 2009
FIDA$Mar 28, 2016Dec 18, 2015Sep 18, 2015Jun 19, 2015Mar 20, 2015Dec 19, 2014Sep 19, 2014Jun 20, 2014
FIIOFMar 28 2016Dec 18, 2015Sep 18, 2015Jun 19, 2015Mar 20, 2015Dec 19, 2014Sep 19, 2014Jun 20, 2014Mar 21, 2014Dec 27, 2013May 24, 2013Mar 15, 2013Dec 28,2012Sep 28, 2012Jun 29, 2012Mar 30, 2012Dec 30, 2011Sep 29, 2011Jun 24, 2011
FISCFFeb 19, 2016Feb 20, 2015
3.50 3.003.002.003.004.003.003.008.008.003.503.004.001.256.008.00
1.751.000.700.700.701.000.503.003.003.002.50
1.251.251.25
2.252.002.001.001.502.000.302.502.501.503.002.006.006.004.00
1.752.501.502.002.003.003.002.003.003.002.502.001.50
0.7223 0.66920.6533 0.60580.8000 0.76611.0000 0.85711.2500 1.07131.2999 1.21151.2000 1.11691.2000 1.11691.2000 1.11692.5000 2.32682.0000 1.86251.5000 1.39691.2000 1.1221
1.201.001.201.201.201.20
0.6139 0.56880.6139 0.56880.6139 0.56880.6139 0.56880.6139 0.56880.5444 0.50490.5444 0.50490.5845 0.55970.5845 0.5597
0.75000.50000.50000.50000.50000.50000.50000.50000.50000.50000.50000.50003.00003.0000
0.1625 0.15060.1625 0.15060.1625 0.15060.1625 0.15060.1633 0.15150.1633 0.15150.1714 0.16420.1753 0.1679
0.1625 0.15060.1625 0.15060.1625 0.15060.1625 0.15060.1633 0.15150.1633 0.15150.1753 0.16790.1753 0.16790.2338 0.22390.2727 0.26120.1970 0.16790.1629 0.13960.176 0.1510.198 0.169
0.1982 0.16980.1982 0.16980.2202 0.18880.2202 0.18880.2202 0.1888
2.002.00
40.6886 47.244131.189632.252730.311134.033433.052320.668146.8922
39.4338.0127.2524.0111.5719.8231.02
20.317319.019513.029013.312812.843416.520513.609917.8556
18.8218.8815.96
13.150515.137214.7828
26.563925.882823.913417.644418.274722.287816.547816.085221.4765
25.6120.2612.6737.5764.0039.59
22.366624.228819.379218.037017.084720.664621.951420.755624.925024.6370
24.2617.7713.99
18.074617.755414.470914.995914.257315.891814.458715.880913.749020.451918.8017
17.7416.2715.8111.7212.0912.4111.4611.31
37.212836.836339.077539.678039.125940.448638.976037.343434.622534.027933.502633.340133.599135.115832.795332.625532.914032.795332.459333.582734.348836.493635.5161
11.613311.701411.632711.595711.571111.452211.226511.2912
10.914411.163111.109411.133111.133511.069910.935510.928110.898311.009910.924010.750310.727610.732110.643010.592210.644610.656410.6385
22.761226.6372
0.7223 0.66920.3448 0.31970.1982 0.57070.6132 0.57070.8234 0.76630.2631 0.2450
0.3792 0.35130.3792 0.35130.3811 0.35340.3702 0.35450.3117 0.2985 0.2727 0.26120.3083 0.26420.3083 0.26420.3083 0.26420.3083 0.26430.3074 0.2865
0.0722 0.06690.0722 0.06690.0722 0.0669
0.1986 0.18400.1986 0.18400.1986 0.1840
0.0506 0.04680.0542 0.05020.0470 0.0435
0.1445 0.13380.1697 0.15730.1733 0.1606
0.0650 0.06020.0650 0.06020.0650 0.0602
0.1986 0.18400.1986 0.18400.1986 0.1840
0.1625 0.15060.1661 0.15390.1661 0.1539
0.1625 0.15060.1625 0.15060.1625 0.1506
0.0469 0.04350.0469 0.04350.0469 0.0435
0.1589 0.14720.1589 0.14720.1589 0.1472
5.7781 5.35335.4170 5.01875.5976 5.1860
17.6955 16.395517.6955 16.394517.6955 16.3945
5.7781 5.35335.4170 5.01875.5976 5.1860
0.1625 0.15060.1625 0.15060.1625 0.15060.1625 0.15060.1633 0.1515
0.1445 0.13380.1445 0.13380.1372 0.12711.3362 1.23800.1343 0.12450.1270 0.11780.1169 0.1119
2.1668 2.00752.359 2.1877
1.6251 1.50561.6332 1.5146
0.9028 0.83650.9073 0.8414
0.1986 0.18400.1986 0.18400.1986 0.1840
0.1806 0.16730.1806 0.16730.1806 0.1673
17.634117.111812.603710.820411.059310.6028
13.982114.165614.223913.777213.372
13.090213.119912.925612.484212.192411.9269
15.645215.653715.5337
13.460713.682513.6763
10.584610.587310.5180
10.509910.553510.5485
13.923214.026213.7923
13.458513.508413.6832
11.447711.339711.5269
11.555511.420611.6075
10.253510.264810.2314
11.252411.243311.2420
1195.49981194.91591185.0494
1237.97141264.17941260.1511
1269.80251268.34931256.9430
11.082311.251611.211111.218311.2104
10.621810.582610.599210.595310.630610.570510.3943
32.343932.8319
25.254525.3082
16.184115.9616
14.369614.432814.5482
13.324913.574813.6514
FIIBA(Annual Dividend)•Mar 28, 2016Mar 20, 2015Mar 30, 2012Mar 26, 2009Mar 28, 2008Mar 28, 2007(Half Yearly Dividend)•Mar 18, 2016Sep 18, 2015Mar 20, 2015Sep 19, 2014Mar 21, 2014Sep 27, 2013Mar 15, 2013Sep 28, 2012Mar 30, 2012Sep 29, 2011Mar 28, 2011
#(Monthly Dividend)May 20, 2016Apr 22, 2016Mar 18, 2016
$(Quarterly Plan)Mar 28, 2016Dec 18, 2015Sep 18, 2015
FILDF#(Monthly Dividend)
May 20, 2016Apr, 22, 2016Mar 18, 2016(Quarterly Dividend)$
Mar 28, 2016Dec 18, 2015Sep 18, 2015
FIMIP(Monthly Dividend)
#
May 20, 2016Apr 22, 2016Mar 18, 2016(Quarterly Dividend)
$
Mar 28, 2016Dec 18, 2015Sep 18, 2015
$FIGSF (Composite Plan)Mar 28, 2016Dec 18, 2015Sep 18, 2015
$FIGSF (LT-Quarterly)Mar 28, 2016Dec 18, 2015Sep 18, 2015
$FISPF (Monthly)May 20, 2016Apr, 22, 2016Mar 18, 2016
$FISPF (Quarterly)Mar 28, 2016Dec 18, 2015Sep 18, 2015
FISTIP#
(Monthly Dividend)May 20, 2016Apr 22, 2016Mar 18, 2016
$(Quarterly Dividend)Mar 28, 2016Dec 18, 2015Sep 18, 2015(Institutional Monthly Dividend)May 20, 2016Apr, 22, 2016Mar 18, 2016
FICBOFMar 28, 2016Dec 18, 2015Sep 18, 2015Jun 19, 2015Mar 20, 2015FIBPDFMar 28, 2016Dec 18, 2015Sep 18, 2015Jun 19, 2015Mar 20, 2015Dec 19, 2014Sep 19, 2014FILSF (20s Plan)Oct 23, 2015Oct 31, 2014FILSF (30s Plan)Oct 23, 2015Oct 31, 2014FILSF (40s Plan)Oct 23, 2015Oct 31, 2014FILSF (50s Plus Floating Rate Plan)Mar 28, 2016Dec 18, 2015Sep 18, 2015FILSF (50s Plus Plan)Mar 28, 2016Dec 18, 2015Sep 18, 2015
Dividend on face value per unit : FISTIP - `1000 ; others - `10
Fund Managers Industry Experience Name Industry experience FRANKLIN EQUITY Anand Radhakrishnan 20 Years R. Janakiraman 17 Years Roshi Jain 14 Years Murali Yerram 5 Years Anand Vasudevan 22 Years Varun Sharma 6 Years Srikesh Nair 4 Years Lakshmikanth Reddy 21 Years Hari Shyamsunder 10 Years TEMPLETON EQUITY Chetan Sehgal 23 Years Vikas Chiranewal 12 Years FIXED INCOME Santosh Kamath 20 Years Kunal Agrawal 12 Years Sumit Gupta 11 Years Sachin Padwal-Desai 18 Years Umesh Sharma 15 Years Pallab Roy 14 Years
Franklin Templeton Investmentswww.franklintempletonindia.com
Record DateRate per unit (`)
Individual /HUF and OthersRecord Date
NAV*(`)


*ICRA has assigned a credit rating of (ICRA)A1+mfs to Franklin India Treasury Management Account (FITMA). ICRA’s mutual fund rating methodology is based on
evaluating the inherent credit quality of the funds portfolio. As a measure of the credit quality of a debt fund’s assets. ICRA uses the concept of ‘credit scores’. These
scores are based on ICRA’s estimates of credit risk associated with each exposure of the portfolio taking into account its maturity. To quantify the credit risk scores, ICRA
uses its database of historical default rates for various rating categories for various maturity buckets. The credit risk Rating incorporate ICRA’s assessment of a debt
fund’s published investment objectives and policies, its management characteristics, and the creditworthiness of its investment portfolio. ICRA reviews relevant fund
information on an ongoing basis to support its published rating opinions. If the portfolio credit score meets the benchmark of the assigned rating during the review, the
rating is retained. In an event that the benchmark credit score is breached, ICRA gives a month’s time to the debt fund manager to bring the portfolio credit score within
the benchmark credit score. If the debt fund manager is able to reduce the portfolio credit score within the benchmark credit score, the rating is retained. If the portfolio
still continues to breach the benchmark credit score, the rating is revised to reflect the change in credit quality.
RISK FACTORS AND DISCLAIMERSMutual Fund investments are subject to market risks, read all scheme related documents carefully. The NAVs of the schemes may go up or down depending upon the
factors and forces affecting the securities market including the fluctuations in the interest rates. The past performance of the mutual funds managed by the FranklinTempleton Group and its affiliates is not necessarily indicative of future performance of the schemes. The Mutual Fund is not guaranteeing or assuring any dividend
under any of the schemes and the same is subject to the availability and adequacy of distributable surplus. The Mutual Fund is also not assuring that it will make any
dividend distributions under the dividend plans of the schemes though it has every intention of doing so and payment of dividend is at the sole discretion of trustees.
Investments in overseas financial assets are subject to risks associated with currency movements, restrictions on repatriation, transaction procedures in overseas
markets and country related risks. The expenses of the Fund of Funds scheme will be over and above the expenses charged by the underlying schemes. The existence,
accuracy and performance of the Nifty 50 and S&P BSE Sensex Index will directly affect the performance of FIIF and FIDPEF, and tracking errors are inherent in any index
scheme. In the event that the investible funds of more than 65% of the total proceeds of the scheme/plan are not invested in equity shares of domestic companies, then
the scheme/plan TIEIF & FIBF may not qualify as equity oriented fund (as per current tax laws). All subscriptions in FIT are subject to a lock-in period of 3 years from the
date of allotment and the unitholder cannot redeem, transfer, assign or pledge the units during this period. All subscriptions in FIPEP are locked in for a period of 3 full
financial years. The Trustee, AMC, their directors or their employees shall not be liable for any of the tax consequences that may arise, in the event that the schemes are
wound up before the completion of the lock-in period. Investors are requested to review the prospectus carefully and obtain expert professional advice with regard to
specific legal, tax and financial implications of the investment/participation in the scheme.
Join us onVisit us onTwitterFollow us on Linked@
Head Office:
Franklin Templeton
Asset Management (India) Pvt. Ltd.
12th and 13th Floor, Tower 2,
Indiabulls Finance Centre,
Senapati Bapat Marg, Elphinstone (W),
Mumbai – 400 013.www.franklintempletonindia.com
For any queries, our investor line is available to assist you at 1-800-425-4255 or 60004255 (if
calling from a mobile phone, please prefix the city STD code; local call rates apply for both
numbers) from 8 a.m to 9 p.m, Monday to Saturday. Alternatively, you can also e-mail us at
&