Embed Size (px)
Citation preview
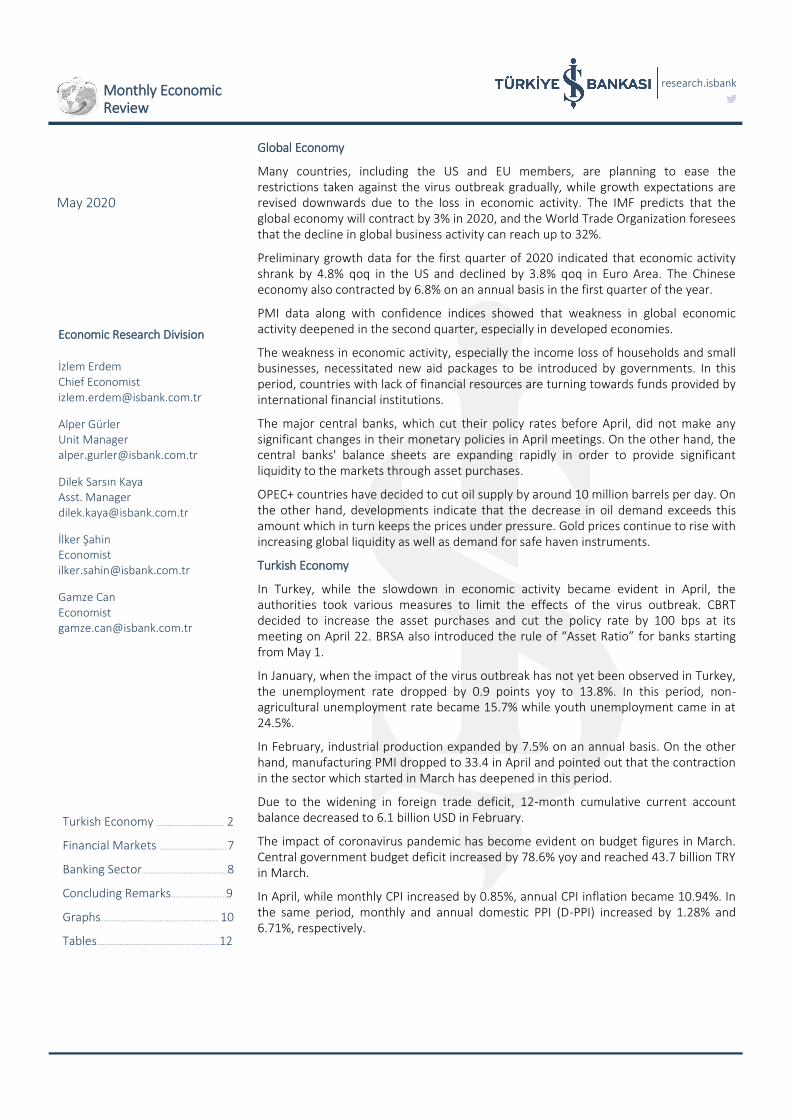
research.isbank
Global Economy
Many countries, including the US and EU members, are planning to ease the restrictions taken against the virus outbreak gradually, while growth expectations are revised downwards due to the loss in economic activity. The IMF predicts that the global economy will contract by 3% in 2020, and the World Trade Organization foresees that the decline in global business activity can reach up to 32%.
Preliminary growth data for the first quarter of 2020 indicated that economic activity shrank by 4.8% qoq in the US and declined by 3.8% qoq in Euro Area. The Chinese economy also contracted by 6.8% on an annual basis in the first quarter of the year.
PMI data along with confidence indices showed that weakness in global economic activity deepened in the second quarter, especially in developed economies.
The weakness in economic activity, especially the income loss of households and small businesses, necessitated new aid packages to be introduced by governments. In this period, countries with lack of financial resources are turning towards funds provided by international financial institutions.
The major central banks, which cut their policy rates before April, did not make any significant changes in their monetary policies in April meetings. On the other hand, the central banks' balance sheets are expanding rapidly in order to provide significant liquidity to the markets through asset purchases.
OPEC+ countries have decided to cut oil supply by around 10 million barrels per day. On the other hand, developments indicate that the decrease in oil demand exceeds this amount which in turn keeps the prices under pressure. Gold prices continue to rise with increasing global liquidity as well as demand for safe haven instruments.
Turkish Economy
In Turkey, while the slowdown in economic activity became evident in April, the authorities took various measures to limit the effects of the virus outbreak. CBRT decided to increase the asset purchases and cut the policy rate by 100 bps at its meeting on April 22. BRSA also introduced the rule of “Asset Ratio” for banks starting from May 1.
In January, when the impact of the virus outbreak has not yet been observed in Turkey, the unemployment rate dropped by 0.9 points yoy to 13.8%. In this period, non-agricultural unemployment rate became 15.7% while youth unemployment came in at 24.5%.
In February, industrial production expanded by 7.5% on an annual basis. On the other hand, manufacturing PMI dropped to 33.4 in April and pointed out that the contraction in the sector which started in March has deepened in this period.
Due to the widening in foreign trade deficit, 12-month cumulative current account balance decreased to 6.1 billion USD in February.
The impact of coronavirus pandemic has become evident on budget figures in March. Central government budget deficit increased by 78.6% yoy and reached 43.7 billion TRY in March.
In April, while monthly CPI increased by 0.85%, annual CPI inflation became 10.94%. In the same period, monthly and annual domestic PPI (D-PPI) increased by 1.28% and 6.71%, respectively.
May 2020
Monthly Economic Review
Economic Research Division İzlem Erdem Chief Economist [email protected]
Alper Gürler Unit Manager [email protected]
Dilek Sarsın Kaya Asst. Manager [email protected]
İlker Şahin Economist [email protected]
Gamze Can Economist [email protected]
Turkish Economy ...……………………..…..………. 2
Financial Markets …………...…...…..…...………...7
Banking Sector.….…..………...…………………………….8
Concluding Remarks.………………..…………...9
Graphs……………………………………………..…………...………. 10
Tables…………………………………………………….…….….………12
research.isbank
May 2020 2
Unemployment rate came in at 13.8% in the first month of the year.
In January, unemployment rate dropped by 0.9 points yoy and became 13.8%. In this period, non-agricultural unemployment rate came in at 15.7%, while youth unemployment rate was 24.5%. The decline in the labor force participation rate continued in January. The labor force participation rate declined to 51%, the lowest level since February 2016. In January, services sector employment, which constitutes approximately 60% of total employment, increased by 161K people yoy. The annual increase in the employment of industrial sector, which constitutes 20% of total employment, was 257K people.
Industrial production expanded by 7.5% yoy in February.
The recovery in industrial production continued in February, when the impact of the coronavirus pandemic has not yet been observed in Turkey. According to calendar-adjusted data, industrial production increased by 7.5% yoy in this period. Thus, the annual increase in the index became 7.6% in January-February period. In February, the production of capital and intermediate goods increased by 12% yoy and 9.1% yoy, respectively, while the production of durable goods decreased by 3.9% yoy.
Retail sales recorded a rapid increase in February.
According to calendar adjusted data, retail sales had a rapid rise of 10.6% yoy in February. Thus, the annual
increase registered in the first two months of the year became 10%.
Manufacturing PMI dropped to 33.4 in April.
The manufacturing PMI, which fell to 48.1 in March, dropped to 33.4 in April and indicated that the contraction in the sector deepened. This level also corresponds to the lowest level since the global financial crisis. The output and new orders sub-indices declined rapidly in April, while employment sub-index decreased for the first time after three months. The input cost, which increased rapidly in March, rose also in April as the depreciation in Turkish lira continued.
April manufacturing industry CUR is the lowest of 11 years…
In April, manufacturing industry capacity utilization ratio (CUR) came in at 61.6%, the lowest level since 2009. CUR for the manufacturing of durable and non-durable consumer goods became 51.2% and 59.8%, respectively in April 2020. The lowest levels of these figures during 2009 crisis were 63.8% and 65.3%, respectively.
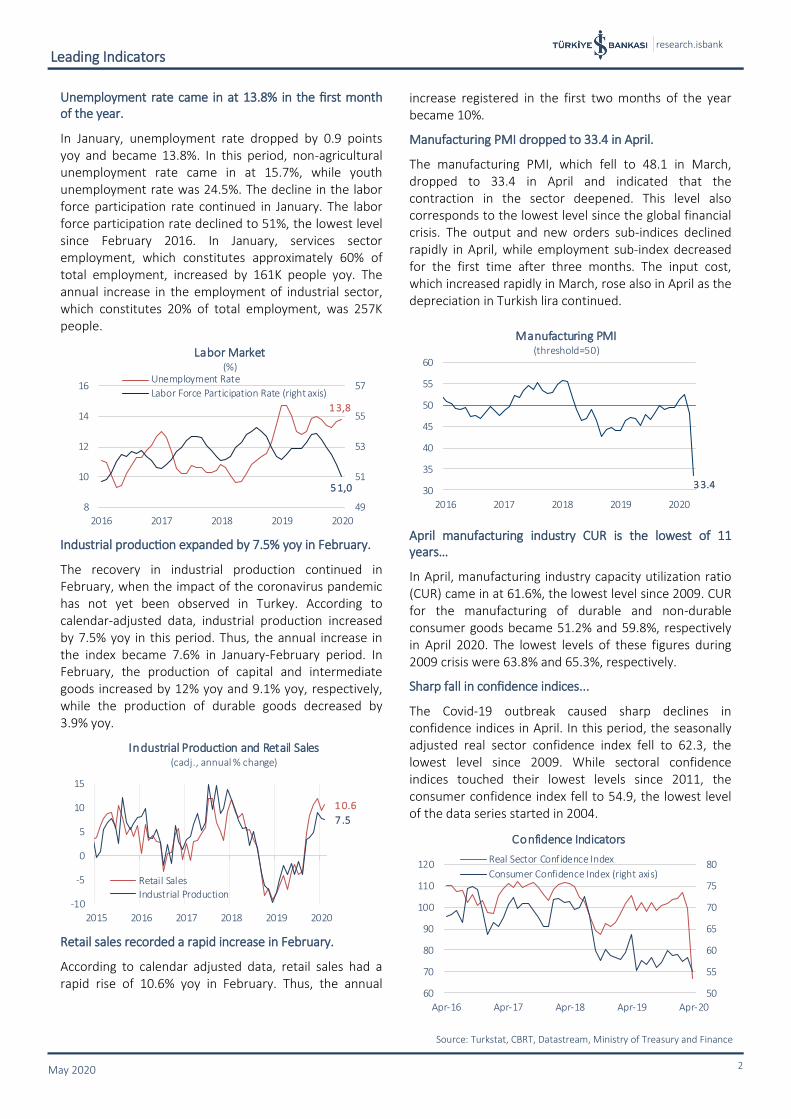
Sharp fall in confidence indices...
The Covid-19 outbreak caused sharp declines in confidence indices in April. In this period, the seasonally adjusted real sector confidence index fell to 62.3, the lowest level since 2009. While sectoral confidence indices touched their lowest levels since 2011, the consumer confidence index fell to 54.9, the lowest level of the data series started in 2004.
Leading Indicators
Source: Turkstat, CBRT, Datastream, Ministry of Treasury and Finance
50
55
60
65
70
75
80
60
70
80
90
100
110
120
Apr-16 Apr-17 Apr-18 Apr-19 Apr-20
Confidence Indicators
Real Sector Confidence Index
Consumer Confidence Index (right axis)
1 0.6
7 .5
-10
-5
0
5
10
15
2015 2016 2017 2018 2019 2020
Industrial Production and Retail Sales(cadj., annual % change)
Retail SalesIndustrial Production
3 3.430
35
40
45
50
55
60
2016 2017 2018 2019 2020
Manufacturing PMI (threshold=50)
1 3,8
5 1,0
49
51
53
55
57
8
10
12
14
16
2016 2017 2018 2019 2020
Labor Market(%)
Unemployment Rate
Labor Force Participation Rate (right axis)

research.isbank
May 2020 3
Foreign trade deficit recorded a rapid increase in March.
According to TURKSTAT data, exports declined by 17.8% yoy to 13.4 billion USD in March, while imports rose by 3.1% yoy to 18.8 billion USD. Thus, foreign trade deficit widened by 181.6% yoy and reached 5.4 billion USD. In the period of January-March 2020, the deficit rose by 117.3% yoy. The import coverage ratio, which was 88.2% in January-March 2019, declined to 76.8% in the same period of this year.
In February current account gave 1.2 billion USD deficit.
In February, when the effects of the Covid-19 outbreak on Turkish economy have not been felt yet, the current account gave 1.2 billion USD deficit, in line with market expectations. In this period, relatively favorable course of economic activity reflected in the current account balance through foreign trade figures. Also the rise in non-monetary gold imports played a role in the course of the current account balance in February.
The 12-month cumulative current account balance, which has been posting surplus since May 2019, continued to decline in February and became 6.1 billion USD. Current account surplus excluding net gold trade decreased to 17.2 billion USD in this period.
FDI remained weak.
Capital inflows through foreign direct investment remained weak in February. Net foreign direct
investment, which was 438 million USD in January, was realized as 309 million USD in February. Outflow posted in the equity capital investment in February exceeded 1 billion USD for the first time since June 2017 and led net direct investments to decline. On the other hand, real estate investments continued to support foreign direct investment.
In February, portfolio investment posted 382 million USD capital inflow. Government’s bond issuance abroad, which was 4 billion USD, came to the fore in this development. In February, non-residents made net sales of 687 million USD in equity market and 1.8 billion USD in government domestic debt securities due to decline in risk appetite led by virus outbreak. In this period, banks made 497 million USD net repayment for the debt securities held abroad.
Other investments posted 2.4 billion USD inflows.
In February, other investments posted 2.4 billion USD capital inflow. The decline in domestic banks' currency and deposits held abroad, which exceeds 3.2 billion USD, was the main driver of this development. In this period, nonresident banks’ deposits held within domestic banks also increased approximately by 1 billion USD. While the short and long-term debt of banking sector decreased in February, short-term debt of other sectors' posted a limited increase of 21 million USD despite the decrease
Foreign Trade and Balance of Payments
Source: CBRT, Datastream
3 9.6
1 7.2
6 .1
-60
-40
-20
0
20
40
60
2017 2018 2019 2020
Current Account Balance(12-month cumulative, USD billion)
Current Account BalanceCAB (Excluding Net Energy Trade)CAB (Excluding Net Gold Trade)
2 .5
-2
0
2
4
6
8
10
2014 2015 2016 2017 2018 2019 2020
Net Portfolio Investment
Average 2014-2019
(January-February period, USD billion)
Net Capital Flows
Dec . 2019 Feb. 2020 Dec . 2019 Feb. 2020
Current Account Balance 8,674 6,128 31.3 38.7
Total Net Foreign Capital Flows 10,900 -5,923 - -
-Direct Investment 5,593 5,447 20.2 34.4
-Portfolio Investment -1,246 -10,007 - -
-Other Investment 195 4,245 0.7 26.8
-Other 34 -3 0.1 -Net Errors and Omissions 6,324 -5,605 22.8 -
Reserves(1) 6 ,926 -205 25.0 -Note: The numbers may not addup total due to rounding.
12-month Cumulative
(million USD) Share in Financing (%)
(1) (-) sign indicates an increase in reserves, while (+) sign indicates decrease.
research.isbank
May 2020 4
in their long-term debts. However, other sectors, similar to banks, made net loan repayment in this period. In February, 12-month cumulative long-term debt rollover ratios became 73% in banking sector and 90% in other sectors.
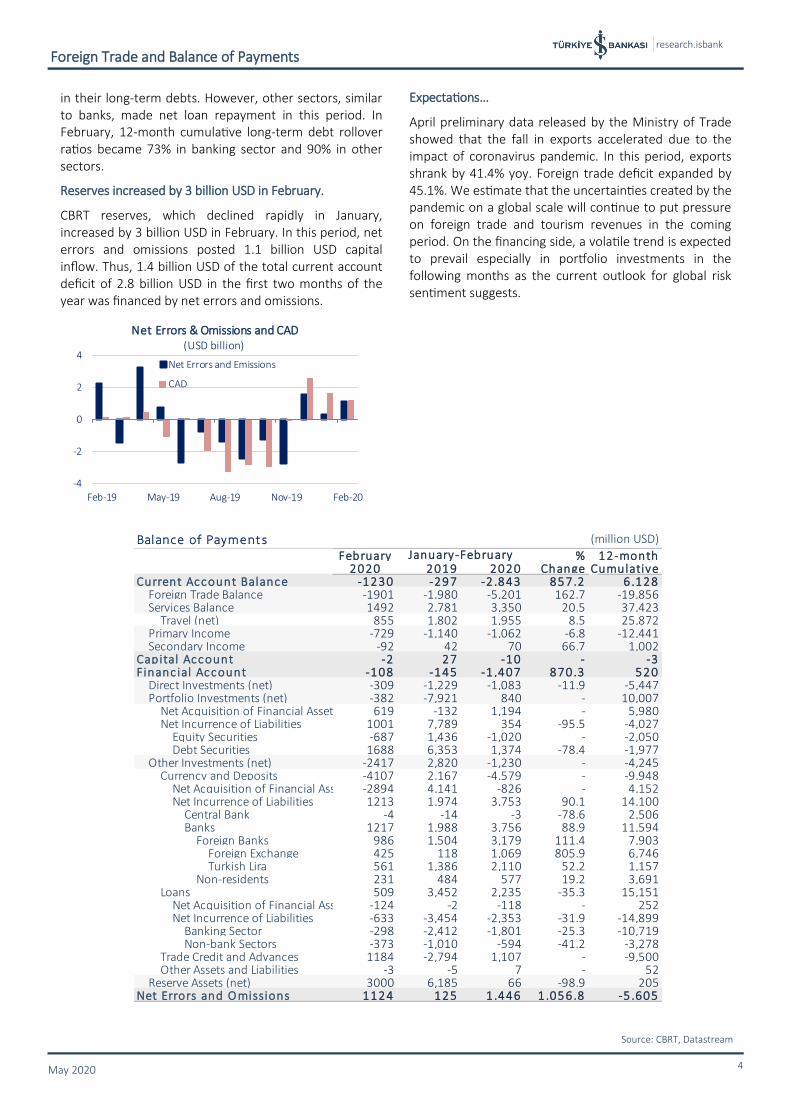
Reserves increased by 3 billion USD in February.
CBRT reserves, which declined rapidly in January, increased by 3 billion USD in February. In this period, net errors and omissions posted 1.1 billion USD capital inflow. Thus, 1.4 billion USD of the total current account deficit of 2.8 billion USD in the first two months of the year was financed by net errors and omissions.
Expectations…
April preliminary data released by the Ministry of Trade showed that the fall in exports accelerated due to the impact of coronavirus pandemic. In this period, exports shrank by 41.4% yoy. Foreign trade deficit expanded by 45.1%. We estimate that the uncertainties created by the pandemic on a global scale will continue to put pressure on foreign trade and tourism revenues in the coming period. On the financing side, a volatile trend is expected to prevail especially in portfolio investments in the following months as the current outlook for global risk sentiment suggests.
Foreign Trade and Balance of Payments
Source: CBRT, Datastream
-4
-2
0
2
4
Feb-19 May-19 Aug-19 Nov-19 Feb-20
Net Errors & Omissions and CAD(USD billion)
Net Errors and Emissions
CAD
Balance of Payments (million USD)
February % 12-month2020 2019 2020 Change Cumulative
Current Account Balance -1230 -297 -2 ,843 857.2 6,128 Foreign Trade Balance -1901 -1,980 -5,201 162.7 -19,856 Services Balance 1492 2,781 3,350 20.5 37,423 Travel (net) 855 1,802 1,955 8.5 25,872 Primary Income -729 -1,140 -1,062 -6.8 -12,441 Secondary Income -92 42 70 66.7 1,002Capital Account -2 27 -10 - -3Financ ial Account -108 -145 -1 ,407 870.3 520 Direct Investments (net) -309 -1,229 -1,083 -11.9 -5,447 Portfolio Investments (net) -382 -7,921 840 - 10,007 Net Acquisition of Financial Assets 619 -132 1,194 - 5,980 Net Incurrence of Liabilities 1001 7,789 354 -95.5 -4,027 Equity Securities -687 1,436 -1,020 - -2,050 Debt Securities 1688 6,353 1,374 -78.4 -1,977 Other Investments (net) -2417 2,820 -1,230 - -4,245 Currency and Deposits -4107 2,167 -4,579 - -9,948 Net Acquisition of Financial Assets -2894 4,141 -826 - 4,152 Net Incurrence of Liabilities 1213 1,974 3,753 90.1 14,100 Central Bank -4 -14 -3 -78.6 2,506 Banks 1217 1,988 3,756 88.9 11,594 Foreign Banks 986 1,504 3,179 111.4 7,903 Foreign Exchange 425 118 1,069 805.9 6,746 Turkish Lira 561 1,386 2,110 52.2 1,157 Non-residents 231 484 577 19.2 3,691 Loans 509 3,452 2,235 -35.3 15,151 Net Acquisition of Financial Assets -124 -2 -118 - 252 Net Incurrence of Liabilities -633 -3,454 -2,353 -31.9 -14,899 Banking Sector -298 -2,412 -1,801 -25.3 -10,719 Non-bank Sectors -373 -1,010 -594 -41.2 -3,278 Trade Credit and Advances 1184 -2,794 1,107 - -9,500 Other Assets and Liabilities -3 -5 7 - 52 Reserve Assets (net) 3000 6,185 66 -98.9 205Net Errors and O missions 1124 125 1,446 1,056.8 -5 ,605
January-February

research.isbank
May 2020 5
Budget deficit widened rapidly in March.
In line with the spread of coronavirus in Turkey, central government budget started to deteriorate in March. In this period, central government budget deficit increased by 78.6% yoy (19.2 billion TRY) and reached 43.7 billion TRY. In March, budget revenues contracted by 12.7% yoy due to the rapid decline in tax revenues. Budget expenditures, on the other hand, expanded by 15.6% in this period.
Thanks to the relatively positive performance in January-February period, the budget deficit decreased by 18.2% yoy (6.6 billion TRY) and became 29.6 billion TRY in the first quarter of 2020. On the other hand, primary balance, which posted 2.8 billion TRY deficit in the first quarter of 2019, gave 8.7 billion TRY surplus in the same period of this year.
Sharp decline in tax revenues…
In addition to the weakening trend in supply and demand conditions, deferral of tax payments to limit the impact of the epidemic on economic activity led tax revenues to decline by 10.1% in March compared to the same period of last year. During this period, domestic VAT has reduced tax revenues by 4.9 billion TRY due to deferral and the refund mechanism. Decreases in income tax and portfolio revenues of Treasury also affected budget revenues negatively in March. On the other hand, the annual increase in SCT revenues by 43.4% limited the decrease in budget revenues in this period.
Despite the negative performance in March, tax revenues expanded by 14.2% in the first quarter of the
year. In this period, SCT, provisional corporation tax and VAT on imports also contributed significantly to the increase in budget revenues. In addition, portfolio revenues of Treasury and interest revenues stood out as the main figures that supported budget revenues in the first quarter.
Budget expenditures continued to increase rapidly in the first quarter.
Increases in current and personnel expenditures in March led budget expenditures to rise rapidly. In this period, 2.6 billion TRY amount of increase in other Treasury aids, being monitored under current transfers, contributed 3.3 pts to the increase in budget expenditures. On the other hand, decrease in immovable capital expenditures by 35.9% yoy (1.6 billion TRY) limited the increase in budget expenditures by 2 pts.
In the first quarter of the year, expansion in current transfers and personnel expenses came to the fore in the rise in budget expenditures.
Expectations…
While negative effects of coronavirus outbreak on economic activity lead tax revenues to weaken in Turkey, it also necessitates public expenditures to support economic activity. Under these circumstances, we expect the budget indicators to remain under pressure for the rest of the year.
Budget Balance
Source: Datastream , Ministry of Treasury and Finance
Central Government Budget (billion TRY)
% % 2020 Budget Real./2019 2020 Change 2019 2020 Change Target Target (%)
Expenditures 78.8 91.2 15.6 254.4 285.3 12.1 1,095.5 26.0Interest Expenditures 11.4 11.3 -0.4 33.4 38.2 14.6 138.9 27.5Non-Interest Expenditures 67.5 79.8 18.3 221.1 247.1 11.8 956.5 25.8Revenues 54.4 47.4 -12.7 218.3 255.7 17.2 956.6 26.7Tax Revenues 41.1 37.0 -10.1 154.3 176.1 14.2 784.6 22.4Other Revenues 13.3 10.5 -21.0 64.0 79.6 24.4 172.0 46.3Budget Balance -24.5 -43.7 78.6 -36.2 -29.6 -18.2 -138.9 21.3Primary Balance -13.1 -32.4 147.2 -2 .8 8.7 - 0 .1 8,667.4Numbers may not add up to total value due to rounding.
March January-March
11.5
1.4 1.6
9.3 10.49.6
0.9
-4.9
13.49.6
Income Tax CorporationTax
DomesticVAT
SpecialConsumption
Tax
VAT onImports
Tax Revenues(TRY billion)
March 2019
March 2020
19.8
5.611.4
31.9
3.6
23.7
3.8
11.3
39.5
4.0
PersonnelExpenditures
CapitalExpenditures
InterestExpenditures
CurrentTransfers
Social SecurityContributions
Budget Expenditures(TRY billion)
March 2019March 2020
research.isbank
May 2020 6
Monthly CPI inflation came in at 0.85% in April.
CPI increased by 0.85% mom in April, a bit above the expectations. Market expectation was around 0.6%. Domestic PPI (D-PPI) posted an increase of 1.28% in this period.
Annual CPI inflation declined to 10.94%.
In April, annual consumer inflation fell to the lowest level since November 2019 with 10.94%. In this period, thanks to the high base effect, annual D-PPI inflation also declined to its lowest level in five months and became 6.71%.
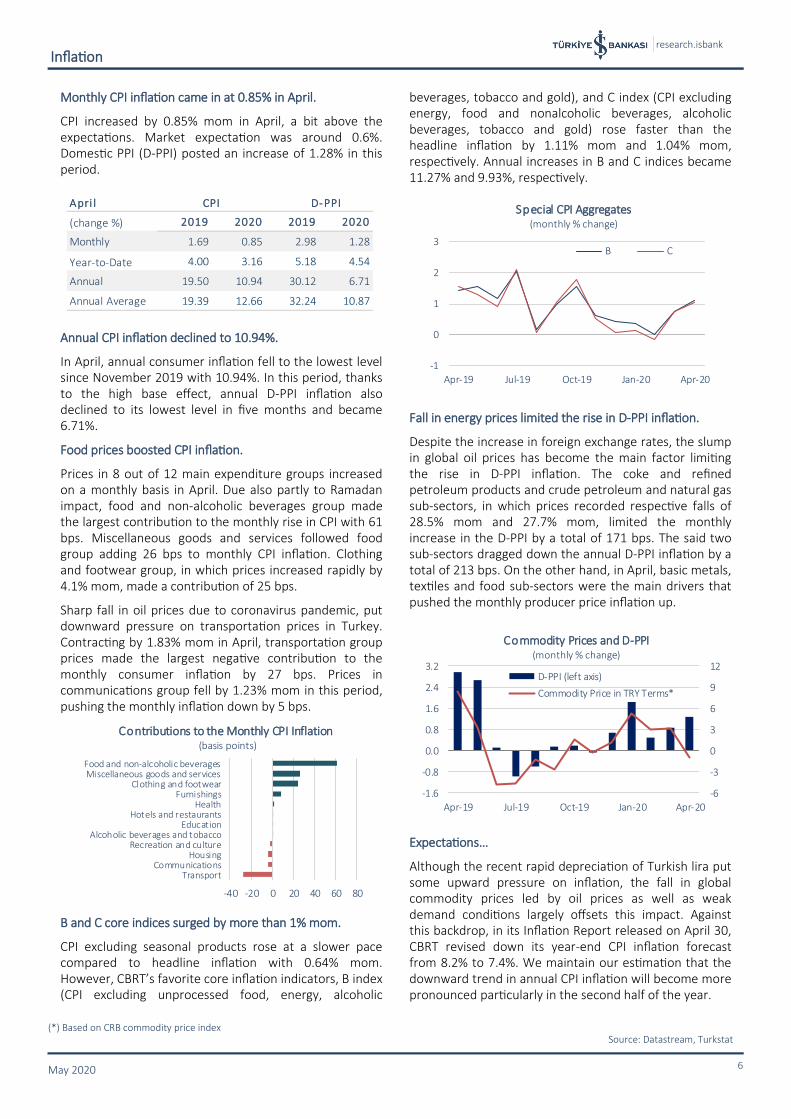
Food prices boosted CPI inflation.
Prices in 8 out of 12 main expenditure groups increased on a monthly basis in April. Due also partly to Ramadan impact, food and non-alcoholic beverages group made the largest contribution to the monthly rise in CPI with 61 bps. Miscellaneous goods and services followed food group adding 26 bps to monthly CPI inflation. Clothing and footwear group, in which prices increased rapidly by 4.1% mom, made a contribution of 25 bps.
Sharp fall in oil prices due to coronavirus pandemic, put downward pressure on transportation prices in Turkey. Contracting by 1.83% mom in April, transportation group prices made the largest negative contribution to the monthly consumer inflation by 27 bps. Prices in communications group fell by 1.23% mom in this period, pushing the monthly inflation down by 5 bps.
B and C core indices surged by more than 1% mom.
CPI excluding seasonal products rose at a slower pace compared to headline inflation with 0.64% mom. However, CBRT’s favorite core inflation indicators, B index (CPI excluding unprocessed food, energy, alcoholic
beverages, tobacco and gold), and C index (CPI excluding energy, food and nonalcoholic beverages, alcoholic beverages, tobacco and gold) rose faster than the headline inflation by 1.11% mom and 1.04% mom, respectively. Annual increases in B and C indices became 11.27% and 9.93%, respectively.
Fall in energy prices limited the rise in D-PPI inflation.
Despite the increase in foreign exchange rates, the slump in global oil prices has become the main factor limiting the rise in D-PPI inflation. The coke and refined petroleum products and crude petroleum and natural gas sub-sectors, in which prices recorded respective falls of 28.5% mom and 27.7% mom, limited the monthly increase in the D-PPI by a total of 171 bps. The said two sub-sectors dragged down the annual D-PPI inflation by a total of 213 bps. On the other hand, in April, basic metals, textiles and food sub-sectors were the main drivers that pushed the monthly producer price inflation up.
Expectations…
Although the recent rapid depreciation of Turkish lira put some upward pressure on inflation, the fall in global commodity prices led by oil prices as well as weak demand conditions largely offsets this impact. Against this backdrop, in its Inflation Report released on April 30, CBRT revised down its year-end CPI inflation forecast from 8.2% to 7.4%. We maintain our estimation that the downward trend in annual CPI inflation will become more pronounced particularly in the second half of the year.
Inflation
(*) Based on CRB commodity price index Source: Datastream, Turkstat
Apri l
(change %) 2019 2020 2019 2020
Monthly 1.69 0.85 2.98 1.28
Year-to-Date 4.00 3.16 5.18 4.54
Annual 19.50 10.94 30.12 6.71
Annual Average 19.39 12.66 32.24 10.87
D-PPICPI
-6
-3
0
3
6
9
12
-1.6
-0.8
0.0
0.8
1.6
2.4
3.2
Apr-19 Jul-19 Oct-19 Jan-20 Apr-20
Commodity Prices and D-PPI(monthly % change)
D-PPI (left axis)
Commodity Price in TRY Terms*
-40 -20 0 20 40 60 80
TransportCommunications
HousingRecreation and culture
Alcoholic beverages and tobaccoEducation
Hotels and restaurantsHealth
FurnishingsClothing and footwear
Miscellaneous goods and servicesFood and non-alcoholic beverages
Contributions to the Monthly CPI Inflation (basis points)
-1
0
1
2
3
Apr-19 Jul-19 Oct-19 Jan-20 Apr-20
Special CPI Aggregates(monthly % change)
B C

research.isbank
May 2020 7
Policy rate cut and additional measures by the CBRT...
CBRT announced new measures on April 17 to fight the economic and financial impacts of the coronavirus outbreak. The maximum limit for the ratio of the open market operations portfolio’s nominal size to the CBRT analytical balance sheet total assets, which had been previously set as 5% for 2020, was raised to 10%. In addition to this, the facility offered to primary dealer (PD) banks to sell GDDS to the CBRT was revised. According to the revision, the limits offered to PD banks for outright sales of GDDS to the CBRT will be applied independent of the repo transaction limits and PD banks will be offered a GDDS selling limit that is equal to the repo transaction limits.
At its meeting held on April 22, CBRT Monetary Policy Committee cut the 1-week repo rate (policy interest rate) by 100 basis points to 8.75%. With this decision, total rate cuts since the beginning of the year reached 325 basis points. In the note released after the meeting, it was stated that the recent monetary and fiscal measures will provide a boost to financial stability and future recovery after the coronavirus pandemic. It was also suggested that commodity prices and aggregate demand conditions would put downward pressure on inflation.
CBRT cut its year-end inflation forecast.
In its Inflation Report released on April 30, CBRT cut the year-end inflation forecast for 2020 from 8.2% to 7.4%. The Central Bank maintained 2021-end inflation forecast at 5.4%. The downward revision for 2020 inflation forecast stemmed from the cut in average oil price forecasts from 60 USD to 32.6 USD and the projection of a deepening output gap. In addition to these factors, the downward revision made to food inflation forecast for this period (from 11% to 9.5%) also played a part.
Global risk sentiment recovered to some extent in April.
Thanks to the measures taken against coronavirus outbreak, global risk sentiment recovered to some extent in April. VIX, which was 54 at the end of March, ended April at 34 level. The index had climbed above 80 level in mid-March.
Risk perception towards Turkey was volatile in April. Turkey’s 5-year CDS premium, which declined as low as 521 bps on April 9, increased by 44 bps to the level of 583 bps at the end of the month.
Depreciation in TRY...
Turkish lira decoupled negatively from its emerging market peers in April. In this period, USD/TRY and EUR/TRY increased by 5.6% mom and by 4.9% mom, respectively. On the other hand, Turkish lira, which faced a sharp depreciation in 2018, depreciated less compared to many other emerging currencies in January-April period.
The compound yield of 2-year benchmark bond decreased by 231 basis points mom and ended the month at 8.91%. As well as CBRT’s rate cuts, the rising demand for GDDS drove this decline in yields.
BIST 100 returned to 100K levels in April.
The BIST-100 index had a similar upward trend to global markets in April and surged above 100K level after one and a half month. The index, which increased by 12.8% mom in April, was down by 11.6% compared to the year-end as of April 30.
Financial Markets
Source: CBRT, Datastream, Reuters, BIST
31-Mar 30-Apr
5-Y CDS (basis points) 539 583 44 bps ▲
TR 2-Y Benchm ark Y ield 11.22% 8.91% -231 bps ▼
BIST-100 89,644 101,110 12.8% ▲
USD/TRY 6.6110 6.9829 5.6% ▲
EUR/TRY 7.2968 7.6515 4.9% ▲
Currency Basket* 6.9539 7.3172 5.2% ▲
(*) (0.5 USD/TL + 0.5 EUR/TL)
Change
50
200
350
500
650
Jan-20 Feb-20 Mar-20 Apr-20
5Y CDS Spread (basis points)
Turkey Brazil
S. Africa Russia
60
70
80
90
100
110
Jan-20 Feb-20 Mar-20 Apr-20
BIST-100 and Emerging Market Index
BIST-100
MSCI-Emerging
(12/31/19=100)
90
100
110
120
130
140
150
Jan-20 Feb-20 Mar-20 Apr-20
USD/Local Currency
Turkey BrazilS. Africa Russia
(12/31/19=100)

research.isbank
May 2020 8
New regulations from the BRSA...
Aiming the effective use of banks’ resources against the impacts of the coronavirus pandemic, the BRSA announced that banks would calculate a new asset ratio (AR) on weekly and solo basis as of May 1, 2020. The AR formula has loans, securities and swap transactions with CBRT in the numerator and TRY and FX deposits in the denominator. The monthly average value of AR should not fall below 100% for deposit banks and below 80% for participation banks.
BRSA decreased the limits of banks regarding the TRY purchases under the swaps, forwards or other derivatives transactions with non-residents (from 10% of equity to 1%) and revoked ratio-maturity practice (application of different equity ratio according to the maturity date of the derivative contract). Regarding the TRY sales at maturity, the equity limit will be 1% for the derivative transactions whose maturity will end 7 days later, 2% for 30 days and 10% for 1 year.
Rapid increase in TRY deposits…
According to BRSA weekly data, total deposit volume expanded by 30.2% yoy and 16.1% ytd reaching 2,984 billion TRY as of April 24. According to exchange rate adjusted figures, deposit volume increased by 20.2% yoy and 7.4% ytd. The year-to-date growth in TRY deposits reached 15.3% while FX deposit volume in USD terms declined by 0.3% in the same period.
Total loan volume expanded by 19.4% yoy.
As of April 24, total loan volume of the banking sector increased by 19.4% yoy and 15.4% ytd reaching 3,062 billion TRY. According to exchange rate adjusted figures, total loan volume surged by 12.6% yoy and 9% ytd. TRY loan volume increased by 16.3% ytd while FX loans in USD terms dropped by 2.7% in the same period.
Analysis of loan types revealed that the volume of consumer loans including credit cards grew by 8.2% ytd. In the same period, commercial loan volume increased by 17.5%.
Looking at the breakdown of consumer loans, housing loans followed a flat course in the recent weeks while
vehicle loans were on a downward trend. On the other hand, personal finance loans continued to accelerate. As of April 24, personal finance loans recorded a rise of 17.4% compared to the year-end.
Non-performing loan ratio became 4.72%.
As of April 24, the non-performing loan (NPL) ratio was realized as 4.72%. In this period, NPL ratio became 5.15% in commercial loans and 3.01% in retail loans.
Net foreign currency position…
As of April 24, banks’ on-balance sheet FX position was (-) 39,532 million USD, while off-balance sheet FX position was (+) 39,121 million USD. Hence, banking sector’s net FX position was realized as (-) 411 million USD.
Banking Sector
Source: BRSA Weekly Bulletin
-4
-2
0
2
4
6
2010 2012 2014 2016 2018 2020
Net FX Position(USD billion)
-8
-4
0
4
8
12
16
20
24
Jan Feb Mar Apr
Turkish Lira Deposits and Loans(ytd % change)
TRY Deposits
TRY Loans
4 .72
3 .01
5 .15
2
3
4
5
6
7
2015 2016 2017 2018 2019 2020
Non-performing Loans(%)
Total Consumer Commercial
-20
-10
0
10
20
Jan Feb Mar Apr
Consumer Loans(y-t-d % change)
Housing
Vehicle
Personal Finance
research.isbank
May 2020 9
The global economy is expected to contract in 2020 due to the virus outbreak bringing economic activity to a halt. Although the outbreak spread mostly in the last month of the first quarter, advance growth data for the first quarter point to a sharp contraction in the economic activity in the US, Euro Area and China. In addition, PMI data for April indicate that the deterioration in economic outlook is continuing in the second quarter, while the worsening in employment market has deepened in this period. The developments are pushing many countries to gradually ease the imposed restrictions in May despite the second wave risk in the outbreak. However, it is estimated that normalization will take quite a long time and the pressure on economic activity will continue.
In Turkey, leading indicators are showing that loss in economic activity deepened in April. Due to social isolation and applied travel restrictions, economic
activity in the services sector has worsened significantly, while production posted sever contraction with the closure of many workplaces in the manufacturing industry. Weakness in the financial markets, which prevailed in March, has been replaced with a more volatile course. In parallel to recovery in global risk appetite, BIST-100 increased, whereas Turkey's CDS premiums continue to remain at high levels. TRY, which depreciated less compared to its emerging market peers earlier in the year, started to decouple negatively since the end of April.
Concluding Remarks

research.isbank
May 2020 10
16 (CA) Calendar adjusted Source: Datastream, CBRT, Turkstat
Turkish Economy- Macroeconomic Indicators
Growth
Leading Indicators
Labor Market
Foreign Trade and Current Account Balance
-15.00
-10.00
-5.00
0.00
5.00
10.00
15.00
2015 2016 2017 2018 2019
Contributions to GDP Growth(% point)
Private Consumption Public Consumption
Investment Net Exports
Change in Stocks
2019 Q4 GDP Growth: 6%
0
3
6
9
12
15
0
200
400
600
800
1,000
2007 2009 2011 2013 2015 2017 2019
Bin
ler
GDPGDP (USD billion) GDP Per Capita (USD thousand, right axis)
6 1 .6 60
64
68
72
76
80
-12
-8
-4
0
4
8
12
Apr-18 Oct-18 Apr-19 Oct-19 Apr-20
Industrial Production and Capacity Utilization
CA Industrial Production (annual % change)
Manufacturing Industry CUR (%, right axis)
6 6.8
5 4.9
50
54
58
62
66
70
74
60
70
80
90
100
110
120
Apr-18 Oct-18 Apr-19 Oct-19 Apr-20
Confidence Indices
Real Sector Confidence
Consumer Confidence (right axis)
5 1 .8
1 2 .6
9
10
11
12
13
14
15
50
51
52
53
54
Jan-18 Jul-18 Jan-19 Jul-19 Jan-20
Employment Indicators(seasonally adjusted)
Labor Force Participation Ratio (%)
Unemployment Rate (%, right axis)
2 8 .1
27.2
27.4
27.6
27.8
28.0
28.2
28.4
28.6
28.8
29.0
Jan-18 Jul-18 Jan-19 Jul-19 Jan-20
Bin
ler
Employment(seasonally adjusted, million persons)
3 .1
- 1 7.8
-40
-20
0
20
40
Mar-18 Jul-18 Nov-18 Mar-19 Jul-19 Nov-19 Mar-20
Foreign Trade(annual % change )
Imports Exports
- 1 .2
6 .1
-12
-9
-6
-3
0
3
6
-60
-45
-30
-15
0
15
30
Bin
ler
Bin
ler
Current Account Balance(USD billion)
Monthly (right axis)
12-month Cumulative

research.isbank
May 2020 11
16 (R) Realization Source: BİST, Datastream, Reuters, CBRT, Turkstat, Treasury
Turkish Economy- Macroeconomic Indicators
Inflation
Foreign Exchange and Bond Market
1 0 .8
6
11
16
21
26
31
Apr-18 Oct-18 Apr-19 Oct-19 Apr-20
Average Compound Yield in Treasury Auctions(%)
0 .9
0
2
4
6
8
10
Apr-18 Oct-18 Apr-19 Oct-19 Apr-20
Expected Real Yield of TRY GDDIs(%)
1 .28
0 .85
-5.0
-2.5
0.0
2.5
5.0
7.5
10.0
12.5
Apr-18 Oct-18 Apr-19 Oct-19 Apr-20
Monthly Inflation(%)
D-PPI CPI
6 .71
1 0 .94
0
8
16
24
32
40
48
56
Apr-18 Oct-18 Apr-19 Oct-19 Apr-20
Annual Inflation(%)
D-PPI CPI
5
10
15
20
25
30
2017 2018 2019 2020
CBRT Survey of Expectations -Annual CPI Inflation Expectations
(%, year-end)
2018(R): 20.30
2017(R): 11.92
2019(R): 11.84
8 .62
9 .70
6
8
10
12
14
16
18
20
22
Apr-18 Oct-18 Apr-19 Oct-19 Apr-20
CBRT Survey of Expectations - 12 & 24-month Ahead CPI Inflation Expectations
(%)24-month Ahead
12-month Ahead
3.00
4.00
5.00
6.00
7.00
8.00
9.00
Apr-18 Oct-18 Apr-19 Oct-19 Apr-20
Exchange Rates
EUR/TRY
USD/TRY
8
12
16
20
24
28
32
Apr-19 Oct-19 Apr-20
CBRT WACOF and 2-Y Benchmark Bond Yield(%)
CBRT Weighted Average Cost of Funding
2-Y Benchmark Bond Yield

research.isbank
May 2020 12
16 Aralık 2017 Source: CBRT, Datastream, Ministry of Treasury and Finance , Reuters, Turkstat
Turkish Economy - Macroeconomic Indicators
G rowth 2015 2016 2017 2018 2019 19-Q1 19-Q2 19-Q3
GDP (USD billion) 862 863 853 789 754 172 175 202
GDP (TRY billion) 2,339 2,609 3,111 3,724 4,280 922 1,024 1,145
GDP Growth Rate (%) 6.1 3.2 7.5 2.8 0.9 -2.3 -1.6 0.9
Inf la t ion ( %) F eb-20 Mar-20 Apr-20
CPI (annual) 8.81 8.53 11.92 20.30 11.84 12.37 11.86 10.94
Domestic PPI (annual) 5.71 9.94 15.47 33.64 7.36 9.26 8.50 6.71
Nov-19 Dec-19 Jan-20
Unemployment Rate (%) 10.2 12.0 9.9 12.8 13.0 13.10 13.00 12.60
Labor Force Participation Rate (%) 51.7 52.4 53.1 53.0 52.3 52.70 52.30 51.80
F eb-20 Mar-20 Apr-20
CPI Based Real Effective Exchange Rate 99.2 93.6 86.3 76.4 76.1 75.1 72.9 68.9
USD/TRY 2.9189 3.5176 3.7916 5.3199 5.9510 6.2493 6.5903 6.9895
EUR/TRY 3.1708 3.7102 4.5530 6.0815 6.6800 6.8645 7.2312 7.6556
Currency Basket (0.5*EUR+0.5*USD) 3.0448 3.6139 4.1723 5.7007 6.3155 6.5569 6.9107 7.3226
Jan-20 F eb-20 Mar-20
Exports 151.0 149.2 164.5 177.2 180.8 181.7 182.0 179.1
Imports 213.6 202.2 238.7 231.2 210.3 213.4 215.0 215.5
F oreign Trade Ba lance -62.6 -52.9 -74.2 -54.0 -29.5 -31.7 -33.0 -36.5
Import Coverage Ratio (%) 70.7 73.8 68.9 76.6 86.0 85.1 84.7 83.1
Dec-19 Jan-20 F eb-20
Current Account Ba lance -27.3 -26.8 -40.6 -20.7 8.7 8.6 7.2 6.1
Capi ta l and F inancia l Accounts -21.2 -21.7 -46.8 -10.9 1.8 1.8 2.8 0.5
Direct Investments (net) -14.2 -10.8 -8.4 -9.4 -5.6 -5.6 -5.6 -5.4
Portfolio Investments (net) 15.3 -6.4 -24.1 3.1 1.2 1.2 8.6 10.0
Other Investments (net) -10.6 -5.3 -6.2 5.7 -0.2 -0.2 -0.4 -4.2
Reserve Assets (net) -11.8 0.8 -8.2 -10.4 6.3 6.3 0.1 0.2
Net Errors and Om iss ions 6.1 5.1 -6.3 9.8 -6.9 -6.9 -4.5 -5.6
Current Account Ba lance/G DP ( %) -3.2 -3.1 -4.8 -2.6 1.2 - - -
Jan-20 F eb-20 Mar-20
Expendi tures 506.3 584.1 678.3 830.5 999.5 100.7 194.2 285.3
Interest Expenditures 53.0 50.2 56.7 74.0 99.9 12.7 26.9 38.2
Non-interest Expenditures 453.3 533.8 621.6 756.5 899.5 87.9 167.3 247.1
Revenues 482.8 554.1 630.5 757.8 875.8 122.2 208.3 255.7
Tax Revenues 407.8 459.0 536.6 621.3 673.3 67.4 139.1 176.1
Budget Ba lance -23.5 -29.9 -47.8 -72.8 -123.7 21.5 14.1 -29.6
Prim ary Ba lance 29.5 20.3 8.9 1.3 -23.8 34.2 41.0 8.7
Budget Ba lance/G DP ( %) -1.0 -1.1 -1.5 -2.0 -2.9 - - -
Jan-20 F eb-20 Mar-20
Domestic Debt Stock 440.1 468.6 535.4 586.1 755.1 761.9 786.0 808.8
External Debt Stock 238.1 291.3 341.0 481.0 573.7 574.3 623.5 653.3
Tota l Debt Stock 678.2 760.0 876.5 1067.1 1,328.8 1,336.2 1,409.5 1,462.0
(1) 12-month cumulative(2) Year-to-date cumulative(3) According to Central Government Budget
Centra l G overnm ent Debt Stock ( TRY bi l l ion)
Seasona l l y Adjus ted Labor Market F igures
F X Rates
F oreign Trade Ba lance (1 ) ( USD bi l l ion)
Ba lance of Paym ents(1 )
( USD bi l l ion)
Budget(2 )(3 )
( TRY bi l l ion)

research.isbank
May 2020 13
16 Aralık 2017
Source: BRSA, Turkstat
Turkish Economy - Banking Sector Outlook
LEGAL NOTICE
This report has been prepared by Türkiye İş Bankası A.Ş. economists and analysts by using the information from publicly available sources believed to be reliable, solely for information purposes; and they are not intended to be construed as an offer or solicitation for the purchase or sale of any financial in-strument or the provision of an offer to provide investment services. The views, opinions and analyses expressed do not represent the official standing of Türkiye İş Bankası A.Ş. and are personal views and opinions of the analysts and economists who prepare the report. No representation or warranty, express or implied, is made as to the accuracy or completeness of the information contained in this report. All information contained in this report is subject to change without notice, Türkiye İş Bankası A,Ş, accepts no liability whatsoever for any direct or consequential loss arising from any use of this report or its contents.
This report is copyright-protected. Reproducing, publishing and/or distributing this report in whole or in part is therefore prohibited. All rights reserved.
Our reports are available on our website https://research.isbank.com.tr
(TRY billion) 2015 2016 2017 2018 2019 F eb.20 Mar.20 Change(1)
TOTAL ASSETS 2,357 2,731 3,258 3,867 4,492 4,713 4,873 8.5
Loans 1,485 1,734 2,098 2,395 2,657 2,772 2,897 9.0
TRY Loans 1,013 1,131 1,414 1,439 1,642 1,738 1,799 9.6
Share (%) 68.2 65.2 67.4 60.1 61.8 62.7 62.1 -
FX Loans 472 603 684 956 1,015 1,034 1,098 8.2
Share (%) 31.8 34.8 32.6 39.9 38.2 37.3 37.9 -
Non-performing Loans 47.5 58.2 64.0 96.6 150.1 152.6 151.5 0.9
Non-performing Loan Rate (%) 3.1 3.2 3.0 3.9 5.3 5.2 5.0 -
Securi t ies 330 352 402 478 661 711 748 13.2
TOTAL LIABILIT IES 2,357 2,731 3,258 3,867 4,492 4,713 4,873 8.5
Depos i ts 1,245 1,454 1,711 2,036 2,567 2,688 2,796 8.9
TRY Deposits 715 845 955 1,042 1,259 1,285 1,351 7.3
Share (%) 57.4 58.1 55.8 51.2 49.0 47.8 48.3 -
FX Deposits 530 609 756 994 1,308 1,403 1,445 10.5
Share (%) 42.6 41.9 44.2 48.8 51.0 52.2 51.7 -
Securi t ies Is sued 98 116 145 174 194 201 210 8.6
Payables to Banks 361 418 475 563 533 551 561 5.1
F unds f rom Repo Transactions 157 138 99 97 154 185 194 26.1
SHAREHOLDERS' EQUITY 262 300 359 421 492 511 500 1.6
Profit (Loss) of the Period 26.1 37.5 49.1 53.5 49.8 15.1 15.8 -
RATIOS ( %)
Loans/GDP 63.5 66.5 67.6 64.7 62.1
Loans/Assets 63.0 63.5 64.4 61.9 59.2 58.8 59.4 -
Securities/Assets 14.0 12.9 12.3 12.4 14.8 15.1 15.4 -
Deposits/Liabilities 52.8 53.2 52.5 52.6 57.2 57.0 57.4 -
Loans/Deposits 119.2 119.3 122.6 117.6 103.6 103.1 103.6 -
Capital Adequacy (%) 15.6 15.6 16.9 17.3 18.4 17.7 17.9 -
(1) Year-to-date % change
BANKING SECTOR ACCORDING TO BRSA's MONTHLY BULLETIN FIGURES