Embed Size (px)
Citation preview

EURO
PEAN
CEN
TRAL
BAN
K
MO
NTH
LY B
ULL
ETI
NEN
MONTHLY BULLET INJANUARY
011201002120100312010041201005120100612010071201008120100912010101201011120101212010
0112
010

MONTHLY BULLET IN
JANUARY 2010
In 2010 all ECB publications
feature a motif taken from the
€500 banknote.

© European Central Bank, 2010
Address Kaiserstrasse 29
60311 Frankfurt am Main
Germany
Postal address Postfach 16 03 19
60066 Frankfurt am Main
Germany
Telephone +49 69 1344 0
Website http://www.ecb.europa.eu
Fax +49 69 1344 6000
This Bulletin was produced under the responsibility of the Executive Board of the ECB. Translations are prepared and published by the national central banks.
All rights reserved. Reproduction for educational and non-commercial purposes is permitted provided that the source is acknowledged.
The cut-off date for the statistics included in this issue was 13 January 2010.
ISSN 1561-0136 (print)
ISSN 1725-2822 (online)

3ECB
Monthly Bulletin
January 2010
CONTENTS
EDITORIAL 5
ECONOMIC AND MONETARY
DEVELOPMENTS
The external environment of the euro area 9
Monetary and fi nancial developments 17
Prices and costs 36
Output, demand and the labour market 44
Exchange rate and balance of payments
developments 53
Boxes:
External adjustment in central 1
and eastern Europe 12
New statistics on euro area 2
investment funds 18
Base effects and their impact 3
on HICP infl ation in 2010 41
Measuring perceptions 4
of macroeconomic uncertainty 47
International trade developments 5
and revision of the effective exchange
rates of the euro 55
ARTICLES
The ECB’s monetary policy stance
during the fi nancial crisis 63
The ECB’s relations with European
Union institutions and bodies –
trends and prospects 73
Entitlements of households under
government pension schemes in the euro
area – results on the basis of the new
system of national accounts 85
EURO AREA STATISTICS S1
ANNEXES
Chronology of monetary policy
measures of the Eurosystem I
Documents published by the European
Central Bank since 2009 V
Glossary XI

4ECB
Monthly Bulletin
January 2010
ABBREVIATIONS
COUNTRIES LU Luxembourg
BE Belgium HU Hungary
BG Bulgaria MT Malta
CZ Czech Republic NL Netherlands
DK Denmark AT Austria
DE Germany PL Poland
EE Estonia PT Portugal
IE Ireland RO Romania
GR Greece SI Slovenia
ES Spain SK Slovakia
FR France FI Finland
IT Italy SE Sweden
CY Cyprus UK United Kingdom
LV Latvia JP Japan
LT Lithuania US United States
OTHERS
BIS Bank for International Settlements
b.o.p. balance of payments
BPM5 IMF Balance of Payments Manual (5th edition)
CD certifi cate of deposit
c.i.f. cost, insurance and freight at the importer’s border
CPI Consumer Price Index
ECB European Central Bank
EER effective exchange rate
EMI European Monetary Institute
EMU Economic and Monetary Union
ESA 95 European System of Accounts 1995
ESCB European System of Central Banks
EU European Union
EUR euro
f.o.b. free on board at the exporter’s border
GDP gross domestic product
HICP Harmonised Index of Consumer Prices
HWWI Hamburg Institute of International Economics
ILO International Labour Organization
IMF International Monetary Fund
MFI monetary fi nancial institution
NACE Rev. 1 Statistical classifi cation of economic activities in the European Community
NCB national central bank
OECD Organisation for Economic Co-operation and Development
PPI Producer Price Index
SITC Rev. 4 Standard International Trade Classifi cation (revision 4)
ULCM unit labour costs in manufacturing
ULCT unit labour costs in the total economy
In accordance with EU practice, the EU countries are listed in this Bulletin using the alphabetical order of the country names in the national languages.

5ECB
Monthly Bulletin
January 2010
Based on its regular economic and monetary
analyses, the Governing Council decided at its
meeting on 14 January 2010 to leave the key
ECB interest rates unchanged. The current rates
remain appropriate. Taking into account all
the information and analyses that have become
available since the Governing Council meeting
on 3 December 2009, price developments
are expected to remain subdued over the
policy-relevant horizon. The latest information
has also confi rmed that towards the end of 2009
euro area economic activity continued to expand.
However, some of the factors supporting the
growth in real GDP are of a temporary nature.
Overall, the Governing Council expects the
euro area economy to grow at a moderate pace
in 2010, recognising that the recovery process
is likely to be uneven and that the outlook
remains subject to uncertainty. The outcome of
the monetary analysis confi rms the assessment of
low infl ationary pressure over the medium term,
given the ongoing parallel decline in money and
credit growth. All in all, the Governing Council
expects price stability to be maintained over the
medium term, thereby supporting the purchasing
power of euro area households. Medium to
longer-term infl ation expectations remain fi rmly
anchored in line with the Governing Council’s
aim of keeping infl ation rates below, but close
to, 2% over the medium term.
Starting with the economic analysis, following
the 0.4% quarter-on-quarter increase in real
GDP in the third quarter of 2009, the latest
information confi rms that towards the end of
last year economic activity in the euro area
continued to expand. The euro area has been
benefi ting from a turn in the inventory cycle
and a recovery in exports, as well as from the
signifi cant macroeconomic stimulus under
way and the measures adopted to restore the
functioning of the fi nancial system. However,
a number of the supporting factors are of a
temporary nature. Furthermore, there is likely to
be a drag on activity for some time to come on
account of the ongoing process of balance sheet
adjustment in the fi nancial and non-fi nancial
sectors, both inside and outside the euro area. In
addition, low capacity utilisation rates are likely
to dampen investment, and unemployment in
the euro area is expected to increase somewhat
further, thereby lowering consumption growth.
For these reasons, the euro area economy is
expected to grow only at a moderate pace
in 2010 and the recovery process could be
uneven.
The Governing Council continues to view
the risks to this outlook as broadly balanced.
On the upside, there may be stronger than
anticipated effects stemming from the extensive
macroeconomic stimulus being provided and
from other policy measures taken. Confi dence
may also improve further, and the global
economy as well as foreign trade may recover
more strongly than projected. On the downside,
concerns remain relating to a stronger or more
protracted than expected negative feedback
loop between the real economy and the
fi nancial sector, renewed increases in oil and
other commodity prices, the intensifi cation of
protectionist pressures and the possibility of
disruptive market movements related to the
correction of global imbalances.
With regard to price developments, as expected,
euro area annual HICP infl ation increased further
in December 2009 to stand at 0.9%, after 0.5% in
November. The rise mainly refl ects upward base
effects stemming mostly from the drop in global
energy prices a year ago. Infl ation is expected
to remain around 1% in the near term. Looking
further ahead, infl ation is expected to remain
moderate over the policy-relevant horizon,
with overall price, cost and wage developments
staying subdued in line with a slow recovery in
demand in the euro area and elsewhere. In this
context, it is important to emphasise, once again,
that infl ation expectations over the medium
to longer term remain fi rmly anchored in line
with the Governing Council’s aim of keeping
infl ation rates below, but close to, 2% over the
medium term.
Risks to this outlook remain broadly balanced.
They relate, in particular, to the outlook
for economic activity and the evolution of
commodity prices. Furthermore, increases in
EDITORIAL
6ECB
Monthly Bulletin
January 2010
indirect taxation and administered prices may
be stronger than currently expected owing
to the need for fi scal consolidation in the
coming years.
Turning to the monetary analysis, both the
annual growth rates of M3 and loans to the
private sector were negative in November,
standing at -0.2% and -0.7% respectively.
The concurrent declines to historically low
growth rates recorded in these two series over
the past months support the assessment of
a decelerating underlying pace of monetary
expansion and low infl ationary pressures over
the medium term. Looking ahead, M3 and
credit growth are likely to remain very weak or
negative for some time to come.
The decline in actual monetary growth is likely
to overstate the deceleration in the underlying
pace of monetary expansion. This is due to
the continued steep slope of the yield curve,
which explains shifts of funds out of M3 into
longer-term deposits and securities. At the same
time, the interest rate constellation continues
to foster divergent developments in the main
components of M3, as the narrow spreads
between the rates on different short-term bank
deposits reduce the opportunity costs of shifting
funds from, for instance, short-term time
deposits into overnight deposits. As a result,
M1 continued to grow at a robust annual rate of
12.6% in November, when annual M3 growth
turned negative.
The negative annual growth of bank loans to
the private sector conceals a return to positive
annual rates of growth in the case of loans to
households, while the annual growth of loans
to non-fi nancial corporations became more
negative. Such divergence remains in line with
business cycle regularities, with turning points
in the growth of loans to enterprises typically
lagging those in economic activity. In the case
of households, the latest data provide further
confi rmation of a levelling-off at low rates.
In the case of non-fi nancial corporations, the
decline in loans continues to refl ect mainly a
strong net redemption of loans with a shorter
maturity, while lending and borrowing at longer
maturities remained positive. The subdued
levels of production and trade, as well as the
ongoing uncertainty surrounding the business
outlook, will probably continue to dampen
fi rms’ demand for bank fi nancing in the months
to come. In the meantime, fi nancing conditions
for enterprises have improved over recent
months in terms of the cost of both bank
credit and market fi nancing. In this respect,
the continued negative fl ows in short-term bank
loans to non-fi nancial corporations observed
in recent months may partly refl ect better
possibilities for substitution with different
sources of longer-term fi nancing.
Banks have continued to reduce the size of
their overall balance sheets, mainly through
downsizing the assets held vis-à-vis other banks.
The challenge remains to adjust the size and
structure of balance sheets while ensuring the
availability of credit to the non-fi nancial sector.
To address this challenge, banks should use
the improved funding conditions to strengthen
further their capital bases and, where necessary,
take full advantage of government support
measures for recapitalisation.
To sum up, the current key ECB interest rates
remain appropriate. Taking into account all
the information and analyses that have become
available since the Governing Council meeting
on 3 December 2009, price developments are
expected to remain subdued over the policy-
relevant horizon. The latest information has also
confi rmed that towards the end of 2009 euro
area economic activity continued to expand.
However, some of the factors supporting the
growth in real GDP are of a temporary nature.
Overall, the Governing Council expects the
euro area economy to grow at a moderate pace
in 2010, recognising that the recovery process
is likely to be uneven and that the outlook
remains subject to uncertainty. A cross-check
of the outcome of the economic analysis with
that of the monetary analysis confi rms the
assessment of low infl ationary pressure over
the medium term, given the ongoing parallel
decline in money and credit growth. All in all,

7ECB
Monthly Bulletin
January 2010
EDITORIAL
the Governing Council expects price stability to
be maintained over the medium term, thereby
supporting the purchasing power of euro area
households. Medium to longer-term infl ation
expectations remain fi rmly anchored in line
with the Governing Council’s aim of keeping
infl ation rates below, but close to, 2% over the
medium term.
The Governing Council will continue its
enhanced credit support to the banking
system, while taking into account the ongoing
improvement in fi nancial market conditions
and avoiding distortions associated with
maintaining non-standard measures for too
long. The Governing Council will also continue
to implement the gradual phasing-out of the
extraordinary liquidity measures that are
not needed to the same extent as in the past.
In order to counter effectively any threat to
price stability over the medium to longer term,
the liquidity provided will be absorbed when
necessary. Accordingly, the Governing Council
will continue to monitor very closely all
developments over the period ahead.
As regards fi scal policies, many euro area
governments are faced with high and sharply
rising fi scal imbalances. The very large
government borrowing requirements carry
the risk of triggering rapid changes in market
sentiment, leading to less favourable medium
and long-term market interest rates. This, in turn,
would dampen private investment and thereby
weaken the foundations for sustained growth.
Moreover, high levels of public defi cit and debt
would place an additional burden on monetary
policy and undermine the credibility of the
provisions of both the Treaty on the Functioning
of the European Union and the Stability and
Growth Pact as a key pillar of Economic and
Monetary Union. The Governing Council
therefore calls upon governments to decide
and implement in a timely fashion ambitious
fi scal exit and consolidation strategies based
on realistic growth assumptions, with a strong
focus on expenditure reforms. Tax cuts should
only be considered over the medium term, when
countries have regained suffi cient room for
budgetary manoeuvre. In this regard, current
government commitments to start consolidation
in 2011 at the latest and to go well beyond the
structural benchmark for adjustment of 0.5%
of GDP per annum represent the minimum
requirement for all euro area countries.
The success of fi scal adjustment strategies
will also depend, crucially, on appropriate
national budgetary rules and institutions and
requires transparent budgetary procedures,
as well as reliable and complete government
fi nance statistics.
Turning to structural reforms, an appropriate
restructuring of the banking sector should play
an important role. Sound balance sheets,
effective risk management, and transparent
as well as robust business models are key to
strengthening banks’ resilience to shocks,
thereby laying the foundations for sustainable
economic growth and fi nancial stability.
The Eurosystem will submit its response to the
European Commission’s public consultation
on the EU 2020 strategy, which is designed
as a successor to the current Lisbon strategy.
To address future challenges, the EU 2020
strategy should focus on raising potential
growth and creating high levels of employment
through well-functioning labour and product
markets, sound fi nancial systems and sustainable
fi scal policies. The aim is to achieve a highly
competitive social market economy, as spelled
out in the Treaty.
This issue of the Monthly Bulletin contains
three articles. The fi rst article describes the way
in which the ECB has assessed, signalled and
implemented the monetary policy stance in the
context of the recent fi nancial crisis. The second
article reviews the relations of the ECB with
the other relevant institutions and bodies in the
European Union which have been established
since the launch of the euro. The third article
presents an overview and estimates of household
entitlements under government pension schemes
in the euro area.


9ECB
Monthly Bulletin
January 2010
ECONOMIC AND MONETARYDEVELOPMENTS
The external
environment
of the euro area
ECONOMIC AND MONETARY DEVELOPMENTS
1 THE EXTERNAL ENVIRONMENT OF THE EURO AREA
The global economy is exhibiting stronger signs of a return to growth. At the same time, owing to base effects related to commodity prices, global infl ation rates have returned to positive territory. Risks to the global economic outlook are viewed to be broadly balanced.
1.1 DEVELOPMENTS IN THE WORLD ECONOMY
There is increasing evidence that global
economic activity, supported by the monetary
and fi scal policy stimuli, as well as by the
inventory cycle, is expanding. The global
Purchasing Managers’ Index (PMI), which
has continued to signal an expansion in
global economic activity, increased to 53.4
in December from 51.7 in the previous month
(see Chart 1). The increase in the global PMI in
December was mainly driven by a recovery in
the manufacturing sector, but the service sector
also recovered further. The pick-up in activity
has been accompanied by sustained growth in
the PMI new orders component, especially in the
manufacturing sector, suggesting that this sector
is likely to expand further in the near term.
Having remained slightly negative for a few
months, mainly owing to base effects related to
commodity prices and elevated spare capacity,
headline annual CPI infl ation in OECD countries
returned to positive territory in October and
stood at 1.3% in November (see Chart 2).
Excluding food and energy, annual CPI infl ation
was 1.5% in November, slightly lower than one
month earlier. The global PMI of manufacturing
input prices also showed marked increases in
purchasing prices in December, recording the
largest increase since August, partly as a result
of the recent increases in commodity prices.
UNITED STATES
In the United States, growth in economic
activity turned positive in the third quarter
of 2009 as economic conditions improved.
According to the third estimate by the Bureau
of Economic Analysis, real GDP increased in
the same quarter, rising by 2.2% in annualised
terms instead of the 2.8% previously estimated.
The main drivers of the pick-up in activity were
gains in consumer spending, a strong rebound
in both residential investment and exports, and
Chart 1 Global PMI output
(diffusion index; SA; monthly data)
25
30
35
40
45
50
55
60
65
25
30
35
40
45
50
55
60
65
20001999 2001 2003 20052002 2004 2006200720082009
PMI output: overall
PMI output: manufacturing
PMI output: services
Source: Markit.
Chart 2 International price developments
(monthly data; annual percentage changes)
-1
0
1
2
3
4
5
6
-1
0
1
2
3
4
5
6
2000 20011999 20032002 20052004 2006 2007 2008 2009
OECD consumer prices (all items)
OECD consumer prices (all items excluding
food and energy)
Source: OECD.

10ECB
Monthly Bulletin
January 2010
a less pronounced pace of inventory liquidation.
Government stimulus measures temporarily
supported demand, particularly in the automobile
and housing sectors. Meanwhile, GDP growth
was dampened by surging imports and declining
investment in non-residential structures.
As regards price developments, annual CPI
infl ation rose to 1.8% in November 2009,
the fi rst positive change since February 2009.
This follows a decline of 0.2% in the CPI index
in the year to October (see Chart 3). The rise in
headline infl ation was largely driven by a rise
in energy costs in November, as well as by
base effects stemming from past developments
in energy prices. The annual rate of infl ation
excluding food and energy remained stable at
1.7% in November.
On 16 December 2009 the US Federal Open
Market Committee (FOMC) decided to maintain
its target range for the federal funds rate at 0%
to 0.25%. The FOMC continues to anticipate
that economic conditions, including low rates
of resource utilisation, subdued infl ation trends
and stable infl ation expectations, are likely to
warrant exceptionally low levels of the federal
funds rate for an extended period. The FOMC
also continues to conduct non-conventional
measures to support the functioning of fi nancial
markets and stimulate the economy, although
the pace of asset purchases is gradually being
reduced and most special liquidity facilities are
expected to expire over the next few months.
JAPAN
In Japan, economic activity is recovering.
In particular, the Bank of Japan’s December 2009
Tankan Survey indicated that sentiment among
large manufacturers in Japan has improved
over recent months. The outlook for capital
expenditure, however, remains less favourable, as fi rms appear to remain cautious concerning
the medium-term perspectives. According to the second preliminary estimate released by
Japan’s Cabinet Offi ce in December, the quarterly real GDP growth rate was revised downwards
substantially, from 1.2% to 0.3% for the third quarter of 2009. This mainly refl ected a signifi cant
downward revision of business investment and, to a lesser extent, inventories, as private
consumption was revised slightly upwards.
Chart 3 Main developments in major industrialised economies
euro area United StatesJapan United Kingdom
Output growth 1)
(quarter-on-quarter percentage changes; quarterly data)
-5.0
-4.0
-3.0
-2.0
-1.0
0.0
1.0
2.0
-5.0
-4.0
-3.0
-2.0
-1.0
0.0
1.0
2.0
2000 2002 2004 2006 2008
Inflation rates 2)
(consumer prices; annual percentage changes; monthly data)
-3
-2
-1
0
1
2
3
4
5
6
-3
-2
-1
0
1
2
3
4
5
6
2000 2002 2004 2006 2008
Sources: National data, BIS, Eurostat and ECB calculations.1) Eurostat data are used for the euro area and the United Kingdom; national data are used for the United States and Japan. GDP fi gures have been seasonally adjusted.2) HICP for the euro area and the United Kingdom; CPI for the United States and Japan.

11ECB
Monthly Bulletin
January 2010
ECONOMIC AND MONETARYDEVELOPMENTS
The external
environment
of the euro area
Price indices continued to decrease in November 2009 owing to considerable economic slack. Annual
CPI infl ation fell by 1.9% in November, following a decline of 2.5% in October. The negative
contribution from the energy component, however, continued to shrink. The annual change in the
CPI excluding food and energy was -1.0% in November, compared with -1.1% in October. At its
meeting on 18 December 2009, the Bank of Japan decided to leave its target for the uncollateralised
overnight call rate unchanged at 0.1%.
UNITED KINGDOM
In the United Kingdom, the economic situation is improving gradually. Real GDP growth in the
third quarter of 2009 was revised slightly upwards to -0.2% (from -0.3% in the fi rst release), with
upward revisions in the construction sector being partly offset by downward revisions to services.
Short-term indicators suggest that real GDP may have returned to positive territory in the
fourth quarter of 2009. House prices rose for the fi fth consecutive month, by 1.4% (month on month)
in December 2009, but nevertheless remained slightly lower than a year ago. Annual HICP infl ation
for November 2009 turned out higher than expected by markets, standing at 1.9% year on year
(up from 1.5% in October). This partly refl ects the weakness of the pound sterling. In the short
term, HICP infl ation is likely to be higher, to some extent also driven by base effects (temporary
VAT reduction in December 2008).
At its meeting on 9 and 10 December, the Monetary Policy Committee of the Bank of England
voted unanimously for keeping the key policy interest rate at 0.5% and maintaining the quantitative
easing strategy of asset purchases. In addition, a new measure was introduced, namely that the
Bank of England will offer to sell corporate bonds as part of the Corporate Bond Secondary Market
Scheme. At its meeting on 7 January, the Bank of England’s Monetary Policy Committee kept
these policies unchanged.
OTHER EUROPEAN COUNTRIES
In most other non-euro area EU countries, the economic situation also seems to have stabilised
recently. In Sweden, real GDP increased by 0.2% (quarter on quarter) in the third quarter of 2009,
which is somewhat weaker than the 0.3% increase recorded in the second quarter. In Denmark,
output increased by 0.6% in the third quarter after a marked decrease of 2.3% in the second quarter,
which mainly refl ected one-off factors. In December 2009 HICP infl ation increased to 2.8% in
Sweden and to 1.2% in Denmark. On 11 December 2009 Danmarks Nationalbank reduced its main
policy rate by 0.05 percentage point to 1.2%.
In the largest central and eastern European EU Member States, recent economic indicators suggest
some improvement. Compared with the second quarter, real GDP contracted at a somewhat
slower pace in Hungary and Romania in the third quarter, by 1.8% and 0.6% quarter on quarter
respectively, and increased by 0.5% and 0.8% in Poland and the Czech Republic respectively.
Short-term indicators generally suggest a further improvement in the economic situation in most
central and eastern European EU Member States. In particular, indicators related to exports and
manufacturing have improved signifi cantly, while indicators related to domestic demand show
a more mixed picture. In the majority of countries, HICP infl ation rose somewhat in December,
moving up to 0.5% in the Czech Republic and 4.7% in Romania (year on year). In Poland,
it remained unchanged at 3.8%. Box 1 briefl y reviews the external adjustment process that is
unfolding in central and eastern Europe.

12ECB
Monthly Bulletin
January 2010
Box 1
EXTERNAL ADJUSTMENT IN CENTRAL AND EASTERN EUROPE
Since the end of 2007 several EU countries of central and eastern Europe have been experiencing
an unwinding of domestic and external imbalances, a process which was exacerbated when the
global fi nancial turmoil intensifi ed. Over the past two years most countries in the region have
seen a signifi cant fall in GDP and domestic demand, which has fostered a rapid contraction in the
sizeable current account defi cits that had prevailed in some of these countries in previous years.
This box briefl y examines the formation and subsequent unwinding of external imbalances in
this region.
In the course of their increasing integration into the world economy, most central and eastern
European countries have been going through a rapid catching-up process, accompanied by large
current account defi cits. While this is, to some extent, a normal feature of the catching-up process,
several central and eastern European countries have recorded defi cits much larger than that
which could typically be explained from an intertemporal perspective.1 In 2007 current account
defi cits amounted to more than 10% of GDP in Estonia, Lithuania and Romania and exceeded
20% of GDP in Bulgaria and Latvia, raising questions about their medium-term sustainability.
These external imbalances were generally also a refl ection of internal imbalances. In particular,
in countries with no or limited exchange rate fl exibility, relatively low interest rates fuelled
domestic credit growth and economic overheating. Accordingly, current account defi cits widened
as a result of strong domestic demand fuelling import growth, while export competitiveness was
negatively affected by rising unit labour costs.
Since the end of 2007 current and capital
account defi cits have narrowed in all of
the countries under consideration. In the
Baltic States, they even turned positive
in 2009 (see Chart A).2 The unwinding of
current account defi cits has occurred amid a
signifi cant decline in house prices and credit
growth, especially in those countries that had
previously shown strong signs of overheating.
Although the correction of the imbalances
had already started prior to the intensifi cation
of the fi nancial turmoil in September 2008,
heightened global risk aversion amplifi ed the
speed and magnitude of the adjustment and led
to a sharp contraction in economic activity and
domestic demand. The decline in activity was
particularly pronounced in the Baltic States,
1 For evidence relating to this, see M. Ca’ Zorzi, A. Chudik and A. Dieppe, “Current account benchmarks for central and eastern Europe:
a desperate search?”, Working Paper Series, No 995, ECB, 2009.
2 Please note that, for some countries, income debits in the current account entail the provisioning by loss-making foreign-owned banks.
Excluding this provisioning from the calculation would result in lower losses by foreign-owned banks, implying lower current account
surpluses.
Chart A Current and capital account balances in central and eastern Europe
(percentages of GDP)
-30
-25
-20
-15
-10
-5
0
5
10
-30
-25
-20
-15
-10
-5
0
5
10
BG
2007
2008
2009 – IMF’s World Economic Outlook projections
CZ EE LV LT HU PL RO
Sources: ECB and the IMF’s World Economic Outlook projections.

13ECB
Monthly Bulletin
January 2010
ECONOMIC AND MONETARYDEVELOPMENTS
The external
environment
of the euro area
partially because the exchange rate could not depreciate and thereby mitigate the downturn in
these countries. As the adjustment process was accompanied by a sharp contraction in global
trade, both exports and imports fell sharply in each country in the region. However, in all of the
countries under consideration, between the third quarter of 2008 and the third quarter of 2009 the
decline in imports was stronger than that of exports, in both nominal and real terms, leading to a
sharp correction of current account defi cits (see Chart B).
The magnitude of the overall current account adjustment in each of these countries seems
to have also been related to the fi nancing of the current account defi cit prior to the turmoil.
In contrast to countries in which foreign direct investment (FDI) accounted for a large proportion
of the fi nancial account, such as the Czech Republic and Poland, countries that relied more
heavily on “other investment” infl ows, such as the Baltic States, have generally experienced
a sharper contraction in their defi cits (see Chart C). Heavy net outfl ows of “other investment”
from these countries during the turmoil can be partly attributed to the global deleveraging that
stemmed from the notable increase in investors’ risk aversion and to a lower demand for credit, as
some of these countries adjusted in response to previous credit-driven domestic demand booms.
With respect to “other investment” fl ows, there are also differences between countries regarding
cross-border fl ows between banks. In some countries, such as Estonia, Hungary and Poland,
local subsidiaries received substantial liquidity support from their parent banks, which might
have played a stabilising role.
To summarise, external imbalances in several central and eastern European countries have been
undergoing strong and rapid adjustment, the speed and magnitude of which has been amplifi ed
by the effects of the turmoil. The strength of the unwinding in each country appears to have
been partly related to the magnitude of the imbalances that had been built up before the crisis.
In addition, the fi nancing structure of the current account defi cit also seems to have played a
role in the adjustment dynamics, as countries with higher FDI coverage appear to have been
relatively less vulnerable to the global turmoil.
Chart B GDP, imports and exports
(annual percentage change in the third quarter of 2009, at constant prices)
-40
-30
-20
-10
0
-40
-30
-20
-10
0
RO
importsexportsGDP
BG CZ EE LV LT HU PL
10 10
Source: ECB staff calculations.
Chart C FDI coverage of the current and capital account
(net infl ows of FDI as a percentage of the combined current and capital account)
0
50
100
150
200
0
50
100
150
200
BG
2008
average (2000-2008)
CZ EE LV LT HU PL RO
Source: ECB staff calculations.

14ECB
Monthly Bulletin
January 2010
In the second half of December, Česká národní banka and the Magyar Nemzeti Bank both cut
their main policy rate by 25 basis points to 1% and 6.25% respectively. In early January Banca
Naţională a României cut its main policy rate by 50 basis points to 7.5%.
EMERGING ASIA
The upturn in the economies of emerging Asia has also continued, driven by ongoing expansionary
fi scal and monetary policies, as well as the rise in asset market valuations partly as a result of
foreign capital infl ows. Furthermore, the most recent labour market data indicate that, in a number
of countries, the unemployment rate, which had been rising since the fourth quarter of 2008,
has started to decline. In addition, foreign trade has continued to recover. Infl ation is gradually
picking up in this region, even though annual changes in consumer prices are still low in most
countries, with India being the main exception, where (wholesale) infl ation stood at 4.8% in
November 2009.
In China, economic growth continued to be strong in the last quarter of 2009. Refl ecting the vast
number of infrastructural projects set in motion by the fi scal package and the upbeat outlook in
the real estate sector, fi xed asset investment grew by 32% in the period between January and
November 2009 relative to the same period in the previous year. With consumption continuing to
grow, strong domestic demand contributed to the rise in imports, whereas the recovery of exports
remained moderate. As a result, the trade surplus decreased by one-third in 2009 compared with
the previous year. In November the annual changes in consumer prices turned slightly positive
for the fi rst time since the beginning of 2009. While the loan stock was still 34% larger at the end
of November than a year earlier, the most recent monthly fi gures indicate that credit growth has
started to slow down.
LATIN AMERICA
In Latin America, economic activity has continued to show signs of improvement in most
countries. In Brazil, industrial production increased at an annual rate of 5.1% in November
2009, after declining by 3.1% in October. Annual CPI infl ation rose to 4.2% in November,
0.1 percentage point above the previous month. In Argentina, economic activity accelerated in
November, with industrial production increasing by 4% on an annual basis, up from 1.4% in
October. Meanwhile, CPI infl ation increased further in November, to 7.1% from 6.5% in the
previous month. In Mexico, economic activity remained weak, though showing some signs
of improvement, with industrial production contracting by 1.7% year on year in November,
compared with 5.0% in October. Meanwhile, annual infl ation continued to decline to 3.6% in
December from 3.9% in November.
1.2 COMMODITY MARKETS
At the beginning of December oil prices declined somewhat and stabilised thereafter. Since the
last week of December, as the Northern Hemisphere has experienced an unusual spell of cold
weather, oil prices have rebounded. On 13 January 2010 Brent crude oil stood at USD 78 per
barrel, which is about twice the level of that at the beginning of 2009 (see Chart 4). Looking ahead,
market participants are expecting higher oil prices in the medium term, with futures contracts for
December 2011 trading at around USD 88 per barrel.

15ECB
Monthly Bulletin
January 2010
ECONOMIC AND MONETARYDEVELOPMENTS
The external
environment
of the euro area
Looking at fundamentals, oil demand in
2009 was much stronger than expected at
the beginning of the year. The supply side
responded to the improvement in demand
conditions by increasing its output by 200,000
barrels per day in November, two-thirds of
which came from OPEC. Looking ahead, the
International Energy Agency has continued
to revise its oil demand projections for 2010
upwards. The medium-term projections for
the period 2010-14 have also been revised
upwards by almost two million barrels per
day, amid a more optimistic outlook for the
global economy.
The prices of non-energy commodities have
increased since the end of November. Increases
in aggregate food prices have been driven by
corn, wheat and sugar. Prices of non-ferrous
metals have increased across the board by
around 10-20% as a result of a strong restocking,
particularly in emerging markets. In aggregate terms, on 8 January the price index for non-energy
commodities (denominated in US dollars) was about 33% higher than at the beginning of 2009.
1.3 OUTLOOK FOR THE EXTERNAL ENVIRONMENT
Leading indicators point to stronger evidence that the global economic outlook has improved
further. The OECD’s composite leading indicator has been rising since its trough in 2009, suggesting
that economic activity is on a path of recovery in
most advanced OECD countries (see Chart 5),
as well as in major emerging economies.
This more favourable outlook is also supported
by the continued rise in consumer and business
confi dence in most OECD countries in recent
months. Moreover, equity market valuations
have risen signifi cantly worldwide, possibly
refl ecting both a noticeable easing in fi nancial
markets tensions – as signalled by falling
volatility measures across all asset classes –
and a more positive global growth outlook. The
recovery of the world economy also bodes well
for the prospects for global trade and euro area
foreign demand. At the same time, there remains
uncertainty surrounding the sustainability of the
global recovery as some of the factors sustaining
economic activity in the near term – such as the
inventory cycle and the policy stimuli measures –
are of a temporary nature.
Chart 5 OECD composite leading indicators
(monthly data; amplitude-adjusted)
90
92
94
96
98
100
102
104
106
90
92
94
96
98
100
102
104
106
2002 2004 2006 2008
OECD
emerging markets
Source: OECD.Note: The emerging market indicator is a weighted average of the composite leading indicators for Brazil, Russia and China.
Chart 4 Main developments in commodity markets
30
40
50
60
70
80
90
100
110
120
130
140
150
120
135
150
165
180
195
210
225
240
255
270
285
300
2008
Brent crude oil (USD/barrel; left-hand scale)
non-energy commodities (USD; index: 2000 = 100;
right-hand scale)
2009
Sources: Bloomberg and HWWI.

16ECB
Monthly Bulletin
January 2010
While global economic prospects remain subject to uncertainty, the risks to global activity
remain broadly balanced. On the upside, there may be stronger than anticipated effects
stemming from the extensive macroeconomic stimulus being provided and from other policy
measures taken. Confi dence may also improve further, and the global economy, as well as
foreign trade, may recover more strongly than projected. On the downside, concerns remain relating
to a stronger or more protracted than expected negative feedback loop between the real economy
and the fi nancial sector, renewed increases in oil and other commodity prices, the intensifi cation of
protectionist pressures and the possibility of disruptive market movements related to the correction
of global imbalances.

17ECB
Monthly Bulletin
January 2010
ECONOMIC AND MONETARYDEVELOPMENTS
Monetary and
financial
developments
2 MONETARY AND FINANCIAL DEVELOPMENTS
2.1 MONEY AND MFI CREDIT
The annual growth rates of M3 and MFI loans to the private sector were both negative in November 2009, having declined in parallel over a protracted period of time. This underpins the assessment that the pace of underlying monetary expansion is declining and medium-term infl ationary pressures are low. The subdued developments observed in headline M3 continue to understate the pace of underlying monetary expansion owing to the downward impact of the steep yield curve. The fact that the annual growth rate of MFI loans to the private sector remained negative in November masked an increase in the annual growth rate of loans to households, whereas the annual growth rate of loans to non-fi nancial corporations continued to decline. The pattern of growth in loans to households and non-fi nancial corporations remains consistent with business cycle regularities. The deleveraging of euro area MFIs continued in November, being driven mainly by the reduction of inter-MFI positions.
THE BROAD MONETARY AGGREGATE M3
The annual growth rate of M3 declined further
in November 2009, reaching -0.2%, down from
0.3% in October (see Chart 6). This refl ected
a third consecutive negative month-on-month
growth rate (-0.6% in November, following
-0.2% in October and -0.1% in September).
These subdued monetary dynamics continue,
to a large extent, to refl ect the current steepness
of the yield curve and the recovery observed
in the stock market and other asset classes
in recent months, both of which encourage
shifts from monetary assets into less liquid
and riskier instruments. (For more information
on the allocation behaviour of institutional
investors, see Box 2, entitled “New statistics on
euro area investment funds”.) As a result, the
decline in M3 growth overstates the decline in
underlying monetary growth. At the same time,
with the current interest rate confi guration, the
opportunity cost of holding overnight deposits
as opposed to short-term time deposits and
marketable instruments remains low. This has underpinned the substantial infl ows recorded for
overnight deposits in the course of 2009, boosting the annual growth of M1 (albeit an outfl ow was
observed for these deposits in November).
In November the annual growth rate of MFI loans to the private sector remained negative, while the
monthly fl ow was positive. Annual loan growth adjusted for the derecognition of loans (i.e. their
removal from MFI balance sheets) in the context of securitisation declined further, albeit remaining
slightly positive. The pattern of loan growth remains consistent with business cycle regularities and
appears, to a large extent, to refl ect reduced demand on the part of borrowers. MFIs’ main assets
declined further in November, and the deleveraging process continued to be driven mainly by the
reduction of MFIs’ positions vis-à-vis one another, rather than by declines in loans to the private
sector.
Chart 6 M3 growth
(percentage changes; adjusted for seasonal and calendar effects)
-2
0
2
4
6
8
10
12
14
2009
-2
0
2
4
6
8
10
12
14
M3 (annual growth rate)
M3 (three-month centred moving average
of the annual growth rate)M3 (six-month annualised growth rate)
1999 2001 2003 2005 2007
Source: ECB.

18ECB
Monthly Bulletin
January 2010
Box 2
NEW STATISTICS ON EURO AREA INVESTMENT FUNDS
For the fi rst time, this issue of the Monthly Bulletin includes harmonised statistics on the assets
and liabilities of investment funds resident in the euro area. These are available for the period
from December 2008 onwards.1 Investment funds are the most important category in the fi nancial
corporation sub-sector entitled “other fi nancial intermediaries, except insurance corporations and
pension funds” (OFIs) in the ESA 95, accounting for nearly half of total OFI assets. Alongside
insurance corporations and pension funds, investment funds play an important role in fi nancial
intermediation in the euro area and the interpretation of developments in money and credit.2
Against this background, this box indicates the main features of the new euro area investment
fund statistics,3 looks at the potential use of these statistics for monetary and fi nancial analysis
and highlights a number of characteristics observed in the new data.4
Main features of the new euro area investment fund data
The data on euro area investment funds published on a quarterly basis by the ECB between
2003 and October 2009 were not harmonised and were partly estimated. By contrast, the
statistics now available have the following features: (i) harmonised concepts that comply with
international statistical standards such as the ESA 95 and ensure a high degree of comparability;
(ii) full coverage across the euro area countries; (iii) data on transactions during the reference
period (in addition to the data available previously on outstanding amounts at the end of the
period); (iv) more detailed breakdowns of assets and liabilities (e.g. breakdowns by geographical
location and sector for issuers of debt securities and shares held by euro area investment funds, and
a breakdown by geographical location for holders of shares issued by euro area investment funds);
(v) new breakdowns for the investment fund sector, now also providing details of hedge funds and
open/closed-end funds; (vi) the publication of key information on a monthly basis and more
detailed information on a quarterly basis; and (vii) the release of data in a more timely manner
(i.e. seven weeks after the reference period, instead of fi fteen).
Use of investment fund statistics for monetary and fi nancial analysis
Detailed and timely data on investment funds can enhance the ECB’s monetary and fi nancial
analysis in several respects.
First, investment funds are fi nancial intermediaries that manage funds on behalf of other
investors. As a result, the liability side of investment funds’ balance sheet statistics provides
important information on the behaviour of resident and non-resident sectors holding investment
fund shares/units. For instance, a breakdown of purchases of investment fund shares/units by
investment policy can provide indications regarding changes in investors’ confi dence and risk
appetite. In particular, it may help to identify and quantify portfolio shifts between monetary
1 See Sections 2.9 and 2.10 of the “Euro area statistics” section.
2 See “The role of other fi nancial intermediaries in money and credit developments in the euro area”, ECB Occasional Paper No 75,
October 2007.
3 The ECB’s monthly press release on investment fund statistics also includes new information on euro area money market funds, which
are analysed in the context of MFI balance sheet statistics in view of their monetary character and are not discussed further in this box.
4 The latest data on investment funds can be downloaded from the ECB’s Statistical Data Warehouse (http://sdw.ecb.europa.eu/
browse.do?node=17066). More details regarding the latest investment fund data, together with explanatory notes, are available in the
“Statistics” section of the ECB’s website (http://www.ecb.europa.eu/stats/money/funds/html/index.en.html).

19ECB
Monthly Bulletin
January 2010
ECONOMIC AND MONETARYDEVELOPMENTS
Monetary and
financial
developments
assets and other asset classes that are driven by factors over and above changes in the relative
returns on those assets. Moreover, changes in the value of the assets held by investment funds
are transmitted through the valuation of their shares/units to the net worth of households,
non-fi nancial corporations, insurance corporations and pension funds and may then have
implications for the level of economic and fi nancial activity. In addition, the structure of the
fi nancial assets held by investment funds provides information regarding the fi nancial risks
borne indirectly by investors via their holdings of investment fund shares/units.
Second, investment funds are large institutional investors and thus infl uence capital market
developments, which can be seen from the asset side of their aggregated balance sheet. They
do so: (a) by channelling funding to other sectors – mainly MFIs, non-fi nancial corporations
and general government – through the purchase of shares and debt securities issued by these
sectors, thereby having an impact on the quantity of fi nancing available; and (b) by infl uencing
prices in capital markets. Thus, investment funds play an important role in helping various
institutional sectors to fi nance their activities and spending, while also infl uencing the price
that these sectors have to pay for external fi nancing.
Some characteristics of the euro area investment fund industry
The value of euro area investment funds’ total outstanding assets stood at €5,150 billion at the
end of the third quarter of 2009. On the basis of the euro area accounts and the new investment
fund statistics, investment funds accounted for around 10% of the assets held by the euro
area fi nancial corporation sector in the second quarter of that year (the most recent period for
which the euro area accounts data are available). By comparison, euro area MFIs’ aggregated
(non-consolidated) balance sheet accounted for 68% of such assets at the same point in time.
In the case of euro area investment funds, changes in outstanding shares/units issued have, in
the past three years, been driven more by changes in prices than by transactions (see Chart A).
This is in contrast to the MFI sector, where changes in stocks are due mainly to transactions.
This difference can be explained mainly by the fact that MFIs’ asset portfolios are dominated
by loans (which are measured at nominal
value), while those of investment funds
are dominated by securities (which are
measured at market value). At the same time,
the signifi cant net issuance observed for
shares/units in the second and third quarters
of 2009 – the proceeds of which were mainly
invested in debt securities (in the second
quarter of 2009) and shares and other equity
(in the third quarter of 2009) – suggests a
recovery in the investment fund industry
(a suggestion which is further supported
by monthly data up to and including
October 2009). This recovery follows a
prolonged period of contraction in investment
fund shares/units between the second quarter
of 2007 and the second quarter of 2009.
This is consistent with the improved market
Chart A Changes in outstanding shares/units issued by euro area investment funds
(EUR billions; quarterly data; not adjusted for seasonal effects)
-600
-400
-200
0
200
400
600
-600
-400
-200
0
200
400
600
transactions
valuation changes and other flows
2007 2008 2009
Source: ECB.
20ECB
Monthly Bulletin
January 2010
sentiment and steep yield curve observed over
recent quarters, which have fostered shifts
from safer and more liquid monetary assets
into riskier and longer-term assets.5
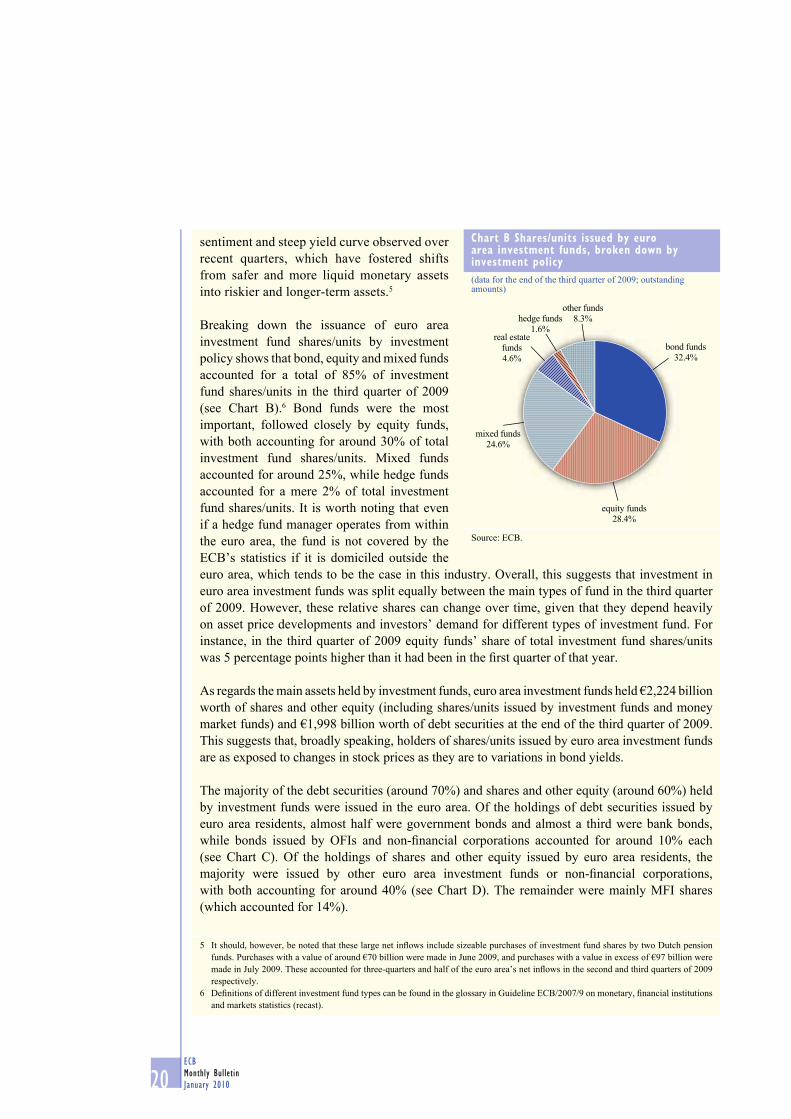
Breaking down the issuance of euro area
investment fund shares/units by investment
policy shows that bond, equity and mixed funds
accounted for a total of 85% of investment
fund shares/units in the third quarter of 2009
(see Chart B).6 Bond funds were the most
important, followed closely by equity funds,
with both accounting for around 30% of total
investment fund shares/units. Mixed funds
accounted for around 25%, while hedge funds
accounted for a mere 2% of total investment
fund shares/units. It is worth noting that even
if a hedge fund manager operates from within
the euro area, the fund is not covered by the
ECB’s statistics if it is domiciled outside the
euro area, which tends to be the case in this industry. Overall, this suggests that investment in
euro area investment funds was split equally between the main types of fund in the third quarter
of 2009. However, these relative shares can change over time, given that they depend heavily
on asset price developments and investors’ demand for different types of investment fund. For
instance, in the third quarter of 2009 equity funds’ share of total investment fund shares/units
was 5 percentage points higher than it had been in the fi rst quarter of that year.
As regards the main assets held by investment funds, euro area investment funds held €2,224 billion
worth of shares and other equity (including shares/units issued by investment funds and money
market funds) and €1,998 billion worth of debt securities at the end of the third quarter of 2009.
This suggests that, broadly speaking, holders of shares/units issued by euro area investment funds
are as exposed to changes in stock prices as they are to variations in bond yields.
The majority of the debt securities (around 70%) and shares and other equity (around 60%) held
by investment funds were issued in the euro area. Of the holdings of debt securities issued by
euro area residents, almost half were government bonds and almost a third were bank bonds,
while bonds issued by OFIs and non-fi nancial corporations accounted for around 10% each
(see Chart C). Of the holdings of shares and other equity issued by euro area residents, the
majority were issued by other euro area investment funds or non-fi nancial corporations,
with both accounting for around 40% (see Chart D). The remainder were mainly MFI shares
(which accounted for 14%).
5 It should, however, be noted that these large net infl ows include sizeable purchases of investment fund shares by two Dutch pension
funds. Purchases with a value of around €70 billion were made in June 2009, and purchases with a value in excess of €97 billion were
made in July 2009. These accounted for three-quarters and half of the euro area’s net infl ows in the second and third quarters of 2009
respectively.
6 Defi nitions of different investment fund types can be found in the glossary in Guideline ECB/2007/9 on monetary, fi nancial institutions
and markets statistics (recast).
Chart B Shares/units issued by euro area investment funds, broken down by investment policy
(data for the end of the third quarter of 2009; outstanding amounts)
bond funds
32.4%
equity funds
28.4%
mixed funds
24.6%
real estate
funds
4.6%
hedge funds
1.6%
other funds
8.3%
Source: ECB.

21ECB
Monthly Bulletin
January 2010
ECONOMIC AND MONETARYDEVELOPMENTS
Monetary and
financial
developments
MAIN COMPONENTS OF M3
The further decline observed in annual M3 growth refl ected a continuation of the weakening seen in
the annual growth rates of short-term time deposits other than overnight deposits (i.e. M2-M1) and
marketable instruments (i.e. M3-M2), whereas the annual growth rate of M1 increased somewhat.
In terms of monthly fl ows, outfl ows were recorded in November for all major sub-aggregates. While
for both short-term time deposits other than overnight deposits and marketable instruments this was
a continuation of past trends, for M1 it followed a series of strong infl ows.
Notwithstanding that monthly outfl ow, the annual growth rate of M1 increased to stand at 12.6%
in November, up from 11.8% in the previous month on account of base effects (see Table 1). That
outfl ow concealed a relatively strong infl ow for currency in circulation, which was more than offset
by the strong outfl ow observed for overnight deposits (with the latter potentially refl ecting an
unwinding of funds parked in this instrument in the course of 2009).
On the basis of the euro area accounts and the new investment fund statistics, investment
funds held around 10% and 15% of the total outstanding debt securities issued by MFIs and
non-fi nancial corporations respectively in the second quarter of 2009. They also held some 15%
of the total quoted shares issued by each of these sectors. This shows that investment funds play
a relatively important role in the provision of fi nancing to banks and fi rms.
Overall, these new data signifi cantly improve the euro area’s statistical framework with regard to
fi nancial intermediaries other than MFIs and act as an important complement to MFI statistics.
They enable, in particular, more detailed analysis of changes in investors’ behaviour and the
allocation of investment funds’ portfolios. Statistical enhancements are also under way with
regard to both fi nancial vehicle corporations engaged in securitisation transactions (which are
also part of the OFI sector) and the insurance corporation and pension fund sector.
Chart C Securities other than shares issued by euro area residents and held by investment funds, broken down by sector
(data for the end of the third quarter of 2009; outstanding amounts)
general
government
48.3%
MFIs
28.1%
OFIs
13.4%
insurance
corporations
and pension funds
0.4%
non-financial
corporations
9.8%
Source: ECB.
Chart D Shares and other equity issued by euro area residents and held by investment funds, broken down by sector
(data for the end of the third quarter of 2009; outstanding amounts)
MFIs
13.6%
investment funds
39.8%
insurance
corporations and
pension funds
1.9%
non-financial
corporations
42.0%
OFIs
(other than
investment funds)
2.7%
Source: ECB.

22ECB
Monthly Bulletin
January 2010
The annual growth rate of short-term deposits other than overnight deposits declined further to stand
at -8.6% in November, down from -7.2% in October. This refl ected further outfl ows for deposits
with an agreed maturity of up to two years (i.e. short-term time deposits), some of which continued
to be directed towards deposits redeemable at notice of up to three months (i.e. short-term savings
deposits). These developments in the various types of short-term deposit are consistent with the
relative interest rates paid on these deposits. In this respect, the fact that short-term savings deposits
are currently better remunerated than short-term time deposits may explain the infl ows consistently
observed for the former. The opportunity cost of holding overnight deposits remains low, a factor
which continues to provide incentives to move funds into this instrument (although a monthly
outfl ow was recorded in November).
The annual growth rate of marketable instruments declined further to stand at -12.9% in November,
down from -11.8% in October, with the strongest outfl ow being recorded for money market fund
shares/units. Likewise, the money-holding sector continued to drive down its holdings of MFI debt
securities with a maturity of up to two years, albeit more slowly than in the previous month.
The annual growth rate of M3 deposits – which comprise short-term deposits and repurchase
agreements and represent the broadest group of monetary assets for which a sectoral breakdown
is reported – continued to decline in November, reaching 1.0%, down from 1.4% in October.
This conceals heterogeneous developments in the various sectors: the contribution made
by households declined further, despite continuing to exceed the annual growth rate of total
M3 deposits, while the slightly positive contribution made by non-fi nancial corporations
continued to increase. The decline observed for household deposits is consistent both with the
fact that household income typically lags economic recoveries and with the shifting of funds
into longer-term assets. At the same time, the sustained accumulation of liquidity observed for
Table 1 Summary table of monetary variables
(quarterly fi gures are averages; adjusted for seasonal and calendar effects)
Outstanding amount as a
percentage of M3 1)
Annual growth rates2008
Q4 2009
Q1 2009
Q2 2009
Q3 2009 Oct.
2009Nov.
M1 47.8 2.7 5.3 8.0 12.3 11.8 12.6Currency in circulation 8.1 12.4 13.6 13.2 12.8 6.5 6.8
Overnight deposits 39.7 0.8 3.7 7.0 12.2 12.9 13.8
M2 - M1 (= other short-term deposits) 39.7 15.8 9.3 3.0 -3.1 -7.2 -8.6
Deposits with an agreed maturity
of up to two years 20.5 29.0 13.0 -0.7 -13.1 -21.6 -23.8
Deposits redeemable at notice
of up to three months 19.2 -0.5 4.5 8.6 12.8 16.2 16.3
M2 87.5 8.9 7.3 5.5 4.5 2.3 1.9M3 - M2 (= marketable instruments) 12.5 4.2 -0.7 -2.5 -7.5 -11.8 -12.9
M3 100.0 8.2 6.1 4.4 2.8 0.3 -0.2Credit to euro area residents 7.4 5.9 4.3 3.3 2.9 2.5
Credit to general government 1.7 5.6 8.4 11.5 15.2 13.3
Loans to general government 2.9 2.3 1.5 2.7 3.6 3.4
Credit to the private sector 8.6 5.9 3.5 1.6 0.5 0.4
Loans to the private sector 7.3 4.6 2.1 0.4 -0.8 -0.7
Loans to the private sector adjusted for
sales and securitisation 8.4 6.1 3.6 1.6 0.3 0.1
Longer-term fi nancial liabilities (excluding capital and reserves) 1.1 1.7 2.7 3.6 6.3 6.9
Source: ECB.1) As at the end of the last month available. Figures may not add up due to rounding.

23ECB
Monthly Bulletin
January 2010
ECONOMIC AND MONETARYDEVELOPMENTS
Monetary and
financial
developments
non-fi nancial corporations is consistent with fi rms rebuilding liquidity buffers in the wake of the crisis,
as well as with the improvement typically seen in fi rms’ cash fl ows early in an economic recovery.
MAIN COUNTERPARTS OF M3
Turning to the counterparts of M3, the annual growth rate of total MFI credit to euro area residents
was 2.5% in November, down from 2.9% in October (see Table 1). This mainly refl ected a decline
(albeit from a very high rate) in the annual growth rate of credit to the government sector, a decline
that was driven by its main component – government debt securities – and was the fi rst since the
intensifi cation of the fi nancial turmoil. The annual growth rate of credit to the private sector remained
broadly unchanged, with a positive monthly fl ow being recorded in November.
The annual growth rate of MFI loans to the private sector, the largest component of credit to the
private sector, stood at -0.7% in November, up from -0.8% in the previous month, ending a series of
declines which began in December 2007. However, the annual growth rate adjusted for the impact of
the derecognition of loans in the context of true-sale securitisation decreased further to stand at 0.1% in
November, down from 0.3% in October, despite a positive adjusted fl ow in November. Securitisation
activity has been subdued in recent months, which has led to a decline in the difference between the
unadjusted and adjusted series (with a difference of 0.8 percentage point in November, down from
1.1 percentage points in October). Looking ahead, the difference between the two series is expected
to decline signifi cantly further once the strong securitisation fl ows observed in the past (especially in
December 2008) drop out of the calculation of the annual growth rate. This muted retained securitisation
activity could be attributable to the easing of credit institutions’ demand for central bank liquidity in
view of the one-year longer-term refi nancing operations conducted by the Eurosystem.
The annual growth of loans to the private sector concealed heterogeneous developments in the
various sectors, with the increase observed in the annual growth rate of loans to households
more than compensating for the further decline recorded in the annual growth rate of loans to
non-fi nancial corporations (see Table 2). While the annual growth rate of MFI loans to non-fi nancial
corporations continued to decline (reaching -1.9% in November, down from -1.2% in October), the
Table 2 MFI loans to the private sector
(quarterly fi gures are averages; adjusted for seasonal and calendar effects)
Outstanding amount as a percentage of the
total 1)
Annual growth rates2008
Q4 2009
Q1 2009
Q2 2009
Q3 2009 Oct.
2009 Nov.
Non-fi nancial corporations 43.9 11.3 8.1 4.6 1.1 -1.2 -1.9 Up to one year 25.7 9.0 4.0 -2.6 -8.7 -11.7 -12.1
Over one and up to fi ve years 19.9 16.0 12.4 9.8 4.7 0.9 -1.2
Over fi ve years 54.4 10.8 8.8 6.8 5.3 3.8 3.6
Households 2) 45.9 2.8 1.0 0.0 -0.1 -0.1 0.5 Consumer credit 3) 12.8 3.1 1.2 -0.4 -1.0 -1.3 -1.0
Lending for house purchase 3) 71.5 2.9 0.7 -0.2 -0.3 -0.2 0.3
Other lending 15.7 2.2 1.7 1.5 1.4 1.6 2.5
Insurance corporations and pension funds 0.8 -6.7 -6.2 -2.9 -5.4 -11.9 -13.4 Other non-monetary fi nancial intermediaries 9.4 14.3 7.9 1.3 -0.0 -1.4 0.3
Source: ECB.Notes: MFI sector including the Eurosystem; sectoral classifi cation based on the ESA 95. For further details, see the relevant technical notes.1) As at the end of the last month available. Sector loans as a percentage of total MFI loans to the private sector; maturity breakdown and breakdown by purpose as a percentage of MFI loans to the respective sector. Figures may not add up due to rounding.2) As defi ned in the ESA 95.3) The defi nitions of consumer credit and lending for house purchase are not fully consistent across the euro area.

24ECB
Monthly Bulletin
January 2010
outfl ow in November was half the size of that seen in October. This negative fl ow continued to
be accounted for primarily by the substantial outfl ows recorded for loans with a maturity of up
to one year (with a somewhat smaller outfl ow being seen for loans with a maturity of between
one and fi ve years), refl ecting a reduction in the need for short-term fi nancing for working capital.
By contrast, fl ows for loans with a maturity of over fi ve years remained positive and even increased
somewhat further in November. This combination of subdued developments for short-term loans
and continued positive fl ows for loans with longer maturities could, in part, refl ect fi rms shifting
towards long-term loans in order to lock in the low level of long-term interest rates. In addition, the
declining spreads between market-based rates and those applied to bank loans have made it more
attractive for fi rms – particularly larger fi rms – to obtain market-based fi nancing.
The annual growth rate of loans to households became positive in November (standing at 0.5% in
that month, up from -0.1% in October), following four months in negative territory. This increase
refl ected both the infl ow seen in November, which continued the series of positive monthly fl ows
observed since May 2009, and the fact that the large negative fl ow recorded in November 2008
on account of strong securitisation activity dropped out of the calculation of the annual growth
rate. Developments in the annual growth rate of loans to households were again driven by the
annual growth rate of loans for house purchase, which rose to 0.3% in November, up from -0.2% in
October, although the annual growth rate of other lending also increased considerably in November.
While the recovery in the annual growth rate of loans to households appears substantially weaker
once the distortion introduced by that previous securitisation activity is taken into account, the
latest data support the view that the downward momentum of loans to households has levelled off
in recent months.
Overall, the pattern of sectoral loan developments remains consistent with business cycle
regularities: growth in loans to households tends to improve early in the economic cycle, whereas
growth in loans to non-fi nancial corporations typically lags improvements in economic activity.1
Thus, corporate borrowing is likely to remain subdued for some time – especially in an environment
that remains characterised by considerable uncertainty as regards future economic prospects.
Turning to the other counterparts of M3, the annual growth rate of MFI longer-term fi nancial
liabilities excluding capital and reserves increased further in November, reaching 6.9%, up from
6.3% in October, thereby continuing the positive trend observed since the beginning of 2009.
This further increase refl ected monthly infl ows for both longer-term deposits with an agreed
maturity of over two years (which attracted at least some of the funds fl owing out of short-term
time deposits) and longer-term MFI debt securities with a maturity of over two years as a result
of the steep yield curve. Credit institutions continued to attract longer-term funding, especially in
the form of long-term deposits from households. The annual growth rate of capital and reserves
declined further in November, reaching 6.9%, down from 7.3% in October.
Finally, the annual infl ow for MFIs’ net external asset position was €58 billion in November, down
from €62 billion in October (see Chart 7). This decline mainly refl ected a small monthly net outfl ow
(of €2 billion), with external assets and external liabilities increasing by similar amounts.
1 See Box 1, entitled “Loans to the non-fi nancial private sector over the business cycle in the euro area”, in the October 2009 issue of the
Monthly Bulletin.
25ECB
Monthly Bulletin
January 2010
ECONOMIC AND MONETARYDEVELOPMENTS
Monetary and
financial
developments
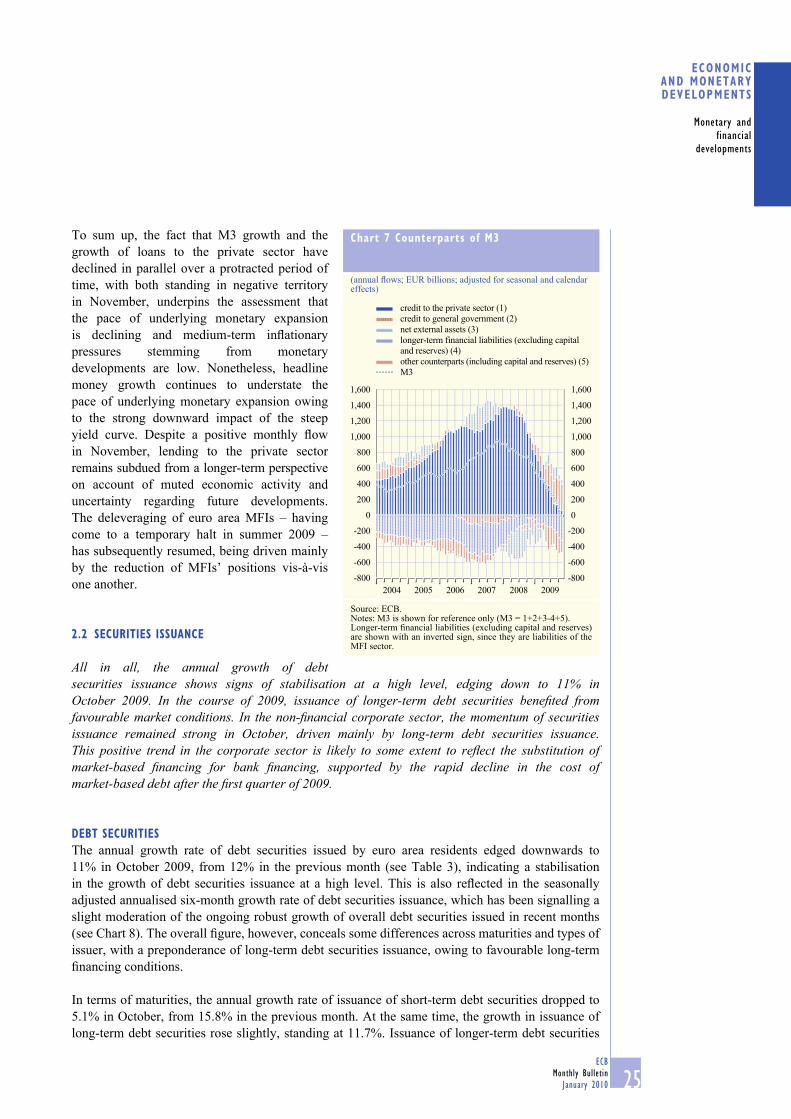
To sum up, the fact that M3 growth and the
growth of loans to the private sector have
declined in parallel over a protracted period of
time, with both standing in negative territory
in November, underpins the assessment that
the pace of underlying monetary expansion
is declining and medium-term infl ationary
pressures stemming from monetary
developments are low. Nonetheless, headline
money growth continues to understate the
pace of underlying monetary expansion owing
to the strong downward impact of the steep
yield curve. Despite a positive monthly fl ow
in November, lending to the private sector
remains subdued from a longer-term perspective
on account of muted economic activity and
uncertainty regarding future developments.
The deleveraging of euro area MFIs – having
come to a temporary halt in summer 2009 –
has subsequently resumed, being driven mainly
by the reduction of MFIs’ positions vis-à-vis
one another.
2.2 SECURITIES ISSUANCE
All in all, the annual growth of debt securities issuance shows signs of stabilisation at a high level, edging down to 11% in October 2009. In the course of 2009, issuance of longer-term debt securities benefi ted from favourable market conditions. In the non-fi nancial corporate sector, the momentum of securities issuance remained strong in October, driven mainly by long-term debt securities issuance. This positive trend in the corporate sector is likely to some extent to refl ect the substitution of market-based fi nancing for bank fi nancing, supported by the rapid decline in the cost of market-based debt after the fi rst quarter of 2009.
DEBT SECURITIES
The annual growth rate of debt securities issued by euro area residents edged downwards to
11% in October 2009, from 12% in the previous month (see Table 3), indicating a stabilisation
in the growth of debt securities issuance at a high level. This is also refl ected in the seasonally
adjusted annualised six-month growth rate of debt securities issuance, which has been signalling a
slight moderation of the ongoing robust growth of overall debt securities issued in recent months
(see Chart 8). The overall fi gure, however, conceals some differences across maturities and types of
issuer, with a preponderance of long-term debt securities issuance, owing to favourable long-term
fi nancing conditions.
In terms of maturities, the annual growth rate of issuance of short-term debt securities dropped to
5.1% in October, from 15.8% in the previous month. At the same time, the growth in issuance of
long-term debt securities rose slightly, standing at 11.7%. Issuance of longer-term debt securities
Chart 7 Counterparts of M3
(annual fl ows; EUR billions; adjusted for seasonal and calendar effects)
-800
-600
-400
-200
0
200
400
600
800
1,000
1,200
1,400
1,600
2009
-800
-600
-400
-200
0
200
400
600
800
1,000
1,200
1,400
1,600
credit to the private sector (1)
credit to general government (2)
net external assets (3)
longer-term financial liabilities (excluding capital
and reserves) (4)
other counterparts (including capital and reserves) (5)
M3
2004 2005 2006 2007 2008
Source: ECB.Notes: M3 is shown for reference only (M3 = 1+2+3-4+5).Longer-term fi nancial liabilities (excluding capital and reserves) are shown with an inverted sign, since they are liabilities of the MFI sector.

26ECB
Monthly Bulletin
January 2010
can be broken down further into securities issued at fl oating rates and those issued at fi xed rates. In
recent months, the positive trend in the issuance of fi xed rate long-term debt securities has persisted,
with the annual growth rate of such issuance surging from 5.4% at the beginning of the year to
12.7% in October 2009. At the same time, the annual growth rate of issuance of fl oating rate long-
term debt securities continued to decrease, falling to 9.6%.
Regarding sectoral issuance, the pace of debt securities issuance by non-fi nancial corporations
continued to be very high, with a 16.2% annual growth rate in October 2009. Since the beginning
of 2009, the rebound in net issuance by non-
fi nancial corporations has been driven by
long-term debt securities, particularly at fi xed
rates, which grew at an annual rate of 25.2% in
October 2009. Net issuance of short-term debt
securities, by contrast, decreased sharply, at
an annual rate of 29% in October 2009. Euro
area companies are currently taking advantage
of the signifi cant decline in the relative cost
of market-based debt fi nancing after the fi rst
quarter of 2009 in order to secure long-term
fi nancing, with corporate spreads currently
below the levels observed immediately prior
to the intensifi cation of the fi nancial crisis
in September 2008. At the same time, the
momentum of debt issuance could also partly
refl ect the tightening of terms and conditions
for obtaining bank loans.
Turning to the fi nancial sector, there was a
further slowdown in the annual growth of
debt securities issuance by MFIs, to 3.1% in
October, from 4.2% in September. It was driven
Table 3 Securities issued by euro area residents
Issuing sector
Amount outstanding (EUR billions) Annual growth rates 1)
2009October
2008Q4
2009Q1
2009Q2
2009Q3
2009September
2009October
Debt securities 14,183 7.7 10.6 12.0 11.5 12.0 11.0
MFIs 5,382 5.7 5.9 5.9 4.1 4.2 3.1
Non-monetary fi nancial corporations 2,151 23.5 30.8 32.5 28.7 27.1 26.1
Non-fi nancial corporations 793 5.2 7.8 10.3 13.3 15.3 16.2
General government 5,857 5.6 9.6 12.1 13.4 14.5 13.2
of which:
Central government 5,493 5.7 9.9 12.3 13.7 14.8 13.4
Other general government 363 3.0 6.0 9.6 9.5 10.6 10.4
Quoted shares 4,086 0.8 1.2 1.9 2.7 2.8 2.7 MFIs 568 4.9 7.2 8.7 9.4 8.4 9.0
Non-monetary fi nancial corporations 322 2.6 3.1 3.4 3.8 3.6 0.8
Non-fi nancial corporations 3,195 -0.1 0.0 0.7 1.6 1.9 1.9
Source: ECB.1) For details, see the technical notes for Sections 4.3 and 4.4 of the “Euro area statistics” section.
Chart 8 Sectoral breakdown of debt securities issued by euro area residents
(six-month annualised growth rates; seasonally adjusted)
-10
0
10
20
30
40
50
60
70
-10
0
10
20
30
40
50
60
70
1999 2001 2003 2005 2007 2009
total
monetary financial institutions
non-monetary financial corporations
non-financial corporations
general government
Source: ECB.

27ECB
Monthly Bulletin
January 2010
ECONOMIC AND MONETARYDEVELOPMENTS
Monetary and
financial
developments
by a rapid decline in the annual growth rate of
short-term debt securities issued, which reached
-8.4% in October, while the annual growth of
long-term debt securities issuance stabilised at
around 5%.
Similarly, the annual growth rate of debt
securities issued by non-monetary fi nancial
institutions declined to 26.1% in October 2009
due to a sharp contraction in issuance of
short-term debt. The issuance activity of
non-monetary fi nancial institutions, as for
other types of issuers, continued to focus on
longer-term maturities.
Finally, the annual growth of debt securities
issued by the general government sector
remained strong, but declined in comparison
with the previous month, to stand at 13.4% in
October 2009. A sharp drop in the annual growth
rate of short-term debt securities issuance was
partly offset by a rise in the annual growth rate
of longer-term debt securities issued. The strong momentum in the issuance of government debt
securities refl ects the persistently substantial funding needs of the euro area public sector.
QUOTED SHARES
The annual growth rate of quoted shares issued by euro area residents remained unchanged at 2.7%
in October 2009 (see Chart 9). The annual growth rate of equity issuance by MFIs remained high
at 9.5%, refl ecting continued efforts on the part of many euro area banks to strengthen their balance
sheets by bolstering their capital bases. Another notable feature was the annual growth rate of quoted
shares issued by non-fi nancial corporations, which rose further to 1.9% in October 2009, possibly
fostered by increased confi dence and positive stock market developments in recent months.
2.3 MONEY MARKET INTEREST RATES
The money market yield curve steepened slightly in December 2009 and early January 2010 as a result of a moderate decline in short-term rates. This refl ected the continued ample liquidity conditions in the euro area, particularly following the allotment of the fi nal one-year longer-term refi nancing operation on 16 December 2009. That operation was conducted by means of a tender procedure with full allotment at a rate fi xed at the average minimum bid rate in the main refi nancing operations over the life of the operation. The Eurosystem also continued to conduct outright purchases of covered bonds in the context of the covered bond purchase programme that began on 6 July 2009.
Unsecured money market rates were broadly stable in December 2009 and early January 2010.
On 13 January the one-month, three-month, six-month and twelve-month EURIBOR stood at
0.44%, 0.68%, 0.98% and 1.24% respectively. The one-month and three-month EURIBOR were
slightly lower than the levels observed on 2 December, having both declined by 4 basis points,
Chart 9 Sectoral breakdown of quoted shares issued by euro area residents
(annual growth rates)
-4.0
-2.0
0.0
2.0
4.0
6.0
8.0
10.0
12.0
-4.0
-2.0
0.0
2.0
4.0
6.0
8.0
10.0
12.0
2009
totalmonetary financial institutionsnon-monetary financial corporationsnon-financial corporations
1999 2001 2003 2005 2007
Source: ECB.Note: Growth rates are calculated on the basis of fi nancial transactions.

28ECB
Monthly Bulletin
January 2010
while the six-month and twelve-month EURIBOR were broadly unchanged. As a result, the slope
of the money market yield curve steepened slightly, with the spread between the twelve-month and
one-month EURIBOR standing at 80 basis points on 13 January – up 4 basis points from the level
observed on 2 December (see Chart 10).
Between 2 December 2009 and 13 January 2010 the secured money market rate derived from the
three-month EONIA swap index declined more than the corresponding EURIBOR, resulting in an
increase of 3 basis points in the spread between the unsecured and secured rates. This spread stood
at 31 basis points on 13 January, compared with 28 basis points on 2 December.
The interest rates implied by the prices of three-month EURIBOR futures contracts maturing in
March, June, September and December 2010 declined to stand at 0.700%, 0.980%, 1.300% and
1.595% respectively on 13 January. The rates implied by contracts maturing in the fi rst half of the
year (which were 17 and 19 basis points lower than their levels on 2 December) declined more than
those implied by contracts maturing in the second half of the year (which were 16 and 14 basis
points lower).
The EONIA was broadly stable in December and early January. It remained at levels around
10 basis points above the deposit facility rate of 0.25% (see Chart 11), with the exception of
7, 30 and 31 December. The fi rst of these dates was the fi nal day of the eleventh maintenance
period of the year, when the EONIA rose to 0.64% as a result of the Eurosystem conducting
a liquidity-absorbing fi ne-tuning operation by means of a variable rate tender procedure.
The operation absorbed €129.7 billion, with a maximum rate of 1.00%, a marginal rate of 0.76%
and a weighted average rate of 0.74%. On the last two days of December the EONIA temporarily
rose to 0.41%, refl ecting end-of-year effects. On 13 January the EONIA stood at 0.33%.
Chart 10 Money market interest rates
(percentages per annum; spread in percentage points; daily data)
-2.0-1.5-1.0-0.50.00.51.01.52.02.53.03.54.04.55.05.56.0
0.0
0.5
1.0
1.5
2.0
2.5
3.0
3.5
4.0
one-month EURIBOR (left-hand scale)three-month EURIBOR (left-hand scale)twelve-month EURIBOR (left-hand scale)spread between twelve-month and one-month EURIBOR (right-hand scale)
Sep. Nov. Jan. Sep. Nov. Jan.Mar. May July2008 2009 2010
Sources: ECB and Reuters.
Chart 11 ECB interest rates and the overnight interest rate
(percentages per annum; daily data)
0.0
0.5
1.0
1.5
2.0
2.5
3.0
3.5
4.0
0.0
0.5
1.0
1.5
2.0
2.5
3.0
3.5
4.0
2009 2010
fixed rate in the main refinancing operations
interest rate on the deposit facility
overnight interest rate (EONIA)
interest rate on the marginal lending facility
Jan. Jan.Mar. May July Sep. Nov.
Sources: ECB and Reuters.

29ECB
Monthly Bulletin
January 2010
ECONOMIC AND MONETARYDEVELOPMENTS
Monetary and
financial
developments
Having steadily declined to stand at €651 billion in the fi rst half of December, the volume of
outstanding open market operations rose to €776 billion by the end of the year on account of both
the settlement of the fi nal one-year longer-term refi nancing operation (LTRO) on 17 December and
the larger main refi nancing operation covering the end of the year. The liquidity provided in all other
operations – particularly LTROs – declined in December as counterparties reduced their demand
ahead of the one-year LTRO. Overall, the term structure of liquidity remained unchanged, with the
main refi nancing operations accounting for around 8% of total outstanding liquidity on 13 January.
In the main refi nancing operations conducted on 1, 7, 15, 22 and 29 December and 5 January the
ECB allotted €58.1 billion, €55.8 billion, €52.9 billion, €58.6 billion, €78.6 billion and €54.0 billion
respectively. As regards longer-term operations, the ECB conducted three special LTROs in
December with maturities of one, three and six months, as well as one regular three-month LTRO.
The ECB allotted €2.7 billion in the special one-month LTRO on 7 December, and €2.9 billion and
€1.7 billion respectively in the special three and six-month LTROs on 9 December. In the regular
three-month LTRO on 16 December the ECB allotted €2.6 billion. On the same day, the ECB
allotted €96.9 billion in the fi nal one-year LTRO at a rate fi xed at the average minimum bid rate
in the main refi nancing operations over the life of the operation. The amount allotted exceeded the
€75.2 billion in the second one-year LTRO on 30 September 2009, but was signifi cantly lower than
the €442.2 billion in the fi rst one-year LTRO on 24 June 2009. The one-year LTROs in June and
September were conducted at the fi xed rate in the main refi nancing operations.
In line with the increase in the liquidity surplus in the euro area money market following the
settlement of the fi nal one-year LTRO, average daily recourse to the deposit facility rose to stand at
€138.7 billion in the period from 9 December to 13 January – up from €65.7 billion in the previous
maintenance period, which ended on 8 December.
December and early January also saw the Eurosystem continue to provide US dollar funding in
one-week operations against collateral eligible for Eurosystem operations, as well as Swiss franc
funding in one-week swap operations.
The covered bond purchase programme that began on 6 July 2009 has also proceeded further.
The total value of purchases of euro-denominated covered bonds issued in the euro area stood at
€29.6 billion on 13 January – i.e. almost half of the €60 billion worth of bonds set to be purchased
by the end of June 2010.
2.4 BOND MARKETS
Yields on long-term euro area government bonds increased slightly from the end of November 2009 to early January 2010, partly on account of some further improvements in the macroeconomic outlook. Long-term US government bond yields increased more sharply. Apart from improved macroeconomic conditions, this increase probably also refl ected some concerns about the potential impact of the strongly increasing effective supply of US bonds on yields. Infl ation expectations for the euro area derived from infl ation-linked bonds increased somewhat, but this appeared to be attributable mainly to non-fundamental demand factors, which affected the infl ation-linked bond market over the period under review. Euro area corporate bond spreads continued to decline across all rating categories in December and early January.

30ECB
Monthly Bulletin
January 2010
Compared with end-November 2009, ten-year government bond yields in the euro area increased by
around 10 basis points to stand at around 3.5% on 13 January 2010 (see Chart 12). In the United States,
ten-year government bond yields increased by around 60 basis points to stand at around 3.8% on
13 January. Accordingly, the interest rate differential between ten-year nominal US and euro area
government bonds changed sign to stand at 30 basis points. The modest increase in long-term
euro area government bond yields appears to mainly refl ect the further improvements in the
macroeconomic outlook observed over the period under review. The more pronounced increases
in ten-year government bond yields in the United States seem likewise to refl ect a continuation of
positive macroeconomic news, as well as investor concerns about the potential impact on yields
of the expected sharp increase in the effective supply of US Treasury securities to be absorbed by
investors in 2010 and beyond. Implied bond market volatility increased slightly in the euro area, and
somewhat more in the United States, following the larger movements in US yields.
With the exceptions of Greece and Portugal, intra-euro area sovereign bond spreads vis-à-vis
Germany remained either broadly unchanged or declined slightly in the period under review.
In December and early January, credit default swap (CDS) spreads edged up somewhat across most
euro area countries, partly in response to the downgrading of Greek sovereign debt by several rating
agencies.
Yields on fi ve-year infl ation-linked euro area government bonds declined by around 5 basis points
to stand at around 0.6% on 13 January, and ten-year real yields remained broadly unchanged at
1.4% (see Chart 13). In turn, the real fi ve-year forward yield fi ve years ahead rose slightly to stand
at 2.2%. Although the improvement in the macroeconomic outlook over the review period probably
exerted some upward pressure on real yields, this appears to have been offset by a temporary
Chart 12 Long-term government bond yields
(percentages per annum; daily data)
2.50
3.00
3.50
4.00
4.50
1.50
2.00
2.50
3.00
3.50
euro area (left-hand scale)
United States (left-hand scale)
Japan (right-hand scale)
2.00 1.00
Jan.2009
Mar. May July Sep. Nov. Jan.2010
Sources: Bloomberg and Reuters.Note: Long-term government bond yields refer to ten-year bonds or to the closest available bond maturity.
Chart 13 Euro area zero coupon inflation-linked bond yields
(percentages per annum; fi ve-day moving averages of daily data; seasonally adjusted)
0.0
0.5
1.0
1.5
2.0
2.5
3.0
0.0
0.5
1.0
1.5
2.0
2.5
3.0
five-year forward inflation-linked bond yield
five years ahead
five-year spot inflation-linked bond yieldten-year spot inflation-linked bond yield
Jan. Jan.Mar. May July Sep. Nov.2009 2010
Sources: Reuters and ECB calculations.

31ECB
Monthly Bulletin
January 2010
ECONOMIC AND MONETARYDEVELOPMENTS
Monetary and
financial
developments
increase in the demand for highly rated infl ation-linked bonds that is largely unrelated to changes in
expectations about future infl ation.
Infl ation expectations derived from infl ation-linked bonds increased somewhat in the
euro area from the end of November 2009 to early January 2010. On 13 January the
fi ve-year and ten-year spot break-even infl ation rates stood at 1.9% and 2.3% respectively,
up somewhat from the levels observed at the end of November (see Chart 14). The implied
fi ve-year forward break-even infl ation rate fi ve years ahead increased by 20 basis points to stand at
2.7%. The most recent volatility and upward movement of long-term forward break-even infl ation
rates appear, however, to mainly refl ect the above-mentioned non-fundamental factors, which
affected the infl ation-linked bond market over the period under review.
The term structure of forward rates in the euro area shows how the overall behaviour of long-term
yields in the euro area can be decomposed into changes in interest rate expectations (and related risk
premia) at different horizons (see Chart 15). The implied forward overnight interest rate curve for
euro area government bonds shifted up slightly at medium to longer-term maturities in comparison
with the situation at the end of November.
As regards corporate bond markets, spreads continued to narrow across all rating classes and for
both fi nancial and non-fi nancial fi rms, especially in early January. This refl ected the improving
expectations regarding the future economic outlook, increased risk appetite among investors and
Chart 14 Euro area zero coupon break-even inflation rates
(percentages per annum; fi ve-day moving averages of daily data; seasonally adjusted)
0.8
1.2
1.6
2.0
2.4
2.8
3.2
0.8
1.2
1.6
2.0
2.4
2.8
3.2
Jan. Mar. May
2009 2010
July Sep. Nov. Jan.
five-year forward break-even inflation rate
five years ahead
five-year spot break-even inflation rate
ten-year spot break-even inflation rate
Sources: Reuters and ECB calculations.
Chart 15 Implied forward euro area overnight interest rates
(percentages per annum; daily data)
0.0
1.0
2.0
3.0
4.0
5.0
6.0
0.0
1.0
2.0
3.0
4.0
5.0
6.0
20192009 2011 2013 2015 2017
13 January 2010
30 November 2009
Sources: ECB, EuroMTS (underlying data) and Fitch Ratings (ratings).Notes: The implied forward yield curve, which is derived from the term structure of interest rates observed in the market, refl ects market expectations of future levels for short-term interest rates. The method used to calculate these implied forward yield curves is outlined in the “Euro area yield curve” section of the ECB’s website. The data used in the estimate are euro area AAA-rated government bond yields.

32ECB
Monthly Bulletin
January 2010
lower uncertainty, as measured by implied stock market volatility. In the euro area, covered bond
spreads generally remained broadly stable throughout the period under review.
2.5 INTEREST RATES ON LOANS AND DEPOSITS
All in all, developments in MFI loan and deposit rates in November 2009 pointed towards stabilisation at historically low levels. Some of the rates on loans to non-fi nancial corporations increased slightly in that month, while most of the rates on loans to households continued the decline recorded in previous months, although they remained somewhat above the lows observed in 2005 in most cases. Overall, these developments suggest that euro area banks continued to pass on the reduction in key ECB policy rates that has taken place since October 2008, broadly in line with historical pattern.
Short-term MFI interest rates on loans to, and deposits from, households declined or remained
unchanged in November 2009, whereas short-term MFI interest rates on loans to non-fi nancial
corporations increased slightly (see Chart 16), with deposit rates broadly unchanged.
In November 2009, for instance, the average rates on households’ overdrafts and the short-term
rates on loans to households for house purchase decreased by 8 and 6 basis points respectively
(to 9.0% and 2.7% respectively), the lowest
levels recorded since 2003 in both cases. The
more volatile short-term rates on loans for
consumption declined to 7.0%, a drop of 29 basis
points, but remained above the historical average
since 2003. Whereas banks’ rates on overdrafts
for non-fi nancial corporations fell by another 6
basis points to reach 4.1% in November 2009,
short-term rates on large loans to non-fi nancial
corporations increased by 9 basis points, to 2.2%.
Short-term rates on small loans to non-fi nancial
corporations remained broadly unchanged
around their historical lows at 3.3%.
Given that the three-month EURIBOR declined
by 2 basis points in November 2009, the spreads
between short-term MFI interest rates and
the three-month money market rate declined
somewhat for loans to households, while it
increased for loans to non-fi nancial corporations
(see Chart 17). Overall, these developments
suggest that the pass-through of the reduction in
key ECB policy rates that has taken place since
October 2008 is close to coming to an end.
Taking a longer-term perspective, between
September 2008 (i.e. immediately prior to
the beginning of the cycle of monetary policy
Chart 16 Short-term MFI interest rates and a short-term market rate
(percentages per annum; rates on new business)
0.0
1.0
2.0
3.0
4.0
5.0
6.0
7.0
8.0
9.0
10.0
0.0
1.0
2.0
3.0
4.0
5.0
6.0
7.0
8.0
9.0
10.0
2003 2004 2005 2006 2007 2008 2009
deposits from households redeemable at notice
of up to three months
deposits from households with an agreed maturity
of up to one year
overnight deposits from non-financial corporationsloans to households for consumption with a
floating rate and an initial rate fixation of up to one year
loans to households for house purchase with a
floating rate and an initial rate fixation of up to one year
loans to non-financial corporations of over €1 million
with a floating rate and an initial rate fixation of
up to one year
three-month money market rate
Source: ECB.

33ECB
Monthly Bulletin
January 2010
ECONOMIC AND MONETARYDEVELOPMENTS
Monetary and
financial
developments
easing) and November 2009, short-term rates on both loans to households for house purchase and
loans to non-fi nancial corporations have declined by some 300 to 340 basis points. This compares
with a decline of 430 basis points in the three-month EURIBOR and indicates a considerable
pass-through of market rate changes to bank lending rates. The typically more “sticky” rates on
bank overdrafts and short-term consumer loans have been adjusted to a far lesser extent over the
same period.
Taking into account concerns regarding borrowers’ balance sheets and uncertainty on borrowers’
income and ability to service their debts, which are raising credit risk premia, reductions in policy
rates appear to have been feeding through to retail lending and deposit rates with a degree of inertia
broadly similar to that observed in the past.
Turning to MFI loans with longer initial rate fi xation periods, the rates on loans to households for
house purchase with a rate fi xation period of between fi ve and ten years were unchanged at 4.5%
in November 2009 (see Chart 18). Average rates on small loans to non-fi nancial corporations
with over fi ve years’ rate fi xation declined further, by 8 basis points to 4.1%. At the same time,
the rates on large loans to non-fi nancial corporations with over fi ve years’ rate fi xation increased
by 15 basis points (to 3.80%) in November 2009, after having reached their lowest level since
2003 in the previous month.
Chart 17 Spreads of short-term MFI interest rates vis-à-vis the three-month money market rate
(percentage points; rates on new business)
-1.0
-0.5
0.0
0.5
1.0
1.5
2.0
2.5
-1.0
-0.5
0.0
0.5
1.0
1.5
2.0
2.5
2003 2004 2005 2006 2007 2008 2009
loans to non-financial corporations of over
€1 million with a floating rate and an initial rate
fixation of up to one year
loans to households for house purchase with a floating
rate and an initial rate fixation of up to one year
deposits from households with an agreed maturity
of up to one year
Source: ECB.Notes: For the loans, the spreads are calculated as the lending rate minus the three-month money market rate. For the deposits, the spread is calculated as the three-month money market rate minus the deposit rate.
Chart 18 Long-term MFI interest rates and a long-term market rate
(percentages per annum; rates on new business)
2.5
3.0
3.5
4.0
4.5
5.0
5.5
6.0
2.5
3.0
3.5
4.0
4.5
5.0
5.5
6.0
deposits from non-financial corporations with an agreed maturity of over two yearsdeposits from households with an agreed maturity of over two yearsloans to non-financial corporations of over €1 millionwith an initial rate fixation of over five yearsloans to households for house purchase with an initial rate fixation of over five and up to ten yearsseven-year government bond yield
2.0 2.02003 2004 2005 2006 2007 2008 2009
Source: ECB.

34ECB
Monthly Bulletin
January 2010
Viewed from a longer-term perspective, between September 2008 and November 2009, euro area
banks adjusted their rates on long-term loans to non-fi nancial corporation more or less in line
with the decline in long-term government bond yields. By contrast, longer-term rates on loans to
households for house purchase have not fallen as much over this period, most probably refl ecting
an incomplete and more sluggish pass-through, in the absence of alternative fi nancing sources for
households, as well as concerns about credit risk and the value of housing collateral.
Euro area banks’ profi tability depends, among other things, on loan-deposit margins on both
outstanding amounts and new business. The former measure remained broadly unchanged between
October and November 2009. The latter, however, edged up by 22 basis points (to 2.2%), but
remained below the average recorded since 2003.
2.6 EQUITY MARKETS
Euro area and US stock prices continued to rise in December 2009 and early January 2010. At the same time, implied stock market volatility decreased noticeably on both sides of the Atlantic. Overall, stock prices were supported by the release of generally positive economic news in major markets, by upward revisions of earnings expectations over the period under review and by a further increase in risk appetite at the beginning of the new year. In the euro area, expected growth in earnings per share 12 months ahead improved further in December 2009, refl ecting upgraded expectations for both the fi nancial and the non-fi nancial sector.
In December 2009 and early January 2010, stock price indices in the euro area and the United States
continued the upward trend that had established itself since March 2009. In the early part of the
period under review, non-fi nancial stock prices performed somewhat better than those of fi nancial
fi rms, which had previously led the recovery in stock prices. Towards the end of the review period,
however, the upward momentum became more broad-based and stocks in most economic sectors
recorded robust gains. Euro area stock prices, as measured by the Dow Jones EURO STOXX index,
and US stock prices, as measured by the Standard & Poor’s 500 index, increased by 6.8% and 4.6%
respectively between the end of November 2009 and 13 January 2010 (see Chart 19). Over the
same period, stock prices in Japan, as measured by the Nikkei 225 index, rose even more sharply by
about 15%, after the signifi cant decline in preceding months. Short-term stock market uncertainty,
as measured by implied volatility, declined further to stand below the lowest levels observed
throughout 2009 in early January 2010 (see Chart 20).
For euro area listed companies, the growth of actual earnings per share remained depressed in
December 2009. The actual earnings per share of fi rms covered by the Dow Jones EURO STOXX
index declined by 36%, a slight improvement in comparison with November. A more marked
improvement was observed in the expected growth of earnings per share 12 months ahead, which
was forecast to improve to 30%, from 22% in November. The improvement in expected earnings
per share has been sustained since the beginning of the third quarter of 2009.
The robust increases in euro area stock prices over the period under review refl ected the continued
release of better-than-expected macroeconomic data, which prompted some market participants to
revise the growth prospects for the major economies further upwards. Moreover, the turn of the year
has seen a further increase in risk appetite among institutional investors, as refl ected in generally
broad-based gains for risky assets, including lower-grade corporate debt and commodities.

35ECB
Monthly Bulletin
January 2010
ECONOMIC AND MONETARYDEVELOPMENTS
Monetary and
financial
developments
Taking a somewhat longer perspective, the rather swift and broad-based increase in the prices of
risky assets since March 2009 appears so far to have been mainly a correction of previous sharp
declines in prices. Further sharp asset price appreciation at this point could however increase the
risk of abrupt future market corrections.
Chart 20 Implied stock market volatility
(percentages per annum; fi ve-day moving average of daily data)
10
15
20
25
30
35
40
45
50
55
60
10
15
20
25
30
35
40
45
50
55
60
euro area
United States
Japan
Jan. Mar. May July Sep. Nov. Jan.
2009 2010
Source: Bloomberg.Notes: The implied volatility series refl ects the expected standard deviation of percentage changes in stock prices over a period of up to three months, as implied in the prices of options on stock price indices. The equity indices to which the implied volatilities refer are the Dow Jones EURO STOXX 50 for the euro area, the Standard & Poor’s 500 for the United States and the Nikkei 225 for Japan.
Chart 19 Stock price indices
(index: 1 January 2009 = 100; daily data)
70
80
90
100
110
120
130
70
80
90
100
110
120
130
euro area
United States
Japan
Jan. Mar. May July Sep. Nov. Jan.2009 2010
Sources: Reuters and Thomson Financial Datastream.Note: The indices used are the Dow Jones EURO STOXX broad index for the euro area, the Standard & Poor’s 500 index for the United States and the Nikkei 225 index for Japan.

36ECB
Monthly Bulletin
January 2010
According to Eurostat’s fl ash estimate, annual HICP infl ation increased further in December to stand at 0.9%, up from 0.5% in November. The December outcome was in line with expectations and mainly refl ected global energy price movements a year ago. Near-term developments in annual HICP infl ation continue to be heavily infl uenced by upward base effects stemming from past changes in food and energy prices. At the same time, economic fundamentals, such as modest consumer demand and lower labour cost growth are projected to weigh down on developments in HICP infl ation. All in all, annual HICP infl ation is expected to stay close to 1% in early 2010 and to remain subdued over the medium term as a result of the expected slow recovery in demand in the euro area and elsewhere, thereby supporting the purchasing power of euro area households. It is important to emphasise that infl ation expectations over the medium to longer term remain fi rmly anchored in line with the Governing Council’s aim of keeping infl ation rates below, but close to 2% over the medium term. Risks to the infl ation outlook remain broadly balanced.
3.1 CONSUMER PRICES
Euro area annual HICP infl ation stood at 0.9% in December, up from 0.5% in November, according
to Eurostat’s fl ash estimate (see Table 4). Offi cial estimates of the breakdown of the December
HICP have not yet been published, but it is known that the December outcome was affected by
a sizeable upward base effect in the energy component that stemmed from the drop in global oil
prices 12 months earlier.
Looking at HICP developments at the sectoral level, the year-on-year change in the energy
component moved sharply to -2.4% in November 2009, the last month for which breakdown
data are available, from -8.5% in October. This partly emanated from a strong upward base effect
related to last year’s oil price changes. In addition, energy prices rose in month-on-month terms
in November 2009, mainly owing to increases in the prices of fuel and lubricants for personal
transportation.
The annual rate of change in the unprocessed food component of the euro area HICP stood at
-1.3% in November, up from -1.6% in October. This largely refl ected a base effect stemming
from developments in fruit and vegetable prices, which are usually volatile as they are infl uenced
3 PRICES AND COSTS
Table 4 Price developments
(annual percentage changes, unless otherwise indicated)
2008 2009 2009July
2009Aug.
2009Sep.
2009Oct.
2009Nov.
2009Dec.
HICP and its componentsOverall index 1) 3.3 . -0.7 -0.2 -0.3 -0.1 0.5 0.9
Energy 10.3 . -14.4 -10.2 -11.0 -8.5 -2.4 .
Unprocessed food 3.5 . -1.1 -1.2 -1.3 -1.6 -1.3 .
Processed food 6.1 . 0.8 0.6 0.5 0.3 0.5 .
Non-energy industrial goods 0.8 . 0.5 0.6 0.5 0.3 0.2 .
Services 2.6 . 1.9 1.8 1.8 1.8 1.6 .
Other price indicatorsIndustrial producer prices 6.1 . -8.4 -7.5 -7.6 -6.6 -4.5 .
Oil prices (EUR per barrel) 65.9 44.6 46.5 51.1 46.9 49.8 52.1 51.6
Non-energy commodity prices 2.1 -18.6 -22.9 -16.4 -17.0 -7.3 -0.9 18.4
Sources: Eurostat, ECB and ECB calculations based on Thomson Financial Datastream data.Note: The non-energy commodity price index is weighted according to the structure of euro area imports in the period 2004-06.1) HICP infl ation in December 2009 refers to Eurostat’s fl ash estimate.

37ECB
Monthly Bulletin
January 2010
ECONOMIC AND MONETARYDEVELOPMENTS
Prices and
costs
by weather conditions. At the same time, the dynamics in unprocessed food prices over recent
months have been heavily affected by a slowdown in the annual growth rate of meat prices.
The unwinding of last year’s food commodity price shock has also reduced the annual rate of
change in processed food prices over recent months. In November, however, it increased slightly to
0.5%, indicating some tentative stabilisation. Nevertheless, strong competition in food retailing and
weak consumer demand are still exerting downward pressures on processed food prices.
Excluding all food and energy items, or about 30% of the HICP basket, HICP infl ation decreased
by 0.2 percentage point to 1.0% in November. This refl ected a slight decline in the annual rate of
change in non-energy industrial goods prices and a further drop in services price infl ation.
The annual rate of change in non-energy industrial goods prices slowed down further to 0.2%
in November, from 0.3% in October. The annual rate of change in non-energy industrial goods
prices has thus continued its slight downward trend observed over the past year. This has been
driven primarily by durable goods, mainly cars, and to a lesser extent by the semi-durable goods
sub-component, which mainly mirrors movements in the prices of clothing and footwear.
Services price infl ation decreased to 1.6% in November, from 1.8% in October, reaching its lowest
rate since November 2000. The declining trend in this component of HICP in 2009 was mainly
driven by the downward adjustment in the prices of items related to leisure travel, which has been
affected by the weak economic environment and depressed demand.
According to the European Commission’s Consumer Survey, euro area consumers’ infl ation
perceptions and expectations rose again in December, indicating a further stabilisation of infl ation
sentiment. This stabilisation trend is likely to continue over the coming months.
Chart 21 Breakdown of HICP inflation: main components
(annual percentage changes; monthly data)
2009
-3
-2
-1
0
1
2
3
4
5
-15
-10
-5
0
5
10
15
20
25
total HICP (left-hand scale)
unprocessed food (left-hand scale)
energy (right-hand scale)
2004 2005 2006 2007 2008 2009
-1
0
1
2
3
4
-2
0
2
4
6
8
total HICP excluding energy and unprocessed food
(left-hand scale)
processed food (right-hand scale)
non-energy industrial goods (left-hand scale)
services (left-hand scale)
2004 2005 2006 2007 2008
Source: Eurostat.

38ECB
Monthly Bulletin
January 2010
3.2 INDUSTRIAL PRODUCER PRICES
The annual rate of change in industrial producer prices (excluding construction) rose in November
to -4.4%, from -6.6% in October. While this moderation was broadly based, it was driven by the
energy and intermediate goods components. The annual rate of change in the energy component
moved up to -8.7% in November, from -14.2% in October, mainly on account of positive base
effects. Similarly, the annual rate of change in intermediate goods prices increased from -6.4% in
October to -5.0% in November, mainly as a consequence of base effects.
At the latter stages of the production chain, the annual rate of change in capital goods prices
remained stable, while the annual growth rate of consumer goods prices, which broadly follow
the food component, increased in November. The annual growth rates of the two components are,
however, still in negative territory. Looking ahead, it is likely that the past few months’ increases
in energy and intermediate goods prices will be passed on to capital and consumer goods prices.
The pace and magnitude of such a pass-through is, however, uncertain.
Survey data on the price-setting behaviour of fi rms over recent months have indicated that downward
price pressures are moderating (see Chart 23). With regard to the Purchasing Managers’ Index
(PMI), the input price index for manufacturing and the services sector rose further in December.
The readings stood above the 50 threshold for both sectors, indicating rising input prices, possibly
linked to higher commodity prices. Likewise, indices of prices charged in the manufacturing and
services sectors also rose, but remained below the 50 threshold. These developments indicate that,
while companies are still offering discounts to stimulate sales of goods and services in the face of
weak underlying demand, pressures for further downward price movements are moderating.
Chart 22 Breakdown of industrial producer prices
(annual percentage changes; monthly data)
-10
-8
-6
-4
-2
0
2
4
6
8
10
-25
-20
-15
-10
-5
0
5
10
15
20
25
total industry excluding construction (left-hand scale)
intermediate goods (left-hand scale)
capital goods (left-hand scale)
consumer goods (left-hand scale)
energy (right-hand scale)
2004 2005 2006 2007 2008 2009
Sources: Eurostat and ECB calculations.
Chart 23 Producer input and output price surveys
(diffusion indices; monthly data)
20
30
40
50
60
70
80
20
30
40
50
60
70
80
manufacturing; input prices
manufacturing; prices charged
services; input prices
services; prices charged
2004 2005 2006 2007 2008 2009
Source: Markit.Note: An index value above 50 indicates an increase in prices, whereas a value below 50 indicates a decrease.

39ECB
Monthly Bulletin
January 2010
ECONOMIC AND MONETARYDEVELOPMENTS
Prices and
costs
3.3 LABOUR COST INDICATORS
Labour cost indicators that have become available
since the previous issue of the Monthly Bulletin
suggest lower labour cost growth. On the whole,
the drop in annual labour cost growth in the
third quarter of 2009 refl ected both lower wage
growth per hour and fewer hours worked.
Developments in these two variables have
caused some differences in the behaviour of
the annual rates of growth in negotiated wages,
compensation per employee and hourly labour
costs (see Chart 24 and Table 5).
The annual rate of growth in negotiated wages
in the euro area fell from 2.8% in the second
quarter of 2009 to 2.3% in the third quarter. This
substantial decline is likely to be a consequence
of the sharp downturn in economic activity,
the persistent increase in unemployment
and the signifi cant drop in infl ation.
As negotiated wages capture settled wage
increases through concluded collective agreements, this indicator tends to react to changes in
economic conditions with a time-lag. Available information signals that the annual rate of growth
in negotiated wages may have slowed further in the fourth quarter of 2009.
The annual growth rate of compensation per employee decelerated further to 1.4% in the
third quarter of 2009, from 1.6% one quarter earlier. The additional moderation in the annual growth
rate of this indicator resulted from lower wage growth per hour, shorter working hours and cuts in
fl exible pay elements. The sectoral decomposition indicates that the deceleration was mainly driven
by the market services component (see Chart 25).
Consistent with the recent slowdown in growth in negotiated wages and compensation per employee,
hourly labour costs also declined in the third quarter to 3.2%, down from 4.3% in the second quarter
of the year. The annual growth rate of this indicator is, however, still high in comparison with other
labour cost indicators. The persistently strong growth in hourly labour costs is, apparently, still
Table 5 Labour cost indicators
(annual percentage changes, unless otherwise indicated)
2007 2008 2008Q3
2008Q4
2009Q1
2009Q2
2009Q3
Negotiated wages 2.1 3.2 3.4 3.6 3.2 2.8 2.3
Total hourly labour costs 2.5 3.4 3.5 4.4 3.8 4.3 3.2
Compensation per employee 2.5 3.2 3.6 3.0 1.9 1.6 1.4
Memo items:Labour productivity 1.0 -0.1 -0.1 -1.7 -3.8 -3.1 -2.0
Unit labour costs 1.6 3.3 3.6 4.8 5.9 4.8 3.5
Sources: Eurostat, national data and ECB calculations.
Chart 24 Selected labour cost indicators
(annual percentage changes; quarterly data)
compensation per employee
negotiated wages
hourly labour costs
1.0
1.5
2.0
2.5
3.0
3.5
4.0
4.5
1.0
1.5
2.0
2.5
3.0
3.5
4.0
4.5
2004 2005 2006 2007 2008 2009
Sources: Eurostat, national data and ECB calculations.

40ECB
Monthly Bulletin
January 2010
being driven by the impact of the various measures taken in several euro area economies to reduce
the number of hours worked per employee. Owing to the fact that the industrial sector is most
strongly affected by such adjustment measures, the year-on-year increase in hourly labour costs of
5.4% was highest in this sector in the third quarter of 2009.
Annual productivity in terms of output per employee registered another strong decline in the
third quarter, falling by 2.0% compared with the same quarter last year. This decline was, however,
weaker than the 3.1% contraction observed in the second quarter and thus helped to ease the annual
growth rate of unit labour costs to 3.5%. Given that its average level since the start of EMU has
been around 1.8%, annual unit labour cost growth still remains very high.
3.4 THE OUTLOOK FOR PRICE DEVELOPMENTS
Over the short term, the outlook for annual HICP infl ation will continue to be shaped by upward
base effects arising from changes in food and energy prices (see Box 3). At the same time,
economic fundamentals, such as weak consumer demand and lower labour cost growth are
expected to weigh down on developments in the HICP. Looking further ahead, over the policy-
relevant horizon, overall price and cost developments are expected to remain subdued in an
environment of sluggish demand in the euro area and elsewhere. It is important to emphasise that
infl ation expectations over the medium to longer term remain fi rmly anchored in line with the
Governing Council’s aim of keeping infl ation rates below, but close to 2% over the medium term.
Risks to the outlook for price developments remain broadly balanced. They relate, in particular, to
the outlook for economic activity and to developments in commodity prices. Furthermore, increases
in indirect taxation and administered prices may be stronger than currently expected owing to the
need for fi scal consolidation over the coming years.
Chart 25 Sectoral labour cost developments
(annual percentage changes; quarterly data)
0
1
2
3
4
5
6
7
0
1
2
3
4
5
6
7
industry excluding construction, CPE
construction, CPE
market services, CPE
services, CPE
2004 2005 2006 2007 2008 2009
0
1
2
3
4
5
6
7
0
1
2
3
4
5
6
7
industry excluding construction, hourly LCI
construction, hourly LCI
market services, hourly LCI
2004 2005 2006 2007 2008 2009
Sources: Eurostat and ECB calculations.Note: CPE stands for “compensation per employee” and LCI stands for “labour cost index”.

41ECB
Monthly Bulletin
January 2010
ECONOMIC AND MONETARYDEVELOPMENTS
Prices and
costs
Box 3
BASE EFFECTS AND THEIR IMPACT ON HICP INFLATION IN 2010
Movements in HICP infl ation are often analysed in terms of annual rates of change, which show by
how much the index has changed in 12 months by comparing the value attained in one month with
the value it had in the same month one year earlier. The use of such a statistical measure implies
that annual HICP infl ation fl uctuations are very much affected by index movements taking place
12 months earlier, commonly known as “base effects”. As a result, when assessing changes in
annual HICP infl ation, it is useful to decompose them into a base effect component and a component
related to recent month-on-month infl ationary developments. The base effect component tends to
be particularly infl uential during periods when infl ation volatility was high one year earlier, for
instance induced by sharp movements in commodity prices. Over the past two years, energy and
food prices have accounted for much of the sharp fl uctuations in HICP infl ation, as the wide swings
in oil and food commodity prices in global markets have been passed on to consumer prices. Base
effects in these two components are likely to continue to have a signifi cant infl uence on headline
infl ation in the months to come, as the large energy price falls towards the end of 2008 and the
food price declines in the course of 2009 drop out of the annual comparison only one year later.
As discussed in this box, the contributions of such base effects need to be taken into account when
assessing prospective developments in HICP infl ation in the course of 2010.
Defi nition
Base effects are a recurring feature when analysing changes in annual growth rates. They occur
when variations in the annual growth rate of an economic indicator depend on some atypical
infl uence that affected the indicator’s movement 12 months earlier, rather than being caused
by month-on-month developments.1 To illustrate this distinction with a simple example,
month-on-month infl ation is assumed to be
0.16% in every month except in January of
the year Y, when, owing to a one-off event,
such as a hike in the VAT rate, it rises to 1.0%
(see Chart A). As a consequence, infl ation
calculated in year-on-year terms increases from
1.9% in December Y-1 to 2.8% in January Y,
staying there for one year before falling back
to 1.9% in January Y+1. The fall in the annual
infl ation rate in January Y+1 is said to be
explained by a downward base effect due to
the unusual increase in the price level one year
earlier dropping out of the annual comparison.
Although this concept is intuitive, identifying
and estimating base effects in practice is not
straightforward. Defi ning a base effect as
1 Technically, a base effect can be defi ned as the contribution to the change in the year-on-year infl ation rate in a particular month that
stems from a deviation of the month-on-month rate of change in the base month (i.e. the same month one year earlier) from its usual
or normal pattern, taking account of seasonal fl uctuations. See the box entitled “Accounting for recent and prospective movements in
HICP infl ation: the role of base effects” in the December 2008 issue of the Monthly Bulletin, and the references therein.
Chart A The base effect: an illustration
(percentage changes and index: January Y-1 = 100)
0.0
0.5
1.0
1.5
2.0
2.5
3.0
96
98
100
102
104
106
108
Jan. Y+1Jan. Y-1 Jan. Y
monthly inflation (left-hand scale)
annual inflation (left-hand scale)
price level (right-hand scale)
Source: ECB calculations.

42ECB
Monthly Bulletin
January 2010
being driven by atypical infl uences one year earlier involves the calculation of a deviation of the month-on-month rate of change in the base period from its usual pattern, but there is usually no particular way of distinguishing between typical and atypical effects. For the purposes of this box, the usual pattern of month-on-month changes in the HICP is computed for each month by adding an estimated seasonal effect to the average month-on-month change observed since January 1995.
Impact of base effects on the profi le of euro area infl ation in 2010
In 2010, base effects are expected to make a non-negligible contribution to overall infl ation developments, although more moderate than in the previous year. Chart B shows the expected contributions of base effects from the energy and food components to the monthly changes in the annual infl ation rate in the 12 months to November 2010.
Some notable features can be inferred from the chart. Overall, the contribution of food and energy base effects to monthly changes in annual infl ation is expected to be positive. Base effects from the energy component are estimated to be the strongest in terms of the monthly change in annual HICP infl ation between November 2009 and December 2009 (around 0.5 percentage point). Thereafter, they are expected to refl ect the volatile pattern in energy price developments observed in the course of 2009. At the same time, base effects from (both processed and unprocessed) food prices are expected to make a positive contribution to monthly developments in annual HICP infl ation in each month up to October 2010, as a consequence of the subdued developments in the month-on-month rates of growth in processed food prices and in meat prices within the unprocessed food component in the course of 2009, refl ecting the unwinding of the global food commodity price shock.
Chart C cumulates the base effect contribution to the changes in the annual growth rates of the HICP over the next 12 months, starting in November 2009. As seen in the chart, total base effects from the energy and food components are projected to have a cumulated upward
Chart C Cumulative impact of energy and food base effects
(percentage points)
0.0
0.3
0.6
0.9
1.2
1.5
Nov.0.0
0.3
0.6
0.9
1.2
1.5
food base effectsenergy base effects
cumulative impact of energy and food base effects
20102009Nov. Jan. Mar. May July Sep.
Sources: Eurostat and ECB calculations.
Chart B Contribution of energy and food base effects to the monthly changes in annual HICP inflation
(percentage points)
-0.4
-0.2
0.0
0.2
0.4
0.6
-0.4
-0.2
0.0
0.2
0.4
0.6
20102009Dec. Apr.Feb. June Aug. Oct.
energy base effectsfood base effects
Sources: Eurostat and ECB calculations.

43ECB
Monthly Bulletin
January 2010
ECONOMIC AND MONETARYDEVELOPMENTS
Prices and
costs
impact of around 1.0 percentage point on annual HICP infl ation from November 2009 to
November 2010. While the base effect initially stems mainly from changes in energy prices, over
time the relevance of the food price base effect increases, almost matching that of the energy
prices at the end of that period.
Overall, these upward base effects arising from changes in food and energy prices are likely
to contribute to shaping the outlook for developments in annual HICP infl ation over the
coming months. However, the extent of the rise in infl ation is uncertain and cannot be assessed
mechanically on the basis of base effects alone. The profi le of the annual growth rate in the
HICP will depend on the impact of changes in economic fundamentals, such as the strength of
consumer demand and labour cost growth, as well as future developments in commodity prices
and how these are passed on to euro area consumers. Should the pace of the recovery in activity
remain subdued in the euro area and elsewhere, as is currently envisaged, economic fundamentals
will contribute to keeping headline HICP infl ation moderate in the near term. Therefore, the
expected increase in headline HICP infl ation in 2010, from an estimated annual rate of 0.9% in
December 2009, should not be interpreted as a resurgence of underlying infl ationary pressures.
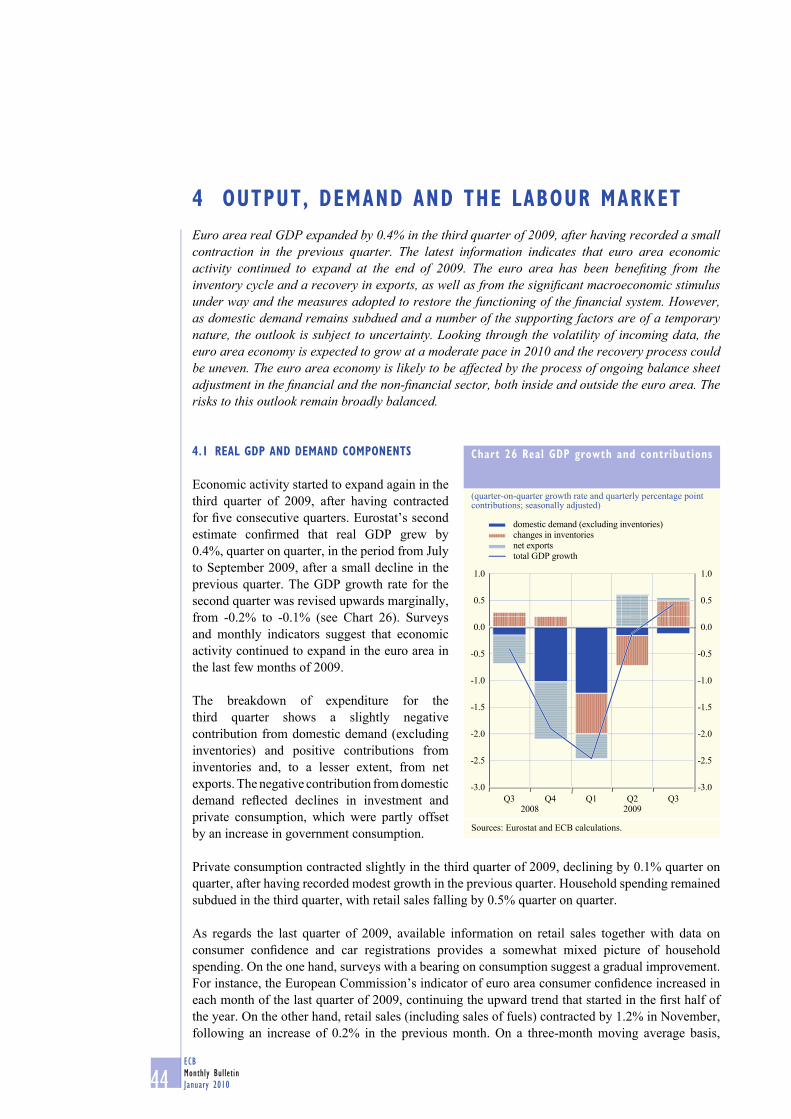
44ECB
Monthly Bulletin
January 2010
Euro area real GDP expanded by 0.4% in the third quarter of 2009, after having recorded a small contraction in the previous quarter. The latest information indicates that euro area economic activity continued to expand at the end of 2009. The euro area has been benefi ting from the inventory cycle and a recovery in exports, as well as from the signifi cant macroeconomic stimulus under way and the measures adopted to restore the functioning of the fi nancial system. However, as domestic demand remains subdued and a number of the supporting factors are of a temporary nature, the outlook is subject to uncertainty. Looking through the volatility of incoming data, the euro area economy is expected to grow at a moderate pace in 2010 and the recovery process could be uneven. The euro area economy is likely to be affected by the process of ongoing balance sheet adjustment in the fi nancial and the non-fi nancial sector, both inside and outside the euro area. The risks to this outlook remain broadly balanced.
4.1 REAL GDP AND DEMAND COMPONENTS
Economic activity started to expand again in the
third quarter of 2009, after having contracted
for fi ve consecutive quarters. Eurostat’s second
estimate confi rmed that real GDP grew by
0.4%, quarter on quarter, in the period from July
to September 2009, after a small decline in the
previous quarter. The GDP growth rate for the
second quarter was revised upwards marginally,
from -0.2% to -0.1% (see Chart 26). Surveys
and monthly indicators suggest that economic
activity continued to expand in the euro area in
the last few months of 2009.
The breakdown of expenditure for the
third quarter shows a slightly negative
contribution from domestic demand (excluding
inventories) and positive contributions from
inventories and, to a lesser extent, from net
exports. The negative contribution from domestic
demand refl ected declines in investment and
private consumption, which were partly offset
by an increase in government consumption.
Private consumption contracted slightly in the third quarter of 2009, declining by 0.1% quarter on
quarter, after having recorded modest growth in the previous quarter. Household spending remained
subdued in the third quarter, with retail sales falling by 0.5% quarter on quarter.
As regards the last quarter of 2009, available information on retail sales together with data on
consumer confi dence and car registrations provides a somewhat mixed picture of household
spending. On the one hand, surveys with a bearing on consumption suggest a gradual improvement.
For instance, the European Commission’s indicator of euro area consumer confi dence increased in
each month of the last quarter of 2009, continuing the upward trend that started in the fi rst half of
the year. On the other hand, retail sales (including sales of fuels) contracted by 1.2% in November,
following an increase of 0.2% in the previous month. On a three-month moving average basis,
4 OUTPUT, DEMAND AND THE LABOUR MARKET
Chart 26 Real GDP growth and contributions
(quarter-on-quarter growth rate and quarterly percentage point contributions; seasonally adjusted)
-3.0
-2.5
-2.0
-1.5
-1.0
-0.5
0.0
0.5
1.0
-3.0
-2.5
-2.0
-1.5
-1.0
-0.5
0.0
0.5
1.0
domestic demand (excluding inventories)
changes in inventories
net exports
total GDP growth
Q3 Q4 Q1 Q2 Q320092008
Sources: Eurostat and ECB calculations.

45ECB
Monthly Bulletin
January 2010
ECONOMIC AND MONETARYDEVELOPMENTS
Output,
demand and the
labour market
retail sales fell by 0.9%, which is more than
in the third quarter of the year (see Chart 27).
On the same basis, growth in new passenger
car registrations stood at 1.7% in November,
compared with 3.0% in the third quarter. This
development clearly suggests that the impact
of fi scal incentives for car purchase in some
countries is falling.
All in all, while consumer surveys have
continued to point to an improvement in
consumer confi dence, recent developments in
retail sales and car registrations, in combination
with weak labour markets and a further
weakening in the impact of fi scal incentives for
car purchase, suggest that consumer spending
continued to be subdued throughout the fourth
quarter of 2009.
Gross fi xed capital formation declined by 0.8%
quarter on quarter in the third quarter of 2009,
following a contraction of 1.6% in the previous
three-month period. This development confi rms that the pace of the decline in investment is
moderating, from the high quarterly rates seen in the fourth quarter of 2008 and the fi rst quarter of
2009 when investment dropped by 4.0% and 5.4% respectively. The breakdown of investment in
the third quarter of 2009 indicates that the decline was almost entirely explained by construction
investment, which decreased by 1.8% quarter on quarter, while non-construction investment
declined by only 0.1%.
As regards available indicators of investment in the euro area in the fourth quarter, both construction
production and industrial new orders declined marginally in October; however, the three-month
moving average growth rate of new orders remained very high by historical standards. Investment
is expected to improve further in the coming quarters but to remain subdued as a result of low
capacity utilisation, continued weak demand, high uncertainty and adjustments in housing markets
in some euro area countries.
The rebound in trade fl ows in the third quarter of 2009 was stronger than estimated in Eurostat’s
fi rst release. Exports increased by 3.1%, quarter on quarter, compared with a contraction of 1.2% in
the second quarter, while imports increased by 3.0%, after a decline of 2.8% in the previous quarter.
The contribution of net trade to the quarterly GDP growth rate, of 0.1 percentage point, remained
unchanged compared with the fi rst release.
Changes in inventories made a 0.5 percentage point contribution to GDP growth in the third quarter
of 2009, after having detracted from growth in the fi rst two quarters of the year. The contribution of
inventories to GDP growth in the third quarter appears to be explained by a slowdown in the pace
of destocking, rather than by the beginning of a restocking phase.
Chart 27 Retail sales and confidence in the retail trade and household sectors
(monthly data)
-3
-2
-1
0
1
2
3
4
-30
-20
-10
0
10
20
30
40
2004 2005 2006 2007 2008 2009
total retail sales 1) (left-hand scale)
consumer confidence 2) (right-hand scale)
retail confidence 2) (right-hand scale)
Sources: European Commission Business and Consumer Surveys and Eurostat.1) Annual percentage changes; three-month moving averages; working day-adjusted. Excludes fuel.2) Percentage balances; seasonally and mean-adjusted.

46ECB
Monthly Bulletin
January 2010
4.2 OUTPUT, SUPPLY AND LABOUR MARKET DEVELOPMENTS
Eurostat’s second estimate confi rms that the 0.4% increase in real value added in the third quarter of
2009 was fuelled by a sharp rebound in the output of the industrial sector, while activity remained
unchanged in the services sector and continued to contract in construction. In particular, value added
in the industrial sector (excluding construction) increased by 2.3% quarter on quarter in the third
quarter, after contracting by 1.5% in the second quarter. Services value added recorded no growth
in the third quarter, whereas it had increased by 0.2% in the previous quarter, while value added in
construction contracted by 0.8% in the third quarter, which is slightly more than the contraction of
0.7% seen in the second quarter.
As regards developments in the fourth quarter of 2009, industrial production increased by 1.0%,
month on month, in November, after a decline of 0.3% in October. Developments in production
have shown a clear recovery over recent months and in November production was 4.7% higher than
the trough reached in April 2009. On average in the two months of the fourth quarter for which data
are available production was 0.8% above its level in the third quarter (see Chart 28).
Surveys indicate that business activity increased in the last few months of 2009 and continue to point
towards economic expansion, albeit from a low level (see Chart 29). The Purchasing Managers’
Index (PMI) for the manufacturing sector rose again in December, to 51.6. In the last quarter of the
year the index stood above 51 on average, up from less than 48 in the third quarter, and was therefore
fi rmly in the expansion range for the fi rst time since the second quarter of 2008. The PMI survey
Chart 28 Industrial production growth and contributions
(growth rate and percentage point contributions; monthly data; seasonally adjusted)
-12.0
-9.0
-6.0
-3.0
0.0
3.0
-12.0
-9.0
-6.0
-3.0
0.0
3.0
capital goodsconsumer goodsintermediate goodsenergytotal excluding construction
2004 2005 2006 2007 2008 2009
Sources: Eurostat and ECB calculations.Note: Data shown are calculated as three-month moving averages against the corresponding average three months earlier.
Chart 29 Industrial production, industrial confidence and the PMI
(monthly data; seasonally adjusted)
-11
-10
-9
-8
-7
-6
-5
-4
-3
-2
-1
0
1
2
3
-44
-40
-36
-32
-28
-24
-20
-16
-12
-8
-4
0
4
8
12
2004 2005 2006 2007 2008 2009
industrial production 1) (left-hand scale)
industrial confidence 2) (right-hand scale)
PMI 3) (right-hand scale)
Sources: Eurostat, European Commission Business and Consumer Surveys, Markit and ECB calculations.Note: All series refer to manufacturing.1) Three-month-on-three-month percentage changes.2) Percentage balances.3) Purchasing Managers’ Index; deviations from an index value of 50.

47ECB
Monthly Bulletin
January 2010
ECONOMIC AND MONETARYDEVELOPMENTS
Output,
demand and the
labour market
also indicates that the pace of inventory destocking is slowing in the euro area. This development
suggests that, all else being equal, inventories should have made a further positive contribution to
GDP growth in the fi nal quarter of 2009. Other business surveys, such as the European Commission
Business Surveys, confi rm the improved sentiment shown in the PMI data. Survey indicators for
activity in the services sector have also followed an upward path and suggest that activity continued
to expand in the last quarter of 2009.
Available information on recent economic developments suggests that, overall, activity continued
to expand in the fourth quarter of 2009. Survey indicators in particular have continued to follow
the upward trend that began in the second quarter. However, the economic outlook continues to be
characterised by uncertainty. Box 4 examines trends in perceptions of uncertainty, using information
from the ECB Survey of Professional Forecasters.
Box 4
MEASURING PERCEPTIONS OF MACROECONOMIC UNCERTAINTY
Since the collapse of Lehman Brothers in
September 2008, the macroeconomic outlook
has been characterised by greater than usual
uncertainty. In addition to complicating the
task of assessing the economic outlook, higher
uncertainty may have an impact on corporate
decisions and household savings choices,
thus affecting investment and consumption.
However, it is not straightforward to gauge the
extent to which uncertainty has increased and
whether it has started to return to more typical
levels. To shed some light on the issue, this box
considers information provided by respondents
to the ECB Survey of Professional Forecasters
(SPF) concerning the amount of uncertainty
they perceive to be surrounding their forecasts.1
The SPF provides several dimensions for
measuring forecast uncertainty, drawing on the
fact that SPF respondents provide both a precise forecast, or point estimate, and a probability
distribution around this point estimate. One approach is to rely on information provided by
individual point estimates and consider “disagreement” among the differing forecasters’ views
to be an indication of uncertainty. This measure of uncertainty is a very narrow one and ignores
the extra information provided by SPF respondents concerning the probability distributions
they assign to their forecasts. There are two ways to use this extra information. One is to
1 For a view of forecast uncertainty over a longer time span using primarily data from Consensus Economics, see the box entitled
“Uncertainty and the economic prospects for the euro area” in the August 2009 issue of the Monthly Bulletin. The analysis in the
current box updates that analysis, considers a number of alternative measures of forecast uncertainty and discusses macroeconomic
uncertainty more generally, including the perceived uncertainty surrounding both HICP infl ation and unemployment rate forecasts in
addition to that surrounding the outlook for economic activity (GDP growth).
Chart A Alternative measures of uncertainty surrounding one-year-ahead inflation forecasts from the SPF
(percentage points)
0.0
0.1
0.2
0.3
0.4
0.5
0.6
0.7
0.8
0.9
0.0
0.1
0.2
0.3
0.4
0.5
0.6
0.7
0.8
0.9
disagreement
individual uncertainty
aggregate uncertainty
1999 2001 2003 20072005 2009
Sources: ECB SPF and ECB calculations.

48ECB
Monthly Bulletin
January 2010
calculate the average standard deviation of the individual probability distributions supplied by
the forecasters, which is known as “individual uncertainty”. While this is informative, there is
evidence that individual forecasters tend to underestimate the degree of uncertainty surrounding
their forecasts.2 For a broader measure of uncertainty, one can calculate “aggregate uncertainty”,
which combines both disagreement and individual uncertainty.3 Chart A illustrates the evolution
of, and relationship between, the different measures of uncertainty surrounding the one-year-
ahead infl ation forecasts from the SPF. Aggregate uncertainty is the measure that is focused on
in this box as it seems to capture a broader notion of macroeconomic uncertainty.
Charts B-D show aggregate uncertainty for HICP infl ation, GDP growth and the unemployment
rate, as perceived by respondents to the ECB SPF at various horizons. The charts show the
average uncertainty for the years 1999-2009, with the shaded area denoting a range of plus and
minus one standard deviation. Unsurprisingly, for each variable, as respondents are asked to
forecast further ahead, average perceived uncertainty typically increases.4 The average level of
2 See, for example, C. Bowles, R. Friz, V. Genre, G. Kenny, A. Meyler and T. Rautanen (2007), “The ECB Survey of Professional
Forecasters (SPF): A review after eight years’ experience”, ECB Occasional Paper No 59, April.
3 “Disagreement” is calculated as the standard deviation of individual point forecasts. “Individual uncertainty” is calculated as the average
standard deviation (or dispersion) of each individual probability distribution. “Aggregate uncertainty” is calculated as the standard
deviation of the aggregated distribution (which is constructed simply by adding up the individual probabilities reported in the SPF and
dividing the sum total by the number of respondents providing probability distributions). It is possible to show that aggregate uncertainty
is a function of, and hence captures, both disagreement and individual uncertainty. For further details, see K. F. Wallis, “Combining
Density and Interval Forecasts: A Modest Proposal”, Oxford Bulletin of Economics and Statistics, 67 (2005 Supplement), 983-94.
4 SPF respondents are asked for their forecasts for specifi c “rolling horizons” (one year and two years ahead of the latest available data,
at the time the survey is conducted, for each variable) and “calendar-year horizons”. These latter horizons are the current calendar year,
next calendar year, calendar year after next (only in the Q3 and Q4 rounds) and a longer-term horizon (of four calendar years ahead
in the Q1 and Q2 rounds and fi ve calendar years ahead in the Q3 and Q4 rounds). The perceived uncertainty surrounding the current
calendar year forecasts is not shown in the charts as it is very much affected by the timing of the SPF round and the amount of data
available to the forecasters. For example, in the Q4 2009 SPF round, forecasters had data on HICP infl ation up to September 2009,
whereas in the Q1 2009 round they only had data up to December 2008.
Chart B Aggregate uncertainty surrounding HICP inflation from the SPF
(percentage points)
x-axis: horizon
0.3
0.4
0.5
0.6
0.7
0.8
0.9
longer term
0.3
0.4
0.5
0.6
0.7
0.8
0.9
average (1999-2009)Q4 2009
Q4 2008
Q4 2007
next calendar
year
one year
ahead
calendaryear
after next
two yearsahead
Sources: ECB SPF and ECB calculations.Note: The light-blue shaded area represents plus and minus one standard deviation from the average observed over the period 1999-2009.
Chart C Aggregate uncertainty surrounding GDP growth from the SPF
(percentage points)
0.3
0.4
0.5
0.6
0.7
0.8
0.9
0.3
0.4
0.5
0.6
0.7
0.8
0.9
nextcalendar
year
calendaryear
after next
oneyear
ahead
two yearsahead
longer term
x-axis: horizon
average (1999-2009)Q4 2009Q4 2008Q4 2007
Sources: ECB SPF and ECB calculations.Note: The light-blue shaded area represents plus and minus one standard deviation from the average observed over the period 1999-2009.

49ECB
Monthly Bulletin
January 2010
ECONOMIC AND MONETARYDEVELOPMENTS
Output,
demand and the
labour market
uncertainty, particularly at longer horizons, is highest for the unemployment rate. This may
refl ect the “non-stationary” nature of the unemployment rate (i.e. in the presence of labour market
rigidities, shocks to the unemployment rate tend to persist). On the other hand, longer-term
expectations for real GDP growth and infl ation are likely to be “anchored” respectively by views
concerning the potential growth rate of the economy and the credibility of monetary policy.
Charts B-D also show the degree of uncertainty perceived by SPF respondents for each variable in the
Q4 2009, Q4 2008 and Q4 2007 rounds.5 For HICP infl ation, aggregate uncertainty, as reported by
SPF respondents, was at a relatively low level in the fourth quarter of 2007, mainly refl ecting a low
level of disagreement. It had risen noticeably, particularly for the short-term horizons, by the fourth
quarter of 2008, mainly refl ecting increased disagreement but also high individual uncertainty. In
the latest (Q4 2009) round, aggregate uncertainty was considerably above historical average levels.
Although disagreement about the infl ation outlook has declined from its peak (in the fi rst half of
2009), it remains relatively high. Average individual uncertainty was at historically high levels in
the fourth quarter of 2009. For GDP growth, aggregate uncertainty about the forecast outlook, as
reported by SPF respondents, was also clearly above historical averages in the fourth quarter of
2009. However, although uncertainty about the growth outlook is still relatively high, it has fallen
substantially compared with its peak recorded in the Q1 2009 round. For the unemployment rate,
uncertainty as reported by SPF respondents was also high in the Q4 2009 round, particularly for
longer-term horizons, but was below the peak levels observed in the Q2 2009 round.
5 The Q4 rounds are reported as the latest available SPF is the Q4 2009 round conducted in October 2009 and to avoid the possible
problem of seasonality, particularly for the calendar-year horizons (see also footnote 4).
Chart D Aggregate uncertainty surrounding the unemployment rate from the SPF
(percentage points)
0.3
0.4
0.5
0.6
0.7
0.8
0.9
1.0
1.1
1.2
1.3
0.3
0.4
0.5
0.6
0.7
0.8
0.9
1.0
1.1
1.2
1.3
x-axis: horizon
average (1999-2009)
Q4 2009
Q4 2008
Q4 2007
nextcalendar
year
calendaryear after
next
one year
ahead
longerterm
two yearsahead
Sources: ECB SPF and ECB calculations.Note: The light-blue shaded area represents plus and minus one standard deviation from the average observed over the period 1999-2009.
Chart E Cross-checking against selected indicators of macroeconomic uncertainty
(percentage points)
0.4
0.5
0.6
0.7
0.8
0.9
1.0
200920072005200320011999
10
20
30
40
50
60
70
two-year-ahead uncertainty (right-hand scale)
implied stock market volatility (left-hand scale)
implied bond market volatility (left-hand scale)economic sentiment indicator (left-hand scale)
Sources: Bloomberg, European Commission (DG-ECFIN), ECB SPF and ECB calculations.Notes: Two-year-ahead uncertainty refers to the arithmetic average of the aggregate uncertainty measures for the two-year-ahead forecasts of HICP infl ation, GDP growth and the unemployment rate. The implied bond market volatility measure has been scaled upwards by a multiple of fi ve. The economic sentiment indicator has been inverted and the scale has been adjusted.

50ECB
Monthly Bulletin
January 2010
LABOUR MARKET
Conditions in euro area labour markets have continued to deteriorate in recent months. Eurostat’s
second estimate confi rms that euro area employment decreased by 0.5% quarter on quarter
in the third quarter of 2009. This is the same quarterly rate of decline as recorded in the second
quarter, but less than in the fi rst quarter of the year (see Table 6). At the sectoral level, industry
and construction continued to bear the brunt of the contraction in employment. While the 1.6%
quarter-on-quarter decline in industrial employment (excluding construction) in the third quarter
suggests some moderation in the rate of contraction compared with the previous quarter, the
contraction in construction employment shows a further clear deterioration for that quarter, after
some signs of improvement in the second quarter. Conversely, employment in the services sector
appears to have held up somewhat better, declining by only 0.1% quarter on quarter in the third
quarter, which was the same rate as recorded in the previous quarter (see Chart 30).
Together with the recent recovery in euro area output growth, the job losses seen in recent quarters
have contributed to an improvement in productivity developments. In year-on-year terms, aggregate
euro area productivity (in terms of output per employee) nevertheless dropped by 2.0% in the third
Chart E presents the average of the two-year-ahead aggregate uncertainty measures for HICP
infl ation, GDP growth and the unemployment rate, alongside other possible indicators of
macroeconomic uncertainty, such as implied stock market volatility (for the Dow Jones EURO
STOXX 50 index), implied bond market volatility (for the Eurex Generic 1st “RX” future) and
the European Commission (DG-ECFIN) Economic Sentiment Indicator. Generally, a degree of
co-movement among the different indicators is present. It also seems that although the level
of uncertainty moderated somewhat during the course of 2009, having reached strong highs at
the beginning of the year, it remained elevated. This pattern is stronger for the SPF measure
and the economic sentiment indicator. Implied stock and bond market volatilities were closer to
historical averages, but also remained higher than the levels observed in recent years.
In summary, macroeconomic forecast uncertainty, as reported by SPF respondents, has increased
substantially since the second half of 2008. However, the peak seems to have been reached in
the fi rst half of 2009. Thereafter, perceived uncertainty in the SPF has unwound to some extent,
even though it remained elevated up to the last quarter of 2009.
Table 6 Employment growth
(percentage changes compared with the previous period; seasonally adjusted)
Annual rates Quarterly rates2007 2008 2008
Q32008
Q42009
Q12009
Q22009
Q3
Whole economy 1.8 0.7 -0.2 -0.4 -0.7 -0.5 -0.5
of which:Agriculture and fi shing -1.5 -1.4 -0.6 0.1 -0.8 -0.8 -1.1
Industry 1.3 -0.8 -0.9 -1.4 -1.7 -1.7 -1.7
Excluding construction 0.3 -0.1 -0.5 -1.1 -1.5 -1.8 -1.6
Construction 3.8 -2.2 -1.9 -2.2 -2.3 -1.4 -2.0
Services 2.1 1.4 0.0 0.0 -0.4 -0.1 -0.1
Trade and transport 2.0 1.3 -0.1 -0.4 -0.8 -0.4 -0.1
Finance and business 4.0 2.3 0.0 -0.5 -0.9 -0.7 -0.5
Public administration 1) 1.2 1.0 0.2 0.6 0.2 0.6 0.3
Sources: Eurostat and ECB calculations.1) Also includes education, health and other services.

51ECB
Monthly Bulletin
January 2010
ECONOMIC AND MONETARYDEVELOPMENTS
Output,
demand and the
labour market
quarter of 2009, but this rate is a substantial improvement on the record contractions seen in the fi rst
half of the year (see Chart 31). The latest survey indicators suggest that productivity should have
continued to improve in the fourth quarter.
The euro area unemployment rate increased to 10.0% in November, from 9.9% in October, which
was revised upwards by 0.1 percentage point compared with Eurostat’s fi rst release. The slow
increase in the euro area unemployment rate masks diverse developments across the euro area, as
unemployment has reached much higher rates in some euro area countries (see Chart 32). Looking
Chart 31 Labour productivity
(annual percentage changes)
-14
-12
-10
-8
-6
-4
-2
0
2
4
6
-14
-12
-10
-8
-6
-4
-2
0
2
4
6
whole economy
industry excluding construction
services
2004 2005 2006 2007 2008 2009
Sources: Eurostat and ECB calculations.
Chart 32 Unemployment
(monthly data; seasonally adjusted)
-300
-150
0
150
300
450
600
7.0
7.5
8.0
8.5
9.0
9.5
10.0
2004 2005 2006 2007 2008 2009
monthly change in thousands (left-hand scale)
percentage of the labour force (right-hand scale)
Source: Eurostat.
Chart 30 Employment growth and employment expectations
(annual percentage changes; percentage balances; seasonally adjusted)
-6.0-5.5-5.0-4.5-4.0-3.5-3.0-2.5-2.0-1.5-1.0-0.50.00.51.01.52.0
-60-55-50-45-40-35-30-25-20-15-10-505101520
2004 2005 2006 2007 2008 2009
employment growth in industry excluding construction
(left-hand scale)
employment expectations in manufacturing
(right-hand scale)
-30
-25
-20
-15
-10
-5
0
5
10
15
20
25
-30
-25
-20
-15
-10
-5
0
5
10
15
20
25
employment expectations in construction
employment expectations in the retail trade
employment expectations in the services sector
2004 2005 2006 2007 2008 2009
Sources: Eurostat and European Commission Business and Consumer Surveys.Note: Percentage balances are mean-adjusted.

52ECB
Monthly Bulletin
January 2010
ahead, survey indicators have improved from their lows, but still suggest that further increases in
euro area unemployment are likely in the months ahead, albeit at a slower pace than was observed
and expected earlier in 2009.
4.3 THE OUTLOOK FOR ECONOMIC ACTIVITY
Euro area real GDP expanded by 0.4% in the third quarter of 2009, after having recorded a small
contraction in the previous quarter. The latest information indicates that the euro area economic
activity continued to expand in the last few months of 2009, although consumption appears to
have remained subdued. The euro area has been benefi ting from the inventory cycle and a recovery
in exports, as well as from the signifi cant macroeconomic stimulus under way and the measures
adopted to restore the functioning of the fi nancial system.
However, future developments remain uncertain, as a number of the supporting factors are of a
temporary nature and domestic demand is expected to remain weak. Looking through the volatility
of incoming data, the euro area economy is expected to grow at a moderate pace in 2010 and the
recovery process could be uneven. The euro area economy is likely to be affected by the process
of ongoing balance sheet adjustment in the fi nancial and the non-fi nancial sector, both inside and
outside the euro area. In addition, low capacity utilisation rates are likely to dampen investment
and unemployment in the euro area is expected to increase somewhat further, thereby dampening
consumption growth.
The risks to the outlook for economic activity remain broadly balanced. On the upside, there may
be stronger than anticipated effects stemming from the extensive macroeconomic stimulus being
provided as well as from other policy measures taken. Confi dence may also improve further and
foreign demand may prove to be stronger than projected. On the downside, concerns remain relating
to a stronger or more protracted negative feedback loop between the real economy and the fi nancial
sector, renewed increases in oil and other commodity prices, the intensifi cation of protectionist
pressures and the possibility of a disorderly correction of global imbalances.

53ECB
Monthly Bulletin
January 2010
ECONOMIC AND MONETARYDEVELOPMENTS
Exchange rate
and balance
of payments
developments
5 EXCHANGE RATE AND BALANCE OF PAYMENTS DEVELOPMENTS
5.1 EXCHANGE RATES
The euro exchange rate has weakened somewhat in nominal effective terms over the past three months, reaching levels close to its 2009 average. The weakening of the euro has been relatively broad based and primarily took place in December.
EFFECTIVE EXCHANGE RATE OF THE EURO
Following some fl uctuation in October and
November, the nominal effective exchange rate
of the euro – as measured against the currencies
of 21 of the euro area’s most important trading
partners – weakened in December. On 13 January
it was 1% weaker than at the end of September
and close to its average 2009 level. Over the
last three months the depreciation of the euro
has been rather broad based, and only slightly
reduced by the appreciation of the euro vis-à-vis
the Japanese yen (see Chart 33). Box 5 briefl y
introduces a revised set of effective exchange
rate indices that take into account the changes in
the geographical structure of euro area trade.
US DOLLAR/EURO
While in October and November the euro
continued to appreciate against the dollar,
in December and early January it weakened.
This was part of a relatively broad-based
appreciation of the US dollar against
major currencies. Market uncertainty, as
measured by the implied volatility at the
three-month horizon, initially increased,
stabilised somewhat in late 2009 and
subsequently declined in January towards the
10-year average (see Chart 34). On 13 January
the euro was trading at USD 1.46, broadly
unchanged compared with the end of September
but 4.5% above its 2009 average.
JAPANESE YEN/EURO
Over the last three months the exchange rate of
the euro vis-à-vis the Japanese yen has continued
to fl uctuate within a range of JPY 129 to JPY
138 to the euro (see Chart 34). After increasing
in October and November, the implied
Chart 33 Euro effective exchange rate (EER-21) and its decomposition 1)
(daily data)
Index: 1999 Q1 = 100
December January
111
112
113
114
115
116
111
112
113
114
115
116
October November
2009 2010
Contributions to EER-21 changes 2)
From 30 September 2009 to 13 January 2010
(percentage points)
-2
-1
0
1
-2
-1
0
1
USD JPY CHF OMS EER-21GBP CNY SEK Other
Contributions to EER-21 changes 2)
From 3 January 2005 to 13 January 2010
(percentage points)
0
-1
1
2
3
4
5
6
0
-1
1
2
3
4
5
6
USD JPY CHF OMS EER-21GBP CNY SEK Other
Source: ECB.1) An upward movement of the index represents an appreciation of the euro against the currencies of 21 of the most important trading partners of the euro area (including all non-euro area EU Member States).2) Contributions to EER-21 changes are displayed individually for the currencies of the six main trading partners of the euro area. The category ‘‘Other Member States’’ (OMS) refers to the aggregate contribution of the currencies of the non-euro area Member States (except the pound sterling and the Swedish krona). The category ‘‘Other’’ refers to the aggregate contribution of the currencies of the remaining six trading partners of the euro area in the EER-21 index. Changes are calculated using the corresponding overall trade weights in the EER-21 index.

54ECB
Monthly Bulletin
January 2010
volatility of the JPY/EUR exchange rate fell,
reaching values closer to its long-term average
(see Chart 34). On 13 January the euro stood
at JPY 133, 1.5% stronger than at the end
of September and 2.1% stronger than its
2009 average.
EU MEMBER STATES’ CURRENCIES
Over the three months to 13 January most
currencies participating in ERM II remained
broadly stable against the euro, trading at,
or close to, their respective central rates
(see Chart 35). The Latvian lats, however,
remained on the weak side of the ±1%
unilaterally set fl uctuation band.
As regards the currencies of the EU Member
States not participating in ERM II, the euro
weakened slightly against the pound sterling in
the fourth quarter. On 13 January the euro was
1.6% weaker vis-à-vis the pound sterling than
at the end of September and close to its 2009
average. Since November the implied volatility
Chart 34 Patterns in exchange rates and implied volatilities
(daily data)
Exchange rates
1.2
1.3
1.4
1.5
1.6
115
125
135
145
155
October November December January2009 2010
USD/EUR (left-hand scale)
JPY/EUR (right-hand scale)
0.60
0.70
0.80
0.90
1.00
1.40
1.45
1.50
1.55
1.60
GBP/EUR (left-hand scale)
CHF/EUR (right-hand scale)
October November December January
2009 2010
Implied exchange rate volatilities (three-month)
10
11
12
13
14
15
16
10
11
12
13
14
15
16
USD/EUR
GBP/EUR
JPY/EUR
October November December January
2009 2010
9 9
Source: Bloomberg and ECB.
Chart 35 Patterns in exchange rates in ERM II
(daily data; deviation from the central parity in percentage points)
-15
-12
-9
-6
-3
0
3
6
9
12
15
-15
-12
-9
-6
-3
0
3
6
9
12
15
October November December2009
EEK/EUR
DKK/EUR
LTL/EUR
LVL/EUR
Source: ECB.Notes: A positive (negative) deviation from the central rate against the euro implies that the currency is on the weak (strong) side of the band. In the case of the Danish krone, the fl uctuation band is ±2.25%; for all other currencies, the standard fl uctuation band of ±15% applies.

55ECB
Monthly Bulletin
January 2010
ECONOMIC AND MONETARYDEVELOPMENTS
Exchange rate
and balance
of payments
developments
of the GBP/EUR exchange rate has decreased sharply, particularly at the one and three-month
horizons (see Chart 34). Since the end of September the euro has weakened against the Polish zloty
(by 4.1%), the Romanian leu (by 2.4%) and the Hungarian forint (by 1.1%), strengthened against
the Czech koruna (by 4.0%) and remained broadly unchanged vis-à-vis the Swedish krona.
OTHER CURRENCIES
In October and November the euro remained rather stable vis-à-vis the Swiss franc, at around
CHF 1.51. In December, following a change in its communication on exchange rate policy by the
Swiss National Bank, the Swiss franc strengthened against the euro, by around 2%, to reach CHF
1.48 to the euro on 13 January. Over the same period the bilateral euro exchange rates vis-à-vis the
Chinese renminbi and the Hong Kong dollar followed the developments in the USD/EUR exchange
rate. The euro also weakened against major commodity currencies, such as the Canadian dollar
(by 4.1%), the Australian dollar (by 5.2%) and the Norwegian krone (by 3.3%).
Box 5
INTERNATIONAL TRADE DEVELOPMENTS AND REVISION OF THE EFFECTIVE EXCHANGE RATES
OF THE EURO
The geographical structure of euro area trade
has undergone signifi cant changes over the
past decade, with the weight of emerging
economies increasing progressively. This
box briefl y discusses these developments and
introduces a revised set of effective exchange
rates (EERs) of the euro that result from an
update of the underlying trade weights.
The main development in extra-euro area
geographical trade patterns in the last decade
has been the progressive increase in the share of
China and of the central and eastern European
countries (CEECs) 1 in the EU, paralleled by
a gradual decrease in the shares of advanced
economies such as the United States, the
United Kingdom, Japan and Switzerland.
The increase in the share of China since the
beginning of the decade has been especially
evident in euro area imports, while the
CEECs have seen their shares in exports
and imports increase at broadly similar rates
(see Chart A). The EER weights are updated
regularly to refl ect these developments; however, they can only be computed with a lag of a few
years owing to limitations in data availability, so that the most recent set of weights is based
on the average trade values for 2004-06. Simple value shares of total trade for the available
months of 2009 show that the overall trend of a progressive increase in the trade shares of
1 These countries are Bulgaria, the Czech Republic, Estonia, Latvia, Lithuania, Hungary, Poland and Romania.
Chart A Shares of various countries and regions in euro area imports and exports
(shares based on values in euro; percentages)
0
5
10
15
20
25
30
35
40
45
0
5
10
15
20
25
30
35
40
45
1 United States
2 CEEC
3 United Kingdom
4 China
5 Japan
6 Switzerland
7 Asia excluding China and Japan
8 other
1 2 3 4 5 6 7 8
2000
2004-2006
2009
E I E I E I E I E I E I E I E I
Source: Eurostat.Note: E = exports; I = imports.

56ECB
Monthly Bulletin
January 2010
emerging markets at the expense of advanced
economies has continued: China’s share of
euro area trade continues to grow, while the
United Kingdom and Japan are seeing their
shares reduced in both euro area imports and
exports. The share of the United States in euro
area imports has remained relatively stable
since 2004-06, while its share in exports has
fallen further. In addition, the share of the
rest of the world as a euro area export market
increased signifi cantly in 2009, refl ecting,
among other things, the increasing importance
of oil-exporting countries (see Chart A).
The ECB computes and publishes nominal
and real EERs of the euro against three groups
of trading partners: the EER-12, for a group
consisting of 12 trading partners of the euro
area; the EER-21, comprising the EER-12 plus China and the eight non-euro area EU Member
States not included in the EER-12; and the EER-41, comprising the EER-21 plus 20 additional
relevant trading partners (see Table A for the complete lists).
The EERs are constructed using moving weights, calculated on the basis of manufacturing
trade data,2 which in 2009 accounted for around 82% of total exports and 66% of total
imports. Manufacturing was chosen as the trade basis for the weights, in accordance with
common practice, because i) such trade is typically responsive to changes in competitiveness
and ii) relatively good data are available for almost all industrial countries. The revised EER
weights refl ect the changes in the composition of euro area trade outlined above: for example,
compared with the weights used for constructing the index up to 1997, the 2004-06 weights of
the United Kingdom and Japan have decreased in all groups of trading partners. The weight
of the United States has also decreased, except in the narrowest group of partner countries
(see Table A). China has emerged as the third largest trading partner of the euro area, after
the United States and the United Kingdom. As a group, however, the eight EU CEECs have a
larger weight than China.3
The EERs are constructed by applying the weights to the bilateral nominal exchange rates
of the euro against the currencies of selected trading partners. The weights combine information
on imports and exports and are designed to capture not only the direct bilateral fl ows, but also
the effect of competition from trading partners faced by euro area exporters in third markets.
The difference between the simple export weights and the double export weights illustrates
the importance of the third-market competition effect. Most strikingly, this competition effect
2 The recently updated EERs are calculated on the basis of manufacturing trade data referring to four periods: averages for 1995-97 are
used in the construction of the series up to 1997; data from 1998-2000 and 2001-03 are used in the corresponding periods; and weights
based on data for 2004-06 are used in the calculation of the series from 2004 to the current period. The trade weights used to construct
euro EER indices were previously updated once, in 2004 (for details, see Box 10 of the September 2004 issue of the Monthly Bulletin).
The two sets of weights calculated at that time were based on manufacturing trade data for the periods 1995-97 (used for constructing
the indices up to 1999) and 1999-2001 (used to calculate the series from 1999 onwards).
3 For more details, see the press release published on 15 December 2009 and the methodological note referred to in the press release.
Chart B Impact of third-market effect on the 2004-06 EER-41 export weights of selected country groups
(percentage points)
-5-4-3-2-1012345
-5-4-3-2-1012345
1 2 3 4 5 6 7 8
1 United States2 CEECs3 United Kingdom4 China
5 Japan6 Switzerland7 Asia excluding China and Japan8 other
Source: ECB.

57ECB
Monthly Bulletin
January 2010
ECONOMIC AND MONETARYDEVELOPMENTS
Exchange rate
and balance
of payments
developments
increases the weights of Asian trading partners in the EER. For China and the rest of Asia, the
increase is 4.4 and 3.7 percentage points respectively. By contrast, the weights of European
trading partners are reduced and that of the United States is largely unaffected (see Chart B).
This means that, for example, when only direct trade fl ows are considered, the export weight of
Table A Updated trade weights used in the calculation of the EERs of the euro
Partner countries
EER-12 EER-21 EER-411995-1997 1)
1998-2000
2001-2003
2004-2006
1995-1997 1)
1998-2000
2001-2003
2004-2006
1995-1997 1)
1998-2000
2001-2003
2004-2006
EER-41 100.0 100.0 100.0 100.0EER-21 100.0 100.0 100.0 100.0 81.1 82.0 81.8 80.6
EER-12 100.0 100.0 100.0 100.0 85.5 83.6 77.9 71.3 69.3 68.4 63.6 57.2Australia 1.1 1.2 1.3 1.5 0.9 0.9 1.0 1.0 0.8 0.7 0.8 0.8
Canada 2.1 2.4 2.6 2.5 1.8 2.0 2.0 1.7 1.5 1.6 1.6 1.3
Denmark 3.7 3.4 3.5 3.7 3.1 2.8 2.8 2.7 2.5 2.3 2.2 2.2
Hong Kong 3.0 2.6 2.6 3.1 2.6 2.1 1.9 2.0 2.1 1.7 1.5 1.6
Japan 14.1 12.8 11.8 11.6 12.0 10.8 9.2 8.3 9.8 8.9 7.6 6.7
Norway 1.9 1.8 1.7 1.9 1.6 1.5 1.3 1.3 1.3 1.2 1.0 1.0
Singapore 2.6 2.3 2.2 2.5 2.2 1.9 1.7 1.8 1.8 1.6 1.4 1.4
South Korea 4.1 3.9 4.4 5.4 3.5 3.3 3.4 3.9 2.8 2.7 2.7 3.2
Sweden 6.7 6.1 5.7 6.5 5.7 5.2 4.5 4.8 4.7 4.3 3.8 3.9
Switzerland 9.4 8.6 8.6 8.7 8.1 7.2 6.9 6.4 6.5 6.0 5.7 5.3
United Kingdom 26.4 25.7 25.9 24.7 22.6 21.6 20.3 17.8 18.3 17.8 16.7 14.3
United States 24.9 29.3 29.8 27.9 21.3 24.3 22.9 19.6 17.2 19.8 18.6 15.6
Additional countries in EER-21 14.5 16.4 22.1 28.7 11.8 13.6 18.3 23.4
Bulgaria 0.4 0.3 0.5 0.6 0.3 0.3 0.4 0.4
Czech Republic 2.7 2.6 3.6 4.1 2.2 2.2 3.0 3.4
Estonia 0.2 0.2 0.3 0.3 0.2 0.2 0.2 0.2
Hungary 1.9 2.3 3.0 3.1 1.6 1.9 2.5 2.5
Latvia 0.1 0.1 0.2 0.2 0.1 0.1 0.1 0.1
Lithuania 0.2 0.2 0.3 0.3 0.1 0.2 0.2 0.3
Poland 2.9 3.4 4.0 4.9 2.4 2.7 3.3 3.9
Romania 0.9 1.0 1.4 1.7 0.7 0.8 1.1 1.4
China 5.3 6.3 9.1 13.6 4.3 5.3 7.5 11.1
Additional countries in EER-41 18.9 18.0 18.2 19.4
Algeria 0.3 0.3 0.3 0.4
Argentina 0.5 0.5 0.3 0.3
Brazil 1.5 1.4 1.2 1.2
Chile 0.3 0.3 0.3 0.4
Croatia 0.5 0.4 0.5 0.5
Iceland 0.0 0.1 0.1 0.1
India 1.4 1.3 1.5 1.8
Indonesia 0.9 0.8 0.7 0.6
Israel 1.1 1.0 0.9 0.7
Malaysia 1.2 1.1 1.2 1.1
Mexico 0.8 1.2 1.3 1.2
Morocco 0.6 0.6 0.6 0.6
New Zealand 0.1 0.1 0.1 0.1
Philippines 0.4 0.5 0.5 0.4
Russia 2.2 1.9 2.2 2.9
South Africa 1.0 0.8 0.9 1.0
Taiwan 2.2 2.3 2.0 1.8
Thailand 1.2 1.0 1.0 1.0
Turkey 2.1 2.3 2.3 3.0
Venezuela 0.2 0.2 0.2 0.2
1) Non-revised.

58ECB
Monthly Bulletin
January 2010
China in the EER-41 index is 4.4% instead of
8.8%. Hence, considering the importance of
China also as a competitor in non-euro area
markets doubles its weight in the index.
The update of the weights shifts the EER
indices computed vis-à-vis broader groups of
trading partners very slightly downwards in
nominal terms and somewhat more noticeably
in real terms.4 In December 2009 the updated
and the previously published nominal EER-41
stood 26% and 28% respectively above their
1999 average levels (see Chart C).
Looking at real EERs, which are more
appropriate for gauging price and cost
competitiveness, a difference between
developments in the revised indices and those in the earlier indices is noticeable for the
broader measures based on 21 and 41 trading partners. From 1999 to December 2009,
the updated real EER-41 of the euro defl ated by consumer prices appreciated by 13%. Using the
previous weighting structure, this appreciation would have been 17% (see Chart C).
Against the background of the rather dynamic evolution of geographical trade patterns in the
past decade, the real EERs of the euro better refl ect current developments in euro area price and
cost competitiveness following the weight update.
4 Real EER indices are derived by adjusting the nominal indices for relative price and cost developments between the euro area and its
trading partners. They are calculated on the basis of consumer price indices, producer price indices, GDP defl ators and unit labour cost
indices – the latter for the total economy as well as for the manufacturing sector.
Chart C Previous and revised real EERs of the euro against the broadest group of trading partners
(index: 1999 Q1 = 100; monthly data)
1993 1995 1997 1999 2001 2003 2005 2007 2009
previous real EER-41revised real EER-41
80
85
90
95
100
105
110
115
120
80
85
90
95
100
105
110
115
120
Source: ECB.Note: Defl ated on the basis of the CPI.
5.2 BALANCE OF PAYMENTS
Extra-euro area trade has continued to show signs of improvement. Both exports and imports of goods and services picked up in the three-month period to October 2009 and the 12-month cumulated current account defi cit of the euro area narrowed to €86.5 billion (1.0% of GDP). In the fi nancial account, the euro area recorded net infl ows in both bonds and notes and money market instruments, and marginal net outfl ows in equities in the three-month period to October. This refl ected the ongoing reversal of euro area residents’ repatriation of funds and a shift in non-residents’ investment in the euro area from equities to debt securities.
TRADE AND THE CURRENT ACCOUNT
Extra-euro area trade continued to show signs of improvement in the three-month period
to October 2009. While extra-euro area exports of goods had already started to rebound in
the preceding few months, imports of extra-euro area goods also picked up, increasing by
0.9% in the three-month period to October, compared with the previous three-month period
(see Chart 36). This was in line with increases in euro area industrial production and also
refl ected lower destocking by euro area fi rms. Extra-euro area exports of goods continued to be
supported by strengthening foreign demand. The geographical breakdown, available for most

59ECB
Monthly Bulletin
January 2010
ECONOMIC AND MONETARYDEVELOPMENTS
Exchange rate
and balance
of payments
developments
countries up to September 2009, shows a rebound in export volumes to some major
non-euro area EU countries, while the export momentum to Asia weakened. Exports to OPEC
countries and Japan continued to decline in the three-month period to October 2009. At the same
time the boost in foreign demand was somewhat dampened by the negative impact of losses in
export price competitiveness owing to the broad-based appreciation of the euro from March 2009.
Trade in services also rebounded in the three-month period to October, with imports and exports
rising by 1.5% and 1.0% respectively compared with the previous three months (see Table 7).
As a result of these developments in extra-euro area trade, the 12-month cumulated goods balance
improved further in October 2009, recording a surplus for the fourth consecutive month (see Chart 37).
As regards the trade balance, this improvement was only partly offset by a decrease in the surplus
in services. Together with lower defi cits in the income account and current transfers, the improved
trade balance resulted in a further narrowing of the euro area current account defi cit, to €86.5 billion
(about 1.0% of GDP) in 12-month cumulated terms, compared with a defi cit of €118.0 billion a
year earlier.
Looking ahead, available indicators suggest that the gradual recovery in extra-euro area exports
will continue in the near term. In December 2009, the Purchasing Managers’ Index (PMI) of new
export orders in the euro area manufacturing sector posted a further increase, remaining well above
the expansion/contraction threshold of 50 for the fi fth consecutive month. Extra-euro area imports
are also expected to rise further, supported by strengthening fi nal domestic demand and additional
demand for imported inputs. However, given that the recent rebound in world and extra-euro area
trade has partly refl ected the impact of temporary factors – such as fi scal stimuli and support
from the inventory cycle – some loss of momentum may be expected, as the impact of those
factors fades.
Chart 36 Extra-euro area trade in goods
(three-month-on-three-month percentage changes; EUR billions; three-month moving averages; monthly data; working day and seasonally adjusted)
-15
-10
-5
0
5
10
15
-15
-10
-5
0
5
10
15
2005 2006 2007 2008 2009
goods balance (right-hand scale)goods exports (left-hand scale)goods imports (left-hand scale)
Source: ECB.
Chart 37 Main items of the current account
(EUR billions; 12-month cumulated fl ows; monthly data; working day and seasonally adjusted)
-250
-200
-150
-100
-50
0
50
100
150
-250
-200
-150
-100
-50
0
50
100
150
2005 2006 2007 2008 2009
current transfers balance
income balance
services balance
goods balance
current account balance
Source: ECB.

60ECB
Monthly Bulletin
January 2010
FINANCIAL ACCOUNT
In the three-month period to October 2009 euro area residents continued to make net purchases of
foreign equities and debt securities, gradually reversing the repatriation of funds that had occurred
as the fi nancial crisis intensifi ed. At the same time non-residents increased their portfolio investment
in the euro area, with their preference shifting to debt securities. These developments resulted in
net infl ows in debt securities, which were almost equally distributed between bonds and notes
and money market instruments, and marginal net outfl ows in equities in the three-month period to
October 2009 (see Chart 38).
The shift in non-residents’ demand away from euro area equities towards euro area bonds and
notes appears to be in line with developments in yield spreads and stock market valuations. While
the positive yield spread between euro area bonds and bonds of other major economies, e.g. the
United States, seems to have encouraged foreign investors to increase their purchases of euro area
bonds and notes, lower net purchases of euro area equities may be related to market perceptions
of a somewhat less favourable outlook for euro area fi rms, as refl ected in declining stock market
Table 7 Main items of the euro area balance of payments
(seasonally adjusted data, unless otherwise indicated)
Three-month moving average fi gures ending
12-month cumulated fi gures ending
2009 Sep.
2009 Oct.
2009 Jan.
2009 Apr.
2009 July
2009 Oct.
2008 Oct.
2009 Oct.
EUR billions
Current account -5.0 -4.6 -16.3 -9.6 0.1 -3.1 -118.0 -86.5Goods balance 3.8 8.3 -3.8 -0.9 5.3 5.9 -3.9 19.5
Exports 106.1 111.7 114.4 105.2 106.2 107.7 1,593.0 1,300.3
Imports 102.3 103.4 118.1 106.1 100.9 101.8 1,596.8 1,280.9
Services balance 2.0 2.6 2.9 1.9 2.1 2.3 42.2 27.6
Exports 38.9 38.3 41.2 39.3 38.0 38.6 511.0 471.2
Imports 36.8 35.7 38.4 37.3 35.9 36.3 468.8 443.6
Income balance -4.4 -2.2 -6.7 -2.9 -1.2 -2.4 -60.0 -39.4
Current transfers balance -6.5 -13.4 -8.6 -7.7 -6.1 -8.9 -96.3 -94.1
Financial account 1) 10.4 14.4 20.2 13.3 -5.2 6.4 154.0 104.3
Combined net direct and portfolio
investment 27.3 17.7 -11.3 41.1 26.7 31.3 173.6 263.3
Net direct investment -26.2 -1.5 -26.4 -10.4 1.0 -8.3 -137.4 -132.1
Net portfolio investment 53.5 19.2 15.0 51.5 25.6 39.6 311.0 395.4
Equities -4.3 -29.3 -12.4 4.9 27.2 -0.7 -16.7 57.1
Debt instruments 57.8 48.5 27.5 46.6 -1.6 40.3 327.8 338.3
Bonds and notes 33.2 27.6 20.9 36.1 -4.0 20.6 133.8 220.9
Money market instruments 24.7 20.9 6.6 10.5 2.4 19.7 193.9 117.4
Percentage changes from previous period
Goods and ServicesExports 0.8 3.5 -11.7 -7.1 -0.2 1.5 5.7 -15.8
Imports 2.3 0.0 -9.4 -8.4 -4.7 1.0 9.4 -16.5
GoodsExports 0.8 5.3 -14.3 -8.0 0.9 1.5 5.6 -18.4
Imports 2.5 1.1 -10.8 -10.2 -4.9 0.9 9.9 -19.8
ServicesExports 0.8 -1.4 -3.7 -4.8 -3.3 1.5 5.9 -7.8
Imports 1.7 -3.1 -5.1 -2.7 -3.9 1.0 7.8 -5.4
Source: ECB.Note: Figures may not add up due to rounding.1) Figures refer to balances (net fl ows). A positive (negative) sign indicates a net infl ow (outfl ow). Not seasonally adjusted.

61ECB
Monthly Bulletin
January 2010
ECONOMIC AND MONETARYDEVELOPMENTS
Exchange rate
and balance
of payments
developments
valuations in October 2009. Furthermore, the euro area continued to record net infl ows in money
market instruments, although they remained well below the peak levels observed last year.
Direct investment activity picked up somewhat in the three-month period to October, particularly
euro area investment abroad. As a result, the euro area recorded average net outfl ows of direct
investment in the three-month period to October compared with net infl ows in the previous three
month period. This development, resulting both from increasing net outfl ows in equity capital and
reinvested earnings and in other capital, could partly refl ect the fact that euro area fi rms have been
taking advantage of the strengthening of the euro to buy assets abroad.
Overall, the euro area recorded a slight increase in the average net infl ows in combined direct
and portfolio investment in the three-month period to October 2009 compared with the previous
three-month period. In 12-month cumulated terms, net infl ows in combined direct and portfolio
investment reached €263.3 billion in October 2009, compared with €173.6 billion a year earlier
(see Chart 38).
Chart 38 Main items of the financial account
(EUR billions; net fl ows; three-month moving averages; monthly data)
(EUR billions; 12-month cumulated net fl ows; monthly data)
2005
equities
money market instruments
bonds and notes
direct investment
combined direct and portfolio investment
2006 2007 2008 2009-60
-40
-20
0
20
40
60
80
100
120
-60
-40
-20
0
20
40
60
80
100
120
-400
-200
0
200
400
600
-400
-200
0
200
400
600
2005 2006 2007 2008 2009
equities
money market instruments
bonds and notes
direct investment
combined direct and portfolio investment
Source: ECB.


63ECB
Monthly Bulletin
January 2010
1 INTRODUCTION
Good decisions rely on comprehensive
information, sound analysis and good judgement.
Central banks’ decisions rely on an assessment
of their monetary policy stance. That stance can
be defi ned as the contribution made by monetary
policy to economic, fi nancial and monetary
developments. Monetary policy actions affect
the setting of market interest rates and prices
in the economy through various channels,
thereby infl uencing economic activity and/
or infl ation in a process known as “monetary
policy transmission”. Thus, the assessment of
the monetary policy stance can be defi ned as
determining whether the contribution made by
monetary policy actions is appropriate in view of
the central bank’s objectives. It is on the basis of
its assessment of the monetary policy stance that
a central bank calibrates its actions.
In the case of the ECB, the primary objective,
as assigned by the Treaty on the Functioning
of the European Union, is to maintain price
stability. Thus, the Governing Council of the
ECB assesses whether the impact that monetary
policy is having on the economy and ultimately
price stability – i.e. its monetary policy
stance – is appropriate in order to achieve its
primary objective, taking into account all the
factors that affect the medium-term infl ation
outlook. The stance deemed appropriate at the
previous monetary policy meeting may require
adjustment, with new information having become
available. The Governing Council then decides
on the monetary policy course that will realign
its stance with the price stability objective.
The severity of the fi nancial crisis since the
autumn of 2008 and its spillover to the real
economy, together with the resulting high
levels of uncertainty, have complicated both the
assessment of risks to price stability and the way
in which monetary policy is able to infl uence
the euro area economy in order to ensure price
stability. In such circumstances, the maintenance
of price stability over the medium term has
required both the rapid lowering of the key ECB
interest rates and the introduction of temporary
measures to ensure their effective transmission to
the economy, with a view to tackling the fi nancial
crisis and cushioning its impact on the real
economy. As economic and fi nancial conditions
have now improved, not all exceptional measures
are needed to the same extent as in the past.
Indeed, continuing them could even have adverse
economic and fi nancial effects.
Against this background, this article describes
the way in which the ECB has assessed,
The ECB’s assessment of its monetary policy stance is essential for the preparation of its monetary policy decisions. That assessment aims to determine whether monetary policy is contributing to economic, fi nancial and monetary developments in a way that maintains price stability over the medium term. It is one of the important inputs that are examined by the Governing Council of the ECB when deciding on its monetary policy.
The ECB’s response to the intensifi cation of the fi nancial crisis in the autumn of 2008 is a good illustration of this process – from the assessment of the monetary policy stance to the decision to adjust it, followed by the signalling and implementation of the appropriate stance. The ECB’s broad-based and medium-term-oriented monetary policy strategy has guided the design and implementation of the monetary policy stance during the crisis. Specifi cally, maintaining price stability over the medium term has required the rapid lowering of the key ECB interest rates, as well as non-standard measures to ensure their effective transmission to the economy, with a view to tacklingthe fi nancial crisis and cushioning its impact on the real economy. Thus, the ECB has embarked on a policy of enhanced credit support. These exceptional measures are of a temporary nature and will be phased out gradually, progressively and in a timely manner when fi nancial conditions improve or if these measures begin to pose risks to the ECB’s primary objective of maintaining price stability.
ART ICLES
THE ECB’S MONETARY POLICY STANCE DURING THE FINANCIAL CRISIS

64ECB
Monthly Bulletin
January 2010
signalled and implemented the monetary policy
stance in the context of the recent fi nancial
crisis. Section 2 describes the ECB’s assessment
of the monetary policy stance in normal times,
and Section 3 shows how the fi nancial crisis has
complicated both the assessment of that stance
and the signalling and implementation of the
desired stance. Section 4 discusses the need for
the progressive, gradual and timely phasing-
out of the extraordinary measures adopted in
response to the crisis against the background of
the assessment of the monetary policy stance.
Section 5 concludes.
2 THE MONETARY POLICY STANCE IN NORMAL
TIMES
2.1 THE ECB’S MONETARY POLICY DECISIONS ARE
BASED ON AN ASSESSMENT OF ITS STANCE
With the monetary policy stance defi ned as
the contribution made by monetary policy to
economic, fi nancial and monetary developments,
the assessment of that stance involves looking
at whether this contribution is in line with the
central bank’s objective. In the case of the
ECB, therefore, this assessment involves two
elements: i) the formation of a view on the
medium-term infl ation outlook, and risks to price
stability in particular; and ii) the identifi cation
of the contribution that monetary policy
(i.e. its current and, given transmission lags,
past conduct) makes to the euro area economy
and the maintenance of price stability.
Assessing the monetary policy stance in real
time is always a challenging exercise. The
assessment must take account of the uncertainty
surrounding current and future economic
conditions and the functioning of the economy,
including the transmission of monetary policy
itself. Given the uncertainty surrounding any
such judgements in real time, the assessment
must be broad-based and forward-looking,
encompassing all the information relevant to the
formation of a view on the risks to price stability
in the medium term, including the potential
infl uence of monetary policy. The monetary
policy strategy of the ECB ensures a broad-based
and medium-term-oriented assessment of the
monetary policy stance. In particular, the strategy
has a two-pillar structure – comprising both an
economic analysis and a monetary analysis –
which provides two complementary perspectives
on the determination of price developments.1
The Governing Council decides on the
appropriate monetary policy stance by cross-
checking the indications regarding risks to price
stability that stem from the economic analysis
with those derived from the monetary analysis.
In this cross-checking, all complementarities
between the two pillars are exploited. Thus, the
assessment of the monetary policy stance takes
account of a broad range of economic, fi nancial
and monetary data, using a variety of models and
analyses. An element of judgement, based on
accumulated experience, is also essential.
This broad-based and medium-term-oriented
assessment of the monetary policy stance
ensures the robustness of policy decisions.
It reduces the risk of policy error as a result
of over-reliance either on a single forecast or
model or on summary indicators of the monetary
policy stance (such as indicators derived from
natural interest rates, Taylor rules, and monetary
and fi nancing conditions indices). The approach
adopted by the Governing Council ensures that
all the information relevant for the assessment of
future prices is used in a consistent and effi cient
manner, facilitating both the decision-making
process and its communication.
2.2 SIGNALLING AND IMPLEMENTING
THE DESIRED STANCE
In order to achieve the monetary policy stance
that is appropriate for maintaining price stability
over the medium term, the Governing Council
fi rst sets the key ECB interest rates. Under
normal circumstances, these key rates are the
See Chapter 3 of the special edition of the Monthly Bulletin 1
(entitled “10th anniversary of the ECB”) published in May 2008.

65ECB
Monthly Bulletin
January 2010
ARTICLES
The ECB’s monetary
policy stance during
the financial crisis
minimum bid rate on the main refi nancing
operations and the interest rates on the marginal
lending facility and the deposit facility, which
form a corridor around the minimum bid rate.
The Eurosystem then steers short-term market
interest rates within this corridor, and normally
towards the minimum bid rate, by means of its
monetary policy operations. The transmission
of monetary policy to the economy begins with
these short-term interest rates and ultimately
infl uences price developments. The ECB’s
communication supports the signalling and
achievement of the desired stance.
SEPARATION BETWEEN MONETARY POLICY
DECISIONS AND OPERATIONS
The overriding principle underlying the
Eurosystem’s operational framework for the
implementation of the monetary policy stance is the
concept of operational effi ciency. The operational
framework supports monetary policy’s fulfi lment
of the ECB’s price stability mandate by letting
monetary policy decisions feed through as quickly
and precisely as possible to short-term money
market rates. It implies a dividing line between
monetary policy decisions and the implementation
of the desired stance through monetary policy
operations. In line with the ECB’s mandate,
monetary policy decisions are geared towards
the maintenance of price stability (and include,
in particular, the setting of key ECB rates that
signal the monetary policy stance). Following the
monetary policy decisions, the monetary policy
operations keep short-term money market interest
rates in line with the level determined by monetary
policy decisions. In normal times, the separation
principle calls for the euro overnight index
average (EONIA) to be very close to the main
policy rate. In exceptional circumstances, when
spreads in the money market (e.g. those between
the euro interbank offered rate (EURIBOR) and
the rates on overnight index swaps (OISs)) were
abnormally high, the Governing Council decided
to adopt a fi xed-rate full-allotment approach
in all refi nancing operations. This has helped
to offset anomalies in money market interest
rate spreads and contributed to the EONIA
fl uctuating at levels closer to the deposit rate
(see Section 3).
IMPLEMENTATION AND TRANSMISSION
The implementation of the monetary policy
stance takes place via the Eurosystem’s
operational framework. Monetary policy
operations mark the start of the transmission
of the monetary policy stance by steering the
marginal cost of banks’ refi nancing. Broadly
speaking, the Eurosystem does so by allocating
an amount of liquidity that allows euro area
credit institutions to fulfi l their liquidity needs at
a price that is in line with the key interest rates
set by monetary policy-makers. These liquidity
needs comprise the liquidity necessary in order
to accommodate the reserve requirements
that the ECB imposes on credit institutions,
as well as changes in factors which cannot
be directly infl uenced by the Eurosystem,
called “autonomous factors” (e.g. banknotes
in circulation and government deposits held
with the Eurosystem). More precisely, the ECB
usually conducts its main refi nancing operations
as variable rate tender procedures for which the
minimum bid rate applies.
Short-term money market interest rates such as
the EONIA are normally steered in line with
the minimum bid rate, following the allotment
in the main refi nancing operations of an amount
of liquidity that allows credit institutions to
smoothly fulfi l their reserve requirements in
the course of a maintenance period (which is a
period of around a month). This allotment
amount in the main refi nancing operations
takes into account not only liquidity needs
resulting from “autonomous factors”, but also
liquidity supplied by means of other operations,
normally longer-term refi nancing operations.
The interest rates on the ECB’s standing
facilities effectively limit the range of variation
in overnight interest rates: the marginal lending
facility allows credit institutions to receive
ECB liquidity on an overnight basis, while the
deposit facility allows them to deposit liquidity
surpluses overnight.2
The implementation of monetary policy both in normal times 2
and in the various phases of the crisis is described in detail in the
article entitled “The implementation of monetary policy since
August 2007” in the July 2009 issue of the Monthly Bulletin.

66ECB
Monthly Bulletin
January 2010
The transmission of monetary policy to the real
economy begins with those short-term money
market interest rates. Ultimately, monetary
policy infl uences price developments. Changes in
money market interest rates are thus transmitted
to bank lending rates. This affects variables such
as money, credit growth and asset prices. These
in turn, together with external factors, lead to
changes in macroeconomic demand and supply,
and ultimately changes in infl ation.
THE ECB’S COMMUNICATION ON THE MONETARY
POLICY STANCE
The ECB’s communication policy forms
an essential element of the transmission of
monetary policy. The ECB’s transparent
communication contributes to the effective and
effi cient implementation of the monetary policy
stance.
First, explaining the assessment of the monetary
policy stance that underlies the decisions taken
raises the general public’s and the markets’
awareness and understanding of the ECB’s
monetary policy decisions. In this respect, the
two-pillar structure used in the assessment
provides a systematic framework not only for
internal decision-making (as indicated above),
but also for external communication with the
public. Using the same framework for internal
and external purposes has helped the ECB
to ensure that its monetary policy remains
consistent, credible and effective.
A second, related point is that good communication
helps private agents to understand the contribution
that monetary policy is intended to make to
economic and price developments over time.
Indeed, to the extent that communication helps
markets to better understand monetary policy
responses to economic developments and shocks,
it also assists them in anticipating the broad
direction of monetary policy over the medium
term. This implicit guidance tends to reinforce
the predictability of policy developments over
time. It affects expectations regarding the future
path of interest rates, thereby making policy
more effective.
Third, credible communication on the ECB’s
fi rm commitment to its objective serves to
anchor infl ation expectations, thereby facilitating
the conduct of monetary policy.3 The ECB’s
readiness to act (its “credible alertness”), its
steady-handed approach and its communication
together facilitate the effi cient use of its interest
rate instrument.
Overall, communication explains the rationale
underlying monetary policy decisions, guides
expectations in a manner consistent with the
assessment of the central bank and helps to
anchor expectations in line with price stability.
Thus, the ECB’s communication is instrumental
in the implementation of the desired stance, as it
helps to align the understanding and expectations
of the public and the markets with this desired
stance and the ultimate price stability objective.
3 THE MONETARY POLICY STANCE DURING
THE RECENT CRISIS
The fi nancial crisis has complicated both the
assessment determining the monetary policy
stance that is appropriate for the maintenance of
price stability and the signalling and
implementation of that stance.4
3.1 ASSESSING THE MONETARY POLICY STANCE
DURING THE CRISIS
AN ASSESSMENT IN THE PRESENCE
OF HEIGHTENED UNCERTAINTY
Assessing the monetary policy stance is already
challenging in normal times. It is even more
At the same time, this anchoring minimises costs in contractual 3
relationships (by reducing infl ation risk premia). More generally,
by providing an anchor of stability in a world of economic
fl uctuation, the ECB should have a positive effect on the
confi dence of economic agents at times of uncertainty, possibly
also allowing for a more sustainable and rapid correction of
economic downturns. This anchoring of infl ation expectations
thereby fosters an environment which is conducive to sustainable
economic growth and employment in the euro area.
For more details concerning the information in this section, see 4
the speeches given by the President of the ECB on 13 July 2009
in Munich, on 22 August 2009 in Jackson Hole and on
4 September 2009 in Frankfurt am Main.

67ECB
Monthly Bulletin
January 2010
ARTICLES
The ECB’s monetary
policy stance during
the financial crisis
challenging when the economic situation is
changing rapidly and there is a high degree
of uncertainty. When the fi nancial turmoil
emerged, and especially when it intensifi ed
in the aftermath of the collapse of Lehman
Brothers in September 2008, the assessment of
the monetary policy stance had to be conducted
in an environment of heightened uncertainty.
Given the exceptional circumstances, regularities
observed in normal times could not be relied
upon when interpreting developments in many
economic and fi nancial variables. This meant
that standard models and projections based on
such regularities were less reliable than in the
past.5 Uncertainty surrounded both the nature of
the shocks affecting the euro area economy and
the functioning of the economy itself. Notably,
it was diffi cult to gauge in real time the nature
and extent of fi nancial developments and their
spillover to the real economy. With confi dence
evaporating in the interbank market and the
money market becoming dysfunctional, the
transmission of monetary policy itself was
disrupted. Indeed, in the euro area, the fi rst
phase of the transmission process relies to
a large extent on intermediation within the
banking sector. As a result, it was more diffi cult
to gauge the two central elements of the stance
assessment as described in Section 2.1, namely:
i) the outlook for price stability over the medium
term; and ii) the contribution that monetary
policy ultimately makes to that outlook.
ITS BROAD-BASED APPROACH HAS SERVED
THE ECB PARTICULARLY WELL
The benefi ts of the ECB’s broad-based
two-pillar approach to the assessment of the
monetary policy stance have been particularly
visible during the fi nancial crisis. To ensure the
appropriate policy response, it is essential to
look beyond volatility in economic and fi nancial
data and understand underlying developments.
In the presence of such heightened uncertainty,
the ECB’s broad-based approach in its monetary
policy strategy has allowed policy-makers to
obtain a more comprehensive and accurate
overall picture of underlying developments and
the associated risks to price stability.
In particular, the economic analysis has helped
the ECB to understand the impact that external
factors (e.g. developments in oil prices and
specifi c market segments such as the
US sub-prime market) have on the euro area
economy, as well as the links between the
fi nancial sphere and the real economy.
The economic analysis has also helped the ECB
to understand and anticipate the reversal of the
infl ationary trend associated with previous large
increases in energy prices. This has avoided any
possibility of the disinfl ation observed in 2009
being confused with outright defl ation and
triggering inappropriate policy reactions.
The monetary analysis has helped to maintain a
medium-term perspective, given the
fundamental link between money and infl ation
over longer horizons. It has also helped to
improve the understanding of developments in
monetary aggregates, banks’ balance sheets,
money markets, asset prices and credit fl ows,
which have been of crucial interest given the
fi nancial origins of the economic downturn.6
The picture of underlying developments
included in the ECB’s assessment of the
monetary policy stance has, in turn, formed the
basis for the interest rate decisions taken and the
non-standard measures adopted. Notably, that
understanding of the distortions affecting the
transmission mechanism and the identifi cation of
the channels through which the fi nancial turmoil
could potentially spill over to the real economy
have guided the design of the monetary policy
action taken in order to contain these spillovers
and the related risks to price stability over the
medium term.
3.2 THE MONETARY POLICY RESPONSE
In the exceptional circumstances created by
the fi nancial crisis, the ECB’s signalling and
implementation of its monetary policy stance
has involved not only interest rate decisions, but
also non-standard measures.
See the article entitled “The latest euro area recession in a 5
historical context” in the November 2009 issue of the Monthly
Bulletin.
See the article entitled “Monetary analysis in an environment of 6
fi nancial turmoil” in the November 2009 issue of the Monthly
Bulletin.

68ECB
Monthly Bulletin
January 2010
At the beginning of the fi nancial turmoil,
when access to liquidity in money markets
became severely hampered in August 2007,
the Eurosystem reacted swiftly to ensure that
this did not lead to a major systemic fi nancial
crisis. It reacted mainly by amending the
timing and maturity of its liquidity-providing
operations to accommodate the funding needs
of banks. In addition, it provided liquidity in
foreign currencies. Following the collapse of
Lehman Brothers, the turmoil escalated into a
fi nancial crisis, which rapidly spread to the global
fi nancial system and caused a severe downturn
in the euro area economy, resulting in subdued
infl ationary pressures. In response to these
developments, the Governing Council adopted a
number of standard and non-standard measures.
Thus, given the changes in the assessment of
risks to price stability, the Governing Council cut
the ECB’s key interest rates by 325 basis points
to 1%, a level not seen in the countries of the
euro area since at least the Second World War.
As the functioning of the fi nancial system – and
the money market in particular – was severely
hampered, the Governing Council adopted a
number of non-standard measures to guard
further against a systemic liquidity crisis in
the euro area fi nancial system, to support the
transmission of its interest rate decisions and
to enhance the fl ow of credit to households and
corporations.
ENHANCED CREDIT SUPPORT
The ECB’s “enhanced credit support” comprises
non-standard measures that support fi nancing
conditions and credit fl ows above and beyond
what could be achieved through reductions in
key ECB interest rates alone.
This approach has been tailored to the fi nancial
structure of the euro area economy and the
specifi c circumstances of the global fi nancial
crisis. It has focused on banks, as in the euro
area banks are the primary source of fi nancing
for the real economy. Indeed, the bulk of the
external fi nancing of non-fi nancial corporations
comes from the banking sector. The banking
sector is especially important when it comes to
providing fi nancing to small and medium-sized
enterprises, which in turn play a key role in the
euro area economy. As regards the specifi c
circumstances of the crisis, two factors have
been particularly important. First, given the
systemic liquidity threat posed by the crisis, the
measures have focused on ensuring that banks
have broad and deep access to central bank
liquidity in these exceptional circumstances.
Second, with euro area banks’ access to foreign
currency interbank markets severely impaired,
the ECB has decided to provide liquidity to the
euro area banking sector in US dollars in
exchange for euro-denominated collateral. This
is backed by the swap facility that the ECB has
arranged with the US Federal Reserve.7 More
specifi cally, the enhanced credit support
comprises a set of fi ve measures:
the provision to euro area banks of unlimited 1.
liquidity at a fi xed rate in all refi nancing
operations against adequate collateral;
the lengthening of the maximum maturity 2.
of refi nancing operations from three months
prior to the crisis to one year;
the extension of the list of assets accepted as 3.
collateral;
the provision of liquidity in foreign 4.
currencies (notably US dollars); and
outright purchases in the covered bond 5.
market.
These measures focus on the banking sector,
with the fi rst four dealing with the provision
of liquidity in euro and foreign currencies. The
decision to purchase covered bonds outright
was taken in order to support the covered bond
market, which is a very important fi nancial
market in Europe and a primary source of
fi nancing for banks. This measure has fostered
primary issuance and reduced the particularly
elevated spreads in this market.
The ECB has also established swap facilities for Swiss francs 7
and Swedish kronor.

69ECB
Monthly Bulletin
January 2010
ARTICLES
The ECB’s monetary
policy stance during
the financial crisis
These enhanced credit support measures
constitute the ECB’s approach to non-standard
policy-making in the context of the recent
fi nancial crisis. They are not comparable with
the US Federal Reserve’s “credit easing”
and the “quantitative easing” conducted by
the Bank of Japan and the Bank of England.
The major central banks of the world are all
united in purpose, but they act in economies
and institutional contexts that are very
different. In the United States, for example, it is
fi nancial markets – and not banks – that are the
primary source of external fi nancing for fi rms.
This explains why there is a much stronger
focus on outright fi nancial market purchases
in the United States. In addition, differences in
institutional arrangements may have an impact
on the operational frameworks of central banks.
TEMPORARY LOOSENING OF THE CLOSE LINK
BETWEEN POLICY AND MARKET INTEREST RATES
In these exceptional circumstances, the signalling
of the monetary policy stance has become more
complex. The close relationship that normally
exists between the main refi nancing rate and
money market rates has taken on a different and
more complex form. The decision to shift to a
fi xed rate tender procedure with full allotment
in refi nancing operations (rather than providing
liquidity through competitive auctions) and
the lengthening of the maximum maturity of
operations to one year for a temporary – but
extended – period have been necessary in
order to mitigate the effects of the impaired
functioning of the money market. Market
participants’ strong demand for liquidity,
which has been fully accommodated by the
Eurosystem, has caused overnight money
market rates to fall signifi cantly below the
main refi nancing rate and relatively close to the
deposit rate. In this respect, the non-standard
measures have temporarily led to a different
relationship between monetary policy decisions
and monetary policy operations. The new
positioning of the overnight money market rate
was considered acceptable in these exceptional
circumstances as a means of helping to offset
the impaired functioning of the money market
and, in particular, the abnormally high level
of spreads on the term money market rates. In
this context, the deposit rate has played a more
prominent role than in the past with respect to
the EONIA and other very short-term money
market interest rates.
A STANCE GEARED TOWARDS PRICE STABILITY
Monetary policy’s response to the fi nancial
crisis has been geared towards the achievement
of the ECB’s price stability objective. The fi rm
anchoring of medium-term infl ation expectations
is essential in order to support sustainable
growth and employment and contribute to
fi nancial stability.
The ECB’s actions have supported both the
banking sector’s access to liquidity and the
recovery of the euro area economy, thereby
allowing the implementation of a monetary
policy stance which is appropriate for
maintaining price stability over the medium
term. The measures adopted in response to
the intensifi cation of the fi nancial crisis have
contributed to the normalisation of economic
and fi nancial conditions. In particular, the
measures implemented by the Eurosystem have
supported credit fl ows to the economy through
both supply factors (notably by alleviating
funding pressures in the banking sector) and
demand factors (owing to the very low level of
interest rates). In addition, by emphasising its
fi rm focus on the price stability objective and
its readiness to act, and by acting accordingly,
the ECB has presented itself as an anchor of
stability in times of heightened uncertainty. This
has been instrumental in fostering confi dence in
the context of the very weak economic activity
foreseen in the short term. Throughout the crisis,
medium to longer-term infl ation expectations in
the euro area have remained fi rmly anchored in
line with the Governing Council’s defi nition of
price stability, with infl ation rates below, but
close to, 2% over the medium term.

70ECB
Monthly Bulletin
January 2010
4 THE PHASING-OUT OF NON-STANDARD
MEASURES
The primary objective of price stability – which
has led to monetary policy being implemented
by means of both standard and non-standard
measures in response to the subdued infl ationary
pressures observed during the fi nancial crisis –
also means that a return to a more normal
monetary policy framework is a natural aim.
All of the non-standard measures adopted have
been designed with their phasing-out in mind.
Most of the measures unwind naturally in
the absence of an explicit decision to prolong
them. In addition, the ECB has the ability to act
whenever it deems this necessary. In particular,
the ECB’s high degree of institutional
independence means that it is unrestricted
in its ability to implement the appropriate
decisions, and the operational framework
incorporates the necessary fl exibility. In part as
a result of the measures adopted by the ECB,
fi nancial conditions have fi rst stabilised and
then improved. The extraordinary conditions
that led the Governing Council to adopt the
non-standard measures will gradually fade
away, and the extraordinary liquidity measures
will not be needed to the same extent as in the
past.
Consequently, the Governing Council decided
at its meeting on 3 December 2009 to gradually
phase out those non-standard measures that
were no longer needed, beginning in the fi rst
quarter of 2010, while continuing with some
other components. In particular, the number and
frequency of longer-term refi nancing operations
is gradually being scaled back. The last one-year
operation was conducted in December 2009,
one fi nal six-month operation will be conducted
in March 2010, and the number of three-month
operations is being reduced as of the fi rst quarter
of 2010.
The decision to initiate the gradual phasing-
out of these measures refl ects, as indicated, the
improvements observed in fi nancial conditions.
Money markets are performing better, and the
past reductions in the ECB’s key policy rates are
increasingly being refl ected in the interest rates
on bank loans to households and corporations,
indicating that the transmission process is
broadly functioning. In such an environment,
the gradual phasing-out of some non-standard
measures is not expected to have a negative
impact on fi nancing conditions.
At the same time, the timing of the decision to
begin phasing out those measures refl ects the
fact that there would have been an increased
risk of adverse side effects had all measures
been extended in the current circumstances.
Improvements in fi nancial conditions allow
banks to begin performing part of their “normal”
role in the money market, thereby reducing the
intermediation role of the Eurosystem. Keeping
all of the non-standard measures in place when
they are no longer needed could induce distortions
such as excessive reliance on exceptional central
bank liquidity and associated moral hazard
problems. In addition, the continuation of all
elements of the enhanced credit support in the
context of improving fi nancial conditions could
result in weak fi nancial incentives to restructure
banks’ balance sheets and delay the necessary
adjustments. In the presence of accommodative
interest rates, excess liquidity could also lead to
excessive risk-taking.
The decision to phase out some of the
non-standard measures refl ects the gradual
approach that the ECB has adopted. These initial
steps allow account to be taken of the way in
which fi nancial conditions and fi nancial market
participants react to the ECB taking on a smaller
role as a money market intermediary. In addition,
the continued high degree of uncertainty and the
ECB’s steady-handedness argue in favour of a
gradual approach.
In particular, the fact that non-standard measures
have begun to be phased out does not mean the
discontinuation of enhanced credit support.
The Eurosystem will continue to provide
liquidity to the banking system at very
favourable conditions. At the same time, the
economy is continuing to benefi t from the
71ECB
Monthly Bulletin
January 2010
ARTICLES
The ECB’s monetary
policy stance during
the financial crisis
gradual pass-through of past decreases in key
ECB interest rates. Against the background of
improving fi nancial and economic conditions,
the phasing-out of non-standard measures
should not necessarily imply a tightening of the
monetary policy stance.
Looking to the future, the gradual phasing-out
of non-standard measures will allow a gradual
return to a more standard implementation of
monetary policy. The main refi nancing rate
should regain its key role in the signalling and
implementation of the monetary policy stance –
and, in turn, in the assessment of the monetary
policy stance itself. This would allow a full
return to the clear distinction between monetary
policy decisions and their implementation.
This will facilitate the implementation of
monetary policy, as it enables monetary
policy decisions to feed through as quickly
and precisely as possible to short-term money
market rates as the fi rst stage of the transmission
process. It should be noted that the operational
framework is fl exible, allowing control over
interest rates even without the phasing-out of
non-standard measures. From a forward-looking
perspective, extraordinary liquidity measures
that are not needed to the same extent as before
will gradually and progressively be phased out
at the appropriate time. In order to effectively
counter any threat to price stability over the
medium to longer term, relevant measures will
be phased out when necessary. In this way,
the Governing Council will continue to ensure
the fi rm anchoring of medium-term infl ation
expectations.
5 CONCLUSION
The ECB assesses the monetary policy stance
by adopting a broad-based, forward-looking
approach. The benefi ts of applying this
approach have been particularly visible during
the fi nancial crisis. In particular, it has allowed
policy-makers to obtain a meaningful assessment
of underlying developments and associated risks
to price stability in an environment marked by a
high level of uncertainty. The outlook for price
stability has changed fundamentally in the course
of the crisis. The ECB has responded to this
change by strongly and rapidly lowering its key
interest rates. In addition, dysfunctional money
markets have weakened the ability of monetary
policy to infl uence this outlook by means of
interest rate decisions alone. Thus, with a view
to supporting the effective transmission of
monetary policy and cushioning the impact on
the real economy and the medium-term infl ation
outlook, the ECB has adopted a number of non-
standard measures. The ECB’s enhanced credit
support has aimed to ensure the fl ow of credit to
households and corporations.
Because of their exceptional nature, these
non-standard measures have to be gradually
phased out once the situation in fi nancial markets
normalises and the transmission of monetary
policy begins to function normally again.
Keeping these measures in place for too long
would lead to distortions and would not provide
the banking sector with appropriate incentives
conducive to sustainable economic growth and
stable price developments in the longer term. At
the same time, the effects of the sizeable policy
interest rate cuts and the enhanced credit support
will continue to feed through to the economy
even after the phasing-out of the non-standard
measures has begun.


73ECB
Monthly Bulletin
January 2010
ARTICLES
The ECB’s relations with
European Union institutions
and bodies – trends
and prospects
THE ECB’S RELATIONS WITH EUROPEAN UNION INSTITUTIONS AND BODIES – TRENDS AND PROSPECTS
More than one decade has passed since the launch of the euro and the creation of the European Central Bank (ECB). This article reviews the evolution of the relations of the ECB – against the background of its independent status and its responsibility for the single monetary policy of the euro area – with each of the relevant European Union (EU) institutions and bodies over this period. It identifi es four common trends: an increased frequency of interaction; a broadening of the topics discussed; a deepening of the discussions, with an increased number of contributions by the ECB; and an increase in the number of specifi c deliberations in euro area composition. The institutional setting of Economic and Monetary Union (EMU), put in place by the Maastricht Treaty and solidly based on the independence of the ECB, has thus proved sound. The Treaty of Lisbon provides opportunities to further enhance economic governance, and should be fully exploited by the parties involved.
1 INTRODUCTION
With the creation of the euro, those EU Member
States that have introduced the single currency
have achieved what the Lisbon Treaty lists as
an objective of the Union: “an economic and
monetary union whose currency is the euro”.
EMU marks a break in the traditional link
between a currency and the nation state. The
construction of EMU involves the transfer
of monetary and exchange rate policies to
the EU level, while economic policies largely
remain within the remit of Member States
and are subject to coordination procedures.
In order to ensure a smooth functioning of EMU
via effective interaction between the relevant
national and supranational economic policy-
makers, a tailor-made institutional framework –
equivalent to the arrangements that exist within
a nation state – has been put into place. The
Treaty establishing the European Community –
since 1 December 2009 the Treaty on the
Functioning of the European Union (TFEU)
referred to hereinafter as “the Treaty” – provides
for close interaction between the ECB, in full
respect of its prerogatives and independence,
and other EU economic policy-makers, ranging
from consultation through policy dialogue to
regulatory competences. Within the boundaries
set by the Treaty, these relations have evolved
over time in response to the challenges that
have arisen, thus contributing to the smooth
functioning of EMU.
This article presents an overview of the ECB’s
relations with EU institutions and bodies
to date.1 It fi rst briefl y describes their underlying
political, economic and fi nancial basis. It then
reviews how the ECB’s interactions with each
of the relevant EU institutions and bodies have
developed over the past decade and identifi es
certain common trends. Particular attention is
devoted to changes observed since the beginning
of the fi nancial turmoil in summer 2007.
In conclusion, the article considers the future
prospects of the ECB’s relations with EU
institutions and bodies, in particular in the light
of the implications of the Treaty of Lisbon.
2 THE RATIONALE BEHIND THE ECB’S RELATIONS
WITH EU INSTITUTIONS AND BODIES
The ECB occupies a special position within
the institutional framework of the EU, given
its specifi c tasks and independent status. Its
interactions with EU institutions and bodies are
built on clear principles and legal provisions
refl ecting their political, economic and fi nancial
basis.
2.1 POLITICAL RATIONALE: INDEPENDENCE
The Treaty assigns a clear and unambiguous
mandate to the ECB to maintain price stability.
It grants the ECB full independence from
See also the article entitled “The ECB’s relations with institutions 1
and bodies of the European Community” in the October 2000
issue of the Monthly Bulletin as well as the relevant part of the
special issue of the Monthly Bulletin on the occasion of the
10th anniversary of the ECB.

74ECB
Monthly Bulletin
January 2010
political inference to fulfi l this mandate. Given
that these provisions have been enshrined in
both the Treaty and the Statute of the European
System of Central Banks (ESCB) and of the
ECB, rather than in ordinary legislation, they
have gained “constitutional” status. An
independent central bank, removed from the
political decision-making process, is indeed in a
better position to achieve the primary objective
of price stability, as it can look ahead over a
longer horizon, while politicians have shorter-
term objectives in line with the election cycles.
Empirical evidence across countries and long
time spans confi rms that greater central bank
independence is associated with lower average
infl ation.2 The respect for the ECB’s
independence implies that the ECB’s relations
with other policy-making bodies cannot go
beyond a non-binding dialogue. Notably, there
cannot be any ex ante coordination of monetary
policy with economic policy, as this would blur
the allocation of responsibilities between policy-
makers, which in turn would dilute
accountability.
The Treaty confers on the ECB exclusive
competence for the monetary policy of the
euro area. The ECB has therefore been entrusted
with the core aspect of monetary sovereignty.
Just like any other independent central bank,
the ECB is required to subject its actions and
decisions to public scrutiny and demonstrate
that it “acts within the limits of the powers
conferred upon it by the Treaties” (Article 13
of the Treaty on European Union). It is
therefore called upon to explain and justify
to European citizens and their elected
representatives how it uses the powers and
prerogatives with which it has been entrusted
to pursue its objectives – in short, it must
be held accountable. Transparency serves
accountability. A strong commitment to
transparency imposes self-discipline on policy-
makers, which helps to ensure that their public
policy decisions and explanations are consistent
over time. This, in turn, also supports the
credibility of public policies. It is therefore in
the ECB’s self-interest to safeguard the public
acceptance of the ECB’s independent status
and to ensure that its decisions are properly
explained.
Consequently, both the Treaty and the Statute
of the ESCB and of the ECB contain a number
of provisions that lay down the ECB’s reporting
obligations (for more details see the box, which
presents the main legal provisions governing
the ECB’s relations with EU institutions and
bodies). The ECB is required to address an
annual report on its monetary policy and other
activities to the European Parliament, the
Council of the European Union (EU Council),
the European Commission and the European
Council. Moreover, the President of the ECB and
the other members of the Executive Board may
be heard by the competent committees of the
European Parliament, either at the Parliament’s
or their own request.
Finally, the ECB goes beyond the reporting
obligations laid down in the Treaty and strives
towards effective and regular communication
vis-à-vis the general public, via press
conferences, speeches by Executive Board
members, the Monthly Bulletin and a range of
other task-related publications.
2.2 ECONOMIC RATIONALE: THE PROPER
FULFILMENT OF THE ECB’S TASKS
Beyond these reporting requirements, the
relations between the ECB and EU institutions
and bodies also have an economic and functional
basis. The ECB – as the central bank of the
euro area – is in contact, at the European level,
with the authorities and the social partners.
In the European context, this interaction is
rendered more complex owing to the allocation
of policy responsibilities to the different levels
of government, both supranational and national.
Economic actors operating at the national level
have a signifi cant impact on price developments
See, inter alia, A. Alesina, and L. Summers, “Central Bank 2
Independence and Macroeconomic Performance: Some
Comparative Evidence”, Journal of Money, Credit and Banking,
25:2, 1993.

75ECB
Monthly Bulletin
January 2010
ARTICLES
The ECB’s relations with
European Union institutions
and bodies – trends
and prospects
through mechanisms such as wage bargaining
or fi scal policy. Regular dialogue between the
ECB and other relevant economic policy-makers
provides an opportunity for the ECB to enrich its
information set and explain its course of monetary
policy, and for its counterparts to improve their
understanding of the ECB’s actions and how
their own actions feed into the monetary policy
transmission process. In this way, the ECB can
provide a reliable reference parameter for the
decisions of individual actors. Moreover, for
those tasks where the ECB shares competences
with other EU institutions or bodies, for instance
in the fi eld of statistics, the Treaty explicitly
calls for cooperation between the ECB and the
institutions or bodies concerned.
Box
RELEVANT LEGAL TEXTS CONCERNING THE ECB’S RELATIONS WITH EUROPEAN UNION INSTITUTIONS
AND BODIES
The Treaty on the Functioning of the European Union
Article 2841. The President of the Council and a Member of the Commission may participate, without
having the right to vote, in meetings of the Governing Council of the ECB.
The President of the Council may submit a motion for deliberation to the Governing Council of
the ECB.
2. The President of the ECB shall be invited to participate in Council meetings when the Council
is discussing matters relating to the objectives and tasks of the ESCB.
3. The ECB shall address an annual report on the activities of the ESCB and on the monetary
policy of both the previous and current year to the European Parliament, the Council and the
Commission, and also to the European Council. The President of the ECB shall present this
report to the Council and to the European Parliament, which may hold a general debate on that
basis.
The President of the ECB and the other members of the Executive Board may, at the request of
the European Parliament or on their own initiative, be heard by the competent committees of the
European Parliament.
Article 1341. In order to promote coordination of the policies of Member States to the full extent needed for
the functioning of the internal market, an Economic and Financial Committee is hereby set up.
2. (…) The Member States, the Commission and the ECB shall each appoint no more than two
members of the Committee.

76ECB
Monthly Bulletin
January 2010
2.3 FINANCIAL RATIONALE: ENSURING SOUND
FINANCIAL MANAGEMENT
Scrutiny of the ECB’s fi nancial management and
integrity is of crucial importance, as the functions
performed by the ECB involve taxpayers’
money. The Statute of the ESCB and of the ECB
provides for two layers of external control: on
the one hand, an independent external auditor is
appointed to audit the annual accounts of the ECB
(Article 27.1); on the other hand, the European
Court of Auditors examines the operational
effi ciency of the management of the ECB
(Article 27.2). The annual report of the European
Court of Auditors, together with the ECB’s reply,
is published on the ECB’s website and in the
Offi cial Journal of the European Union.
In addition, the ECB falls within the scope of
the anti-fraud scheme that was set up by the
European Parliament and the EU Council at the
end of the 1990s. The “OLAF Regulation” 3
provides, inter alia, for the internal investigation
of suspected fraud within EU institutions and
bodies by the European Anti-Fraud Offi ce
(OLAF), which is an independent investigation
service within the European Commission.
In June 2004 the Governing Council of the ECB
adopted a decision laying down the rules
according to which OLAF would carry out
internal investigations. According to those
provisions, OLAF’s investigative powers are
applicable to all ECB tasks, and the ECB is
committed to fully cooperate with OLAF in
combating fraud.
3 A DECADE OF RELATIONS
Against the background of the political,
economic, fi nancial and legal basis for
interaction between an independent ECB and the
relevant institutions and bodies of the European
Union, this section presents these relations and
reviews their development over time.
3.1 THE EUROPEAN PARLIAMENT
The European Parliament – as the body which
derives its legitimacy directly from the citizens of
the European Union – is the key focus of the
ECB’s reporting obligations. The President of the
ECB appears four times a year before the
Regulation (EC) No 1073/1999 of the European Parliament 3
and of the Council of 25 May 1999 concerning investigations
conducted by the European Anti-Fraud Offi ce (OLAF).
Resolution of the European Council of 13 December 1997 on economic policy coordination in Stage Three of EMU and on Articles 138, 219 and 284 of the Treaty (ex Articles 111 and 113)
(…) The Ministers of the States participating in the euro area may meet informally among
themselves to discuss issues connected with their shared specifi c responsibilities for the single
currency. The Commission, and the European Central Bank when appropriate, will be invited to
take part in the meetings.
(…) The Economic and Financial Committee, which will bring together senior offi cials from the
national central banks and the ECB as well as from fi nance ministries, will provide the framework
within which the dialogue can be prepared and continued at the level of senior offi cials.
Presidency conclusions of the Cologne European Council (June 1999)
(…) The European Council deems it necessary, in addition to the Luxembourg and the Cardiff
processes, to set up a regular Macroeconomic Dialogue (the Cologne process) within the
framework of the ECOFIN Council in co-operation with the Labour and Social Affairs Council
and with the participation of representatives of both formations of the Council, the Commission,
the European Central Bank and the social partners.

77ECB
Monthly Bulletin
January 2010
ARTICLES
The ECB’s relations with
European Union institutions
and bodies – trends
and prospects
Committee on Economic and Monetary Affairs
(the ECON Committee). In addition, the President
and other members of the ECB’s Executive Board
appear before the ECON Committee to discuss
specifi c issues.4 Furthermore, and most
importantly, the President appears at least once a
year before the Parliament’s plenary session to
present the ECB’s Annual Report. Finally, the
European Parliament is consulted on the
appointment of the President, Vice-President and
other members of the ECB’s Executive Board.
Over the past decade, the ECB’s relations with
the European Parliament have widened in scope
and deepened in intensity. Besides the regular
assessment of the economic situation in the euro
area and the monetary policy stance, the various
exchanges of views have covered an increasing
number of topics, such as enlargement of the
euro area, international cooperation, payment
and settlement systems, and fi nancial stability
and supervision. The latter theme has increased
in prominence, especially since the start of the
fi nancial crisis. In its various resolutions on
economic and fi nancial developments in the
European Union, the European Parliament has
recognised the timely and decisive actions taken
by the ECB in managing the fi nancial turmoil
and advocated the enhancement of the ECB’s
role in the fi eld of fi nancial stability.
Furthermore, these relations have deepened
over time. Beyond the interaction and exchange
of views with the members of the ECON
Committee itself, the ECB has maintained
constructive relations with the European
Parliament at the highest level, for example
through regular meetings between the Presidents
of the two institutions. The ECB has also been
supportive of the European Parliament’s efforts
to enhance inter-parliamentary cooperation
involving the national parliaments of the EU
Member States, for example by explaining the
ECB’s actions during the fi nancial crisis to a
Joint Parliamentary Meeting.
Moreover, the ECB has established a voluntary
practice of replying in writing to questions
from all members of the European Parliament –
channelled via the chairperson of the ECON
Committee – on issues related to the ECB’s fi elds
of competence. The ECB considers this practice
to be fundamental, insofar as it provides feedback
on topical issues from the representatives of EU
citizens and, thus, from the public at large. This
continuous interaction also offers an opportunity
to respond to EU citizens’ concerns and to convey
key messages to members of the European
Parliament. The ECB also informs the European
Parliament of the actions taken in following up
suggestions contained in the European Parliament
resolution on the ECB’s Annual Report.
In recent years, the hearings of the President of
the ECB in the plenary session have also included
the Commissioner for Economic and Monetary
Affairs and the Eurogroup President and have
thus become an opportunity for a comprehensive
discussion on euro area economic policy issues.
Finally, a delegation of the ECON Committee
has regularly visited the ECB over the last few
years to exchange views with the members of the
Executive Board on a variety of issues.
In addition to these formal institutional relations
at the policy level, the ECB and the European
Parliament have developed close working
relations. In this context, ECB staff have
provided the European Parliament, upon request,
with expertise on technical issues (e.g. euro
counterfeiting, capital requirements and statistics),
in the spirit of mutual sincere cooperation among
EU institutions.
3.2 THE ECOFIN COUNCIL, THE EUROGROUP
AND THEIR PREPARATORY COMMITTEES
3.2.1 THE ECOFIN COUNCIL
The ECOFIN Council is the key forum for the
coordination of Member States’ economic policies
(as stated in the European Council Resolution
of 13 December 1997). The ECB is invited to
participate in meetings of the ECOFIN Council
whenever matters relating to the objectives and
tasks of the ECB are discussed. Such topics
include, among others, the Broad Economic
Policy Guidelines (BEPGs), the reform of the
For more information, see the ECB’s Annual Report.4

78ECB
Monthly Bulletin
January 2010
European fi nancial supervisory and regulatory
framework or the external representation of the
European Union in international fora. Moreover,
the President of the ECB presents the ECB’s
Convergence Report to the ECOFIN Council in
the context of the biennial examination of the
state of convergence of the countries still outside
the euro area and provides information on the
preparation for the introduction of euro banknotes
and coins.
The relations between the ECOFIN Council and
the ECB are not a one-way street. The Treaty
(and the Statute of the ESCB and of the ECB)
explicitly provides for the possibility of the
President of the ECOFIN Council participating
in meetings of the Governing Council and the
General Council of the ECB. In practice, the
Eurogroup President attends the meetings of
the Governing Council. At the same time the
Treaty expressly excludes any voting rights on
the part of the President of the ECOFIN Council
when participating in meetings of the ECB’s
Governing Council. This interaction at the
highest level enhances the fl ow of information
between all parties involved, promotes mutual
understanding of each other’s policy views
and allows for a dialogue on issues of common
interest, in full respect of the respective
responsibilities.
In addition to its formal monthly meetings, the
ECOFIN Council also meets on an informal
basis every six months, offering an opportunity
for frank and open discussion on topical issues.
The President and Vice-President of the ECB
attend these informal meetings, alongside the
governors of the national central banks (NCBs)
of the ESCB, who accompany the economics
and fi nance ministers of their respective
Member States.
Looking back over how the interaction has
developed over the past ten years, the start of the
fi nancial turmoil in August 2007 marks a
discernible intensifi cation. From the creation of
the ECB in 1998 until the start of the fi nancial
turmoil, participation of the ECB at Executive
Board level in the meetings of the ECOFIN
Council took place on an ad hoc basis, linked to
the discussion of specifi c topics close to the
ECB’s fi eld of competence (e.g. in addition to
the aforementioned themes, issues related to the
introduction of euro banknotes and coins, the
introduction of the Lamfalussy framework for
fi nancial regulation and supervision, and the
implementation and reform of the Stability and
Growth Pact). Since the start of the fi nancial
turmoil in August 2007, a more intense dialogue
between the ECB and the ECOFIN Council has
become necessary, which has been refl ected in a
more frequent attendance of the President and/or
Vice-President of the ECB at ECOFIN Council
meetings. On average, they have attended at
least one out of two formal ECOFIN Council
meetings, as well as the additional informal
meetings called by the relevant Presidency of
the EU Council in the context of the fi nancial
crisis.5 Besides the more frequent attendance at
meetings, on several occasions the ECOFIN
Council has called on the ECB, sometimes
together with the European Commission, to
provide expertise and analysis in connection with,
for instance, common EU guidelines on the design
of national bank rescue packages, government
guarantees for bank debt and asset relief schemes.
A further example of the intensifi cation of the
interaction between the ECB and the European
institutions and bodies is the creation of a
“fi nancial crisis cell” (comprising the President
of the ECB, in conjunction with the NCBs;
the President of the European Commission; the
President of the Eurogroup; the Presidency-
in-offi ce; and the governments of the Member
States) to enable the EU to take rapid and
effective crisis response measures.
3.2.2 THE EUROGROUP
The Eurogroup is an informal body composed of
the fi nance ministers of the euro area countries
that provides a forum for the discussion among
governments of “issues connected with their
shared specifi c responsibilities for the single
Such as the one called by the French Presidency in 5
December 2008 and the one called by the Swedish Presidency of
the EU in September 2009 in the run up to the Pittsburgh summit
on 24-25 September 2009.

79ECB
Monthly Bulletin
January 2010
ARTICLES
The ECB’s relations with
European Union institutions
and bodies – trends
and prospects
currency.” (Luxembourg European Council
Conclusions 1997). Generally, the Eurogroup
meets once a month on the eve of the ECOFIN
Council meeting. The Commissioner for
Economic and Monetary Affairs and the
President of the ECB, normally accompanied
by the Vice-President, attend the Eurogroup
meetings on a regular basis. The meetings of the
Eurogroup set the stage for an open dialogue in
a climate of mutual trust and respect.
Notwithstanding this informal nature, a number
of changes have been introduced over the last ten
years in order to enhance the organisation of the
meetings and boost the Eurogroup’s visibility.
For instance, since 2005 the Eurogroup has
elected a President with a two-year mandate,
thus ensuring greater continuity both internally
and externally. Moreover, press conferences are
organised immediately following the meetings,
during which the Eurogroup President –
joined by the Commissioner for Economic
and Monetary Affairs and, when appropriate,
the President of the ECB – communicates the
results of the Eurogroup meeting. Especially on
those issues where a consistent message from
all participants of the meetings is of particular
importance, the Eurogroup endeavours also
to decide on key aspects of the external
communication of its deliberations. Finally,
a regular dialogue between the Eurogroup
President and the European Parliament has
been instituted.
Over time, the agenda of the Eurogroup
has gradually expanded. In addition to the
discussions on the economic situation and
fi scal policies, the Eurogroup also examines
increasingly frequently structural policies, with
a particular focus on issues of crucial importance
for the euro area and the smooth and sustainable
functioning of monetary union (such as wage
and competitiveness developments, infl ation
and growth differentials and commodity price
developments). Moreover, the Eurogroup has
also recently addressed issues related to the
fi nancial sector, mostly against the background
of the fi nancial crisis. The frequency, scope and
depth of the discussions on these issues have
increased over the years.
The Eurogroup has also proved to be an
appropriate medium for preparing a common
euro area approach for ECOFIN Council
decisions on matters closely related to the
euro area, such as the appointment of ECB
Executive Board members, the specifi c part
of the BEPGs that is dedicated to the euro
area, Council decisions in the context of an
Excessive Defi cit Procedure (EDP) concerning
a euro area country, etc. Eurogroup meetings
have also served as a platform for strategic
discussions on euro area enlargement. The
Eurogroup President takes part in the main
international fi nancial fora, in particular the
meetings of the G7 and the International
Monetary and Financial Committee, alongside
the President of the ECB.
3.2.3 THE ECONOMIC AND FINANCIAL
COMMITTEE
The Economic and Financial Committee (EFC)
is a consultative committee, established by the
Treaty itself (see box), which contributes to the
preparation of the work of the ECOFIN Council.
The EU Member States, the European Commission
and the ECB each appoint no more than two
members and two alternates of the Committee.
The ECB members of the EFC are members
of the Executive Board of the ECB. The EFC
Alternates meet before the meetings of the EFC
in order to prepare the discussions of the parent
committee. The EFC has a very broad mandate,
ranging from discussion of the economic situation
and the BEPGs to the surveillance of fi scal policy
(including the annual updates of the stability and
convergence programmes and the preparation of
European positions on various international issues).
For the purposes of discussions and decisions in
the context of the Exchange Rate Mechanism
(ERM II), the EFC meets in a special format
consisting of the EFC members from national
administrations, the EFC members from non-
euro area central banks, two ECB representatives,
two European Commission representatives and
the President of the Alternates.

80ECB
Monthly Bulletin
January 2010
Two major developments can be identifi ed
during the past decade. First, in response to the
2004 enlargement of the European Union, and
the concomitant increase in its membership,
the EFC has acted to improve the effi ciency of
its work. Since this enlargement, the EFC has
met in two compositions, namely a restricted
composition (without the representatives of the
NCBs of the EU Member States) and a full
composition (including the NCBs).6 Second, the
EFC has signifi cantly stepped up its analysis
and discussion of key policy areas, in particular
as new issues have emerged, e.g. in connection
with the enlargement of the European Union
and the euro area (including competitiveness
and balance of payments programmes) and the
emergence of fi nancial stability issues.
For the latter, special formats have been
established, the most prominent one being the
Financial Stability Table (FST). The EFC-FST
meets twice a year, ahead of the two informal
ECOFIN meetings, and prepares the discussions
of the ECOFIN Council on the assessment of
fi nancial stability in the EU. For the purpose
of an appropriately informed debate, additional
stakeholders are invited to these deliberations:
the chairpersons of the Committee of European
Banking Supervisors, the Committee of
European Securities Regulators, the Committee
of European Insurance and Occupational
Pensions Supervisors and the ESCB Banking
Supervision Committee. Finally, the EFC also
benefi ts from the input of the Financial Services
Committee, in which the ECB also participates.
During the fi nancial crisis, and particularly at its
height, following the demise of Lehman Brothers
in September 2008, the ECB’s relations with
the EFC intensifi ed in frequency and scope –
mirroring the developments at the level of the
ECOFIN Council – as the EFC played a key role
in monitoring and coordinating, on a daily basis
at times, the preparation and implementation of
Member States’ national rescue plans and EU
and IMF support programmes.
The Eurogroup Working Group (EWG) is
a consultative sub-committee of the EFC,
restricted to representatives of the euro area
countries, the European Commission and the
ECB, which contributes to the preparation of the
work of the Eurogroup.
3.2.4 THE ECONOMIC POLICY COMMITTEE
The Economic Policy Committee (EPC)
is another consultative Union body which
contributes to the preparation of the work of
the ECOFIN Council, in close cooperation
with the EFC, with a specifi c focus on
structural policies aimed at improving growth
potential and employment in the European
Union. The EU Member States, the European
Commission and the ECB each appoint two
members of the Committee. The ECB attaches
the utmost importance to the implementation
of structural reforms in the Member States as a
means to increase the fl exibility of the economy,
enhance its resilience to economic shocks
and ultimately achieve a higher, sustainable
long-term growth rate and a higher level of
employment. In addition, structural reforms are
key to the smooth functioning of EMU, as the
countries can no longer resort to some of the
pre-EMU adjustment mechanisms to restore
their competitiveness. The ECB’s participation
in this Committee therefore represents an
opportunity to contribute to the ongoing work in
this fi eld at the European and the national level,
fully respecting the respective competencies of
all the parties involved.
The EPC’s work, since the start of EMU,
was initially focused on a limited number of
topics, essentially related to structural reforms,
productivity and labour market reforms.
Over time, the Committee has also started
to address topics such as energy and climate
change, developments in commodity prices,
the reduction of administrative burdens and
competitiveness issues in a currency union. Since
August 2005, the EPC has also been meeting
in a Eurogroup composition with the aim of
For further details see G. Grosche and U. Puetter, “Preparing 6
the Economic and Financial Committee and the Economic Policy
Committee for Enlargement”, Journal of European Integration,
30:4, 527-543.

81ECB
Monthly Bulletin
January 2010
ARTICLES
The ECB’s relations with
European Union institutions
and bodies – trends
and prospects
contributing to discussions of the Eurogroup on
issues within the competence of the EPC. These
include structural reforms related to the Lisbon
agenda and structural aspects of macroeconomic
policy-making, such as population ageing and
the quality of public fi nances.
3.3 THE EUROPEAN COMMISSION
Given its core functions as the initiator of EU
legislation and guardian of the EU Treaties,
the European Commission is naturally a key
actor in the dialogue between the ECB and
economic policy-makers within the Eurogroup
and the ECOFIN Council. The Commissioner
for Economic and Monetary Affairs attends
Eurogroup and ECOFIN Council meetings.
In addition, the Treaty (see box) states that a
member of the European Commission (generally
the Commissioner for Economic and Monetary
Affairs) can participate in the meetings of the
ECB’s Governing Council – although without
having either the right to vote or, unlike the
President of the EU Council, to submit a motion
for deliberation. The Commissioner attends
around half of the meetings of the ECB’s
Governing Council. This dialogue is particularly
important in the light of the crucial role played
by the European Commission in EU economic
policy-making and the fact that the European
Commission is entrusted with several specifi c
tasks relating to EMU (such as the formulation
of the BEPGs, the monitoring of budgetary
matters and reporting to the EU Council thereon,
and the assessment of the state of convergence
in the EU Member States with a derogation).
Finally, the two institutions have developed a
close working relationship and a wide variety
of regular and ad hoc contacts at the working
level (e.g. in the fi elds of statistics and payment
systems and in relation to the preparation
of the Convergence Reports). Mirroring the
intensifi cation of relations with the bodies and
committees mentioned above, relations with
the European Commission have also deepened
and broadened over time, particularly since the
start of the crisis, during which the European
Commission has played an important role in
the coordination of the policy response at the
European level and in preventing a fragmentation
of the single market.
3.4 THE EUROPEAN COUNCIL AND THE EU
COUNCIL IN THE COMPOSITION OF HEADS
OF STATE OR GOVERNMENT
The European Council – bringing together
Heads of State or Government and the
President of the European Commission and,
since 1 December 2009, the newly created
President of the European Council and the High
Representative for Foreign Affairs and Security
Policy – plays a crucial steering role in European
affairs in that it gives political guidance and
impetus to the European Union, takes the most
important decisions and puts the seal of approval
on signifi cant documents. The European Council
is distinct from the EU Council meeting in the
composition of Heads of State or Government,
which is a specifi c format of the EU Council.
Unlike the latter, the European Council has not
until now been recognised as a formal European
institution. The Treaty of Lisbon, however,
changes the status of the European Council by
formally recognising it as a Union institution
and by introducing a “permanent” President
of the European Council, who will chair its
meetings during a once-renewable term of two
and a half years.
The President of the ECB has been invited to
several meetings of the European Council, as
well as to the ad hoc informal summits at the
level of EU Heads of State or Government
that have been called since the beginning
of the fi nancial crisis, such as the informal
European Council meetings on 1 March and
17 September 2009 and the summit of euro area
Heads of State in Paris on 12 October 2008.
The aim of the latter was to coordinate the
response to the crisis by the euro area countries.
3.5 THE MACROECONOMIC DIALOGUE
The Macroeconomic Dialogue (MED) was
established by the European Council in June 1999.
The MED is an institutionalised dialogue

82ECB
Monthly Bulletin
January 2010
among the European monetary authorities,
the EU Council, the European Commission
and the social partners at European level,
which is intended to enhance understanding
of the policy requirements entailed by EMU.
The Dialogue is based on full respect for the
independence of all actors involved, in particular
the independence of the social partners in the
wage formation process and that of the ECB in
relation to the single monetary policy. The MED
takes place twice a year, fi rst at the technical
level and then at the political level, and provides
a forum for an exchange of views about the
economic situation, as well as discussions on
special topics related to labour market conditions
and developments in fi scal and structural
policies. The ECB is represented in the MED
at political level by the President.
4 COMMON TRENDS
On the basis of the above overview, four common
trends can be identifi ed that characterise the
developments in the ECB’s relations with
EU institutions and bodies since its creation:
an increased frequency of interactions (i)
(as illustrated by the increasing number of
meetings attended by the ECB – see chart
below);
a widening of the topics discussed; (ii)
a deepening of the discussions, with an (iii)
increased number of written contributions
by the ECB;
an increase in the number of specifi c (iv)
deliberations in euro area composition.
This has fostered the creation of a climate of
mutual trust and understanding between the
relevant policy-makers, which is conducive to a
smooth functioning of EMU.
In particular, the period since the start of the
fi nancial market turmoil in August 2007 has
been characterised by an increased focus of the
discussions on issues related to the fi nancial
sector and has thus engendered an intensifi cation
of the ECB’s relations with EU institutions and
bodies at all levels.
This enhanced interaction is likely to continue
and to further develop in the context of the
creation of two new European bodies, namely
the European Systemic Risk Board and the
European System of Financial Supervisors
(a network of supervisors consisting of the
European Banking Authority, the European
Securities and Markets Authority and the
European Insurance and Occupational
Pensions Authority), which are going to be
established to enhance the framework for
macro and micro-prudential supervision in the
European Union.
Finally, a discernible trend towards a more
clearly defi ned euro area focus of deliberations
can be observed from the increased number
of meetings in euro area composition only,
together with a widening and deepening of
Number of attended meetings per year and per body
0
10
20
30
40
50
60
70
80
90
100
0
10
20
30
40
50
60
70
80
90
100
1999 2000 2001 2002 2003 2004 2005 2006 2007 2008
ECOFIN 1)
Eurogroup
EFC
EPC
EFC (A) 2)
EPC EG 3)
EWG
European Council 4)
MED
Source: ECB.1) Includes informal ECOFIN.2) EFC Alternates.3) EPC Eurogroup Working Group.4) The European Council and the EU Council in the composition of Heads of State or Government.

83ECB
Monthly Bulletin
January 2010
ARTICLES
The ECB’s relations with
European Union institutions
and bodies – trends
and prospects
those discussions. This means, for instance, that
in addition to its initial focus on the economic
situation and fi scal policies, the Eurogroup
now also examines structural policies more
often, with a particular focus on issues of
crucial importance for the euro area, such as
competitiveness developments in euro area
Member States.
The analysis has shown that the institutional
setting put in place by the Maastricht Treaty is
fundamentally sound. The ECB’s relations with
EU institutions and bodies have evolved over
the past decade within the existing framework,
without there being any urgent need for a
fundamental overhaul of the system.
5 IMPLICATIONS OF THE TREATY OF LISBON
In line with this positive assessment of the
institutional setting of EMU, the Treaty of
Lisbon makes no fundamental change to the
provisions of the previous Treaties.7 Nevertheless,
it introduces some noteworthy changes with a
view to, on the one hand, consolidating the
monetary pillar and, on the other hand,
improving the functioning of the economic
pillar, in particular with regard to the euro area.
5.1 CONSOLIDATION OF THE PROVISIONS
ON MONETARY UNION
As far as the monetary union pillar is concerned,
the ECB’s mandate is reinforced by the elevation
of the primary objective of the ECB, i.e. price
stability, to an objective of the European Union
as a whole. This implies that Member States
should work towards this objective in framing
their economic policies. The ECB welcomes
this change. In addition, an “economic and
monetary union whose currency is the euro” is
also considered to be an EU objective.
Moreover, the ECB, initially established as
a Community body of a sui generis nature,
becomes a Union institution. This is a step
to simplify and enhance the transparency of
the Union’s institutional framework – the
institution that is responsible for the single
currency will be listed as a Union institution,
rendering its status and position in the European
Union’s overall institutional architecture more
accessible to European citizens. Important as
this step will undoubtedly be for the Bank’s
external perception, in practice, little is
expected to change for the ECB, as it retains
all its special institutional features such as its
independence, regulatory powers and legal
personality. The fi rm anchoring of these features
in the new Treaty is essential to the successful
performance of the ECB’s tasks. The Treaty of
Lisbon actually further strengthens the ECB’s
independence by explicitly referring for the
fi rst time to the ECB’s fi nancial independence.
Finally, whilst being an EU institution entails
a duty of mutual sincere cooperation between all
Union institutions, this was already applicable
to the ECB.
Another noteworthy change in the new Treaty
is that the term “Eurosystem” is introduced
for the fi rst time into primary legislation. This
should further clarify the distinction between
the Eurosystem and the ESCB.
Moreover, the members of the ECB’s Executive
Board will be appointed by the European Council
acting by a qualifi ed majority rather than, as
now, by common accord of the governments of
Member States. The appointment procedure will
thus become more supranational and be brought
into line with the decision-making procedures
for other key nominations.
Finally, the euro area members will be
entitled to make recommendations on euro
area enlargement: the fi nal decision on the
introduction of the euro in a Member State will
still be taken by the EU Council as a whole,
but it will take into account the specifi c views
expressed by the euro area members.
While the overall functioning of the monetary
union pillar is left untouched by the Treaty
See the box entitled “The Treaty of Lisbon” in the December 2007 7
issue of the Monthly Bulletin.

84ECB
Monthly Bulletin
January 2010
of Lisbon 8, the institutional position of the ECB
is strengthened in several respects. This goes
hand in hand with a number of innovations in the
area of economic governance.
5.2 ENHANCEMENT OF THE PROVISIONS ON
ECONOMIC POLICIES
The Treaty of Lisbon provides a number
of opportunities to enhance the economic
governance of the euro area. The Eurogroup
is for the fi rst time recognised in the Treaties.
Nevertheless, it retains its current informal status
and thus does not have any formal decision-
making powers. The Eurogroup’s President will
serve a two-and-a-half year term.
Moreover, the role of euro area Member States and
of the European Commission is strengthened with
regard to both the BEPGs and the EDP. The Treaty
of Lisbon will confer on the European Commission
the power to directly address an opinion to
a Member State in the event of non-compliance.
Once the ECOFIN Council becomes involved,
during the subsequent step of the procedure,
the Member State concerned will be allowed
to take part in the discussions on the necessary
recommendations but will no longer have a vote.
Most importantly, decisions on non-compliance
with the BEPGs or the EDP by euro area countries
will be taken by euro area countries only.
The specifi c shared responsibilities for the
management of the single currency are also
recognised in the possibility of “enhanced
cooperation” among euro area Member States.
A new provision allows them, by a qualifi ed
majority, to adopt new measures to enhance
the coordination and surveillance of their
budgetary discipline and to set out specifi c
economic policy guidelines for themselves. Any
such measure, provided it is compatible with
the Treaty and adopted in accordance with the
relevant procedures on the BEPGs and EDPs,
will be legally binding on euro area countries.
These noteworthy innovations are welcome
as they should contribute to enhancing the
economic governance framework for the euro
area. In order for their full potential to be
realised, they need to be fully implemented in
line with the Treaty of Lisbon.
Finally, as regards the external representation
of the euro area, the Treaty of Lisbon clarifi es
and improves the current provisions, but does
not bring about fundamental changes. As is
currently the case, the euro area countries, should
they wish to do so, can decide, by a qualifi ed
majority, to mandate a particular body or person
to represent the euro area in a unifi ed way in
international fora. The new Treaty explicitly
provides for the EU Council to have the means
to take “appropriate measures to ensure unifi ed
representation”. It remains to be seen whether,
and if so how, the creation of new EU foreign
policy posts by the Treaty of Lisbon will affect
the international representation of the euro area.
6 CONCLUSIONS
This article has described the institutional
framework of EMU as established by the Treaty,
and specifi cally the interactions between the
ECB, in full respect of its independent status, and
economic policy-makers. It has functioned well
over the last decade: EU economic policy-makers
have been able to respond fl exibly and pragmatically
within the current framework to the unprecedented
challenges that have arisen, including the fi nancial
crisis. The Treaty of Lisbon provides a number
of opportunities to further enhance economic
governance, which should be fully exploited by
all parties involved. The euro area is thus well
equipped to face the economic policy challenges
that lie ahead (such as fi scal consolidation,
population ageing, climate change fi nancing, etc.).
A challenge of immediate importance will be to
have an equally well-functioning and effective
set-up for fi nancial supervision: the ECB stands
ready to take an active part in this regard.
Under the Treaty of Lisbon, the former Article 111 of the Treaty, 8
on exchange rate policy and the conclusion of monetary and
exchange rate agreements, has been moved from the title on
economic and monetary policy to a new part on EU external
action. However, the allocation of responsibilities in this fi eld
has been left unchanged.

85ECB
Monthly Bulletin
January 2010
ARTICLES
Entitlements of households
under government pension
schemes in the euro area –
results on the basis of
the new System
of National Accounts
This article presents the results obtained when household entitlements under government pension schemes in the euro area are recorded on the basis of the System of National Accounts, 2008 (2008 SNA). While the treatment of government pension schemes in the core accounts has hardly changed, the 2008 SNA provides an international statistical standard for compiling supplementary data on pension entitlements under unfunded defi ned-benefi t schemes managed by the general government and also social security schemes. The rough magnitude of unfunded entitlements vis-à-vis general government is known owing to various studies undertaken by international organisations such as the IMF, the OECD and the World Bank. However, the 2008 SNA makes provision for more detailed information in terms of pension entitlements as outstanding amounts, their accumulation and the impact of pension reforms. It increases the transparency of household and general government fi nance, allows a better comparison across countries and economic areas and is particularly relevant in view of the far-reaching implications of population ageing in the euro area and many industrial economies.
Household entitlements under government pension schemes as presented in this article cannot be used as an indicator to assess the fi scal sustainability of unfunded pension schemes. For that purpose the concept of pension entitlements needs to be extended to include entitlements that will be accrued in the future, while at the same time comparing these “claims” with future social contributions and tax payments.
1 INTRODUCTION AND POLICY CHALLENGES
Owing to increasing life expectancy and low
birth rates, the population in the euro area is
ageing and is expected to decline. According to
the central scenario prepared by Eurostat, life
expectancy at birth in the euro area is projected
to increase in the period from 2008 to 2060 by
7.5 years for men (from 77.5 years in 2008 to
85.0 years in 2060) and by 6.1 years for women
(from 83.4 years in 2008 to 89.5 years in 2060).
As shown in Chart 1, this implies a continuation
of the gradual convergence of the life expectancy
of men and women. As regards the birth rate in
the euro area, although it is expected to rise
slightly, from 1.55 births per woman in 2008 to
1.67 births per woman in 2060, this is still
substantially below the rate of 2.1 births per
woman that would be needed for each generation
to replace itself.1
To assess the policy challenges arising from the
above demographic projections for the fi nancing
of pay-as-you-go government pension schemes,
it is useful to analyse the implications by taking
stock of pension entitlements already accrued to
date, from both a national accounts perspective
and a forward-looking economic perspective.
See also European Commission and the Economic Policy 1
Committee, “2009 Ageing Report: economic and budgetary
projections for the EU-27 Member States (2008-2060)”,
European Economy, No 2, 2009.
ENTITLEMENTS OF HOUSEHOLDS UNDER GOVERNMENT PENSION SCHEMES IN THE EURO AREA – RESULTS ON THE BASIS OF THE NEW SYSTEM OF NATIONAL ACCOUNTS
Chart 1 Projected life expectancy at birth in the euro area
(age in years)
2010 2020 2030 2040 2050 2060
life expectancy at birth, men
life expectancy at birth, women
70
75
80
85
90
95
70
75
80
85
90
95
Source: European Commission and the Economic Policy Committee (2009), 2009 Ageing Report: economic and budgetary projections for the EU-27 Member States (2008-2060), European Economy No 2, 2009.

86ECB
Monthly Bulletin
January 2010
From a forward-looking economic perspective,
according to the 2009 Ageing Report by the
European Commission and Economic Policy
Committee, government expenditure on
pensions in the euro area is projected to rise from
the level of 11.1% of GDP in 2007 to 13.9% of
GDP in 2060, with signifi cant differences across
the euro area countries. In conjunction with
the euro area’s weak structural fi scal position,
this overall rise in ageing-related costs in an
environment in which potential GDP growth is
declining to some extent would contribute to
signifi cant risks to the long-term sustainability
of public fi nances identifi ed in the Sustainability
Report 2009.2 Reducing these risks requires
the implementation of the so-called three-
pronged strategy agreed upon by the Stockholm
European Council in 2001 which consists of
(i) fostering fi scal consolidation, (ii) increasing
productivity and employment and (iii) reforming
social security systems including pensions.
The above-mentioned stocktaking approach is
based on the recording of pension entitlements
which pensioners and employees have accrued
through their past social contributions. These
household pension entitlements are obligations
of general government. Even though they are
not recorded as government debt, governments
are expected to fulfi l their commitments to
(current and future) pensioners. In the light of
the projected demographic developments, it is
of interest to record the size of these obligations
and monitor their development over time.
It must be stressed that gauging general
government accrued-to-date pension obligations
does not suffi ce in itself to allow an assessment of
the sustainability of public fi nances. This is
because the evolution of future contributions to
pay-as-you-go government pension schemes is not
taken into account. Notwithstanding, if recorded
systematically and over a long time horizon, data
on accrued obligations may contribute usefully to
assessing, inter alia, to what extent the size of
pension obligations changes in response to reforms
of government pension schemes, e.g. increases in
the statutory retirement age. According to the
literature, the size of these accrued-to-date pension
entitlements of households or obligations of
general governments is very signifi cant, although
differing widely across countries.3
The recently adopted 2008 SNA recommends
that the accrued-to-date pension entitlements of
households be recorded under unfunded defi ned-
benefi t schemes managed by government and
social security schemes in a supplementary table
on pensions.4 Moreover, the European System
of Accounts, which is currently being revised,
will be amended in line with this approach.
These amendments aim to allow pension data
of countries with different types of pension
scheme to be compared, especially in the case
of major economic areas, such as the euro
area, the United States and Japan. Against this
background, the aim of this article is to survey
the changes in the 2008 SNA with respect to
accrued-to-date pension entitlements and to
present estimates for the euro area prepared
by the European Commission (Eurostat)/ECB
Task Force on Pensions established by the
Committee for Monetary, Financial and Balance
of Payments Statistics.5
The article is structured as follows. Section 2
provides an overview of how pension
See European Commission, “Sustainability Report 2009”, 2
European Economy, No 9, 2009.
For a survey of estimates, including those of the OECD and IMF, 3
see R. Holzmann, P. Palacios and A. Zviniene, “On the economics
and scope of implicit pension debt: an international perspective”,
Empirica, No 28, 2001, pp. 97-129. The studies surveyed date back
to the mid-1990s and fi nd implicit pension liabilities of between
200% and 350% of GDP for individual euro area countries.
The 2008 SNA, the most important international statistical standard, 4
is an updated version of the System of National Accounts, 1993
(1993 SNA). It is the fi fth version of the SNA, the fi rst of which
was published over fi fty years ago, and it was adopted by the United
Nations Statistical Commission in 2008 and 2009. The 2008 SNA was
prepared under the auspices of the Inter-Secretariat Working Group on
National Accounts (ISWGNA), which consists of fi ve organisations:
Eurostat, the IMF, the OECD, the United Nations Statistics Division and
regional commissions of the United Nations Secretariat and the World
Bank. The 2008 SNA is published jointly by the fi ve organisations.
It is available at the website of the United Nations Statistics Division
(http://unstats.un.org/unsd/sna1993/snarev1.asp).
The estimates refer to accrued-to-date pension entitlements of 5
households vis-à-vis unfunded employment-related government
pension schemes, including social security schemes. See also
R. Mink, M. Rodriguez, E. Barredo and J. Verrinder, “Refl ecting
pensions in National Accounts – Work of the Eurostat/ECB Task
Force”, a paper prepared for the 30th General Conference of the
International Association for Research in Income and Wealth
(IARIW), August 2008.

87ECB
Monthly Bulletin
January 2010
ARTICLES
Entitlements of households
under government pension
schemes in the euro area –
results on the basis of
the new System
of National Accounts
entitlements of households are currently recorded
in national accounts and introduces the new
way of recording pension data recommended in
the 2008 SNA. Section 3 presents estimates of
pension entitlements under government pension
schemes in the euro area in comparison with
data provided for the United States. It describes
these data from the perspective of households
and also from a general government perspective.
Section 4 briefl y considers the projections
published in the 2009 Ageing Report for all
EU Member States. Their methodological basis
is also compared with the concept of accrued-to-
date pension entitlements. Section 5 concludes.
2 PENSION ENTITLEMENTS OF HOUSEHOLDS
UNDER GOVERNMENT SCHEMES,
AS COMPARED WITH HOUSEHOLD ASSETS
Pension entitlements of households can be
recorded either as fi nancial assets in the national
accounts or as contingent assets.6 Those treated
as fi nancial assets constitute fi nancial claims that
benefi ciaries have vis-à-vis either their employer
or a pension manager designated by the employer
to pay pension benefi ts earned as part of a
compensation agreement concluded between the
employer and the employee. Those treated as
contingent assets usually represent “conditional
claims” on unfunded pension schemes managed
by general government, including social security
schemes. As counterparts, they are recorded as
contingent liabilities of the government,
the obligations of which cover these
contingencies together with government debt.
SOCIAL INSURANCE PENSION SCHEMES
Under social insurance pension schemes,
benefi ciaries are obliged or encouraged to take
out insurance to cover their risks and needs in
old age. The most important pension benefi t
covered by social insurance pension schemes
is income in retirement, but other contingencies
may also be covered. For example, pensions
may be payable to widows and widowers,
or to people who have suffered an injury at work
and are no longer able to work. Social assistance
benefi ts may be provided independently of
participation in a social insurance scheme.
A third form of pension is that provided under
individual insurance policies.
As shown in Box 1, there are different types
of social insurance pension scheme in the
euro area: they may be managed by general
government, as is predominantly the case, or by
non-government entities; they may be designed
as employment-related pension schemes, such
as defi ned-contribution, defi ned-benefi t or
hybrid schemes, or as social security schemes.
Employment-related schemes may be funded or
unfunded, while social security schemes tend to
be fi nanced on a pay-as-you-go basis, through
social contributions or government transfers.
In the System of National Accounts, 1993
(1993 SNA), obligations to provide pension
benefi ts were recognised as liabilities for
employment-related defi ned-contribution and
funded defi ned-benefi t schemes, but not for
unfunded defi ned-benefi t and social security
schemes. The recently adopted 2008 SNA
recommends that pension entitlements under
unfunded defi ned-benefi t schemes managed by
general government and social security schemes be
recorded as supplementary data.7 This will allow
pension data of countries with different types of
pension scheme to be compared, especially in the
case of major economic areas, such as the euro
area, the United States and Japan.
Social security pension schemes and unfunded
defi ned-benefi t schemes managed by general
government are particularly important for the
euro area. Accordingly, there is an interest in
comprehensive information on accrued-to-date
government obligations that will need to be
fi nanced in future, in view of demographic
developments and the foreseeable fi scal burden
owing to ageing populations.
As contingent assets and liabilities do not give rise to unconditional 6
obligations either to make payments or to provide other objects
of value, they are not recorded as fi nancial assets and liabilities
in the national accounts. For details, see paragraph 2.29 of the
2008 SNA.
For details, see Chapter 17 of the 2008 SNA.7
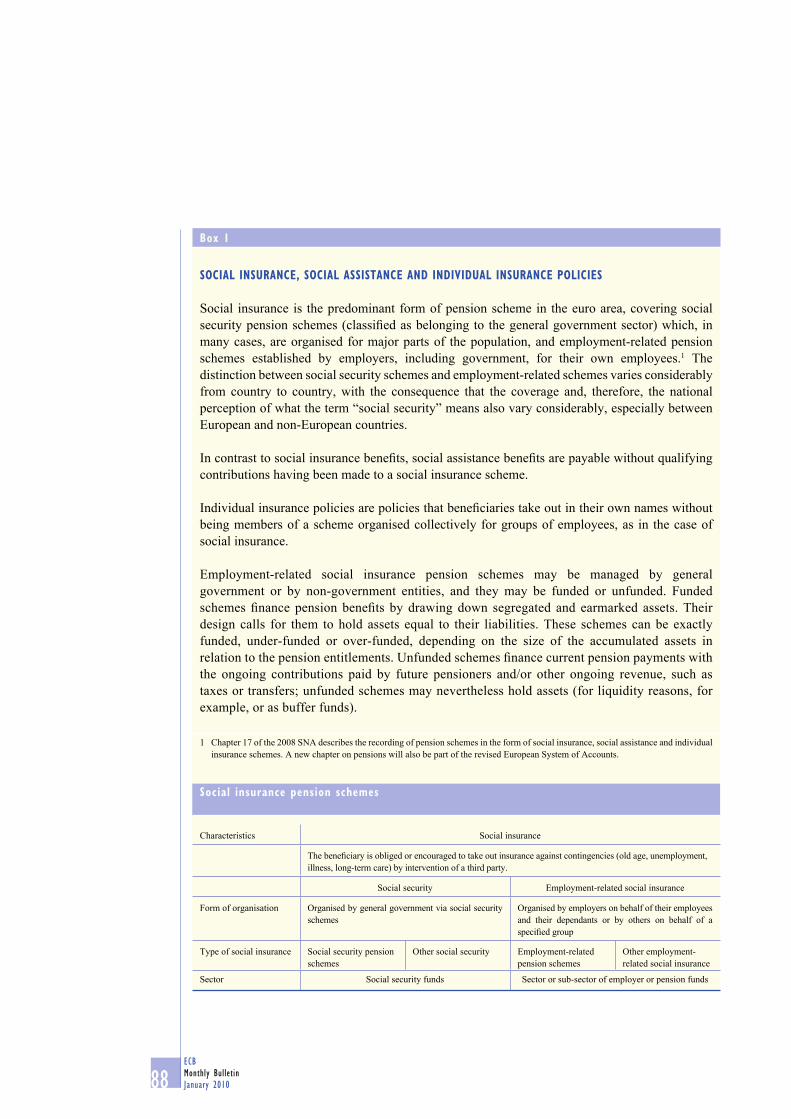
88ECB
Monthly Bulletin
January 2010
Box 1
SOCIAL INSURANCE, SOCIAL ASSISTANCE AND INDIVIDUAL INSURANCE POLICIES
Social insurance is the predominant form of pension scheme in the euro area, covering social
security pension schemes (classifi ed as belonging to the general government sector) which, in
many cases, are organised for major parts of the population, and employment-related pension
schemes established by employers, including government, for their own employees.1 The
distinction between social security schemes and employment-related schemes varies considerably
from country to country, with the consequence that the coverage and, therefore, the national
perception of what the term “social security” means also vary considerably, especially between
European and non-European countries.
In contrast to social insurance benefi ts, social assistance benefi ts are payable without qualifying
contributions having been made to a social insurance scheme.
Individual insurance policies are policies that benefi ciaries take out in their own names without
being members of a scheme organised collectively for groups of employees, as in the case of
social insurance.
Employment-related social insurance pension schemes may be managed by general
government or by non-government entities, and they may be funded or unfunded. Funded
schemes fi nance pension benefi ts by drawing down segregated and earmarked assets. Their
design calls for them to hold assets equal to their liabilities. These schemes can be exactly
funded, under-funded or over-funded, depending on the size of the accumulated assets in
relation to the pension entitlements. Unfunded schemes fi nance current pension payments with
the ongoing contributions paid by future pensioners and/or other ongoing revenue, such as
taxes or transfers; unfunded schemes may nevertheless hold assets (for liquidity reasons, for
example, or as buffer funds).
1 Chapter 17 of the 2008 SNA describes the recording of pension schemes in the form of social insurance, social assistance and individual
insurance schemes. A new chapter on pensions will also be part of the revised European System of Accounts.
Social insurance pension schemes
Characteristics Social insurance
The benefi ciary is obliged or encouraged to take out insurance against contingencies (old age, unemployment,
illness, long-term care) by intervention of a third party.
Social security Employment-related social insurance
Form of organisation Organised by general government via social security
schemes
Organised by employers on behalf of their employees
and their dependants or by others on behalf of a
specifi ed group
Type of social insurance Social security pension
schemes
Other social security Employment-related
pension schemes
Other employment-
related social insurance
Sector Social security funds Sector or sub-sector of employer or pension funds

89ECB
Monthly Bulletin
January 2010
ARTICLES
Entitlements of households
under government pension
schemes in the euro area –
results on the basis of
the new System
of National Accounts
DIFFERENT RECORDING OF DEFINED-
CONTRIBUTION AND DEFINED-BENEFIT SCHEMES
Institutional differences across countries with
respect to pension schemes (e.g. a relatively
large proportion of defi ned-contribution schemes
in the United States, the Netherlands and
the United Kingdom, as opposed to relatively
large social security and government-managed
unfunded defi ned-benefi t schemes in most
euro area countries) result in signifi cant
differences across the national accounts,
making international comparisons diffi cult.
In particular, household pension entitlements
in countries with mainly defi ned-contribution
schemes are recorded as household assets, while
rather small amounts of pension entitlements are
recorded in countries in which pension schemes
are predominantly organised as government-
managed unfunded schemes, as in Germany,
France and Italy.
Looking at the data currently reported in
household balance sheets on life insurance and
pension assets, euro area countries with a large
proportion of defi ned-contribution schemes
show rather high ratios of household life
insurance and pension assets as a percentage
of household gross disposable income (GDI)
(see Table 1). The opposite is the case for euro
area countries with social security pension
schemes for the majority of the population
and also unfunded defi ned-benefi t schemes
managed by general government.
In the euro area, defi ned-contribution pension
entitlements (including life insurance products)
totalled €4.8 trillion in 2008, covering 80% of
household GDI (see also Table 5) or 11% of
household assets, held predominantly with
pension funds.8 In the United States, life
insurance and pension assets amounted to
USD 10.4 trillion in 2008, which corresponds
See Table 3.3 under the Euro area accounts sub-section of the 8
Euro area statistics section in this issue of the Monthly Bulletin.
Employment-related pension schemes are broken down further into defi ned-contribution pension
schemes and defi ned-benefi t pension schemes. In a defi ned-contribution scheme, the benefi ts
are defi ned exclusively in terms of the level of the fund built up from the contributions made
over the employee’s working life and the increases in value that result from the investment of
these funds. These schemes are organised like accounts owned by the scheme participants, as
the level of benefi ts on retirement depends on the balance in the defi ned-contribution scheme
account. The entire risk of the scheme to provide an adequate income in retirement is thus
borne by the employee. In a defi ned-benefi t scheme, the benefi ts payable to the employee on
retirement are determined through the use of a formula, either alone or in combination with a
guaranteed minimum amount payable. This formula typically considers the length of service
and some measure of fi nal or average pay. The risk of a defi ned-benefi t scheme to provide an
adequate income in retirement is borne by the employer. Hybrid schemes with both a defi ned-
benefi t and a defi ned-contribution element are usually classifi ed as defi ned-benefi t schemes.
Table 1 Household life insurance and pension assets
(percentages of household GDI at the end of the year)
Country/area 1999 2007 2008
Euro area 64.4 84.0 79.7
of which: Germany 64.2 82.8 84.8France 69.6 96.7 94.5Italy 33.6 54.1 51.3The Netherlands 296.0 324.4 268.7
United Kingdom 261.5 247.9 201.8
United States 138.4 129.2 98.0
Japan 103.3 119.5 .
Sources: ECB, European Commission (Eurostat), UK Offi ce for National Statistics, US Federal Reserve Board, US Bureau of Economic Analysis, Bank of Japan, Economic and Social Research Institute and the Cabinet Offi ce of the Government of Japan.Notes: End-of-year fi gures. Data include life insurance and pension assets; they refer predominantly to defi ned-contribution schemes.
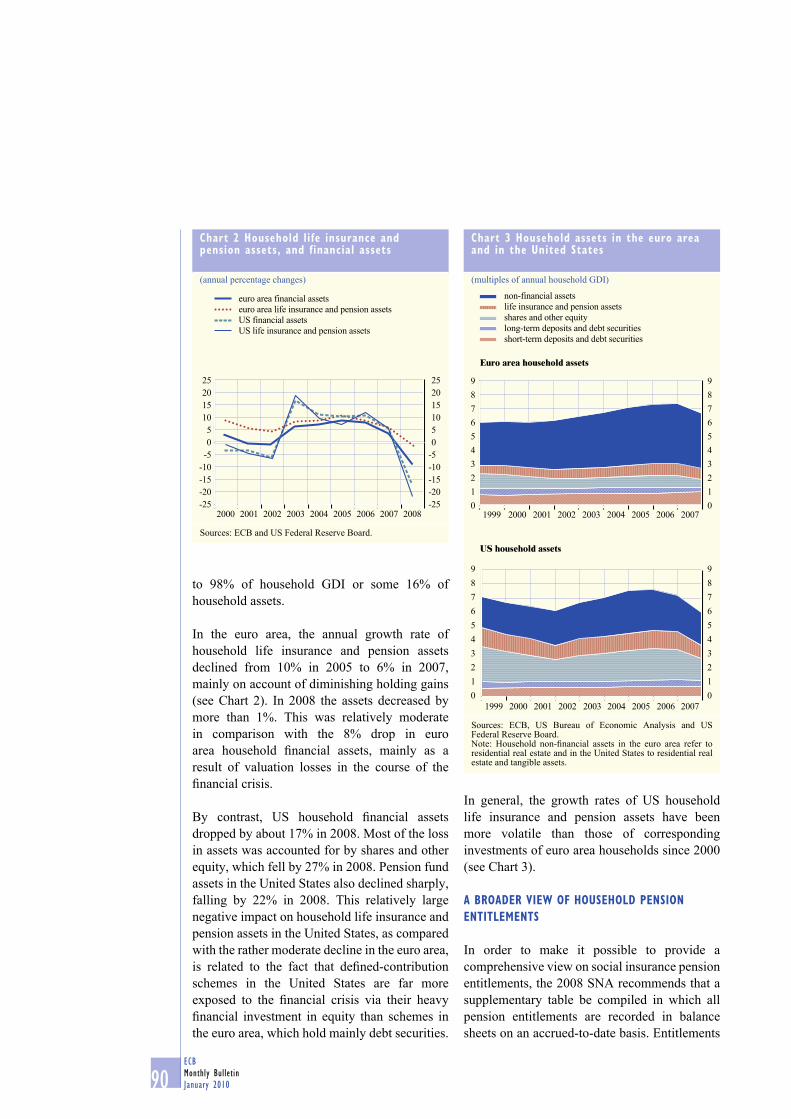
90ECB
Monthly Bulletin
January 2010
to 98% of household GDI or some 16% of
household assets.
In the euro area, the annual growth rate of
household life insurance and pension assets
declined from 10% in 2005 to 6% in 2007,
mainly on account of diminishing holding gains
(see Chart 2). In 2008 the assets decreased by
more than 1%. This was relatively moderate
in comparison with the 8% drop in euro
area household fi nancial assets, mainly as a
result of valuation losses in the course of the
fi nancial crisis.
By contrast, US household fi nancial assets
dropped by about 17% in 2008. Most of the loss
in assets was accounted for by shares and other
equity, which fell by 27% in 2008. Pension fund
assets in the United States also declined sharply,
falling by 22% in 2008. This relatively large
negative impact on household life insurance and
pension assets in the United States, as compared
with the rather moderate decline in the euro area,
is related to the fact that defi ned-contribution
schemes in the United States are far more
exposed to the fi nancial crisis via their heavy
fi nancial investment in equity than schemes in
the euro area, which hold mainly debt securities.
In general, the growth rates of US household
life insurance and pension assets have been
more volatile than those of corresponding
investments of euro area households since 2000
(see Chart 3).
A BROADER VIEW OF HOUSEHOLD PENSION
ENTITLEMENTS
In order to make it possible to provide a
comprehensive view on social insurance pension
entitlements, the 2008 SNA recommends that a
supplementary table be compiled in which all
pension entitlements are recorded in balance
sheets on an accrued-to-date basis. Entitlements
Chart 3 Household assets in the euro area and in the United States
(multiples of annual household GDI)
non-financial assets
life insurance and pension assets
shares and other equity
long-term deposits and debt securities
short-term deposits and debt securities
Euro area household assets
0
1
2
3
4
5
6
7
8
9
0
1
2
3
4
5
6
7
8
9
1999 2000 2001 2002 2003 2004 2005 2006 2007
US household assets
0
1
2
3
4
5
6
7
8
9
0
1
2
3
4
5
6
7
8
9
1999 2000 2001 2002 2003 2004 2005 2006 2007
Sources: ECB, US Bureau of Economic Analysis and US Federal Reserve Board. Note: Household non-fi nancial assets in the euro area refer to residential real estate and in the United States to residential real estate and tangible assets.
Chart 2 Household life insurance and pension assets, and financial assets
(annual percentage changes)
-25
-20
-15
-10
-5
0
5
10
15
20
25
-25
-20
-15
-10
-5
0
5
10
15
20
25
2000 2001 2002 2003 2004 2005 2006 2007 2008
euro area financial assets
euro area life insurance and pension assets
US financial assets
US life insurance and pension assets
Sources: ECB and US Federal Reserve Board.
91ECB
Monthly Bulletin
January 2010
ARTICLES
Entitlements of households
under government pension
schemes in the euro area –
results on the basis of
the new System
of National Accounts
under unfunded defi ned-benefi t schemes
managed by government are not recorded
in the standard national accounts, but in this
supplementary table. The same applies to social
security pension entitlements.
The supplementary table on social insurance
pension schemes provides a framework for
compiling and presenting balance sheet,
transaction and other fl ow data for all pension
entitlements from the perspective of both debtors
(pension funds) and creditors (households).
The table shows stock and fl ow data for specifi c
pension schemes, such as government-managed
unfunded defi ned-benefi t schemes and social
security pension schemes, that are not fully
recorded in the standard national accounts.
In principle, the supplementary table covers the
pension part of social insurance only. Social
assistance, health or long-term care insurance
and individual insurance policies (related to
pensions) are not included. However, it contains
elements of social assistance that are covered
indistinguishably within pension schemes that
are generally organised as social insurance.
Entitlements for survivors (e.g. dependent
spouses, children and orphans), as well as
benefi ts for disability and invalidity are included
in the supplementary table if they are an integral
part of the pension scheme.
Table 2 presents the supplementary table as
included in Chapter 17 of the 2008 SNA.
The rows show the opening and closing balance
sheet positions of the various social insurance
pension schemes, and also the transactions
and other fl ows during an accounting period.
In essence, the table reconciles the opening
and closing positions of pension entitlements
(rows 1 and 10) for all social insurance
pension schemes that exist in an economy.
Transactions shown in the table are social
contributions received (row 2), pension
benefi ts paid (row 4), transfers of pension
entitlements (row 6) and consequences of
pension reforms (row 7). Other economic
fl ows cover revaluations and other changes in
volume (rows 8 and 9) during an accounting
period. The columns distinguish between
different types of pension scheme according
to various criteria – the principle of recording
(in the standard national accounts, or not in
the standard accounts), the pension manager
and the sector of the scheme (government or
non-government), and the type of the scheme
(defi ned-contribution, defi ned-benefi t or social
security) – with separate columns (G and H)
for the “non-standard account” schemes –
unfunded government-managed defi ned-benefi t
and social security pension schemes. Column J
shows all household pension entitlements.
Only the items in the table that are shaded
in yellow add to the transaction data on
social contributions and pension benefi ts that
are already recorded. The additional fl ow
data are essential to derive data on pension
entitlements. They comprise data on imputed
social contributions paid by employers
(row 2.2) and household supplementary
contributions (row 2.4), other actuarial
changes in social security pension entitlements
(row 3) and changes arising from revaluations
and other changes in volume. Together with
the transaction data on both employers’
and household actual social contributions
(rows 2.1 and 2.3) and pension benefi ts
(row 4), which are also recorded in the
standard national accounts, they permit a full
and consistent set of stock and fl ow data to be
compiled for pension schemes, as shown in
columns G and H.
In the absence of data from other sources or
reporting agents, national statistical institutes, in
cooperation with other national agencies, perform
the actuarial calculations underlying columns G
and H on pension schemes managed by
government. This is a new task for statisticians,
which requires extensive experience in handling
fi nancial models for pension annuities and life
insurance.

92ECB
Monthly Bulletin
January 2010
3 ENTITLEMENTS TO GOVERNMENT PENSIONS
IN THE EURO AREA
SUPPLEMENTARY DATA ON PENSION SCHEMES
MANAGED BY GOVERNMENT
In order to obtain a complete picture of the
pension entitlements of households in the
euro area, data on transactions and other
economic fl ows in the course of 2007
as well as outstanding positions in
pension entitlements at the end of 2006
(the opening amounts) and the end of 2007
were estimated with the assistance of the
European Commission (Eurostat)/ECB Task
Force on Pensions (see Box 2). These estimates
were based on national pension models, and
also on benchmark calculations provided by
Table 2 Supplementary table on pension schemes in social insurance
Recording Standard national accounts
Pension manager Non-general government
Defi ned-contribution
schemes
Defi ned-benefi t schemes and other 1) non-defi ned-
contribution schemes
Total Defi ned-contribution
schemes
Row No Column number A B C D
Opening balance sheet
1 Pension entitlements
Changes in pension entitlements due to transactions
2 Increase in pension entitlements due to
social contributions
2.1 Employer actual social contributions
2.2 Employer imputed social contributions
2.3 Household actual social contributions
2.4 Household social contribution supplements 5)
3 Other (actuarial) changes in pension
entitlements in social security pension
schemes
4 Reduction in pension entitlements due to
payment of pension benefi ts
5 Changes in pension entitlements due to
social contributions and pension benefi ts
6 Transfers of pension entitlements between
schemes
7 Changes in pension entitlements due to
pension scheme reforms
Changes in pension entitlements due to other fl ows
8 Changes in pension entitlements due to
revaluations 6)
9 Changes in pension entitlements due to other
changes in volume 6)
Closing balance sheet
10 Pension entitlements
Notes:1) Other non-defi ned-contribution schemes, often described as hybrid schemes, have both a defi ned-benefi t and a defi ned-contribution element. 2) Schemes organised by general government for its current and former employees. 3) These are non-autonomous defi ned-benefi t schemes the pension entitlements of which are recorded in the standard national accounts. 4) Counterpart data for non-resident households will only be shown separately when pension relationships with the rest of the world are signifi cant.

93ECB
Monthly Bulletin
January 2010
ARTICLES
Entitlements of households
under government pension
schemes in the euro area –
results on the basis of
the new System
of National Accounts
the Forschungszentrum Generationenverträge
(Research Centre for Generational Contracts at
Freiburg University).
Table 3 provides an overview of these
benchmark calculations, covering about 54%
of the government-managed unfunded defi ned-
benefi t schemes and 73% of the social security
schemes in 2007. According to these estimates,
pension entitlements under government-managed
unfunded defi ned-benefi t schemes accounted
for about 79% and pension entitlements under
social security schemes for 415% of household
GDI at the end of 2007 (see also Table 5).
These results are broadly in line with the
fi ndings in the literature on estimating the
size of accrued-to-date pension entitlements.
Differences relate mainly to the reference
Standard national accounts Not in the standard national accounts Total pension schemes
Counterparts:pension
entitlements of resident
households 4)
General government
Defi ned-benefi t schemes for general government employees 2) Social security pension schemesClassifi ed in fi nancial
corporationsClassifi ed in general
government 3)
Classifi ed in general government
E F G H I J
Opening balance sheet
Changes in pension entitlements due to transactions
Changes in pension entitlements due to other fl ows
Closing balance sheet
5) These supplements represent the return on members’ claims on pension schemes through investment income on defi ned-contribution schemes’ assets and, for defi ned-benefi t schemes, through the unwinding of the discount rate applied. 6) A more detailed split of these positions should be provided for columns G and H based on the model calculations carried out for these schemes. The cells shown as are not applicable; the cells in will contain different data from the standard national accounts.

94ECB
Monthly Bulletin
January 2010
year, the proportion of pension schemes
included in the estimates, the denominator
(household GDI in this case, but GDP in
other studies), as well as methodological
specifi cations that follow the new international
standards, and macroeconomic assumptions.
Moreover, the approach applied in this article
provides a coherent set of stock and fl ow data,
as outlined in Table 2. In 2007, the reference
year of the estimates presented in this article,
accrued pension entitlements in the euro area
totalled about 490% of annual household GDI
(330% of GDP), with government-managed
unfunded defi ned-benefi t schemes amounting
to about 79% of household GDI (52% of GDP)
and pension entitlements under social security
schemes for 415% of household GDI (278%
of GDP).
Estimates of accrued contingent pension
entitlements have been provided for France and
Germany in recent years. The estimates for
France, which were carried out by INSEE,
put implicit social security pension entitlements
at 259% of GDP in 2003. The fi gure is broadly
in line with the results published in a study by
the Banque de France, in cooperation with the
US Bureau of Economic Analysis. According to
the calculations undertaken for Germany by
DESTATIS, social security pension entitlements
amounted to about 230% of GDP in 2005.
The entitlements derived for social security
pension schemes in these country studies
compare well with the estimates provided for
the euro area (278% of GDP in 2007).
Preliminary estimates for pension schemes
established for civil servants have been carried
out recently in some country studies. For the
euro area, they amounted to 52% of GDP
in 2007.9
These estimates should be considered from two
perspectives, namely that of households and
that of the government. From the household
perspective, they provide additional information
on household assets, including contingent
pension entitlements. From the government’s
perspective, they add to the data on government
liabilities, including contingent pension
obligations. However, as set out in Box 3, these
See R. Holzmann et al. 2001; D. Blanchet and S. Le Minez, 9
“Assessing implicit pension liabilities for the French pension
system: a micro-founded approach”, a paper prepared for
the 30th General Conference of the IARIW, August 2008;
D. Durant and M. Reinsdorf, “Implicit social security and
pension wealth in household assets in the US and France”,
a paper prepared for the 30th General Conference of the
IARIW, August 2008; and A. Braakmann, J. Grütz and T. Haug,
“Das Renten- und Pensionsvermögen in den Volkswirtschaftlichen
Gesamtrechnungen”, Statistisches Bundesamt, Wirtschaft und Statistik 12/2007, pp. 1167-79.
Table 3 Pension entitlements under government-managed pension schemes in the euro area
(percentages of annual household GDI in 2007; projected-benefi t-obligation valuation 1) )
Position
Column NoGovernment-managed
unfunded defi ned-benefi t schemes
Social security pension schemes
G H
Pension entitlements (opening balance sheet) 77.4 406.0
Increase in pension entitlements due to social contributions 4.1 29.7
Other (actuarial) change of pension entitlements -2.3
Reduction in pension entitlements due to payment of
pension benefi ts 3.0 14.4
Changes in pension entitlements due to social contributions
and pension benefi ts 1.1 13.1
Changes in pension entitlements due to pension reforms -0.0 -4.1
Pension entitlements (closing balance sheet) 78.5 415.0
Memo: Pension entitlements (closing balance sheet) in EUR billions 2,270 17,404
Sources: ECB and Research Centre for Generational Contracts, Freiburg University. Notes: The row and column numbers refer to the corresponding row and column numbers in Table 2.1) See Box 2 for details on the valuation methods.

95ECB
Monthly Bulletin
January 2010
ARTICLES
Entitlements of households
under government pension
schemes in the euro area –
results on the basis of
the new System
of National Accounts
fi gures do not allow a direct assessment of fi scal
sustainability, which would need to be based
on a more comprehensive approach, including
revenue projections.
Similar actuarial calculations have been carried
out by the US Bureau of Economic Analysis for
private and government-managed defi ned-
benefi t schemes and for social security pension
schemes in the United States.10 Currently, both
defi ned-benefi t and defi ned-contribution schemes
play important roles in fi nancing retirement for
households.11 While government-managed
unfunded defi ned-benefi t schemes are virtually
non-existent in the United States, pension
entitlements from private defi ned-benefi t
pension schemes add the equivalent of about
80% of US household GDI to US household
assets (see also Table 5, row 5). Moreover, US
household have contingent social security
pension entitlements of about 160% of
household GDI (see also Table 5, row 10).12
In order to account for the uncertainty surrounding
the actuarial estimates of contingent pension
entitlements of euro area households, sensitivity
analyses were carried out. The calculations shown
See M. B. Reinsdorf and D. G. Lenze, “Defi ned benefi t pensions 10
and household income and wealth”, Survey of Current Business,
August 2009; and D. Durant and M. Reinsdorf, op. cit.
In the US private sector, newly established pension schemes 11
are almost always defi ned-contribution schemes. The number
of private sector defi ned-benefi t schemes is declining very
slowly but remains above 40,000. The population covered
is ageing rapidly, so that benefi t payments are rising faster
than contributions. Moreover, the United States also has over
2,500 defi ned-benefi t pension schemes for employees of state
and local governments, while the federal government manages
about 40 defi ned-benefi t schemes for its employees.
Social security is covered in the estimates for the United States. It is 12
a social insurance programme, not a social assistance programme.
It is not very different from social security in Europe, except
that the benefi ts are generally lower relative to average earnings
because of the expectation that the retiree will also have income
from employer schemes or from individual insurance schemes.
Table 4 Sensitivity analysis of household entitlements under government pension schemes in the euro area
(percentages of household GDI)
Real wage growth rate as a percentageReal discount rate as a percentage 1 1.5 2 Schemes G H G H G H
2.6 79.2 419.1 83.9 446.3 89.2 477.2
2.8 76.6 404.6 81.1 430.2 86.1 459.3
3.0 74.2 390.8 78.5 415.0 83.2 442.4
3.2 71.9 377.8 75.9 400.7 80.4 426.5
3.4 69.7 365.5 73.5 387.2 77.8 411.6
Sources: ECB and Research Centre for Generational Contracts, Freiburg University.Notes: Pension entitlements as percentages of household GDI; end-2007; projected-benefi t-obligation valuation; sensitivity analysis based on varying the real discount rate and real wage growth; baseline scenario: a real discount rate of 3% and real wage growth of 1.5%; G – government-managed unfunded defi ned-benefi t schemes; H – social security pension schemes.
Chart 4 Sensitivity analysis by varying the real discount rate and the real wage growth rate
(percentages of household GDI)
Government-managed unfunded defined-benefit schemes and social security pension schemes
-75
-50
-25
0
25
50
75
-75
-50
-25
0
25
50
75
2.6 2.8 3.0 3.2 3.4
real wage growth rate at 1%
real wage growth rate at 1.5%
real wage growth rate at 2%
Sources: ECB and Research Centre for Generational Contracts, Freiburg University.Notes: Pension entitlements as deviations from the baseline scenario as percentages of household GDI; end-2007; projected-benefi t-obligation valuation; sensitivity analysis based on varying the percentage of the real discount rate (x-axis) and the real wage growth rate; baseline scenario: a real discount rate of 3% and a real wage growth rate of 1.5%.

96ECB
Monthly Bulletin
January 2010
in Table 4 and Chart 4 are based on various
model assumptions, with a baseline scenario
assuming a long-term real discount rate of 3%
and an annual real wage growth of 1.5%. To
check the robustness of the results, the baseline
assumptions were changed as indicated in the
table and in the chart. For these calculations, the
projected-benefi t-obligation (PBO) method was
applied (see Box 2).
As shown in Chart 4, the impact of a change
in the real discount rate on the amount of
pension entitlements is substantially higher
than that of changes in the real wage growth.
The calculations based on the PBO valuation
lead to stocks of pension entitlements
that are usually 10% to 20% higher than
entitlements valued on the basis of the accrued
benefi t obligations (ABO). Moreover, the
sensitivities in the case of PBO valuation are
more pronounced than in the case of ABO
valuation. Hence, accrued-to-date pension
entitlements related to government-managed
pension schemes amounted to between 430%
and 570% of household GDI in the euro area at
the end of 2007.
Box 2
ACTUARIAL ESTIMATES OF PENSION ENTITLEMENTS
All pension entitlements of households are assessed as part of the extended household balance
sheet in the national accounts (showing assets and contingent assets) at a certain point in time,
usually at the year-end. The pension entitlements under unfunded social insurance are recorded
in gross terms, meaning that no accrued-to-date obligations of households refl ecting future
social contributions to fi nance the pension entitlements are taken into account; instead only the
accrued-to-date pension entitlements for current and future pension benefi ts are covered, i.e.
the pension entitlements accrued by current workers (including deferred pension entitlements)
and the remaining pension entitlements of existing pensioners. As for all national accounts data,
the data are measured ex post, as they include only the current values of the entitlements that
arise from already accrued pension rights. The method is based on observable past events and
transactions, such as membership of the pension scheme and contributions paid. However, these
ex post measures also rely on some assumptions in the modelling process. The probability that
current contributors may die or become disabled before reaching pensionable age needs to be
estimated. The approach also covers future changes to the (defi ned) pension benefi ts owing to
any legislation enacted prior to the year for which pension entitlements are calculated. Finally,
the method requires assumptions about future developments, notably the development of the
discount rate for future pension disbursements.
As with all other assets, the pension entitlements are entered into the extended household
balance sheet at their value on the balance sheet date. Since actuarial values for pension
entitlements related to unfunded social insurance in the euro area are typically not made
available by the manager of the pension scheme, compilers of national accounts have to
estimate the actuarial value.
The real discount rate applied has a relatively large impact on the overall amount estimated.
Sensitivity analyses using several different discount rates (or discount rate differentials) are
strongly recommended. Three choices may be considered for a discount rate to be applied

97ECB
Monthly Bulletin
January 2010
ARTICLES
Entitlements of households
under government pension
schemes in the euro area –
results on the basis of
the new System
of National Accounts
A COMPREHENSIVE VIEW OF HOUSEHOLD
PENSION ENTITLEMENTS AND GOVERNMENT
PENSION OBLIGATIONS
The data provided in balance sheets for the euro
area and in these preliminary compilations allow
a more comprehensive picture of household
assets – including household contingent pension
assets – and liabilities, to be drawn. Household
wealth is broken down into non-fi nancial
assets (housing) and fi nancial assets. Table 5
illustrates that household assets in the euro area
(excluding contingent pension entitlements)
were more than seven times annual household
GDI at the end of 2007; the same calculation
for the United States shows that household
entitlements were more than eight times
larger than annual household GDI. Contingent
pension entitlements of households in the euro
area are larger than those in the United States –
at approximately fi ve times and two times
annual household GDI respectively. There are
to government-managed pension schemes: (i) a discount rate based on the yield on (central)
government bonds; (ii) a discount rate based on the yield on high quality corporate bonds; and
(iii) a risk-free rate refl ecting the time value of money. The preferred discount rate is the yield
on central government bonds (or, exceptionally, high quality corporate bonds). These should,
ideally, have a residual maturity of the same order as the pension entitlements (e.g. 30 years,
which corresponds to the average length of pension entitlement payments).
Another important aspect is the assumption about real wage growth used in the calculations of
entitlements under defi ned-benefi t pension schemes, where the level of pensions is determined
by applying a formula to the member’s salary. One approach is to assume that there is no
future real wage growth – the accrued-benefi t-obligation method. The alternative approach is
to make an explicit non-zero assumption for wage growth – the projected-benefi t-obligation
method – which would take account of expected promotions and other factors driving
real wages.
Table 5 Household assets, liabilities, net worth and contingent pension entitlements in the euro area and the United States
(multiples of household GDI; end-2007)
Item Euro area United States
Assets 7.3 8.3Non-fi nancial assets 4.4 2.8
Financial assets 3.0 5.5
Of which:Life insurance and pension assets (as currently reported) 0.8 1.3
Of which:Pension entitlements under private defi ned-benefi t schemes 1) . 0.8
Liabilities 0.9 1.4Net worth (assets minus liabilities) 6.4 6.9Memo items:Contingent pension entitlements 4.9 1.6Under government-managed defi ned-benefi t schemes 2) 0.8 0.0 3)
Under social security pension schemes 4.2 1.6 4)
Sources: ECB, European Commission (Eurostat), Research Centre for Generational Contracts, Freiburg University, US Bureau of Economic Analysis and US Federal Reserve Board.1) For the euro area, data are not yet available; for the United States, data refer to end-2006. 2) Government-managed defi ned-benefi t schemes are predominantly unfunded in the euro area, but are predominantly funded in the United States. 3) Government-managed unfunded defi ned-benefi t schemes are practically non-existent in the United States although the pre-1983 federal government scheme was unfunded and still supports many retirees. 4) US households have contingent social security pension entitlements.

98ECB
Monthly Bulletin
January 2010
practically no pension entitlements recorded
under US government-managed unfunded
defi ned-benefi t schemes, but many under social
security pension schemes.
From the fi gures shown in Table 5 information
can be derived on government pension obligations
arising from government-managed pension
schemes at the end of 2007. Table 6 provides an
overview of gross government debt in the euro
area and in the United States as conventionally
measured. It shows that government debt was
between 60% and 70% of GDP (see Table 6).
If all contingent pension liabilities are taken
into account, government obligations in the
euro area at the end of 2007 were more than
fi ve times higher than gross government debt
(see Table 6). The associated increase in
government obligations is less signifi cant in the
United States.
ASSESSING THE IMPACT OF PENSION REFORMS
ON ENTITLEMENTS UNDER GOVERNMENT
PENSION SCHEMES
The calculations presented above may have
substantial implications for future rates of
benefi ts, taxes and social contributions. Reforms
of government-managed defi ned-benefi t pension
schemes are on the agenda of most governments in
the euro area as these schemes are far more strongly
affected by demographic changes than defi ned-
contribution pension schemes. A demographic
change that reduces the number of contributors
relative to the benefi ciaries will require a reduction
in average pension benefi ts if contribution rates
are to remain constant. Alternatively, for constant
pension benefi ts, contribution rates (or tax
payments) would have to be increased. To avoid
an unbalanced burden either on benefi ciaries or on
contributors, different strategies of pension reform
are typically considered.
Reforms may take the form of adjusting the
existing scheme arrangements with regard to the
level of pension benefi ts and social contributions
(parametric reforms). Alternatively, fundamental
changes may be made to the structure of the
fi nancing of pension benefi ts (systemic reforms).
They may be carried out by setting up a new
scheme for new contributions or new contributors,
while largely maintaining the current scheme
for accrued entitlements. Policy simulations
based on pension models are useful for broadly
assessing the impact of parametric pension
reforms by modifying parameters and input data
for existing schemes. In this context, several
important determining factors of the accrued
pension entitlements can be identifi ed. The levels
of pension benefi ts actually paid are regarded as
quite important as they are a direct determinant of
the stock of pension entitlements. The retirement
age is an additional determining factor. Other
factors are the indexation of pension benefi ts, as
well as reductions in future pension benefi ts on
account of pension reforms already enacted.
Table 6 General government debt and contingent pension entitlements in the euro area and the United States
(multiples of GDP; end-2007)
Item Euro area United States
Maastricht debt 0.7 0.6 1)
Memo items:Contingent pension obligations 3.3 1.1Government-managed defi ned-benefi t schemes 2) 0.5 0.0 3)
Social security pension schemes 2.8 1.1 4)
Debt including contingent pension obligations 4.0 1.7
Sources: ECB, European Commission (Eurostat), Research Centre for Generational Contracts, Freiburg University, US Bureau of Economic Analysis and US Federal Reserve Board. 1) Currency and deposits, loans and debt securities incurred by general government (consolidated). 2) Government-managed defi ned-benefi t schemes are predominantly unfunded in the euro area, but are predominantly funded in the United States. 3) Government-managed unfunded defi ned-benefi t schemes are practically non-existent in the United States. 4) US households have contingent social security pension entitlements.

99ECB
Monthly Bulletin
January 2010
ARTICLES
Entitlements of households
under government pension
schemes in the euro area –
results on the basis of
the new System
of National Accounts
In several euro area countries, pension reforms
have been carried out in recent years by, inter
alia, gradually raising the statutory retirement
age. If the effective retirement age rises in line
with the increase in the statutory retirement
age, pension benefi ts will decrease as eligible
individuals will draw pension payments for a
shorter period of time. In parallel, the payment
of pension contributions over a longer period
adds to the revenue of pension schemes.
According to policy simulations, the impact
of raising the effective retirement age for the
euro area by one year would lower pension
entitlements by 2.7%, and by 5.2% if it is
increased by two years (relative to the baseline
scenario shown in Table 4). A further aspect to
be considered when modelling such an increase
in the retirement age is that the outcome of
the reform depends also on the behavioural
assumptions regarding new benefi ciaries with
respect to changes in the retirement age, the
penalty for early retirement and legislation on,
for example, granting disability benefi ts.
4 PROJECTIONS OF THE IMPACT OF AGEING
POPULATIONS ON GOVERNMENT PENSION
EXPENDITURE – THE 2009 AGEING REPORT
In April 2009 the ECOFIN Council endorsed
the 2009 Ageing Report for the EU-27 Member
States (2008-2060), which had been prepared by
the European Commission and the Economic
Policy Committee on the basis of commonly
agreed demographic and macroeconomic
assumptions. As explained in Box 3, the concept
of implicit pension liabilities, as applied in the
Ageing Report, differs from that of estimating
accrued-to-date pension entitlements in the
national accounts as it projects total age-related
government expenditure including pensions
over a long horizon.
Both concepts are linked to each other:
accrued-to-date pension entitlements are
compiled ex post taking into consideration all
“claims” accrued by current workers and the
remaining pension entitlements of existing
pensioners. In this respect, they are only a
sub-set of implicit pension liabilities. Implicit
pension liabilities also include, in addition to
pension entitlements that have accrued to date,
inter alia, pensions to be paid to people who
are not yet in the labour market, some of whom
have not even been born yet. To this extent,
implicit pension liabilities are a forward-
looking concept that is based on a broader set
of projections.13
The amount of such implicit liabilities may be much higher 13
than the amount of accrued-to-date pension entitlements.
In an empirical study undertaken with data for the social security
pension scheme in Germany, these implicit pension liabilities
(open-system gross pension obligations) were calculated at 622%
of GDP in 2006 of which less than half were accrued-to-date
pension obligations. Future social contributions and taxes added
up to 535% of GDP in 2006 leading to a relatively low balancing
item, the “fi nancing gap” of approximately 88% of GDP. See
C. Müller, B. Raffelhueschen and O. Weddige, “Measuring
pension liabilities and the perspective of sustainability: the case
of the reformed German statutory pension scheme”, Discussion
Paper No 39, Research Centre for Generational Contracts,
Freiburg University, September 2009.

100ECB
Monthly Bulletin
January 2010
Box 3
PENSION ENTITLEMENTS ACCRUED TO DATE AND IMPLICIT PENSION LIABILITIES
The concepts of accrued-to-date pension entitlements and implicit pension liabilities, as applied
in the 2009 Ageing Report for the EU-27 Member States (2008-2060), are linked to each other.
Accrued-to-date contingent pension entitlements are compiled on the basis of a national accounts
concept. They are derived ex post as they only include the pension entitlements accrued by
current workers and the remaining pension entitlements of existing pensioners.
Pension entitlements accrued to date are a component of a broader defi nition of implicit pension
liabilities. They represent only a fraction of the pensions to be paid in the future. According
to the 2009 Ageing Report, government pension expenditure in the euro area is projected to
increase by 2.8 percentage points to nearly 14% of GDP by 2060 if it is assumed that policies
remain unchanged.1 These future payments can be divided into four groups: (a) for each year,
pensions have to be paid to people who have already retired today. Given the mortality of
pensioners, this group of payments is expected to progressively decline in importance and will
become zero upon the death of the last people who have already retired today; (b) pensions have
to be paid in future to people working today, in relation to the entitlement they have already
acquired up to the present moment. This share of payments will increase for several years, as
people currently working will progressively retire; it will then decrease in line with mortality;
(c) pensions have to be paid to people already in the labour market, in relation to the entitlements
they will accumulate from the present moment until their retirement; and (d) pensions have to
be paid in the distant future to people who are not yet in the labour market, some of whom are
yet to be born.
Accrued-to-date pension entitlements, as measured in national accounts, correspond to (a) and
(b) if account is taken of the necessary modelling assumptions such as the discount rate or wage
growth. The concept that is relevant for assessing sustainability, by contrast, corresponds to (a) to
(d), together with the related government revenues. However, implicit pension liabilities are also
derived by making corresponding assumptions related to the discount rate and other parameters
of pension models.
Accordingly, accrued-to-date pension entitlements are based on a backward-looking actuarial
estimation, even though the estimation requires projections on the future development of interest
rates, wages and the population. By contrast, implicit pension liabilities are a forward-looking
concept based on a broader set of projections, and they are set to be used in the EU’s new
medium-term budgetary objectives. For reasons of consistency, it is appropriate to harmonise
the data input for calculations of accrued-to-date contingent pension entitlements and also for
projections of government pension expenditure.
In practice, there are cases in which the results derived for accrued-to-date pension
entitlements and for implicit pension liabilities appear to point in different directions. Countries
may have large accrued-to-date contingent pension entitlements, but their implicit pension
liabilities are not expected to increase in the future. These countries have mature pension systems,
so that large accrued-to-date contingent pension entitlements have been accumulated over time.
1 The results of the 2009 Ageing Report are described in Box 7 of the June 2009 issue of the Monthly Bulletin.

101ECB
Monthly Bulletin
January 2010
ARTICLES
Entitlements of households
under government pension
schemes in the euro area –
results on the basis of
the new System
of National Accounts
5 CONCLUSION
As described in the article, the 2008 SNA
foresees supplementary data on pension
entitlements of households under government
pension schemes, as will the European System
of Accounts, which is currently being revised.
Following this approach, the European
Commission (Eurostat)/ECB Task Force on
Pensions has already undertaken preparatory
work to provide estimates of these pension
entitlements under unfunded defi ned-benefi t
schemes managed by government and under
social security schemes. In the absence of
data from other sources or reporting agents,
the national statistical institutes have carried
out these estimates in cooperation with other
national agencies. This was a rather new and
challenging task, requiring extensive experience
in actuarial fi nance.
The data compiled in accordance with the new,
globally agreed and harmonised methodology
confi rm that accrued-to-date contingent pension
entitlements are very signifi cant in the euro area,
even exceeding the portfolio of all fi nancial
assets or that of non-fi nancial assets owned by
households. They total approximately 490% of
households’ annual gross disposable income
(or 330% of GDP). In terms of government
obligations, they are about fi ve times higher than
government debt. The results are in line with
those of earlier studies reviewed by the World
Bank for a wide range of countries, including
several euro area countries, and with estimates
calculated by the national statistical offi ces of
Germany and France.
It must be stressed that the compilation of
general government accrued-to-date pension
obligations does not allow an assessment of the
sustainability of public fi nances. This would only
be possible if the evolution of future contributions
to the pension schemes were fully accounted
for. Nevertheless, if recorded systematically
over a long time horizon, data on accrued-
to-date pension obligations may contribute
usefully to gauging, inter alia, to what extent the
size of pension obligations changes in response
to reforms of government pension schemes,
e.g. increases in the statutory retirement age.
Given the size of the ageing-related fi scal
burden, it is necessary for countries to
fi nd an intergenerational balance between
securing appropriate pensions in the future
and maintaining the social security burden for
members of the labour force within tolerable
limits. The same also applies to other types of
government obligations in the form of health
care and long-term care. The implementation
of the so-called three-pronged strategy agreed
upon by the Stockholm European Council in
2001 is essential. It comprises (i) fostering fi scal
consolidation, (ii) increasing productivity and
employment and (iii) reforming social security
systems including pensions.
On account of both demographic developments and the design of the pension system, however,
future pension expenditures are not under strain. On the other hand, there are also countries
that may have small accrued-to-date contingent pension entitlements, but their implicit pension
liabilities are expected to increase in the future. These are typically countries that have a new
pension system, so that the accrued-to-date contingent pension entitlements are still small. These
countries will have obligations for the future pensioners in the future, and these are refl ected in
their implicit pension liabilities.


S 1ECB
Monthly Bulletin
January 2010
EURO AREA STATISTICS


S 3ECB
Monthly Bulletin
January 2010
CONTENTS 1
For further information, please contact us at: [email protected]. See the ECB’s Statistical Data Warehouse in the “Statistics” section of the ECB’s website 1
(http://sdw.ecb.europa.eu) for longer runs and more detailed data.
EURO AREA OVERVIEW
Summary of economic indicators for the euro area S5
1 MONETARY POLICY STATISTICS
1.1 Consolidated fi nancial statement of the Eurosystem S6
1.2 Key ECB interest rates S7
1.3 Eurosystem monetary policy operations allotted through tender procedures S8
1.4 Minimum reserve and liquidity statistics S9
2 MONEY, BANKING AND INVESTMENT FUNDS
2.1 Aggregated balance sheet of euro area MFIs S10
2.2 Consolidated balance sheet of euro area MFIs S11
2.3 Monetary statistics S12
2.4 MFI loans: breakdown S14
2.5 Deposits held with MFIs: breakdown S17
2.6 MFI holdings of securities: breakdown S20
2.7 Revaluation of selected MFI balance sheet items S21
2.8 Currency breakdown of selected MFI balance sheet items S22
2.9 Aggregated balance sheet of euro area investment funds S24
2.10 Securities held by investment funds broken down by issuer of securities S25
3 EURO AREA ACCOUNTS
3.1 Integrated economic and fi nancial accounts by institutional sector S26
3.2 Euro area non-fi nancial accounts S30
3.3 Households S32
3.4 Non-fi nancial corporations S33
3.5 Insurance corporations and pension funds S34
4 FINANCIAL MARKETS
4.1 Securities other than shares by original maturity, residency of the issuer and currency S35
4.2 Securities other than shares issued by euro area residents, by sector of the issuer and instrument type S36
4.3 Growth rates of securities other than shares issued by euro area residents S38
4.4 Quoted shares issued by euro area residents S40
4.5 MFI interest rates on euro-denominated deposits from and loans to euro area residents S42
4.6 Money market interest rates S44
4.7 Euro area yield curves S45
4.8 Stock market indices S46
5 PRICES, OUTPUT, DEMAND AND LABOUR MARKETS
5.1 HICP, other prices and costs S47
5.2 Output and demand S50
5.3 Labour markets S54
6 GOVERNMENT FINANCE
6.1 Revenue, expenditure and defi cit/surplus S55
6.2 Debt S56

ECB
Monthly Bulletin
January 2010
Conventions used in the tables
“-” data do not exist/data are not applicable
“.” data are not yet available
“…” nil or negligible
“billion” 109
(p) provisional
s.a. seasonally adjusted
n.s.a. non-seasonally adjusted
S 4
ENLARGEMENT OF THE EURO AREA ON 1 JANUARY 2009 TO INCLUDE SLOVAKIA
Unless otherwise indicated, all data series including observations for 2009 and beyond relate to the Euro 16 (the euro area
including Slovakia) for the whole time series. For interest rates, monetary statistics and the HICP (and, for consistency
reasons, the components and counterparts of M3 and the components of the HICP), the statistical series relating to the euro
area cover the EU Member States that had adopted the euro at the time to which the statistics relate. Where applicable, this
is indicated in the tables by means of a footnote. In such cases, where underlying data are available, absolute and percentage
changes for the respective year of entry into the euro area of Greece (2001), Slovenia (2007), Cyprus (2008), Malta (2008)
and Slovakia (2009), calculated from bases covering the year prior to the year of entry, use a series in which the impact
of these countries’ joining the euro area is taken into account. Historical data referring to the euro area before the entry
of Slovakia are available on the ECB’s website at: http://www.ecb.europa.eu/stats/services/downloads/html/index.en.html
6.3 Change in debt S57
6.4 Quarterly revenue, expenditure and defi cit/surplus S58
6.5 Quarterly debt and change in debt S59
7 EXTERNAL TRANSACTIONS AND POSITIONS
7.1 Summary balance of payments S60
7.2 Current and capital accounts S61
7.3 Financial account S63
7.4 Monetary presentation of the balance of payments S69
7.5 Trade in goods S70
8 EXCHANGE RATES
8.1 Effective exchange rates S72
8.2 Bilateral exchange rates S73
9 DEVELOPMENTS OUTSIDE THE EURO AREA
9.1 In other EU Member States S74
9.2 In the United States and Japan S75
LIST OF CHARTS S76
TECHNICAL NOTES S77
GENERAL NOTES S83

ECB
Monthly Bulletin
January 2010 S 5
EURO AREA OVERVIEW
Summary of economic indicators for the euro area (annual percentage changes, unless otherwise indicated)
1. Monetary developments and interest rates 1)
M1 2) M2 2) M3 2), 3) M3 2), 3) MFI loans to Securities other 3-month 10-year3-month euro area than shares issued interest rate spot rate
moving average residents in euro by non-MFI (EURIBOR; (% per annum;(centred) excluding MFIs corporations 2) % per annum; end of
and general period period) 4)
government 2) averages)
1 2 3 4 5 6 7 82008 2.4 9.6 9.7 - 9.5 18.9 4.64 3.692009 . . . - . . 1.22 3.76
2009 Q1 5.3 7.3 6.1 - 4.6 26.1 2.01 3.77 Q2 8.0 5.5 4.4 - 2.1 27.8 1.31 3.99 Q3 12.3 4.5 2.8 - 0.4 25.3 0.87 3.64 Q4 . . . - . . 0.72 3.76
2009 July 12.2 4.7 3.0 3.1 0.6 26.9 0.97 3.74 Aug. 13.6 4.6 2.6 2.5 0.1 24.0 0.86 3.68 Sep. 12.8 3.6 1.8 1.6 -0.3 24.3 0.77 3.64 Oct. 11.8 2.3 0.3 0.6 -0.8 23.6 0.74 3.68 Nov. 12.6 1.9 -0.2 . -0.7 19.7 0.72 3.57 Dec. . . . . . . 0.71 3.76
2. Prices, output, demand and labour markets
HICP 1) Industrial Hourly Real GDP Industrial Capacity Employment Unemploymentproducer labour production utilisation in (% of labour
prices costs excluding manufacturing force)construction (percentages)
1 2 3 4 5 6 7 82008 3.3 6.1 3.4 0.6 -1.7 81.8 0.7 7.52009 . . . . . . . .
2009 Q2 0.2 -5.7 4.3 -4.8 -18.6 70.0 -1.8 9.3 Q3 -0.4 -7.8 3.2 -4.0 -14.5 70.1 -2.1 9.7 Q4 . . . . . . . .
2009 July -0.7 -8.4 - - -15.8 69.6 - 9.5 Aug. -0.2 -7.5 - - -15.1 - - 9.6 Sep. -0.3 -7.6 - - -12.7 - - 9.8 Oct. -0.1 -6.6 - - -10.9 70.7 - 9.9 Nov. 0.5 -4.5 - - . - - 10.0 Dec. 0.9 . - - . - - .
3. Balance of payments, reserve assets and exchange rates(EUR billions, unless otherwise indicated)
Balance of payments (net transactions) Reserve assets Effective exchange rate of USD/EUR (end-of-period the euro: EER-21 5) exchange rate
Current and Direct Portfolio positions) (index: 1999 Q1 = 100)capital Goods investment investment
accounts Nominal Real (CPI)
1 2 3 4 5 6 7 82008 -133.3 -11.4 -189.0 350.5 374.2 110.5 110.1 1.47082009 . . . . . 111.7 110.6 1.3948
2009 Q1 -36.6 -7.7 -58.8 129.9 395.7 109.9 109.2 1.3029 Q2 -17.4 12.5 -0.6 98.1 381.5 111.1 110.2 1.3632 Q3 3.2 13.5 -14.9 96.6 430.9 112.1 110.9 1.4303 Q4 . . . . . 113.8 112.2 1.4779
2009 July 10.7 12.6 8.5 -3.0 386.5 111.6 110.5 1.4088 Aug. -2.8 -1.0 2.8 46.1 428.0 111.7 110.6 1.4268 Sep. -4.6 1.9 -26.2 53.5 430.9 112.9 111.6 1.4562 Oct. -3.6 7.5 -1.5 19.2 437.9 114.3 112.8 1.4816 Nov. . . . . 464.2 114.0 112.5 1.4914 Dec. . . . . . 113.0 111.4 1.4614
Sources: ECB, European Commission (Eurostat and Economic and Financial Affairs DG) and Reuters.Note: For more information on the data, see the relevant tables later in this section.1) Data refer to the changing composition of the euro area. For further information, see the General Notes.2) Annual percentage changes for monthly data refer to the end of the month, whereas those for quarterly and yearly data refer to the annual change in the period average.
See the Technical Notes for details.3) M3 and its components exclude holdings by non-euro area residents of money market fund shares/units and debt securities with a maturity of up to two years.4) Based on AAA-rated euro area central government bond yield curves. For further information, see Section 4.7.5) For a definition of the trading partner groups and other information, please refer to the General Notes.

ECB
Monthly Bulletin
January 2010
1
S 6
MONETARY POLICY STATISTICS
1.1 Consolidated financial statement of the Eurosystem (EUR millions)
1. Assets
18 December 2009 25 December 2009 1 January 2010 8 January 2010
Gold and gold receivables 238,147 238,147 266,919 266,919Claims on non-euro area residents in foreign currency 192,094 191,909 195,480 196,138Claims on euro area residents in foreign currency 33,260 31,708 32,151 31,434Claims on non-euro area residents in euro 15,733 15,696 15,198 16,190Lending to euro area credit institutions in euro 722,935 728,584 749,906 724,030
Main refinancing operations 53,574 59,221 79,293 54,652Longer-term refinancing operations 669,288 669,296 669,297 669,303Fine-tuning reverse operations 0 0 0 0Structural reverse operations 0 0 0 0Marginal lending facility 45 40 1,289 46Credits related to margin calls 28 27 27 30
Other claims on euro area credit institutions in euro 24,752 25,765 26,281 26,890Securities of euro area residents in euro 329,221 329,546 328,652 329,637
Securities held for monetary policy purposes 27,679 28,504 28,782 29,112Other securities 301,542 301,042 299,870 300,526
General government debt in euro 36,183 36,188 36,161 36,171Other assets 250,027 254,921 254,188 252,181
Total assets 1,842,352 1,852,463 1,904,935 1,879,590
2. Liabilities
18 December 2009 25 December 2009 1 January 2010 8 January 2010
Banknotes in circulation 797,502 807,191 806,522 796,391Liabilities to euro area credit institutions in euro 389,312 368,683 395,614 387,831
Current accounts (covering the minimum reserve system) 252,825 204,594 233,490 160,684Deposit facility 136,477 164,088 162,117 227,141Fixed-term deposits 0 0 0 0Fine-tuning reverse operations 0 0 0 0Deposits related to margin calls 10 1 6 6
Other liabilities to euro area credit institutions in euro 292 330 340 497Debt certificates issued 0 0 0 0Liabilities to other euro area residents in euro 113,295 133,760 129,749 123,371Liabilities to non-euro area residents in euro 47,391 46,459 46,759 46,338Liabilities to euro area residents in foreign currency 3,310 3,703 4,032 4,710Liabilities to non-euro area residents in foreign currency 9,345 9,567 9,616 9,560Counterpart of special drawing rights allocated by the IMF 50,906 50,906 51,249 51,249Other liabilities 165,782 166,647 167,840 166,468Revaluation accounts 192,254 192,254 220,212 220,213Capital and reserves 72,963 72,964 73,001 72,962
Total liabilities 1,842,352 1,852,463 1,904,935 1,879,590
Source: ECB.

S 7ECB
Monthly Bulletin
January 2010
EURO AREASTATISTICS
Monetary
policy
statistics
1.2 Key ECB interest rates (levels in percentages per annum; changes in percentage points)
With effect from: 1) Deposit facility Main refinancing operations Marginal lending facility
Fixed rate tenders Variable rate tenders Fixed rate Minimum bid rate
Level Change Level Level Change Level Change
1 2 3 4 5 6 71999 1 Jan. 2.00 - 3.00 - - 4.50 -
4 2) 2.75 0.75 3.00 - ... 3.25 -1.2522 2.00 -0.75 3.00 - ... 4.50 1.25
9 Apr. 1.50 -0.50 2.50 - -0.50 3.50 -1.005 Nov. 2.00 0.50 3.00 - 0.50 4.00 0.50
2000 4 Feb. 2.25 0.25 3.25 - 0.25 4.25 0.2517 Mar. 2.50 0.25 3.50 - 0.25 4.50 0.2528 Apr. 2.75 0.25 3.75 - 0.25 4.75 0.25
9 June 3.25 0.50 4.25 - 0.50 5.25 0.5028 3) 3.25 ... - 4.25 ... 5.25 ...
1 Sep. 3.50 0.25 - 4.50 0.25 5.50 0.256 Oct. 3.75 0.25 - 4.75 0.25 5.75 0.25
2001 11 May 3.50 -0.25 - 4.50 -0.25 5.50 -0.2531 Aug. 3.25 -0.25 - 4.25 -0.25 5.25 -0.2518 Sep. 2.75 -0.50 - 3.75 -0.50 4.75 -0.50
9 Nov. 2.25 -0.50 - 3.25 -0.50 4.25 -0.502002 6 Dec. 1.75 -0.50 - 2.75 -0.50 3.75 -0.502003 7 Mar. 1.50 -0.25 - 2.50 -0.25 3.50 -0.25
6 June 1.00 -0.50 - 2.00 -0.50 3.00 -0.502005 6 Dec. 1.25 0.25 - 2.25 0.25 3.25 0.252006 8 Mar. 1.50 0.25 - 2.50 0.25 3.50 0.25
15 June 1.75 0.25 - 2.75 0.25 3.75 0.259 Aug. 2.00 0.25 - 3.00 0.25 4.00 0.25
11 Oct. 2.25 0.25 - 3.25 0.25 4.25 0.2513 Dec. 2.50 0.25 - 3.50 0.25 4.50 0.25
2007 14 Mar. 2.75 0.25 - 3.75 0.25 4.75 0.2513 June 3.00 0.25 - 4.00 0.25 5.00 0.25
2008 9 July 3.25 0.25 - 4.25 0.25 5.25 0.258 Oct. 2.75 -0.50 - - - 4.75 -0.509 4) 3.25 0.50 - - - 4.25 -0.50
15 5) 3.25 ... 3.75 - -0.50 4.25 ... 12 Nov. 2.75 -0.50 3.25 - -0.50 3.75 -0.5010 Dec. 2.00 -0.75 2.50 - -0.75 3.00 -0.75
2009 21 Jan. 1.00 -1.00 2.00 - -0.50 3.00 ... 11 Mar. 0.50 -0.50 1.50 - -0.50 2.50 -0.50
8 Apr. 0.25 -0.25 1.25 - -0.25 2.25 -0.2513 May 0.25 ... 1.00 - -0.25 1.75 -0.50
Source: ECB.1) From 1 January 1999 to 9 March 2004, the date refers to the deposit and marginal lending facilities. For main refinancing operations, changes in the rate are effective from the
first operation following the date indicated. The change on 18 September 2001 was effective on that same day. From 10 March 2004 onwards, the date refers both to the depositand marginal lending facilities and to the main refinancing operations (with changes effective from the first main refinancing operation following the Governing Councildecision), unless otherwise indicated.
2) On 22 December 1998 the ECB announced that, as an exceptional measure between 4 and 21 January 1999, a narrow corridor of 50 basis points would be applied between theinterest rates for the marginal lending facility and the deposit facility, aimed at facilitating the transition to the new monetary regime by market participants.
3) On 8 June 2000 the ECB announced that, starting from the operation to be settled on 28 June 2000, the main refinancing operations of the Eurosystem would be conducted asvariable rate tenders. The minimum bid rate refers to the minimum interest rate at which counterparties may place their bids.
4) As of 9 October 2008 the ECB reduced the standing facilities corridor from 200 basis points to 100 basis points around the interest rate on the main refinancing operations.The standing facilities corridor was restored to 200 basis points as of 21 January 2009.
5) On 8 October 2008 the ECB announced that, starting from the operation to be settled on 15 October, the weekly main refinancing operations would be carried out through afixed rate tender procedure with full allotment at the interest rate on the main refinancing operations. This change overrode the previous decision (made on the same day)to cut by 50 basis points the minimum bid rate on the main refinancing operations conducted as variable rate tenders.

ECB
Monthly Bulletin
January 2010S 8
1.3 Eurosystem monetary policy operations allotted through tender procedures 1), 2) (EUR millions; interest rates in percentages per annum)
1. Main and longer-term refinancing operations 3), 4)
Main refinancing operations
Date of Bids Number of Allotment Fixed rate tender Variable rate tender Running for
settlement (amount) participants (amount) procedures procedures (...) days
Fixed rate Minimum Marginal Weightedbid rate rate 5) average rate
1 2 3 4 5 6 7 8
2009 16 Sep. 87,800 318 87,800 1.00 - - - 723 85,004 332 85,004 1.00 - - - 730 66,767 244 66,767 1.00 - - - 7
7 Oct. 62,620 224 62,620 1.00 - - - 714 61,565 218 61,565 1.00 - - - 721 49,803 224 49,803 1.00 - - - 728 48,660 188 48,660 1.00 - - - 7
4 Nov. 46,201 170 46,201 1.00 - - - 711 51,250 160 51,250 1.00 - - - 718 52,580 177 52,580 1.00 - - - 725 59,066 168 59,066 1.00 - - - 7
2 Dec. 58,128 137 58,128 1.00 - - - 68 55,779 111 55,779 1.00 - - - 8
16 52,899 125 52,899 1.00 - - - 723 58,575 109 58,575 1.00 - - - 730 78,647 132 78,647 1.00 - - - 7
2010 6 Jan. 54,023 100 54,023 1.00 - - - 713 60,077 102 60,077 1.00 - - - 7
Longer-term refinancing operations
2009 8 Oct. 1,128 8 1,128 1.00 - - - 988 2,368 22 2,368 1.00 - - - 182
14 7,741 19 7,741 1.00 - - - 2829 3,284 25 3,284 1.00 - - - 9111 Nov. 2,536 12 2,536 1.00 - - - 2712 10,794 9 10,794 1.00 - - - 9112 782 21 782 1.00 - - - 18226 2,065 19 2,065 1.00 - - - 91
8 Dec. 2,655 8 2,655 1.00 - - - 4310 2,933 9 2,933 1.00 - - - 9110 1,728 21 1,728 1.00 - - - 18217 2,558 21 2,558 1.00 - - - 10517 6) 96,937 224 96,937 . - - - 371
2. Other tender operations
Date of settlement Type of Bids Number of Allotment Fixed rate tender Variable rate tender Running
operation (amount) participants (amount) procedures procedures for(...) days
Fixed rate Minimum Maximum Marginal Weightedbid rate bid rate rate 5) average rate
1 2 3 4 5 6 7 8 9 102008 9 Oct. Reverse transaction 24,682 99 24,682 3.75 - - - - 6
11 Nov. Collection of fixed-term deposits 149,656 117 79,940 - - 3.75 3.60 3.51 19 Dec. Collection of fixed-term deposits 152,655 95 137,456 - - 3.25 3.05 2.94 1
2009 20 Jan. Collection of fixed-term deposits 143,835 103 140,013 - - 2.50 2.30 2.15 110 Feb. Collection of fixed-term deposits 130,435 119 129,135 - - 2.00 1.80 1.36 110 Mar. Collection of fixed-term deposits 111,502 119 110,832 - - 2.00 1.80 1.52 1
7 Apr. Collection of fixed-term deposits 105,486 114 103,876 - - 1.50 1.30 1.12 112 May Collection of fixed-term deposits 109,091 128 108,056 - - 1.25 1.05 0.93 1
9 June Collection of fixed-term deposits 91,551 101 57,912 - - 1.00 0.80 0.77 17 July Collection of fixed-term deposits 279,477 165 275,986 - - 1.00 0.80 0.64 1
11 Aug. Collection of fixed-term deposits 238,847 159 238,345 - - 1.00 0.80 0.70 18 Sep. Collection of fixed-term deposits 196,299 157 195,099 - - 1.00 0.80 0.73 1
13 Oct. Collection of fixed-term deposits 170,131 160 169,680 - - 1.00 0.80 0.74 110 Nov. Collection of fixed-term deposits 191,883 165 191,379 - - 1.00 0.80 0.76 1
7 Dec. Collection of fixed-term deposits 130,896 147 129,709 - - 1.00 0.80 0.76 1 Source: ECB.1) The amounts shown may differ slightly from those in Section 1.1 owing to operations that have been allotted but not settled.2) With effect from April 2002, split tender operations (i.e. operations with a one-week maturity conducted as standard tender procedures in parallel with a main refinancing
operation) are classified as main refinancing operations. For split tender operations conducted before this month, see Table 2 in Section 1.3.3) On 8 June 2000 the ECB announced that, starting from the operation to be settled on 28 June 2000, the main refinancing operations of the Eurosystem would be conducted as
variable rate tender procedures. The minimum bid rate refers to the minimum interest rate at which counterparties may place their bids.4) On 8 October 2008 the ECB announced that, starting from the operation to be settled on 15 October, the weekly main refinancing operations would be carried out through a
fixed rate tender procedure with full allotment at the interest rate on the main refinancing operations.5) In liquidity-providing (absorbing) operations, the marginal rate refers to the lowest (highest) rate at which bids were accepted.6) In the final one-year longer-term refinancing operation, which was settled on 17 December 2009, the rate at which all bids were satisfied was indexed to the average
minimum bid rate in the main refinancing operations over the life of this operation.

S 9ECB
Monthly Bulletin
January 2010
EURO AREASTATISTICS
Monetary
policy
statistics
1.4 Minimum reserve and liquidity statistics (EUR billions; period averages of daily positions, unless otherwise indicated; interest rates as percentages per annum)
1. Reserve base of credit institutions subject to reserve requirements
Reserve Total Liabilities to which a 2% reserve coefficient is applied Liabilities to which a 0% reserve coefficient is applied
baseas at: 1) Overnight deposits and Debt securities Deposits with an agreed Repos Debt securities
deposits with an agreed maturity issued with a maturity maturity or notice period issued with a maturityor notice period of up to 2 years of up to 2 years of over 2 years of over 2 years
1 2 3 4 5 62007 17,394.7 9,438.8 815.0 2,143.1 1,364.0 3,633.92008 18,169.6 10,056.8 848.7 2,376.9 1,243.5 3,643.72009 June 18,518.3 10,003.9 818.8 2,432.6 1,207.0 4,056.0 July 18,432.9 9,891.2 818.9 2,436.0 1,204.6 4,082.1 Aug. 18,319.0 9,817.8 799.7 2,427.1 1,172.3 4,102.1 Sep. 18,280.1 9,752.0 786.1 2,453.9 1,206.6 4,081.5 Oct. 18,260.1 9,766.9 763.3 2,420.9 1,224.8 4,084.2
2. Reserve maintenance
Maintenance Required Credit institutions’ Excess Deficiencies Interest rate onperiod reserves current accounts reserves minimum reserves
ending on:1 2 3 4 5
2008 217.2 218.7 1.5 0.0 3.252009 210.2 211.4 1.2 0.0 1.00
2009 11 Aug. 216.0 216.9 0.9 0.0 1.008 Sep. 215.9 216.9 1.0 0.0 1.00
13 Oct. 213.7 214.7 1.1 0.0 1.0010 Nov. 211.8 212.8 1.0 0.0 1.00
7 Dec. 210.2 211.4 1.2 0.0 1.002010 19 Jan. 210.1 . . . .
3. Liquidity
Maintenance Liquidity-providing factors Liquidity-absorbing factors Credit Base
period institutions’ moneyending on: Monetary policy operations of the Eurosystem current
accountsEurosystem’s Main Longer-term Marginal Other Deposit Other Banknotes Central Other
net assets refinancing refinancing lending liquidity- facility liquidity- in government factorsin gold operations operations facility providing absorbing circulation deposits (net)
and foreign operations 2) operations 3) with thecurrency Eurosystem
1 2 3 4 5 6 7 8 9 10 11 122008 580.5 337.3 457.2 2.7 0.0 200.9 4.9 731.1 107.8 114.3 218.7 1,150.72009 407.6 55.8 593.4 0.7 24.6 65.7 9.9 775.2 150.1 -130.2 211.4 1,052.3
2009 7 July 457.1 221.4 504.9 1.3 0.0 119.7 9.9 763.1 137.9 -65.1 219.2 1,102.011 Aug. 433.6 94.1 694.0 0.3 2.8 185.1 22.1 770.8 133.9 -103.9 216.9 1,172.8
8 Sep. 427.6 74.8 645.4 0.3 8.4 136.7 18.5 769.1 125.7 -110.4 216.9 1,122.713 Oct. 421.4 79.1 616.9 0.3 14.3 109.6 12.9 768.8 139.0 -113.1 214.7 1,093.110 Nov. 413.0 52.3 626.1 0.3 20.1 86.5 12.0 770.7 148.7 -118.9 212.8 1,070.0
7 Dec. 407.6 55.8 593.4 0.7 24.6 65.7 9.9 775.2 150.1 -130.2 211.4 1,052.3Source: ECB.1) End of period.2) Includes liquidity provided under the Eurosystem’s covered bond purchase programme.3) Includes liquidity absorbed as a result of the Eurosystem’s foreign exchange swap operations.
For more information, please see: http://www.ecb.europa.eu/mopo/liq/html/index.en.html

ECB
Monthly Bulletin
January 2010
2
S 10
MONEY, BANKING AND INVESTMENT FUNDS
2.1 Aggregated balance sheet of euro area MFIs 1) (EUR billions; outstanding amounts at end of period)
1. Assets
Eurosystem
Total Loans to euro area residents Holdings of securities other than Money Holdings External Fixed Remaining
shares issued by euro area residents market of shares/ assets assets assetsfund other equity
Total General Other MFIs Total General Other MFIs shares/ issued bygovernment euro area government euro area units 2) euro area
residents residents residents
1 2 3 4 5 6 7 8 9 10 11 12 13 14
2007 2,046.2 1,031.7 17.8 0.6 1,013.3 268.6 225.1 1.9 41.6 - 17.4 395.3 15.2 318.02008 2,982.9 1,809.4 18.6 0.6 1,790.1 350.8 308.0 2.4 40.3 - 14.4 476.7 15.7 316.12009 Q1 2,783.6 1,555.3 18.7 0.7 1,535.9 374.1 322.7 2.5 48.9 - 13.9 490.2 15.7 334.3 Q2 2,893.4 1,671.5 17.7 0.7 1,653.1 385.4 327.0 2.7 55.7 - 15.0 480.7 16.4 324.42009 July 2,734.4 1,500.7 17.7 0.7 1,482.4 391.8 327.8 3.0 60.9 - 15.3 483.6 16.5 326.6 Aug. 2,723.6 1,451.3 17.6 0.7 1,433.1 400.6 332.1 3.3 65.3 - 15.7 518.4 16.4 321.2 Sep. 2,746.8 1,465.9 17.6 0.7 1,447.7 408.4 336.0 3.3 69.2 - 16.1 517.5 16.6 322.2 Oct. 2,693.0 1,405.3 17.6 0.7 1,387.1 410.6 333.7 3.6 73.3 - 16.0 529.4 16.6 315.0 Nov. (p) 2,659.4 1,340.1 17.6 0.7 1,321.9 416.1 334.3 3.7 78.2 - 16.1 555.8 16.6 314.7
MFIs excluding the Eurosystem
2007 29,440.2 16,893.0 954.5 10,144.3 5,794.2 3,890.6 1,197.1 953.2 1,740.3 93.5 1,293.8 4,878.9 205.7 2,184.72008 31,835.8 18,052.0 967.7 10,771.7 6,312.6 4,630.9 1,244.7 1,406.7 1,979.5 98.7 1,199.5 4,754.3 211.4 2,888.92009 Q1 31,750.6 17,913.7 970.6 10,815.0 6,128.1 4,920.1 1,387.3 1,446.9 2,085.8 104.1 1,185.5 4,545.7 215.0 2,866.5 Q2 31,815.0 18,050.7 998.2 10,836.2 6,216.3 5,085.8 1,466.2 1,496.1 2,123.5 95.6 1,198.9 4,431.3 215.0 2,737.82009 July 31,720.2 17,945.9 998.9 10,799.5 6,147.6 5,110.5 1,475.8 1,493.9 2,140.8 95.3 1,204.8 4,390.3 215.8 2,757.5 Aug. 31,498.3 17,783.0 1,003.8 10,734.8 6,044.4 5,104.0 1,475.6 1,492.8 2,135.6 94.8 1,213.0 4,343.4 215.9 2,744.3 Sep. 31,274.2 17,665.6 994.3 10,770.5 5,900.9 5,115.4 1,504.9 1,491.9 2,118.6 90.6 1,222.0 4,266.6 216.3 2,697.6 Oct. 31,207.7 17,649.0 1,014.3 10,724.2 5,910.5 5,102.3 1,517.5 1,490.0 2,094.9 88.7 1,225.2 4,263.5 217.1 2,661.9 Nov. (p) 31,330.9 17,664.0 1,007.6 10,752.8 5,903.6 5,106.3 1,519.4 1,489.1 2,097.8 88.2 1,239.1 4,243.8 218.1 2,771.6
2. Liabilities
Eurosystem
Total Currency Deposits of euro area residents Money Debt Capital External Remaining
in market securities and liabilities liabilitiescirculation Total Central Other general MFIs fund issued 4) reserves
government government/ shares/other euro units 3)
area residents
1 2 3 4 5 6 7 8 9 10 11
2007 2,046.2 697.0 714.7 23.9 19.1 671.8 - 0.1 238.0 113.9 282.52008 2,982.9 784.7 1,217.5 68.8 16.6 1,132.1 - 0.1 273.8 377.8 329.02009 Q1 2,783.6 768.9 1,114.9 135.6 23.3 956.0 - 0.1 296.4 296.0 307.4 Q2 2,893.4 785.9 1,257.5 125.1 23.6 1,108.7 - 0.1 283.3 202.6 364.02009 July 2,734.4 795.1 1,106.7 128.2 20.2 958.2 - 0.1 286.7 187.1 358.8 Aug. 2,723.6 790.0 1,097.0 124.0 21.7 951.3 - 0.1 288.6 177.2 370.8 Sep. 2,746.8 789.7 1,149.0 138.4 23.0 987.6 - 0.1 292.7 154.1 361.1 Oct. 2,693.0 794.1 1,095.2 152.8 26.0 916.4 - 0.1 297.3 144.9 361.4 Nov. (p) 2,659.4 798.7 1,037.0 129.3 27.7 880.0 - 0.1 321.4 143.9 358.4
MFIs excluding the Eurosystem
2007 29,440.2 - 15,081.8 126.9 8,867.4 6,087.5 754.1 4,630.9 1,683.6 4,538.6 2,751.12008 31,835.8 - 16,741.8 190.8 9,689.8 6,861.2 825.1 4,848.3 1,767.2 4,402.7 3,250.62009 Q1 31,750.6 - 16,597.4 216.2 9,772.1 6,609.1 885.2 4,936.1 1,778.2 4,349.8 3,203.7 Q2 31,815.0 - 16,771.6 227.1 9,917.5 6,626.9 837.5 4,984.9 1,839.8 4,236.9 3,144.22009 July 31,720.2 - 16,605.9 170.0 9,888.0 6,547.8 853.6 5,008.7 1,854.3 4,198.7 3,199.0 Aug. 31,498.3 - 16,444.2 148.9 9,873.2 6,422.2 854.4 5,004.0 1,875.4 4,133.9 3,186.4 Sep. 31,274.2 - 16,348.5 156.7 9,903.8 6,287.9 831.4 4,961.6 1,879.4 4,084.9 3,168.5 Oct. 31,207.7 - 16,323.4 164.8 9,877.7 6,280.8 823.8 4,928.3 1,883.6 4,093.6 3,155.0 Nov. (p) 31,330.9 - 16,356.0 174.8 9,900.5 6,280.7 809.7 4,930.9 1,896.4 4,073.3 3,264.6
Source: ECB.1) Data refer to the changing composition of the euro area. For further information, see the General Notes.2) Amounts issued by euro area residents. Amounts issued by non-euro area residents are included in external assets.3) Amounts held by euro area residents.4) Amounts issued with a maturity of up to two years and held by non-euro area residents are included in external liabilities.

S 11ECB
Monthly Bulletin
January 2010
EURO AREASTATISTICS
Money, banking
and investment
funds
2.2 Consolidated balance sheet of euro area MFIs 1) (EUR billions; outstanding amounts at end of period; transactions during period)
1. Assets
Outstanding amounts
Total Loans to euro area residents Holdings of securities other than shares Holdings External Fixed Remaining
issued by euro area residents of shares/ assets assets assetsother equity
Total General Other Total General Other issued bygovernment euro area government euro area other euro area
residents residents residents
1 2 3 4 5 6 7 8 9 10 11
2007 22,316.2 11,117.3 972.3 10,144.9 2,377.3 1,422.2 955.1 882.2 5,274.2 220.9 2,444.32008 24,108.0 11,758.6 986.3 10,772.3 2,961.8 1,552.7 1,409.1 786.1 5,231.0 227.1 3,143.32009 Q1 24,152.9 11,804.9 989.3 10,815.6 3,159.5 1,710.1 1,449.4 770.0 5,035.9 230.7 3,151.9 Q2 24,080.1 11,852.7 1,015.9 10,836.8 3,292.1 1,793.2 1,498.9 780.7 4,911.9 231.3 3,011.32009 July 24,035.6 11,816.7 1,016.6 10,800.1 3,300.6 1,803.7 1,496.9 777.7 4,873.9 232.3 3,034.5 Aug. 23,945.6 11,756.8 1,021.4 10,735.4 3,303.8 1,807.7 1,496.0 774.2 4,861.8 232.4 3,016.6 Sep. 23,897.6 11,783.0 1,011.9 10,771.1 3,336.1 1,840.9 1,495.2 790.7 4,784.1 232.9 2,970.8 Oct. 23,849.2 11,756.7 1,031.8 10,724.9 3,344.9 1,851.2 1,493.6 792.7 4,793.0 233.6 2,928.3 Nov. (p) 24,009.5 11,778.6 1,025.2 10,753.4 3,346.4 1,853.7 1,492.7 812.7 4,799.6 234.7 3,037.6
Transactions
2007 2,572.2 1,014.5 -9.9 1,024.4 232.2 -46.3 278.5 55.5 806.6 -0.5 464.42008 1,598.3 597.9 12.4 585.5 372.5 58.1 314.5 -56.1 -81.6 -2.2 768.92009 Q1 -139.8 7.4 2.0 5.4 178.9 141.9 37.0 -4.3 -274.1 2.1 -49.8 Q2 -224.3 68.5 27.0 41.5 144.2 89.3 54.8 6.0 -63.1 0.6 -381.5 Q3 -156.0 -49.2 -3.9 -45.3 32.6 39.5 -6.9 -6.2 -91.9 1.8 -42.92009 July -49.5 -29.5 0.7 -30.2 3.2 6.2 -3.0 -7.0 -39.2 1.2 21.9 Aug. -102.0 -56.9 4.8 -61.7 1.9 3.5 -1.6 -7.1 -22.9 0.1 -17.2 Sep. -4.5 37.2 -9.4 46.6 27.5 29.8 -2.4 7.9 -29.7 0.5 -47.6 Oct. -37.4 -18.6 20.0 -38.6 7.7 11.4 -3.7 3.6 13.5 0.8 -44.3 Nov. (p) 153.1 25.8 -4.9 30.7 0.8 1.1 -0.3 12.6 5.0 1.0 107.9
2. Liabilities
Outstanding amounts
Total Currency in Deposits of Deposits of Money market Debt Capital External Remaining Excess ofcirculation central other general fund shares/ securities and liabilities liabilities inter-MFI
government government/ units 2) issued 3) reserves liabilitiesother euro area over inter-MFI
residents assets
1 2 3 4 5 6 7 8 9 10
2007 22,316.2 638.6 150.8 8,886.5 660.4 2,849.1 1,492.7 4,652.5 3,033.6 -48.22008 24,108.0 722.9 259.6 9,706.5 726.1 2,828.6 1,613.3 4,780.5 3,579.6 -109.52009 Q1 24,152.9 719.9 351.8 9,795.4 780.8 2,801.4 1,645.2 4,645.9 3,511.1 -98.9 Q2 24,080.1 735.0 352.3 9,941.1 741.7 2,805.9 1,690.0 4,439.5 3,508.2 -133.92009 July 24,035.6 745.5 298.2 9,908.3 758.0 2,807.1 1,698.6 4,385.8 3,557.8 -123.9 Aug. 23,945.6 741.2 272.8 9,894.9 759.3 2,803.2 1,709.6 4,311.1 3,557.1 -104.0 Sep. 23,897.6 740.6 295.1 9,926.8 740.5 2,774.0 1,724.7 4,239.0 3,529.6 -73.0 Oct. 23,849.2 745.4 317.6 9,903.8 734.9 2,760.3 1,732.4 4,238.5 3,516.4 -100.4 Nov. (p) 24,009.5 750.1 304.0 9,928.2 721.2 2,755.0 1,775.4 4,217.1 3,623.0 -64.8
Transactions
2007 2,572.2 45.8 -13.4 838.7 54.5 269.3 150.2 847.6 450.0 -70.72008 1,598.3 83.3 106.1 603.8 29.8 -30.1 142.3 93.3 595.3 -25.62009 Q1 -139.8 -4.3 89.3 32.8 55.8 -37.4 17.6 -212.8 -93.5 12.8 Q2 -224.3 15.0 0.5 154.1 -20.0 18.1 53.5 -167.7 -240.0 -37.9 Q3 -156.0 5.7 -45.7 -1.1 -2.4 -15.4 15.0 -122.8 -50.2 60.92009 July -49.5 10.5 -54.1 -32.6 16.0 0.4 2.5 -50.7 42.7 15.8 Aug. -102.0 -4.3 -14.0 -10.9 1.1 2.2 5.9 -49.2 -50.1 17.3 Sep. -4.5 -0.5 22.3 42.5 -19.5 -18.0 6.6 -22.8 -42.9 27.7 Oct. -37.4 4.8 22.5 -8.1 -4.8 -11.0 4.9 9.2 -26.8 -28.1 Nov. (p) 153.1 4.7 -13.6 13.8 -15.5 0.5 21.4 2.7 104.4 34.7
Source: ECB.1) Data refer to the changing composition of the euro area. For further information, see the General Notes.2) Amounts held by euro area residents.3) Amounts issued with a maturity of up to two years and held by non-euro area residents are included in external liabilities.

ECB
Monthly Bulletin
January 2010S 12
2.3 Monetary statistics 1) (EUR billions and annual growth rates; seasonally adjusted; outstanding amounts and growth rates at end of period; transactions during period)
1. Monetary aggregates 2) and counterparts
Outstanding amounts
M3 M3 Longer-term Credit to Credit to other euro area residents Net
3-month financial general external M2 M3-M2 moving liabilities government Loans Memo item: Loans assets 3)
average adjustedM1 M2-M1 (centred) for sales and
securitisation 4)
1 2 3 4 5 6 7 8 9 10 11 12
2007 3,830.5 3,509.8 7,340.3 1,305.6 8,645.9 - 5,968.3 2,416.4 12,009.7 10,161.9 - 596.02008 3,974.2 4,035.5 8,009.7 1,376.8 9,386.5 - 6,294.2 2,562.3 12,989.5 10,788.1 - 423.42009 Q1 4,118.8 3,956.5 8,075.3 1,310.9 9,386.2 - 6,443.4 2,687.5 13,034.1 10,813.5 - 389.9 Q2 4,236.8 3,894.4 8,131.2 1,275.4 9,406.6 - 6,550.8 2,792.5 13,077.8 10,810.1 - 473.92009 July 4,332.6 3,846.5 8,179.1 1,249.7 9,428.8 - 6,577.8 2,815.3 13,048.8 10,767.3 - 488.1 Aug. 4,399.1 3,822.8 8,221.8 1,214.8 9,436.6 - 6,634.7 2,845.0 13,055.5 10,761.4 - 564.6 Sep. 4,402.7 3,784.3 8,187.1 1,228.5 9,415.6 - 6,650.3 2,870.3 13,080.6 10,762.8 - 551.1 Oct. 4,484.0 3,730.7 8,214.7 1,184.6 9,399.2 - 6,638.8 2,895.7 13,035.3 10,738.3 - 536.8 Nov. (p) 4,462.1 3,711.6 8,173.7 1,166.0 9,339.7 - 6,728.4 2,881.9 13,064.2 10,753.5 - 560.8
Transactions
2007 148.7 529.7 678.4 221.4 899.8 - 469.1 -59.6 1,361.7 1,028.2 1,119.6 -42.82008 125.3 484.8 610.1 46.5 656.7 - 169.2 70.4 839.3 584.2 746.1 -176.32009 Q1 109.0 -95.6 13.5 -62.1 -48.6 - 115.4 108.8 15.2 -12.6 8.9 -34.3 Q2 137.7 -71.5 66.1 -18.1 48.0 - 129.5 111.6 64.8 16.8 36.0 106.2 Q3 167.5 -100.9 66.6 -49.2 17.4 - 99.9 69.7 3.4 -27.0 -23.7 35.42009 July 95.7 -47.7 48.0 -26.8 21.2 - 20.9 18.6 -27.5 -36.3 -34.7 10.1 Aug. 67.3 -22.9 44.4 -35.3 9.1 - 58.7 29.2 5.2 -3.0 2.3 40.3 Sep. 4.5 -30.3 -25.8 12.9 -12.9 - 20.3 21.9 25.6 12.3 8.7 -15.0 Oct. 81.6 -52.6 29.0 -43.9 -14.9 - 2.9 26.6 -38.1 -16.8 -12.2 -19.3 Nov. (p) -21.2 -18.4 -39.6 -19.1 -58.7 - 60.4 -13.4 24.1 17.3 16.0 -1.7
Growth rates
2007 Dec. 4.0 17.9 10.2 20.2 11.6 11.9 8.6 -2.6 12.8 11.2 12.1 -42.82008 Dec. 3.3 13.7 8.3 3.5 7.5 7.1 2.8 2.9 7.0 5.7 7.2 -176.3
2009 Mar. 6.0 6.5 6.2 -1.1 5.1 5.3 4.2 7.6 4.6 3.1 4.7 -128.2 June 9.4 0.4 4.9 -4.0 3.6 3.5 5.2 10.7 2.9 1.4 2.7 126.0
2009 July 12.2 -2.7 4.7 -6.7 3.0 3.1 5.2 10.9 1.9 0.6 1.8 143.8 Aug. 13.6 -4.1 4.6 -9.3 2.6 2.5 5.5 11.5 1.1 0.1 1.3 172.7 Sep. 12.8 -5.3 3.6 -8.8 1.8 1.6 5.6 13.6 1.0 -0.3 0.9 138.1 Oct. 11.8 -7.2 2.3 -11.8 0.3 0.6 6.5 15.2 0.5 -0.8 0.3 62.3 Nov. (p) 12.6 -8.6 1.9 -12.9 -0.2 . 6.9 13.3 0.4 -0.7 0.1 58.3
C1 Monetary aggregates 1) (annual growth rates; seasonally adjusted)
C2 Counterparts 1) (annual growth rates; seasonally adjusted)
-5
0
5
10
15
20
1999 2000 2001 2002 2003 2004 2005 2006 2007 2008 2009-5
0
5
10
15
20
M1M3
-10
-5
0
5
10
15
20
1999 2000 2001 2002 2003 2004 2005 2006 2007 2008 2009-10
-5
0
5
10
15
20
longer-term financial liabilitiescredit to general governmentloans to other euro area residents
Source: ECB.1) Data refer to the changing composition of the euro area. For further information, see the General Notes.
Monthly and other shorter-term growth rates for selected items are available at: http://www.ecb.europa.eu/stats/money/aggregates/aggr/html/index.en.html2) Monetary liabilities of MFIs and central government (post office, treasury, etc.) vis-à-vis non-MFI euro area residents excluding central government.
For definitions of M1, M2 and M3 see glossary.3) Values in the section ‘‘growth rates’’ are sums of the transactions during the 12 months ending in the period indicated.4) Adjustment for the derecognition of loans on the MFI balance sheet on account of their sale or securitisation.

S 13ECB
Monthly Bulletin
January 2010
EURO AREASTATISTICS
Money, banking
and investment
funds
2.3 Monetary statistics 1) (EUR billions and annual growth rates; seasonally adjusted; outstanding amounts and growth rates at end of period; transactions during period)
2. Components of monetary aggregates and longer-term financial liabilities
Outstanding amounts
Currency inOvernight Deposits Deposits Repos Money Debt Debt Deposits Deposits Capitalcirculation deposits with an agreed redeemable market securities securities redeemable with an agreed and
maturity of up at notice of fundwith a maturity of with a maturiy of at notice of maturity of reservesto 2 years up to 3 months shares/units up to 2 years over 2 years over 3 months over 2 years
1 2 3 4 5 6 7 8 9 10 11
2007 625.6 3,204.9 1,969.3 1,540.5 307.6 685.9 312.2 2,549.6 119.3 1,812.8 1,486.62008 709.9 3,264.3 2,468.5 1,567.0 354.3 755.6 266.8 2,575.5 121.2 1,990.7 1,606.72009 Q1 727.5 3,391.4 2,314.8 1,641.8 340.6 776.0 194.4 2,607.8 124.2 2,071.8 1,639.5 Q2 734.2 3,502.6 2,199.6 1,694.8 351.3 742.2 182.0 2,607.9 129.4 2,118.4 1,695.12009 July 733.6 3,599.0 2,125.3 1,721.2 328.9 747.0 173.8 2,618.7 130.9 2,133.9 1,694.3 Aug. 742.8 3,656.3 2,080.9 1,741.9 308.2 747.1 159.4 2,636.8 132.2 2,151.3 1,714.3 Sep. 747.3 3,655.4 2,025.0 1,759.4 326.9 750.8 150.8 2,622.2 133.5 2,174.9 1,719.7 Oct. 745.2 3,738.8 1,946.2 1,784.5 300.6 744.7 139.3 2,613.4 134.9 2,161.1 1,729.5 Nov. (p) 753.6 3,708.5 1,918.2 1,793.5 310.3 726.6 129.1 2,626.4 134.0 2,188.1 1,779.9
Transactions
2007 46.7 102.1 582.2 -52.5 42.1 58.7 120.6 149.5 9.7 160.4 149.52008 83.3 42.0 464.8 20.0 48.0 33.3 -34.7 6.2 0.6 20.6 141.82009 Q1 16.2 92.9 -170.0 74.4 -13.8 21.5 -69.7 19.1 2.2 75.5 18.5 Q2 6.8 130.9 -125.3 53.8 10.9 -15.0 -14.0 15.3 4.5 45.3 64.4 Q3 13.1 154.4 -165.6 64.7 -24.3 7.4 -32.4 32.0 4.1 58.9 4.82009 July -0.6 96.3 -74.2 26.5 -22.4 4.5 -9.0 10.8 1.5 15.5 -6.9 Aug. 9.2 58.1 -43.6 20.7 -20.6 -0.2 -14.5 24.2 1.3 18.3 14.9 Sep. 4.6 -0.1 -47.8 17.5 18.7 3.0 -8.9 -3.0 1.3 25.2 -3.1 Oct. -2.2 83.8 -77.8 25.1 -26.3 -5.3 -12.3 -5.3 1.5 -0.3 7.0 Nov. (p) 8.5 -29.6 -27.4 9.0 9.7 -19.9 -8.9 17.6 -0.9 14.9 28.8
Growth rates
2007 Dec. 8.1 3.3 41.3 -3.4 15.8 9.2 62.1 6.3 9.5 9.7 11.42008 Dec. 13.3 1.3 23.4 1.3 15.5 4.8 -11.6 0.3 0.5 1.1 9.7
2009 Mar. 13.8 4.4 6.6 6.6 8.2 4.1 -26.9 0.7 3.7 4.9 9.1 June 12.8 8.7 -6.1 10.3 5.3 2.8 -33.7 0.2 9.3 6.4 12.1
2009 July 12.5 12.1 -12.1 12.2 -3.5 3.8 -38.3 -0.1 10.9 7.2 11.2 Aug. 13.2 13.7 -15.2 13.6 -7.9 1.9 -41.9 0.5 12.8 7.8 10.7 Sep. 12.5 12.8 -17.8 14.9 -2.9 3.1 -47.2 0.7 15.0 9.4 8.4 Oct. 6.5 12.9 -21.6 16.2 -11.8 2.7 -50.3 3.4 14.3 9.6 7.3 Nov. (p) 6.8 13.8 -23.8 16.3 -6.3 -1.0 -53.0 4.1 11.4 10.2 6.9
C3 Components of monetary aggregates 1) (annual growth rates; seasonally adjusted)
C4 Components of longer-term financial liabilities 1) (annual growth rates; seasonally adjusted)
-40
-20
0
20
40
60
1999 2000 2001 2002 2003 2004 2005 2006 2007 2008 2009-40
-20
0
20
40
60
currency in circulationovernight depositsdeposits redeemable at notice of up to 3 months
-5
0
5
10
15
20
1999 2000 2001 2002 2003 2004 2005 2006 2007 2008 2009-5
0
5
10
15
20
debt securities with a maturiy of over 2 yearsdeposits with an agreed maturity of over 2 yearscapital and reserves
Source: ECB.1) Data refer to the changing composition of the euro area. For further information, see the General Notes.

S 14ECB
Monthly Bulletin
January 2010
2.4 MFI loans: breakdown 1), 2) (EUR billions and annual growth rates; seasonally adjusted; outstanding amounts and growth rates at end of period; transactions during period)
1. Loans to financial intermediaries, non-financial corporations and households
Outstanding amounts
Insurance Other
corporations financial Non-financial corporations Households 4) and pension funds intermediaries 3)
Total Total Total Up to Over 1 Over Total Consumer Loans Other1 year and up to 5 years credit for house loans
5 years purchase1 2 3 4 5 6 7 8 9 10
2007 107.5 881.5 4,384.0 1,281.1 860.2 2,242.7 4,788.9 616.5 3,425.2 747.12008 103.6 978.8 4,823.1 1,381.2 961.6 2,480.3 4,882.6 630.8 3,487.6 764.32009 Q1 102.5 975.5 4,847.0 1,338.5 981.4 2,527.1 4,888.5 640.7 3,486.3 761.5 Q2 103.3 1,026.8 4,788.7 1,282.7 974.7 2,531.4 4,891.3 635.6 3,487.5 768.22009 July 97.5 1,012.8 4,764.7 1,250.8 968.3 2,545.5 4,892.4 632.3 3,493.6 766.5 Aug. 94.6 1,000.4 4,766.2 1,251.8 962.7 2,551.6 4,900.2 630.7 3,500.9 768.6 Sep. 97.7 1,003.7 4,751.5 1,242.4 955.4 2,553.7 4,909.9 630.5 3,510.0 769.4 Oct. 91.9 997.1 4,730.4 1,224.5 948.3 2,557.6 4,918.9 628.3 3,520.3 770.4 Nov. (p) 88.2 1,008.4 4,721.5 1,211.8 940.6 2,569.0 4,935.5 629.5 3,529.2 776.8
Transactions
2007 16.7 177.2 554.8 145.2 155.9 253.8 279.5 31.5 228.0 20.02008 -4.4 88.6 419.3 87.1 120.1 212.2 80.7 10.5 53.0 17.22009 Q1 -4.4 -10.4 10.3 -41.7 13.8 38.2 -8.0 2.2 -8.6 -1.6 Q2 2.2 51.7 -41.0 -50.6 -1.4 11.0 4.0 -4.7 2.4 6.2 Q3 -5.6 -20.7 -27.6 -38.1 -15.9 26.5 26.9 1.9 21.2 3.72009 July -5.8 -14.7 -21.0 -31.1 -5.1 15.1 5.2 -0.3 6.5 -0.9 Aug. -2.9 -11.5 2.9 2.1 -6.1 6.9 8.5 0.6 5.9 2.0 Sep. 3.1 5.5 -9.4 -9.1 -4.8 4.5 13.1 1.6 8.9 2.6 Oct. -5.7 -5.2 -16.0 -18.3 -5.4 7.7 10.1 -1.4 10.0 1.5 Nov. (p) -3.7 12.4 -8.2 -11.9 -6.7 10.4 16.9 0.5 8.9 7.4
Growth rates
2007 Dec. 18.2 24.9 14.5 12.7 22.0 12.8 6.2 5.4 7.1 2.72008 Dec. -4.1 10.1 9.5 6.8 13.9 9.4 1.7 1.7 1.5 2.32009 Mar. -6.0 3.8 6.1 -0.5 11.0 8.1 0.4 0.8 0.1 1.3 June -0.2 1.8 2.7 -5.8 7.1 5.9 0.2 -0.8 0.1 1.42009 July -4.2 -0.1 1.5 -8.7 5.9 5.6 0.0 -1.0 -0.1 1.3 Aug. -8.5 -0.7 0.7 -9.3 3.7 5.2 -0.2 -1.0 -0.4 1.3 Sep. -6.5 -0.2 -0.2 -10.2 2.2 4.5 -0.3 -1.1 -0.6 1.4 Oct. -11.9 -1.4 -1.2 -11.7 0.9 3.8 -0.1 -1.3 -0.2 1.6 Nov. (p) -13.4 0.3 -1.9 -12.1 -1.2 3.6 0.5 -1.0 0.3 2.5
C5 Loans to other financial intermediaries and non-financialcorporations 2) (annual growth rates; not seasonally adjusted)
C6 Loans to households 2) (annual growth rates; not seasonally adjusted)
-5
0
5
10
15
20
25
30
35
1999 2000 2001 2002 2003 2004 2005 2006 2007 2008 2009-5
0
5
10
15
20
25
30
35
other financial intermediariesnon-financial corporations
-2
0
2
4
6
8
10
12
14
1999 2000 2001 2002 2003 2004 2005 2006 2007 2008 2009-2
0
2
4
6
8
10
12
14
consumer creditloans for house purchaseother loans
Source: ECB.1) MFI sector excluding the Eurosystem; sectoral classification is based on the ESA 95.2) Data refer to the changing composition of the euro area. For further information, see the General Notes.3) Including investment funds.4) Including non-profit institutions serving households.

S 15ECB
Monthly Bulletin
January 2010
EURO AREASTATISTICS
Money, banking
and investment
funds
2.4 MFI loans: breakdown 1), 2) (EUR billions and annual growth rates; not seasonally adjusted; outstanding amounts and growth rates at end of period; transactions during period)
2. Loans to financial intermediaries and non-financial corporations
Outstanding amounts
Insurance corporations and pension funds Other financial intermediaries 3) Non-financial corporations
Total Up to Over 1 Over Total Up to Over 1 Over Total Up to Over 1 Over1 year and up to 5 years 1 year and up to 5 years 1 year and up to 5 years
5 years 5 years 5 years1 2 3 4 5 6 7 8 9 10 11 12
2008 92.4 68.6 5.7 18.0 961.2 554.1 169.0 238.0 4,829.4 1,379.1 961.3 2,489.02009 Q1 102.0 75.6 6.2 20.2 991.4 572.3 181.2 237.9 4,842.7 1,335.7 981.9 2,525.1 Q2 107.4 82.8 7.3 17.2 1,026.2 600.3 184.4 241.5 4,803.3 1,296.6 974.8 2,531.9
2009 Aug. 94.5 69.6 7.7 17.2 985.7 554.5 184.0 247.2 4,752.9 1,240.0 962.2 2,550.8 Sep. 97.6 73.1 7.7 16.8 1,015.3 579.9 188.8 246.6 4,740.6 1,236.0 954.7 2,549.9 Oct. 93.7 68.4 7.9 17.5 987.9 564.5 176.0 247.5 4,720.2 1,218.0 948.9 2,553.2 Nov. (p) 89.3 64.5 7.6 17.1 1,005.5 586.7 173.0 245.9 4,718.1 1,213.1 940.8 2,564.2
Transactions
2008 -4.0 -3.1 -1.8 0.9 89.5 26.9 20.3 42.4 420.0 86.8 120.1 213.02009 Q1 6.2 5.6 0.6 0.1 23.2 13.5 12.2 -2.5 -0.4 -42.4 14.5 27.6 Q2 6.8 7.3 1.1 -1.6 35.2 30.0 1.9 3.3 -22.1 -33.9 -1.7 13.5 Q3 -9.7 -9.7 0.3 -0.4 -8.5 -18.2 4.0 5.7 -53.0 -58.4 -16.7 22.1
2009 Aug. -5.9 -6.6 0.5 0.2 -24.0 -22.3 -3.4 1.7 -31.5 -23.9 -9.9 2.2 Sep. 3.2 3.6 0.0 -0.4 31.8 26.7 5.3 -0.2 -7.1 -3.7 -4.9 1.5 Oct. -3.8 -4.7 0.2 0.7 -25.9 -20.1 -6.7 0.9 -15.2 -18.4 -4.1 7.2 Nov. (p) -4.5 -3.8 -0.2 -0.4 18.7 22.9 -2.9 -1.4 -1.4 -4.3 -7.1 10.0
Growth rates
2008 Dec. -4.1 -4.3 -23.7 5.0 10.4 5.3 13.7 22.0 9.5 6.8 13.9 9.42009 Mar. -5.6 -7.7 -18.0 10.3 3.7 -4.7 19.4 17.2 6.2 -0.5 11.0 8.1 June 0.2 0.7 -3.7 0.6 1.7 -4.4 13.2 11.0 2.7 -5.8 7.2 5.92009 Aug. -8.5 -11.6 17.1 -3.2 -0.7 -6.8 10.2 7.4 0.7 -9.3 3.7 5.2 Sep. -6.2 -8.2 21.5 -6.4 -0.3 -5.7 10.6 6.5 -0.2 -10.2 2.2 4.5 Oct. -12.0 -17.3 38.1 -2.3 -1.5 -8.2 8.4 9.6 -1.2 -11.7 0.9 3.8 Nov. (p) -13.6 -18.2 37.5 -8.5 0.3 -3.6 3.8 8.2 -1.9 -12.1 -1.2 3.5
3. Loans to households 4)
Outstanding amounts
Total Consumer credit Loans for house purchase Other loans
Total Up to Over 1 Over Total Up to Over 1 Over Total Up to Over 1 Over1 year and up to 5 years 1 year and up to 5 years 1 year and up to 5 years
5 years 5 years 5 years1 2 3 4 5 6 7 8 9 10 11 12 13
2008 4,888.7 633.1 138.8 196.2 298.0 3,490.3 17.2 67.5 3,405.7 765.3 155.0 90.5 519.72009 Q1 4,878.9 637.7 136.2 199.8 301.6 3,480.9 16.3 65.6 3,399.0 760.3 150.7 88.7 520.9 Q2 4,899.2 639.1 136.6 198.6 303.9 3,487.4 15.8 64.1 3,407.5 772.8 154.4 88.3 530.1
2009 Aug. 4,901.7 631.2 133.6 196.6 301.0 3,503.0 15.7 64.1 3,423.2 767.4 146.3 88.1 533.1 Sep. 4,917.0 632.0 134.5 195.9 301.7 3,515.3 15.7 64.3 3,435.3 769.7 149.1 88.0 532.6 Oct. 4,922.3 630.3 133.1 195.3 301.8 3,522.9 15.6 64.2 3,443.1 769.2 146.6 87.7 534.8 Nov. (p) 4,939.9 628.9 132.8 194.7 301.4 3,531.6 15.5 64.3 3,451.8 779.4 151.7 87.5 540.2
Transactions
2008 80.0 10.4 1.0 -9.1 18.6 52.4 1.1 -3.8 55.1 17.2 2.5 -5.3 20.12009 Q1 -23.7 -3.0 -2.6 -2.2 1.7 -16.8 -0.9 -3.3 -12.5 -3.9 -4.2 -1.5 1.9 Q2 21.6 1.8 0.7 -0.9 2.0 7.7 -0.8 -1.5 10.0 12.1 4.0 -0.1 8.1 Q3 26.1 0.0 -1.4 -0.1 1.4 26.8 0.0 0.2 26.5 -0.7 -5.0 -0.1 4.5
2009 Aug. -0.3 -2.6 -0.9 -1.6 -0.1 2.2 -0.1 0.0 2.3 0.1 -0.9 -0.5 1.5 Sep. 18.7 2.6 1.2 0.8 0.6 12.1 0.0 0.1 11.9 4.0 3.0 0.0 1.0 Oct. 6.4 -0.9 -1.2 -0.3 0.5 7.3 -0.1 -0.3 7.7 0.0 -2.4 -0.1 2.5 Nov. (p) 17.9 -2.1 -0.1 -0.5 -1.5 8.7 -0.1 0.1 8.7 11.2 5.0 -0.2 6.4
Growth rates
2008 Dec. 1.7 1.7 0.7 -4.4 6.7 1.5 7.0 -5.2 1.6 2.3 1.7 -5.1 4.02009 Mar. 0.4 0.8 0.0 -4.5 5.0 0.1 1.0 -9.0 0.3 1.3 -0.2 -7.2 3.5 June 0.2 -0.8 -1.8 -5.5 3.0 0.1 -2.4 -11.2 0.3 1.5 -1.7 -5.7 3.82009 Aug. -0.2 -1.0 -1.9 -5.4 2.5 -0.4 -3.2 -11.0 -0.1 1.3 -2.9 -4.4 3.7 Sep. -0.3 -1.1 -2.5 -4.4 1.7 -0.5 -8.5 -9.7 -0.3 1.5 -2.8 -3.8 3.7 Oct. -0.1 -1.3 -3.2 -4.0 1.4 -0.2 -9.6 -9.3 0.0 1.6 -2.8 -3.5 3.8 Nov. (p) 0.5 -1.0 -1.3 -3.8 1.1 0.3 -9.7 -8.1 0.5 2.5 -2.0 -2.6 4.8
Source: ECB.1) MFI sector excluding the Eurosystem; sectoral classification is based on the ESA 95.2) Data refer to the changing composition of the euro area. For further information, see the General Notes.3) Including investment funds.4) Including non-profit institutions serving households.

S 16ECB
Monthly Bulletin
January 2010
2.4 MFI loans: breakdown 1), 2) (EUR billions and annual growth rates; not seasonally adjusted; outstanding amounts and growth rates at end of period; transactions during period)
4. Loans to government and non-euro area residents
Outstanding amounts
General government Non-euro area residents
Total Central Other general government Total Banks 3) Non-banks
governmentState Local Social Total General Other
government government security governmentfunds
1 2 3 4 5 6 7 8 9 10
2006 809.0 104.0 232.5 446.6 25.8 2,931.8 2,070.6 861.2 63.1 798.12007 954.5 213.4 217.6 494.1 29.4 3,300.2 2,344.5 955.7 59.8 895.92008 Q4 967.7 227.0 210.1 508.4 22.2 3,247.8 2,282.0 965.8 57.8 908.12009 Q1 970.6 232.8 205.6 511.2 21.0 3,057.1 2,101.0 956.1 59.2 896.9 Q2 998.2 249.2 206.5 513.9 28.6 2,949.3 1,999.7 949.6 57.2 892.3 Q3 (p) 994.3 235.5 209.7 518.2 30.7 2,807.7 1,893.6 914.2 48.6 865.6
Transactions
2007 -8.0 -4.5 -13.0 6.0 3.6 540.7 381.4 159.3 0.3 159.02008 13.2 12.3 -8.1 16.2 -7.2 -59.3 -85.8 26.4 0.3 26.12008 Q4 -9.5 1.1 -0.2 12.8 -23.2 -257.6 -182.6 -75.0 -0.7 -74.32009 Q1 2.0 5.4 -4.4 2.2 -1.2 -234.0 -208.5 -25.7 0.3 -26.0 Q2 28.1 16.9 0.9 2.7 7.6 -72.1 -79.0 7.2 -1.0 8.2 Q3 (p) -3.7 -13.6 3.2 4.3 2.1 -74.8 -69.8 -4.9 1.5 -6.4
Growth rates
2006 Dec. -1.6 -14.0 -5.8 5.2 -11.6 21.9 23.9 17.2 -0.1 18.82007 Dec. -1.0 -4.3 -5.6 1.3 13.8 18.6 18.5 18.8 0.5 20.2
2008 Dec. 1.4 5.8 -3.7 3.3 -24.5 -1.8 -3.6 2.8 0.5 3.02009 Mar. 1.5 10.0 -3.6 3.5 -43.5 -14.3 -16.7 -8.7 -3.6 -9.0 June 2.6 12.8 -4.1 3.9 -31.9 -13.8 -16.5 -7.5 -7.6 -7.5 Sep. (p) 1.7 4.3 -0.2 4.4 -32.3 -18.2 -21.9 -9.3 0.2 -9.9
C7 Loans to government 2) (annual growth rates; not seasonally adjusted)
C8 Loans to non-euro area residents 2) (annual growth rates; not seasonally adjusted)
-20
-15
-10
-5
0
5
10
15
1999 2000 2001 2002 2003 2004 2005 2006 2007 2008 2009-20
-15
-10
-5
0
5
10
15
central governmentother general government
-30
-20
-10
0
10
20
30
40
1999 2000 2001 2002 2003 2004 2005 2006 2007 2008 2009-30
-20
-10
0
10
20
30
40
non-resident banksnon-resident non-banks
Source: ECB.1) MFI sector excluding the Eurosystem; sectoral classification is based on the ESA 95.2) Data refer to the changing composition of the euro area. For further information, see the General Notes.3) The term ‘‘banks’’ is used in this table to indicate institutions similar to MFIs which are resident outside the euro area.

S 17ECB
Monthly Bulletin
January 2010
EURO AREASTATISTICS
Money, banking
and investment
funds
2.5 Deposits held with MFIs: breakdown 1), 2) (EUR billions and annual growth rates; outstanding amounts and growth rates at end of period; transactions during period)
1. Deposits by financial intermediaries
Outstanding amounts
Insurance corporations and pension funds Other financial intermediaries 3)
Total Overnight With an agreed maturity of: Redeemable at notice of: Repos Total Overnight With an agreed maturity of: Redeemable at notice of: Repos
Up to Over 2 Up to Over Up to Over Up to Over2 years years 3 months 3 months 2 years 2 years 3 months 3 months
1 2 3 4 5 6 7 8 9 10 11 12 13 14
2007 689.5 70.8 69.6 526.4 0.8 1.1 20.8 1,465.0 311.8 345.5 648.1 12.2 0.3 147.12008 760.9 83.7 114.1 537.5 1.1 1.5 23.1 1,802.3 320.2 419.8 852.9 12.3 0.1 197.0
2009 Q1 760.8 91.5 98.3 545.7 2.3 1.5 21.4 1,839.9 335.4 350.2 905.0 14.4 0.0 234.7 Q2 749.4 85.1 91.4 550.6 1.7 1.5 19.0 1,896.8 337.2 342.6 947.8 14.1 0.0 255.0
2009 July 748.0 85.8 91.3 550.7 1.8 1.5 16.9 1,858.8 316.8 345.6 950.3 14.6 0.0 231.4 Aug. 748.0 86.8 87.9 551.2 1.8 1.5 18.7 1,840.8 305.3 349.8 945.5 14.5 0.1 225.5 Sep. 742.8 83.1 86.7 550.5 1.9 1.4 19.2 1,865.0 314.5 333.9 948.7 14.4 0.2 253.3 Oct. 745.2 85.6 90.0 548.0 2.0 1.4 18.3 1,820.7 320.6 324.3 926.0 15.8 0.1 233.9 Nov. (p) 736.5 84.6 82.0 545.7 2.0 1.4 20.8 1,849.6 324.9 331.5 939.2 16.1 0.0 237.8
Transactions
2007 38.5 0.8 10.4 31.9 -0.3 -0.3 -4.1 338.9 33.9 98.7 180.4 1.7 0.1 24.12008 69.4 12.4 42.8 12.3 -0.3 0.1 2.2 172.4 4.5 71.0 46.6 -0.3 -0.3 51.0
2009 Q1 -5.0 5.4 -17.2 8.0 0.5 0.0 -1.7 33.8 11.6 -68.3 50.7 2.1 0.0 37.7 Q2 -11.3 -6.3 -6.9 4.9 -0.5 0.0 -2.4 61.0 19.5 -20.0 41.4 -0.2 0.0 20.4 Q3 -6.3 -1.9 -4.5 -0.1 0.1 -0.1 0.1 -22.3 -22.8 -1.5 3.2 0.4 0.1 -1.7
2009 July -1.3 0.7 -0.1 0.1 0.1 0.0 -2.1 -37.9 -20.3 3.1 2.5 0.5 0.0 -23.6 Aug. 0.1 1.0 -3.3 0.5 0.0 0.0 1.8 -16.5 -11.2 4.6 -4.1 -0.1 0.1 -5.9 Sep. -5.0 -3.6 -1.1 -0.7 0.0 -0.1 0.5 32.1 8.8 -9.2 4.7 0.0 0.0 27.8 Oct. 2.5 2.5 3.3 -2.6 0.1 0.0 -0.8 -30.4 6.4 -9.3 -9.4 1.4 0.0 -19.4 Nov. (p) -8.9 -0.9 -8.1 -2.4 0.0 0.0 2.4 17.5 4.5 7.6 1.2 0.3 -0.1 3.9
Growth rates
2007 Dec. 5.9 1.1 17.5 6.4 -25.3 - -16.4 29.9 12.0 39.7 38.5 16.4 - 19.12008 Dec. 10.0 17.3 60.0 2.3 -23.4 - 10.5 11.8 1.4 20.7 7.2 -2.5 - 34.62009 Mar. 4.3 8.8 13.6 2.4 -3.4 - -2.2 9.7 -1.3 -2.4 13.6 6.3 - 39.4 June 3.5 12.6 5.2 2.4 -13.3 - -4.0 8.0 3.7 -14.5 13.2 15.4 - 39.92009 July 3.4 19.7 2.5 2.2 -3.3 - -15.9 5.7 9.2 -21.9 13.5 1.7 - 30.3 Aug. 4.1 27.1 0.2 2.3 3.7 - -4.3 4.4 10.7 -24.2 13.5 11.5 - 23.0 Sep. 1.6 7.8 -5.4 2.3 7.6 - -5.9 4.9 1.7 -25.3 15.7 24.0 - 36.3 Oct. 1.0 1.1 -1.1 1.9 16.2 - -12.7 2.0 0.9 -26.6 13.7 32.9 - 20.4 Nov. (p) -0.8 -1.6 -14.7 1.6 31.1 - 5.6 3.9 7.5 -24.8 13.3 37.9 - 23.0
C9 Total deposits by sector 2) (annual growth rates)
C10 Total deposits and deposits included in M3by sector 2) (annual growth rates)
0
5
10
15
20
25
30
35
1999 2000 2001 2002 2003 2004 2005 2006 2007 2008 20090
5
10
15
20
25
30
35
insurance corporations and pension funds (total)other financial intermediaries (total)
-10
0
10
20
30
40
2004 2005 2006 2007 2008 2009-10
0
10
20
30
40
insurance corporations and pension funds (total)other financial intermediaries (total)insurance corporations and pension funds (included in M3)other financial intermediaries (included in M3)
Source: ECB.1) MFI sector excluding the Eurosystem; sectoral classification is based on the ESA 95.2) Data refer to the changing composition of the euro area. For further information, see the General Notes.3) Includes investment funds.4) Covers deposits in columns 2, 3, 5 and 7.5) Covers deposits in columns 9, 10, 12 and 14.
4)
5)

S 18ECB
Monthly Bulletin
January 2010
2.5 Deposits held with MFIs: breakdown 1), 2) (EUR billions and annual growth rates; outstanding amounts and growth rates at end of period; transactions during period)
2. Deposits by non-financial corporations and households
Outstanding amounts
Non-financial corporations Households 3)
TotalOvernight With an agreed maturity of: Redeemable at notice of: Repos TotalOvernight With an agreed maturity of: Redeemable at notice of: Repos
Up to Over 2 Up to Over Up to Over Up to Over2 years years 3 months 3 months 2 years 2 years 3 months 3 months
1 2 3 4 5 6 7 8 9 10 11 12 13 14
2007 1,477.2 884.0 479.4 59.5 29.3 1.4 23.7 4,989.0 1,777.4 993.3 561.5 1,458.6 111.1 87.12008 1,504.4 884.4 502.7 64.4 27.9 1.3 23.7 5,368.6 1,813.3 1,350.0 517.9 1,490.2 113.6 83.7
2009 Q1 1,477.2 873.3 476.1 70.7 38.0 1.3 17.9 5,446.6 1,899.2 1,281.2 524.4 1,565.5 114.9 61.4 Q2 1,516.9 916.1 459.4 71.9 48.4 1.5 19.6 5,505.7 2,010.8 1,185.5 536.2 1,604.1 118.2 50.9
2009 July 1,517.6 912.5 458.8 74.0 52.4 1.5 18.4 5,515.7 2,028.7 1,154.2 544.5 1,618.0 119.4 50.9 Aug. 1,528.7 928.1 451.9 76.1 54.7 1.5 16.5 5,507.5 2,032.0 1,121.9 552.7 1,632.7 120.1 48.1 Sep. 1,549.4 950.6 445.0 78.0 57.0 1.5 17.4 5,501.1 2,052.9 1,084.8 561.1 1,637.7 121.4 43.2 Oct. 1,558.6 962.2 442.6 78.6 58.5 1.5 15.1 5,513.7 2,085.0 1,040.7 573.6 1,650.8 123.8 39.9 Nov. (p) 1,562.3 970.1 435.2 80.2 59.6 1.6 15.7 5,511.7 2,098.9 1,010.8 584.3 1,654.4 124.7 38.5
Transactions
2007 140.2 34.1 126.8 -8.1 -10.8 -0.7 -1.1 282.9 22.4 320.9 -45.4 -43.2 11.2 17.12008 7.8 -5.0 13.3 3.2 -3.4 -0.3 0.0 347.5 28.7 335.5 -43.1 28.1 1.7 -3.4
2009 Q1 -37.3 -16.5 -30.7 5.0 10.7 0.0 -5.8 41.5 64.7 -80.4 4.0 75.1 0.5 -22.2 Q2 43.4 45.5 -15.6 1.3 10.4 0.1 1.7 59.8 110.9 -94.4 11.8 39.3 2.7 -10.6 Q3 35.0 35.8 -13.4 6.2 8.6 0.0 -2.2 -3.6 42.4 -100.0 24.9 33.7 3.1 -7.7
2009 July 0.8 -3.6 -0.6 2.2 4.0 0.0 -1.2 10.1 17.8 -31.2 8.3 14.0 1.1 0.0 Aug. 11.8 15.9 -6.6 2.1 2.3 0.0 -1.9 -8.0 3.4 -32.2 8.2 14.7 0.8 -2.8 Sep. 22.3 23.4 -6.2 1.9 2.3 0.0 0.9 -5.6 21.2 -36.5 8.4 5.0 1.3 -5.0 Oct. 9.9 12.1 -2.1 0.6 1.4 0.0 -2.2 13.5 32.1 -43.7 12.8 13.1 2.5 -3.3 Nov. (p) 4.3 8.2 -7.2 1.6 1.1 0.0 0.6 -1.9 14.1 -29.9 10.8 3.7 0.9 -1.4
Growth rates
2007 Dec. 10.4 4.0 35.1 -11.8 -26.3 -31.6 -4.4 6.1 1.3 47.7 -7.5 -3.3 11.2 24.42008 Dec. 0.5 -0.6 2.8 5.3 -11.0 -16.2 0.0 6.9 1.6 33.2 -7.7 1.9 1.5 -3.92009 Mar. -0.6 1.2 -6.2 13.2 31.2 -9.5 -21.9 6.5 6.8 15.1 -4.6 6.6 4.7 -35.8 June 0.4 4.6 -11.4 12.1 76.5 1.0 -13.0 5.8 11.3 -0.6 0.0 9.6 10.5 -48.42009 July 1.5 7.1 -13.1 12.9 102.7 5.4 -20.0 5.5 13.3 -6.8 2.3 11.3 12.1 -52.5 Aug. 2.3 9.6 -15.1 16.2 114.4 5.1 -28.8 5.2 15.1 -11.5 4.0 12.3 14.0 -56.5 Sep. 2.5 8.3 -14.0 20.2 126.2 8.4 -30.8 5.0 15.9 -15.4 6.4 13.3 16.3 -60.1 Oct. 3.6 11.9 -15.4 18.5 137.1 13.0 -47.7 4.3 17.3 -22.1 10.6 14.3 15.4 -60.6 Nov. (p) 4.0 11.5 -15.3 21.4 131.9 19.4 -37.1 3.5 16.8 -25.5 13.5 14.3 12.2 -59.5
C11 Total deposits by sector 2) (annual growth rates)
C12 Total deposits and deposits included in M3by sector 2) (annual growth rates)
-2
0
2
4
6
8
10
12
14
1999 2000 2001 2002 2003 2004 2005 2006 2007 2008 2009-2
0
2
4
6
8
10
12
14
non-financial corporations (total)households (total)
-5
0
5
10
15
20
2004 2005 2006 2007 2008 2009-5
0
5
10
15
20
non-financial corporations (total)households (total)non-financial corporations (included in M3)households (included in M3)
Source: ECB.1) MFI sector excluding the Eurosystem; sectoral classification is based on the ESA 95.2) Data refer to the changing composition of the euro area. For further information, see the General Notes.3) Including non-profit institutions serving households.4) Covers deposits in columns 2, 3, 5 and 7.5) Covers deposits in columns 9, 10, 12 and 14.
4)
5)

S 19ECB
Monthly Bulletin
January 2010
EURO AREASTATISTICS
Money, banking
and investment
funds
2.5 Deposits held with MFIs: breakdown 1), 2) (EUR billions and annual growth rates; outstanding amounts and growth rates at end of period; transactions during period)
3. Deposits by government and non-euro area residents
Outstanding amounts
General government Non-euro area residents
Total Central Other general government Total Banks 3) Non-banks
governmentState Local Social Total General Other
government government security governmentfunds
1 2 3 4 5 6 7 8 9 10
2006 329.6 124.1 45.4 91.4 68.8 3,430.0 2,561.5 868.6 128.5 740.12007 373.7 126.9 59.0 107.6 80.3 3,862.1 2,953.9 908.2 143.3 764.92008 Q4 444.4 190.8 52.3 115.5 85.8 3,713.9 2,816.9 897.0 65.8 831.22009 Q1 463.8 216.2 50.6 114.0 83.0 3,665.7 2,786.7 879.0 63.6 815.4 Q2 476.0 227.1 48.9 118.5 81.4 3,565.2 2,685.4 879.9 64.3 815.6 Q3 (p) 402.3 156.7 51.2 122.6 71.7 3,422.7 2,569.7 853.2 62.5 790.8
Transactions
2007 31.9 -3.1 13.6 9.8 11.6 609.4 542.6 66.8 20.2 46.62008 72.8 63.5 -6.5 8.7 7.1 -185.1 -167.0 -18.0 -36.9 18.92008 Q4 46.2 50.8 -9.2 3.0 1.5 -427.8 -332.1 -95.8 -35.3 -60.42009 Q1 15.6 22.5 -1.7 -2.3 -2.9 -108.9 -77.7 -31.3 -2.6 -28.7 Q2 11.7 10.9 -1.6 4.4 -2.0 -60.5 -67.6 7.1 0.9 6.1 Q3 (p) -62.2 -58.9 2.3 4.2 -9.8 -78.7 -66.5 -12.0 -1.2 -10.8
Growth rates
2006 Dec. 4.3 -16.6 18.4 9.3 52.1 15.7 17.3 11.2 5.3 12.42007 Dec. 9.7 -2.4 29.9 10.7 16.9 17.9 21.3 7.7 15.8 6.3
2008 Dec. 19.5 49.9 -11.0 8.1 8.8 -4.7 -5.6 -1.8 -25.6 2.62009 Mar. 22.8 52.6 2.2 5.7 6.5 -13.6 -14.5 -10.9 -24.1 -8.8 June 15.3 43.7 -13.0 5.3 -4.9 -14.7 -15.6 -11.9 -21.9 -10.4 Sep. (p) 2.9 18.6 -16.6 8.3 -15.6 -16.3 -17.2 -13.2 -28.2 -10.7
C13 Deposits by government and non-euro area residents 2) (annual growth rates)
-20
-15
-10
-5
0
5
10
15
20
25
30
1999 2000 2001 2002 2003 2004 2005 2006 2007 2008 2009-20
-15
-10
-5
0
5
10
15
20
25
30
general governmentnon-resident banksnon-resident non-banks
Source: ECB.1) MFI sector excluding the Eurosystem; sectoral classification is based on the ESA 95.2) Data refer to the changing composition of the euro area. For further information, see the General Notes.3) The term ‘‘banks’’ is used in this table to indicate institutions similar to MFIs which are resident outside the euro area.

S 20ECB
Monthly Bulletin
January 2010
2.6 MFI holdings of securities: breakdown 1), 2) (EUR billions and annual growth rates; outstanding amounts and growth rates at end of period; transactions during period)
Outstanding amounts
Securities other than shares Shares and other equity
Total MFIs General Other euro Non-euro area Total MFIs Non-MFIs Non-euro area
government area residents residents residents
Euro Non-euro Euro Non-euro Euro Non-euro
1 2 3 4 5 6 7 8 9 10 11 12
2007 5,125.3 1,656.4 84.0 1,180.5 16.6 919.9 33.3 1,234.7 1,636.5 424.5 869.3 342.72008 5,858.4 1,887.1 92.4 1,225.4 19.3 1,355.5 51.2 1,227.5 1,476.9 423.2 776.3 277.42009 Q1 6,135.8 1,982.3 103.5 1,366.7 20.6 1,396.3 50.6 1,215.7 1,456.8 424.6 760.9 271.3 Q2 6,289.9 2,016.8 106.7 1,445.8 20.4 1,448.4 47.7 1,204.1 1,475.0 428.3 770.6 276.12009 July 6,302.5 2,033.1 107.7 1,456.7 19.2 1,445.4 48.5 1,192.0 1,486.6 437.6 767.2 281.8 Aug. 6,305.1 2,030.2 105.4 1,457.7 17.9 1,445.5 47.3 1,201.1 1,496.0 449.5 763.5 283.1 Sep. 6,295.6 2,015.6 103.0 1,486.8 18.1 1,445.8 46.1 1,180.1 1,498.5 442.5 779.5 276.5 Oct. 6,271.4 1,992.0 102.8 1,500.2 17.3 1,447.6 42.4 1,169.1 1,502.2 443.6 781.6 277.1 Nov. (p) 6,255.8 1,994.8 103.0 1,503.6 15.7 1,447.4 41.6 1,149.6 1,515.1 437.6 801.4 276.0
Transactions
2007 543.7 136.0 18.1 -86.2 1.5 269.5 9.5 195.2 147.8 51.3 55.4 41.02008 597.1 212.4 5.9 36.5 1.9 295.0 19.0 26.4 -84.2 22.9 -56.6 -50.52009 Q1 252.0 95.1 8.4 133.8 0.4 39.7 -2.8 -22.6 -4.7 3.2 -4.4 -3.4 Q2 176.6 34.6 4.1 83.7 0.5 56.2 -1.6 -0.9 16.6 7.2 5.7 3.6 Q3 19.6 -4.2 -0.3 34.4 -1.8 -7.0 -0.4 -1.1 7.8 15.7 -6.3 -1.62009 July 14.1 18.5 1.0 7.9 -1.3 -3.8 0.5 -8.9 4.6 6.8 -7.0 4.8 Aug. 7.4 -4.6 -1.2 0.6 -1.1 -1.1 -0.7 15.6 3.6 10.1 -7.1 0.6 Sep. -1.8 -18.1 -0.1 25.9 0.6 -2.1 -0.2 -7.8 -0.5 -1.2 7.8 -7.0 Oct. -22.7 -22.2 0.1 13.7 -0.7 -0.6 -3.5 -9.6 6.7 2.1 3.5 1.1 Nov. (p) -9.5 -0.1 1.4 2.3 -1.6 -0.1 -0.3 -11.1 14.0 2.4 12.5 -0.9
Growth rates
2007 Dec. 11.7 8.7 25.4 -6.8 10.7 43.3 33.4 17.7 10.0 13.7 6.9 13.92008 Dec. 11.6 12.7 8.1 3.1 9.9 32.2 57.2 2.2 -5.3 5.4 -6.7 -15.3
2009 Mar. 11.7 14.4 10.4 12.5 16.1 30.2 2.8 -5.4 -4.5 0.5 -6.6 -6.4 June 10.6 11.9 1.4 18.0 19.8 24.9 -5.8 -7.7 -3.4 0.7 -5.5 -4.0
2009 July 9.7 11.8 -1.8 18.2 13.5 22.7 -5.5 -9.4 -4.0 2.0 -8.6 0.5 Aug. 8.7 10.7 -2.0 18.3 13.8 19.6 -7.1 -9.4 -3.6 5.6 -9.4 -0.2 Sep. 11.8 11.3 4.1 24.3 15.5 22.0 -5.1 -5.8 -4.2 4.2 -8.9 -2.6 Oct. 11.4 8.5 5.7 26.8 -0.2 17.5 -9.5 -2.5 -0.9 7.9 -5.0 -2.3 Nov. (p) 8.9 5.8 10.9 23.1 -3.8 13.4 -9.4 -3.4 0.4 9.0 -2.8 -3.4
C14 MFI holdings of securities 2) (annual growth rates)
-10
-5
0
5
10
15
20
25
30
1999 2000 2001 2002 2003 2004 2005 2006 2007 2008 2009-10
-5
0
5
10
15
20
25
30
securities other than sharesshares and other equity
Source: ECB.1) MFI sector excluding the Eurosystem; sectoral classification is based on the ESA 95.2) Data refer to the changing composition of the euro area. For further information, see the General Notes.

S 21ECB
Monthly Bulletin
January 2010
EURO AREASTATISTICS
Money, banking
and investment
funds
2.7 Revaluation of selected MFI balance sheet items 1), 2) (EUR billions)
1. Write-offs/write-downs of loans to households 3)
Consumer credit Lending for house purchase Other lending
Total Up to Over 1 Over Total Up to Over 1 Over Total Up to Over 1 Over1 year and up to 5 years 1 year and up to 5 years 1 year and up to 5 years
5 years 5 years 5 years
1 2 3 4 5 6 7 8 9 10 11 122007 -4.2 -1.2 -1.4 -1.6 -2.7 -0.2 -0.2 -2.3 -6.9 -0.8 -2.3 -3.72008 -4.6 -1.1 -1.5 -1.9 -2.7 0.0 -0.2 -2.5 -6.7 -1.2 -2.3 -3.22009 Q1 -1.8 -0.5 -0.5 -0.8 -1.2 0.0 -0.1 -1.1 -2.3 -0.7 -0.2 -1.3 Q2 -1.5 -0.3 -0.5 -0.7 -1.0 0.0 0.0 -0.9 -1.2 -0.1 -0.2 -0.9 Q3 -1.6 -0.3 -0.5 -0.9 -0.8 0.0 0.0 -0.7 -1.6 -0.3 -0.2 -1.02009 July -0.7 -0.1 -0.2 -0.3 -0.2 0.0 0.0 -0.2 -0.6 -0.1 -0.1 -0.4 Aug. -0.4 -0.1 -0.1 -0.2 -0.2 0.0 0.0 -0.2 -0.4 -0.1 0.0 -0.2 Sep. -0.5 -0.1 -0.2 -0.3 -0.4 0.0 0.0 -0.3 -0.5 -0.1 -0.1 -0.4 Oct. -0.7 -0.1 -0.3 -0.4 -0.2 0.0 0.0 -0.2 -0.4 0.0 -0.1 -0.2 Nov. (p) -0.4 -0.1 -0.1 -0.2 -0.2 0.0 0.0 -0.2 -0.4 0.0 0.0 -0.3
2. Write-offs/write-downs of loans to non-financial corporations and non-euro area residents
Non-financial corporations Non-euro area residents
Total Up to Over 1 Over Total Up to Over 11 year and up to 5 years 1 year year
5 years
1 2 3 4 5 6 72007 -12.5 -2.1 -5.4 -4.9 -5.2 -3.4 -1.82008 -17.8 -4.1 -9.1 -4.6 -6.6 -3.4 -3.22009 Q1 -7.2 -3.5 -1.7 -2.1 -2.7 -1.3 -1.3 Q2 -5.9 -1.7 -2.4 -1.8 -1.1 -0.3 -0.8 Q3 -7.0 -2.2 -2.1 -2.7 -1.0 -0.5 -0.52009 July -2.5 -0.7 -0.9 -0.9 -0.4 -0.2 -0.2 Aug. -1.4 -0.7 -0.4 -0.3 -0.1 -0.1 0.0 Sep. -3.1 -0.8 -0.8 -1.5 -0.5 -0.2 -0.3 Oct. -3.4 -0.7 -1.3 -1.4 -0.4 -0.1 -0.3 Nov. (p) -1.4 -0.2 -0.5 -0.6 -0.2 0.1 -0.2
3. Revaluation of securities held by MFIs
Securities other than shares Shares and other equity
Total MFIs General Other euro Non-euro area Total MFIs Non-MFIs Non-euro area
government area residents residents residents
Euro Non-euro Euro Non-euro Euro Non-euro
1 2 3 4 5 6 7 8 9 10 11 122007 -14.2 -3.3 0.1 -0.4 -0.2 -3.2 -0.6 -6.7 27.6 3.8 11.7 12.12008 -56.4 -8.0 0.0 5.2 0.0 -20.1 -2.2 -31.2 -60.6 -8.2 -44.1 -8.22009 Q1 -14.1 -0.3 -0.1 -3.2 0.0 -2.9 0.4 -8.1 -16.0 -3.5 -11.5 -1.0 Q2 -2.4 2.0 0.1 -2.0 -0.1 -1.7 0.3 -1.0 8.2 2.3 4.7 1.3 Q3 17.3 4.6 0.1 3.6 0.0 3.4 0.2 5.3 15.9 4.8 9.2 1.92009 July 8.2 1.9 0.1 2.9 0.0 0.5 0.2 2.5 7.0 2.5 3.6 0.9 Aug. 4.9 1.5 0.0 0.4 0.0 1.1 0.0 1.9 5.8 1.8 3.3 0.7 Sep. 4.2 1.2 0.0 0.2 0.0 1.8 0.0 1.0 3.1 0.4 2.2 0.4 Oct. 2.3 1.5 0.0 -0.3 0.0 0.4 0.0 0.7 -3.2 -1.0 -1.7 -0.5 Nov. (p) 2.3 1.0 0.0 1.2 0.1 -0.1 0.0 0.0 -1.2 -0.8 -0.2 -0.2
Source: ECB.1) MFI sector excluding the Eurosystem; sectoral classification is based on the ESA 95.2) Data refer to the changing composition of the euro area. For further information, see the General Notes.3) Including non-profit institutions serving households.

S 22ECB
Monthly Bulletin
January 2010
2.8 Currency breakdown of selected MFI balance sheet items 1), 2) (percentages of total; outstanding amounts in EUR billions; end of period)
1. Deposits
By euro area residents
MFIs 3) Non-MFIs
All Euro 4) Non-euro currencies All Euro 4) Non-euro currencies
currencies currencies (outstanding Total (outstanding Total
amount) amount)USD JPY CHF GBP USD JPY CHF GBP
1 2 3 4 5 6 7 8 9 10 11 12 13 14
2006 5,239.3 90.7 9.3 5.6 0.4 1.5 1.2 8,025.9 96.4 3.6 2.2 0.3 0.1 0.62007 6,087.5 92.1 7.9 4.8 0.4 1.1 1.0 8,994.4 96.4 3.6 2.2 0.4 0.1 0.5
2008 Q4 6,861.2 89.7 10.3 7.3 0.4 1.2 0.8 9,880.6 96.9 3.1 1.9 0.5 0.1 0.42009 Q1 6,609.1 90.9 9.1 6.3 0.3 1.2 0.7 9,988.3 96.9 3.1 1.9 0.4 0.1 0.5 Q2 6,626.9 92.2 7.8 5.1 0.3 1.1 0.8 10,144.7 97.0 3.0 1.9 0.3 0.1 0.5 Q3 (p) 6,287.9 92.4 7.6 4.8 0.4 1.1 0.8 10,060.5 97.0 3.0 1.9 0.3 0.1 0.4
By non-euro area residents
2006 2,561.5 45.4 54.6 35.0 2.3 2.7 11.5 868.6 50.8 49.2 31.9 1.3 2.0 10.42007 2,953.9 47.0 53.0 33.5 2.9 2.4 11.0 908.2 50.1 49.9 32.9 1.6 1.8 9.9
2008 Q4 2,816.9 48.2 51.8 33.4 2.8 2.6 10.2 897.0 54.9 45.1 28.7 1.4 1.9 9.42009 Q1 2,786.7 47.2 52.8 34.8 2.1 2.6 10.4 879.0 52.7 47.3 31.6 1.2 1.9 8.4 Q2 2,685.4 49.0 51.0 33.2 1.6 2.6 10.7 879.9 51.9 48.1 32.5 1.8 1.8 7.8 Q3 (p) 2,569.7 49.1 50.9 34.3 1.5 2.5 9.5 853.2 54.3 45.7 30.5 1.4 1.6 7.7
2. Debt securities issued by euro area MFIs
All Euro 4) Non-euro currencies
currencies (outstanding Total
amount)USD JPY CHF GBP
1 2 3 4 5 6 72006 4,470.8 80.6 19.4 10.0 1.6 1.9 3.52007 4,933.2 81.5 18.5 9.2 1.7 1.9 3.4
2008 Q4 5,111.7 83.3 16.7 8.4 2.0 1.9 2.52009 Q1 5,197.9 83.3 16.7 8.7 1.9 1.9 2.5 Q2 5,225.0 83.6 16.4 8.3 1.8 1.8 2.7 Q3 (p) 5,202.2 84.0 16.0 8.2 1.8 1.9 2.3
Source: ECB.1) MFI sector excluding the Eurosystem; sectoral classification is based on the ESA 95.2) Data refer to the changing composition of the euro area. For further information, see the General Notes.3) For non-euro area residents, the term ‘‘MFIs’’ refers to institutions similar to euro area MFIs.4) Including items expressed in the national denominations of the euro.

S 23ECB
Monthly Bulletin
January 2010
EURO AREASTATISTICS
Money, banking
and investment
funds
2.8 Currency breakdown of selected MFI balance sheet items 1), 2) (percentages of total; outstanding amounts in EUR billions; end of period)
3. Loans
To euro area residents
MFIs 3) Non-MFIs
All Euro 4) Non-euro currencies All Euro 4) Non-euro currencies
currencies currencies (outstanding Total (outstanding Total
amount) amount)USD JPY CHF GBP USD JPY CHF GBP
1 2 3 4 5 6 7 8 9 10 11 12 13 14
2006 4,938.0 - - - - - - 9,943.7 96.4 3.6 1.6 0.2 1.1 0.52007 5,794.2 - - - - - - 11,098.9 96.2 3.8 1.8 0.2 0.9 0.6
2008 Q4 6,312.6 - - - - - - 11,739.4 95.9 4.1 2.1 0.3 1.0 0.42009 Q1 6,128.1 - - - - - - 11,785.6 95.9 4.1 2.1 0.3 1.0 0.5 Q2 6,216.3 - - - - - - 11,834.4 96.1 3.9 2.0 0.2 1.0 0.5 Q3 (p) 5,900.9 - - - - - - 11,764.8 96.2 3.8 1.9 0.2 1.0 0.4
To non-euro area residents
2006 2,070.6 50.9 49.1 28.7 2.0 2.3 11.0 861.2 39.3 60.7 43.1 1.1 4.0 8.62007 2,344.5 48.2 51.8 28.8 2.3 2.4 12.7 955.7 40.9 59.1 41.2 1.2 3.7 8.2
2008 Q4 2,282.0 45.8 54.2 31.8 3.0 2.6 11.3 965.8 40.5 59.5 41.9 1.4 4.3 7.42009 Q1 2,101.0 44.8 55.2 31.2 2.7 3.1 12.7 956.1 38.1 61.9 44.5 1.0 4.2 7.8 Q2 1,999.7 45.2 54.8 29.6 2.8 3.2 13.5 949.6 40.2 59.8 42.6 1.1 3.9 7.6 Q3 (p) 1,893.6 45.4 54.6 29.9 2.7 3.1 12.6 914.2 40.5 59.5 41.7 1.5 3.8 7.6
4. Holdings of securities other than shares
Issued by euro area residents
Issued by MFIs 3) Issued by non-MFIs
All Euro 4) Non-euro currencies All Euro 4) Non-euro currencies
currencies currencies (outstanding Total (outstanding Total
amount) amount)USD JPY CHF GBP USD JPY CHF GBP
1 2 3 4 5 6 7 8 9 10 11 12 13 14
2006 1,636.9 95.6 4.4 2.3 0.2 0.3 1.3 1,924.6 97.6 2.4 1.3 0.3 0.1 0.72007 1,740.3 95.2 4.8 2.4 0.3 0.3 1.5 2,150.3 97.7 2.3 1.4 0.2 0.1 0.5
2008 Q4 1,979.5 95.3 4.7 2.6 0.4 0.2 1.2 2,651.4 97.3 2.7 1.7 0.3 0.1 0.42009 Q1 2,085.8 95.0 5.0 2.7 0.2 0.4 1.3 2,834.3 97.5 2.5 1.7 0.2 0.1 0.4 Q2 2,123.5 95.0 5.0 2.5 0.5 0.4 1.4 2,962.4 97.7 2.3 1.5 0.2 0.1 0.3 Q3 (p) 2,118.6 95.1 4.9 2.9 0.2 0.3 1.3 2,996.9 97.9 2.1 1.4 0.2 0.1 0.4
Issued by non-euro area residents
2006 515.3 52.3 47.7 28.8 0.7 0.4 14.5 594.5 38.9 61.1 36.5 4.9 0.8 14.22007 582.4 53.9 46.1 27.3 0.7 0.4 14.4 652.3 35.9 64.1 39.3 4.5 0.8 12.6
2008 Q4 580.7 54.1 45.9 28.6 0.9 0.5 13.3 646.8 39.0 61.0 37.1 6.4 0.8 11.02009 Q1 597.9 52.1 47.9 27.6 0.3 1.6 13.9 617.9 34.1 65.9 40.5 4.3 0.8 15.3 Q2 571.0 55.3 44.7 24.6 1.7 1.4 14.6 633.1 33.5 66.5 41.4 4.0 0.9 15.0 Q3 (p) 562.1 56.2 43.8 25.3 0.6 0.5 14.7 618.0 34.8 65.2 39.3 4.2 0.9 15.1
Source: ECB.1) MFI sector excluding the Eurosystem; sectoral classification is based on the ESA 95.2) Data refer to the changing composition of the euro area. For further information, see the General Notes.3) For non-euro area residents, the term ‘‘MFIs’’ refers to institutions similar to euro area MFIs.4) Including items expressed in the national denominations of the euro.

S 24ECB
Monthly Bulletin
January 2010
2.9 Aggregated balance sheet of euro area investment funds 1) (EUR billions; outstanding amounts at end of period; transactions during period)
1. Assets
Outstanding amounts
Total Deposits and Securities other Shares and other Investment fund/ Non-financial Other assetsloan claims than shares equity (excl. money market fund assets (incl. financial
investment fund/ shares derivatives)money market fund
shares)1 2 3 4 5 6 7
2009 Apr. 4,482.1 403.5 1,737.2 1,190.5 611.9 193.4 345.6 May 4,596.4 414.7 1,773.4 1,240.1 620.1 194.1 354.1 June 4,710.0 378.1 1,872.8 1,251.5 627.6 200.7 379.2 July 4,987.0 370.8 1,937.6 1,441.3 655.6 201.7 379.9 Aug. 5,088.1 374.5 1,968.7 1,495.8 662.4 202.0 384.7 Sep. 5,150.4 347.6 1,997.8 1,542.8 681.1 197.3 383.8 Oct. (p) 5,131.9 346.4 2,017.8 1,507.3 681.0 198.5 380.9
Transactions
2009 Q1 -76.2 -23.1 -0.2 -9.1 -5.3 2.8 -41.4 Q2 106.7 -0.7 99.8 19.5 2.2 9.7 -23.8 Q3 163.3 -10.1 68.7 109.0 10.3 -3.1 -11.5
2. Liabilities
Outstanding amounts
Total Loans and Investment fund shares issued Other
deposits liabilitiesreceived Total Held by euro area residents Held by (incl. financial
non-euro area derivatives)Investment residents
funds1 2 3 4 5 6 7
2009 Apr. 4,482.1 104.4 4,085.0 3,343.1 426.8 742.0 292.5 May 4,596.4 105.9 4,195.0 3,427.3 437.1 767.7 295.5 June 4,710.0 98.6 4,276.9 3,494.6 457.2 782.3 334.4 July 4,987.0 103.1 4,528.2 3,701.7 483.3 826.4 355.6 Aug. 5,088.1 106.1 4,633.0 3,784.3 493.3 848.7 348.9 Sep. 5,150.4 96.4 4,729.4 3,860.0 514.0 869.5 324.6 Oct. (p) 5,131.9 95.7 4,717.6 3,848.0 518.3 869.6 318.7
Transactions
2009 Q1 -76.2 -15.7 -22.8 -13.9 24.1 -8.8 -37.7 Q2 106.7 0.3 93.0 74.7 20.8 18.3 13.5 Q3 163.3 0.7 179.5 86.5 17.6 93.0 -16.8
3. Investment fund shares issued broken down by investment policy and type of fund
Outstanding amounts
Total Funds by investment policy Funds by type Memo item:
Money marketBond Equity Mixed Real estate Hedge Other Open-end Closed-end fundsfunds funds funds funds funds funds funds funds
1 2 3 4 5 6 7 8 9 10
2009 Mar. 3,904.8 1,265.9 909.8 1,071.2 214.9 78.2 364.9 3,839.4 65.5 1,307.6 Apr. 4,085.0 1,294.2 1,015.6 1,101.1 218.5 81.7 373.8 4,018.2 66.8 1,315.6 May 4,195.0 1,348.1 1,078.9 1,087.4 221.1 79.2 380.3 4,128.2 66.7 1,295.4 June 4,276.9 1,425.5 1,077.6 1,093.0 221.0 79.2 380.6 4,209.3 67.6 1,269.1 July 4,528.2 1,485.2 1,242.1 1,111.6 222.9 78.1 388.3 4,462.9 65.2 1,285.4 Aug. 4,633.0 1,510.2 1,290.7 1,139.9 225.5 78.1 388.6 4,567.9 65.1 1,285.2 Sep. 4,729.4 1,531.0 1,344.7 1,165.0 219.3 77.3 392.1 4,664.0 65.4 1,253.0 Oct. (p) 4,717.6 1,545.0 1,315.8 1,175.9 224.1 75.7 381.0 4,652.2 65.3 1,246.2
Transactions
2009 Apr. 4.8 6.4 6.7 -0.3 1.4 -3.3 -6.1 3.5 1.3 5.1 May 18.3 12.1 12.4 -2.9 1.0 -3.1 -1.3 18.4 -0.1 -1.6 June 69.9 60.8 2.3 -13.8 7.7 7.4 5.5 69.5 0.3 -28.2 July 128.0 40.6 85.1 0.4 -1.4 -1.8 4.9 130.3 -2.4 16.4 Aug. 28.2 11.8 9.8 7.4 1.6 -0.8 -1.4 28.4 -0.1 3.9 Sep. 23.3 4.1 8.8 13.1 -1.6 -0.1 -0.9 22.8 0.5 -29.2 Oct. (p) 26.3 10.2 3.2 13.9 3.2 0.4 -4.6 26.3 0.0 -5.8
Source: ECB.1) Other than money market funds (which are shown as a memo item in column in Table 3 of this section). For further details, see the General Notes.

S 25ECB
Monthly Bulletin
January 2010
EURO AREASTATISTICS
Money, banking
and investment
funds
2.10 Securities held by investment funds 1) broken down by issuer of securities (EUR billions; outstanding amounts at end of period; transactions during period)
1. Securities other than shares
Outstanding amounts
Total Euro area Rest of the world
Total MFIs General Other Insurance Non-financial EU United Japangovernment financial corporations corporations Member States States
intermediaries and pension outside thefunds euro area
1 2 3 4 5 6 7 8 9 10 11
2008 Q4 1,708.4 1,206.2 335.0 617.3 150.2 3.2 100.4 502.1 130.7 163.6 25.52009 Q1 1,710.6 1,233.9 340.9 628.6 151.6 4.0 108.7 476.6 142.3 183.5 22.6 Q2 1,872.8 1,293.7 357.9 635.7 173.2 3.9 122.9 579.1 161.9 234.6 21.8 Q3 (p) 1,997.8 1,383.3 388.5 668.1 185.8 4.9 135.9 614.5 180.1 234.6 22.0
Transactions
2009 Q1 -0.2 24.3 7.4 7.2 2.6 1.1 6.0 -24.4 13.2 14.7 -2.4 Q2 99.8 32.0 3.5 10.1 11.3 -0.8 7.9 67.8 6.8 48.7 -2.6 Q3 (p) 68.7 46.2 10.7 19.4 6.1 0.4 9.6 22.5 11.2 3.6 -0.8
2. Shares and other equity (other than investment fund and money market fund shares)
Outstanding amounts
Total Euro area Rest of the world
Total MFIs General Other Insurance Non-financial EU United Japangovernment financial corporations corporations Member States States
intermediaries and pension outside thefunds euro area
1 2 3 4 5 6 7 8 9 10 11
2008 Q4 1,156.0 582.4 67.6 - 31.1 26.3 456.1 573.5 103.3 183.7 60.62009 Q1 1,070.5 502.9 48.1 - 26.1 19.8 408.7 567.5 89.3 190.8 47.9 Q2 1,251.5 566.0 69.8 - 28.6 16.8 450.1 685.5 110.8 210.9 59.7 Q3 (p) 1,542.8 700.1 97.1 - 35.1 24.7 543.0 842.7 126.9 265.0 61.7
Transactions
2009 Q1 -9.1 -30.9 -14.3 - -4.8 -2.3 -9.1 22.0 -5.7 20.3 -6.2 Q2 19.5 -4.2 1.3 - -1.4 -3.4 -1.3 23.6 4.3 1.0 7.1 Q3 (p) 109.0 31.6 7.1 - 3.3 2.3 19.6 77.4 2.3 33.9 1.4
3. Investment fund/money market fund shares
Outstanding amounts
Total Euro area Rest of the world
Total MFIs 2) General Other Insurance Non-financial EU United Japangovernment financial corporations corporations Member States States
intermediaries 2) and pension outside thefunds euro area
1 2 3 4 5 6 7 8 9 10 11
2008 Q4 621.9 494.6 93.9 - 400.7 - - 127.3 13.3 19.4 0.42009 Q1 594.6 492.9 85.1 - 407.8 - - 101.8 9.5 15.9 0.3 Q2 627.6 540.1 82.9 - 457.2 - - 87.5 12.9 16.2 0.4 Q3 (p) 681.1 592.5 78.5 - 514.0 - - 88.5 14.4 19.4 0.3
Transactions
2009 Q1 -5.3 17.2 -6.9 - 24.1 - - -22.5 -3.1 -3.7 0.0 Q2 2.2 15.8 -5.1 - 20.8 - - -13.6 2.1 0.2 0.0 Q3 (p) 10.3 11.8 -5.8 - 17.6 - - -1.5 0.9 -0.3 0.0
Source: ECB.1) Other than money market funds. For further details, see the General Notes.2) Investment fund shares (other than money market fund shares) are issued by other financial intermediaries. Money market fund shares are issued by MFIs.

S 26ECB
Monthly Bulletin
January 2010
3 EURO AREA ACCOUNTS
3.1 Integrated economic and financial accounts by institutional sector (EUR billions)
Uses Euro Households Non-financial Financial General Rest ofarea corporations corporations government the world
2009 Q2
External account
Exports of goods and services 424.5 Trade balance 1) -20.8
Generation of income account
Gross value added (basic prices) Taxes less subsidies on products Gross domestic product (market prices) Compensation of employees 1,113.9 109.6 708.4 54.4 241.5 Other taxes less subsidies on production 33.6 3.5 22.7 3.6 3.8 Consumption of fixed capital 355.1 96.8 200.7 11.6 46.0 Net operating surplus and mixed income 1) 517.0 281.8 203.1 32.7 -0.6
Allocation of primary income account
Net operating surplus and mixed income Compensation of employees 4.7 Taxes less subsidies on production Property income 1,016.8 37.5 492.0 418.7 68.6 115.8 Interest 425.5 35.2 67.1 254.6 68.5 64.7 Other property income 591.3 2.3 424.9 164.0 0.0 51.1 Net national income 1) 1,862.3 1,673.3 -59.7 33.1 215.6
Secondary distribution of income account
Net national income Current taxes on income, wealth, etc. 258.4 212.5 37.0 8.6 0.3 4.3 Social contributions 414.6 414.6 0.8 Social benefits other than social transfers in kind 438.4 1.5 15.9 31.0 390.0 0.7 Other current transfers 182.8 69.3 25.8 46.2 41.6 7.8 Net non-life insurance premiums 44.6 32.4 10.7 0.8 0.7 1.1 Non-life insurance claims 44.5 44.5 0.5 Other 93.7 36.9 15.1 0.8 40.9 6.2 Net disposable income 1) 1,843.1 1,502.2 -110.8 40.2 411.5
Use of income account
Net disposable income Final consumption expenditure 1,784.5 1,294.5 490.1 Individual consumption expenditure 1,591.5 1,294.5 297.0 Collective consumption expenditure 193.0 193.0 Adjustment for the change in the net equity of households in pension fund reserves 17.0 0.1 0.5 16.4 0.0 0.0 Net saving/current external account 1) 58.6 224.6 -111.3 23.8 -78.6 17.7
Capital account
Net saving/current external account Gross capital formation 431.4 142.9 216.8 12.6 59.2 Gross fixed capital formation 462.4 143.9 247.0 12.4 59.1 Changes in inventories and acquisitions less disposals of valuables -31.0 -1.1 -30.3 0.2 0.1 Consumption of fixed capital Acquisitions less disposals of non-produced non-financial assets 0.3 -1.8 1.3 0.3 0.6 -0.3 Capital transfers 45.1 8.4 3.3 6.7 26.6 4.8 Capital taxes 11.2 5.6 0.3 5.3 0.0 Other capital transfers 33.9 2.8 3.0 1.4 26.6 4.8 Net lending (+)/net borrowing (-) (from capital account) 1) -15.3 183.3 -113.2 20.6 -106.0 15.3 Statistical discrepancy 0.0 -31.4 31.4 0.0 0.0 0.0
Sources: ECB and Eurostat.1) For details of the calculation of the balancing items, see the Technical Notes.

S 27ECB
Monthly Bulletin
January 2010
EURO AREASTATISTICS
Euro area
accounts
3.1 Integrated economic and financial accounts by institutional sector (cont'd) (EUR billions)
Resources Euro Households Non-financial Financial General Rest ofarea corporations corporations government the world
2009 Q2
External account
Imports of goods and services 403.7 Trade balance Generation of income account
Gross value added (basic prices) 2,019.6 491.6 1,135.0 102.3 290.7 Taxes less subsidies on products 217.1 Gross domestic product (market prices)2) 2,236.7 Compensation of employees Other taxes less subsidies on production Consumption of fixed capital Net operating surplus and mixed income Allocation of primary income account
Net operating surplus and mixed income 517.0 281.8 203.1 32.7 -0.6 Compensation of employees 1,116.0 1,116.0 2.7 Taxes less subsidies on production 252.9 252.9 -2.3 Property income 993.2 313.1 229.1 419.1 31.8 139.4 Interest 413.3 63.5 43.3 297.8 8.6 76.9 Other property income 579.9 249.6 185.8 121.4 23.2 62.5 Net national income Secondary distribution of income account
Net national income 1,862.3 1,673.3 -59.7 33.1 215.6 Current taxes on income, wealth, etc. 262.0 262.0 0.6 Social contributions 414.4 1.2 17.0 47.4 348.9 1.0 Social benefits other than social transfers in kind 436.5 436.5 2.7 Other current transfers 162.2 89.1 10.6 45.5 17.0 28.4 Net non-life insurance premiums 44.5 44.5 1.1 Non-life insurance claims 43.8 34.9 8.0 0.6 0.3 1.2 Other 73.9 54.2 2.6 0.4 16.7 26.1 Net disposable income Use of income account
Net disposable income 1,843.1 1,502.2 -110.8 40.2 411.5 Final consumption expenditure Individual consumption expenditure Collective consumption expenditure Adjustment for the change in the net equity of households in pension fund reserves 17.0 17.0 0.0 Net saving/current external account Capital account
Net saving/current external account 58.6 224.6 -111.3 23.8 -78.6 17.7 Gross capital formation Gross fixed capital formation Changes in inventories and acquisitions less disposals of valuables Consumption of fixed capital 355.1 96.8 200.7 11.6 46.0 Acquisitions less disposals of non-produced non-financial assets Capital transfers 47.8 11.4 18.6 4.8 12.9 2.1 Capital taxes 11.2 11.2 0.0 Other capital transfers 36.6 11.4 18.6 4.8 1.8 2.1 Net lending (+)/net borrowing (-) (from capital account) Statistical discrepancy
Sources: ECB and Eurostat.2) Gross domestic product is equal to the gross value added of all domestic sectors plus net taxes (i.e. taxes less subsidies) on products.

S 28ECB
Monthly Bulletin
January 2010
3.1 Integrated economic and financial accounts by institutional sector (cont'd) (EUR billions)
Assets Euro Households Non-financial MFIs Other Insurance General Rest ofarea corporations financial corporations govern- the world
inter- and pension ment2009 Q2 mediaries funds
Opening balance sheet, financial assets
Total financial assets 16,592.7 13,849.2 23,623.5 9,709.5 5,915.4 3,216.5 14,773.4 Monetary gold and special drawing rights (SDRs) 245.2 Currency and deposits 6,242.5 1,706.8 2,181.1 1,820.2 871.1 736.1 4,077.6 Short-term debt securities 60.4 107.0 137.5 371.0 345.3 25.5 795.5 Long-term debt securities 1,310.7 220.5 4,442.4 1,664.5 2,035.0 316.8 3,037.4 Loans 67.5 2,631.3 12,765.8 2,266.8 367.8 444.3 1,811.4 of which: Long-term 49.5 1,460.0 9,724.0 1,757.0 304.9 355.9 . Shares and other equity 3,493.2 5,812.9 1,541.0 3,399.0 1,826.1 1,111.3 4,353.1 Quoted shares 523.7 998.2 412.8 1,373.1 395.2 223.3 . Unquoted shares and other equity 1,694.2 4,496.2 909.1 1,493.0 391.2 764.1 . Mutual fund shares 1,275.3 318.5 219.0 532.9 1,039.7 123.9 . Insurance technical reserves 5,178.3 140.5 1.9 0.0 154.4 3.1 134.6 Other accounts receivable and financial derivatives 240.2 3,230.3 2,308.8 187.9 315.8 579.4 563.7 Net financial worth Financial account, transactions in financial assets
Total transactions in financial assets 193.0 60.2 -123.2 164.7 42.9 112.3 -8.8 Monetary gold and SDRs -0.4 0.4 Currency and deposits 74.1 41.6 -54.2 27.3 -13.3 17.1 -151.6 Short-term debt securities -14.0 -28.5 -13.7 17.8 6.5 -0.8 64.9 Long-term debt securities 16.1 -44.7 147.8 113.8 -16.0 35.9 23.0 Loans 0.3 14.0 61.8 -55.7 5.6 23.5 -56.5 of which: Long-term 0.0 7.7 58.7 -61.2 5.1 1.6 . Shares and other equity 31.5 64.9 21.9 32.1 60.1 26.9 121.2 Quoted shares 18.9 37.9 -0.5 -1.6 5.0 10.0 . Unquoted shares and other equity 12.4 31.1 13.2 15.5 -3.4 17.0 . Mutual fund shares 0.1 -4.1 9.2 18.2 58.4 -0.1 . Insurance technical reserves 56.5 0.2 0.0 0.0 0.3 0.0 -2.3 Other accounts receivable and financial derivatives 28.5 12.7 -286.3 29.3 -0.3 9.6 -7.9 Changes in net financial worth due to transactions Other changes account, financial assets
Total other changes in financial assets 306.0 310.5 231.5 331.2 86.4 20.4 55.5 Monetary gold and SDRs -10.8 Currency and deposits 0.0 -4.5 -21.0 -5.8 0.0 0.9 -42.0 Short-term debt securities -0.7 18.0 -1.3 5.4 0.5 0.5 -20.0 Long-term debt securities 17.2 -5.4 -3.5 19.4 11.1 -1.0 -1.8 Loans 0.0 -3.6 -34.2 -19.2 -1.5 0.3 -19.6 of which: Long-term 0.0 -3.6 -17.2 -21.7 -0.9 -0.4 . Shares and other equity 233.3 361.8 62.2 317.8 65.2 21.6 196.8 Quoted shares 90.7 95.8 43.1 188.3 39.3 21.2 . Unquoted shares and other equity 91.1 250.0 35.8 110.3 5.2 -3.3 . Mutual fund shares 51.5 16.0 -16.7 19.2 20.6 3.7 . Insurance technical reserves 53.9 3.5 0.0 0.0 28.5 0.0 -46.1 Other accounts receivable and financial derivatives 2.3 -59.4 240.2 13.6 -17.4 -1.9 -11.8 Other changes in net financial worth Closing balance sheet, financial assets
Total financial assets 17,091.7 14,219.9 23,731.9 10,205.4 6,044.7 3,349.2 14,819.7 Monetary gold and SDRs 234.0 Currency and deposits 6,316.6 1,743.8 2,105.9 1,841.7 857.8 754.1 3,883.9 Short-term debt securities 45.7 96.5 122.4 394.2 352.3 25.2 840.5 Long-term debt securities 1,344.0 170.3 4,586.7 1,797.6 2,030.1 351.7 3,058.6 Loans 67.8 2,641.7 12,793.4 2,192.0 371.9 468.1 1,735.3 of which: Long-term 49.5 1,464.1 9,765.5 1,674.0 309.1 357.1 . Shares and other equity 3,758.0 6,239.6 1,625.0 3,748.9 1,951.3 1,159.7 4,671.0 Quoted shares 633.3 1,131.9 455.4 1,559.8 439.5 254.5 . Unquoted shares and other equity 1,797.8 4,777.3 958.1 1,618.8 393.1 777.8 . Mutual fund shares 1,326.9 330.4 211.5 570.4 1,118.7 127.5 . Insurance technical reserves 5,288.7 144.2 1.9 0.0 183.2 3.2 86.3 Other accounts receivable and financial derivatives 271.0 3,183.6 2,262.6 230.8 298.1 587.2 544.0 Net financial worthSource: ECB.

S 29ECB
Monthly Bulletin
January 2010
EURO AREASTATISTICS
Euro area
accounts
3.1 Integrated economic and financial accounts by institutional sector (cont'd) (EUR billions)
Liabilities Euro Households Non-financial MFIs Other Insurance General Rest ofarea corporations financial corporations govern- the world
inter- and pension ment2009 Q2 mediaries funds
Opening balance sheet, liabilities
Total liabilities 6,339.0 21,856.3 23,014.5 9,398.4 6,083.0 7,713.7 13,030.3 Monetary gold and special drawing rights (SDRs) Currency and deposits 26.3 14,856.7 21.0 0.0 245.6 2,485.8 Short-term debt securities 308.5 255.5 96.2 10.7 943.3 228.0 Long-term debt securities 481.7 2,800.0 2,193.5 31.5 4,859.7 2,660.8 Loans 5,716.4 8,205.0 1,828.2 214.7 1,260.3 3,130.4 of which: Long-term 5,344.4 5,687.8 826.8 80.4 1,068.8 . Shares and other equity 9,621.7 2,446.1 5,043.6 387.4 4.2 4,033.4 Quoted shares 2,514.0 318.1 93.8 122.0 0.0 . Unquoted shares and other equity 7,107.7 924.9 1,152.2 265.4 4.2 . Mutual fund shares 1,203.1 3,797.6 . Insurance technical reserves 33.7 330.9 62.9 0.8 5,184.0 0.5 Other accounts payable and financial derivatives 588.8 2,882.1 2,593.3 215.3 254.8 400.0 491.8 Net financial worth 1) -1,497.9 10,253.8 -8,007.0 609.1 311.1 -167.6 -4,497.2
Financial account, transactions in liabilities
Total transactions in liabilities 41.2 142.0 -153.0 193.8 23.0 218.3 -24.1 Monetary gold and SDRs Currency and deposits 0.5 14.8 -0.9 0.0 8.2 -81.5 Short-term debt securities 8.1 -49.5 -0.2 -1.0 68.5 6.4 Long-term debt securities 25.1 47.9 67.4 -1.1 113.6 22.9 Loans 31.1 12.3 -61.4 -0.2 50.3 -39.1 of which: Long-term 27.8 40.3 -75.5 -0.2 29.1 . Shares and other equity 78.1 3.6 188.5 0.3 0.0 88.0 Quoted shares 26.2 12.0 1.4 0.0 0.0 . Unquoted shares and other equity 51.9 9.4 29.5 0.3 0.0 . Mutual fund shares -17.8 157.6 . Insurance technical reserves 0.1 0.6 2.1 0.0 52.0 0.0 Other accounts payable and financial derivatives 9.9 17.5 -171.9 0.4 -26.9 -22.3 -20.9 Changes in net financial worth due to transactions 1) -15.3 151.9 -81.8 29.8 -29.1 19.9 -106.0 15.3
Other changes account, liabilities
Total other changes in liabilities -1.3 503.2 305.5 305.0 77.0 13.5 149.3 Monetary gold and SDRs Currency and deposits 0.0 -50.3 0.0 0.0 0.0 -22.2 Short-term debt securities 11.3 0.6 0.6 0.0 -1.0 -9.3 Long-term debt securities -2.0 2.0 24.9 -0.1 -20.5 31.6 Loans -0.6 -19.2 -40.5 -1.4 -2.6 -13.6 of which: Long-term -0.1 -5.1 -44.5 -1.5 -2.7 . Shares and other equity 628.0 134.6 312.1 27.2 0.3 156.5 Quoted shares 302.9 119.5 25.5 19.4 0.0 . Unquoted shares and other equity 325.0 27.2 55.6 7.8 0.3 . Mutual fund shares -12.1 231.0 . Insurance technical reserves 0.0 0.0 0.0 0.0 39.9 0.0 Other accounts payable and financial derivatives -0.7 -114.9 218.6 7.8 11.4 37.2 6.2 Other changes in net financial worth 1) 83.0 307.3 -192.7 -74.0 26.2 9.3 6.9 -93.8
Closing balance sheet, liabilities
Total liabilities 6,378.8 22,501.5 23,167.0 9,897.2 6,183.1 7,945.5 13,155.4 Monetary gold and SDRs Currency and deposits 26.8 14,821.2 20.1 0.0 253.8 2,382.1 Short-term debt securities 327.9 206.6 96.6 9.7 1,010.8 225.1 Long-term debt securities 504.8 2,849.9 2,285.8 30.3 4,952.9 2,715.4 Loans 5,746.9 8,198.1 1,726.3 213.0 1,308.1 3,077.7 of which: Long-term 5,372.1 5,723.0 706.8 78.7 1,095.3 . Shares and other equity 10,327.7 2,584.3 5,544.2 414.9 4.5 4,277.9 Quoted shares 2,843.1 449.5 120.6 141.4 0.0 . Unquoted shares and other equity 7,484.6 961.5 1,237.4 273.5 4.5 . Mutual fund shares 1,173.3 4,186.3 . Insurance technical reserves 33.8 331.5 65.1 0.8 5,275.8 0.5 Other accounts payable and financial derivatives 598.0 2,784.7 2,640.0 223.4 239.3 414.9 477.1 Net financial worth 1) -1,430.3 10,713.0 -8,281.6 564.9 308.2 -138.4 -4,596.3 Source: ECB.

S 30ECB
Monthly Bulletin
January 2010
3.2 Euro area non-financial accounts (EUR billions; four-quarter cumulated flows)
Uses 2007 Q3- 2007 Q4- 2008 Q1- 2008 Q2- 2008 Q3-2005 2006 2007 2008 Q2 2008 Q3 2008 Q4 2009 Q1 2009 Q2
Generation of income account
Gross value added (basic prices) Taxes less subsidies on products Gross domestic product (market prices) Compensation of employees 3,907.1 4,070.1 4,255.9 4,356.9 4,403.1 4,438.5 4,444.9 4,441.1 Other taxes less subsidies on production 130.0 128.8 137.1 136.3 137.1 133.8 131.7 126.3 Consumption of fixed capital 1,186.7 1,247.2 1,315.2 1,347.5 1,363.9 1,378.2 1,390.3 1,400.0 Net operating surplus and mixed income 1) 2,072.1 2,189.5 2,331.7 2,375.2 2,379.2 2,358.6 2,293.3 2,211.7
Allocation of primary income account
Net operating surplus and mixed income Compensation of employees Taxes less subsidies on production Property income 2,618.2 3,056.3 3,617.1 3,838.5 3,923.1 3,929.5 3,824.1 3,588.7 Interest 1,345.8 1,644.0 2,055.4 2,226.3 2,296.2 2,307.2 2,222.5 2,062.9 Other property income 1,272.4 1,412.3 1,561.7 1,612.3 1,626.9 1,622.3 1,601.6 1,525.8 Net national income 1) 6,970.7 7,317.8 7,695.2 7,783.9 7,819.7 7,803.3 7,720.6 7,631.1
Secondary distribution of income account
Net national income Current taxes on income, wealth, etc. 935.9 1,028.2 1,111.8 1,140.2 1,142.1 1,124.2 1,113.7 1,077.3 Social contributions 1,477.8 1,540.5 1,595.9 1,627.7 1,645.3 1,660.4 1,669.2 1,671.4 Social benefits other than social transfers in kind 1,505.5 1,553.2 1,597.1 1,627.1 1,647.5 1,665.1 1,688.9 1,717.4 Other current transfers 712.0 722.8 753.5 775.5 781.7 790.1 784.3 775.3 Net non-life insurance premiums 179.6 179.6 184.2 186.5 187.7 188.3 185.7 182.6 Non-life insurance claims 180.5 179.9 183.9 186.6 188.0 189.3 186.6 183.3 Other 351.8 363.3 385.4 402.4 406.1 412.5 412.0 409.3 Net disposable income 1) 6,884.3 7,225.6 7,599.7 7,680.2 7,717.1 7,697.7 7,615.7 7,526.8
Use of income account
Net disposable income Final consumption expenditure 6,355.7 6,631.5 6,891.7 7,044.4 7,119.0 7,156.8 7,164.8 7,157.6 Individual consumption expenditure 5,691.0 5,946.4 6,180.3 6,313.6 6,378.6 6,407.4 6,405.2 6,391.1 Collective consumption expenditure 664.7 685.1 711.3 730.8 740.4 749.4 759.6 766.4 Adjustment for the change in the net equity of households in pension fund reserves 60.8 62.9 59.7 62.3 63.7 64.2 64.8 64.5 Net saving 1) 528.9 594.3 708.2 635.8 598.2 540.9 450.9 369.2
Capital account
Net saving Gross capital formation 1,717.1 1,876.7 2,021.7 2,056.2 2,072.2 2,066.3 2,003.1 1,910.5 Gross fixed capital formation 1,709.9 1,854.9 1,995.5 2,034.3 2,048.2 2,029.3 1,976.4 1,907.2 Changes in inventories and acquisitions less disposals of valuables 7.3 21.8 26.1 21.9 24.0 37.0 26.7 3.2 Consumption of fixed capital Acquisitions less disposals of non-produced non-financial assets -0.4 -0.5 -1.2 0.1 0.3 0.7 1.2 0.7 Capital transfers 183.6 170.0 151.2 159.6 163.7 164.1 161.4 169.9 Capital taxes 24.4 22.5 24.3 23.9 24.1 23.6 23.5 28.6 Other capital transfers 159.2 147.4 126.9 135.7 139.6 140.5 137.9 141.3 Net lending (+)/net borrowing (-) (from capital account) 1) 12.1 -20.2 16.8 -57.8 -97.1 -136.3 -153.9 -132.9 Sources: ECB and Eurostat.1) For details of the calculation of the balancing items, see the Technical Notes.

S 31ECB
Monthly Bulletin
January 2010
EURO AREASTATISTICS
Euro area
accounts
3.2 Euro area non-financial accounts (cont'd) (EUR billions; four-quarter cumulated flows)
Resources 2007 Q3- 2007 Q4- 2008 Q1- 2008 Q2- 2008 Q3-2005 2006 2007 2008 Q2 2008 Q3 2008 Q4 2009 Q1 2009 Q2
Generation of income account
Gross value added (basic prices) 7,295.9 7,635.5 8,039.8 8,216.0 8,283.2 8,309.1 8,260.3 8,179.0 Taxes less subsidies on products 845.1 913.7 959.1 954.1 952.5 945.6 928.9 912.6 Gross domestic product (market prices)2) 8,141.1 8,549.3 8,998.9 9,170.1 9,235.7 9,254.7 9,189.2 9,091.6 Compensation of employees Other taxes less subsidies on production Consumption of fixed capital Net operating surplus and mixed income
Allocation of primary income account
Net operating surplus and mixed income 2,072.1 2,189.5 2,331.7 2,375.2 2,379.2 2,358.6 2,293.3 2,211.7 Compensation of employees 3,914.4 4,077.6 4,264.0 4,365.4 4,411.6 4,447.0 4,453.2 4,449.4 Taxes less subsidies on production 988.2 1,054.0 1,103.2 1,095.8 1,095.0 1,084.5 1,065.7 1,045.4 Property income 2,614.3 3,053.1 3,613.5 3,786.1 3,857.0 3,842.8 3,732.6 3,513.4 Interest 1,320.3 1,614.5 2,014.6 2,172.5 2,241.0 2,251.0 2,164.3 2,009.0 Other property income 1,294.0 1,438.6 1,598.9 1,613.6 1,616.0 1,591.8 1,568.3 1,504.4 Net national income
Secondary distribution of income account
Net national income 6,970.7 7,317.8 7,695.2 7,783.9 7,819.7 7,803.3 7,720.6 7,631.1 Current taxes on income, wealth, etc. 939.5 1,032.9 1,119.2 1,148.4 1,150.4 1,132.5 1,121.9 1,083.8 Social contributions 1,477.0 1,539.7 1,595.0 1,626.9 1,644.6 1,659.5 1,668.2 1,670.4 Social benefits other than social transfers in kind 1,497.9 1,545.1 1,588.1 1,618.4 1,639.1 1,657.0 1,680.7 1,709.4 Other current transfers 630.4 634.7 660.5 673.1 680.0 685.1 680.4 673.4 Net non-life insurance premiums 180.5 179.9 183.9 186.6 188.0 189.3 186.6 183.3 Non-life insurance claims 178.3 176.8 181.3 183.7 184.9 185.7 183.0 179.9 Other 271.6 278.1 295.3 302.7 307.2 310.1 310.8 310.1 Net disposable income
Use of income account
Net disposable income 6,884.3 7,225.6 7,599.7 7,680.2 7,717.1 7,697.7 7,615.7 7,526.8 Final consumption expenditure Individual consumption expenditure Collective consumption expenditure Adjustment for the change in the net equity of households in pension fund reserves 61.0 63.1 59.9 62.4 63.7 64.2 64.8 64.6 Net saving
Capital account
Net saving 528.9 594.3 708.2 635.8 598.2 540.9 450.9 369.2 Gross capital formation Gross fixed capital formation Changes in inventories and acquisitions less disposals of valuables Consumption of fixed capital 1,186.7 1,247.2 1,315.2 1,347.5 1,363.9 1,378.2 1,390.3 1,400.0 Acquisitions less disposals of non-produced non-financial assets Capital transfers 196.8 184.5 165.1 174.6 177.0 175.7 170.6 179.0 Capital taxes 24.4 22.5 24.3 23.9 24.1 23.6 23.5 28.6 Other capital transfers 172.4 162.0 140.8 150.8 152.9 152.1 147.1 150.4 Net lending (+)/net borrowing (-) (from capital account) Sources: ECB and Eurostat.2) Gross domestic product is equal to the gross value added of all domestic sectors plus net taxes (i.e. taxes less subsidies) on products.

S 32ECB
Monthly Bulletin
January 2010
3.3 Households (EUR billions; four-quarter cumulated flows; outstanding amounts at end of period)
2007 Q3- 2007 Q4- 2008 Q1- 2008 Q2- 2008 Q3-2005 2006 2007 2008 Q2 2008 Q3 2008 Q4 2009 Q1 2009 Q2
Income, saving and changes in net worth
Compensation of employees (+) 3,914.4 4,077.6 4,264.0 4,365.4 4,411.6 4,447.0 4,453.2 4,449.4 Gross operating surplus and mixed income (+) 1,332.8 1,409.6 1,492.9 1,524.8 1,538.7 1,544.8 1,539.4 1,529.5 Interest receivable (+) 227.0 262.5 306.1 328.4 338.2 338.6 326.3 302.8 Interest payable (-) 130.7 163.9 209.6 227.1 234.1 232.9 217.2 192.6 Other property income receivable (+) 722.7 771.5 808.8 826.3 830.2 819.1 814.1 791.4 Other property income payable (-) 9.5 9.8 9.9 9.9 9.9 9.8 10.0 9.9 Current taxes on income and wealth (-) 741.7 794.1 852.7 882.4 889.4 891.8 889.2 876.2 Net social contributions (-) 1,473.8 1,536.5 1,591.6 1,623.4 1,640.9 1,655.9 1,664.7 1,666.9 Net social benefits (+) 1,492.6 1,539.7 1,582.5 1,612.6 1,633.3 1,651.2 1,674.9 1,703.5 Net current transfers receivable (+) 66.5 66.5 69.1 70.6 70.2 71.1 72.4 74.7 = Gross disposable income 5,400.1 5,623.2 5,859.4 5,985.3 6,047.9 6,081.3 6,099.1 6,105.7 Final consumption expenditure (-) 4,691.4 4,898.4 5,088.0 5,195.4 5,249.2 5,263.4 5,245.6 5,220.3 Changes in net worth in pension funds (+) 60.6 62.7 59.5 61.9 63.2 63.8 64.3 64.1 = Gross saving 769.4 787.5 830.8 851.9 862.0 881.7 917.8 949.5 Consumption of fixed capital (-) 319.9 338.6 359.0 368.7 373.1 376.4 379.2 381.6 Net capital transfers receivable (+) 24.1 18.9 11.9 14.2 14.8 15.7 15.4 17.3 Other changes in net worth 1) (+) 524.3 563.8 45.4 -1,150.4 -1,321.4 -1,768.7 -1,361.8 -752.7 = Changes in net worth 1) 997.9 1,031.7 529.0 -653.0 -817.9 -1,247.8 -807.8 -167.5
Investment, financing and changes in net worth
Net acquisition of non-financial assets (+) 546.9 601.5 638.9 644.6 644.2 633.0 615.1 591.9 Consumption of fixed capital (-) 319.9 338.6 359.0 368.7 373.1 376.4 379.2 381.6 Main items of financial investment (+) Short-term assets 206.4 307.5 425.9 426.9 433.0 440.8 384.5 283.4 Currency and deposits 246.9 284.3 349.8 387.6 392.4 437.0 397.6 335.4 Money market fund shares -20.2 0.9 40.0 10.5 13.5 -9.1 -4.0 -24.9 Debt securities 2) -20.3 22.2 36.0 28.7 27.1 12.9 -9.1 -27.0 Long-term assets 422.9 364.3 160.6 109.0 61.9 77.0 118.5 214.6 Deposits -5.3 -1.2 -29.8 -37.2 -40.0 -32.9 -17.9 10.5 Debt securities -1.7 76.6 13.9 73.8 83.4 72.1 65.2 47.9 Shares and other equity 137.5 -27.6 -86.6 -149.5 -189.5 -137.0 -98.4 -17.8 Quoted and unquoted shares and other equity 71.1 -9.8 -5.7 -24.8 -41.9 -7.9 3.4 30.6 Mutual fund shares 66.4 -17.9 -81.0 -124.7 -147.6 -129.1 -101.8 -48.4 Life insurance and pension fund reserves 292.5 316.5 263.2 221.9 208.0 174.8 169.7 174.1 Main items of financing (-) Loans 397.2 393.5 350.5 287.8 252.2 205.4 147.7 112.1 of which: From euro area MFIs 358.5 355.3 283.7 199.0 183.2 81.6 18.8 9.1 Other changes in financial assets (+) Shares and other equity 443.3 510.7 7.9 -1,007.0 -1,051.3 -1,403.6 -1,090.8 -624.5 Life insurance and pension fund reserves 105.5 50.6 28.1 -127.8 -180.3 -259.3 -203.8 -115.2 Remaining net flows (+) -10.1 -70.9 -22.8 -42.2 -100.0 -153.9 -104.3 -24.0 = Changes in net worth 1) 997.9 1,031.7 529.0 -653.0 -817.9 -1,247.8 -807.8 -167.5
Financial balance sheet
Financial assets (+) Short-term assets 4,482.0 4,748.0 5,212.3 5,488.3 5,546.3 5,724.5 5,792.7 5,798.3 Currency and deposits 4,174.0 4,454.4 4,843.3 5,055.2 5,104.7 5,312.9 5,374.4 5,430.1 Money market fund shares 296.4 257.6 296.0 346.5 348.5 328.0 346.5 312.0 Debt securities 2) 11.6 36.0 72.9 86.6 93.0 83.6 71.7 56.2 Long-term assets 10,994.7 11,966.2 12,112.0 11,173.5 10,843.7 10,371.0 10,148.5 10,609.9 Deposits 1,023.3 1,031.1 966.8 903.6 887.0 890.6 868.0 886.6 Debt securities 1,209.3 1,283.1 1,279.2 1,306.2 1,287.2 1,280.5 1,299.3 1,333.4 Shares and other equity 4,514.7 5,037.4 4,960.3 4,078.7 3,790.5 3,378.7 3,146.7 3,445.9 Quoted and unquoted shares and other equity 3,192.0 3,634.3 3,612.9 2,949.6 2,736.5 2,406.1 2,218.0 2,431.1 Mutual fund shares 1,322.7 1,403.2 1,347.4 1,129.1 1,054.0 972.6 928.7 1,014.8 Life insurance and pension fund reserves 4,247.5 4,614.5 4,905.7 4,885.1 4,878.8 4,821.2 4,834.5 4,943.9 Remaining net assets (+) 95.2 72.2 74.2 49.0 67.4 37.8 29.0 51.7 Liabilities (-) Loans 4,788.1 5,180.0 5,512.6 5,628.4 5,683.8 5,723.1 5,716.4 5,746.9 of which: From euro area MFIs 4,201.0 4,553.1 4,825.5 4,887.7 4,938.7 4,901.9 4,879.5 4,899.9 = Net financial wealth 10,783.9 11,606.3 11,885.9 11,082.5 10,773.4 10,410.1 10,253.8 10,713.0
Sources: ECB and Eurostat.1) Excluding changes in net worth which are due to other changes in non-financial assets, such as revaluations of residential property.2) Securities issued by MFIs with a maturity of less than two years and securities issued by other sectors with a maturity of less than one year.

S 33ECB
Monthly Bulletin
January 2010
EURO AREASTATISTICS
Euro area
accounts
3.4 Non-financial corporations (EUR billions; four-quarter cumulated flows; outstanding amounts at end of period)
2007 Q3- 2007 Q4- 2008 Q1- 2008 Q2- 2008 Q3-2005 2006 2007 2008 Q2 2008 Q3 2008 Q4 2009 Q1 2009 Q2
Income and saving
Gross value added (basic prices) (+) 4,178.2 4,387.2 4,635.4 4,739.5 4,777.6 4,781.9 4,724.9 4,644.5 Compensation of employees (-) 2,479.0 2,592.9 2,720.8 2,789.4 2,820.4 2,841.9 2,838.5 2,828.6 Other taxes less subsidies on production (-) 73.1 75.2 80.6 80.9 81.8 79.1 77.6 73.7 = Gross operating surplus (+) 1,626.2 1,719.2 1,833.9 1,869.2 1,875.4 1,860.9 1,808.8 1,742.1 Consumption of fixed capital (-) 672.7 704.8 741.9 759.6 768.8 777.3 784.6 790.2 = Net operating surplus (+) 953.5 1,014.4 1,092.0 1,109.6 1,106.6 1,083.5 1,024.2 951.9 Property income receivable (+) 440.2 508.5 581.8 598.7 602.3 599.7 582.2 557.8 Interest receivable 141.1 169.7 199.0 219.3 225.9 227.9 218.2 203.6 Other property income receivable 299.1 338.8 382.8 379.4 376.4 371.7 364.1 354.2 Interest and rents payable (-) 237.3 284.6 346.2 382.1 397.1 403.8 386.2 356.4 = Net entrepreneurial income (+) 1,156.4 1,238.3 1,327.6 1,326.2 1,311.7 1,279.4 1,220.2 1,153.3 Distributed income (-) 887.7 961.5 1,016.5 1,050.5 1,064.6 1,059.5 1,055.0 1,024.7 Taxes on income and wealth payable (-) 149.1 190.0 211.1 215.3 212.2 195.2 188.9 169.4 Social contributions receivable (+) 72.8 74.9 64.3 64.1 64.9 65.4 65.6 66.2 Social benefits payable (-) 60.7 60.6 61.7 62.4 62.7 62.9 63.0 63.1 Other net transfers (-) 61.7 66.0 57.0 59.6 59.8 60.0 60.1 61.3 = Net saving 70.1 35.1 45.5 2.5 -22.7 -32.8 -81.3 -99.1
Investment, financing and saving
Net acquisition of non-financial assets (+) 256.4 313.6 367.7 371.7 376.8 367.6 313.0 232.7 Gross fixed capital formation (+) 920.7 993.9 1,084.2 1,111.1 1,123.6 1,109.8 1,073.1 1,022.2 Consumption of fixed capital (-) 672.7 704.8 741.9 759.6 768.8 777.3 784.6 790.2 Net acquisition of other non-financial assets (+) 8.4 24.5 25.4 20.2 22.0 35.1 24.6 0.7 Main items of financial investment (+) Short-term assets 128.6 160.3 158.9 119.6 93.5 49.4 -37.4 -18.1 Currency and deposits 113.7 146.3 154.5 114.2 89.4 15.6 -5.3 9.8 Money market fund shares 8.3 2.5 -19.1 -10.1 6.6 30.6 27.7 33.0 Debt securities 1) 6.6 11.5 23.5 15.5 -2.5 3.2 -59.8 -60.9 Long-term assets 393.5 489.5 518.7 522.6 544.2 631.3 644.3 536.3 Deposits 34.2 35.7 28.4 -19.7 3.1 9.4 14.0 29.4 Debt securities -34.9 5.9 -27.4 -80.0 -44.3 -25.3 30.3 -5.9 Shares and other equity 255.9 265.5 346.4 380.0 339.1 332.9 326.3 281.7 Other (mainly intercompany loans) 138.3 182.5 171.2 242.2 246.3 314.4 273.7 231.0 Remaining net assets (+) 83.7 156.3 211.5 63.7 -9.4 -59.8 -149.8 -120.1 Main items of financing (-) Debt 440.3 750.3 787.7 743.5 760.6 692.5 579.6 393.7 of which: Loans from euro area MFIs 271.8 453.1 556.8 543.1 495.0 400.0 273.0 119.3 of which: Debt securities 13.8 41.8 37.3 12.3 41.7 55.1 68.4 82.9 Shares and other equity 291.3 262.2 355.6 259.4 191.0 248.5 189.8 255.3 Quoted shares 104.1 42.4 42.9 -12.1 -29.7 2.2 12.1 45.2 Unquoted shares and other equity 187.2 219.9 312.6 271.5 220.7 246.3 177.8 210.0 Net capital transfers receivable (-) 60.4 72.1 68.8 75.7 79.0 78.3 79.3 76.9 = Net saving 70.1 35.1 45.5 2.5 -22.7 -32.8 -81.3 -99.1
Financial balance sheet
Financial assets Short-term assets 1,505.2 1,670.9 1,808.4 1,837.7 1,851.4 1,869.7 1,849.6 1,882.2 Currency and deposits 1,229.3 1,367.2 1,507.6 1,521.7 1,536.6 1,540.9 1,510.4 1,550.5 Money market fund shares 176.5 184.8 161.0 182.2 182.8 187.8 210.5 213.7 Debt securities 1) 99.4 118.8 139.8 133.8 132.0 141.0 128.7 118.0 Long-term assets 8,634.3 10,024.2 10,744.1 9,903.2 9,634.1 8,871.6 8,628.8 9,009.8 Deposits 109.5 147.7 200.4 169.8 192.0 206.6 196.4 193.3 Debt securities 284.5 284.2 252.4 188.2 192.4 208.8 198.8 148.9 Shares and other equity 6,350.0 7,533.7 8,032.9 7,125.0 6,771.0 5,907.2 5,602.4 6,025.9 Other (mainly intercompany loans) 1,890.4 2,058.5 2,258.4 2,420.1 2,478.6 2,548.9 2,631.3 2,641.7 Remaining net assets 407.8 453.3 606.9 542.6 578.6 578.1 515.0 569.9 Liabilities Debt 7,046.1 7,771.6 8,518.4 8,900.5 9,088.0 9,229.5 9,326.2 9,362.3 of which: Loans from euro area MFIs 3,527.9 3,980.9 4,525.1 4,764.1 4,853.6 4,918.8 4,902.9 4,874.8 of which: Debt securities 675.4 695.1 692.4 698.7 721.4 745.9 790.3 832.7 Shares and other equity 10,994.5 12,966.9 14,011.7 12,209.5 11,427.7 10,300.7 9,621.7 10,327.7 Quoted shares 3,711.1 4,491.5 5,010.2 4,000.1 3,454.4 2,864.2 2,514.0 2,843.1 Unquoted shares and other equity 7,283.5 8,475.3 9,001.5 8,209.4 7,973.3 7,436.5 7,107.7 7,484.6Sources: ECB and Eurostat.1) Securities issued by MFIs with a maturity of less than two years and securities issued by other sectors with a maturity of less than one year.

S 34ECB
Monthly Bulletin
January 2010
3.5 Insurance corporations and pension funds (EUR billions; four-quarter cumulated flows; outstanding amounts at end of period)
2007 Q3- 2007 Q4- 2008 Q1- 2008 Q2- 2008 Q3-2005 2006 2007 2008 Q2 2008 Q3 2008 Q4 2009 Q1 2009 Q2
Financial account, financial transactions
Main items of financial investment (+) Short-term assets 25.5 67.4 92.3 105.8 90.9 107.0 55.8 39.0 Currency and deposits 7.2 10.6 6.4 35.2 32.4 57.0 18.2 12.5 Money market fund shares -0.5 3.6 3.1 14.3 21.7 20.3 16.8 9.4 Debt securities 1) 18.9 53.3 82.8 56.2 36.8 29.8 20.8 17.1 Long-term assets 284.6 319.2 202.3 144.9 119.7 101.9 95.2 129.9 Deposits 17.4 76.9 47.8 13.5 -0.4 0.0 10.1 10.5 Debt securities 132.9 129.3 77.0 70.6 80.7 65.8 80.6 37.8 Loans -3.7 2.7 -8.7 11.9 13.5 23.2 0.6 15.2 Quoted shares 30.7 -3.4 -2.2 -2.1 -10.9 -11.5 -8.2 -10.3 Unquoted shares and other equity 19.9 28.2 25.3 22.1 22.9 14.9 10.8 7.7 Mutual fund shares 87.5 85.4 63.0 28.7 13.9 9.4 1.4 69.1 Remaining net assets (+) 2.7 3.4 -34.7 -18.6 1.7 30.8 0.6 25.6 Main items of financing (-) Debt securities -0.4 5.7 3.9 5.1 5.4 9.3 9.9 7.0 Loans 17.3 44.8 6.7 3.5 -7.4 22.2 -10.4 6.3 Shares and other equity 10.6 11.6 3.1 -3.1 -8.7 -1.4 0.9 0.8 Insurance technical reserves 335.2 319.9 279.8 246.5 233.1 191.6 168.6 163.7 Net equity of households in life insurance and pension fund reserves 291.6 313.6 277.8 236.5 217.8 177.1 160.4 157.5 Prepayments of insurance premiums and reserves for outstanding claims 43.6 6.2 2.0 10.0 15.4 14.5 8.2 6.3 = Changes in net financial worth due to transactions -49.9 8.0 -33.6 -20.1 -10.1 18.1 -17.4 16.5
Other changes account
Other changes in financial assets (+) Shares and other equity 190.5 182.0 1.3 -342.0 -415.9 -549.8 -432.7 -319.7 Other net assets 82.0 -37.1 -56.7 -16.5 -7.9 32.2 9.3 74.9 Other changes in liabilities (-) Shares and other equity 117.9 37.0 -37.6 -150.4 -146.4 -185.1 -188.3 -121.4 Insurance technical reserves 137.7 55.3 26.8 -128.3 -183.3 -260.5 -205.9 -130.7 Net equity of households in life insurance and pension fund reserves 146.8 51.8 26.9 -124.2 -176.4 -252.2 -199.8 -126.3 Prepayments of insurance premiums and reserves for outstanding claims -9.1 3.5 -0.1 -4.1 -6.9 -8.3 -6.1 -4.4 = Other changes in net financial worth 16.8 52.6 -44.6 -79.7 -94.2 -71.9 -29.2 7.3
Financial balance sheet
Financial assets (+) Short-term assets 437.3 512.9 598.3 665.3 670.2 709.8 719.8 708.2 Currency and deposits 146.6 156.6 163.1 180.5 188.4 222.9 214.7 198.5 Money market fund shares 75.6 81.6 82.5 94.8 99.0 100.2 113.0 103.7 Debt securities 1) 215.0 274.7 352.7 390.0 382.8 386.6 392.1 406.0 Long-term assets 4,623.6 5,064.0 5,214.5 5,020.0 4,954.1 4,773.6 4,725.4 4,855.3 Deposits 523.7 601.3 647.0 649.4 644.9 646.1 656.4 659.3 Debt securities 1,778.2 1,851.7 1,880.9 1,914.8 1,960.3 1,950.9 1,988.2 1,976.4 Loans 356.1 355.6 341.5 355.5 356.7 366.0 367.8 371.9 Quoted shares 653.2 736.4 728.3 598.0 538.4 427.2 395.2 439.5 Unquoted shares and other equity 404.7 483.6 513.4 459.3 444.6 420.2 391.2 393.1 Mutual fund shares 907.7 1,035.5 1,103.4 1,043.1 1,009.1 963.3 926.7 1,015.1 Remaining net assets (+) 180.7 205.2 165.7 171.6 180.5 216.2 215.4 242.0 Liabilities (-) Debt securities 21.3 35.9 35.2 36.5 36.7 43.2 42.2 40.0 Loans 142.1 183.7 186.9 204.3 195.5 209.2 214.7 213.0 Shares and other equity 618.8 667.4 632.8 535.5 514.9 446.3 387.4 414.9 Insurance technical reserves 4,559.9 4,935.0 5,241.7 5,242.8 5,239.8 5,172.8 5,184.0 5,275.8 Net equity of households in life insurance and pension fund reserves 3,892.2 4,257.6 4,562.4 4,554.2 4,550.4 4,487.3 4,495.6 4,585.4 Prepayments of insurance premiums and reserves for outstanding claims 667.6 677.4 679.3 688.5 689.5 685.5 688.4 690.4 = Net financial wealth -100.5 -39.9 -118.1 -162.2 -182.1 -172.0 -167.6 -138.4
Source: ECB.1) Securities issued by MFIs with a maturity of less than two years and securities issued by other sectors with a maturity of less than one year.

S 35ECB
Monthly Bulletin
January 2010
4FINANCIAL MARKETS
4.1 Securities other than shares by original maturity, residency of the issuer and currency (EUR billions and period growth rates; seasonally adjusted; transactions during the month and end-of-period outstanding amounts; nominal values)
Total
By euro area residents
Total in euro 1) In euro In all currencies
Outstanding Gross issues Net issues Outstanding Gross issues Net issues Outstanding Gross issues Net issues Annual Seasonally adjusted 2)
amounts amounts amounts growth rates6-month
Net issues growth rates1 2 3 4 5 6 7 8 9 10 11 12
2008 Nov. 13,952.9 1,421.9 217.9 11,763.7 1,369.3 227.3 13,095.9 1,436.7 212.6 8.1 192.0 11.0 Dec. 14,139.0 1,538.6 189.6 11,916.4 1,450.0 156.4 13,169.1 1,527.2 143.3 9.5 229.5 13.12009 Jan. 14,237.7 1,500.6 94.1 12,055.8 1,451.3 135.7 13,369.9 1,530.1 145.1 10.1 103.1 13.0 Feb. 14,430.9 1,260.0 190.9 12,242.9 1,200.8 184.9 13,574.4 1,286.3 204.5 11.0 157.2 13.1 Mar. 14,603.0 1,318.0 170.5 12,379.0 1,229.8 134.7 13,680.1 1,318.6 150.0 11.9 134.5 15.2 Apr. 14,680.2 1,233.6 79.9 12,479.1 1,167.3 102.8 13,791.8 1,247.8 109.3 12.1 91.5 14.6 May 14,888.3 1,159.9 208.0 12,653.3 1,070.6 174.2 13,934.7 1,151.0 173.0 12.1 113.1 13.1 June 14,977.9 1,088.8 89.1 12,713.2 1,006.6 59.2 13,999.5 1,086.7 68.8 11.9 87.4 10.6 July 15,006.8 1,124.2 31.6 12,766.1 1,069.5 55.8 14,063.2 1,148.7 67.4 11.8 101.2 10.5 Aug. 15,055.6 882.3 47.8 12,796.1 826.4 29.0 14,083.5 892.5 22.3 11.0 60.4 8.9 Sep. 15,163.6 965.3 106.9 12,876.8 882.1 79.6 14,155.6 965.8 83.7 12.0 145.1 9.0 Oct. . . . 12,900.4 900.8 24.2 14,179.3 972.1 27.0 11.0 1.3 7.5 Nov. . . . 12,955.7 843.4 55.5 14,233.4 903.9 59.7 9.6 35.7 6.3
Long-term
2008 Nov. 12,392.1 275.2 174.1 10,323.7 253.6 174.8 11,483.7 262.5 165.1 6.2 137.4 8.0 Dec. 12,571.1 363.3 180.2 10,495.1 328.8 173.0 11,578.5 340.6 153.9 7.3 165.7 9.72009 Jan. 12,647.4 291.6 74.1 10,584.6 276.7 88.3 11,712.7 300.2 88.9 8.1 115.4 10.5 Feb. 12,817.8 301.4 169.3 10,747.0 270.4 161.4 11,886.2 297.5 173.6 9.2 136.4 10.6 Mar. 12,998.2 319.8 150.6 10,917.3 280.2 140.6 12,021.0 301.8 141.7 10.3 139.0 13.2 Apr. 13,074.5 292.2 79.5 10,985.7 257.4 71.6 12,099.2 276.2 75.0 10.3 71.7 14.0 May 13,277.7 339.1 204.3 11,155.8 281.3 171.4 12,250.1 301.6 175.5 10.6 112.8 13.3 June 13,398.3 313.1 119.0 11,264.5 274.5 106.7 12,377.9 308.3 126.9 10.8 99.7 11.9 July 13,421.9 269.3 25.9 11,294.6 247.9 32.5 12,416.3 272.8 41.4 10.8 82.7 11.2 Aug. 13,478.4 130.7 56.3 11,336.1 108.1 41.3 12,456.3 121.0 45.4 10.5 93.6 10.3 Sep. 13,553.4 223.5 72.6 11,413.0 196.9 74.6 12,521.9 222.3 74.7 11.5 120.3 9.9 Oct. . . . 11,470.5 215.3 55.9 12,575.8 234.6 57.8 11.7 54.9 9.6 Nov. . . . 11,551.5 176.6 80.0 12,653.8 191.6 83.6 10.8 49.9 8.4
C15 Total outstanding amounts and gross issues of securities other than shares issued by euro area residents(EUR billions)
2000
4000
6000
8000
10000
12000
14000
16000
18000
1994 1995 1996 1997 1998 1999 2000 2001 2002 2003 2004 2005 2006 2007 2008 20090
200
400
600
800
1000
1200
1400
1600
total gross issues (right-hand scale)total outstanding amounts (left-hand scale)outstanding amounts in euro (left-hand scale)
Sources: ECB and BIS (for issues by non-euro area residents).1) Total euro-denominated securities other than shares issued by euro area residents and non-euro area residents.2) For details of the calculation of the growth rates, see the Technical Notes. The six-month growth rates have been annualised.

S 36ECB
Monthly Bulletin
January 2010
4.2 Securities other than shares issued by euro area residents, by sector of the issuer and instrument type (EUR billions ; transactions during the month and end-of-period outstanding amounts; nominal values)
1. Outstanding amounts and gross issues
Total
Outstanding amounts Gross issues 1)
Total MFIs Non-MFI corporations General government Total MFIs Non-MFI corporations General government
(including (includingEurosystem) Financial Non-financial Central Other Eurosystem) Financial Non-financial Central Other
corporations corporations government general corporations corporations government generalother than government other than government
MFIs MFIs1 2 3 4 5 6 7 8 9 10 11 12
2007 12,066 5,048 1,505 653 4,534 327 1,138 841 59 109 116 122008 13,169 5,267 1,924 701 4,937 340 1,177 816 74 100 162 242008 Q4 13,169 5,267 1,924 701 4,937 340 1,486 1,006 136 107 209 282009 Q1 13,680 5,390 2,032 723 5,191 343 1,378 922 78 92 250 35 Q2 13,999 5,431 2,112 757 5,348 351 1,162 749 62 90 241 20 Q3 14,156 5,424 2,137 785 5,452 358 1,002 651 43 84 212 122009 Aug. 14,083 5,437 2,141 768 5,383 354 892 628 27 74 155 8 Sep. 14,156 5,424 2,137 785 5,452 358 966 610 30 83 230 14 Oct. 14,179 5,375 2,149 793 5,498 363 972 599 44 79 229 21 Nov. 14,233 5,382 2,159 795 5,532 366 904 590 34 69 191 20
Short-term
2007 1,287 788 36 100 345 18 946 754 18 101 64 92008 1,591 822 62 116 566 25 961 722 26 92 101 192008 Q4 1,591 822 62 116 566 25 1,220 911 38 96 152 232009 Q1 1,659 839 42 98 663 18 1,078 806 17 74 154 27 Q2 1,622 785 37 85 699 16 866 631 14 69 139 13 Q3 1,634 751 31 82 752 19 797 569 10 71 139 82009 Aug. 1,627 752 34 84 742 16 771 567 10 72 117 5 Sep. 1,634 751 31 82 752 19 743 525 10 63 134 11 Oct. 1,604 710 35 80 760 18 738 513 14 62 134 13 Nov. 1,580 706 34 75 746 19 712 515 9 58 115 15
Long-term 2)
2007 10,779 4,260 1,468 553 4,189 309 191 86 41 8 52 32008 11,579 4,445 1,862 585 4,371 316 216 95 48 8 61 42008 Q4 11,579 4,445 1,862 585 4,371 316 266 95 98 12 57 52009 Q1 12,021 4,552 1,991 625 4,529 325 300 116 61 18 96 8 Q2 12,378 4,645 2,075 672 4,650 335 295 118 48 21 102 7 Q3 12,522 4,673 2,106 703 4,700 339 205 82 33 14 72 42009 Aug. 12,456 4,684 2,108 685 4,641 339 121 61 17 2 38 3 Sep. 12,522 4,673 2,106 703 4,700 339 222 85 19 20 95 2 Oct. 12,576 4,665 2,114 713 4,739 345 235 85 29 17 95 8 Nov. 12,654 4,676 2,124 721 4,786 347 192 75 25 11 76 5
of which: Long-term fixed rate
2007 7,324 2,264 594 419 3,797 250 107 44 10 5 45 32008 7,613 2,326 635 448 3,955 250 120 49 9 6 53 32008 Q4 7,613 2,326 635 448 3,955 250 121 42 13 10 53 22009 Q1 7,933 2,393 702 491 4,094 253 208 72 27 18 86 5 Q2 8,248 2,492 747 539 4,211 260 210 72 23 20 90 5 Q3 8,375 2,527 768 569 4,251 259 139 49 14 13 61 32009 Aug. 8,297 2,521 764 551 4,201 260 65 33 4 1 26 1 Sep. 8,375 2,527 768 569 4,251 259 174 55 13 20 86 1 Oct. 8,436 2,535 768 580 4,289 264 168 56 8 16 83 5 Nov. 8,504 2,549 772 589 4,329 265 140 47 11 11 68 2
of which: Long-term variable rate
2007 3,001 1,621 856 123 342 58 69 31 30 3 4 02008 3,476 1,725 1,198 127 363 64 81 36 38 1 5 12008 Q4 3,476 1,725 1,198 127 363 64 129 39 83 1 3 22009 Q1 3,585 1,757 1,264 124 369 70 75 32 34 0 5 3 Q2 3,614 1,740 1,302 124 374 74 65 30 24 1 7 2 Q3 3,611 1,725 1,313 123 372 79 48 21 18 0 7 12009 Aug. 3,634 1,747 1,318 123 368 78 40 17 12 0 9 2 Sep. 3,611 1,725 1,313 123 372 79 27 16 5 1 5 1 Oct. 3,602 1,710 1,321 123 369 80 57 24 21 1 8 3 Nov. 3,609 1,707 1,326 122 373 81 42 21 13 0 5 2
Source: ECB.1) Monthly data on gross issues refer to transactions during the month. For the purposes of comparison, quarterly and annual data refer to the respective monthly averages.2) The residual difference between total long-term debt securities and fixed and variable rate long-term debt securities consists of zero coupon bonds and revaluation effects.

S 37ECB
Monthly Bulletin
January 2010
EURO AREASTATISTICS
Financial
markets
4.2 Securities other than shares issued by euro area residents, by sector of the issuer and instrument type (EUR billions unless otherwise indicated; transactions during the period; nominal values)
2. Net issues
Total
Non-seasonally adjusted 1) Seasonally adjusted 1)
Total MFIs Non-MFI corporations General government Total MFIs Non-MFI corporations General government
(including (includingEurosystem) Financial Non-financial Central Other Eurosystem) Financial Non-financial Central Other
corporations corporations government general corporations corporations government generalother than government other than government
MFIs MFIs1 2 3 4 5 6 7 8 9 10 11 12
2007 83.5 40.7 27.6 4.2 9.9 1.2 83.7 41.3 27.0 4.3 10.0 1.12008 95.1 23.1 34.9 4.2 31.7 1.1 95.8 23.3 34.1 4.4 33.1 1.02008 Q4 166.7 11.3 80.7 6.2 63.0 5.5 179.9 21.4 55.7 9.3 90.6 2.92009 Q1 166.6 39.7 35.1 7.0 83.9 0.9 131.6 20.3 45.1 5.2 58.7 2.4 Q2 117.1 21.7 27.3 11.5 53.8 2.8 97.3 21.1 27.1 7.3 39.0 2.8 Q3 57.8 0.2 9.9 10.1 35.4 2.3 102.2 9.7 29.1 12.8 47.1 3.52009 Aug. 22.3 -9.6 -4.3 -1.7 37.0 0.9 60.4 -0.5 7.3 2.8 48.9 1.9 Sep. 83.7 -7.7 -1.5 18.1 71.1 3.7 145.1 16.0 31.1 21.8 70.3 5.7 Oct. 27.0 -47.9 13.3 8.9 47.3 5.5 1.3 -73.1 -7.7 7.0 71.3 3.9 Nov. 59.7 9.3 10.8 2.8 34.1 2.7 35.7 12.0 1.5 2.3 19.5 0.3
Long-term
2007 61.7 23.9 26.9 2.4 7.8 0.7 61.3 24.1 26.4 2.4 7.7 0.72008 65.7 16.2 32.8 2.8 13.3 0.6 65.0 16.3 32.0 2.9 13.2 0.52008 Q4 116.0 2.8 80.9 4.5 26.2 1.6 111.4 12.4 56.3 4.8 37.0 0.82009 Q1 134.7 24.9 41.9 12.9 52.0 3.0 130.3 16.2 52.0 14.4 44.7 2.9 Q2 125.8 36.1 28.8 15.9 41.3 3.7 94.8 25.4 27.9 12.2 25.7 3.5 Q3 53.9 12.1 12.0 11.0 17.4 1.4 98.9 22.3 31.4 12.9 29.8 2.52009 Aug. 45.4 21.2 -3.2 -0.3 25.5 2.1 93.6 37.5 10.1 2.7 40.4 2.9 Sep. 74.7 -8.1 1.4 19.8 61.0 0.7 120.3 7.0 31.6 21.8 57.2 2.6 Oct. 57.8 -6.2 8.6 10.6 39.2 5.6 54.9 -9.1 -12.5 10.7 61.4 4.4 Nov. 83.6 13.4 11.6 8.2 47.8 2.6 49.9 17.9 2.2 7.6 22.1 0.2
C16 Net issues of securities other than shares: seasonally adjusted and non-seasonally adjusted(EUR billions; transactions during the month; nominal values)
-100
-50
0
50
100
150
200
250
2003 2004 2005 2006 2007 2008 2009-100
-50
0
50
100
150
200
250
net issuesseasonally adjusted net issues
Source: ECB.1) Monthly data on net issues refer to transactions during the month. For the purposes of comparison, quarterly and annual data refer to the respective monthly averages.

S 38ECB
Monthly Bulletin
January 2010
4.3 Growth rates of securities other than shares issued by euro area residents 1) (percentage changes)
Total
Annual growth rates (non-seasonally adjusted) 6-month seasonally adjusted growth rates
Total MFIs Non-MFI corporations General government Total MFIs Non-MFI corporations General government
(including (includingEurosystem) Financial Non-financial Central Other Eurosystem) Financial Non-financial Central Other
corporations corporations government general corporations corporations government generalother than government other than government
MFIs MFIs1 2 3 4 5 6 7 8 9 10 11 12
2008 Nov. 8.1 5.7 23.8 4.9 6.7 2.8 11.0 5.1 30.4 5.1 12.5 7.1 Dec. 9.5 5.5 27.8 7.8 8.4 4.1 13.1 4.8 35.4 12.9 15.5 9.82009 Jan. 10.1 5.3 30.0 7.1 9.6 5.5 13.0 3.6 37.9 12.3 16.0 8.6 Feb. 11.0 6.3 32.1 8.1 10.1 6.5 13.1 3.8 36.3 13.3 16.0 7.2 Mar. 11.9 6.4 33.2 9.1 11.6 7.9 15.2 4.8 38.1 13.0 19.8 10.0 Apr. 12.1 6.3 33.4 10.1 11.7 10.6 14.6 6.0 41.6 15.3 15.1 11.3 May 12.1 5.5 32.9 10.2 12.8 9.5 13.1 5.8 35.3 15.9 13.0 11.9 June 11.9 4.8 29.7 11.8 13.7 9.6 10.6 4.7 24.2 10.8 12.0 9.6 July 11.8 4.2 30.8 13.2 13.5 9.4 10.5 4.8 24.2 14.3 11.0 10.3 Aug. 11.0 3.5 26.9 12.8 13.4 9.0 8.9 3.1 18.6 12.5 10.7 10.8 Sep. 12.0 4.2 27.2 15.2 14.9 10.6 9.0 3.5 17.4 17.3 10.2 11.3 Oct. 11.0 3.0 26.1 16.1 13.6 10.4 7.5 0.1 12.3 17.2 12.1 9.4 Nov. 9.6 2.5 21.5 15.8 12.0 10.5 6.3 -0.7 9.3 15.7 11.1 9.3
Long-term
2008 Nov. 6.2 4.5 22.4 3.8 3.4 1.3 8.0 4.6 29.2 3.6 5.2 3.0 Dec. 7.3 4.6 26.8 6.1 3.8 2.2 9.7 3.9 35.5 9.7 7.1 4.62009 Jan. 8.1 4.4 30.7 8.3 4.4 3.4 10.5 3.0 42.2 16.1 7.1 4.2 Feb. 9.2 5.1 33.9 10.5 5.1 3.9 10.6 3.0 41.0 19.5 7.4 3.0 Mar. 10.3 5.4 34.8 13.0 6.7 5.8 13.2 3.9 42.9 21.0 11.8 7.3 Apr. 10.3 5.6 34.8 14.8 6.0 8.7 14.0 5.1 46.9 26.0 10.0 11.8 May 10.6 5.2 34.4 16.3 7.2 8.5 13.3 5.7 39.6 30.5 9.1 14.2 June 10.8 4.8 31.7 19.0 8.4 8.4 11.9 5.6 28.0 29.1 9.8 12.6 July 10.8 4.6 33.4 21.2 7.8 8.0 11.2 6.1 25.4 26.6 8.6 12.0 Aug. 10.5 4.8 29.9 20.8 7.8 8.0 10.3 6.7 19.7 22.1 8.3 13.2 Sep. 11.5 5.1 30.2 23.2 9.6 9.3 9.9 6.4 18.8 25.4 7.5 11.4 Oct. 11.7 4.9 28.9 25.2 10.4 10.4 9.6 4.7 13.1 24.4 11.0 9.0 Nov. 10.8 5.0 23.9 26.1 9.6 10.8 8.4 4.3 10.0 21.9 10.1 7.5
C17 Annual growth rates of long-term debt securities, by sector of the issuer, in all currencies combined(annual percentage changes)
0
5
10
15
20
25
30
35
1994 1995 1996 1997 1998 1999 2000 2001 2002 2003 2004 2005 2006 2007 2008 20090
5
10
15
20
25
30
35
general governmentMFIs (including Eurosystem)non-MFI corporations
Source: ECB.1) For details of the calculation of the growth rates, see the Technical Notes. The six-month growth rates have been annualised.

S 39ECB
Monthly Bulletin
January 2010
EURO AREASTATISTICS
Financial
markets
4.3 Growth rates of securities other than shares issued by euro area residents 1) (cont'd) (percentage changes)
In all currencies combined
Long-term fixed rate Long-term variable rate
Total MFIs Non-MFI corporations General government Total MFIs Non-MFI corporations General government
(including (includingEurosystem) Financial Non-financial Central Other Eurosystem) Financial Non-financial Central Other
corporations corporations government general corporations corporations government generalother than government other than government
MFIs MFIs13 14 15 16 17 18 19 20 21 22 23 24
2007 5.1 7.1 17.1 4.0 2.5 6.6 15.8 11.2 37.7 18.6 3.8 -1.82008 3.1 4.9 5.7 4.9 1.5 1.4 12.8 5.6 33.4 7.1 7.6 3.2
2008 Q4 3.2 4.5 4.8 5.3 2.3 -0.8 13.0 5.7 33.8 4.5 3.8 10.32009 Q1 6.1 4.9 13.0 12.5 5.3 1.6 15.8 5.3 44.8 0.6 0.8 11.1 Q2 9.0 6.8 20.3 21.2 7.5 4.8 14.6 3.3 44.1 -1.3 -0.6 19.9 Q3 10.6 7.2 24.7 28.4 9.0 3.9 11.6 1.0 36.6 -3.4 -1.6 25.1
2009 June 10.3 6.9 22.4 25.3 9.1 4.4 12.4 1.3 38.5 -1.3 0.1 23.4 July 10.4 6.7 25.8 28.6 8.6 3.9 12.4 1.5 39.3 -3.2 -2.3 23.7 Aug. 10.5 7.4 24.7 28.2 8.7 3.5 10.6 0.9 34.1 -3.9 -3.8 25.9 Sep. 11.7 8.2 24.6 31.8 10.0 4.4 11.2 0.1 34.7 -5.0 2.9 28.2 Oct. 12.7 8.5 26.0 34.1 11.1 6.4 9.6 -1.1 31.6 -4.5 1.3 26.1 Nov. 12.5 9.4 25.3 35.2 10.1 7.1 7.1 -1.9 23.8 -4.4 1.7 25.8
In euro
2007 4.6 6.4 13.7 2.3 2.7 6.7 15.2 10.4 35.4 18.2 3.9 -2.42008 2.9 4.7 6.1 3.0 1.7 1.3 14.3 6.6 35.1 7.2 7.9 2.0
2008 Q4 3.4 4.7 7.2 3.2 2.5 -1.3 15.4 7.7 36.5 5.2 4.0 9.32009 Q1 6.5 6.1 16.4 9.8 5.6 0.9 18.7 7.9 47.7 0.6 0.9 10.9 Q2 9.6 8.8 23.4 19.5 7.7 4.2 17.3 5.3 47.1 -2.0 -0.7 21.7 Q3 11.3 9.4 26.6 27.4 9.2 3.3 13.8 2.8 39.0 -4.0 -2.4 27.4
2009 June 10.9 8.8 24.5 24.1 9.4 3.8 14.9 3.1 41.5 -2.0 -0.2 25.5 July 11.0 8.8 27.8 27.4 8.9 3.3 14.8 3.4 41.9 -3.7 -3.0 25.9 Aug. 11.2 9.6 26.7 27.5 9.0 2.8 12.6 2.6 36.2 -4.4 -4.9 28.3 Sep. 12.3 10.7 25.8 30.6 10.1 3.7 13.3 2.0 36.6 -5.9 1.7 30.5 Oct. 13.3 11.0 27.2 33.5 11.2 5.7 11.4 0.5 33.1 -5.4 0.0 26.9 Nov. 12.9 11.8 25.6 34.6 10.2 6.8 8.6 -0.6 25.0 -5.1 0.4 25.9
C18 Annual growth rates of short-term debt securities, by sector of the issuer, in all currencies combined(annual percentage changes)
-60
-40
-20
0
20
40
60
80
1994 1995 1996 1997 1998 1999 2000 2001 2002 2003 2004 2005 2006 2007 2008 2009-60
-40
-20
0
20
40
60
80
general governmentMFIs (including Eurosystem)non-MFI corporations
Source: ECB.1) Annual percentage changes for monthly data refer to the end of the month, whereas those for quarterly and yearly data refer to the annual change in the period average. See the Technical Notes for details.

S 40ECB
Monthly Bulletin
January 2010
4.4 Quoted shares issued by euro area residents 1) (EUR billions, unless otherwise indicated; market values)
1. Outstanding amounts and annual growth rates(outstanding amounts as at end of period)
Total MFIs Financial corporations other than MFIs Non-financial corporations
Total Index: Annual Total Annual Total Annual Total AnnualDec. 2001 = 100 growth growth growth growth
rates (%) rates (%) rates (%) rates (%)
1 2 3 4 5 6 7 8 92007 Nov. 6,631.8 104.3 1.4 1,034.6 1.1 578.6 3.3 5,018.6 1.2 Dec. 6,588.7 104.4 1.4 1,019.0 1.2 578.4 2.9 4,991.3 1.22008 Jan. 5,766.2 104.4 1.3 889.8 0.8 497.0 2.8 4,379.4 1.2 Feb. 5,820.8 104.5 1.2 860.1 0.5 492.0 2.6 4,468.7 1.2 Mar. 5,567.1 104.5 1.2 860.5 1.1 501.0 2.5 4,205.6 1.1 Apr. 5,748.0 104.4 1.0 837.2 1.3 519.1 2.4 4,391.7 0.7 May 5,729.4 104.5 0.9 771.0 1.8 496.7 2.5 4,461.7 0.6 June 5,081.0 104.5 0.6 665.3 1.8 435.5 2.4 3,980.3 0.1 July 4,972.7 104.6 0.6 691.6 2.8 427.9 2.5 3,853.2 0.0 Aug. 4,999.3 104.6 0.6 665.5 2.8 438.0 2.7 3,895.7 0.0 Sep. 4,430.0 104.7 0.7 612.2 3.6 381.8 2.6 3,436.1 0.0 Oct. 3,743.8 105.0 0.7 451.9 4.2 280.2 2.8 3,011.8 -0.1 Nov. 3,489.3 105.2 0.9 394.5 5.9 265.1 2.3 2,829.7 -0.2 Dec. 3,482.6 105.4 1.0 377.0 5.8 269.1 3.0 2,836.5 -0.12009 Jan. 3,286.9 105.6 1.1 342.8 7.4 243.9 3.1 2,700.3 -0.1 Feb. 2,922.2 105.6 1.1 275.0 7.3 192.4 3.1 2,454.8 -0.1 Mar. 3,010.5 106.1 1.5 314.5 8.0 209.7 3.2 2,486.4 0.4 Apr. 3,435.6 106.2 1.7 412.8 8.2 256.4 3.3 2,766.4 0.5 May 3,580.6 106.5 2.0 453.2 8.9 262.3 3.1 2,865.1 0.8 June 3,530.7 107.3 2.7 448.5 9.8 257.9 4.2 2,824.3 1.5 July 3,815.2 107.5 2.7 509.4 9.5 278.3 3.9 3,027.5 1.6 Aug. 4,044.3 107.5 2.7 572.4 9.4 301.0 3.5 3,171.0 1.7 Sep. 4,213.3 107.6 2.8 593.0 8.4 327.6 3.6 3,292.7 1.9 Oct. 4,085.6 107.8 2.7 568.1 9.0 322.1 0.8 3,195.4 1.9 Nov. 4,098.6 108.1 2.7 567.6 8.8 313.5 1.7 3,217.5 1.9
C19 Annual growth rates for quoted shares issued by euro area residents(annual percentage changes)
-4.0
-2.0
0.0
2.0
4.0
6.0
8.0
10.0
12.0
2000 2001 2002 2003 2004 2005 2006 2007 2008 2009-4.0
-2.0
0.0
2.0
4.0
6.0
8.0
10.0
12.0
MFIsfinancial corporations other than MFIsnon-financial corporations
Source: ECB.1) For details of the calculation of the index and the growth rates, see the Technical Notes.

S 41ECB
Monthly Bulletin
January 2010
EURO AREASTATISTICS
Financial
markets
4.4 Quoted shares issued by euro area residents 1) (EUR billions; market values)
2. Transactions during the month
Total MFIs Financial corporations other than MFIs Non-financial corporations
Gross issues Redemptions Net issues Gross issues Redemptions Net issues Gross issues Redemptions Net issues Gross issues Redemptions Net issues
1 2 3 4 5 6 7 8 9 10 11 122007 Nov. 6.8 3.3 3.5 0.9 0.0 0.9 1.0 1.3 -0.3 4.9 2.0 2.9 Dec. 9.5 4.6 4.9 0.9 0.0 0.9 0.7 2.2 -1.5 7.9 2.5 5.52008 Jan. 3.6 1.4 2.3 0.1 0.0 0.1 0.4 0.7 -0.2 3.1 0.7 2.4 Feb. 2.8 1.9 0.9 1.0 0.0 1.0 0.1 0.3 -0.2 1.7 1.6 0.1 Mar. 6.4 6.0 0.3 5.9 0.0 5.9 0.0 0.5 -0.4 0.4 5.6 -5.1 Apr. 2.0 3.0 -0.9 1.1 0.0 1.1 0.1 0.5 -0.3 0.8 2.5 -1.7 May 7.3 6.0 1.4 4.1 0.1 4.1 1.5 0.3 1.2 1.7 5.6 -3.9 June 3.9 4.8 -0.9 1.3 0.0 1.3 0.5 0.1 0.4 2.1 4.7 -2.6 July 12.7 3.4 9.4 6.7 0.0 6.7 1.5 0.5 1.0 4.5 2.9 1.6 Aug. 1.5 3.0 -1.4 0.3 0.0 0.3 0.1 0.0 0.1 1.1 3.0 -1.9 Sep. 7.8 2.9 5.0 7.0 0.0 7.0 0.0 0.1 -0.1 0.8 2.8 -2.0 Oct. 12.8 0.6 12.2 1.4 0.0 1.4 10.7 0.0 10.7 0.8 0.6 0.1 Nov. 10.6 2.9 7.7 8.4 0.5 8.0 0.5 2.1 -1.6 1.7 0.3 1.4 Dec. 9.3 2.6 6.8 0.0 0.0 0.0 1.3 0.0 1.2 8.0 2.5 5.52009 Jan. 6.3 0.5 5.8 5.7 0.0 5.7 0.1 0.0 0.0 0.5 0.4 0.1 Feb. 0.2 0.9 -0.7 0.0 0.0 0.0 0.0 0.1 -0.1 0.2 0.8 -0.6 Mar. 13.6 0.2 13.4 3.6 0.0 3.6 0.1 0.0 0.1 9.9 0.2 9.7 Apr. 3.7 0.3 3.4 1.2 0.0 1.2 0.1 0.0 0.0 2.4 0.3 2.1 May 11.2 0.3 10.9 4.4 0.0 4.4 0.0 0.0 0.0 6.7 0.3 6.5 June 27.0 2.0 25.0 4.8 0.0 4.8 3.3 0.3 3.0 18.9 1.8 17.2 July 7.2 0.2 7.0 3.0 0.0 3.0 0.0 0.0 0.0 4.1 0.2 3.9 Aug. 3.6 3.3 0.2 0.0 0.0 0.0 1.0 1.9 -0.9 2.6 1.4 1.2 Sep. 5.0 0.3 4.7 0.6 0.0 0.6 0.2 0.0 0.1 4.2 0.2 3.9 Oct. 7.6 0.3 7.4 4.5 0.0 4.5 0.1 0.0 0.1 3.0 0.2 2.8 Nov. 11.4 0.2 11.2 8.8 0.0 8.8 1.0 0.0 1.0 1.6 0.2 1.4
C20 Gross issues of quoted shares by sector of the issuer(EUR billions; transactions during the month; market values)
0
5
10
15
20
25
30
35
40
1999 2000 2001 2002 2003 2004 2005 2006 2007 2008 20090
5
10
15
20
25
30
35
40
non-financial corporationsMFIsfinancial corporations other than MFIs
Source: ECB.1) For details of the calculation of the index and the growth rates, see the Technical Notes.

S 42ECB
Monthly Bulletin
January 2010
4.5 MFI interest rates on euro-denominated deposits from and loans to euro area residents 1) (percentages per annum; outstanding amounts as at end of period, new business as period average, unless otherwise indicated)
1. Interest rates on deposits (new business)
Deposits from households Deposits from non-financial corporations Repos
Overnight 2) With an agreed maturity of: Redeemable at notice of: 2), 3) Overnight 2) With an agreed maturity of:
Up to 1 year Over 1 and Over 2 years Up to 3 months Over 3 months Up to 1 year Over 1 and Over 2 yearsup to 2 years up to 2 years
1 2 3 4 5 6 7 8 9 10 112008 Dec. 1.16 3.75 4.35 3.69 2.95 4.17 1.61 2.87 4.23 4.08 2.632009 Jan. 1.02 3.28 3.90 3.52 2.88 4.08 1.26 2.24 3.81 3.76 2.05 Feb. 0.90 2.62 3.38 3.23 2.49 3.98 1.10 1.61 3.21 3.89 1.55 Mar. 0.80 2.24 2.94 3.07 2.31 3.87 0.93 1.36 2.96 3.30 1.23 Apr. 0.66 2.01 2.69 2.87 2.22 3.75 0.77 1.15 2.64 3.06 1.12 May 0.61 1.89 2.39 2.71 1.98 3.62 0.74 1.08 2.38 3.11 1.02 June 0.56 1.86 2.38 2.57 1.95 3.52 0.63 1.04 2.17 2.58 0.93 July 0.52 1.86 2.41 2.61 1.86 3.38 0.56 0.82 2.47 2.93 0.68 Aug. 0.50 1.72 2.32 2.64 1.64 3.23 0.54 0.71 2.06 2.93 0.57 Sep. 0.49 1.61 2.27 2.52 1.60 3.12 0.52 0.69 2.10 2.74 0.58 Oct. 0.46 1.68 2.11 2.55 1.55 2.97 0.49 0.66 1.99 2.72 0.56 Nov. 0.46 1.67 2.23 2.56 1.52 2.76 0.48 0.70 2.10 2.92 0.58
2. Interest rates on loans to households (new business)
Bank Consumer credit Lending for house purchase Other lending
overdrafts 2) by initial rate fixation By initial rate fixation Annual By initial rate fixation Annual
percentage percentageFloating rate Over 1 Over rate of Floating rate Over 1 Over 5 Over rate of Floating rate Over 1 Over
and up to and up to 5 years charge 4) and up to and up to and up to 10 years charge 4) and up to and up to 5 years1 year 5 years 1 year 5 years 10 years 1 year 5 years
1 2 3 4 5 6 7 8 9 10 11 12 132008 Dec. 10.45 8.16 7.03 8.39 8.48 5.09 5.06 5.10 5.13 5.30 4.99 5.75 5.292009 Jan. 10.14 8.27 7.03 8.63 8.66 4.37 4.77 4.92 5.00 4.86 4.43 5.44 5.23 Feb. 10.15 8.06 6.65 8.49 8.35 3.97 4.54 4.80 4.89 4.60 4.08 5.03 5.16 Mar. 9.94 7.51 6.51 8.31 8.05 3.65 4.34 4.61 4.72 4.38 3.83 4.72 5.05 Apr. 9.71 7.43 6.50 8.27 8.05 3.38 4.21 4.55 4.68 4.22 3.54 4.69 4.90 May 9.62 7.87 6.44 8.17 8.08 3.22 4.15 4.50 4.58 4.12 3.60 4.71 4.90 June 9.55 7.30 6.36 8.03 7.83 3.12 4.12 4.51 4.58 4.07 3.54 4.76 4.95 July 9.31 7.67 6.49 8.04 8.02 3.03 4.09 4.54 4.54 4.02 3.35 4.77 4.91 Aug. 9.26 7.96 6.54 7.96 8.17 3.00 4.10 4.54 4.45 4.06 3.21 4.74 4.82 Sep. 9.25 7.69 6.45 7.91 8.00 2.81 4.05 4.48 4.45 3.92 3.13 4.66 4.74 Oct. 9.16 7.32 6.38 7.94 7.87 2.78 4.02 4.45 4.40 3.85 3.21 4.73 4.72 Nov. 9.08 7.03 6.29 7.87 7.76 2.72 3.97 4.46 4.32 3.78 3.16 4.56 4.62
3. Interest rates on loans to non-financial corporations (new business)
Bank Other loans of up to EUR 1 million Other loans of over EUR 1 million
overdrafts 2) by initial rate fixation by initial rate fixation
Floating rate and Over 1 and Over 5 years Floating rate and Over 1 and Over 5 yearsup to 1 year up to 5 years up to 1 year up to 5 years
1 2 3 4 5 6 72008 Dec. 6.24 5.38 5.78 5.32 4.28 4.50 4.762009 Jan. 5.65 4.73 5.46 5.24 3.52 3.95 4.58 Feb. 5.38 4.32 5.24 4.96 3.12 3.51 4.23 Mar. 5.08 4.03 5.06 4.74 2.85 3.22 3.87 Apr. 4.72 3.82 5.00 4.60 2.54 3.34 4.01 May 4.64 3.73 5.00 4.52 2.48 3.21 3.98 June 4.55 3.64 4.85 4.49 2.57 3.08 3.71 July 4.34 3.56 4.78 4.32 2.37 2.89 3.90 Aug. 4.24 3.42 4.67 4.24 2.31 2.80 3.83 Sep. 4.25 3.36 4.54 4.16 2.06 2.89 3.64 Oct. 4.18 3.33 4.49 4.18 2.14 2.73 3.64 Nov. 4.12 3.34 4.49 4.10 2.23 2.74 3.80
Source: ECB.1) Data refer to the changing composition of the euro area. For further information, see the General Notes.2) For this instrument category, new business and outstanding amounts coincide. End of period.3) For this instrument category, households and non-financial corporations are merged and allocated to the household sector, since the outstanding amounts of non-financial
corporations are negligible compared with those of the household sector when all participating Member States are combined.4) The annual percentage rate of charge covers the total cost of a loan. The total cost comprises both an interest rate component and a component incorporating
other (related) charges, such as the cost of inquiries, administration, preparation of documents and guarantees.

S 43ECB
Monthly Bulletin
January 2010
EURO AREASTATISTICS
Financial
markets
4.5 MFI interest rates on euro-denominated deposits from and loans to euro area residents 1) (percentages per annum; outstanding amounts as at end of period, new business as period average, unless otherwise indicated)
4. Interest rates on deposits (outstanding amounts)
Deposits from households Deposits from non-financial corporations Repos
Overnight 2) With an agreed maturity of: Redeemable at notice of: 2),3) Overnight 2) With an agreed maturity of:
Up to 2 years Over 2 years Up to 3 months Over 3 months Up to 2 years Over 2 years
1 2 3 4 5 6 7 8 92008 Dec. 1.16 4.41 3.07 2.95 4.17 1.61 4.01 4.30 3.562009 Jan. 1.02 4.16 3.10 2.88 4.08 1.26 3.48 4.11 3.09 Feb. 0.90 3.98 3.17 2.49 3.98 1.10 3.17 4.00 2.68 Mar. 0.80 3.78 3.06 2.31 3.87 0.93 2.80 3.87 2.29 Apr. 0.66 3.54 3.11 2.22 3.75 0.77 2.50 3.84 1.95 May 0.61 3.38 3.04 1.98 3.62 0.74 2.36 3.70 1.79 June 0.56 3.25 3.07 1.95 3.52 0.63 2.19 3.65 1.63 July 0.52 3.07 3.03 1.86 3.38 0.56 1.97 3.53 1.53 Aug. 0.50 2.94 3.01 1.64 3.23 0.54 1.90 3.39 1.53 Sep. 0.49 2.83 3.01 1.60 3.12 0.52 1.80 3.39 1.45 Oct. 0.46 2.64 2.96 1.55 2.97 0.49 1.70 3.34 1.35 Nov. 0.46 2.52 2.95 1.52 2.76 0.48 1.62 3.37 1.27
5. Interest rates on loans (outstanding amounts)
Loans to households Loans to non-financial corporations
Lending for house purchase Consumer credit and other loans With a maturity of:
with a maturity of: with a maturity of:
Up to 1 year Over 1 and Over 5 years Up to 1 year Over 1 and Over 5 years Up to 1 year Over 1 and Over 5 yearsup to 5 years up to 5 years up to 5 years
1 2 3 4 5 6 7 8 92008 Dec. 5.49 4.90 5.08 9.02 7.38 6.38 5.71 5.42 5.272009 Jan. 5.22 4.72 4.93 8.72 7.22 6.22 5.10 4.89 4.89 Feb. 5.14 4.75 4.91 8.61 7.27 6.21 4.75 4.59 4.74 Mar. 4.92 4.63 4.78 8.43 7.08 6.07 4.40 4.28 4.48 Apr. 4.70 4.49 4.65 8.19 7.00 5.92 4.10 3.97 4.25 May 4.59 4.45 4.56 8.09 6.92 5.84 4.00 3.84 4.12 June 4.50 4.40 4.46 7.97 6.91 5.79 3.91 3.72 4.00 July 4.31 4.31 4.36 7.82 6.79 5.70 3.72 3.59 3.81 Aug. 4.23 4.25 4.28 7.81 6.74 5.65 3.65 3.50 3.73 Sep. 4.19 4.26 4.25 7.80 6.72 5.63 3.62 3.44 3.68 Oct. 4.06 4.19 4.18 7.69 6.66 5.54 3.56 3.37 3.60 Nov. 4.03 4.16 4.13 7.57 6.66 5.51 3.53 3.36 3.59
C21 New deposits with an agreed maturity(percentages per annum excluding charges; period averages)
C22 New loans with a floating rate and up to 1 year's initialrate fixation (percentages per annum excluding charges; period averages)
0.50
1.00
1.50
2.00
2.50
3.00
3.50
4.00
4.50
5.00
2003 2004 2005 2006 2007 2008 20090.50
1.00
1.50
2.00
2.50
3.00
3.50
4.00
4.50
5.00
by households, up to 1 yearby non-financial corporations, up to 1 yearby households, over 2 yearsby non-financial corporations, over 2 years
1.00
2.00
3.00
4.00
5.00
6.00
7.00
8.00
9.00
2003 2004 2005 2006 2007 2008 20091.00
2.00
3.00
4.00
5.00
6.00
7.00
8.00
9.00
to households for consumptionto households for house purchaseto non-financial corporations, up to EUR 1 millionto non-financial corporations, over EUR 1 million
Source: ECB.1) Data refer to the changing composition of the euro area. For further information, see the General Notes.

S 44ECB
Monthly Bulletin
January 2010
4.6 Money market interest rates (percentages per annum; period averages)
Euro area 1), 2) United States Japan
Overnight 1-month 3-month 6-month 12-month 3-month 3-monthdeposits deposits deposits deposits deposits deposits deposits
(EONIA) (EURIBOR) (EURIBOR) (EURIBOR) (EURIBOR) (LIBOR) (LIBOR)
1 2 3 4 5 6 72007 3.87 4.08 4.28 4.35 4.45 5.30 0.792008 3.87 4.28 4.64 4.73 4.83 2.93 0.932009 0.71 0.89 1.22 1.43 1.61 0.69 0.47
2008 Q4 3.17 3.92 4.24 4.31 4.38 2.77 0.962009 Q1 1.37 1.67 2.01 2.11 2.22 1.24 0.67 Q2 0.77 0.94 1.31 1.51 1.67 0.84 0.53 Q3 0.36 0.53 0.87 1.13 1.34 0.41 0.40 Q4 0.36 0.45 0.72 1.00 1.24 0.27 0.31
2008 Dec. 2.49 2.99 3.29 3.37 3.45 1.83 0.922009 Jan. 1.81 2.14 2.46 2.54 2.62 1.21 0.73 Feb. 1.26 1.63 1.94 2.03 2.14 1.24 0.64 Mar. 1.06 1.27 1.64 1.77 1.91 1.27 0.62 Apr. 0.84 1.01 1.42 1.61 1.77 1.11 0.57 May 0.78 0.88 1.28 1.48 1.64 0.82 0.53 June 0.70 0.91 1.23 1.44 1.61 0.62 0.49 July 0.36 0.61 0.97 1.21 1.41 0.52 0.43 Aug. 0.35 0.51 0.86 1.12 1.33 0.42 0.40 Sep. 0.36 0.46 0.77 1.04 1.26 0.30 0.36 Oct. 0.36 0.43 0.74 1.02 1.24 0.28 0.33 Nov. 0.36 0.44 0.72 0.99 1.23 0.27 0.31 Dec. 0.35 0.48 0.71 1.00 1.24 0.25 0.28
C23 Euro area money market rates 1), 2) (monthly averages; percentages per annum)
C24 3-month money market rates(monthly averages; percentages per annum)
0.00
1.00
2.00
3.00
4.00
5.00
6.00
7.00
8.00
9.00
1994 1996 1998 2000 2002 2004 2006 20080.00
1.00
2.00
3.00
4.00
5.00
6.00
7.00
8.00
9.00
1-month rate3-month rate12-month rate
0.00
1.00
2.00
3.00
4.00
5.00
6.00
7.00
8.00
9.00
1994 1996 1998 2000 2002 2004 2006 20080.00
1.00
2.00
3.00
4.00
5.00
6.00
7.00
8.00
9.00
euro areaJapanUnited States
Source: ECB.1) Before January 1999 synthetic euro area rates were calculated on the basis of national rates weighted by GDP. For further information, see the General Notes.2) Data refer to the changing composition of the euro area. For further information, see the General Notes.
1), 2)
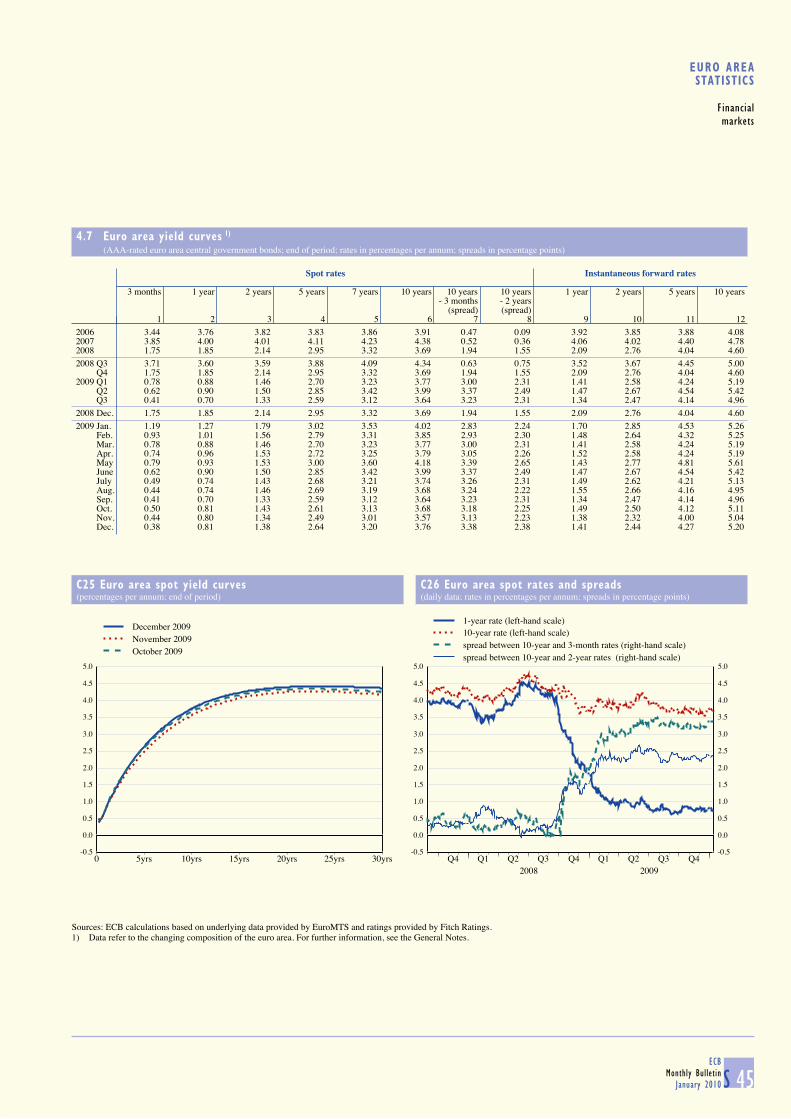
S 45ECB
Monthly Bulletin
January 2010
EURO AREASTATISTICS
Financial
markets
4.7 Euro area yield curves 1)
(AAA-rated euro area central government bonds; end of period; rates in percentages per annum; spreads in percentage points)
Spot rates Instantaneous forward rates
3 months 1 year 2 years 5 years 7 years 10 years 10 years 10 years 1 year 2 years 5 years 10 years- 3 months - 2 years
(spread) (spread)1 2 3 4 5 6 7 8 9 10 11 12
2006 3.44 3.76 3.82 3.83 3.86 3.91 0.47 0.09 3.92 3.85 3.88 4.082007 3.85 4.00 4.01 4.11 4.23 4.38 0.52 0.36 4.06 4.02 4.40 4.782008 1.75 1.85 2.14 2.95 3.32 3.69 1.94 1.55 2.09 2.76 4.04 4.602008 Q3 3.71 3.60 3.59 3.88 4.09 4.34 0.63 0.75 3.52 3.67 4.45 5.00 Q4 1.75 1.85 2.14 2.95 3.32 3.69 1.94 1.55 2.09 2.76 4.04 4.602009 Q1 0.78 0.88 1.46 2.70 3.23 3.77 3.00 2.31 1.41 2.58 4.24 5.19 Q2 0.62 0.90 1.50 2.85 3.42 3.99 3.37 2.49 1.47 2.67 4.54 5.42 Q3 0.41 0.70 1.33 2.59 3.12 3.64 3.23 2.31 1.34 2.47 4.14 4.962008 Dec. 1.75 1.85 2.14 2.95 3.32 3.69 1.94 1.55 2.09 2.76 4.04 4.602009 Jan. 1.19 1.27 1.79 3.02 3.53 4.02 2.83 2.24 1.70 2.85 4.53 5.26 Feb. 0.93 1.01 1.56 2.79 3.31 3.85 2.93 2.30 1.48 2.64 4.32 5.25 Mar. 0.78 0.88 1.46 2.70 3.23 3.77 3.00 2.31 1.41 2.58 4.24 5.19 Apr. 0.74 0.96 1.53 2.72 3.25 3.79 3.05 2.26 1.52 2.58 4.24 5.19 May 0.79 0.93 1.53 3.00 3.60 4.18 3.39 2.65 1.43 2.77 4.81 5.61 June 0.62 0.90 1.50 2.85 3.42 3.99 3.37 2.49 1.47 2.67 4.54 5.42 July 0.49 0.74 1.43 2.68 3.21 3.74 3.26 2.31 1.49 2.62 4.21 5.13 Aug. 0.44 0.74 1.46 2.69 3.19 3.68 3.24 2.22 1.55 2.66 4.16 4.95 Sep. 0.41 0.70 1.33 2.59 3.12 3.64 3.23 2.31 1.34 2.47 4.14 4.96 Oct. 0.50 0.81 1.43 2.61 3.13 3.68 3.18 2.25 1.49 2.50 4.12 5.11 Nov. 0.44 0.80 1.34 2.49 3.01 3.57 3.13 2.23 1.38 2.32 4.00 5.04 Dec. 0.38 0.81 1.38 2.64 3.20 3.76 3.38 2.38 1.41 2.44 4.27 5.20
C25 Euro area spot yield curves(percentages per annum; end of period)
C26 Euro area spot rates and spreads(daily data; rates in percentages per annum; spreads in percentage points)
-0.5
0.0
0.5
1.0
1.5
2.0
2.5
3.0
3.5
4.0
4.5
5.0
0 5yrs 10yrs 15yrs 20yrs 25yrs 30yrs
December 2009November 2009October 2009
-0.5
0.0
0.5
1.0
1.5
2.0
2.5
3.0
3.5
4.0
4.5
5.0
Q4 Q1 Q2 Q3 Q4 Q1 Q2 Q3 Q42008 2009
-0.5
0.0
0.5
1.0
1.5
2.0
2.5
3.0
3.5
4.0
4.5
5.0
1-year rate (left-hand scale)10-year rate (left-hand scale)spread between 10-year and 3-month rates (right-hand scale)spread between 10-year and 2-year rates (right-hand scale)
Sources: ECB calculations based on underlying data provided by EuroMTS and ratings provided by Fitch Ratings.1) Data refer to the changing composition of the euro area. For further information, see the General Notes.

S 46ECB
Monthly Bulletin
January 2010
4.8 Stock market indices (index levels in points; period averages)
Dow Jones EURO STOXX indices 1) United Japan
States Benchmark Main industry indices
Broad 50 Basic Consumer Consumer Oil and Financials Industrials Technology Utilities Telecoms Health care Standard Nikkeiindex materials services goods gas & Poor’s 225
500
1 2 3 4 5 6 7 8 9 10 11 12 13 142007 416.4 4,315.8 543.8 235.4 366.5 449.6 408.3 488.4 383.4 561.4 492.7 519.2 1,476.5 16,984.42008 313.7 3,319.5 480.4 169.3 290.7 380.9 265.0 350.9 282.5 502.0 431.5 411.5 1,220.7 12,151.62009 234.2 2,521.0 353.2 140.5 244.5 293.5 172.1 269.7 200.7 353.7 380.4 363.5 946.2 9,321.6
2008 Q4 228.7 2,497.7 320.7 136.5 236.9 287.6 169.3 238.1 200.0 384.7 387.0 358.1 910.9 8,700.42009 Q1 200.2 2,166.4 293.6 131.6 207.9 272.5 126.3 223.0 175.7 340.6 367.2 345.7 810.1 7,968.8 Q2 220.5 2,376.6 326.9 136.6 229.5 287.3 158.6 251.0 201.1 337.7 351.5 343.8 892.0 9,274.8 Q3 247.2 2,660.6 369.0 142.0 257.1 296.8 192.7 286.0 211.3 361.1 386.0 365.1 994.2 10,117.3 Q4 268.1 2,872.7 422.1 151.5 282.8 316.9 209.7 317.7 214.1 375.3 416.5 399.3 1,088.7 9,969.2
2008 Dec. 219.0 2,407.0 304.0 137.8 224.2 281.0 152.5 238.7 189.4 369.2 396.6 349.4 877.2 8,492.12009 Jan. 215.5 2,344.9 309.7 136.8 220.8 280.5 143.4 236.4 188.1 376.5 384.1 364.8 866.6 8,402.5 Feb. 200.4 2,159.8 299.2 132.7 208.0 280.9 123.3 226.1 175.7 341.0 361.7 354.1 806.3 7,707.3 Mar. 184.6 1,993.9 272.5 125.3 194.9 256.9 111.8 206.8 163.5 304.2 355.2 319.1 757.1 7,772.8 Apr. 209.3 2,256.3 308.4 134.6 219.0 268.1 145.0 237.9 196.0 323.2 356.8 327.7 848.5 8,755.5 May 225.7 2,426.7 331.6 140.1 233.8 296.0 164.5 259.8 203.1 346.3 348.0 346.7 901.7 9,257.7 June 226.7 2,449.0 341.0 135.3 235.9 298.3 166.8 255.5 204.3 343.8 349.6 357.0 926.1 9,810.3 July 228.0 2,462.1 337.9 134.8 243.7 288.6 170.6 256.8 198.8 334.7 364.8 352.9 934.1 9,678.3 Aug. 250.7 2,702.7 377.6 142.1 261.8 293.2 198.6 290.3 208.5 365.7 387.2 364.1 1,009.7 10,430.4 Sep. 264.0 2,827.9 393.3 149.5 266.5 308.7 210.2 312.5 227.2 384.4 407.0 378.8 1,044.6 10,302.9 Oct. 268.7 2,865.5 403.7 150.1 277.5 314.2 216.0 318.4 221.3 375.4 415.0 393.6 1,067.7 10,066.2 Nov. 265.4 2,843.8 415.4 149.5 280.0 315.3 208.7 313.6 209.9 369.8 414.5 391.5 1,088.1 9,641.0 Dec. 270.1 2,907.6 447.0 155.0 290.9 321.1 204.3 321.0 211.0 380.5 419.8 412.4 1,110.4 10,169.0
C27 Dow Jones EURO STOXX broad index, Standard & Poor's 500 and Nikkei 225(January 1994 = 100; monthly averages)
0
50
100
150
200
250
300
350
1994 1995 1996 1997 1998 1999 2000 2001 2002 2003 2004 2005 2006 2007 2008 20090
50
100
150
200
250
300
350
Dow Jones EURO STOXX broad indexStandard & Poor’s 500Nikkei 225
Source: ECB.1) Data refer to the changing composition of the euro area. For further information, see the General Notes.
1)

S 47ECB
Monthly Bulletin
January 2010
5PRICES, OUTPUT, DEMAND AND LABOUR MARKETS
5.1 HICP, other prices and costs (annual percentage changes, unless otherwise indicated)
1. Harmonised Index of Consumer Prices 1)
Total Total (s.a.; percentage change vis-à-vis previous period) Memo item: Administered prices 2)
Index: Total Goods Services Total Processed Unprocessed Non-energy Energy Services2005 = 100 food food industrial (n.s.a.) Total HICP Administered
Total excl. goods excluding pricesunprocessed administered
food and energy prices
% of total 3) 100.0 100.0 83.0 58.6 41.4 100.0 11.9 7.5 29.7 9.6 41.4 89.3 10.7
1 2 3 4 5 6 7 8 9 10 11 12 132005 100.0 2.2 1.5 2.1 2.3 - - - - - - 2.1 2.52006 102.2 2.2 1.5 2.3 2.0 - - - - - - 2.1 2.72007 104.4 2.1 2.0 1.9 2.5 - - - - - - 2.1 2.12008 107.8 3.3 2.4 3.8 2.6 - - - - - - 3.3 3.0
2008 Q3 108.4 3.8 2.5 4.7 2.6 0.8 0.8 1.1 0.2 2.1 0.7 3.9 3.3 Q4 108.2 2.3 2.2 2.1 2.6 -0.6 0.3 0.2 0.3 -8.7 0.5 2.1 3.42009 Q1 107.4 1.0 1.6 0.1 2.2 -0.3 -0.1 0.3 0.0 -4.9 0.4 0.7 2.9 Q2 108.3 0.2 1.5 -1.2 2.2 0.2 0.1 -0.9 0.2 0.7 0.4 0.0 1.7 Q3 108.0 -0.4 1.2 -1.9 1.8 0.2 0.4 -0.9 0.0 0.8 0.4 -0.6 1.1
2009 July 107.8 -0.7 1.2 -2.4 1.9 -0.1 0.1 -0.5 0.0 -1.8 0.1 -0.9 1.2 Aug. 108.1 -0.2 1.2 -1.5 1.8 0.3 0.1 -0.2 0.1 1.8 0.2 -0.3 1.1 Sep. 108.2 -0.3 1.1 -1.8 1.8 -0.1 0.0 0.1 0.0 -1.2 0.1 -0.5 1.0 Oct. 108.4 -0.1 1.0 -1.4 1.8 0.0 0.0 -0.1 0.0 -0.2 0.2 -0.2 0.8 Nov. 108.5 0.5 1.0 -0.3 1.6 0.2 0.2 0.2 0.0 1.4 0.1 0.4 0.8 Dec. 4) . 0.9 . . . . . . . . . . .
Goods Services
Food (incl. alcoholic beverages and tobacco) Industrial goods Housing Transport Communication Recreation Miscellaneous
andTotal Processed Unprocessed Total Non-energy Energy Rents personal
food food industrialgoods
% of total 3) 19.3 11.9 7.5 39.3 29.7 9.6 10.1 6.0 6.3 3.2 14.9 6.8
14 15 16 17 18 19 20 21 22 23 24 252005 1.6 2.0 0.8 2.4 0.3 10.1 2.6 2.0 2.7 -2.2 2.3 3.12006 2.4 2.1 2.8 2.3 0.6 7.7 2.5 2.1 2.5 -3.3 2.3 2.32007 2.8 2.8 3.0 1.4 1.0 2.6 2.7 2.0 2.6 -1.9 2.9 3.22008 5.1 6.1 3.5 3.1 0.8 10.3 2.3 1.9 3.9 -2.2 3.2 2.5
2008 Q3 5.6 6.7 3.9 4.2 0.7 15.1 2.3 1.9 4.4 -2.4 3.4 2.3 Q4 3.8 4.3 3.0 1.2 0.9 2.1 2.2 1.9 4.5 -2.0 3.3 2.22009 Q1 2.4 2.1 2.8 -1.1 0.7 -6.1 2.0 1.7 3.6 -1.7 2.7 2.1 Q2 1.0 1.1 0.8 -2.3 0.7 -10.7 2.1 1.8 3.1 -1.2 2.7 2.0 Q3 -0.1 0.6 -1.2 -2.8 0.5 -11.9 2.0 1.8 2.5 -0.6 1.8 2.1
2009 June 0.7 1.1 0.0 -2.7 0.6 -11.7 2.1 1.8 2.7 -0.9 2.2 1.9 July 0.0 0.8 -1.1 -3.6 0.5 -14.4 2.1 1.8 2.6 -0.8 1.9 2.0 Aug. -0.1 0.6 -1.2 -2.3 0.6 -10.2 2.0 1.8 2.5 -0.7 1.8 2.0 Sep. -0.2 0.5 -1.3 -2.6 0.5 -11.0 2.0 1.8 2.3 -0.3 1.7 2.1 Oct. -0.4 0.3 -1.6 -2.0 0.3 -8.5 1.9 1.6 2.6 -0.3 1.6 2.1 Nov. -0.1 0.5 -1.3 -0.4 0.2 -2.4 1.9 1.7 2.4 -0.7 1.3 2.2
Sources: Eurostat and ECB calculations.1) Data refer to the changing composition of the euro area. For further information, see the General Notes.2) ECB estimates based on Eurostat data; these experimental statistics can only provide an approximate measure of price administration, since changes in administered prices cannot be fully isolated from other influences. Please refer to http://www.ecb.europa.eu/stats/prices/hicp/html/index.en.html for a note explaining the methodology used in the compilation of this indicator.3) Weighting used in 2009.4) Estimate based on provisional national releases, which usually cover around 95% of the euro area, as well as on early information on energy prices.

S 48ECB
Monthly Bulletin
January 2010
5.1 HICP, other prices and costs (annual percentage changes, unless otherwise indicated)
2. Industry, construction and residential property prices
Industrial producer prices excluding construction Construct- Residential
ion 1) propertyTotal Total Industry excluding construction and energy Energy prices 2)
(index: 2005 = 100) Manu- Total Intermediate Capital Consumer goods
facturing goods goodsTotal Durable Non-durable
% of total 3) 100.0 100.0 83.0 75.8 30.1 21.9 23.7 2.7 21.0 24.2
1 2 3 4 5 6 7 8 9 10 11 122005 100.0 4.1 3.1 1.9 2.8 1.2 0.9 1.3 0.8 13.5 3.4 7.52006 105.1 5.1 3.5 2.8 4.6 1.6 1.5 1.4 1.5 13.4 4.6 6.52007 107.9 2.7 3.0 3.2 4.6 2.2 2.2 2.4 2.1 1.2 4.1 4.42008 114.4 6.1 4.8 3.5 4.0 2.1 3.9 2.8 4.1 14.1 3.8 1.7
2008 Q3 117.2 8.4 6.7 4.2 5.4 2.3 4.2 2.7 4.4 21.5 5.2 - Q4 113.7 3.4 0.7 2.4 2.6 2.5 2.0 2.6 1.9 6.7 3.4 0.6 4)
2009 Q1 109.8 -2.0 -4.3 -1.1 -2.7 1.8 -1.0 1.9 -1.4 -4.1 2.6 - Q2 108.3 -5.7 -6.8 -3.0 -5.7 0.6 -2.0 1.5 -2.5 -13.2 -0.2 . Q3 108.0 -7.8 -7.4 -4.2 -7.4 -0.2 -2.6 1.0 -3.1 -18.0 -1.6 -
2009 June 108.5 -6.5 -7.3 -3.5 -6.4 0.3 -2.3 1.6 -2.9 -14.7 - - July 107.8 -8.4 -8.2 -4.1 -7.5 0.0 -2.5 1.2 -3.0 -19.8 - - Aug. 108.3 -7.5 -7.0 -4.2 -7.4 -0.2 -2.6 1.1 -3.1 -16.7 - - Sep. 108.0 -7.6 -6.9 -4.2 -7.3 -0.5 -2.7 0.7 -3.2 -17.3 - - Oct. 108.3 -6.6 -5.2 -3.9 -6.4 -0.7 -2.8 0.4 -3.3 -14.2 - - Nov. 108.4 -4.5 -2.8 -3.1 -4.8 -0.8 -2.4 0.5 -2.7 -9.0 - -
3. Commodity prices and gross domestic product deflators 1)
Oil prices 5) Non-energy commodity prices GDP deflators
(EUR per barrel) Import-weighted 6) Use-weighted 7) Total Total Domestic demand Exports 8) Imports 8)
(s.a.; index:Total Food Non-food Total Food Non-food 2000 = 100) Total Private Government Gross
consump- consump- fixedtion tion capital
formation
% of total 100.0 35.0 65.0 100.0 44.3 55.7
1 2 3 4 5 6 7 8 9 10 11 12 13 14 152006 52.9 27.5 5.8 37.6 24.4 5.9 38.1 113.8 1.9 2.4 2.2 2.0 2.9 2.6 3.82007 52.8 7.5 14.3 5.0 5.1 9.4 2.7 116.5 2.4 2.3 2.3 1.7 2.6 1.6 1.42008 65.9 2.1 18.5 -4.3 -1.7 9.7 -8.5 119.0 2.2 2.7 2.9 2.8 2.4 2.4 3.72009 44.6 -18.6 -9.0 -23.2 -18.1 -11.5 -22.8 . . . . . . . .
2008 Q4 43.5 -9.9 -7.2 -11.2 -14.5 -12.9 -15.8 120.0 2.4 2.0 2.0 2.2 1.8 1.3 0.42009 Q1 35.1 -29.2 -15.0 -36.0 -28.7 -17.7 -36.8 120.1 1.8 1.1 0.3 2.8 0.6 -2.6 -4.4 Q2 43.8 -24.5 -11.2 -31.0 -22.5 -10.0 -31.4 120.2 1.1 0.1 -0.3 1.6 -0.8 -4.4 -6.8 Q3 48.1 -18.8 -12.7 -21.8 -18.9 -15.3 -21.5 120.4 0.9 -0.3 -0.7 2.4 -1.5 -5.4 -8.1 Q4 51.2 2.7 5.3 1.4 2.3 -1.1 4.9 . . . . . . . .
2009 July 46.5 -22.9 -15.3 -26.6 -21.6 -14.3 -26.8 - - - - - - - - Aug. 51.1 -16.4 -10.9 -19.1 -17.6 -16.2 -18.7 - - - - - - - - Sep. 46.9 -17.0 -11.6 -19.6 -17.5 -15.4 -18.9 - - - - - - - - Oct. 49.8 -7.3 -1.2 -10.1 -9.3 -10.3 -8.6 - - - - - - - - Nov. 52.1 -0.9 3.0 -2.8 -1.0 -3.0 0.5 - - - - - - - - Dec. 51.6 18.4 14.5 20.5 19.5 10.4 27.1 - - - - - - - -
Sources: Eurostat, ECB calculations based on Eurostat data (column 7 in Table 2 in Section 5.1 and columns 8-15 in Table 3 in Section 5.1), ECB calculations based onThomson Financial Datastream data (column 1 in Table 3 in Section 5.1) and ECB calculations (column 12 in Table 2 in Section 5.1 and columns 2-7 in Table 3 in Section 5.1).1) Input prices for residential buildings.2) Experimental data based on non-harmonised national sources (see http://www.ecb.int/stats/intro/html/experiment.en.html for further details).3) In 2005.4) The quarterly data for the second and fourth quarters refer to biannual averages for the first and second halves of the year respectively. Since some national data are only
available annually, the biannual estimate is partially derived from annual results; consequently, the accuracy of biannual data is lower than the accuracy of annual data.5) Brent Blend (for one-month forward delivery).6) Refers to prices expressed in euro. Weighted according to the structure of euro area imports in the period 2004-06.7) Refers to prices expressed in euro. Weighted according to euro area domestic demand (domestic production plus imports minus exports) in the period 2004-06. Experimental data
(see http://www.ecb.int/stats/intro/html/experiment.en.html for details).8) Deflators for exports and imports refer to goods and services and include cross-border trade within the euro area.

S 49ECB
Monthly Bulletin
January 2010
EURO AREASTATISTICS
Prices, output,
demand and
labour markets
5.1 HICP, other prices and costs (annual percentage changes, unless otherwise indicated)
4. Unit labour costs, compensation per employee and labour productivity(seasonally adjusted)
Unit labour costs 1)
Total Total By economic activity
(index:2000 = 100) Agriculture, hunting, Mining, Construction Trade, repairs, hotels and Financial, real estate, Public administration,
forestry and fishing manufacturing restaurants, transport and renting and business education, healthand energy communication services and other services
1 2 3 4 5 6 7 8
2005 109.0 1.2 8.5 -0.5 3.2 0.7 2.1 2.12006 110.0 1.0 1.3 -0.5 3.4 0.6 2.2 2.02007 111.7 1.6 2.6 0.7 4.1 0.7 2.3 1.82008 115.4 3.3 0.1 3.6 2.8 3.2 3.1 3.1
2008 Q3 115.8 3.6 -0.9 4.1 3.0 4.4 3.6 2.5 Q4 118.2 4.8 -0.4 9.9 2.5 5.2 2.4 3.22009 Q1 120.3 5.9 0.6 16.5 2.2 6.8 0.3 3.6 Q2 120.4 4.8 1.3 14.9 0.7 5.5 1.0 2.1 Q3 119.9 3.5 0.0 9.2 -0.7 3.5 0.0 3.6
Compensation per employee
2005 112.3 2.0 2.6 1.9 2.2 1.9 2.3 1.92006 114.9 2.3 3.2 3.4 3.5 1.7 2.3 1.72007 117.8 2.5 4.1 2.8 2.7 2.1 2.5 2.52008 121.6 3.2 3.3 3.1 4.5 2.7 2.5 3.7
2008 Q3 122.1 3.6 3.5 3.2 5.0 3.9 3.0 3.5 Q4 122.8 3.0 3.0 2.9 4.4 2.9 2.0 3.52009 Q1 122.7 1.9 3.2 0.3 3.4 2.2 0.7 3.2 Q2 123.2 1.6 3.6 0.0 3.8 1.9 1.9 1.9 Q3 123.8 1.4 2.8 0.2 3.0 0.5 1.4 2.9
Labour productivity 2)
2005 103.1 0.7 -5.5 2.4 -1.1 1.3 0.2 -0.22006 104.5 1.4 1.8 3.9 0.1 1.2 0.1 -0.32007 105.5 1.0 1.4 2.1 -1.4 1.4 0.2 0.72008 105.4 -0.1 3.2 -0.5 1.6 -0.5 -0.6 0.6
2008 Q3 105.5 -0.1 4.4 -0.9 1.9 -0.5 -0.6 1.0 Q4 103.8 -1.7 3.4 -6.4 1.8 -2.2 -0.4 0.32009 Q1 102.0 -3.8 2.5 -13.9 1.2 -4.3 0.4 -0.4 Q2 102.4 -3.1 2.3 -12.9 3.0 -3.4 0.9 -0.2 Q3 103.3 -2.0 2.8 -8.3 3.7 -2.9 1.4 -0.7
5. Hourly labour costs 3)
Total Total By component For selected economic activities Memo item:
(s.a.; index: indicator2008 = 100) Wages and Employers’ social Mining, Construction Services of
salaries contributions manufacturing negotiatedand energy wages 4)
% of total 5) 100.0 100.0 75.2 24.8 32.4 9.0 58.6
1 2 3 4 5 6 7 82005 92.2 2.1 2.2 2.0 2.1 1.6 2.3 2.12006 94.3 2.3 2.3 2.2 3.4 1.4 1.8 2.32007 96.6 2.5 2.8 1.5 2.2 2.7 2.6 2.12008 99.9 3.4 3.5 3.3 3.8 4.2 3.1 3.2
2008 Q3 100.5 3.5 3.6 3.5 2.9 3.7 3.8 3.4 Q4 101.7 4.4 4.3 4.9 6.2 5.1 3.3 3.62009 Q1 102.3 3.8 3.7 4.5 6.2 3.4 2.6 3.2 Q2 103.3 4.3 4.2 4.6 6.1 3.8 3.5 2.8 Q3 103.8 3.2 3.1 3.6 5.4 2.9 2.0 2.3
Sources: Eurostat, ECB calculations based on Eurostat data (Table 4 in Section 5.1 and column 7 in Table 5 in Section 5.1) and ECB calculations (column 8 in Table 5 in Section 5.1).1) Compensation (at current prices) per employee divided by value added (volumes) per person employed.2) Value added (volumes) per person employed.3) Hourly labour costs for the whole economy, excluding agriculture, public administration, education, health and services not classified elsewhere. Owing to differences in
coverage, the estimates for the components may not be consistent with the total.4) Experimental data (see http://www.ecb.int/stats/intro/html/experiment.en.html for further details).5) In 2008.

S 50ECB
Monthly Bulletin
January 2010
5.2 Output and demand
1. GDP and expenditure components
Current prices (EUR billions; seasonally adjusted)
GDP
Total Domestic demand External balance 1)
Total Private Government Gross fixed Changes in Total Exports 1) Imports 1)
consumption consumption capital inventories 2)
formation
1 2 3 4 5 6 7 8 9
2005 8,140.6 8,021.3 4,666.2 1,664.2 1,683.1 7.9 119.2 3,094.0 2,974.72006 8,558.9 8,461.2 4,870.0 1,733.2 1,831.2 26.7 97.7 3,451.6 3,353.92007 9,005.7 8,864.7 5,062.2 1,803.4 1,968.5 30.6 141.0 3,732.8 3,591.82008 9,259.6 9,162.9 5,228.8 1,892.1 2,001.8 40.2 96.8 3,858.7 3,761.92008 Q3 2,324.7 2,309.6 1,316.9 474.7 504.0 14.0 15.1 984.0 968.9 Q4 2,294.7 2,281.4 1,304.6 480.7 481.8 14.3 13.3 900.6 887.32009 Q1 2,239.7 2,231.4 1,288.3 487.8 453.5 1.8 8.3 801.3 793.0 Q2 2,238.4 2,218.8 1,292.1 493.2 444.3 -10.7 19.6 783.0 763.4 Q3 2,251.9 2,232.4 1,294.1 498.2 439.8 0.3 19.4 805.4 785.9
percentage of GDP 2008 100.0 99.0 56.5 20.4 21.6 0.4 1.0 - -
Chain-linked volumes (prices for the previous year; seasonally adjusted 3) )
quarter-on-quarter percentage changes
2008 Q3 -0.4 0.1 0.0 0.5 -1.2 - - -1.3 0.0 Q4 -1.9 -0.8 -0.5 0.6 -4.0 - - -7.2 -4.82009 Q1 -2.5 -2.0 -0.4 0.6 -5.4 - - -8.6 -7.4 Q2 -0.1 -0.7 0.1 0.6 -1.6 - - -1.2 -2.8 Q3 0.4 0.4 -0.1 0.6 -0.8 - - 3.1 3.0
annual percentage changes
2005 1.7 1.9 1.8 1.6 3.2 - - 5.1 5.82006 3.0 2.9 2.0 2.1 5.5 - - 8.5 8.52007 2.8 2.4 1.6 2.3 4.8 - - 6.3 5.52008 0.6 0.6 0.4 2.0 -0.4 - - 1.0 1.0
2008 Q3 0.4 0.4 0.0 2.1 -0.6 - - 1.0 0.9 Q4 -1.8 -0.5 -0.7 2.4 -5.8 - - -6.9 -4.02009 Q1 -5.0 -3.2 -1.3 2.5 -11.5 - - -16.6 -12.8 Q2 -4.8 -3.4 -0.9 2.5 -11.7 - - -17.2 -14.3 Q3 -4.0 -3.2 -1.0 2.5 -11.4 - - -13.5 -11.8
contributions to quarter-on-quarter percentage changes in GDP; percentage points
2008 Q3 -0.4 0.1 0.0 0.1 -0.3 0.3 -0.5 - - Q4 -1.9 -0.8 -0.3 0.1 -0.9 0.2 -1.1 - - 2009 Q1 -2.5 -2.0 -0.2 0.1 -1.1 -0.8 -0.5 - - Q2 -0.1 -0.7 0.0 0.1 -0.3 -0.6 0.6 - - Q3 0.4 0.4 -0.1 0.1 -0.2 0.5 0.1 - -
contributions to annual percentage changes in GDP; percentage points
2005 1.7 1.8 1.1 0.3 0.6 -0.2 -0.2 - - 2006 3.0 2.9 1.2 0.4 1.1 0.1 0.1 - - 2007 2.8 2.4 0.9 0.5 1.0 0.0 0.4 - - 2008 0.6 0.6 0.2 0.4 -0.1 0.1 0.0 - -
2008 Q3 0.4 0.3 0.0 0.4 -0.1 0.1 0.1 - - Q4 -1.8 -0.5 -0.4 0.5 -1.3 0.6 -1.3 - - 2009 Q1 -5.0 -3.2 -0.7 0.5 -2.5 -0.5 -1.8 - - Q2 -4.8 -3.4 -0.5 0.5 -2.5 -0.8 -1.5 - - Q3 -4.0 -3.2 -0.6 0.5 -2.5 -0.6 -0.9 - -
Sources: Eurostat and ECB calculations.
1) Exports and imports cover goods and services and include cross-border intra-euro area trade. They are not fully consistent with: Section 3.1; Table 1 of Section 7.1; Table 3 of Section 7.2; or Tables 1 or 3 of Section 7.5.2) Including acquisitions less disposals of valuables.3) Annual data are not working day-adjusted.

S 51ECB
Monthly Bulletin
January 2010
EURO AREASTATISTICS
Prices, output,
demand and
labour markets
5.2 Output and demand
2. Value added by economic activity
Current prices (EUR billions; seasonally adjusted)
Gross value added (basic prices) Taxes less
subsidies onTotal Agriculture, Mining, Construction Trade, repairs, Financial, real Public products
hunting, manufacturing hotels and estate, renting administration,forestry and energy restaurants, and business education,
and fishing transport and activities health andactivities communication other services
1 2 3 4 5 6 7 8
2005 7,295.9 143.7 1,481.7 439.8 1,541.3 2,018.4 1,671.1 844.72006 7,645.0 141.2 1,563.3 476.3 1,598.0 2,134.6 1,731.6 913.92007 8,046.8 151.7 1,638.9 509.3 1,672.7 2,271.0 1,803.1 959.02008 8,313.6 146.7 1,660.2 533.3 1,726.8 2,364.6 1,882.1 946.02008 Q3 2,087.5 35.9 418.0 134.8 433.8 594.0 471.0 237.2 Q4 2,064.5 34.9 395.7 132.0 428.8 594.9 478.2 230.22009 Q1 2,016.1 34.4 359.1 130.4 417.9 589.7 484.7 223.5 Q2 2,016.2 33.4 353.2 129.3 418.6 592.5 489.2 222.2 Q3 2,029.8 32.4 361.1 128.9 420.2 594.7 492.4 222.1
percentage of value added 2008 100.0 1.8 20.0 6.4 20.8 28.4 22.6 -
Chain-linked volumes (prices for the previous year; seasonally adjusted 1) )
quarter-on-quarter percentage changes
2008 Q3 -0.4 0.3 -1.8 -1.4 -0.4 -0.1 0.5 -0.2 Q4 -1.9 0.3 -6.4 -1.8 -2.0 -0.6 0.3 -2.02009 Q1 -2.5 -0.3 -8.3 -1.0 -2.8 -0.7 -0.1 -2.5 Q2 -0.2 -0.2 -1.5 -0.7 -0.1 0.1 0.7 0.3 Q3 0.4 0.4 2.3 -0.8 0.2 -0.1 0.1 0.8
annual percentage changes
2005 1.7 -6.1 1.3 1.6 2.0 2.7 1.3 1.92006 3.0 0.0 3.6 2.9 2.8 4.1 1.4 3.32007 3.0 -0.1 2.4 2.3 3.4 4.3 2.0 0.92008 0.9 1.7 -0.6 -0.6 0.8 1.7 1.6 -1.2
2008 Q3 0.6 2.8 -1.0 -1.0 0.4 1.3 1.8 -1.5 Q4 -1.7 2.2 -7.6 -3.4 -2.0 0.2 1.5 -2.62009 Q1 -4.9 0.1 -16.6 -5.9 -5.5 -1.0 1.1 -5.6 Q2 -4.9 0.1 -17.1 -4.7 -5.1 -1.2 1.3 -4.4 Q3 -4.1 0.1 -13.6 -4.2 -4.6 -1.3 1.0 -3.5
contributions to quarter-on-quarter percentage changes in value added; percentage points
2008 Q3 -0.4 0.0 -0.4 -0.1 -0.1 0.0 0.1 - Q4 -1.9 0.0 -1.3 -0.1 -0.4 -0.2 0.1 - 2009 Q1 -2.5 0.0 -1.6 -0.1 -0.6 -0.2 0.0 - Q2 -0.2 0.0 -0.3 0.0 0.0 0.0 0.2 - Q3 0.4 0.0 0.4 -0.1 0.0 0.0 0.0 -
contributions to annual percentage changes in value added; percentage points
2005 1.7 -0.1 0.3 0.1 0.4 0.7 0.3 - 2006 3.0 0.0 0.7 0.2 0.6 1.1 0.3 - 2007 3.0 0.0 0.5 0.1 0.7 1.2 0.4 - 2008 0.9 0.0 -0.1 0.0 0.2 0.5 0.4 -
2008 Q3 0.6 0.1 -0.2 -0.1 0.1 0.4 0.4 - Q4 -1.7 0.0 -1.5 -0.2 -0.4 0.1 0.3 - 2009 Q1 -4.9 0.0 -3.4 -0.4 -1.1 -0.3 0.3 - Q2 -4.9 0.0 -3.5 -0.3 -1.1 -0.3 0.3 - Q3 -4.1 0.0 -2.7 -0.3 -1.0 -0.4 0.2 -
Sources: Eurostat and ECB calculations.
1) Annual data are not working day-adjusted.

S 52ECB
Monthly Bulletin
January 2010
5.2 Output and demand (annual percentage changes, unless otherwise indicated)
3. Industrial production
Total Industry excluding construction Construction
Total Total Industry excluding construction and energy Energy
(s.a.;index: 2005 = 100) Manu- Total Intermediate Capital Consumer goods
facturing goods goodsTotal Durable Non-durable
% of total 1) 100.0 78.0 78.0 69.4 68.8 28.2 22.1 18.5 2.6 15.9 9.1 22.0
1 2 3 4 5 6 7 8 9 10 11 122006 4.1 104.3 4.2 4.6 4.7 4.9 6.0 3.0 4.7 2.7 0.6 3.52007 3.2 108.2 3.7 4.2 4.3 3.7 6.7 2.3 1.4 2.5 -0.9 1.12008 -2.2 106.3 -1.7 -1.8 -1.9 -3.3 -0.1 -2.0 -5.7 -1.4 0.3 -4.4
2008 Q4 -8.9 98.6 -8.9 -9.2 -9.4 -13.3 -8.4 -4.7 -11.9 -3.5 -4.1 -8.12009 Q1 -17.0 90.3 -18.5 -20.2 -20.7 -25.4 -23.9 -7.4 -19.8 -5.5 -4.5 -10.3 Q2 -16.7 89.2 -18.6 -19.5 -19.9 -24.3 -24.2 -6.0 -21.3 -3.4 -8.9 -7.4 Q3 -13.8 91.2 -14.5 -15.3 -15.8 -18.4 -21.1 -4.0 -18.2 -1.9 -6.3 -9.5
2009 May -16.2 89.2 -17.8 -18.7 -18.9 -23.4 -23.0 -5.4 -19.9 -2.8 -7.5 -8.7 June -15.2 90.1 -16.7 -17.8 -18.3 -22.2 -22.2 -5.3 -23.6 -2.3 -6.2 -7.6 July -15.1 90.5 -15.8 -16.9 -17.8 -20.2 -23.5 -4.0 -20.4 -1.3 -5.6 -10.2 Aug. -14.7 91.5 -15.1 -16.1 -16.1 -19.4 -22.0 -5.4 -19.5 -3.8 -6.1 -10.8 Sep. -12.0 91.8 -12.7 -13.1 -13.7 -15.7 -18.3 -2.8 -15.3 -0.9 -7.3 -7.8 Oct. -10.6 91.5 -10.9 -11.5 -12.1 -12.2 -16.7 -4.5 -14.3 -2.8 -6.0 -6.8
month-on-month percentage changes (s.a.)
2009 May 0.5 - 1.1 1.0 1.0 1.3 1.2 0.3 -2.3 0.6 1.8 -2.0 June 0.7 - 1.0 0.9 -0.2 0.6 0.2 -0.2 -3.5 0.2 1.8 -0.1 July -0.2 - 0.4 0.4 -0.2 1.2 -1.3 0.5 0.9 0.4 0.5 -1.7 Aug. 0.6 - 1.1 1.4 1.1 0.9 1.6 -0.4 5.7 -1.1 0.2 0.0 Sep. 0.5 - 0.3 0.6 0.0 0.8 1.6 0.2 -4.8 0.8 -1.6 -0.7 Oct. -0.6 - -0.3 -0.6 -0.3 1.1 -0.3 -1.4 -1.2 -1.3 0.4 -0.3
4. Industrial new orders and turnover, retail sales and new passenger car registrations
Industrial new orders Industrial turnover Retail sales (excluding automotive fuel) New passenger car
registrations Manufacturing 2) Manufacturing Current prices Constant prices (current prices) (current prices)
Total Total Total Total Total Total Total Food, Non-food Total (s.a., Total
(s.a.; index: (s.a.: index: (s.a.; index: beverages, thousands) 3)
2005 = 100) 2005 = 100) 2005 = 100) tobacco Textiles, Householdclothing, equipmentfootwear
% of total 1) 100.0 100.0 100.0 100.0 100.0 100.0 100.0 42.9 57.1 9.9 13.9
1 2 3 4 5 6 7 8 9 10 11 12 132006 110.7 10.3 108.3 8.0 3.3 102.5 2.4 1.0 3.5 3.1 5.3 975 2.42007 120.0 8.7 115.0 6.5 2.6 104.3 1.8 0.0 3.2 4.0 3.0 968 -0.52008 113.4 -5.2 116.9 1.9 1.7 103.5 -0.8 -1.8 -0.1 -1.8 -1.9 896 -7.0
2008 Q4 94.6 -22.3 107.1 -7.5 -0.4 102.7 -1.7 -2.4 -1.1 -3.1 -2.7 825 -17.42009 Q1 83.1 -31.8 95.1 -21.6 -2.8 102.0 -2.7 -3.7 -1.9 -0.5 -6.1 828 -12.6 Q2 84.5 -30.6 94.1 -23.2 -2.8 101.6 -2.0 -1.6 -2.2 -2.0 -5.3 933 -0.2 Q3 91.1 -21.4 96.0 -18.8 -3.2 101.2 -1.8 -1.4 -2.2 -2.7 -2.9 961 9.6
2009 June 86.5 -25.8 93.7 -20.4 -2.8 101.5 -1.7 -1.6 -1.5 -1.7 -4.5 974 11.6 July 90.3 -24.9 95.0 -20.6 -2.6 101.5 -1.2 -1.7 -1.1 0.3 -3.3 977 6.8 Aug. 90.8 -23.2 96.9 -18.8 -3.2 101.3 -1.8 -0.8 -2.6 -4.2 -2.9 935 14.5 Sep. 92.3 -16.4 96.1 -16.9 -3.8 100.9 -2.5 -1.9 -3.0 -4.7 -2.4 972 9.6 Oct. 90.4 -14.4 96.5 -16.4 -1.9 101.2 -0.6 -1.6 -0.2 2.5 -0.5 984 10.8 Nov. . . . . -3.3 100.0 -3.4 -2.8 -4.0 . . 979 33.6
month-on-month percentage changes (s.a.)
2009 July - 4.4 - 1.4 -0.1 - 0.0 -0.3 0.2 1.3 0.3 - 0.2 Aug. - 0.5 - 2.0 -0.2 - -0.2 0.6 -0.8 -2.6 -0.1 - -4.3 Sep. - 1.6 - -0.8 -0.5 - -0.4 -0.7 -0.2 0.4 0.1 - 4.1 Oct. - -2.1 - 0.4 0.3 - 0.3 -0.3 0.6 2.3 0.4 - 1.2 Nov. - . - . -0.7 - -1.1 -0.3 -1.6 . . - -0.5
Sources: Eurostat, except columns 12 and 13 in Table 4 in Section 5.2 (which comprise ECB calculations based on data from the European Automobile Manufacturers’ Association).1) In 2005.2) Includes manufacturing industries working mainly on the basis of orders, which represented 61.2% of total manufacturing in 2005.3) Annual and quarterly figures are averages of monthly figures in the period concerned.

S 53ECB
Monthly Bulletin
January 2010
EURO AREASTATISTICS
Prices, output,
demand and
labour markets
5.2 Output and demand (percentage balances, 1) unless otherwise indicated; seasonally adjusted)
5. Business and Consumer Surveys
Economic Manufacturing industry Consumer confidence indicatorsentiment
indicator 2) Industrial confidence indicator Capacity Total 4) Financial Economic Unemployment Savings(long-term utilisation 3) situation situation situation over next
average Total 4) Order Stocks of Production (percentages) over next over next over next 12 months= 100) books finished expectations 12 months 12 months 12 months
products
1 2 3 4 5 6 7 8 9 10 112006 106.9 2 0 6 13 83.1 -9 -3 -9 15 -92007 108.9 4 5 5 13 84.1 -5 -2 -4 5 -82008 91.1 -9 -15 11 -2 81.8 -18 -10 -25 23 -142009 76.1 -29 -56 14 -15 . -25 -7 -26 55 -10
2008 Q4 75.6 -25 -36 18 -22 78.1 -27 -11 -34 49 -142009 Q1 65.7 -36 -56 20 -31 72.5 -33 -11 -41 64 -14 Q2 70.2 -33 -62 18 -21 70.0 -28 -9 -34 59 -11 Q3 79.9 -26 -58 12 -9 70.1 -21 -5 -20 51 -9 Q4 88.7 -19 -50 7 1 . -17 -3 -11 48 -7
2009 July 76.0 -30 -61 14 -13 69.6 -23 -6 -23 53 -10 Aug. 80.8 -25 -56 13 -8 - -22 -5 -21 53 -9 Sep. 82.8 -24 -56 10 -7 - -19 -4 -15 48 -10 Oct. 86.1 -21 -53 8 -2 70.7 -18 -3 -12 48 -8 Nov. 88.8 -19 -51 8 2 - -17 -3 -10 50 -7 Dec. 91.3 -16 -47 5 4 - -16 -3 -10 46 -5
Construction confidence indicator Retail trade confidence indicator Services confidence indicator
Total 4) Order Employment Total 4) Present Volume of Expected Total 4) Business Demand in Demand inbooks expectations business stocks business climate recent the months
situation situation months ahead
12 13 14 15 16 17 18 19 20 21 222006 1 -4 6 1 3 14 13 18 13 18 242007 0 -8 7 1 4 15 12 19 16 19 232008 -14 -20 -7 -7 -6 16 1 2 -5 4 72009 -31 -40 -22 -15 -21 11 -15 -16 -22 -16 -9
2008 Q4 -23 -31 -16 -15 -16 17 -13 -12 -20 -9 -62009 Q1 -31 -36 -26 -19 -21 15 -20 -24 -33 -21 -18 Q2 -34 -42 -25 -17 -23 9 -19 -22 -29 -23 -15 Q3 -32 -41 -22 -14 -19 10 -13 -12 -19 -13 -5 Q4 -28 -40 -16 -12 -20 10 -7 -4 -8 -8 3
2009 July -33 -41 -25 -13 -16 10 -14 -18 -24 -19 -9 Aug. -32 -40 -23 -14 -20 10 -12 -11 -16 -10 -5 Sep. -30 -42 -19 -15 -21 11 -14 -9 -15 -10 -2 Oct. -29 -42 -16 -15 -24 10 -12 -7 -10 -10 0 Nov. -26 -39 -14 -11 -19 10 -4 -4 -7 -8 4 Dec. -28 -40 -17 -10 -15 9 -6 -3 -7 -6 5
Source: European Commission (Economic and Financial Affairs DG).1) Difference between the percentages of respondents giving positive and negative replies.2) The economic sentiment indicator is composed of the industrial, services, consumer, construction and retail trade confidence indicators; the industrial confidence indicator has
a weight of 40%, the services confidence indicator a weight of 30%, the consumer confidence indicator a weight of 20% and the two other indicators a weight of 5% each.Values for the economic sentiment indicator of above (below) 100 indicate above-average (below-average) economic sentiment, calculated for the period 1990 to 2008.
3) Data are collected in January, April, July and October each year. The quarterly figures shown are averages of two successive surveys. Annual data are derived from quarterly averages.
4) The confidence indicators are calculated as simple averages of the components shown; the assessments of stocks (columns 4 and 17) and unemployment (column 10) are used with inverted signs for the calculation of confidence indicators.

S 54ECB
Monthly Bulletin
January 2010
5.3 Labour markets 1) (annual percentage changes, unless otherwise indicated)
1. Employment
Whole economy By employment status By economic activity
Millions (s.a.) Employees Self- Agriculture, Mining, Construction Trade, repairs, Financial, real Publicemployed hunting, manufacturing hotels and estate, renting administration,
forestry and energy restaurants, and business education, healthand fishing transport and services and other services
communication
% of total 2) 100.0 100.0 85.2 14.8 3.9 17.1 7.5 25.6 16.0 29.9
1 2 3 4 5 6 7 8 9 102005 141.875 1.0 1.0 0.4 -0.7 -1.1 2.7 0.7 2.5 1.52006 144.168 1.6 1.8 0.8 -1.8 -0.3 2.7 1.6 4.0 1.82007 146.728 1.8 1.9 0.8 -1.5 0.3 3.8 2.0 4.0 1.22008 147.816 0.7 0.9 -0.3 -1.4 -0.1 -2.2 1.3 2.3 1.0
2008 Q3 147.794 0.5 0.8 -0.9 -1.7 -0.1 -2.7 0.9 2.0 0.8 Q4 147.261 0.0 0.1 -0.8 -1.1 -1.2 -5.0 0.4 0.7 1.32009 Q1 146.200 -1.2 -1.0 -2.3 -2.3 -3.0 -7.2 -1.2 -1.2 1.6 Q2 145.499 -1.8 -1.7 -2.2 -2.3 -4.7 -7.5 -1.8 -2.1 1.7 Q3 144.788 -2.1 -2.0 -2.4 -2.8 -6.1 -7.8 -1.7 -2.5 1.7
quarter-on-quarter percentage changes (s.a.)
2008 Q3 -0.352 -0.2 -0.2 -0.6 -0.6 -0.5 -1.9 -0.1 0.0 0.2 Q4 -0.533 -0.4 -0.3 -0.5 0.1 -1.1 -2.2 -0.4 -0.5 0.62009 Q1 -1.062 -0.7 -0.7 -0.9 -0.8 -1.5 -2.3 -0.8 -0.9 0.2 Q2 -0.700 -0.5 -0.5 -0.5 -0.8 -1.8 -1.4 -0.4 -0.7 0.6 Q3 -0.712 -0.5 -0.5 -0.7 -1.1 -1.6 -2.0 -0.1 -0.5 0.3
2. Unemployment(seasonally adjusted)
Total By age 3) By gender 4)
Millions % of labour Adult Youth Male Female
forceMillions % of labour Millions % of labour Millions % of labour Millions % of labour
force force force force
% of total 2) 100.0 77.9 22.1 50.4 49.6
1 2 3 4 5 6 7 8 9 102005 13.710 9.0 10.668 7.9 3.042 17.5 6.914 8.1 6.796 10.02006 12.876 8.3 10.053 7.3 2.823 16.4 6.387 7.5 6.489 9.42007 11.673 7.5 9.124 6.6 2.549 14.9 5.736 6.7 5.937 8.52008 11.891 7.6 9.263 6.6 2.627 15.4 5.999 6.9 5.892 8.3
2008 Q3 11.938 7.6 9.284 6.6 2.654 15.6 6.059 7.0 5.879 8.3 Q4 12.677 8.0 9.867 7.0 2.810 16.6 6.554 7.6 6.123 8.62009 Q1 13.878 8.8 10.812 7.7 3.067 18.2 7.347 8.5 6.531 9.2 Q2 14.721 9.3 11.493 8.1 3.228 19.3 7.907 9.1 6.814 9.5 Q3 15.247 9.7 11.934 8.4 3.313 20.0 8.252 9.6 6.995 9.8
2009 June 14.896 9.4 11.658 8.2 3.238 19.5 8.012 9.3 6.884 9.6 July 15.071 9.5 11.805 8.4 3.265 19.8 8.135 9.4 6.935 9.7 Aug. 15.215 9.6 11.911 8.4 3.304 20.0 8.219 9.5 6.996 9.8 Sep. 15.454 9.8 12.084 8.6 3.370 20.3 8.400 9.7 7.054 9.9 Oct. 15.610 9.9 12.154 8.6 3.457 20.8 8.478 9.8 7.132 10.0 Nov. 15.712 10.0 12.215 8.7 3.497 21.0 8.564 9.9 7.147 10.0
Source: Eurostat.1) Data for employment refer to persons and are based on the ESA 95. Data for unemployment refer to persons and follow ILO recommendations.2) In 2008.3) Adult: 25 years of age and over; youth: below 25 years of age; rates are expressed as a percentage of the labour force for the relevant age group.4) Rates are expressed as a percentage of the labour force for the relevant gender.

S 55ECB
Monthly Bulletin
January 2010
6GOVERNMENT FINANCE
6.1 Revenue, expenditure and deficit/surplus 1) (as a percentage of GDP)
1. Euro area _ revenue
Total Current revenue Capital revenue Memo
item:Direct Indirect Social Sales Capital Fiscaltaxes Households Corporations taxes Received by EU contributions Employers Employees taxes burden 2)
institutions1 2 3 4 5 6 7 8 9 10 11 12 13 14
2000 46.5 46.2 12.6 9.6 3.0 13.9 0.6 15.8 8.2 4.8 2.2 0.3 0.3 42.62001 45.7 45.4 12.2 9.4 2.7 13.5 0.5 15.6 8.2 4.7 2.1 0.2 0.3 41.62002 45.1 44.8 11.8 9.2 2.5 13.5 0.4 15.6 8.2 4.6 2.1 0.3 0.3 41.22003 45.0 44.4 11.4 9.0 2.3 13.5 0.4 15.7 8.3 4.6 2.1 0.6 0.5 41.12004 44.5 44.0 11.3 8.7 2.5 13.5 0.3 15.5 8.2 4.5 2.1 0.5 0.4 40.72005 44.8 44.4 11.5 8.8 2.6 13.7 0.3 15.4 8.1 4.5 2.2 0.5 0.3 40.92006 45.3 45.0 12.1 8.9 3.0 13.9 0.3 15.3 8.1 4.5 2.1 0.3 0.3 41.52007 45.5 45.2 12.4 9.1 3.1 13.8 0.3 15.1 8.0 4.4 2.1 0.3 0.3 41.62008 44.9 44.7 12.2 9.3 2.7 13.3 0.3 15.3 8.1 4.4 2.1 0.2 0.3 41.0
2. Euro area _ expenditure
Total Current expenditure Capital expenditure Memo
item:Total Compensation Intermediate Interest Current Investment Capital Primary
of consumption transfers Social Subsidies transfers Paid by EU expenditure 3)
employees payments Paid by EU institutionsinstitutions
1 2 3 4 5 6 7 8 9 10 11 12 13 142000 46.6 43.8 10.4 4.8 3.9 24.7 21.6 2.0 0.5 2.8 2.5 1.3 0.0 42.72001 47.6 43.7 10.3 4.8 3.8 24.8 21.7 1.9 0.5 3.9 2.5 1.4 0.0 43.82002 47.7 43.9 10.4 4.9 3.5 25.1 22.2 1.9 0.5 3.8 2.4 1.4 0.0 44.22003 48.1 44.1 10.5 5.0 3.3 25.4 22.5 1.9 0.5 3.9 2.5 1.4 0.1 44.82004 47.5 43.6 10.4 5.0 3.1 25.1 22.3 1.8 0.5 3.9 2.5 1.5 0.1 44.42005 47.4 43.5 10.4 5.0 3.0 25.0 22.3 1.7 0.5 3.9 2.5 1.4 0.0 44.42006 46.7 42.8 10.2 5.0 2.9 24.8 22.0 1.7 0.5 3.8 2.5 1.4 0.0 43.82007 46.1 42.3 10.0 5.0 3.0 24.4 21.6 1.6 0.4 3.8 2.6 1.2 0.0 43.12008 46.9 43.0 10.1 5.1 3.0 24.8 22.0 1.6 0.4 3.9 2.5 1.3 0.0 43.9
3. Euro area _ deficit/surplus, primary deficit/surplus and government consumption
Deficit (-)/surplus (+) Primary Government consumption 4)
deficit (-)/ Total Central State Local Social surplus (+) Total Collective Individual
gov. gov. gov. security Compensation Intermediate Transfers Consumption Sales consumption consumptionfunds of employees consumption in kind of fixed (minus)
via market capitalproducers
1 2 3 4 5 6 7 8 9 10 11 12 13 142000 -0.1 -0.5 -0.1 0.1 0.5 3.8 19.7 10.4 4.8 4.9 1.8 2.2 8.2 11.62001 -1.9 -1.7 -0.4 -0.1 0.3 1.9 19.8 10.3 4.8 4.9 1.8 2.1 8.2 11.72002 -2.6 -2.1 -0.5 -0.2 0.2 0.9 20.2 10.4 4.9 5.1 1.8 2.1 8.3 12.02003 -3.1 -2.4 -0.5 -0.2 0.0 0.2 20.5 10.5 5.0 5.2 1.8 2.1 8.3 12.22004 -3.0 -2.5 -0.4 -0.3 0.2 0.2 20.4 10.4 5.0 5.1 1.9 2.1 8.3 12.12005 -2.6 -2.2 -0.3 -0.2 0.2 0.4 20.4 10.4 5.0 5.1 1.9 2.2 8.2 12.32006 -1.3 -1.4 -0.1 -0.2 0.4 1.6 20.3 10.2 5.0 5.2 1.9 2.1 8.0 12.22007 -0.6 -1.2 0.0 0.0 0.5 2.4 20.0 10.0 5.0 5.2 1.9 2.1 7.9 12.12008 -2.0 -2.0 -0.2 -0.2 0.4 1.0 20.4 10.1 5.1 5.3 1.9 2.1 8.1 12.3
4. Euro area countries _ deficit (-)/surplus (+) 5)
BE DE IE GR ES FR IT CY LU MT NL AT PT SI SK FI1 2 3 4 5 6 7 8 9 10 11 12 13 14 15 16
2005 -2.7 -3.3 1.7 -5.2 1.0 -2.9 -4.3 -2.4 0.0 -2.9 -0.3 -1.6 -6.1 -1.4 -2.8 2.82006 0.3 -1.6 3.0 -2.9 2.0 -2.3 -3.3 -1.2 1.3 -2.6 0.5 -1.6 -3.9 -1.3 -3.5 4.02007 -0.2 0.2 0.3 -3.7 1.9 -2.7 -1.5 3.4 3.7 -2.2 0.2 -0.6 -2.6 0.0 -1.9 5.22008 -1.2 0.0 -7.2 -7.7 -4.1 -3.4 -2.7 0.9 2.5 -4.7 0.7 -0.4 -2.7 -1.8 -2.3 4.5
Sources: ECB for euro area aggregated data; European Commission for data relating to countries’ deficit/surplus.1) Data refer to the Euro 16. The concepts ’revenue’, ’expenditure’ and ’deficit/surplus’ are based on the ESA 95. Transactions involving the EU budget are included and consolidated.
Transactions among Member States’ governments are not consolidated.2) The fiscal burden comprises taxes and social contributions.3) Comprises total expenditure minus interest expenditure.4) Corresponds to final consumption expenditure (P.3) of general government in the ESA 95.5) Includes proceeds from the sale of UMTS licences and settlements under swaps and forward rate agreements.

S 56ECB
Monthly Bulletin
January 2010
6.2 Debt 1) (as a percentage of GDP)
1. Euro area _ by financial instrument and sector of the holder
Total Financial instruments Holders
Currency Loans Short-term Long-term Domestic creditors 2) Other
and securities securities creditors 3)
deposits Total MFIs Other Otherfinancial sectors
corporations
1 2 3 4 5 6 7 8 9 101999 72.0 2.9 14.5 4.3 50.4 48.7 25.4 13.7 9.7 23.32000 69.2 2.7 13.2 3.7 49.6 44.0 22.1 12.3 9.6 25.22001 68.2 2.8 12.4 4.0 49.0 41.8 20.6 11.0 10.2 26.42002 68.0 2.7 11.8 4.6 48.9 40.0 19.4 10.6 10.0 28.02003 69.1 2.1 12.4 5.0 49.6 39.3 19.6 11.0 8.6 29.82004 69.5 2.2 12.0 5.0 50.3 37.5 18.5 10.7 8.3 31.92005 70.0 2.4 11.8 4.7 51.2 35.5 17.2 11.1 7.1 34.62006 68.2 2.4 11.4 4.1 50.2 33.8 17.4 9.4 7.0 34.42007 65.9 2.2 10.8 4.2 48.8 32.1 16.8 8.6 6.7 33.92008 69.3 2.3 10.9 6.7 49.4 32.5 17.2 8.2 7.1 36.8
2. Euro area _ by issuer, maturity and currency denomination
Total Issued by: 4) Original maturity Residual maturity Currencies
Central State Local Social Up to Over Up to Over 1 year Over Euro or Other
gov. gov. gov. security 1 year 1 year Variable 1 year and up to 5 5 years participating currenciesfunds interest rate years currencies
1 2 3 4 5 6 7 8 9 10 11 12 131999 72.0 60.5 6.0 5.1 0.4 7.3 64.6 7.0 13.5 27.8 30.6 69.9 2.02000 69.2 58.1 5.8 4.9 0.4 6.5 62.7 6.2 13.4 27.8 28.1 67.4 1.82001 68.2 57.0 6.0 4.7 0.4 7.0 61.2 5.3 13.7 26.6 27.9 66.7 1.52002 68.0 56.7 6.2 4.7 0.4 7.6 60.4 5.2 15.5 25.3 27.2 66.7 1.32003 69.1 57.0 6.5 5.0 0.6 7.8 61.3 5.0 14.9 26.0 28.2 68.1 0.92004 69.5 57.4 6.6 5.1 0.4 7.8 61.6 4.7 14.8 26.2 28.5 68.6 0.92005 70.0 57.6 6.7 5.2 0.5 7.9 62.2 4.6 14.8 25.6 29.7 69.1 1.02006 68.2 55.9 6.5 5.3 0.5 7.4 60.8 4.3 14.4 24.0 29.8 67.7 0.62007 65.9 54.0 6.2 5.2 0.5 7.4 58.5 4.3 14.2 22.7 29.1 65.4 0.52008 69.3 57.1 6.6 5.2 0.4 10.2 59.1 4.5 17.8 22.2 29.3 68.6 0.7
3. Euro area countries
BE DE IE GR ES FR IT CY LU MT NL AT PT SI SK FI
1 2 3 4 5 6 7 8 9 10 11 12 13 14 15 162005 92.1 68.0 27.6 100.0 43.0 66.4 105.8 69.1 6.1 70.2 51.8 63.9 63.6 27.0 34.2 41.82006 88.1 67.6 25.0 97.1 39.6 63.7 106.5 64.6 6.6 63.6 47.4 62.2 64.7 26.7 30.5 39.32007 84.2 65.0 25.1 95.6 36.1 63.8 103.5 58.3 6.6 62.0 45.5 59.5 63.6 23.3 29.3 35.22008 89.8 65.9 44.1 99.2 39.7 67.4 105.8 48.4 13.5 63.8 58.2 62.6 66.3 22.5 27.7 34.1
Sources: ECB for euro area aggregated data; European Commission for data relating to countries’ debt.1) Data refer to the Euro 16. Gross general government debt at nominal value and consolidated between sub-sectors of government. Holdings by non-resident governments are
not consolidated. Data are partially estimated.2) Holders resident in the country whose government has issued the debt. 3) Includes residents of euro area countries other than the country whose government has issued the debt. 4) Excludes debt held by general government in the country whose government has issued it.

S 57ECB
Monthly Bulletin
January 2010
EURO AREASTATISTICS
Government
finance
6.3 Change in debt 1) (as a percentage of GDP)
1. Euro area _ by source, financial instrument and sector of the holder
Total Source of change Financial instruments Holders
Borrowing Valuation Other Currency Loans Short-term Long-term Domestic Other
requirement 2) effects 3) changes and securities securities creditors 5) MFIs Other creditors 6)
in deposits financialvolume 4) corporations
1 2 3 4 5 6 7 8 9 10 11 122000 1.1 1.2 0.0 -0.1 0.0 -0.5 -0.3 1.9 -2.1 -2.0 -0.6 3.22001 1.9 1.9 -0.1 0.1 0.2 -0.2 0.5 1.5 -0.3 -0.5 -0.8 2.22002 2.1 2.7 -0.5 -0.1 0.0 -0.2 0.7 1.6 -0.4 -0.5 -0.1 2.52003 3.1 3.3 -0.2 0.0 -0.6 0.9 0.6 2.1 0.5 0.8 0.8 2.62004 3.1 3.2 -0.1 0.0 0.2 0.1 0.1 2.7 -0.2 -0.3 0.1 3.32005 3.1 3.0 0.0 0.0 0.3 0.3 -0.1 2.6 -0.7 -0.6 0.8 3.82006 1.5 1.4 0.1 0.0 0.2 0.2 -0.4 1.5 0.0 1.0 -1.2 1.52007 1.1 1.1 0.0 0.0 -0.1 -0.1 0.3 1.0 0.0 0.2 -0.3 1.12008 5.2 5.1 0.1 0.0 0.1 0.4 2.6 2.0 1.3 0.9 -0.2 3.8
2. Euro area _ deficit-debt adjustment
Change in Deficit (-) / Deficit-debt adjustment 8)
debt surplus (+) 7) Total Transactions in main financial assets held by general government Valuation Other Other 9)
effects Exchange changes inTotal Currency Loans Securities 10) Shares and rate volume
and other Privatisations Equity effectsdeposits equity injections
1 2 3 4 5 6 7 8 9 10 11 12 13 142000 1.1 -0.1 1.0 1.0 0.7 0.1 0.2 0.0 -0.3 0.2 0.0 0.1 -0.1 0.12001 1.9 -1.9 0.0 -0.5 -0.6 0.1 0.1 -0.1 -0.3 0.1 -0.1 0.0 0.1 0.62002 2.1 -2.6 -0.5 0.1 0.1 0.0 0.0 -0.1 -0.4 0.1 -0.5 -0.1 -0.1 0.02003 3.1 -3.1 0.0 0.1 0.1 0.0 0.0 0.1 -0.2 0.1 -0.2 -0.1 0.0 0.12004 3.1 -3.0 0.2 0.2 0.2 0.0 0.1 0.0 -0.5 0.2 -0.1 0.0 0.0 0.12005 3.1 -2.6 0.5 0.6 0.3 0.1 0.1 0.1 -0.3 0.2 0.0 0.0 0.0 -0.12006 1.5 -1.3 0.2 0.3 0.3 -0.1 0.3 -0.2 -0.4 0.1 0.1 0.0 0.0 -0.22007 1.1 -0.6 0.5 0.6 0.3 0.0 0.3 0.1 -0.2 0.2 0.0 0.0 0.0 -0.12008 5.2 -2.0 3.2 3.1 0.8 0.7 0.7 0.8 -0.1 0.7 0.1 0.0 0.0 0.0
Source: ECB.1) Data refer to the Euro 16 and are partially estimated. Annual change in gross nominal consolidated debt is expressed as a percentage of GDP, i.e. [debt(t) - debt(t-1)] ÷ GDP(t).2) The borrowing requirement is by definition equal to transactions in debt.3) Includes, in addition to the impact of foreign exchange movements, effects arising from measurement at nominal value (e.g. premia or discounts on securities issued).4) Includes, in particular, the impact of the reclassification of units and certain types of debt assumption.5) Holders resident in the country whose government has issued the debt. 6) Includes residents of euro area countries other than the country whose government has issued the debt. 7) Including proceeds from sales of UMTS licences.8) The difference between the annual change in gross nominal consolidated debt and the deficit as a percentage of GDP. 9) Mainly composed of transactions in other assets and liabilities (trade credits, other receivables/payables and financial derivatives).10) Excluding financial derivatives.
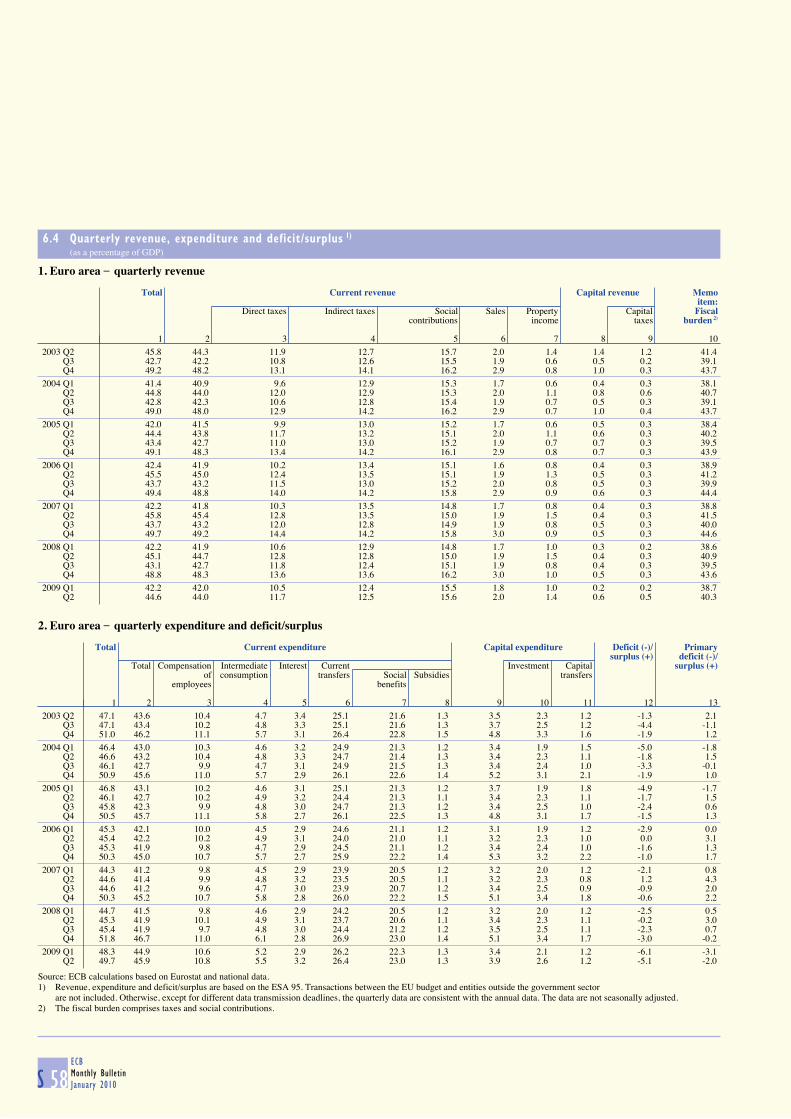
S 58ECB
Monthly Bulletin
January 2010
6.4 Quarterly revenue, expenditure and deficit/surplus 1) (as a percentage of GDP)
1. Euro area _ quarterly revenue
Total Current revenue Capital revenue Memo
item:Direct taxes Indirect taxes Social Sales Property Capital Fiscal
contributions income taxes burden 2)
1 2 3 4 5 6 7 8 9 102003 Q2 45.8 44.3 11.9 12.7 15.7 2.0 1.4 1.4 1.2 41.4 Q3 42.7 42.2 10.8 12.6 15.5 1.9 0.6 0.5 0.2 39.1 Q4 49.2 48.2 13.1 14.1 16.2 2.9 0.8 1.0 0.3 43.72004 Q1 41.4 40.9 9.6 12.9 15.3 1.7 0.6 0.4 0.3 38.1 Q2 44.8 44.0 12.0 12.9 15.3 2.0 1.1 0.8 0.6 40.7 Q3 42.8 42.3 10.6 12.8 15.4 1.9 0.7 0.5 0.3 39.1 Q4 49.0 48.0 12.9 14.2 16.2 2.9 0.7 1.0 0.4 43.72005 Q1 42.0 41.5 9.9 13.0 15.2 1.7 0.6 0.5 0.3 38.4 Q2 44.4 43.8 11.7 13.2 15.1 2.0 1.1 0.6 0.3 40.2 Q3 43.4 42.7 11.0 13.0 15.2 1.9 0.7 0.7 0.3 39.5 Q4 49.1 48.3 13.4 14.2 16.1 2.9 0.8 0.7 0.3 43.92006 Q1 42.4 41.9 10.2 13.4 15.1 1.6 0.8 0.4 0.3 38.9 Q2 45.5 45.0 12.4 13.5 15.1 1.9 1.3 0.5 0.3 41.2 Q3 43.7 43.2 11.5 13.0 15.2 2.0 0.8 0.5 0.3 39.9 Q4 49.4 48.8 14.0 14.2 15.8 2.9 0.9 0.6 0.3 44.42007 Q1 42.2 41.8 10.3 13.5 14.8 1.7 0.8 0.4 0.3 38.8 Q2 45.8 45.4 12.8 13.5 15.0 1.9 1.5 0.4 0.3 41.5 Q3 43.7 43.2 12.0 12.8 14.9 1.9 0.8 0.5 0.3 40.0 Q4 49.7 49.2 14.4 14.2 15.8 3.0 0.9 0.5 0.3 44.62008 Q1 42.2 41.9 10.6 12.9 14.8 1.7 1.0 0.3 0.2 38.6 Q2 45.1 44.7 12.8 12.8 15.0 1.9 1.5 0.4 0.3 40.9 Q3 43.1 42.7 11.8 12.4 15.1 1.9 0.8 0.4 0.3 39.5 Q4 48.8 48.3 13.6 13.6 16.2 3.0 1.0 0.5 0.3 43.62009 Q1 42.2 42.0 10.5 12.4 15.5 1.8 1.0 0.2 0.2 38.7 Q2 44.6 44.0 11.7 12.5 15.6 2.0 1.4 0.6 0.5 40.3
2. Euro area _ quarterly expenditure and deficit/surplus
Total Current expenditure Capital expenditure Deficit (-)/ Primary
surplus (+) deficit (-)/Total Compensation Intermediate Interest Current Investment Capital surplus (+)
of consumption transfers Social Subsidies transfersemployees benefits
1 2 3 4 5 6 7 8 9 10 11 12 132003 Q2 47.1 43.6 10.4 4.7 3.4 25.1 21.6 1.3 3.5 2.3 1.2 -1.3 2.1 Q3 47.1 43.4 10.2 4.8 3.3 25.1 21.6 1.3 3.7 2.5 1.2 -4.4 -1.1 Q4 51.0 46.2 11.1 5.7 3.1 26.4 22.8 1.5 4.8 3.3 1.6 -1.9 1.22004 Q1 46.4 43.0 10.3 4.6 3.2 24.9 21.3 1.2 3.4 1.9 1.5 -5.0 -1.8 Q2 46.6 43.2 10.4 4.8 3.3 24.7 21.4 1.3 3.4 2.3 1.1 -1.8 1.5 Q3 46.1 42.7 9.9 4.7 3.1 24.9 21.5 1.3 3.4 2.4 1.0 -3.3 -0.1 Q4 50.9 45.6 11.0 5.7 2.9 26.1 22.6 1.4 5.2 3.1 2.1 -1.9 1.02005 Q1 46.8 43.1 10.2 4.6 3.1 25.1 21.3 1.2 3.7 1.9 1.8 -4.9 -1.7 Q2 46.1 42.7 10.2 4.9 3.2 24.4 21.3 1.1 3.4 2.3 1.1 -1.7 1.5 Q3 45.8 42.3 9.9 4.8 3.0 24.7 21.3 1.2 3.4 2.5 1.0 -2.4 0.6 Q4 50.5 45.7 11.1 5.8 2.7 26.1 22.5 1.3 4.8 3.1 1.7 -1.5 1.32006 Q1 45.3 42.1 10.0 4.5 2.9 24.6 21.1 1.2 3.1 1.9 1.2 -2.9 0.0 Q2 45.4 42.2 10.2 4.9 3.1 24.0 21.0 1.1 3.2 2.3 1.0 0.0 3.1 Q3 45.3 41.9 9.8 4.7 2.9 24.5 21.1 1.2 3.4 2.4 1.0 -1.6 1.3 Q4 50.3 45.0 10.7 5.7 2.7 25.9 22.2 1.4 5.3 3.2 2.2 -1.0 1.72007 Q1 44.3 41.2 9.8 4.5 2.9 23.9 20.5 1.2 3.2 2.0 1.2 -2.1 0.8 Q2 44.6 41.4 9.9 4.8 3.2 23.5 20.5 1.1 3.2 2.3 0.8 1.2 4.3 Q3 44.6 41.2 9.6 4.7 3.0 23.9 20.7 1.2 3.4 2.5 0.9 -0.9 2.0 Q4 50.3 45.2 10.7 5.8 2.8 26.0 22.2 1.5 5.1 3.4 1.8 -0.6 2.22008 Q1 44.7 41.5 9.8 4.6 2.9 24.2 20.5 1.2 3.2 2.0 1.2 -2.5 0.5 Q2 45.3 41.9 10.1 4.9 3.1 23.7 20.6 1.1 3.4 2.3 1.1 -0.2 3.0 Q3 45.4 41.9 9.7 4.8 3.0 24.4 21.2 1.2 3.5 2.5 1.1 -2.3 0.7 Q4 51.8 46.7 11.0 6.1 2.8 26.9 23.0 1.4 5.1 3.4 1.7 -3.0 -0.22009 Q1 48.3 44.9 10.6 5.2 2.9 26.2 22.3 1.3 3.4 2.1 1.2 -6.1 -3.1 Q2 49.7 45.9 10.8 5.5 3.2 26.4 23.0 1.3 3.9 2.6 1.2 -5.1 -2.0
Source: ECB calculations based on Eurostat and national data.1) Revenue, expenditure and deficit/surplus are based on the ESA 95. Transactions between the EU budget and entities outside the government sector
are not included. Otherwise, except for different data transmission deadlines, the quarterly data are consistent with the annual data. The data are not seasonally adjusted.2) The fiscal burden comprises taxes and social contributions.

S 59ECB
Monthly Bulletin
January 2010
EURO AREASTATISTICS
Government
finance
6.5 Quarterly debt and change in debt (as a percentage of GDP)
1. Euro area _ Maastricht debt by financial instrument 1)
Total Financial instruments
Currency and deposits Loans Short-term securities Long-term securities1 2 3 4 5
2006 Q3 69.9 2.5 11.6 4.7 51.1 Q4 68.2 2.4 11.4 4.1 50.22007 Q1 68.4 2.4 11.5 4.7 49.9 Q2 68.6 2.2 11.2 5.1 50.2 Q3 67.6 2.1 11.0 5.1 49.4 Q4 65.9 2.2 10.8 4.2 48.82008 Q1 66.9 2.1 11.1 5.0 48.7 Q2 67.2 2.1 11.0 4.9 49.1 Q3 67.1 2.1 10.8 5.5 48.6 Q4 69.3 2.3 10.9 6.7 49.42009 Q1 72.7 2.3 11.0 7.9 51.5 Q2 75.8 2.3 11.5 8.4 53.5
2. Euro area _ deficit-debt adjustment
Change in Deficit (-)/ Deficit-debt adjustment Memo
debt surplus (+) item:Total Transactions in main financial assets held by general government Valuation effects Other Borrowing
and other changes requirementTotal Currency Loans Securities Shares and in volume
and deposits other equity1 2 3 4 5 6 7 8 9 10 11
2006 Q3 1.2 -1.6 -0.4 -0.9 -0.7 -0.2 0.2 -0.2 0.3 0.2 0.9 Q4 -2.9 -1.0 -3.9 -2.4 -1.5 -0.5 -0.2 -0.2 -0.2 -1.3 -2.82007 Q1 4.4 -2.1 2.3 2.0 1.0 0.0 0.6 0.2 -0.7 1.0 5.1 Q2 4.2 1.2 5.3 5.0 4.1 0.0 0.6 0.4 0.6 -0.3 3.5 Q3 -0.6 -0.9 -1.5 -1.5 -2.1 0.1 0.4 0.0 0.1 -0.1 -0.7 Q4 -3.4 -0.6 -3.9 -2.8 -1.9 -0.2 -0.6 -0.2 0.0 -1.0 -3.32008 Q1 6.3 -2.5 3.8 3.1 1.9 0.0 0.9 0.3 -0.1 0.7 6.3 Q2 3.7 -0.2 3.5 3.4 1.8 0.3 1.1 0.1 0.0 0.0 3.7 Q3 1.9 -2.3 -0.5 -0.9 -1.6 0.0 0.1 0.6 0.5 0.0 1.4 Q4 8.9 -3.0 5.9 6.5 1.1 2.6 0.8 2.0 0.1 -0.7 8.82009 Q1 11.9 -6.1 5.8 5.4 4.8 -0.1 -0.2 0.9 -0.3 0.7 12.2 Q2 9.3 -5.1 4.2 3.4 1.9 -0.8 1.0 1.2 -0.2 1.0 9.6
C28 Deficit, borrowing requirement and change in debt(four-quarter moving sum as a percentage of GDP)
C29 Maastricht debt(annual change in the debt-to-GDP ratio and underlying factors)
0.0
1.0
2.0
3.0
4.0
5.0
6.0
7.0
8.0
9.0
2001 2002 2003 2004 2005 2006 2007 20080.0
1.0
2.0
3.0
4.0
5.0
6.0
7.0
8.0
9.0
deficitchange in debtborrowing requirement
-4.0
-2.0
0.0
2.0
4.0
6.0
8.0
10.0
2001 2002 2003 2004 2005 2006 2007 2008-4.0
-2.0
0.0
2.0
4.0
6.0
8.0
10.0
deficit-debt adjustmentprimary deficit/surplusgrowth/interest rate differentialchange in debt-to-GDP ratio
Source: ECB calculations based on Eurostat and national data.1) The stock data in quarter t are expressed as a percentage of the sum of GDP in t and the previous three quarters.

S 60ECB
Monthly Bulletin
January 2010
7 EXTERNAL TRANSACTIONS AND POSITIONS
7.1 Summary balance of payments 1) (EUR billions; net transactions)
Current account Net Financial account
Capital lending/ Errors andTotal Goods Services Income Current account borrowing Total Direct Portfolio Financial Other Reserve omissions
transfers to/from investment investment derivatives investment assetsrest of
the world(columns
1+6)
1 2 3 4 5 6 7 8 9 10 11 12 13 142006 -10.2 10.7 41.6 17.3 -79.8 9.1 -1.1 -9.1 -160.2 188.7 -0.6 -35.7 -1.3 10.22007 10.6 46.0 48.3 2.8 -86.4 5.0 15.7 -1.2 -72.9 151.3 -64.6 -9.9 -5.1 -14.42008 -143.3 -11.4 40.6 -74.4 -98.1 10.0 -133.3 163.9 -189.0 350.5 -65.7 72.1 -3.9 -30.72008 Q3 -34.7 -10.4 12.9 -12.8 -24.4 1.7 -32.9 58.3 -23.6 114.7 -8.2 -26.1 1.6 -25.4 Q4 -32.2 -1.9 7.1 -11.7 -25.7 1.7 -30.5 41.5 -61.1 152.7 -13.3 -36.1 -0.5 -11.02009 Q1 -38.0 -7.7 0.5 -2.3 -28.4 1.4 -36.6 55.8 -58.8 129.9 -5.3 -15.7 5.7 -19.1 Q2 -19.8 12.5 7.4 -24.7 -15.0 2.4 -17.4 10.2 -0.6 98.1 20.3 -105.3 -2.4 7.3 Q3 1.9 13.5 11.4 -1.4 -21.6 1.4 3.2 -4.8 -14.9 96.6 0.0 -86.3 -0.2 1.62008 Oct. -9.1 3.2 1.4 -2.7 -11.0 0.2 -9.0 12.8 -4.8 101.1 0.6 -76.2 -8.0 -3.8 Nov. -17.4 -4.8 1.9 -5.3 -9.2 1.6 -15.8 12.7 -53.5 50.2 -10.3 26.7 -0.4 3.2 Dec. -5.7 -0.2 3.8 -3.8 -5.5 -0.1 -5.7 16.1 -2.8 1.4 -3.7 13.4 7.9 -10.32009 Jan. -24.0 -10.6 0.2 -3.2 -10.4 0.2 -23.8 31.8 -22.8 -6.4 3.4 52.4 5.3 -8.0 Feb. -5.4 -0.1 0.4 0.0 -5.6 0.5 -4.9 11.2 -11.7 67.3 -1.3 -44.3 1.2 -6.3 Mar. -8.6 3.0 -0.2 0.9 -12.3 0.7 -7.9 12.7 -24.3 69.0 -7.3 -23.8 -0.8 -4.9 Apr. -10.2 4.0 1.8 -7.8 -8.1 1.9 -8.2 16.1 4.8 18.2 8.9 -16.0 0.1 -7.9 May -13.2 2.0 3.1 -12.2 -6.1 0.2 -13.0 5.3 6.0 37.9 9.2 -45.5 -2.2 7.7 June 3.5 6.5 2.5 -4.7 -0.8 0.2 3.8 -11.2 -11.4 42.0 2.3 -43.8 -0.4 7.5 July 10.1 12.6 4.4 -0.4 -6.6 0.6 10.7 -9.7 8.5 -3.0 7.7 -19.9 -3.0 -1.0 Aug. -3.5 -1.0 3.2 2.0 -7.7 0.7 -2.8 -5.5 2.8 46.1 -6.1 -48.5 0.2 8.4 Sep. -4.7 1.9 3.8 -3.1 -7.3 0.1 -4.6 10.4 -26.2 53.5 -1.6 -17.9 2.6 -5.8 Oct. -3.9 7.5 2.8 0.4 -14.6 0.3 -3.6 14.4 -1.5 19.2 0.8 -3.5 -0.6 -10.8
12-month cumulated transactions 2009 Oct. -82.9 20.8 27.7 -37.1 -94.3 6.9 -76.0 104.3 -132.1 395.4 1.9 -170.7 9.8 -28.3
C30 B.o.p. current account balance(EUR billions)
-200
-150
-100
-50
0
50
100
2001 2002 2003 2004 2005 2006 2007 2008 2009-200
-150
-100
-50
0
50
100
quarterly transactions12-month cumulated transactions
Source: ECB.1) The sign convention is explained in the General Notes.
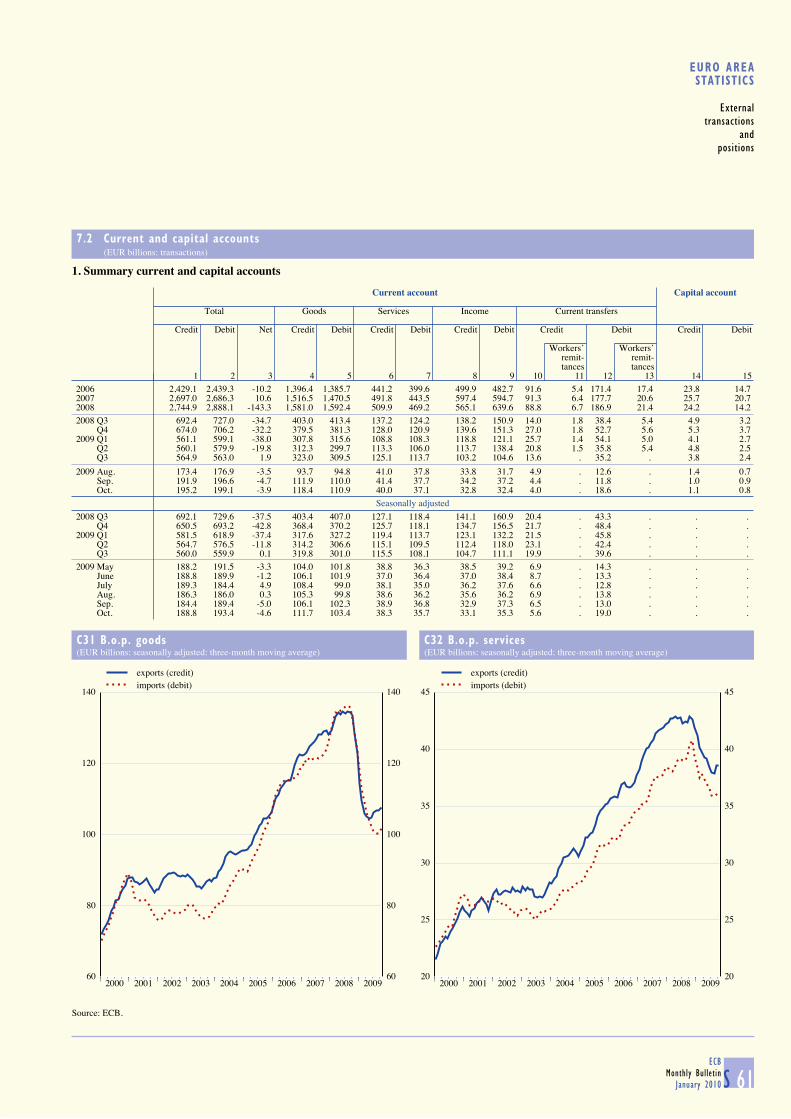
S 61ECB
Monthly Bulletin
January 2010
EURO AREASTATISTICS
External
transactions
and
positions
7.2 Current and capital accounts (EUR billions; transactions)
1. Summary current and capital accounts
Current account Capital account
Total Goods Services Income Current transfers
Credit Debit Net Credit Debit Credit Debit Credit Debit Credit Debit Credit Debit
Workers’ Workers’remit- remit-tances tances
1 2 3 4 5 6 7 8 9 10 11 12 13 14 152006 2,429.1 2,439.3 -10.2 1,396.4 1,385.7 441.2 399.6 499.9 482.7 91.6 5.4 171.4 17.4 23.8 14.72007 2,697.0 2,686.3 10.6 1,516.5 1,470.5 491.8 443.5 597.4 594.7 91.3 6.4 177.7 20.6 25.7 20.72008 2,744.9 2,888.1 -143.3 1,581.0 1,592.4 509.9 469.2 565.1 639.6 88.8 6.7 186.9 21.4 24.2 14.22008 Q3 692.4 727.0 -34.7 403.0 413.4 137.2 124.2 138.2 150.9 14.0 1.8 38.4 5.4 4.9 3.2 Q4 674.0 706.2 -32.2 379.5 381.3 128.0 120.9 139.6 151.3 27.0 1.8 52.7 5.6 5.3 3.72009 Q1 561.1 599.1 -38.0 307.8 315.6 108.8 108.3 118.8 121.1 25.7 1.4 54.1 5.0 4.1 2.7 Q2 560.1 579.9 -19.8 312.3 299.7 113.3 106.0 113.7 138.4 20.8 1.5 35.8 5.4 4.8 2.5 Q3 564.9 563.0 1.9 323.0 309.5 125.1 113.7 103.2 104.6 13.6 . 35.2 . 3.8 2.4
2009 Aug. 173.4 176.9 -3.5 93.7 94.8 41.0 37.8 33.8 31.7 4.9 . 12.6 . 1.4 0.7 Sep. 191.9 196.6 -4.7 111.9 110.0 41.4 37.7 34.2 37.2 4.4 . 11.8 . 1.0 0.9 Oct. 195.2 199.1 -3.9 118.4 110.9 40.0 37.1 32.8 32.4 4.0 . 18.6 . 1.1 0.8
Seasonally adjusted
2008 Q3 692.1 729.6 -37.5 403.4 407.0 127.1 118.4 141.1 160.9 20.4 . 43.3 . . . Q4 650.5 693.2 -42.8 368.4 370.2 125.7 118.1 134.7 156.5 21.7 . 48.4 . . . 2009 Q1 581.5 618.9 -37.4 317.6 327.2 119.4 113.7 123.1 132.2 21.5 . 45.8 . . . Q2 564.7 576.5 -11.8 314.2 306.6 115.1 109.5 112.4 118.0 23.1 . 42.4 . . . Q3 560.0 559.9 0.1 319.8 301.0 115.5 108.1 104.7 111.1 19.9 . 39.6 . . . 2009 May 188.2 191.5 -3.3 104.0 101.8 38.8 36.3 38.5 39.2 6.9 . 14.3 . . . June 188.8 189.9 -1.2 106.1 101.9 37.0 36.4 37.0 38.4 8.7 . 13.3 . . . July 189.3 184.4 4.9 108.4 99.0 38.1 35.0 36.2 37.6 6.6 . 12.8 . . . Aug. 186.3 186.0 0.3 105.3 99.8 38.6 36.2 35.6 36.2 6.9 . 13.8 . . . Sep. 184.4 189.4 -5.0 106.1 102.3 38.9 36.8 32.9 37.3 6.5 . 13.0 . . . Oct. 188.8 193.4 -4.6 111.7 103.4 38.3 35.7 33.1 35.3 5.6 . 19.0 . . .
C31 B.o.p. goods(EUR billions; seasonally adjusted; three-month moving average)
C32 B.o.p. services(EUR billions; seasonally adjusted; three-month moving average)
60
80
100
120
140
2000 2001 2002 2003 2004 2005 2006 2007 2008 200960
80
100
120
140
exports (credit)imports (debit)
20
25
30
35
40
45
2000 2001 2002 2003 2004 2005 2006 2007 2008 200920
25
30
35
40
45
exports (credit)imports (debit)
Source: ECB.

S 62ECB
Monthly Bulletin
January 2010
7.2 Current and capital accounts (EUR billions)
2. Income account(transactions)
Compensation of employees Investment income
Credit Debit Total Direct investment Portfolio investment Other investment
Credit Debit Equity Debt Equity Debt Credit Debit
Credit Debit Credit Debit Credit Debit Credit Debit
Reinv. Reinv.earnings earnings
1 2 3 4 5 6 7 8 9 10 11 12 13 14 15 16 2006 17.4 9.8 482.5 472.8 184.3 40.3 114.5 37.5 20.6 20.2 39.2 96.3 103.6 91.5 134.9 150.4 2007 18.8 10.2 578.6 584.5 208.8 72.7 139.1 46.1 26.4 24.9 45.4 113.2 118.8 110.9 179.3 196.4 2008 19.1 10.5 546.0 629.1 163.6 30.5 153.8 58.2 30.3 25.5 42.9 120.5 123.9 127.8 185.3 201.4 2008 Q2 4.7 2.6 140.7 184.4 42.9 2.2 39.4 7.7 7.6 6.9 14.5 56.6 30.4 31.3 45.3 50.3 Q3 4.6 3.1 133.5 147.8 39.0 10.7 37.7 20.3 7.1 6.2 10.2 23.2 32.1 31.0 45.1 49.8 Q4 4.9 2.7 134.7 148.6 38.4 2.9 38.4 12.8 8.7 6.4 8.3 20.2 30.8 33.6 48.4 50.0 2009 Q1 4.7 2.0 114.1 119.1 37.9 12.1 28.4 17.2 5.5 5.9 6.5 13.0 25.8 36.3 38.3 35.6 Q2 4.6 2.7 109.1 135.7 35.9 2.7 28.4 5.8 5.7 5.8 8.7 36.5 24.2 35.5 34.5 29.6
3. Geographical breakdown(cumulated transactions)
Total EU Member States outside the euro area Brazil Canada China India Japan Russia Switzer- United Other
land StatesTotal Den- Sweden United Other EU EU
mark Kingdom countries insti-2008 Q3 to tutions
2009 Q2 1 2 3 4 5 6 7 8 9 10 11 12 13 14 15 16
Credits
Current account 2,487.5 883.2 53.3 73.3 446.9 252.2 57.7 37.2 33.0 82.4 28.8 51.5 85.9 176.0 356.4 753.0 Goods 1,402.6 472.0 32.0 45.3 201.4 193.2 0.0 20.4 17.1 64.1 21.6 30.7 64.7 87.4 172.3 452.3 Services 487.2 162.0 11.8 12.6 104.6 27.5 5.4 7.3 6.6 14.1 5.4 10.8 12.7 48.4 75.9 144.1 Income 510.2 186.6 8.7 13.8 128.7 28.4 7.0 9.3 8.6 3.9 1.7 9.7 8.1 33.5 101.9 147.0 Investment income 491.4 180.1 8.6 13.7 127.0 27.7 3.1 9.2 8.5 3.8 1.7 9.7 8.0 26.5 100.0 143.7 Current transfers 87.5 62.7 0.7 1.5 12.1 3.1 45.2 0.2 0.7 0.3 0.1 0.4 0.4 6.8 6.4 9.7 Capital account 19.1 17.0 0.0 0.0 1.1 0.1 15.7 0.0 0.0 0.0 0.0 0.0 0.1 0.4 0.5 1.1
Debits
Current account 2,612.2 826.0 44.2 75.8 392.9 214.2 99.0 - 28.5 - - 91.5 - 168.3 370.1 - Goods 1,410.1 387.2 28.4 42.2 152.3 164.3 0.0 24.6 12.7 172.1 19.7 47.7 90.0 76.5 135.0 444.6 Services 459.4 140.0 7.9 11.5 87.2 33.2 0.2 5.4 6.2 11.0 4.5 7.9 8.5 38.3 99.8 137.9 Income 561.8 189.3 7.0 21.0 141.3 12.1 7.9 - 7.9 - - 35.3 - 47.8 128.3 - Investment income 551.2 183.1 6.9 20.9 139.7 7.6 7.9 - 7.8 - - 35.2 - 47.2 127.4 - Current transfers 181.0 109.7 0.9 1.1 12.1 4.6 90.8 1.5 1.8 2.8 0.7 0.6 0.5 5.8 6.9 50.8 Capital account 12.0 2.3 0.0 0.1 1.1 0.2 0.9 0.1 0.1 0.1 0.2 0.1 0.1 0.5 0.8 7.6
Net
Current account -124.7 57.2 9.1 -2.5 53.9 38.0 -41.3 - 4.5 - - -40.0 - 7.7 -13.6 - Goods -7.5 84.8 3.6 3.1 49.2 28.9 0.0 -4.2 4.4 -108.0 1.9 -17.1 -25.3 10.9 37.3 7.7 Services 27.8 22.0 3.9 1.2 17.4 -5.7 5.2 1.9 0.5 3.0 1.0 2.9 4.2 10.1 -23.9 6.2 Income -51.6 -2.7 1.7 -7.1 -12.7 16.3 -0.9 - 0.7 - - -25.6 - -14.3 -26.5 - Investment income -59.9 -3.0 1.7 -7.2 -12.7 20.1 -4.8 - 0.8 - - -25.5 - -20.7 -27.4 - Current transfers -93.4 -47.0 -0.2 0.3 0.0 -1.5 -45.6 -1.2 -1.1 -2.5 -0.6 -0.2 -0.1 1.0 -0.6 -41.1 Capital account 7.2 14.7 0.0 -0.1 0.0 0.0 14.8 -0.1 -0.1 -0.1 -0.2 -0.1 0.0 -0.2 -0.3 -6.5
Source: ECB.

S 63ECB
Monthly Bulletin
January 2010
EURO AREASTATISTICS
External
transactions
and
positions
7.3 Financial account (EUR billions and annual growth rates; outstanding amounts and growth rates at end of period; transactions and other changes during period)
1. Summary financial account
Outstanding amounts (international investment position)
Total 1) Total Direct Portfolio Net Other Reserve
as a % of GDP investment investment financial investment assetsderivatives
Assets Liabilities Net Assets Liabilities Net Assets Liabilities Assets Liabilities Assets Liabilities
1 2 3 4 5 6 7 8 9 10 11 12 13 14
2005 10,838.5 11,554.1 -715.6 133.1 141.8 -8.8 2,790.8 2,444.3 3,887.5 5,057.8 -21.4 3,861.5 4,052.0 320.12006 12,384.0 13,399.8 -1,015.8 144.8 156.6 -11.9 3,153.4 2,729.4 4,372.1 5,950.0 -20.8 4,553.4 4,720.4 325.82007 13,906.9 15,155.8 -1,248.9 154.5 168.4 -13.9 3,572.8 3,130.7 4,631.6 6,556.5 -26.0 5,381.3 5,468.6 347.22008 13,312.5 14,949.2 -1,636.7 143.7 161.3 -17.7 3,744.4 3,217.0 3,763.9 6,078.6 -36.2 5,466.1 5,653.6 374.2
2009 Q1 13,110.5 14,763.2 -1,652.8 142.7 160.7 -18.0 3,837.7 3,237.8 3,638.4 6,015.7 -50.7 5,289.4 5,509.8 395.7 Q2 13,248.6 14,820.6 -1,572.0 145.9 163.2 -17.3 3,958.1 3,318.5 3,859.5 6,300.3 -57.9 5,107.3 5,201.8 381.5
Changes to outstanding amounts
2005 2,209.7 2,070.3 139.3 27.1 25.4 1.7 522.1 209.0 842.5 1,012.3 16.0 790.0 849.1 39.12006 1,545.5 1,845.7 -300.2 18.1 21.6 -3.5 362.6 285.1 484.6 892.2 0.6 691.9 668.4 5.72007 1,522.9 1,756.0 -233.1 16.9 19.5 -2.6 419.4 401.3 259.5 606.5 -5.2 827.9 748.1 21.42008 -594.4 -206.6 -387.8 -6.4 -2.2 -4.2 171.7 86.3 -867.7 -478.0 -10.2 84.8 185.1 27.0
2009 Q1 -202.0 -186.0 -16.1 -9.2 -8.5 -0.7 93.2 20.7 -125.5 -62.9 -14.5 -176.8 -143.8 21.6 Q2 138.1 57.3 80.8 6.2 2.6 3.6 120.5 80.7 221.1 284.6 -7.2 -182.0 -308.0 -14.2
Transactions
2005 1,358.3 1,320.7 37.6 16.7 16.2 0.5 358.4 152.4 416.2 524.5 17.3 584.3 643.7 -18.02006 1,728.3 1,719.1 9.1 20.2 20.1 0.1 417.6 257.4 519.8 708.5 0.6 788.9 753.2 1.32007 1,940.9 1,939.7 1.2 21.6 21.5 0.0 481.2 408.3 436.7 587.9 64.6 953.4 943.4 5.12008 480.6 644.5 -163.9 5.2 7.0 -1.8 326.5 137.5 -9.0 341.5 65.7 93.4 165.5 3.9
2009 Q1 -204.1 -148.4 -55.8 -9.3 -6.8 -2.5 100.1 41.3 -71.2 58.7 5.3 -232.7 -248.4 -5.7 Q2 -23.2 -13.0 -10.2 -1.0 -0.6 -0.5 92.8 92.3 41.1 139.2 -20.3 -139.2 -244.5 2.4 Q3 -15.5 -20.3 4.8 -0.7 -0.9 0.2 58.0 43.1 28.6 125.3 0.0 -102.4 -188.7 0.2
2009 June -5.5 -16.7 11.2 . . . 15.2 3.8 14.8 56.8 -2.3 -33.5 -77.3 0.4 July -35.3 -45.0 9.7 . . . 9.5 18.0 6.5 3.5 -7.7 -46.7 -66.6 3.0 Aug. 25.5 19.9 5.5 . . . 16.7 19.5 31.6 77.7 6.1 -28.8 -77.3 -0.2 Sep. -5.7 4.7 -10.4 . . . 31.7 5.5 -9.5 44.0 1.6 -26.9 -44.8 -2.6 Oct. 82.1 96.5 -14.4 . . . 27.3 25.7 15.1 34.3 -0.8 40.0 36.4 0.6
Other changes
2005 851.4 749.6 101.7 10.5 9.2 1.2 163.7 56.5 426.3 487.7 -1.4 205.7 205.4 57.12006 -182.7 126.6 -309.3 -2.1 1.5 -3.6 -55.0 27.7 -35.2 183.7 0.0 -97.0 -84.8 4.42007 -418.0 -183.7 -234.3 -4.6 -2.0 -2.6 -61.8 -7.0 -177.2 18.6 -69.8 -125.5 -195.3 16.32008 -1,075.0 -851.1 -223.9 -11.6 -9.2 -2.4 -154.9 -51.2 -858.7 -819.5 -75.9 -8.6 19.6 23.1
Other changes due to exchange rate changes
2005 394.2 245.0 149.2 4.8 3.0 1.8 89.8 5.7 158.3 101.4 . 129.2 137.9 17.02006 -343.3 -227.3 -116.0 -4.0 -2.7 -1.4 -72.1 -4.2 -151.7 -99.9 . -105.7 -123.2 -13.92007 -533.1 -293.0 -240.1 -5.9 -3.3 -2.7 -113.3 -5.9 -221.2 -107.5 . -185.0 -179.5 -13.72008 -43.6 64.7 -108.2 -0.5 0.7 -1.2 -17.3 -0.2 -1.5 47.4 . -34.0 17.5 9.2
Other changes due to price changes
2005 284.5 430.3 -145.8 3.5 5.3 -1.8 45.0 40.8 199.0 389.5 -1.4 . . 41.92006 288.6 298.4 -9.8 3.4 3.5 -0.1 45.4 33.5 226.0 264.9 0.0 . . 17.12007 82.4 124.7 -42.4 0.9 1.4 -0.5 46.5 12.5 75.0 112.2 -69.8 . . 30.72008 -1,013.8 -1,102.1 88.3 -10.9 -11.9 1.0 -155.6 -138.4 -803.6 -963.7 -75.9 . . 21.2
Other changes due to other adjustments
2005 172.7 74.3 98.3 2.1 0.9 1.2 29.0 10.0 69.0 -3.1 . 76.5 67.4 -1.82006 -128.0 55.5 -183.5 -1.5 0.6 -2.1 -28.3 -1.6 -109.6 18.6 . 8.7 38.4 1.22007 32.7 -15.4 48.1 0.4 -0.2 0.5 5.0 -13.6 -31.0 13.9 . 59.5 -15.7 -0.82008 -17.6 186.3 -203.9 -0.2 2.0 -2.2 18.0 87.4 -53.6 96.8 . 25.4 2.1 -7.3
Growth rates of outstanding amounts
2005 15.2 13.4 - . . . 15.2 6.8 13.1 12.1 . 18.5 19.5 -5.92006 16.1 14.8 - . . . 15.0 10.5 13.6 13.7 . 20.5 18.7 0.32007 15.7 14.4 - . . . 15.3 14.9 10.0 9.8 . 21.0 20.0 1.62008 3.4 4.3 - . . . 9.2 4.4 -0.5 5.4 . 1.7 3.1 1.1
2009 Q1 -2.3 -0.8 - . . . 7.7 2.8 -4.4 3.8 . -7.8 -7.5 -1.8 Q2 -3.1 -1.7 - . . . 9.3 6.1 -6.1 3.8 . -8.9 -11.5 -1.2 Q3 -4.2 -3.7 . . . . 8.0 5.1 -3.9 3.7 . -12.4 -15.9 -0.7
Source: ECB.1) Net financial derivatives are included in assets.

S 64ECB
Monthly Bulletin
January 2010
7.3 Financial account (EUR billions and annual growth rates; outstanding amounts and growth rates at end of period; transactions during period)
2. Direct investment
Outstanding amounts (international investment position)
By resident units abroad By non-resident units in the euro area
Total Equity capital Other capital Total Equity capital Other capital and reinvested earnings (mostly inter-company loans) and reinvested earnings (mostly inter-company loans)
Total MFIs Non- Total MFIs Non- Total In MFIs In Total To MFIs ToMFIs MFIs non-MFIs non-MFIs
1 2 3 4 5 6 7 8 9 10 11 12 13 14
2007 3,572.8 2,886.7 240.8 2,645.9 686.1 6.4 679.7 3,130.7 2,401.0 69.5 2,331.5 729.8 15.4 714.42008 3,744.4 2,946.9 234.8 2,712.1 797.5 9.3 788.2 3,217.0 2,405.5 77.0 2,328.5 811.6 16.4 795.1
2009 Q1 3,837.7 2,988.9 253.9 2,735.1 848.7 10.6 838.1 3,237.8 2,427.6 78.7 2,348.9 810.1 16.8 793.4 Q2 3,958.1 3,092.0 266.5 2,825.5 866.1 10.4 855.7 3,318.5 2,492.7 80.9 2,411.9 825.8 16.6 809.1
Transactions
2007 481.2 373.0 25.5 347.4 108.2 -0.1 108.4 408.3 310.5 5.1 305.4 97.8 1.4 96.42008 326.5 198.1 2.2 195.9 128.4 -0.2 128.6 137.5 91.3 -1.0 92.2 46.2 1.6 44.62009 Q1 100.1 55.6 20.4 35.2 44.6 0.9 43.7 41.3 44.0 1.2 42.8 -2.7 0.1 -2.8 Q2 92.8 75.4 9.5 65.9 17.4 0.6 16.8 92.3 71.0 1.3 69.7 21.2 0.4 20.8 Q3 58.0 21.3 1.8 19.4 36.7 0.2 36.5 43.1 32.7 1.1 31.6 10.4 0.2 10.2
2009 June 15.2 14.2 2.8 11.4 1.0 -1.1 2.0 3.8 5.1 0.0 5.1 -1.3 0.9 -2.2 July 9.5 2.3 3.0 -0.7 7.3 -0.1 7.3 18.0 14.1 0.3 13.8 3.9 0.9 3.1 Aug. 16.7 11.7 2.2 9.5 5.0 0.3 4.8 19.5 13.7 0.3 13.3 5.9 -0.6 6.5 Sep. 31.7 7.3 -3.4 10.6 24.4 0.0 24.4 5.5 5.0 0.5 4.5 0.5 -0.1 0.6 Oct. 27.3 24.3 -0.5 24.9 2.9 0.3 2.6 25.7 16.4 0.3 16.1 9.3 0.1 9.2
Growth rates
2007 15.3 14.6 11.3 14.9 18.5 -55.0 18.7 14.9 14.8 8.3 15.0 15.3 6.3 15.52008 9.2 6.9 0.8 7.5 18.8 -1.6 19.1 4.4 3.8 -1.4 4.0 6.4 9.9 6.3
2009 Q1 7.7 5.4 5.9 5.3 16.8 -20.9 17.3 2.8 4.1 -0.1 4.2 -0.8 9.8 -1.1 Q2 9.3 7.9 7.8 7.9 14.5 5.7 14.6 6.1 7.4 4.6 7.5 2.1 4.9 2.1 Q3 8.0 6.1 12.8 5.5 15.2 14.0 15.2 5.1 7.1 4.8 7.1 -0.7 3.6 -0.8
C33 B.o.p. net direct and portfolio investment(EUR billions)
-300
-200
-100
0
100
200
300
400
500
600
2001 2002 2003 2004 2005 2006 2007 2008 2009-300
-200
-100
0
100
200
300
400
500
600
direct investment (quarterly transactions)portfolio investment (quarterly transactions)direct investment (12-month cumulated transactions)portfolio investment (12-month cumulated transactions)
Source: ECB.

S 65ECB
Monthly Bulletin
January 2010
EURO AREASTATISTICS
External
transactions
and
positions
7.3 Financial account (EUR billions and annual growth rates; outstanding amounts and growth rates at end of period; transactions during period)
3. Portfolio investment assets
Outstanding amounts (international investment position)
Total Equity Debt instruments
Bonds and notes Money market instruments
Total MFIs Non-MFIs Total MFIs Non-MFIs Total MFIs Non-MFIs
Euro- General Euro- General Euro- Generalsystem government system government system government
1 2 3 4 5 6 7 8 9 10 11 12 13 14 15 16
2007 4,631.6 1,961.8 136.7 2.8 1,825.1 44.6 2,279.7 990.2 16.4 1,289.5 17.2 390.1 297.3 34.6 92.8 0.52008 3,763.9 1,162.7 68.4 3.0 1,094.3 27.3 2,179.1 970.9 19.9 1,208.2 18.4 422.1 353.3 61.6 68.8 1.3
2009 Q1 3,638.4 1,068.8 60.8 2.9 1,008.0 27.3 2,139.5 946.9 17.1 1,192.6 17.4 430.1 360.5 58.9 69.6 1.7 Q2 3,859.5 1,209.2 66.7 3.0 1,142.4 29.2 2,220.2 927.7 17.3 1,292.5 18.2 430.2 353.1 55.3 77.0 1.5
Transactions
2007 436.7 64.2 26.7 0.0 37.5 8.2 291.5 148.3 4.9 143.2 3.3 81.0 63.4 26.3 17.6 0.82008 -9.0 -101.8 -37.9 0.6 -63.9 0.1 95.4 43.9 3.3 51.5 2.6 -2.5 26.8 15.1 -29.4 0.42009 Q1 -71.2 -38.1 -5.7 0.0 -32.4 0.1 -56.1 -49.1 -2.4 -7.0 -1.2 23.0 21.6 -0.5 1.4 0.4 Q2 41.1 9.4 -0.4 0.0 9.8 0.3 11.7 -34.9 0.1 46.6 0.2 20.1 12.5 -1.8 7.6 -0.3 Q3 28.6 10.6 3.3 0.0 7.3 . 14.9 -13.6 -0.7 28.5 . 3.1 8.7 -3.9 -5.6 .
2009 June 14.8 12.5 -0.5 0.0 13.1 . -2.7 3.6 -0.3 -6.3 . 5.0 5.1 -1.5 -0.1 . July 6.5 6.4 1.1 0.0 5.3 . -0.3 -10.6 0.7 10.2 . 0.4 -1.4 0.8 1.8 . Aug. 31.6 4.0 1.2 0.0 2.8 . 21.9 12.0 -0.2 9.8 . 5.8 4.1 -3.0 1.7 . Sep. -9.5 0.2 0.9 0.0 -0.7 . -6.6 -15.1 -1.2 8.4 . -3.1 6.0 -1.8 -9.0 . Oct. 15.1 8.2 1.8 0.0 6.3 . 5.9 -2.4 0.6 8.3 . 1.0 -0.2 3.3 1.2 .
Growth rates
2007 10.0 3.3 22.2 -0.5 2.0 21.3 14.0 16.7 38.9 12.0 23.3 23.1 23.7 272.7 25.8 277.42008 -0.5 -6.1 -29.7 24.6 -4.4 0.2 4.3 4.5 20.4 4.0 15.6 -0.5 9.1 41.9 -32.1 70.8
2009 Q1 -4.4 -7.9 -22.0 18.8 -7.0 1.3 -0.9 -3.8 14.4 1.5 5.3 -10.5 -2.3 43.6 -38.8 36.6 Q2 -6.1 -8.5 -15.5 14.9 -8.1 -0.9 -4.0 -10.4 -12.9 1.3 -3.1 -10.4 -7.0 -18.6 -24.2 39.2 Q3 -3.9 -5.1 -9.0 12.5 -4.9 . -4.0 -11.4 -19.6 1.9 . -1.1 5.5 -18.4 -26.0 .
4. Portfolio investment liabilities
Outstanding amounts (international investment position)
Total Equity Debt instruments
Bonds and notes Money market instruments
Total MFIs Non-MFIs Total MFIs Non-MFIs Total MFIs Non-MFIs
General Generalgovernment government
1 2 3 4 5 6 7 8 9 10 11 12
2007 6,556.5 3,272.5 594.6 2,677.9 3,041.1 1,143.5 1,897.6 1,118.5 243.0 141.5 101.5 76.12008 6,078.6 2,168.7 640.7 1,528.0 3,466.5 1,263.8 2,202.8 1,357.1 443.3 108.9 334.4 272.9
2009 Q1 6,015.7 1,986.4 649.7 1,336.8 3,557.5 1,248.9 2,308.5 1,402.3 471.8 91.9 379.9 320.4 Q2 6,300.3 2,231.5 680.2 1,551.2 3,558.6 1,212.7 2,345.9 1,430.9 510.2 81.3 428.9 359.8
Transactions
2007 587.9 157.9 24.3 133.6 367.1 156.5 210.6 141.7 62.9 52.9 10.0 20.42008 341.5 -124.8 93.4 -218.2 250.0 31.5 218.6 199.2 216.3 -2.5 218.9 185.72009 Q1 58.7 -51.3 -4.4 -46.8 90.4 -11.0 101.4 67.6 19.6 -11.4 31.0 51.6 Q2 139.2 49.2 4.8 44.4 38.4 -7.5 45.8 56.9 51.7 -0.1 51.8 51.0 Q3 125.3 65.3 30.2 35.1 3.9 15.7 -11.7 . 56.0 -3.4 59.4 .
2009 June 56.8 37.9 0.5 37.4 8.8 -16.1 24.9 . 10.1 12.4 -2.2 . July 3.5 33.8 12.3 21.6 -45.5 3.8 -49.3 . 15.2 -16.5 31.7 . Aug. 77.7 35.6 18.3 17.3 22.9 14.8 8.1 . 19.3 4.7 14.6 . Sep. 44.0 -4.1 -0.3 -3.8 26.6 -3.0 29.5 . 21.6 8.5 13.1 . Oct. 34.3 -21.2 -3.1 -18.0 33.5 12.8 20.7 . 22.0 1.9 20.1 .
Growth rates
2007 9.8 5.2 4.4 5.3 13.5 15.9 12.2 14.2 31.2 54.5 13.7 33.22008 5.4 -5.4 16.0 -10.5 8.3 2.8 11.5 17.8 88.3 -2.0 202.0 246.5
2009 Q1 3.8 -10.0 2.1 -13.6 9.0 1.1 13.6 18.5 83.0 -18.5 208.0 250.6 Q2 3.8 -7.0 -0.2 -9.0 4.6 -5.0 10.4 17.7 99.0 -17.9 230.7 297.0 Q3 3.7 -4.8 7.1 -9.0 3.1 -3.8 7.2 . 66.1 -21.1 118.2 .
Source: ECB.

S 66ECB
Monthly Bulletin
January 2010
7.3 Financial account (EUR billions and annual growth rates; outstanding amounts and growth rates at end of period; transactions during period)
5. Other investment assets
Outstanding amounts (international investment position)
Total Eurosystem MFIs General Other sectors
(excluding Eurosystem) government
Total Loans/ Other Total Loans/ Other Trade Loans/currency Trade Loans/currencycurrency assets currency assets credits and deposits credits and deposits
and anddeposits deposits Currency Currency
and anddeposits deposits
1 2 3 4 5 6 7 8 9 10 11 12 13 14 15
2007 5,381.3 36.9 35.6 1.4 3,354.4 3,283.2 71.2 107.8 12.7 48.8 13.7 1,882.1 196.2 1,518.5 476.52008 5,466.1 28.8 27.7 1.0 3,280.7 3,221.6 59.1 101.0 12.1 40.9 7.2 2,055.6 186.1 1,644.9 474.5
2009 Q1 5,289.4 21.7 21.4 0.3 3,094.0 3,037.2 56.8 108.3 12.2 46.9 16.3 2,065.4 185.5 1,647.2 458.1 Q2 5,107.3 27.9 27.7 0.3 2,972.6 2,936.8 35.9 103.1 12.1 42.1 11.2 2,003.7 189.3 1,575.9 437.7
Transactions
2007 953.4 22.0 22.0 0.0 546.8 539.6 7.2 -7.7 -1.4 -7.2 -5.5 392.2 14.1 335.3 55.32008 93.4 -9.4 -9.4 0.0 -50.2 -65.5 15.3 -6.6 -1.1 -6.8 -5.8 159.6 2.5 97.6 -31.92009 Q1 -232.7 -8.2 -8.2 0.0 -236.4 -234.6 -1.8 6.5 0.0 5.8 9.1 5.3 -3.5 8.7 1.1 Q2 -139.2 7.0 7.0 0.0 -82.8 -69.2 -13.6 -3.8 0.0 -4.5 -5.1 -59.6 5.7 -69.5 -19.2 Q3 -102.4 -4.1 . . -90.5 . . -5.0 . . -4.0 -2.8 . 7.5 11.1
2009 June -33.5 5.3 . . -53.1 . . 2.0 . . 1.3 12.2 . . 4.2 July -46.7 -2.2 . . -35.4 . . -4.5 . . -4.4 -4.6 . . 1.2 Aug. -28.8 -0.1 . . -31.9 . . 1.3 . . 2.2 1.9 . . 16.2 Sep. -26.9 -1.8 . . -23.2 . . -1.7 . . -1.8 -0.1 . . -6.2 Oct. 40.0 1.9 . . 13.6 . . -0.3 . . -0.5 24.8 . . 3.7
Growth rates
2007 21.0 157.3 173.7 -1.7 18.6 18.8 11.4 -6.4 -9.8 -12.4 -28.6 26.6 7.5 28.8 14.02008 1.7 -26.2 -26.9 5.0 -1.5 -2.0 21.6 -6.2 -8.9 -14.0 -44.4 8.6 1.2 6.5 -6.9
2009 Q1 -7.8 -57.3 -58.7 6.0 -14.1 -14.6 11.2 4.6 -6.7 9.2 39.1 4.3 -3.1 3.6 -11.3 Q2 -8.9 -28.7 -30.3 5.6 -13.8 -13.9 -16.5 -4.9 -3.2 -13.2 -35.7 0.0 -4.6 -1.0 -3.8 Q3 -12.4 -35.5 . . -18.3 . . -2.2 . . -21.3 -1.9 . -1.5 -1.8
6. Other investment liabilities
Outstanding amounts (international investment position)
Total Eurosystem MFIs General Other sectors
(excluding Eurosystem) government
Total Loans/ Other Total Loans/ Other Total Trade Loans Other Total Trade Loans Othercurrency liabilities currency liabilities credits liabilities credits liabilities
and anddeposits deposits
1 2 3 4 5 6 7 8 9 10 11 12 13 14 15
2007 5,468.6 201.7 201.4 0.2 3,935.1 3,872.6 62.5 52.3 0.0 46.9 5.4 1,279.5 156.9 1,009.7 112.82008 5,653.6 482.3 481.9 0.4 3,751.8 3,698.1 53.6 61.9 0.0 58.0 3.9 1,357.6 170.2 1,069.6 117.8
2009 Q1 5,509.8 404.2 400.9 3.3 3,702.6 3,649.0 53.6 58.7 0.0 55.5 3.2 1,344.3 180.5 1,043.6 120.2 Q2 5,201.8 313.5 308.4 5.1 3,579.1 3,542.7 36.4 56.6 0.0 53.3 3.2 1,252.6 182.6 953.7 116.3
Transactions
2007 943.4 91.4 91.4 0.0 625.3 620.5 4.8 -1.0 0.0 -2.0 1.0 227.8 10.0 218.9 -1.12008 165.5 280.7 280.6 0.1 -181.0 -191.9 10.9 9.5 0.0 11.0 -1.5 56.3 10.5 46.1 -0.32009 Q1 -248.4 -82.2 -85.1 2.9 -112.7 -111.4 -1.3 -3.7 0.0 -2.7 -0.9 -49.9 -5.1 -40.2 -4.6 Q2 -244.5 -89.3 -91.1 1.8 -82.2 -70.9 -11.4 -2.6 0.0 -3.1 0.5 -70.3 4.7 -74.5 -0.5 Q3 -188.7 -46.6 . . -80.2 . . 1.4 . . . -63.2 . . .
2009 June -77.3 -40.2 . . -52.4 . . -2.4 . . . 17.8 . . . July -66.6 -15.7 . . -30.8 . . -0.4 . . . -19.6 . . . Aug. -77.3 -10.0 . . -43.3 . . 0.4 . . . -24.4 . . . Sep. -44.8 -21.0 . . -6.0 . . 1.4 . . . -19.1 . . . Oct. 36.4 -8.3 . . 17.8 . . 5.9 . . . 21.0 . . .
Growth rates
2007 20.0 79.2 79.4 -6.9 18.0 18.2 9.5 -1.9 27.4 -4.1 20.7 20.7 6.8 26.2 0.52008 3.1 141.3 141.4 20.8 -4.6 -4.9 17.3 18.3 -20.1 23.6 -27.9 4.3 6.6 4.5 -0.8
2009 Q1 -7.5 82.4 81.3 439.8 -13.5 -13.9 10.3 12.5 -11.4 14.2 -12.6 -4.1 -0.4 -4.4 -7.7 Q2 -11.5 19.1 17.3 1,123.2 -15.0 -15.1 -9.6 10.1 41.1 11.3 -6.0 -7.7 -3.3 -9.2 -1.5 Q3 -15.9 -28.5 . . -16.4 . . 7.8 . . . -11.7 . . .
Source: ECB.

S 67ECB
Monthly Bulletin
January 2010
EURO AREASTATISTICS
External
transactions
and
positions
7.3 Financial account (EUR billions and annual growth rates; outstanding amounts and growth rates at end of period; transactions during period)
7. Reserve assets
Outstanding amounts (international investment position)
Reserve assets Memo
items
Total Monetary gold Special Reserve Foreign exchange Other Other Predetermined
drawing position claims foreign short-termIn In fine rights in the Total Currency and Securities Financial currency net
EUR troy IMF deposits derivatives assets drainsbillions ounces on
(millions) With With Total Equity Bonds Money foreignmonetary banks and market currency
authorities notes instrumentsand the BIS
1 2 3 4 5 6 7 8 9 10 11 12 13 14 15 16
2005 320.1 163.4 375.861 4.3 10.6 141.7 12.6 21.4 107.9 0.6 69.4 38.0 -0.2 0.0 25.6 -17.92006 325.8 176.3 365.213 4.6 5.2 139.7 6.3 22.5 110.7 0.5 79.3 30.8 0.3 0.0 24.6 -21.52007 347.2 201.0 353.688 4.6 3.6 138.0 7.2 22.0 108.5 0.4 87.8 20.3 0.3 0.0 44.3 -38.5
2008 Q4 374.2 217.0 349.190 4.7 7.3 145.1 7.6 8.0 129.5 0.6 111.3 17.6 0.0 0.1 262.8 -245.72009 Q1 395.7 240.4 349.059 4.8 8.4 142.1 8.4 3.7 129.9 0.6 108.6 20.7 0.1 0.1 155.4 -141.4 Q2 381.5 229.8 347.546 4.2 11.3 136.1 9.5 6.5 119.9 0.5 99.3 20.0 0.2 0.1 77.6 -65.6
2009 Sep. 430.9 236.1 347.200 49.8 11.7 133.2 12.7 7.1 113.2 - - - 0.2 0.0 56.7 -42.4 Oct. 437.9 244.0 347.197 49.5 11.6 132.8 11.7 9.1 111.7 - - - 0.2 0.0 43.4 -36.0 Nov. 464.2 271.7 347.169 49.6 10.3 132.6 11.8 8.4 112.2 - - - 0.2 0.0 39.5 -32.0
Transactions
2006 1.3 -4.2 - 0.5 -5.2 10.2 -6.1 2.7 13.7 0.0 19.4 -5.7 0.0 0.0 - - 2007 5.1 -3.2 - 0.3 -0.9 8.8 1.0 1.6 6.2 0.0 14.5 -8.3 0.0 0.0 - - 2008 3.9 -2.1 - -0.1 3.8 2.3 5.0 -15.8 11.8 0.1 15.8 -4.1 1.3 0.1 - -
2009 Q1 -5.7 -0.9 - 0.0 0.9 -5.7 2.2 -4.9 -3.7 0.0 -6.6 2.9 0.6 0.0 - - Q2 2.4 0.1 - -0.5 3.3 -0.5 -0.4 2.9 -3.2 0.0 -2.0 -1.2 0.2 0.0 - - Q3 0.2 - - - - - - - - - - - - - - -
Growth rates
2006 0.3 -2.4 - 11.6 -49.0 7.7 -48.4 12.7 13.4 0.0 29.2 -15.3 - - - - 2007 1.6 -1.7 - 7.3 -18.3 6.3 14.9 6.4 5.7 1.1 18.6 -27.6 - - - - 2008 1.1 -1.0 - -2.6 105.3 1.7 67.7 -69.1 10.8 28.0 17.9 -20.6 - - - -
2009 Q1 -1.8 -1.1 - 4.6 135.1 -6.3 142.1 -90.5 6.7 2.6 3.7 25.5 - - - - Q2 -1.2 -0.9 - -6.6 174.2 -6.5 106.0 -80.8 2.1 2.6 0.0 15.5 - - - - Q3 -0.7 - - - - - - - - - - - - - - -
Source: ECB.

S 68ECB
Monthly Bulletin
January 2010
7.3 Financial account (EUR billions; outstanding amounts at end of period; transactions during period)
8. Geographical breakdown
Total EU Member States outside the euro area Canada China Japan Switzer- United Offshore Interna- Otherland States financial tional countries
Total Denmark Sweden United Other EU EU centres organisa-Kingdom countries institutions tions
1 2 3 4 5 6 7 8 9 10 11 12 13 14 15
2008 Outstanding amounts (international investment position)
Direct investment 527.4 -93.0 -2.1 -30.2 -293.9 233.6 -0.3 41.1 35.2 -9.5 126.2 -68.7 -7.1 -0.2 503.3 Abroad 3,744.4 1,255.3 34.9 93.9 865.7 260.8 0.0 104.1 38.8 71.7 384.5 734.6 418.5 0.1 736.8
Equity/reinvested earnings 2,946.9 967.5 30.1 60.3 660.1 216.9 0.0 83.3 32.0 53.6 335.3 551.3 386.7 0.0 537.4 Other capital 797.5 287.9 4.8 33.6 205.7 43.8 0.0 20.7 6.9 18.1 49.2 183.4 31.9 0.0 199.4
In the euro area 3,217.0 1,348.3 37.0 124.1 1,159.7 27.1 0.3 63.0 3.6 81.2 258.3 803.3 425.6 0.3 233.4 Equity/reinvested earnings 2,405.5 1,096.8 28.3 97.4 956.9 13.9 0.2 50.6 0.8 68.7 191.1 590.8 284.1 0.1 122.5 Other capital 811.6 251.5 8.7 26.7 202.8 13.2 0.1 12.4 2.9 12.5 67.2 212.5 141.6 0.2 110.9
Portfolio investment assets 3,763.9 1,242.2 63.7 122.4 895.5 80.7 80.0 82.8 25.6 213.4 95.4 1,225.8 458.4 30.5 389.8 Equity 1,162.7 228.7 6.4 19.9 191.7 9.8 0.9 18.2 22.8 84.5 81.3 378.8 197.8 2.0 148.6 Debt instruments 2,601.3 1,013.6 57.3 102.5 703.7 71.0 79.1 64.6 2.9 128.8 14.1 847.0 260.6 28.5 241.3
Bonds and notes 2,179.1 849.1 50.3 81.5 569.1 70.3 77.8 61.6 2.3 61.7 12.6 705.4 238.2 28.4 219.9 Money market instruments 422.1 164.5 6.9 21.0 134.6 0.6 1.3 3.0 0.6 67.1 1.5 141.5 22.4 0.1 21.4
Other investment -187.5 -91.1 51.1 28.0 -110.4 108.8 -168.6 -6.2 -16.0 -10.2 -131.2 -286.3 2.1 1.8 349.6 Assets 5,466.1 2,419.7 100.9 83.3 2,020.2 201.8 13.4 25.7 34.0 109.4 276.5 852.5 640.7 58.7 1,048.8
General government 101.0 15.0 0.7 0.4 3.6 0.7 9.7 0.0 1.8 0.2 0.1 3.4 1.4 40.1 39.1 MFIs 3,309.5 1,731.1 83.9 58.3 1,419.1 167.9 1.9 16.8 14.5 79.0 164.5 418.9 367.7 18.2 498.8 Other sectors 2,055.6 673.5 16.4 24.6 597.5 33.3 1.8 8.9 17.7 30.3 111.9 430.2 271.7 0.5 510.9
Liabilities 5,653.6 2,510.8 49.8 55.3 2,130.6 93.0 182.0 32.0 50.0 119.5 407.7 1,138.8 638.6 57.0 699.1 General government 61.9 32.5 0.0 0.1 2.5 0.0 29.7 0.0 0.0 0.6 0.5 7.0 0.3 17.7 3.3 MFIs 4,234.1 1,907.6 38.9 33.5 1,664.9 70.0 100.2 24.4 32.1 91.2 328.7 751.1 535.1 36.8 527.2 Other sectors 1,357.6 570.8 10.8 21.7 463.2 23.0 52.0 7.5 17.9 27.8 78.6 380.8 103.2 2.5 168.7
2008 Q3 to 2009 Q2 Cumulated transactions
Direct investment 144.1 73.8 -0.2 8.6 50.9 14.4 0.0 -2.3 1.8 -4.7 -34.3 31.6 64.5 0.0 13.6 Abroad 337.2 132.7 1.8 23.7 98.1 9.2 0.0 6.8 2.3 0.7 -11.3 91.6 67.2 0.0 47.2
Equity/reinvested earnings 227.5 76.7 1.1 12.9 57.8 4.9 0.0 6.9 3.1 1.8 -5.7 62.7 48.0 0.0 34.0 Other capital 109.7 56.0 0.7 10.8 40.3 4.4 0.0 -0.2 -0.7 -1.1 -5.6 28.9 19.2 0.0 13.2
In the euro area 193.1 58.9 1.9 15.0 47.2 -5.2 0.0 9.0 0.5 5.4 23.0 60.0 2.8 0.0 33.5 Equity/reinvested earnings 176.1 50.7 1.0 12.7 35.0 2.0 0.0 9.9 0.2 2.5 12.9 63.9 12.7 0.0 23.2 Other capital 16.9 8.2 1.0 2.3 12.1 -7.2 0.0 -0.9 0.3 2.8 10.1 -3.9 -9.9 0.0 10.3
Portfolio investment assets -265.6 9.1 4.4 12.3 -18.8 -6.9 18.2 14.9 2.7 -45.9 4.4 -107.6 -103.3 -1.1 -38.9 Equity -128.4 -22.8 0.3 -0.7 -21.8 -0.5 0.0 7.4 3.7 -19.4 4.0 -41.5 -40.8 0.0 -19.0 Debt instruments -137.2 31.9 4.1 13.0 3.0 -6.4 18.2 7.5 -1.0 -26.4 0.4 -66.1 -62.5 -1.1 -19.9
Bonds and notes -90.8 46.7 3.7 10.8 24.6 -6.7 14.2 2.5 -0.5 -17.9 -0.1 -47.6 -55.4 -1.5 -17.0 Money market instruments -46.4 -14.7 0.4 2.2 -21.6 0.2 4.0 5.0 -0.5 -8.5 0.4 -18.5 -7.1 0.4 -2.9
Other investment 183.2 -258.8 -2.9 -17.7 -268.7 46.6 -16.1 -5.4 -5.3 69.9 54.8 64.6 179.0 11.1 73.3 Assets -499.0 -294.5 -17.1 -12.7 -305.5 39.4 1.4 0.7 -8.3 -4.4 -62.9 -140.9 34.6 -6.7 -16.4
General government -5.2 -5.8 -0.2 -0.1 -5.8 -0.4 0.7 0.0 0.0 0.0 0.1 0.1 0.0 1.2 -0.9 MFIs -492.1 -280.8 -14.3 -11.6 -291.9 36.3 0.7 0.0 -9.9 1.7 -58.1 -53.5 -18.4 -7.9 -65.3 Other sectors -1.7 -7.9 -2.6 -1.0 -7.8 3.4 0.0 0.6 1.7 -6.1 -5.0 -87.5 52.9 0.0 49.7
Liabilities -682.2 -35.7 -14.3 5.0 -36.8 -7.2 17.5 6.1 -3.0 -74.4 -117.8 -205.4 -144.4 -17.8 -89.8 General government 5.0 2.0 0.0 -0.1 0.6 0.0 1.4 0.0 0.0 -0.1 0.0 0.3 0.0 3.0 -0.2 MFIs -582.1 -22.5 -14.0 6.9 -18.2 -5.1 7.9 3.0 -3.2 -76.4 -102.1 -95.5 -151.8 -20.6 -112.8 Other sectors -105.1 -15.2 -0.2 -1.8 -19.2 -2.1 8.1 3.0 0.2 2.2 -15.6 -110.2 7.4 -0.2 23.3
Source: ECB.

S 69ECB
Monthly Bulletin
January 2010
EURO AREASTATISTICS
External
transactions
and
positions
7.4 Monetary presentation of the balance of payments 1) (EUR billions; transactions)
B.o.p. items mirroring net transactions by MFIs
Total Current Transactions by non-MFIs Financial Errors
and derivatives andcapital Direct investment Portfolio investment Other investment omissions
account balance By By non- Assets Liabilities Assets Liabilities
resident residentunits units in Equity Debt Equity Debt
abroad euro area instruments instruments1 2 3 4 5 6 7 8 9 10 11 12
2006 -17.6 8.0 -391.6 256.4 -136.2 -135.5 151.6 243.3 -256.5 229.9 -0.3 13.32007 -112.5 22.8 -457.6 401.0 -38.3 -160.9 134.4 223.0 -384.8 226.8 -64.8 -14.12008 -237.6 -126.2 -325.0 136.6 63.8 -21.6 -218.5 438.0 -153.7 66.4 -65.6 -31.72008 Q3 -48.1 -31.2 -107.4 72.5 43.3 -16.1 -74.3 134.1 -27.3 -8.1 -8.3 -25.3 Q4 52.7 -28.9 -48.9 -14.7 50.0 73.2 -111.9 140.8 -18.1 34.8 -13.2 -10.42009 Q1 -41.7 -36.6 -78.8 40.0 32.4 5.6 -46.8 132.4 -11.8 -53.5 -5.3 -19.1 Q2 86.5 -17.4 -82.7 90.5 -9.8 -54.1 44.4 97.6 63.4 -72.9 20.3 7.3 Q3 -10.9 3.2 -55.9 41.8 -7.3 -23.0 35.1 47.7 7.8 -61.8 0.0 1.6
2008 Oct. 64.7 -8.4 -5.9 1.0 35.3 39.6 -66.1 85.6 -59.3 46.4 0.6 -4.2 Nov. 10.5 -15.4 -35.0 -18.5 6.4 10.0 -8.6 55.5 12.2 9.3 -10.4 4.9 Dec. -22.5 -5.1 -8.0 2.8 8.3 23.6 -37.2 -0.3 28.9 -20.9 -3.4 -11.22009 Jan. -74.5 -23.8 -21.1 9.3 2.4 -5.6 -35.1 51.6 -3.7 -43.7 3.4 -8.0 Feb. 31.0 -4.9 -19.5 12.4 18.8 0.8 3.4 38.1 6.8 -17.3 -1.3 -6.3 Mar. 1.8 -7.9 -38.2 18.3 11.3 10.4 -15.2 42.7 -15.0 7.6 -7.3 -4.9 Apr. 22.7 -8.2 -56.8 70.2 5.1 -26.9 -21.9 44.9 -6.4 21.8 8.9 -7.9 May 6.3 -13.0 -12.5 17.5 -1.8 -33.6 28.9 30.1 84.0 -110.1 9.2 7.7 June 57.5 3.8 -13.5 2.9 -13.1 6.4 37.4 22.6 -14.2 15.4 2.3 7.5 July 3.3 10.7 -6.6 16.9 -5.3 -12.0 21.6 -17.6 9.1 -20.0 7.7 -1.0 Aug. 3.5 -2.8 -14.3 19.8 -2.8 -11.5 17.3 22.7 -3.2 -24.0 -6.1 8.4 Sep. -17.8 -4.6 -35.0 5.1 0.7 0.6 -3.8 42.6 1.9 -17.8 -1.6 -5.8 Oct. -6.3 -3.6 -27.5 25.3 -6.3 -9.5 -18.0 40.8 -24.5 26.9 0.8 -10.8
12-month cumulated transactions 2009 Oct. 15.6 -74.9 -288.0 181.9 23.7 -47.4 -31.2 373.7 76.0 -173.0 2.0 -27.4
C34 Main b.o.p. items mirroring developments in MFI net external transactions 1) (EUR billions; 12-month cumulated transactions)
-600
-400
-200
0
200
400
600
2007 2008 2009-600
-400
-200
0
200
400
600
total mirroring net external transactions by MFIscurrent and capital account balancedirect and portfolio equity investment abroad by non-MFIsportfolio investment liabilities of non-MFIs in the form of debt instruments
Source: ECB.1) Data refer to the changing composition of the euro area. For further information, see the General Notes.

S 70ECB
Monthly Bulletin
January 2010
7.5 Trade in goods
1. Values and volumes by product group 1) (seasonally adjusted, unless otherwise indicated)
Values (EUR billions; annual percentage changes for columns 1 and 2)
Total (n.s.a.) Exports (f.o.b.) Imports (c.i.f.)
Total Memo item: Total Memo items:
Exports Imports Intermediate Capital Consumption Manufacturing Intermediate Capital Consumption Manufacturing Oil
1 2 3 4 5 6 7 8 9 10 11 12 13
2007 11.0 8.4 1,507.8 739.7 326.6 401.3 1,282.6 1,491.7 913.9 234.4 323.2 1,019.7 227.52008 3.6 8.1 1,559.3 767.9 337.4 412.2 1,300.5 1,602.2 1,020.5 233.1 333.0 1,018.8 293.7
2008 Q4 -5.0 -2.1 366.1 174.1 81.5 95.8 302.5 373.0 228.9 56.7 81.7 239.0 55.42009 Q1 -20.9 -20.7 311.2 149.5 65.6 86.3 258.9 321.7 181.3 49.5 78.6 214.7 35.6 Q2 -23.2 -27.2 309.8 150.5 63.5 84.9 254.4 306.6 170.1 47.4 76.4 202.9 41.4 Q3 -19.3 -26.0 320.2 . . . 259.2 308.1 . . . 201.3 .
2009 May -22.6 -27.7 102.4 49.2 21.2 28.0 84.6 101.2 55.8 15.6 25.2 67.6 13.7 June -20.7 -26.4 103.4 50.2 21.2 28.4 83.3 101.7 56.7 15.6 25.5 66.6 14.7 July -18.1 -28.9 108.0 52.4 22.6 29.6 89.4 102.5 58.0 15.6 25.9 67.2 15.8 Aug. -21.1 -26.0 103.6 . . . 83.7 101.4 . . . 66.3 . Sep. -19.0 -23.1 108.6 . . . 86.1 104.2 . . . 67.9 . Oct. -16.8 -23.6 108.3 . . . 87.5 102.0 . . . 65.7 .
Volume indices (2000 = 100; annual percentage changes for columns 1 and 2)
2007 8.6 6.8 144.4 141.3 153.1 144.6 142.1 129.1 123.1 143.3 141.5 134.7 107.72008 1.2 0.4 146.0 141.2 157.6 146.9 142.6 128.8 122.6 143.7 143.2 133.1 108.4
2008 Q4 -7.5 -4.6 136.2 127.0 150.2 136.7 130.4 122.6 115.8 135.7 137.0 121.3 108.02009 Q1 -20.8 -14.7 117.7 112.5 120.1 124.4 112.1 113.8 104.5 117.8 130.9 110.3 99.4 Q2 -22.0 -19.3 118.5 115.2 117.3 122.5 111.7 109.4 97.9 113.8 130.9 106.7 97.2 Q3 -17.6 -15.0 121.5 . . . 113.4 109.2 . . . 107.0 .
2009 May -21.6 -20.2 117.7 113.4 117.6 120.9 111.5 108.4 96.7 112.3 129.2 106.5 98.0 June -19.2 -16.8 118.1 115.1 116.7 122.4 109.5 108.1 96.9 112.8 131.1 105.4 93.7 July -16.2 -18.2 122.9 120.0 124.4 126.1 117.1 108.3 98.1 114.7 131.6 106.2 98.1 Aug. -19.6 -14.1 118.2 . . . 110.2 108.8 . . . 106.2 . Sep. -17.2 -12.7 123.3 . . . 112.9 110.5 . . . 108.7 . Oct. . . . . . . . . . . . . .
2. Prices 2) (annual percentage changes, unless otherwise indicated)
Industrial producer export prices (f.o.b.) 3) Industrial import prices (c.i.f.)
Total Total Memo Total Total Memo
(index: item: (index: item:2005 = 100) Intermediate Capital Consumer Energy Manufac- 2005 = 100) Intermediate Capital Consumer Energy Manufac-
goods goods goods turing goods goods goods turing
% of total 100.0 100.0 32.2 46.3 17.7 3.8 99.4 100.0 100.0 28.4 27.9 22.1 21.6 81.1
1 2 3 4 5 6 7 8 9 10 11 12 13 142007 101.8 0.4 2.7 -0.5 0.9 1.8 0.4 105.9 0.1 2.3 -3.5 0.5 1.6 -0.32008 103.5 1.6 1.5 -0.4 2.4 25.2 1.5 112.7 6.5 0.2 -3.4 2.4 28.2 0.8
2009 Q1 101.2 -1.3 -1.1 1.3 1.4 -32.3 -1.4 101.4 -8.4 -4.0 -0.3 2.7 -27.9 -2.4 Q2 100.9 -2.8 -3.9 1.5 0.9 -36.4 -2.7 101.5 -12.4 -6.5 0.1 1.4 -35.3 -4.2 Q3 100.9 -4.0 -6.2 0.7 0.4 -34.0 -3.8 102.3 -13.0 -7.8 -1.0 -0.3 -33.8 -5.2
2009 June 101.1 -3.3 -4.8 1.4 0.7 -35.4 -3.2 102.8 -13.2 -7.3 -0.2 0.6 -34.9 -5.0 July 100.8 -4.0 -5.7 1.3 0.5 -38.9 -3.8 101.5 -15.0 -8.1 -0.6 0.7 -39.2 -5.4 Aug. 101.2 -3.6 -6.1 0.8 0.7 -30.1 -3.5 103.3 -12.2 -7.6 -1.0 -0.4 -31.4 -4.8 Sep. 100.6 -4.3 -6.7 0.0 0.0 -32.7 -4.2 102.0 -11.7 -7.9 -1.3 -1.3 -30.1 -5.3 Oct. 100.4 -3.6 -6.5 -1.0 -1.1 -13.6 -3.5 102.8 -7.7 -7.2 -2.3 -3.0 -16.7 -4.9 Nov. 100.8 -2.1 -5.2 -1.7 -0.6 10.8 -1.9 103.4 -3.5 -5.5 -2.5 -3.5 -2.4 -3.6
Source: Eurostat.1) Product groups as classified in the Broad Economic Categories. Unlike the product groups shown in Table 2, intermediate and consumption product groups include
agricultural and energy products.2) Product groups as classified in the Main Industrial Groupings. Unlike the product groups shown in Table 1, intermediate and consumer goods do not include
energy products, and agricultural goods are not covered. Manufacturing has a different composition compared with the data shown in columns 7 and 12 of Table 1. Data shownare price indices which follow the pure price change for a basket of products and are not simple ratios of the value and volume data shown in Table 1, which are affectedby changes in the composition and quality of traded goods. These indices differ from the GDP deflators for imports and exports (shown in Table 3 in Section 5.1), mainlybecause those deflators include all goods and services and cover cross-border trade within the euro area.
3) Industrial producer export prices refer to direct transactions between domestic producers and non-domestic customers. Contrary to the data shown for values and volumes in Table 1, exports from wholesalers and re-exports are not covered.

S 71ECB
Monthly Bulletin
January 2010
EURO AREASTATISTICS
External
transactions
and
positions
7.5 Trade in goods (EUR billions, unless otherwise indicated; seasonally adjusted)
3. Geographical breakdown
Exports (f.o.b.)
Total EU Member States outside the euro area Russia Switzer- Turkey United Asia Africa Latin Other
land States America countriesDenmark Sweden United Other EU China Japan
Kingdom countries
1 2 3 4 5 6 7 8 9 10 11 12 13 14 15
2007 1,507.8 34.1 55.6 230.9 216.4 67.9 82.3 41.5 195.9 295.9 60.6 34.3 87.6 61.7 138.02008 1,559.3 35.0 53.6 220.2 232.1 78.4 86.5 42.8 187.5 307.9 65.7 33.5 100.5 68.1 146.8
2008 Q2 397.8 9.1 14.3 58.0 60.7 20.2 22.2 11.4 47.4 77.5 16.8 8.5 24.8 16.9 35.5 Q3 397.8 9.1 14.0 55.8 60.0 20.8 21.8 10.8 46.8 76.8 16.0 8.2 26.7 17.5 37.7 Q4 366.1 8.0 11.5 49.3 52.1 17.7 21.2 8.3 43.6 74.6 15.7 8.1 24.9 17.5 37.62009 Q1 311.2 7.4 10.0 42.4 43.6 12.6 20.0 7.7 40.0 65.2 15.4 7.1 23.4 12.8 26.2 Q2 309.8 6.4 9.6 42.4 42.2 12.1 19.2 8.3 37.7 70.3 16.8 7.1 22.8 12.5 26.3 Q3 320.2 6.9 10.5 44.6 45.0 12.1 19.6 8.9 36.0 70.9 17.0 7.2 22.3 13.9 29.5
2009 May 102.4 2.2 3.1 13.8 14.0 3.8 6.4 2.8 12.4 23.4 5.6 2.3 7.5 4.2 8.8 June 103.4 2.0 3.3 14.4 14.0 4.1 6.4 2.8 12.5 23.7 5.5 2.4 7.5 4.0 8.6 July 108.0 2.3 3.6 15.0 14.8 4.2 6.5 3.1 12.6 24.0 5.7 2.6 7.6 4.9 9.5 Aug. 103.6 2.3 3.4 14.3 14.8 3.8 6.4 2.9 11.5 23.4 5.6 2.2 7.3 4.4 9.1 Sep. 108.6 2.3 3.5 15.3 15.4 4.1 6.6 2.9 11.9 23.5 5.7 2.4 7.4 4.7 10.9 Oct. 108.3 . . . . 4.1 6.5 3.0 13.0 23.5 5.9 2.3 7.4 4.6 .
% share of total exports 2008 100.0 2.2 3.4 14.1 14.9 5.0 5.6 2.7 12.0 19.8 4.2 2.2 6.5 4.4 9.4
Imports (c.i.f.)
2007 1,491.7 28.8 52.2 169.5 169.5 102.2 67.2 32.4 131.7 455.6 172.7 59.1 113.4 75.2 94.02008 1,602.2 30.6 52.0 164.2 184.3 122.0 69.9 32.4 137.7 481.4 184.3 56.9 141.0 81.7 104.9
2008 Q2 410.7 8.0 13.6 42.6 47.7 32.3 17.6 8.6 33.7 121.9 45.2 14.6 37.4 20.3 26.9 Q3 413.8 7.9 13.2 41.6 47.3 34.3 17.9 8.2 35.4 124.2 48.0 14.1 37.7 21.1 25.0 Q4 373.0 7.3 11.5 36.2 43.1 24.8 17.4 7.0 33.8 113.3 46.5 13.5 30.8 19.8 28.02009 Q1 321.7 6.9 9.4 31.6 39.3 17.8 16.7 6.7 33.1 98.9 42.2 11.5 24.0 14.9 22.4 Q2 306.6 6.3 8.9 30.4 38.5 18.1 16.1 6.3 28.3 92.8 39.7 10.3 23.0 14.2 23.6 Q3 308.1 6.7 9.8 31.4 40.5 21.6 16.0 6.5 26.6 92.0 38.0 10.2 22.0 14.5 20.3
2009 May 101.2 2.1 2.9 10.1 12.8 5.9 5.3 2.1 9.8 30.6 13.1 3.4 7.3 4.6 7.5 June 101.7 2.0 3.0 10.2 12.7 6.4 5.2 2.2 9.1 30.6 13.0 3.4 7.8 4.8 7.8 July 102.5 2.3 3.3 10.4 13.2 6.8 5.4 2.2 9.0 30.5 12.6 3.4 7.6 5.0 6.9 Aug. 101.4 2.3 3.2 10.4 13.5 6.6 5.3 2.1 8.6 30.5 12.6 3.3 7.2 4.7 7.1 Sep. 104.2 2.2 3.3 10.6 13.8 8.2 5.3 2.2 9.0 31.0 12.8 3.4 7.3 4.8 6.3 Oct. 102.0 . . . . 7.6 5.2 2.3 8.8 30.5 12.6 3.4 6.9 4.8 .
% share of total imports 2008 100.0 1.9 3.2 10.2 11.5 7.6 4.4 2.0 8.6 30.1 11.5 3.6 8.8 5.1 6.6
Balance
2007 16.2 5.4 3.4 61.4 46.8 -34.3 15.1 9.0 64.2 -159.7 -112.1 -24.9 -25.8 -13.5 44.12008 -42.8 4.4 1.6 56.0 47.8 -43.6 16.7 10.4 49.8 -173.5 -118.7 -23.4 -40.5 -13.7 42.0
2008 Q2 -12.9 1.1 0.7 15.3 12.9 -12.2 4.5 2.8 13.7 -44.4 -28.4 -6.2 -12.6 -3.4 8.6 Q3 -16.0 1.2 0.7 14.1 12.7 -13.5 3.9 2.6 11.4 -47.4 -32.0 -5.9 -10.9 -3.6 12.8 Q4 -6.9 0.7 0.0 13.0 9.0 -7.1 3.8 1.3 9.8 -38.7 -30.8 -5.4 -5.9 -2.3 9.62009 Q1 -10.6 0.5 0.6 10.7 4.3 -5.2 3.3 1.0 6.8 -33.8 -26.8 -4.4 -0.6 -2.1 3.7 Q2 3.2 0.1 0.7 12.0 3.7 -6.0 3.2 2.1 9.4 -22.5 -22.9 -3.3 -0.3 -1.8 2.6 Q3 12.1 0.1 0.7 13.2 4.5 -9.5 3.5 2.4 9.4 -21.1 -21.1 -3.0 0.2 -0.6 9.2
2009 May 1.3 0.0 0.1 3.7 1.1 -2.1 1.1 0.7 2.6 -7.2 -7.4 -1.2 0.2 -0.4 1.3 June 1.7 0.0 0.3 4.2 1.3 -2.3 1.2 0.6 3.4 -6.9 -7.4 -1.0 -0.2 -0.8 0.8 July 5.5 0.0 0.2 4.6 1.7 -2.6 1.2 0.9 3.5 -6.5 -6.9 -0.8 0.0 -0.1 2.7 Aug. 2.3 0.0 0.2 3.9 1.2 -2.8 1.1 0.8 3.0 -7.1 -7.0 -1.1 0.2 -0.4 2.0 Sep. 4.3 0.2 0.2 4.7 1.6 -4.1 1.3 0.7 2.9 -7.5 -7.1 -1.1 0.1 -0.2 4.6 Oct. 6.3 . . . . -3.5 1.3 0.7 4.2 -6.9 -6.7 -1.1 0.4 -0.2 .
Source: Eurostat.

S 72ECB
Monthly Bulletin
January 2010
8 EXCHANGE RATES
8.1 Effective exchange rates 1) (period averages; index: 1999 Q1=100)
EER-21 EER-41
Nominal Real Real Real Real Real Nominal RealCPI PPI GDP ULCM ULCT CPI
deflator
1 2 3 4 5 6 7 82007 106.3 106.8 105.2 102.7 107.0 100.6 113.0 104.22008 110.5 110.1 107.4 105.7 112.8 104.3 118.0 107.12009 111.7 110.6 105.9 . . . 120.6 107.9
2008 Q4 107.0 106.5 103.1 102.4 111.5 101.3 115.2 104.02009 Q1 109.9 109.2 104.8 104.9 118.0 105.2 119.0 107.0 Q2 111.1 110.2 105.4 106.3 121.2 106.5 119.8 107.5 Q3 112.1 110.9 106.2 107.4 118.5 106.6 121.0 108.1 Q4 113.8 112.2 107.2 . . . 122.5 109.0
2008 Dec. 110.2 109.7 106.0 - - - 118.7 107.22009 Jan. 109.8 109.2 105.0 - - - 118.6 106.9 Feb. 108.7 108.0 103.6 - - - 117.7 106.0 Mar. 111.1 110.3 105.6 - - - 120.4 108.1 Apr. 110.3 109.5 104.7 - - - 119.1 106.9 May 110.8 109.9 105.3 - - - 119.5 107.2 June 112.0 111.1 106.2 - - - 120.7 108.3 July 111.6 110.5 105.8 - - - 120.5 107.8 Aug. 111.7 110.6 106.0 - - - 120.6 107.9 Sep. 112.9 111.6 106.8 - - - 122.0 108.8 Oct. 114.3 112.8 108.0 - - - 123.0 109.6 Nov. 114.0 112.5 107.4 - - - 122.9 109.3 Dec. 113.0 111.4 106.1 - - - 121.7 108.1
% change versus previous month 2009 Dec. -0.9 -1.0 -1.2 - - - -1.0 -1.1
% change versus previous year 2009 Dec. 2.6 1.6 0.1 - - - 2.5 0.8
C35 Effective exchange rates(monthly averages; index: 1999 Q1=100)
C36 Bilateral exchange rates(monthly averages; index: 1999 Q1=100)
70
80
90
100
110
120
130
140
150
1999 2000 2001 2002 2003 2004 2005 2006 2007 2008 200970
80
90
100
110
120
130
140
150
nominal EER-21real CPI-deflated EER-21
70
80
90
100
110
120
130
140
150
1999 2000 2001 2002 2003 2004 2005 2006 2007 2008 200970
80
90
100
110
120
130
140
150
USD/EURJPY/EURGBP/EUR
Source: ECB.1) For a definition of the trading partner groups and other information, please refer to the General Notes.

S 73ECB
Monthly Bulletin
January 2010
EURO AREASTATISTICS
Exchange
rates
8.2 Bilateral exchange rates (period averages; units of national currency per euro)
Danish Swedish Pound US Japanese Swiss South Korean Hong Kong Singapore Canadian Norwegian Australiankrone krona sterling dollar yen franc won dollar dollar dollar krone dollar
1 2 3 4 5 6 7 8 9 10 11 122007 7.4506 9.2501 0.68434 1.3705 161.25 1.6427 1,272.99 10.6912 2.0636 1.4678 8.0165 1.63482008 7.4560 9.6152 0.79628 1.4708 152.45 1.5874 1,606.09 11.4541 2.0762 1.5594 8.2237 1.74162009 7.4462 10.6191 0.89094 1.3948 130.34 1.5100 1,772.90 10.8114 2.0241 1.5850 8.7278 1.7727
2009 Q2 7.4471 10.7806 0.87883 1.3632 132.59 1.5138 1,747.10 10.5657 2.0050 1.5883 8.8431 1.7917 Q3 7.4442 10.4241 0.87161 1.4303 133.82 1.5195 1,772.14 11.0854 2.0570 1.5704 8.7397 1.7169 Q4 7.4424 10.3509 0.90483 1.4779 132.69 1.5088 1,725.91 11.4555 2.0604 1.5604 8.3932 1.6250
2009 June 7.4457 10.8713 0.85670 1.4016 135.39 1.5148 1,768.80 10.8638 2.0357 1.5761 8.9388 1.7463 July 7.4458 10.8262 0.86092 1.4088 133.09 1.5202 1,778.43 10.9182 2.0421 1.5824 8.9494 1.7504 Aug. 7.4440 10.2210 0.86265 1.4268 135.31 1.5236 1,768.99 11.0587 2.0577 1.5522 8.6602 1.7081 Sep. 7.4428 10.1976 0.89135 1.4562 133.14 1.5148 1,768.58 11.2858 2.0720 1.5752 8.5964 1.6903 Oct. 7.4438 10.3102 0.91557 1.4816 133.91 1.5138 1,739.94 11.4828 2.0714 1.5619 8.3596 1.6341 Nov. 7.4415 10.3331 0.89892 1.4914 132.97 1.5105 1,735.17 11.5588 2.0711 1.5805 8.4143 1.6223 Dec. 7.4419 10.4085 0.89972 1.4614 131.21 1.5021 1,703.03 11.3296 2.0392 1.5397 8.4066 1.6185
% change versus previous month 2009 Dec. 0.0 0.7 0.1 -2.0 -1.3 -0.6 -1.9 -2.0 -1.5 -2.6 -0.1 -0.2
% change versus previous year 2009 Dec. -0.1 -3.2 -0.5 8.7 7.1 -2.4 -7.9 8.7 2.5 -7.2 -10.8 -19.5
Czech Estonian Latvian Lithuanian Hungarian Polish Bulgarian New Roma- Croatian New Turkishkoruna kroon lats litas forint zloty lev nian leu kuna lira
13 14 15 16 17 18 19 20 21 222007 27.766 15.6466 0.7001 3.4528 251.35 3.7837 1.9558 3.3353 7.3376 1.78652008 24.946 15.6466 0.7027 3.4528 251.51 3.5121 1.9558 3.6826 7.2239 1.90642009 26.435 15.6466 0.7057 3.4528 280.33 4.3276 1.9558 4.2399 7.3400 2.1631
2009 Q2 26.679 15.6466 0.7065 3.4528 285.71 4.4523 1.9558 4.1963 7.3528 2.1410 Q3 25.597 15.6466 0.7019 3.4528 271.35 4.1978 1.9558 4.2263 7.3232 2.1444 Q4 25.923 15.6466 0.7084 3.4528 270.88 4.1745 1.9558 4.2680 7.2756 2.2029
2009 June 26.545 15.6466 0.7015 3.4528 280.46 4.5084 1.9558 4.2131 7.2954 2.1675 July 25.793 15.6466 0.7006 3.4528 272.06 4.2965 1.9558 4.2184 7.3307 2.1378 Aug. 25.646 15.6466 0.7013 3.4528 270.05 4.1311 1.9558 4.2183 7.3287 2.1236 Sep. 25.346 15.6466 0.7039 3.4528 271.84 4.1584 1.9558 4.2420 7.3102 2.1711 Oct. 25.861 15.6466 0.7088 3.4528 268.49 4.2146 1.9558 4.2871 7.2419 2.1823 Nov. 25.812 15.6466 0.7088 3.4528 270.92 4.1646 1.9558 4.2896 7.2952 2.2262 Dec. 26.089 15.6466 0.7077 3.4528 273.22 4.1439 1.9558 4.2284 7.2907 2.2013
% change versus previous month 2009 Dec. 1.1 0.0 -0.2 0.0 0.8 -0.5 0.0 -1.4 -0.1 -1.1
% change versus previous year 2009 Dec. -0.1 0.0 -0.1 0.0 3.1 3.5 0.0 7.8 0.9 5.4
Brazilian Chinese Icelandic Indian Indonesian Malaysian Mexican New Zealand Philippine Russian South African Thaireal 1) yuan renminbi krona 2) rupee 3) rupiah ringgit peso 1) dollar peso rouble rand baht
23 24 25 26 27 28 29 30 31 32 33 342007 2.6594 10.4178 87.63 56.4186 12,528.33 4.7076 14.9743 1.8627 63.026 35.0183 9.6596 44.2142008 2.6737 10.2236 143.83 63.6143 14,165.16 4.8893 16.2911 2.0770 65.172 36.4207 12.0590 48.4752009 2.7674 9.5277 - 67.3611 14,443.74 4.9079 18.7989 2.2121 66.338 44.1376 11.6737 47.804
2009 Q2 2.8245 9.3107 - 66.3982 14,334.53 4.8340 18.1648 2.2565 65.097 43.7716 11.5242 47.294 Q3 2.6699 9.7702 - 69.1909 14,285.93 5.0333 18.9695 2.1232 68.815 44.7703 11.1618 48.575 Q4 2.5703 10.0905 - 68.9088 13,999.42 5.0275 19.3003 2.0297 69.080 43.5740 11.0757 49.221
2009 June 2.7391 9.5786 - 66.9191 14,315.40 4.9305 18.6813 2.1967 67.036 43.5553 11.2718 47.844 July 2.7221 9.6246 - 68.2333 14,241.51 4.9963 18.8143 2.1873 67.724 44.3881 11.2007 47.969 Aug. 2.6314 9.7485 - 68.9570 14,270.78 5.0185 18.5571 2.1097 68.803 45.1972 11.3415 48.543 Sep. 2.6520 9.9431 - 70.4154 14,346.84 5.0862 19.5255 2.0691 69.967 44.7624 10.9495 49.239 Oct. 2.5771 10.1152 - 69.2160 14,057.25 5.0425 19.5856 2.0065 69.419 43.6188 11.0938 49.504 Nov. 2.5777 10.1827 - 69.4421 14,115.45 5.0553 19.5478 2.0450 70.165 43.1835 11.2134 49.634 Dec. 2.5566 9.9777 - 68.0924 13,830.84 4.9859 18.7787 2.0383 67.706 43.9019 10.9261 48.544
% change versus previous month 2009 Dec. -0.8 -2.0 - -1.9 -2.0 -1.4 -3.9 -0.3 -3.5 1.7 -2.6 -2.2
% change versus previous year 2009 Dec. -20.8 8.2 - 4.5 -9.5 4.4 3.9 -15.5 5.0 15.8 -18.6 3.1
Source: ECB.1) For these currencies the ECB computes and publishes euro reference exchange rates as from 1 January 2008. Previous data are indicative.2) The most recent rate for the Icelandic krona refers to 3 December 2008.3) For this currency the ECB computes and publishes euro reference exchange rates as from 1 January 2009. Previous data are indicative.
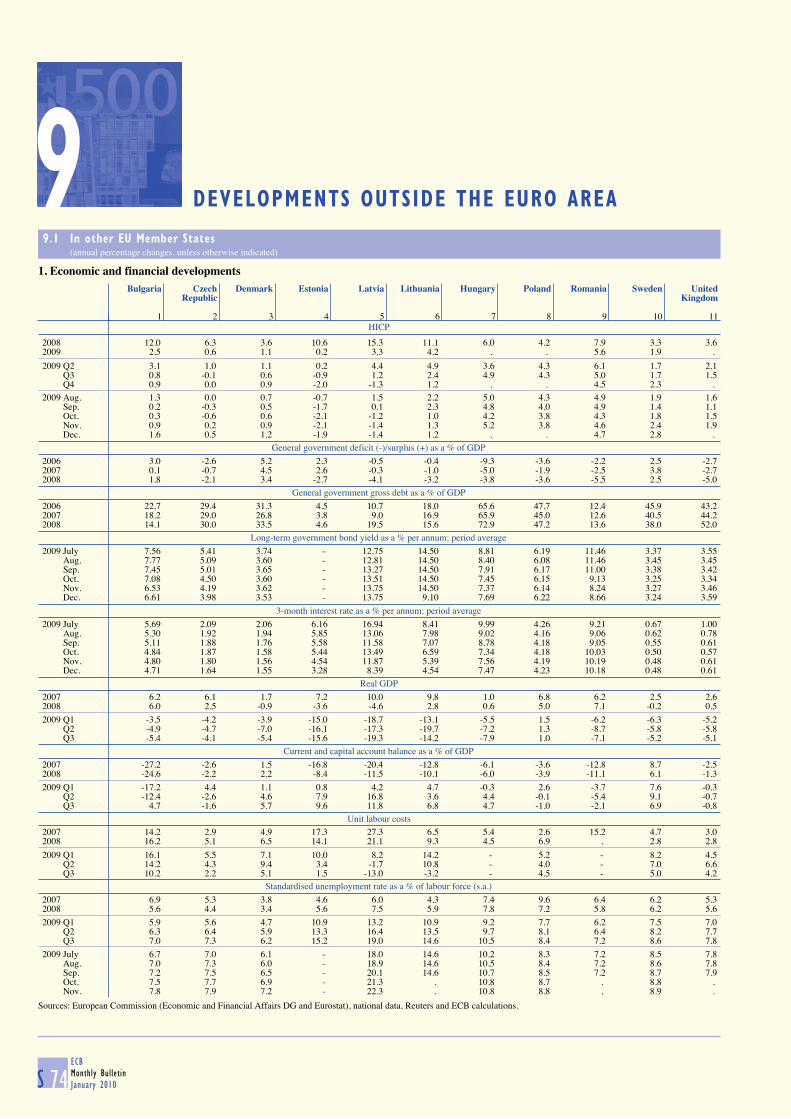
S 74ECB
Monthly Bulletin
January 2010
9 DEVELOPMENTS OUTSIDE THE EURO AREA
9.1 In other EU Member States (annual percentage changes, unless otherwise indicated)
1. Economic and financial developments
HICP
Bulgaria Czech Denmark Estonia Latvia Lithuania Hungary Poland Romania Sweden UnitedRepublic Kingdom
1 2 3 4 5 6 7 8 9 10 11
2008 12.0 6.3 3.6 10.6 15.3 11.1 6.0 4.2 7.9 3.3 3.62009 2.5 0.6 1.1 0.2 3.3 4.2 . . 5.6 1.9 .
2009 Q2 3.1 1.0 1.1 0.2 4.4 4.9 3.6 4.3 6.1 1.7 2.1 Q3 0.8 -0.1 0.6 -0.9 1.2 2.4 4.9 4.3 5.0 1.7 1.5 Q4 0.9 0.0 0.9 -2.0 -1.3 1.2 . . 4.5 2.3 .
2009 Aug. 1.3 0.0 0.7 -0.7 1.5 2.2 5.0 4.3 4.9 1.9 1.6 Sep. 0.2 -0.3 0.5 -1.7 0.1 2.3 4.8 4.0 4.9 1.4 1.1 Oct. 0.3 -0.6 0.6 -2.1 -1.2 1.0 4.2 3.8 4.3 1.8 1.5 Nov. 0.9 0.2 0.9 -2.1 -1.4 1.3 5.2 3.8 4.6 2.4 1.9 Dec. 1.6 0.5 1.2 -1.9 -1.4 1.2 . . 4.7 2.8 .
General government deficit (-)/surplus (+) as a % of GDP
2006 3.0 -2.6 5.2 2.3 -0.5 -0.4 -9.3 -3.6 -2.2 2.5 -2.72007 0.1 -0.7 4.5 2.6 -0.3 -1.0 -5.0 -1.9 -2.5 3.8 -2.72008 1.8 -2.1 3.4 -2.7 -4.1 -3.2 -3.8 -3.6 -5.5 2.5 -5.0
General government gross debt as a % of GDP
2006 22.7 29.4 31.3 4.5 10.7 18.0 65.6 47.7 12.4 45.9 43.22007 18.2 29.0 26.8 3.8 9.0 16.9 65.9 45.0 12.6 40.5 44.22008 14.1 30.0 33.5 4.6 19.5 15.6 72.9 47.2 13.6 38.0 52.0
Long-term government bond yield as a % per annum; period average
2009 July 7.56 5.41 3.74 - 12.75 14.50 8.81 6.19 11.46 3.37 3.55 Aug. 7.77 5.09 3.60 - 12.81 14.50 8.40 6.08 11.46 3.45 3.45 Sep. 7.45 5.01 3.65 - 13.27 14.50 7.91 6.17 11.00 3.38 3.42 Oct. 7.08 4.50 3.60 - 13.51 14.50 7.45 6.15 9.13 3.25 3.34 Nov. 6.53 4.19 3.62 - 13.75 14.50 7.37 6.14 8.24 3.27 3.46 Dec. 6.61 3.98 3.53 - 13.75 9.10 7.69 6.22 8.66 3.24 3.59
3-month interest rate as a % per annum; period average
2009 July 5.69 2.09 2.06 6.16 16.94 8.41 9.99 4.26 9.21 0.67 1.00 Aug. 5.30 1.92 1.94 5.85 13.06 7.98 9.02 4.16 9.06 0.62 0.78 Sep. 5.11 1.88 1.76 5.58 11.58 7.07 8.78 4.18 9.05 0.55 0.61 Oct. 4.84 1.87 1.58 5.44 13.49 6.59 7.34 4.18 10.03 0.50 0.57 Nov. 4.80 1.80 1.56 4.54 11.87 5.39 7.56 4.19 10.19 0.48 0.61 Dec. 4.71 1.64 1.55 3.28 8.39 4.54 7.47 4.23 10.18 0.48 0.61
Real GDP
2007 6.2 6.1 1.7 7.2 10.0 9.8 1.0 6.8 6.2 2.5 2.62008 6.0 2.5 -0.9 -3.6 -4.6 2.8 0.6 5.0 7.1 -0.2 0.5
2009 Q1 -3.5 -4.2 -3.9 -15.0 -18.7 -13.1 -5.5 1.5 -6.2 -6.3 -5.2 Q2 -4.9 -4.7 -7.0 -16.1 -17.3 -19.7 -7.2 1.3 -8.7 -5.8 -5.8 Q3 -5.4 -4.1 -5.4 -15.6 -19.3 -14.2 -7.9 1.0 -7.1 -5.2 -5.1
Current and capital account balance as a % of GDP
2007 -27.2 -2.6 1.5 -16.8 -20.4 -12.8 -6.1 -3.6 -12.8 8.7 -2.52008 -24.6 -2.2 2.2 -8.4 -11.5 -10.1 -6.0 -3.9 -11.1 6.1 -1.3
2009 Q1 -17.2 4.4 1.1 0.8 4.2 4.7 -0.3 2.6 -3.7 7.6 -0.3 Q2 -12.4 -2.6 4.6 7.9 16.8 3.6 4.4 -0.1 -5.4 9.1 -0.7 Q3 4.7 -1.6 5.7 9.6 11.8 6.8 4.7 -1.0 -2.1 6.9 -0.8
Unit labour costs
2007 14.2 2.9 4.9 17.3 27.3 6.5 5.4 2.6 15.2 4.7 3.02008 16.2 5.1 6.5 14.1 21.1 9.3 4.5 6.9 . 2.8 2.8
2009 Q1 16.1 5.5 7.1 10.0 8.2 14.2 - 5.2 - 8.2 4.5 Q2 14.2 4.3 9.4 3.4 -1.7 10.8 - 4.0 - 7.0 6.6 Q3 10.2 2.2 5.1 1.5 -13.0 -3.2 - 4.5 - 5.0 4.2
Standardised unemployment rate as a % of labour force (s.a.)
2007 6.9 5.3 3.8 4.6 6.0 4.3 7.4 9.6 6.4 6.2 5.32008 5.6 4.4 3.4 5.6 7.5 5.9 7.8 7.2 5.8 6.2 5.6
2009 Q1 5.9 5.6 4.7 10.9 13.2 10.9 9.2 7.7 6.2 7.5 7.0 Q2 6.3 6.4 5.9 13.3 16.4 13.5 9.7 8.1 6.4 8.2 7.7 Q3 7.0 7.3 6.2 15.2 19.0 14.6 10.5 8.4 7.2 8.6 7.8
2009 July 6.7 7.0 6.1 - 18.0 14.6 10.2 8.3 7.2 8.5 7.8 Aug. 7.0 7.3 6.0 - 18.9 14.6 10.5 8.4 7.2 8.6 7.8 Sep. 7.2 7.5 6.5 - 20.1 14.6 10.7 8.5 7.2 8.7 7.9 Oct. 7.5 7.7 6.9 - 21.3 . 10.8 8.7 . 8.8 . Nov. 7.8 7.9 7.2 - 22.3 . 10.8 8.8 . 8.9 .
Sources: European Commission (Economic and Financial Affairs DG and Eurostat), national data, Reuters and ECB calculations.

S 75ECB
Monthly Bulletin
January 2010
EURO AREASTATISTICS
Developments
outside the
euro area
9.2 In the United States and Japan (annual percentage changes, unless otherwise indicated)
1. Economic and financial developments
United States
Consumer Unit labour Real GDP Industrial Unemployment Broad 3-month 10-year Exchange Fiscal Grossprice index costs 1) production rate money 2) interbank zero coupon rate 4) deficit (-)/ public
index as a % of deposit government as national surplus (+) debt 5)
(manufacturing) labour force rate 3) bond yield; 3) currency as a % of as a % of(s.a.) end of per euro GDP GDP
period
1 2 3 4 5 6 7 8 9 10 11
2006 3.2 2.8 2.7 2.7 4.6 5.0 5.20 5.26 1.2556 -2.2 47.72007 2.9 2.3 2.1 1.6 4.6 5.8 5.30 4.81 1.3705 -2.8 48.32008 3.8 1.0 0.4 -3.1 5.8 6.9 2.93 2.70 1.4708 -6.5 56.32009 . . . . 9.3 . 0.69 4.17 1.3948 . .
2008 Q4 1.6 1.7 -1.9 -8.7 7.0 8.3 2.77 2.70 1.3180 -8.1 56.32009 Q1 0.0 -0.1 -3.3 -13.9 8.2 9.4 1.24 2.96 1.3029 -9.9 60.0 Q2 -1.2 0.3 -3.8 -14.6 9.3 8.6 0.84 3.95 1.3632 -11.6 62.8 Q3 -1.6 -1.4 -2.6 -10.6 9.6 7.6 0.41 3.61 1.4303 -11.4 65.8 Q4 . . . . 10.0 . 0.27 4.17 1.4779 . .
2009 Aug. -1.5 - - -11.3 9.7 7.9 0.42 3.77 1.4268 - - Sep. -1.3 - - -7.0 9.8 6.7 0.30 3.61 1.4562 - - Oct. -0.2 - - -7.6 10.1 5.4 0.28 3.71 1.4816 - - Nov. 1.8 - - -4.4 10.0 5.1 0.27 3.44 1.4914 - - Dec. . - - . 10.0 . 0.25 4.17 1.4614 - -
Japan
2006 0.2 -0.5 2.0 4.5 4.1 1.0 0.30 1.85 146.02 -1.6 159.92007 0.1 -1.0 2.3 2.8 3.8 1.6 0.79 1.70 161.25 -2.4 156.32008 1.4 1.6 -1.2 -3.4 4.0 2.1 0.93 1.21 152.45 -2.1 162.22009 . . . . . 2.7 0.47 1.42 130.34 . .
2008 Q4 1.0 3.9 -4.4 -14.6 4.0 1.8 0.96 1.21 126.71 . . 2009 Q1 -0.1 3.9 -8.6 -34.6 4.5 2.1 0.67 1.33 122.04 . . Q2 -1.0 2.5 -6.0 -27.9 5.2 2.6 0.53 1.41 132.59 . . Q3 -2.2 . -4.7 -20.1 5.5 2.8 0.40 1.45 133.82 . . Q4 . . . . . 3.3 0.31 1.42 132.69 . .
2009 Aug. -2.2 - - -19.0 5.5 2.8 0.40 1.44 135.31 - - Sep. -2.2 - - -18.4 5.3 3.0 0.36 1.45 133.14 - - Oct. -2.5 - - -15.1 5.1 3.4 0.33 1.58 133.91 - - Nov. -1.9 - - -3.9 5.2 3.3 0.31 1.41 132.97 - - Dec. . - - . . 3.1 0.28 1.42 131.21 - -
C37 Real gross domestic product(annual percentage changes; quarterly data)
C38 Consumer price indices(annual percentage changes; monthly data)
-10
-8
-6
-4
-2
0
2
4
6
1999 2000 2001 2002 2003 2004 2005 2006 2007 2008 2009-10
-8
-6
-4
-2
0
2
4
6
euro areaUnited StatesJapan
-4
-2
0
2
4
6
1999 2000 2001 2002 2003 2004 2005 2006 2007 2008 2009-4
-2
0
2
4
6
euro areaUnited StatesJapan
Sources: National data (columns 1, 2 (United States), 3, 4, 5 (United States), 6, 9 and 10); OECD (column 2 (Japan)); Eurostat (column 5 (Japan), euro area chart data); Reuters(columns 7 and 8); ECB calculations (column 11).1) Seasonally adjusted. The data for the United States refer to the private non-agricultural business sector.2) Period averages; M2 for the United States, M2+CDs for Japan.3) Percentages per annum. For further information on the three-month interbank deposit rate, see Section 4.6.4) For more information, see Section 8.2.5) Gross consolidated general government debt (end of period).6) Data refer to the changing composition of the euro area. For further information, see the General Notes.
6)

S 76ECB
Monthly Bulletin
January 2010
LIST OF CHARTS
C1 Monetary aggregates S12
C2 Counterparts S12
C3 Components of monetary aggregates S13
C4 Components of longer-term fi nancial liabilities S13
C5 Loans to other fi nancial intermediaries and non-fi nancial corporations S14
C6 Loans to households S14
C7 Loans to government S16
C8 Loans to non-euro area residents S16
C9 Total deposits by sector (fi nancial intermediaries) S17
C10 Total deposits and deposits included in M3 by sector (fi nancial intermediaries) S17
C11 Total deposits by sector (non-fi nancial corporations and households) S18
C12 Total deposits and deposits included in M3 by sector (non-fi nancial corporations and households) S18
C13 Deposits by government and non-euro area residents S19
C14 MFI holdings of securities S20
C15 Total outstanding amounts and gross issues of securities other than shares issued by euro area residents S35
C16 Net issues of securities other than shares: seasonally adjusted and non-seasonally adjusted S37
C17 Annual growth rates of long-term debt securities, by sector of the issuer, in all currencies combined S38
C18 Annual growth rates of short-term debt securities, by sector of the issuer, in all currencies combined S39
C19 Annual growth rates for quoted shares issued by euro area residents S40
C20 Gross issues of quoted shares by sector of the issuer S41
C21 New deposits with an agreed maturity S43
C22 New loans with a fl oating rate and up to 1 year’s initial rate fi xation S43
C23 Euro area money market rates S44
C24 3-month money market rates S44
C25 Euro area spot yield curves S45
C26 Euro area spot rates and spreads S45
C27 Dow Jones EURO STOXX broad index, Standard & Poor’s 500 and Nikkei 225 S46
C28 Defi cit, borrowing requirement and change in debt S59
C29 Maastricht debt S59
C30 B.o.p. current account balance S60
C31 B.o.p. goods S61
C32 B.o.p. services S61
C33 B.o.p. net direct and portfolio investment S64
C34 Main b.o.p. items mirroring developments in MFI net external transactions S69
C35 Effective exchange rates S72
C36 Bilateral exchange rates S72
C37 Real gross domestic product S75
C38 Consumer price indices S75

ECB
Monthly Bulletin
January 2010 S 77
TECHNICAL NOTES
EURO AREA OVERVIEW
CALCULATION OF GROWTH RATES FOR MONETARY
DEVELOPMENTS
The average growth rate for the quarter ending
in month t is calculated as:
a)
where It is the index of adjusted outstanding
amounts as at month t (see also below).
Likewise, for the year ending in month t, the
average growth rate is calculated as:
b)
SECTIONS 2.1 TO 2.6
CALCULATION OF TRANSACTIONS
Monthly transactions are calculated from
monthly differences in outstanding amounts
adjusted for reclassifi cations, other revaluations,
exchange rate variations and any other changes
which do not arise from transactions.
If Lt represents the outstanding amount at the end
of month t, C t
M the reclassifi cation adjustment
in month t, E t
M the exchange rate adjustment
and V t
M the other revaluation adjustments, the
transactions F t
M in month t are defi ned as:
c)
Similarly, the quarterly transactions F t
Q for the
quarter ending in month t are defi ned as:
d) Ft = (L
t – L
t–3) – C
t – E
t – V
tQ Q Q Q
where Lt-3
is the amount outstanding at the end
of month t-3 (the end of the previous quarter)
and, for example, C t
Q is the reclassifi cation
adjustment in the quarter ending in month t.
For those quarterly series for which monthly
observations are now available (see below), the
quarterly transactions can be derived as the sum
of the three monthly transactions in the quarter.
CALCULATION OF GROWTH RATES FOR MONTHLY
SERIES
Growth rates can be calculated from transactions
or from the index of adjusted outstanding
amounts. If F t
M and Lt are defi ned as above,
the index It of adjusted outstanding amounts in
month t is defi ned as:
e)
The base of the index (for the non-seasonally
adjusted series) is currently set as December
2006 = 100. Time series for the index of
adjusted outstanding amounts are available on
the ECB’s website (www.ecb.europa.eu) in the
“Monetary and fi nancial statistics” sub-section
of the “Statistics” section.
The annual growth rate at for month t – i.e. the
change in the 12 months ending in month t – can
be calculated using either of the following two
formulae:
f)
g)
Unless otherwise indicated, the annual growth
rates refer to the end of the indicated period.
For example, the annual percentage change for
the year 2002 is calculated in g) by dividing
the index for December 2002 by the index for
December 2001.
−1
⎞
⎠
⎟⎟⎟⎟
⎞
⎠
⎟⎟⎟⎟
×100
0.5It−12
+ ∑ It−i−12 + 0.5I
t−15
2
i=1
0.5It + ∑ It−i
+ 0.5It−3
2
i=1
⎞
⎠
⎟⎟⎟⎟
⎞
⎠
⎟⎟⎟⎟
−1 ×1000.5I
t + ∑ I
t−i + 0.5I
t−12
11
i=1
0.5It−12
+ ∑ It−i−12
+ 0.5It−24
11
i=1
Ft = (L
t – L
t–1) – C
t – E
t – V
tM M M M
It = I
t−1 ×
Ft
Lt−1
M⎛
⎝⎜
⎞
⎠⎟1+
at = F
t−iL
t−1−i
M
i=0
⎛
⎝⎜
⎞
⎠⎟
⎡
⎣⎢
⎤
⎦⎥×100∏ 1 + −1
11
at = I
tI
t−12
⎛⎝⎜
⎞⎠⎟× 100−1

ECB
Monthly Bulletin
January 2010S 78
Growth rates for intra-annual periods can be
derived by adapting formula g). For example,
the month-on-month growth rate aM
t can be
calculated as:
h)
Finally, the three-month moving average
(centred) for the annual growth rate of M3 is
obtained as (at+1
+ at + a
t-1)/3, where a
t is defi ned
as in f) or g) above.
CALCULATION OF GROWTH RATES FOR
QUARTERLY SERIES
If F t
Q and Lt-3
are defi ned as above, the index It
of adjusted outstanding amounts for the quarter
ending in month t is defi ned as:
i)
The annual growth rate in the four quarters
ending in month t (i.e. at) can be calculated
using formula g).
SEASONAL ADJUSTMENT OF THE EURO AREA
MONETARY STATISTICS 1
The approach used is based on multiplicative
decomposition using X-12-ARIMA.2 The
seasonal adjustment may include a day-of-the-
week adjustment, and for some series it is carried
out indirectly by means of a linear combination
of components. This is the case for M3, which is
derived by aggregating the seasonally adjusted
series for M1, M2 less M1, and M3 less M2.
The seasonal adjustment procedures are fi rst
applied to the index of adjusted outstanding
amounts.3 The resulting estimates of seasonal
factors are then applied to the levels and to the
adjustments arising from reclassifi cations and
revaluations, in turn yielding seasonally adjusted
transactions. Seasonal (and trading day) factors
are revised at annual intervals or as required.
SECTIONS 3.1 TO 3.5
EQUALITY OF USES AND RESOURCES
In Section 3.1 the data conform to a basic
accounting identity. For non-fi nancial
transactions, total uses equal total resources
for each transaction category. This accounting
identity is also refl ected in the fi nancial
account – i.e. for each fi nancial instrument
category, total transactions in fi nancial assets
equal total transactions in liabilities. In the
other changes in assets account and the fi nancial
balance sheets, total fi nancial assets equal total
liabilities for each fi nancial instrument category,
with the exception of monetary gold and special
drawing rights, which are by defi nition not a
liability of any sector.
CALCULATION OF BALANCING ITEMS
The balancing items at the end of each account in
Sections 3.1 and 3.2 are computed as follows.
The trade balance equals euro area imports
minus exports vis-à-vis the rest of the world for
goods and services.
It
It−1
at
=M −1⎛
⎝⎜
⎞
⎠⎟ ×100
It = I
t−3 ×⎛
⎝⎜
⎞
⎠⎟
Lt−3
FtQ
1+
For details, see “Seasonal adjustment of monetary aggregates and 1
HICP for the euro area”, ECB (August 2000) and the “Monetary
and fi nancial statistics” sub-section of the “Statistics” section of
the ECB’s website (www.ecb.europa. eu).
For details, see Findley, D., Monsell, B., Bell, W., Otto,2
M. and Chen, B. C. (1998), “New Capabilities and Methods
of the X-12-ARIMA Seasonal Adjustment Program”, Journal
of Business and Economic Statistics, 16, 2, pp.127-152, or
“X-12-ARIMA Reference Manual”, Time Series Staff, Bureau
of the Census, Washington, D.C.
For internal purposes, the model-based approach of
TRAMO-SEATS is also used. For details of TRAMO-SEATS,
see Gomez, V. and Maravall, A. (1996), “Programs TRAMO and
SEATS: Instructions for the User”, Banco de España, Working
Paper No 9628, Madrid.
It follows that for the seasonally adjusted series, the level of the 3
index for the base period (i.e. December 2001) generally differs
from 100, refl ecting the seasonality of that month.

ECB
Monthly Bulletin
January 2010 S 79
EURO AREASTATISTICS
Technical notes
Net operating surplus and mixed income
is defi ned for resident sectors only and is
calculated as gross value added (gross domestic
product at market prices for the euro area) minus
compensation of employees (uses) minus other
taxes less subsidies on production (uses) minus
consumption of fi xed capital (uses).
Net national income is defi ned for resident
sectors only and is computed as net operating
surplus and mixed income plus compensation of
employees (resources) plus taxes less subsidies
on production (resources) plus net property
income (resources minus uses).
Net disposable income is also defi ned only
for resident sectors and equals net national
income plus net current taxes on income and
wealth (resources minus uses) plus net social
contributions (resources minus uses) plus net
social benefi ts other than social transfers in kind
(resources minus uses) plus net other current
transfers (resources minus uses).
Net saving is defi ned for resident sectors and
is calculated as net disposable income plus
the net adjustment for the change in the net
equity of households in pension funds reserves
(resources minus uses) minus fi nal consumption
expenditure (uses). For the rest of the world, the
current external account is compiled as the trade
balance plus all net income (resources minus
uses).
Net lending/net borrowing is computed from
the capital account as net saving plus net capital
transfers (resources minus uses) minus gross
capital formation (uses) minus acquisitions
less disposals of non-produced non-fi nancial
assets (uses) plus consumption of fi xed capital
(resources). It can also be calculated in the
fi nancial account as total transactions in fi nancial
assets minus total transactions in liabilities
(also known as changes in net fi nancial worth
(wealth) due to transactions). For the household
and non-fi nancial corporation sectors, there is
a statistical discrepancy between the balancing
items computed from the capital account and
the fi nancial account.
Changes in net worth (wealth) are calculated
as changes in net worth (wealth) due to savings
and capital transfers plus other changes in net
fi nancial worth (wealth). They currently exclude
other changes in non-fi nancial assets owing to
the unavailability of data.
Net fi nancial worth (wealth) is calculated as
total fi nancial assets minus total liabilities,
whereas changes in net fi nancial worth (wealth)
are equal to the sum of changes in net fi nancial
worth (wealth) due to transactions (lending/net
borrowing from the fi nancial account) and other
changes in net fi nancial worth (wealth).
Finally, changes in net fi nancial worth (wealth)
due to transactions are computed as total
transactions in fi nancial assets minus total
transactions in liabilities, and other changes in
net fi nancial worth (wealth) are calculated as
total other changes in fi nancial assets minus
total other changes in liabilities.
SECTIONS 4.3 AND 4.4
CALCULATION OF GROWTH RATES FOR DEBT
SECURITIES AND QUOTED SHARES
Growth rates are calculated on the basis of
fi nancial transactions and therefore exclude
reclassifi cations, revaluations, exchange rate
variations and any other changes which do not
arise from transactions. They can be calculated
from transactions or from the index of notional
stocks. If N t
M represents the transactions
(net issues) in month t and Lt the level outstanding
at the end of month t, the index It of notional
stocks in month t is defi ned as:
j)
As a base, the index is set equal to 100 in
December 2001. The growth rate at for month
t, corresponding to the change in the 12 months
ending in month t, can be calculated using either
of the following two formulae:
It = I
t−1 ×
Nt
Lt−1
⎛
⎝⎜
⎞
⎠⎟1+

ECB
Monthly Bulletin
January 2010S 80
k)
l)
The method used to calculate the growth rates
for securities other than shares is the same as
that used for the monetary aggregates, the only
difference being that an “N” is used instead of
an “F”. This is to show that the method used to
obtain “net issues” for securities issues statistics
differs from that used to calculate equivalent
“transactions” for the monetary aggregates.
The average growth rate for the quarter ending
in month t is calculated as:
m)
where It is the index of notional stocks as at
month t. Likewise, for the year ending in month
t, the average growth rate is calculated as:
n)
The calculation formula used for Section 4.3 is
also used for Section 4.4 and is likewise based on
that used for the monetary aggregates. Section 4.4
is based on market values, and the calculations
are based on fi nancial transactions, which
exclude reclassifi cations, revaluations and any
other changes that do not arise from transactions.
Exchange rate variations are not included, as all
quoted shares covered are denominated in euro.
SEASONAL ADJUSTMENT OF SECURITIES ISSUES
STATISTICS 4
The approach used is based on multiplicative
decomposition using X-12-ARIMA. The
seasonal adjustment of total securities issues
is carried out indirectly by means of a linear
combination of sector and maturity component
breakdowns.
The seasonal adjustment procedures are
applied to the index of notional stocks. The
resulting estimates of seasonal factors are then
applied to the outstanding amounts, from which
seasonally adjusted net issues are derived.
Seasonal factors are revised at annual intervals
or as required.
As in formulae k) and l), the growth rate at for
month t, corresponding to the change in the six
months ending in month t, can be calculated
using either of the following two formulae:
o)
p)
TABLE 1 IN SECTION 5.1
SEASONAL ADJUSTMENT OF THE HICP 4
The approach used is based on multiplicative
decomposition using X-12-ARIMA (see
footnote 2 on page S78). The seasonal
adjustment of the overall HICP for the euro
area is carried out indirectly by aggregating
the seasonally adjusted euro area series for
processed food, unprocessed food, industrial
goods excluding energy, and services. Energy
is added without adjustment, since there is no
statistical evidence of seasonality. Seasonal
factors are revised at annual intervals or as
required.
at = N
t−iL
t−1−i
M
i=0
⎛
⎝⎜
⎞
⎠⎟
⎡
⎣⎢
⎤
⎦⎥×100∏ 1 + −1
11
at = I
tI
t−12
⎛⎝⎜
⎞⎠⎟×100−1
−1
⎞
⎠
⎟⎟⎟⎟
⎞
⎠
⎟⎟⎟⎟
×100
0.5It−12
+ ∑ It−i−12 + 0.5I
t−15
2
i=1
0.5It + ∑ It−i
+ 0.5It−3
2
i=1
⎞
⎠
⎟⎟⎟⎟
⎞
⎠
⎟⎟⎟⎟
−1 ×1000.5I
t + ∑ I
t−i + 0.5I
t−12
11
i=1
0.5It−12
+ ∑ It−i−12
+ 0.5It−24
11
i=1
For details, see “Seasonal adjustment of monetary aggregates and 4
HICP for the euro area”, ECB (August 2000) and the “Monetary
and fi nancial statistics” sub-section of the “Statistics” section of
the ECBís website (www.ecb.europa.eu).
at = N
t−iLt−1−i
M
i=0
⎛
⎝⎜
⎞
⎠⎟
⎡
⎣⎢
⎤
⎦⎥×100∏ 1 + −1
5
at = I
tIt−6
⎛⎝⎜
⎞⎠⎟×100−1

ECB
Monthly Bulletin
January 2010 S 81
EURO AREASTATISTICS
Technical notes
TABLE 2 IN SECTION 7.1
SEASONAL ADJUSTMENT OF THE BALANCE OF
PAYMENTS CURRENT ACCOUNT
The approach used is based on multiplicative
decomposition using X-12-ARIMA
(see footnote 2 on page S78). The raw data for
goods, services and income are preadjusted
to take a working day effect into account. The
working day adjustment in goods and services
is corrected for national public holidays. The
seasonal adjustment of these items is carried
out using these preadjusted series. The seasonal
adjustment of the total current account is carried
out by aggregating the seasonally adjusted euro
area series for goods, services, income and
current transfers. Seasonal (and trading day)
factors are revised at biannual intervals or as
required.
SECTION 7.3
CALCULATION OF GROWTH RATES FOR THE
QUARTERLY AND ANNUAL SERIES
The annual growth rate for quarter t is calculated
on the basis of quarterly transactions (Ft) and
positions (Lt) as follows:
The growth rate for the annual series is equal to
the growth rate in the last quarter of the year.
at
t
= ×100⎛⎝⎜
⎛⎝⎜
⎞⎠⎟
⎞⎠⎟
i=t-3∏ 1 + Fi
Li-l
— −1


ECB
Monthly Bulletin
January 2010 S 83
The “Euro area statistics” section of the
Monthly Bulletin focuses on statistics for the
euro area as a whole. More detailed and longer
runs of data, with further explanatory notes, are
available in the “Statistics” section of the ECB’s
website (www.ecb.europa.eu). This allows user-
friendly access to data via the ECB’s Statistical
Data Warehouse (http://sdw.ecb.europa.eu),
which includes search and download facilities.
Further services available in the “Data services”
sub-section include subscriptions to different
datasets and a repository of compressed Comma
Separated Value (CSV) fi les. For further
information, please contact us at: statistics@
ecb.europa.eu.
In general, the cut-off date for the statistics
included in the Monthly Bulletin is the day
preceding the fi rst meeting in the month of the
Governing Council of the ECB. For this issue,
the cut-off date was 13 January 2010.
Unless otherwise indicated, all data series
including observations for 2009 relate to the
Euro 16 (the euro area including Slovakia) for the
whole time series. For interest rates, monetary
statistics and the HICP (and, for consistency
reasons, the components and counterparts of M3
and the components of the HICP), the statistical
series refer to the changing composition of the
euro area. Where applicable, this is indicated in
the tables by means of a footnote. In such cases,
where underlying data are available, absolute
and percentage changes for the respective year
of entry into the euro area of Greece (2001),
Slovenia (2007), Cyprus (2008), Malta (2008)
and Slovakia (2009), calculated from bases
covering the year prior to the year of entry, use
a series in which the impact of these countries’
joining the euro area is taken into account.
Historical data referring to the euro area before
the entry of Slovakia are available on the ECB’s
website at: http://www.ecb.europa.eu/stats/
services/downloads/html/index.en.html.
The statistical series referring to the changing
composition of the euro area are based on the
euro area composition at the time to which the
statistics relate. Thus, data prior to 2001 refer to
the Euro 11, i.e. the following 11 EU Member
States: Belgium, Germany, Ireland, Spain,
France, Italy, Luxembourg, the Netherlands,
Austria, Portugal and Finland. Data from 2001
to 2006 refer to the Euro 12, i.e. the Euro 11 plus
Greece. Data for 2007 refer to the Euro 13, i.e.
the Euro 12 plus Slovenia. Data for 2008 refer
to the Euro 15, i.e. the Euro 13 plus Cyprus and
Malta, and data as of 2009 refer to the Euro 16,
i.e. the Euro 15 plus Slovakia.
Given that the composition of the European
currency unit (ECU) does not coincide with the
former currencies of the countries that have
adopted the single currency, pre-1999 amounts
originally expressed in the participating
currencies and converted into ECU at current
ECU exchange rates are affected by movements
in the currencies of EU Member States that have
not adopted the euro. To avoid this effect on the
monetary statistics, pre-1999 data 1 are expressed
in units converted from national currencies at
the irrevocable euro exchange rates established
on 31 December 1998. Unless otherwise
indicated, price and cost statistics before 1999
are based on data expressed in national
currency terms.
Methods of aggregation and/or consolidation
(including cross-country consolidation) have
been used where appropriate.
Recent data are often provisional and may be
revised. Discrepancies between totals and their
components may arise from rounding.
The group “Other EU Member States” comprises
Bulgaria, the Czech Republic, Denmark,
Estonia, Latvia, Lithuania, Hungary, Poland,
Romania, Sweden and the United Kingdom.
In most cases, the terminology used within the
tables follows international standards, such
as those contained in the European System
Data on monetary statistics in Sections 2.1 to 2.8 are available 1
for periods prior to January 1999 on the ECB’s website
(http://www.ecb.europa.eu/stats/services/downloads/html/index.
en.html) and in the SDW (http://sdw.ecb.europa.eu/browse.
do?node=2018811).
GENERAL NOTES

ECB
Monthly Bulletin
January 2010S 84
of Accounts 1995 and the IMF Balance
of Payments Manual. Transactions refer to
voluntary exchanges (measured directly or
derived), while fl ows also encompass changes
in outstanding amounts owing to price
and exchange rate changes, write-offs and
other changes.
In the tables, the wording “up to (x) years”
means “up to and including (x) years”.
OVERVIEW
Developments in key indicators for the euro area
are summarised in an overview table.
MONETARY POLICY STATISTICS
Section 1.4 shows statistics on minimum reserve
and liquidity factors. Maintenance periods for
minimum reserve requirements start every month
on the settlement day of the main refi nancing
operation (MRO) following the Governing
Council meeting for which the monthly
assessment of the monetary policy stance is
scheduled. They end on the day preceding the
corresponding settlement day in the following
month. Annual/quarterly observations refer to
averages for the last reserve maintenance period
of the year/quarter.
Table 1 in Section 1.4 shows the components
of the reserve base of credit institutions
subject to reserve requirements. Liabilities
vis-à-vis other credit institutions subject to
the ESCB’s minimum reserve system, the
ECB and participating national central banks
are excluded from the reserve base. When a
credit institution cannot provide evidence of
the amount of its issues of debt securities with
a maturity of up to two years which are held
by the institutions mentioned above, it may
deduct a certain percentage of these liabilities
from its reserve base. The percentage used
to calculate the reserve base was 10% until
November 1999 and has been 30% since
that date.
Table 2 in Section 1.4 contains average data
for completed maintenance periods. First,
the reserve requirement of each individual
credit institution is calculated by applying the
reserve ratios for the corresponding categories
of liability to the eligible liabilities, using the
balance sheet data from the end of each calendar
month. Subsequently, each credit institution
deducts from this fi gure a lump-sum allowance
of €100,000. The resulting required reserves are
then aggregated at the euro area level (column 1).
Current account holdings (column 2) are the
aggregate average daily current account holdings
of credit institutions, including those that serve
to fulfi l reserve requirements. Excess reserves
(column 3) are the average current account
holdings over the maintenance period in excess
of the required reserves. Defi ciencies (column 4)
are defi ned as the average shortfalls of current
account holdings from required reserves over
the maintenance period, computed on the basis
of those credit institutions that have not fulfi lled
their reserve requirements. The interest rate on
minimum reserves (column 5) is equal to the
average, over the maintenance period, of the
ECB’s rate (weighted according to the number
of calendar days) on the Eurosystem’s MROs
(see Section 1.3).
Table 3 in Section 1.4 shows the banking
system’s liquidity position, which is defi ned
as euro area credit institutions’ current account
holdings with the Eurosystem in euro. All
amounts are derived from the consolidated
fi nancial statement of the Eurosystem. Other
liquidity-absorbing operations (column 7)
exclude the issuance of debt certifi cates
initiated by NCBs in Stage Two of EMU. Net
other factors (column 10) represent the netted
remaining items in the consolidated fi nancial
statement of the Eurosystem. Credit institutions’
current accounts (column 11) are equal to
the difference between the sum of liquidity-
providing factors (columns 1 to 5) and the sum
of liquidity-absorbing factors (columns 6 to 10).
Base money (column 12) is calculated as the
sum of the deposit facility (column 6), banknotes
in circulation (column 8) and credit institutions’
current account holdings (column 11).

ECB
Monthly Bulletin
January 2010 S 85
EURO AREASTATISTICS
General notes
MONEY, BANKING AND INVESTMENT FUNDS
Section 2.1 shows the aggregated balance sheet
of the monetary fi nancial institution sector,
i.e. the sum of the harmonised balance sheets of
all MFIs resident in the euro area. MFIs comprise
central banks, credit institutions as defi ned
under Community law, money market funds and
other institutions whose business it is to receive
deposits and/or close substitutes for deposits
from entities other than MFIs and, for their own
account (at least in economic terms), to grant
credit and/or make investments in securities.
A complete list of MFIs is published on the
ECB’s website.
Section 2.2 shows the consolidated balance
sheet of the MFI sector, which is obtained by
netting the aggregated balance sheet positions of
MFIs in the euro area. Owing to a small amount
of heterogeneity in recording practices, the sum
of the inter-MFI positions is not necessarily
zero; the balance is shown in column 10 of
the liabilities side of Section 2.2. Section 2.3
sets out the euro area monetary aggregates
and counterparts. These are derived from the
consolidated MFI balance sheet and include
positions of non-MFIs resident in the euro area
held with MFIs resident in the euro area; they
also take account of some monetary assets/
liabilities of central government. Statistics
on monetary aggregates and counterparts are
adjusted for seasonal and trading day effects.
The external liabilities item in Sections 2.1
and 2.2 shows the holdings by non-euro area
residents of: (i) shares/units issued by money
market funds located in the euro area; and
(ii) debt securities issued with a maturity of up
to two years by MFIs located in the euro area.
In Section 2.3, however, these holdings are
excluded from the monetary aggregates and
contribute to the item “net external assets”.
Section 2.4 provides analysis, broken down
by sector, type and original maturity, of loans
granted by MFIs other than the Eurosystem
(i.e. the banking system) resident in the euro
area. Section 2.5 provides analysis, broken down
by sector and instrument, of deposits held with
the euro area banking system. Section 2.6 shows
the securities held by the euro area banking
system, broken down by type of issuer.
Sections 2.2 to 2.6 include data on transactions,
which are derived as differences in outstanding
amounts adjusted for reclassifi cations,
revaluations, exchange rate variations and any
other changes that do not arise from transactions.
Section 2.7 shows selected revaluations that
are used in the derivation of transactions.
Sections 2.2 to 2.6 also provide growth rates
based on those transactions in the form of
annual percentage changes. Section 2.8 shows a
quarterly currency breakdown of selected MFI
balance sheet items.
Details of sector defi nitions are set out in the
third edition of the “Monetary fi nancial
institutions and markets statistics sector manual –
Guidance for the statistical classifi cation of
customers” (ECB, March 2007). The publication
“Guidance Notes to the Regulation ECB/2001/13
on the MFI Balance Sheet Statistics” (ECB,
November 2002) explains practices that NCBs
are recommended to follow. Since
1 January 1999, statistical information has been
collected and compiled on the basis of
Regulation ECB/1998/16 of 1 December 1998
concerning the consolidated balance sheet of the
monetary fi nancial institutions sector,2 as last
amended by Regulation ECB/2003/10 3.
In line with this Regulation, the balance sheet
item “money market paper” has been merged
with the item “debt securities” on both the assets
and liabilities sides of the MFI balance sheet.
Section 2.9 shows outstanding amounts and
transactions on the balance sheet of euro area
investment funds (other than money market
funds, which are included in the MFI balance
sheet statistics). An investment fund is a
collective investment undertaking that invests
capital raised from the public in fi nancial and/
or non-fi nancial assets. A complete list of euro
OJ L 356, 30.12.1998, p. 7.2
OJ L 250, 2.10.2003, p. 19.3

ECB
Monthly Bulletin
January 2010S 86
area investment funds is published on the ECB’s
website. The balance sheet is aggregated, so
investment funds' assets include their holdings
of shares/units issued by other investment
funds. Shares/units issued by investment funds
are also broken down by investment policy
(i.e. into bond funds, equity funds, mixed
funds, real estate funds, hedge funds and other
funds) and by type (i.e. into open-end funds and
closed-end funds). Section 2.10 provides further
details on the main types of asset held by euro
area investment funds. This Section contains
a geographical breakdown of the issuers of
securities held by investment funds, as well
as breaking issuers down by economic sector
where they are resident in the euro area.
Further information on these investment fund
statistics can be found in the “Manual on
investment fund statistics”. Since December 2008
harmonised statistical information has been
collected and compiled on the basis of
Regulation ECB/2007/8 concerning statistics on
the assets and liabilities of investment funds.
EURO AREA ACCOUNTS
Section 3.1 shows quarterly integrated euro area
accounts data, which provide comprehensive
information on the economic activities of
households (including non-profi t institutions
serving households), non-fi nancial corporations,
fi nancial corporations and general government,
as well as on the interaction between these
sectors and both the euro area and the rest of the
world. Non-seasonally adjusted data on current
prices are displayed for the last available quarter,
following a simplifi ed sequence of accounts in
accordance with the methodological framework
of the European System of Accounts 1995.
In short, the sequence of accounts (transactions)
comprises: (1) the generation of income account,
which shows how production activity translates
into various categories of income; (2) the
allocation of primary income account, which
records receipts and expenses relating to various
forms of property income (for the economy as a
whole; the balancing item of the primary income
account is national income); (3) the secondary
distribution of income account, which shows
how the national income of an institutional
sector changes because of current transfers;
(4) the use of income account, which shows how
disposable income is spent on consumption or
saved; (5) the capital account, which shows how
savings and net capital transfers are spent in the
acquisition of non-fi nancial assets (the balancing
item of the capital account is net lending/
net borrowing); and (6) the fi nancial account,
which records the net acquisitions of fi nancial
assets and the net incurrence of liabilities. As
each non-fi nancial transaction is mirrored by a
fi nancial transaction, the balancing item of the
fi nancial account conceptually also equals net
lending/net borrowing as calculated from the
capital account.
In addition, opening and closing fi nancial
balance sheets are presented, which provide a
picture of the fi nancial wealth of each individual
sector at a given point in time. Finally, other
changes in fi nancial assets and liabilities
(e.g. those resulting from the impact of changes
in asset prices) are also shown.
The sectoral coverage of the fi nancial account
and the fi nancial balance sheets is more detailed
for the fi nancial corporation sector, which
is broken down into MFIs, other fi nancial
intermediaries (including fi nancial auxiliaries),
and insurance corporations and pension funds.
Section 3.2 shows four-quarter cumulated fl ows
(transactions) for the “non-fi nancial accounts”
of the euro area (i.e. accounts (1) to (5) above),
also following the simplifi ed sequence of
accounts.
Section 3.3 shows four-quarter cumulated fl ows
(transactions and other changes) for households’
income, expenditure and accumulation accounts,
as well as outstanding amounts for the fi nancial
balance sheet accounts, presenting data in
a more analytical manner. Sector-specifi c
transactions and balancing items are arranged
in a way that more clearly depicts the fi nancing

ECB
Monthly Bulletin
January 2010 S 87
EURO AREASTATISTICS
General notes
and investment decisions of households, while
respecting the accounting identities presented in
Sections 3.1 and 3.2.
Section 3.4 displays four-quarter cumulated fl ows
(transactions) for non-fi nancial corporations’
income and accumulation accounts, as well as
outstanding amounts for the fi nancial balance
sheet accounts, presenting data in a more
analytical manner.
Section 3.5 shows four-quarter cumulated
fi nancial fl ows (transactions and other changes)
and outstanding amounts for the fi nancial
balance sheets of insurance corporations and
pension funds.
FINANCIAL MARKETS
The series on fi nancial market statistics for the
euro area cover those EU Member States that
had adopted the euro at the time to which the
statistics relate (i.e. a changing composition),
with the exception of statistics on securities
issues (Sections 4.1 to 4.4), which relate to the
Euro 16 for the whole time series (i.e. a fi xed
composition).
Statistics on securities other than shares and
statistics on quoted shares (Sections 4.1 to
4.4) are produced by the ECB using data from
the ESCB and the BIS. Section 4.5 presents
MFI interest rates on euro-denominated
deposits from and loans to euro area residents.
Statistics on money market interest rates, long-
term government bond yields and stock market
indices (Sections 4.6 to 4.8) are produced by
the ECB using data from wire services.
Statistics on securities issues cover: (i) securities
other than shares, excluding fi nancial derivatives;
and (ii) quoted shares. The former are presented
in Sections 4.1, 4.2 and 4.3, while the latter
are presented in Section 4.4. Debt securities are
broken down into short-term and long-term
securities. “Short-term” means securities
with an original maturity of one year or less
(in exceptional cases, two years or less).
Securities with (i) a longer maturity, (ii) optional
maturity dates, the latest of which is more than
one year away, or (iii) indefi nite maturity dates
are classifi ed as “long-term”. Long-term debt
securities issued by euro area residents are
broken down further into fi xed and variable rate
issues. Fixed rate issues consist of issues where
the coupon rate does not change during the life
of the issue. Variable rate issues comprise all
issues where the coupon is periodically refi xed
with reference to an independent interest rate
or index. The statistics on debt securities are
estimated to cover approximately 95% of
total issues by euro area residents. The euro-
denominated securities indicated in Sections 4.1,
4.2 and 4.3 also include items expressed in
national denominations of the euro.
Section 4.1 shows securities other than shares,
broken down by original maturity, residency of
the issuer and currency. It presents outstanding
amounts, gross issues and net issues of
securities other than shares, broken down into:
(i) issues denominated in euro and issues in all
currencies; (ii) issues by euro area residents
and total issues; and (iii) total and long-term
maturities. Net issues differ from the changes
in outstanding amounts owing to valuation
changes, reclassifi cations and other adjustments.
This section also presents seasonally adjusted
statistics, including six-month annualised
seasonally adjusted growth rates for total and
long-term debt securities. Seasonally adjusted
data are derived from the index of notional
stocks, from which the seasonal effects have
been removed. See the Technical Notes for
details.
Section 4.2 contains a sectoral breakdown
of outstanding amounts, gross issues and net
issues for issuers resident in the euro area in line
with the ESA 95. The ECB is included in the
Eurosystem.
The total outstanding amounts for total and
long-term debt securities in column 1 of Table 1 in
Section 4.2 correspond to the data on outstanding

ECB
Monthly Bulletin
January 2010S 88
amounts for total and long-term debt securities
issued by euro area residents in column 7 of
Section 4.1. The outstanding amounts for total
and long-term debt securities issued by MFIs in
column 2 of Table 1 in Section 4.2 are broadly
comparable with the data on debt securities issued
on the liabilities side of the aggregated MFI
balance sheet in column 8 of Table 2 in Section 2.1.
The total net issues for total debt securities in
column 1 of Table 2 in Section 4.2 correspond to
the data on total net issues by euro area residents
in column 9 of Section 4.1. The residual difference
between long-term debt securities and total fi xed
and variable rate long-term debt securities in
Table 1 of Section 4.2 consists of zero coupon
bonds and revaluation effects.
Section 4.3 shows seasonally adjusted and
non-seasonally adjusted growth rates for debt
securities issued by euro area residents (broken
down by maturity, type of instrument, sector
of the issuer and currency), which are based
on fi nancial transactions that occur when an
institutional unit incurs or redeems liabilities. The
growth rates therefore exclude reclassifi cations,
revaluations, exchange rate variations and any
other changes that do not arise from transactions.
The seasonally adjusted growth rates have been
annualised for presentational purposes. See the
Technical Notes for details.
Columns 1, 4, 6 and 8 in Table 1 of Section 4.4
show the outstanding amounts of quoted shares
issued by euro area residents broken down by
issuing sector. The monthly data for quoted
shares issued by non-fi nancial corporations
correspond to the quarterly series shown in
Section 3.4 (fi nancial balance sheet; quoted
shares).
Columns 3, 5, 7 and 9 in Table 1 of Section 4.4
show annual growth rates for quoted shares
issued by euro area residents (broken down by
the sector of the issuer), which are based on
fi nancial transactions that occur when an issuer
issues or redeems shares for cash, excluding
investments in the issuer’s own shares.
The calculation of annual growth rates excludes
reclassifi cations, revaluations and any other
changes that do not arise from transactions.
Section 4.5 presents statistics on all the interest
rates that MFIs resident in the euro area apply
to euro-denominated deposits and loans vis-à-
vis households and non-fi nancial corporations
resident in the euro area. Euro area MFI interest
rates are calculated as a weighted average
(by corresponding business volume) of the euro
area countries’ interest rates for each category.
MFI interest rate statistics are broken down by
type of business coverage, sector, instrument
category and maturity, period of notice or initial
period of interest rate fi xation. These MFI
interest rate statistics replaced the ten transitional
statistical series on euro area retail interest rates
that had been published in the Monthly Bulletin
as of January 1999.
Section 4.6 presents money market interest rates
for the euro area, the United States and Japan.
For the euro area, a broad spectrum of money
market interest rates is covered, ranging from
interest rates on overnight deposits to those on
twelve-month deposits. Before January 1999,
synthetic euro area interest rates were calculated
on the basis of national rates weighted by
GDP. With the exception of the overnight rate
prior to January 1999, monthly, quarterly and
yearly values are period averages. Overnight
deposits are represented by end-of-period
interbank deposit bid rates up to and including
December 1998 and period averages for the euro
overnight index average (EONIA) thereafter.
As of January 1999, euro area interest rates on
one, three, six and twelve-month deposits are
euro interbank offered rates (EURIBOR); prior
to that date, they are London interbank offered
rates (LIBOR) where available. For the United
States and Japan, interest rates on three-month
deposits are represented by LIBOR.
Section 4.7 shows end-of-period rates estimated
from nominal spot yield curves based on AAA-
rated euro-denominated bonds issued by euro
area central governments. The yield curves are

ECB
Monthly Bulletin
January 2010 S 89
EURO AREASTATISTICS
General notes
estimated using the Svensson model 4. Spreads
between the ten-year rates and the three-month
and two-year rates are also released. Additional
yield curves (daily releases, including charts and
tables) and the corresponding methodological
information are available at: http://www.ecb.
europa.eu/stats/money/yc/html/index.en.html.
Daily data can also be downloaded.
Section 4.8 shows stock market indices for the
euro area, the United States and Japan.
PRICES, OUTPUT, DEMAND AND LABOUR MARKETS
Most of the data described in this section are
produced by the European Commission (mainly
Eurostat) and national statistical authorities. Euro
area results are obtained by aggregating data
for individual countries. As far as possible, the
data are harmonised and comparable. Statistics
on hourly labour costs, GDP and expenditure
components, value added by economic activity,
industrial production, retail sales and passenger
car registrations are working day-adjusted.
The Harmonised Index of Consumer Prices
(HICP) for the euro area (Table 1 in Section 5.1)
is available from 1995 onwards. It is based
on national HICPs, which follow the same
methodology in all euro area countries. The
breakdown into goods and services components
is derived from the classifi cation of individual
consumption by purpose (Coicop/HICP).
The HICP covers monetary expenditure by
households on fi nal consumption in the economic
territory of the euro area. The table includes
seasonally adjusted HICP data and experimental
HICP-based estimates of administered prices,
which are compiled by the ECB.
Industrial producer prices (Table 2 in
Section 5.1), industrial production, industrial
new orders, industrial turnover and retail sales
(Section 5.2) are covered by Council Regulation
(EC) No 1165/98 of 19 May 1998 concerning
short-term statistics5. Since January 2009 the
revised classifi cation of economic activities
(NACE Revision 2), as covered by Regulation
(EC) No 1893/2006 of the European Parliament
and of the Council of 20 December 2006
establishing the statistical classifi cation
of economic activities NACE Revision 2 and
amending Council Regulation (EEC)
No 3037/90, as well as certain EC Regulations
on specifi c statistical domains,6 has been applied
in the production of short-term statistics. The
breakdown by end-use of product for industrial
producer prices and industrial production is the
harmonised sub-division of industry excluding
construction (NACE Revision 2, sections B
to E) into Main Industrial Groupings (MIGs)
as defi ned by Commission Regulation (EC)
No 656/2007 of 14 June 2007 7. Industrial
producer prices refl ect the ex-factory gate prices
of producers. They include indirect taxes except
VAT and other deductible taxes. Industrial
production refl ects the value added of the
industries concerned.
The two non-energy commodity price indices
shown in Table 3 in Section 5.1 are compiled
with the same commodity coverage, but using
two different weighting schemes: one based on
the respective commodity imports of the euro
area (columns 2-4), and the other (columns 5-7)
based on estimated euro area domestic demand,
or “use”, taking into account information on
imports, exports and the domestic production
of each commodity (ignoring, for the sake of
simplicity, inventories, which are assumed to
be relatively stable over the observed period).
The import-weighted commodity price index is
appropriate for analysing external developments,
while the use-weighted index is suitable for
the specifi c purpose of analysing international
commodity price pressures on euro area infl ation.
The use-weighted commodity price indices are
experimental data. For more details as regards
the compilation of the ECB commodity price
indices, see Box 1 in the December 2008 issue
of the Monthly Bulletin.
Svensson, L. E., “Estimating and Interpreting Forward Interest 4
Rates: Sweden 1992-1994”, Centre for Economic Policy
Research, Discussion Paper No 1051, 1994.
OJ L 162, 5.6.1998, p. 1.5
OJ L 393, 30.12.2006, p. 1. 6
OJ L 155, 15.6.2007, p. 3.7

ECB
Monthly Bulletin
January 2010S 90
The labour cost indices (Table 5 in Section 5.1)
measure the changes in labour costs per hour
worked in industry (including construction) and
market services. Their methodology is laid down
in Regulation (EC) No 450/2003 of the European
Parliament and of the Council of 27 February
2003 concerning the labour cost index 8 and in
the implementing Commission Regulation (EC)
No 1216/2003 of 7 July 2003 9. A breakdown of
hourly labour costs for the euro area is available
by labour cost component (wages and salaries,
and employers’ social contributions plus
employment-related taxes paid by the employer
less subsidies received by the employer) and by
economic activity. The ECB calculates the
indicator of negotiated wages (memo item
in Table 3 of Section 5.1) on the basis of
non-harmonised, national-defi nition data.
Unit labour cost components (Table 4 in
Section 5.1), GDP and its components (Tables 1
and 2 in Section 5.2), GDP defl ators (Table 3 in
Section 5.1) and employment statistics (Table 1
in Section 5.3) are derived from the ESA 95
quarterly national accounts.
Industrial new orders (Table 4 in Section 5.2)
measure the orders received during the reference
period and cover industries working mainly on
the basis of orders – in particular the textile, pulp
and paper, chemical, metal, capital goods and
durable consumer goods industries. The data are
calculated on the basis of current prices.
Indices for turnover in industry and for the
retail trade (Table 4 in Section 5.2) measure the
turnover, including all duties and taxes (with
the exception of VAT), invoiced during the
reference period. Retail trade turnover covers all
retail trade (excluding sales of motor vehicles
and motorcycles), except automotive fuel. New
passenger car registrations cover registrations of
both private and commercial passenger cars. The
euro area series excludes Cyprus and Malta.
Qualitative business and consumer survey data
(Table 5 in Section 5.2) draw on the European
Commission Business and Consumer Surveys.
Unemployment rates (Table 2 in Section 5.3)
conform to International Labour Organization
guidelines. They refer to persons actively
seeking work as a share of the labour force,
using harmonised criteria and defi nitions.
The labour force estimates underlying the
unemployment rate are different from the sum
of the employment and unemployment levels
published in Section 5.3.
GOVERNMENT FINANCE
Sections 6.1 to 6.5 show the general government
fi scal position in the euro area. The data are
mainly consolidated and are based on the
ESA 95 methodology. The annual euro area
aggregates in Sections 6.1 to 6.3 are compiled
by the ECB on the basis of harmonised data
provided by the NCBs, which are regularly
updated. The defi cit and debt data for the euro
area countries may therefore differ from those
used by the European Commission within the
excessive defi cit procedure. The quarterly euro
area aggregates in Sections 6.4 and 6.5 are
compiled by the ECB on the basis of Eurostat
and national data.
Section 6.1 presents annual fi gures on general
government revenue and expenditure on the
basis of defi nitions laid down in Commission
Regulation (EC) No 1500/2000 of 10 July 2000 10
amending the ESA 95. Section 6.2 shows details
of general government gross consolidated debt
at nominal value in line with the Treaty
provisions on the excessive defi cit procedure.
Sections 6.1 and 6.2 include summary data for
the individual euro area countries owing to their
importance within the framework of the Stability
and Growth Pact. The defi cits/surpluses
presented for the individual euro area countries
correspond to excessive defi cit procedure B.9,
as defi ned by Council Regulation (EC)
No 479/2009 as regards references to the
ESA 95. Section 6.3 presents changes in general
OJ L 69, 13.3.2003, p. 1.8
OJ L 169, 8.7.2003, p. 37.9
OJ L 172, 12.7.2000, p. 3. 10

ECB
Monthly Bulletin
January 2010 S 91
EURO AREASTATISTICS
General notes
government debt. The difference between the
change in the government debt and the
government defi cit – the defi cit-debt adjustment –
is mainly explained by government transactions
in fi nancial assets and by foreign exchange
valuation effects. Section 6.4 presents quarterly
fi gures on general government revenue and
expenditure on the basis of defi nitions laid down
in Regulation (EC) No 1221/2002 of the
European Parliament and of the Council of
10 June 2002 on quarterly non-fi nancial accounts
for general government 11. Section 6.5 presents
quarterly fi gures on gross consolidated
government debt, the defi cit-debt adjustment
and the government borrowing requirement.
These fi gures are compiled using data provided
by the Member States under Regulation (EC)
No 501/2004 and Regulation (EC) No 222/2004
and data provided by the NCBs.
EXTERNAL TRANSACTIONS AND POSITIONS
The concepts and defi nitions used in balance of
payments and international investment position
(i.i.p.) statistics (Sections 7.1 to 7.4) are
generally in line with the IMF Balance of
Payments Manual (fi fth edition, October 1993),
the ECB Guideline of 16 July 2004 on the
statistical reporting requirements of the ECB
(ECB/2004/15)12 and the amending ECB
Guideline of 31 May 2007 (ECB/2007/3) 13.
Additional information regarding the
methodologies and sources used in the euro area
b.o.p. and i.i.p. statistics can be found in the
ECB publication entitled “European Union
balance of payments/international investment
position statistical methods” (May 2007) and in
the reports of the Task Force on Portfolio
Investment Collection Systems (June 2002), the
Task Force on Portfolio Investment Income
(August 2003) and the Task Force on Foreign
Direct Investment (March 2004), all of which
can be downloaded from the ECB’s website. In
addition, a report by the ECB/European
Commission (Eurostat) Task Force on Quality
looking at balance of payments and international
investment position statistics (June 2004) is
available on the website of the Committee on
Monetary, Financial and Balance of Payments
Statistics (www.cmfb.org). The annual quality
report on the euro area b.o.p./i.i.p., which is
based on the Task Force’s recommendations
and follows the basic principles of the ECB
Statistics Quality Framework published in
April 2008, is available on the ECB’s website.
The tables in Sections 7.1 and 7.4 follow
the sign convention in the IMF Balance of
Payments Manual – i.e. surpluses in the current
account and the capital account have a plus
sign, while in the fi nancial account a plus sign
denotes an increase in liabilities or a decrease
in assets. In the tables in Section 7.2, both credit
and debit transactions are presented with a plus
sign. Furthermore, as of the February 2008
issue of the Monthly Bulletin, the tables in
Section 7.3 have been restructured in order to
allow the data on the balance of payments, the
international investment position and related
growth rates to be presented together; in the new
tables, transactions in assets and liabilities that
correspond to increases in positions are shown
with a plus sign.
The euro area b.o.p. is compiled by the ECB.
Recent monthly fi gures should be regarded as
provisional. Data are revised when fi gures for
the following month and/or the detailed quarterly
b.o.p. are published. Earlier data are revised
periodically or as a result of methodological
changes in the compilation of the source data.
Table 1 in Section 7.2 also contains seasonally
adjusted data for the current account. Where
appropriate, the adjustment also covers working
day, leap year and/or Easter-related effects.
Table 3 in Section 7.2 and Table 8 in Section 7.3
present a breakdown of the euro area b.o.p. and
i.i.p. vis-à-vis major partner countries, both
individually and as a group, distinguishing
between EU Member States outside the euro
area and countries or areas outside the European
Union. The breakdown also shows transactions
and positions vis-à-vis EU institutions (which,
OJ L 179, 9.7.2002, p. 1.11
OJ L 354, 30.11.2004, p. 34.12
OJ L 159, 20.6.2007, p. 48.13

ECB
Monthly Bulletin
January 2010S 92
with the exception of the ECB, are considered
to be outside the euro area for statistical
purposes, regardless of their physical location)
and, for some purposes, offshore centres and
international organisations. The breakdown does
not cover transactions or positions in portfolio
investment liabilities, fi nancial derivatives or
international reserves. In addition, separate data
are not provided for investment income payable
to Brazil, mainland China, India or Russia. The
geographical breakdown is described in the
article entitled “Euro area balance of payments
and international investment position vis-à-vis
main counterparts” in the February 2005 issue
of the Monthly Bulletin.
The data on the euro area b.o.p. fi nancial
account and i.i.p. in Section 7.3 are based
on transactions and positions vis-à-vis non-
residents of the euro area, regarding the euro
area as a single economic entity (see also Box 9
in the December 2002 issue of the Monthly
Bulletin, Box 5 in the January 2007 issue of
the Monthly Bulletin and Box 6 in the January
2008 issue of the Monthly Bulletin). The i.i.p.
is valued at current market prices, with the
exception of direct investment, where book
values are used for unquoted shares, and other
investments (e.g. loans and deposits). The
quarterly i.i.p. is compiled on the basis of the
same methodological framework as the annual
i.i.p. As some data sources are not available on
a quarterly basis (or are available with a delay),
the quarterly i.i.p. is partly estimated on the
basis of fi nancial transactions, asset prices and
foreign exchange developments.
Table 1 in Section 7.3 summarises the i.i.p. and
fi nancial transactions in the euro area b.o.p.
The breakdown of the change in the annual
i.i.p. is obtained by applying a statistical model
to i.i.p. changes other than transactions, using
information from the geographical breakdown
and currency composition of assets and
liabilities, as well as price indices for different
fi nancial assets. In this table, columns 5 and
6 refer to direct investment by resident units
abroad and direct investment by non-resident
units in the euro area.
In Table 5 in Section 7.3, the breakdown into
“loans” and “currency and deposits” is based
on the sector of the non-resident counterpart –
i.e. assets vis-à-vis non-resident banks are
classifi ed as deposits, whereas assets vis-à-vis
other non-resident sectors are classifi ed as loans.
This breakdown follows the distinction made in
other statistics, such as the MFI consolidated
balance sheet, and conforms to the IMF Balance
of Payments Manual.
The outstanding amounts for the Eurosystem’s
international reserves and related assets and
liabilities are shown in Table 7 of Section 7.3.
These fi gures are not fully comparable with
those in the Eurosystem’s weekly fi nancial
statement owing to differences in coverage
and valuation. The data in Table 7 are in line
with the recommendations for the template on
international reserves and foreign currency
liquidity. Changes in the gold holdings of the
Eurosystem (column 3) are due to transactions
in gold within the terms of the Central Bank
Gold Agreement of 26 September 1999, which
was updated on 27 September 2009. More
information on the statistical treatment of the
Eurosystem’s international reserves can be found
in a publication entitled “Statistical treatment
of the Eurosystem’s international reserves”
(October 2000), which can be downloaded from
the ECB’s website. The website also contains
more comprehensive data in accordance with the
template on international reserves and foreign
currency liquidity.
Section 7.4 contains a monetary presentation
of the euro area balance of payments, showing
the transactions by non-MFIs that mirror the net
external transactions by MFIs. Included in the
transactions by non-MFIs are b.o.p. transactions
for which a sectoral breakdown is not available.
These concern the current and capital accounts
(column 2) and fi nancial derivatives (column 11).
An up-to-date methodological note on the
monetary presentation of the euro area balance
of payments is available in the “Statistics”
section of the ECB’s website. See also Box 1 in
the June 2003 issue of the Monthly Bulletin.

ECB
Monthly Bulletin
January 2010 S 93
EURO AREASTATISTICS
General notes
Section 7.5 shows data on euro area external
trade in goods. The source is Eurostat. Value data
and volume indices are seasonally and working
day-adjusted. The breakdown by product
group in columns 4 to 6 and 9 to 11 of Table 1
in Section 7.5 is in line with the classifi cation
contained in the Broad Economic Categories
and corresponds to the basic classes of goods in
the System of National Accounts. Manufactured
goods (columns 7 and 12) and oil (column 13)
are in line with the SITC Rev. 4 defi nition. The
geographical breakdown (Table 3 in Section 7.5)
shows major trading partners both individually
and in regional groups. China excludes Hong
Kong. On account of differences in defi nitions,
classifi cation, coverage and time of recording,
external trade data, in particular for imports, are
not fully comparable with the goods item in the
b.o.p. statistics (Sections 7.1 and 7.2). Part of the
difference arises from the inclusion of insurance
and freight services in the recording of imported
goods in external trade data.
Industrial import prices and industrial producer
export prices (or industrial output prices for
the non-domestic market) shown in Table 2
in Section 7.5 were introduced by Regulation
(EC) No 1158/2005 of the European Parliament
and of the Council of 6 July 2005 amending
Council Regulation (EC) No 1165/98, which is
the principal legal basis for short-term statistics.
The industrial import price index covers
industrial products imported from outside the
euro area under sections B to E of the Statistical
Classifi cation of Products by Activity in the
European Economic Community (CPA) and all
institutional import sectors except households,
governments and non-profi t institutions. It
refl ects the cost, insurance and freight price
excluding import duties and taxes, and refers to
actual transactions in euro recorded at the point
when ownership of the goods is transferred.
The industrial producer export prices cover all
industrial products exported directly by euro
area producers to the extra-euro area market
under sections B to E of NACE Revision 2.
Exports from wholesalers and re-exports are
not covered. The indices refl ect the free on
board price expressed in euro and calculated
at the euro area frontier, including any indirect
taxes except VAT and other deductible taxes.
Industrial import prices and industrial producer
export prices are available by Main Industrial
Grouping as defi ned by Commission Regulation
(EC) No 656/2007 of 14 June 2007. For more
details, see Box 11 in the December 2008 issue
of the Monthly Bulletin.
EXCHANGE RATES
Section 8.1 shows nominal and real effective
exchange rate indices for the euro, which are
calculated by the ECB on the basis of weighted
averages of the euro’s bilateral exchange rates
of the euro against the currencies of the selected
trading partners of the euro area. A positive
change denotes an appreciation of the euro.
Weights are based on trade in manufactured
goods with those trading partners in the
periods 1995-1997, 1998-2000, 2001-2003
and 2004-2006, and are calculated to account
for third-market effects. The EER indices are
obtained by chain-linking the indicators based
on each of these four sets of trade weights at the
end of each three-year period. The base period
of the resulting EER index is the fi rst quarter
of 1999. The EER-21 group of trading partners
is composed of the 11 non-euro area EU
Member States plus Australia, Canada, China,
Hong Kong, Japan, Norway, Singapore, South
Korea, Switzerland and the United States. The
EER-41 group comprises the EER-21 plus the
following countries: Algeria, Argentina, Brazil,
Chile, Croatia, Iceland, India, Indonesia, Israel,
Malaysia, Mexico, Morocco, New Zealand,
the Philippines, Russia, South Africa, Taiwan,
Thailand, Turkey and Venezuela. Real EERs
are calculated using consumer price indices,
producer price indices, gross domestic product
defl ators and unit labour costs, both for the
manufacturing sector and for the total economy.
For more detailed information on the calculation
of the EERs, see Box 5, entitled “International
trade developments and revision of the effective

ECB
Monthly Bulletin
January 2010S 94
exchange rates of the euro”, in this issue of the
Monthly Bulletin, the relevant methodological
note and ECB Occasional Paper No 2 (“The
effective exchange rates of the euro” by Luca
Buldorini, Stelios Makrydakis and Christian
Thimann, February 2002), which can be
downloaded from the ECB’s website.
The bilateral rates shown in Section 8.2 are
monthly averages of those published daily as
reference rates for these currencies.
DEVELOPMENTS OUTSIDE THE EURO AREA
Statistics on other EU Member States
(Section 9.1) follow the same principles as data
relating to the euro area. The data for the United
States and Japan contained in Section 9.2 are
obtained from national sources.

ECB
Monthly Bulletin
January 2010
11 JANUARY AND 8 FEBRUARY 2007
The Governing Council of the ECB decides
that the minimum bid rate on the main
refi nancing operations and the interest rates on
the marginal lending facility and the deposit
facility will remain unchanged at 3.50%,
4.50% and 2.50% respectively.
8 MARCH 2007
The Governing Council of the ECB decides
to increase the minimum bid rate on the main
refi nancing operations by 25 basis points to
3.75%, starting from the operation to be settled
on 14 March 2007. In addition, it decides to
increase the interest rates on both the marginal
lending facility and the deposit facility by
25 basis points, to 4.75% and 2.75%, both with
effect from 14 March 2007.
12 APRIL AND 10 MAY 2007
The Governing Council of the ECB decides
that the minimum bid rate on the main
refi nancing operations and the interest rates on
the marginal lending facility and the deposit
facility will remain unchanged at 3.75%, 4.75%
and 2.75% respectively.
6 JUNE 2007
The Governing Council of the ECB decides
to increase the minimum bid rate on the main
refi nancing operations by 25 basis points to
4%, starting from the operation to be settled on
13 June 2007. In addition, it decides to increase
by 25 basis points the interest rates on both
the marginal lending facility and the deposit
facility, to 5% and 3% respectively, with effect
from 13 June 2007.
5 JULY, 2 AUGUST, 6 SEPTEMBER, 4 OCTOBER,
8 NOVEMBER AND 6 DECEMBER 2007, AND
10 JANUARY, 7 FEBRUARY, 6 MARCH, 10 APRIL,
8 MAY AND 5 JUNE 2008
The Governing Council of the ECB decides that
the minimum bid rate on the main refi nancing
operations and the interest rates on the marginal
lending facility and the deposit facility will
remain unchanged at 4.00%, 5.00% and 3.00%
respectively.
3 JULY 2008
The Governing Council of the ECB decides
to increase the minimum bid rate on the main
refi nancing operations by 25 basis points
to 4.25%, starting from the operation to be
settled on 9 July 2008. In addition, it decides
to increase by 25 basis points the interest
rates on both the marginal lending facility
and the deposit facility, to 5.25% and 3.25%
respectively, with effect from 9 July 2008.
7 AUGUST, 4 SEPTEMBER AND
2 OCTOBER 2008
The Governing Council of the ECB decides that
the minimum bid rate on the main refi nancing
operations and the interest rates on the marginal
lending facility and the deposit facility will
remain unchanged at 4.25%, 5.25% and 3.25%
respectively.
8 OCTOBER 2008
The Governing Council of the ECB decides
to decrease the minimum bid rate on the main
refi nancing operations by 50 basis points to
3.75%, starting from the operations to be settled
on 15 October 2008. In addition, it decides to
decrease by 50 basis points the interest rates on
I
ANNEXES
CHRONOLOGY OF MONETARY POLICY MEASURES OF THE EUROSYSTEM1
The chronology of monetary policy measures taken by the 1
Eurosystem between 1999 and 2006 can be found in the ECB’s
Annual Report for the respective years.

ECB
Monthly Bulletin
January 2010II
both the marginal lending facility and the deposit
facility, to 4.75% and 2.75% respectively, with
immediate effect. Moreover, the Governing
Council decides that, as from the operation settled
on 15 October, the weekly main refi nancing
operations will be carried out through a fi xed-
rate tender procedure with full allotment at the
interest rate on the main refi nancing operation.
Furthermore, as of 9 October, the ECB will
reduce the corridor of standing facilities from
200 basis points to 100 basis points around the
interest rate on the main refi nancing operation.
The two measures will remain in place for as
long as needed, and at least until the end of the
fi rst maintenance period of 2009, on 20 January.
15 OCTOBER 2008
The Governing Council of the ECB decides to
further expand the collateral framework and
enhance the provision of liquidity. To do so, the
Governing Council decides: (i) to expand the
list of assets eligible as collateral in Eurosystem
credit operations, with this expansion remaining
in force until the end of 2009, (ii) to enhance
the provision of longer-term refi nancing, with
effect from 30 October 2008 and until the end of
the fi rst quarter of 2009, and (iii) to provide US
dollar liquidity through foreign exchange swaps.
6 NOVEMBER 2008
The Governing Council of the ECB decides
to decrease the interest rate on the main
refi nancing operations by 50 basis points to
3.25%, starting from the operations to be settled
on 12 November 2008. In addition, it decides to
decrease by 50 basis points the interest rates on
both the marginal lending facility and the deposit
facility, to 3.75% and 2.75% respectively, with
effect from 12 November 2008.
4 DECEMBER 2008
The Governing Council of the ECB decides to
decrease the interest rate on the main refi nancing
operations of the Eurosystem by 75 basis points
to 2.50%, starting from the operations to be
settled on 10 December 2008. In addition,
it decides to decrease by 75 basis points the
interest rates on both the marginal lending
and the deposit facility to 3.00% and 2.00%
respectively, with effect from 10 December
2008.
18 DECEMBER 2008
The Governing Council of the ECB decides
that the main refi nancing operations will
continue to be carried out through a fi xed rate
tender procedure with full allotment beyond the
maintenance period ending on 20 January 2009.
This measure will be in place for as long as
needed, and at least until the last allotment of the
third maintenance period in 2009 on 31 March.
Moreover, as of 21 January 2009, the corridor of
standing facility rates, which on 9 October 2008
was reduced to 100 basis points around the
prevailing interest rate of the main refi nancing
operation, will be be re-widened symmetrically
to 200 basis points.
15 JANUARY 2009
The Governing Council of the ECB decides
to decrease the interest rate on the main
refi nancing operations by 50 basis points to
2.00%, starting from the operations to be settled
on 21 January 2009. In addition, it decides that
the interest rates on the marginal lending and
the deposit facility will be 3.00% and 1.00%
respectively, with effect from 21 January 2009,
in line with the decision of 18 December 2008.
5 FEBRUARY 2009
The Governing Council of the ECB decides
that the interest rate on the main refi nancing
operations and the interest rates on the marginal
lending facility and the deposit facility will
remain unchanged at 2.00%, 3.00% and 1.00%
respectively.

ECB
Monthly Bulletin
January 2010
CHRONOLOGY
III
5 MARCH 2009
The Governing Council of the ECB decides
to decrease the interest rate on the main
refi nancing operations by 50 basis points to
1.50%, starting from the operations to be settled
on 11 March 2009. In addition, it decides that
the interest rates on the marginal lending and
the deposit facility will be 2.50% and 0.50%
respectively, with effect from 11 March 2009.
Moreover, the Governing Council decides
to continue the fi xed rate tender procedure
with full allotment for all main refi nancing
operations, special-term refi nancing operations
and supplementary and regular longer-term
refi nancing operations for as long as needed,
and in any case beyond the end of 2009. In
addition, the Governing Council decides
to continue with the current frequency and
maturity profi le of supplementary longer-
term refi nancing operations and special-term
refi nancing operations for as long as needed,
and in any case beyond the end of 2009.
2 APRIL 2009
The Governing Council of the ECB decides
to decrease the interest rate on the main
refi nancing operations by 25 basis points to
1.25%, starting from the operations to be settled
on 8 April 2009. In addition, it decides that
the interest rates on the marginal lending and
the deposit facility will be 2.25% and 0.25%
respectively, with effect from 8 April 2009.
7 MAY 2009
The Governing Council of the ECB decides to
decrease the interest rate on the main refi nancing
operations by 25 basis points to 1.00%, starting
from the operation to be settled on 13 May
2009. In addition, it decides to decrease the
interest rate on the marginal lending facility
by 50 basis points to 1.75% with effect from
13 May 2009, and to leave the interest rate
on the deposit facility unchanged at 0.25%.
In addition, the Governing Council of the ECB
decides to proceed with its enhanced credit
support approach. In particular, it decides that
the Eurosystem will conduct liquidity-providing
longer-term refi nancing operations with a
maturity of one year as fi xed rate tender
procedure with full allotment. In addition, it
decides in principle that the Eurosystem will
purchase euro-denominated covered bonds
issued in the euro area.
4 JUNE 2009
The Governing Council of the ECB decides
that the interest rate on the main refi nancing
operations and the interest rates on the marginal
lending facility and the deposit facility will
remain unchanged at 1.00%, 1.75% and 0.25%
respectively. In addition, the Governing Council
of the ECB decides upon the technical modalities
related to the purchase of euro-denominated
covered bonds issued in the euro area decided
on 7 May 2009.
2 JULY, 6 AUGUST, 3 SEPTEMBER, 8 OCTOBER,
5 NOVEMBER AND 3 DECEMBER 2009,
AND 14 JANUARY 2010
The Governing Council of the ECB decides
that the interest rate on the main refi nancing
operations and the interest rates on the marginal
lending facility and the deposit facility will
remain unchanged at 1.00%, 1.75% and 0.25%
respectively.


ECB
Monthly Bulletin
January 2010 V
DOCUMENTS PUBLISHED BY THE EUROPEAN CENTRAL BANK SINCE 2009
This list is designed to inform readers about selected documents published by the European Central
Bank since January 2009. For Working Papers, which as of January 2009 (from Working Paper
No 989 onwards) are available online only, the list only refers to publications released between
October and December 2009. Unless otherwise indicated, hard copies can be obtained or subscribed
to free of charge, stock permitting, by contacting [email protected].
For a complete list of documents published by the European Central Bank and by the European
Monetary Institute, please visit the ECB’s website (http://www.ecb.europa.eu).
ANNUAL REPORT
“Annual Report 2008”, April 2009.
MONTHLY BULLETIN ARTICLES
“Housing wealth and private consumption in the euro area”, January 2009.
“Foreign asset accumulation by authorities in emerging markets”, January 2009.
“New survey evidence on wage setting in Europe”, February 2009.
“Assessing global trends in protectionism”, February 2009.
“The external fi nancing of households and non-fi nancial corporations: a comparison of the euro
area and the United States”, April 2009.
“Revisions to GDP estimates in the euro area”, April 2009.
“The functional composition of government spending in the European Union”, April 2009.
“Expectations and the conduct of monetary policy”, May 2009.
“Five years of EU membership”, May 2009.
“Credit rating agencies: developments and policy issues”, May 2009.
“The impact of government support to the banking sector on euro area public fi nances”, July 2009.
“The implementation of monetary policy since August 2007”, July 2009.
“Rotation of voting rights in the Governing Council of the ECB”, July 2009.
“Housing fi nance in the euro area”, August 2009.
“Recent developments in the retail bank interest rate pass-through in the euro area”, August 2009.
“Monetary policy and loan supply in the euro area”, October 2009.
“Recent developments in the balance sheets of the Eurosystem, the Federal Reserve System and
the Bank of Japan”, October 2009.
“Financial development in emerging economies – stock-taking and policy implications”,
October 2009.
“Central bank communication in periods of heightened uncertainty”, November 2009.
“Monetary analysis in an environment of fi nancial turmoil”, November 2009.
“The latest euro area recession in a historical context”, November 2009.
“The ECB’s monetary policy stance during the fi nancial crisis”, January 2010.
“The ECB’s relations with European Union institutions and bodies: trends and prospects”,
January 2010.
“Entitlements of households under government pension schemes in the euro area – results on the
basis of the new system of national accounts”, January 2010.
STATISTICS POCKET BOOK
Available monthly since August 2003.

ECB
Monthly Bulletin
January 2010VI
LEGAL WORKING PAPER SERIES
8 “National rescue measures in response to the current fi nancial crisis” by A. Petrovic and
R. Tutsch, July 2009.
9 “The legal duty to consult the European Central Bank – national and EU consultations”
by S. E. Lambrinoc, November 2009.
10 “Withdrawal and expulsion from the EU and EMU: some refl ections” by P. Athanassiou,
December 2009.
OCCASIONAL PAPER SERIES
100 “Survey data on household fi nance and consumption: research summary and policy use” by the
Eurosystem Household Finance and Consumption Network, January 2009.
101 “Housing fi nance in the euro area” by the Task Force of the Monetary Policy Committee of
the European System of Central Banks, March 2009.
102 “Domestic fi nancial development in emerging economies: evidence and implications”
by E. Dorrucci, A. Meyer-Cirkel and D. Santabárbara, April 2009.
103 “Transnational governance in global fi nance: the principles for stable capital fl ows and fair
debt restructuring in emerging markets” by R. Ritter, April 2009.
104 “Fiscal policy challenges in oil-exporting countries: a review of key issues” by M. Sturm,
F. Gurtner and J. González Alegre, June 2009.
105 “Flow-of-funds analysis at the ECB – framework and applications” by L. Bê Duc
and G. Le Breton, August 2009.
106 “Monetary policy strategy in a global environment” by P. Moutot and G. Vitale,
August 2009.
107 “The collateral frameworks of the Eurosystem, the Federal Reserve System and the Bank
of England and the fi nancial market turmoil” by S. Cheun, I. von Köppen-Mertes and
B. Weller, December 2009.
RESEARCH BULLETIN
“Research Bulletin”, No 8, March 2009.
WORKING PAPER SERIES
1097 “Monetary and fi scal policy aspects of indirect tax changes in a monetary union”
by A. Lipińska and L. von Thadden, October 2009.
1098 “Gauging the effectiveness of quantitative forward guidance: evidence from three infl ation
targeters” by M. Andersson and B. Hofmann, October 2009.
1099 “Public and private sector wages interactions in a general equilibrium model”
by G. Fernández de Córdoba, J. J. Pérez and J. L. Torres, October 2009.
1100 “Weak and strong cross section dependence and estimation of large panels” by A. Chudik,
M. Hashem Pesaran and E. Tosetti, October 2009.
1101 “Fiscal variables and bond spreads – evidence from eastern European countries and Turkey”
by C. Nickel, P. C. Rother and J. C. Rülke, October 2009.
1102 “Wage-setting behaviour in France: additional evidence from an ad hoc survey”
by J. Montornés and J.-B. Sauner-Leroy, October 2009.
1103 “Inter-industry wage differentials: how much does rent sharing matter?” by P. Du Caju,
F. Rycx and I. Tojerow, October 2009.

ECB
Monthly Bulletin
January 2010
DOCUMENTSPUBLISHED
VII
1104 “Pass-through of external shocks along the pricing chain: a panel estimation approach for
the euro area” by B. Landau and F. Skudelny, November 2009.
1105 “Downward nominal and real wage rigidity: survey evidence from European fi rms”
by J. Babecký, P. Du Caju, T. Kosma, M. Lawless, J. Messina and T. Rõõm,
November 2009.
1106 “The margins of labour cost adjustment: survey evidence from European fi rms”
by J. Babecký, P. Du Caju, T. Kosma, M. Lawless, J. Messina and T. Rõõm,
November 2009.
1107 “Interbank lending, credit risk premia and collateral” by F. Heider and M. Hoerova,
November 2009.
1108 “The role of fi nancial variables in predicting economic activity” by R. Espinoza, F. Fornari
and M. J. Lombardi, November 2009.
1109 “What triggers prolonged infl ation regimes? A historical analysis” by I. Vansteenkiste,
November 2009.
1110 “Putting the New Keynesian DSGE model to the real-time forecasting test” by M. Kolasa,
M. Rubaszek and P. Skrzypczyński, November 2009.
1111 “A stable model for euro area money demand: revisiting the role of wealth” by A. Beyer,
November 2009.
1112 “Risk spillover among hedge funds: the role of redemptions and fund failures” by B. Klaus
and B. Rzepkowski, November 2009.
1113 “Volatility spillovers and contagion from mature to emerging stock markets” by J. Beirne,
G. M. Caporale, M. Schulze-Ghattas and N. Spagnolo, November 2009.
1114 “Explaining government revenue windfalls and shortfalls: an analysis for selected
EU countries” by R. Morris, C. Rodrigues Braz, F. de Castro, S. Jonk, J. Kremer,
S. Linehan, M. Rosaria Marino, C. Schalck and O. Tkacevs.
1115 “Estimation and forecasting in large datasets with conditionally heteroskedastic dynamic
common factors” by L. Alessi, M. Barigozzi and M. Capasso, November 2009.
1116 “Sectorial border effects in the European Single Market: an explanation through industrial
concentration” by G. Cafi so, November 2009.
1117 “What drives personal consumption? The role of housing and fi nancial wealth”
by J. Slacalek, November 2009.
1118 “Discretionary fi scal policies over the cycle: new evidence based on the ESCB
disaggregated approach” by L. Agnello and J. Cimadomo, November 2009.
1119 “Nonparametric hybrid Phillips curves based on subjective expectations: estimates for the
euro area” by M. Buchmann, December 2009.
1120 “Exchange rate pass-through in central and eastern European Member States” by J. Beirne
and M. Bijsterbosch, December 2009.
1121 “Does fi nance bolster superstar companies? Banks, venture capital and fi rm size in local
US markets” by A. Popov, December 2009.
1122 “Monetary policy shocks and portfolio choice” by M. Fratzscher, C. Saborowski and
R. Straub, December 2009.
1123 “Monetary policy and the fi nancing of fi rms” by F. De Fiore, P. Teles and O. Tristani,
December 2009.
1124 “Balance sheet interlinkages and macro-fi nancial risk analysis in the euro area”
by O. Castrén and I. K. Kavonius, December 2009.
1125 “Leading indicators in a globalised world” by F. Fichtner, R. Rüffer and B. Schnatz,
December 2009.
1126 “Liquidity hoarding and interbank market spreads: the role of counterparty risk”
by F. Heider, M. Hoerova and C. Holthausen, December 2009.

ECB
Monthly Bulletin
January 2010
1127 “The Janus-headed salvation: sovereign and bank credit risk premia during 2008-09”
by J. W. Ejsing and W. Lemke, December 2009.
1128 “EMU and the adjustment to asymmetric shocks: the case of Italy” by G. Amisano,
N. Giammarioli and L. Stracca, December 2009.
1129 “Determinants of infl ation and price level differentials across the euro area countries”
by M. Andersson, K. Masuch and M. Schiffbauer, December 2009.
1130 “Monetary policy and potential output uncertainty: a quantitative assessment”
by S. Delle Chiaie, December 2009.
1131 “What explains the surge in euro area sovereign spreads during the fi nancial crisis of
2007-09?” by M.-G. Attinasi, C. Checherita and C. Nickel, December 2009.
1132 “A quarterly fi scal database for the euro area based on intra-annual fi scal information”
by J. Paredes, D. J. Pedregal and J. J. Pérez, December 2009.
1133 “Fiscal policy shocks in the euro area and the United States: an empirical assessment”
by P. Burriel, F. de Castro, D. Garrote, E. Gordo, J. Paredes and J. J. Pérez, December 2009.
1134 “Would the Bundesbank have prevented the great infl ation in the United States?”
by L. Benati, December 2009.
1135 “Return to retail banking and payments” by I. Hasan, H. Schmiedel and L. Song,
December 2009.
1136 “Payment scale economies, competition and pricing” by D. B. Humphrey, December 2009.
1137 “Regulating two-sided markets: an empirical investigation” by S. Carbó Valverde,
S. Chakravorti, F. Rodríguez Fernández, December 2009.
1138 “Credit card interchange fees” by J.-C. Rochet and J. Wright, December 2009.
1139 “Pricing payment cards” by O. Bedre and E. Calvano, December 2009.
1140 “SEPA, effi ciency and payment card competition” by W. Bolt and H. Schmiedel,
December 2009.
1141 “How effective are rewards programmes in promoting payment card usage? Empirical
evidence” by S. Carbó Valverde and J. M. Liñares-Zegarra, December 2009.
1142 “Credit card use after the fi nal mortgage payment: does the magnitude of income shocks
matter?” by B. Scholnick, December 2009.
1143 “What drives the network’s growth? An agent-based study of the payment card market”
by B. Alexandrova-Kabadjova and J. Luis Negrín, December 2009.
1144 “Choosing and using payment instruments: evidence from German microdata”
by U. von Kalckreuth, T. Schmidt and H. Stix, December 2009.
OTHER PUBLICATIONS
“Letter from the ECB President to Mr Robert Sturdy, Member of the European Parliament”,
January 2009 (online only).
“Euro money market study 2008”, February 2009 (online only).
“Eurosystem oversight policy framework”, February 2009 (online only).
“Harmonised oversight approach and oversight standards for payment instruments”, February 2009
(online only).
“European Commission’s consultation on hedge funds – Eurosystem contribution”, February 2009
(online only).
“Guiding principles for bank asset support schemes”, March 2009 (online only).
“Letter from the ECB President to Mr José Ribeiro e Castro, Member of the European
Parliament”, March 2009 (online only).
“Letter from the ECB President to Mr Dimitrios Papadimoulis, Member of the European
Parliament”, March 2009 (online only).
VIII

ECB
Monthly Bulletin
January 2010
DOCUMENTSPUBLISHED
IX
“Letter from the ECB President to Mr Manolis Mavrommatis, Member of the European
Parliament, regarding the issuance of low denomination euro banknotes”, March 2009
(online only).
“Letter from the ECB President to Mr Eoin Ryan, Member of the European Parliament, concerning
the recent widening of spreads between euro area government bond yields”, March 2009
(online only).
“Eurosystem’s SEPA expectations”, March 2009 (online only).
“Housing fi nance in the euro area”, March 2009 (online only).
“Euro area monetary and fi nancial statistics: 2008 quality report”, March 2009 (online only).
“Euro area balance of payments and international investment position statistics: 2008 quality
report”, March 2009 (online only).
“Manual on investment fund statistics”, May 2009 (online only).
“EU banks’ funding structures and policies”, May 2009 (online only).
“Letter from the ECB President to Mr Ashley Mote, Member of the European Parliament”,
May 2009 (online only).
“TARGET2 oversight assessment report”, May 2009 (online only).
“TARGET Annual Report”, May 2009 (online only).
“The ECB’s advisory role – overview of opinions (1994-2008)”, May 2009.
“Financial Stability Review”, June 2009.
“Recommendations for securities settlement systems and recommendations for central
counterparties in the European Union – European Central Bank (ECB) and the Committee of
European Securities Regulators (CESR)”, June 2009 (online only).
“The international role of the euro”, July 2009.
“Monthly report on the Eurosystem’s covered bond purchase programme – July 2009”, August
2009 (online only).
“Oversight framework for direct debit schemes”, August 2009 (online only).
“Oversight framework for credit transfer schemes”, August 2009 (online only).
“The Eurosystem’s stance on the Commission’s consultation document on the review of Directive
94/19/EC on deposit-guarantee schemes”, August 2009 (online only).
“Legal framework of the Eurosystem and the European System of Central Banks. ECB legal acts
and instruments. 2009 update”, August 2009.
“EU banking sector stability”, August 2009 (online only).
“Credit default swaps and counterparty risk”, August 2009 (online only).
“OTC derivatives and post-trading infrastructures”, September 2009 (online only).
“Monthly report on the Eurosystem’s covered bond purchase programme – August 2009”,
September 2009 (online only).
“Consultation of the European Commission on ‘Possible initiatives to enhance the resilience of
OTC derivatives markets’: Eurosystem contribution”, September 2009 (online only).
“ECB survey on access to fi nance for small and medium-sized enterprises in the euro area”,
September 2009 (online only).
“The euro at ten – lessons and challenges”, Fifth ECB Central Banking Conference volume,
September 2009.
“Euro money market survey”, September 2009 (online only).
“Monthly report on the Eurosystem’s covered bond purchase programme – September 2009”,
October 2009 (online only).
“Letter from the ECB President to Mr Jim Higgins, Member of the European Parliament,
concerning consumer protection and banking practices in Spain”, October 2009 (online only).
“Letter from the ECB President to Mr Jim Higgins, Member of the European Parliament,
concerning the ECB’s considerations on issuing a €30 banknote”, October 2009 (online only).

ECB
Monthly Bulletin
January 2010
“Monthly report on the Eurosystem’s covered bond purchase programme – October 2009”,
November 2009 (online only).
“Consultation of the Committee of European Securities Regulators on trade repositories in the
European Union – ECB contribution”, November 2009 (online only).
“Eurosystem oversight report 2009”, November 2009 (online only).
“Glossary of terms related to payment clearing and settlement systems”, December 2009
(online only).
“Monthly report on the Eurosystem’s covered bond purchase programme – November 2009”,
December 2009 (online only).
“New procedure for constructing Eurosystem and ECB staff projection ranges”, December 2009
(online only).
“Financial Stability Review”, December 2009.
“Retail payments – integration and innovation”, December 2009 (online only).
INFORMATION BROCHURES
“The European Central Bank, the Eurosystem, the European System of Central Banks”,
April 2009.
“Price stability – why is it important for you?”, April 2009.
“The Single Euro Payments Area (SEPA): an integrated retail payments market”, July 2009.
X

ECB
Monthly Bulletin
January 2010 XI
GLOSSARY
This glossary contains selected items that are frequently used in the Monthly Bulletin. A more
comprehensive and detailed glossary can be found on the ECB’s website (www.ecb.europa.eu/
home/glossary/html/index.en.html).
Autonomous liquidity factors: liquidity factors that do not normally stem from the use of monetary
policy instruments. Such factors are, for example, banknotes in circulation, government deposits
with the central bank and the net foreign assets of the central bank.
Balance of payments (b.o.p.): a statistical statement that summarises, for a specifi c period of
time, the economic transactions of an economy with the rest of the world.
Bank lending survey (BLS): a quarterly survey on lending policies that has been conducted by
the Eurosystem since January 2003. It addresses qualitative questions on developments in credit
standards, terms and conditions of loans and loan demand for both enterprises and households to a
predefi ned sample group of banks in the euro area.
Borrowing requirement (general government): net incurrence of debt by the general government.
Break-even inflation rate: the spread between the yield on a nominal bond and that on an infl ation-
linked bond of the same (or as similar as possible) maturity.
Capital account: a b.o.p. account that covers all capital transfers and acquisitions/disposals of
non-produced, non-fi nancial assets between residents and non-residents.
Capital accounts: part of the system of national (or euro area) accounts consisting of the change in
net worth that is due to net saving, net capital transfers and net acquisitions of non-fi nancial assets.
Central parity (or central rate): the exchange rate of each ERM II member currency vis-à-vis the
euro, around which the ERM II fl uctuation margins are defi ned.
Compensation per employee or per hour worked: the total remuneration, in cash or in kind, that
is payable by employers to employees, i.e. gross wages and salaries, as well as bonuses, overtime
payments and employers’ social security contributions, divided by the total number of employees
or by the total number of employees’ hours worked.
Consolidated balance sheet of the MFI sector: a balance sheet obtained by netting out inter-
MFI positions (e.g. inter-MFI loans and deposits) in the aggregated MFI balance sheet. It provides
statistical information on the MFI sector’s assets and liabilities vis-à-vis residents of the euro area
not belonging to this sector (i.e. the general government and other euro area residents) and vis-à-vis
non-euro area residents. It is the main statistical source for the calculation of monetary aggregates,
and it provides the basis for the regular analysis of the counterparts of M3.
Current account: a b.o.p. account that covers all transactions in goods and services, income and
current transfers between residents and non-residents.
Debt (financial accounts): loans taken out by households, as well as the loans, deposit liabilities,
debt securities and pension fund reserves (resulting from employers’ direct pension commitments
on behalf of their employees) of non-fi nancial corporations, valued at market prices at the end of
the period.

ECB
Monthly Bulletin
January 2010XII
Debt (general government): the gross debt (currency and deposits, loans and debt securities)
at nominal value outstanding at the end of the year and consolidated between and within the sectors
of general government.
Debt security: a promise on the part of the issuer (i.e. the borrower) to make one or more
payment(s) to the holder (the lender) on a specifi ed future date or dates. Such securities usually
carry a specifi c rate of interest (the coupon) and/or are sold at a discount to the amount that will
be repaid at maturity. Debt securities issued with an original maturity of more than one year are
classifi ed as long-term.
Debt-to-GDP ratio (general government): the ratio of general government debt to GDP at
current market prices. It is the subject of one of the fi scal criteria laid down in Article 126(2) of the
Treaty on the Functioning of the European Union to defi ne the existence of an excessive defi cit.
Deficit (general government): the general government’s net borrowing, i.e. the difference between
total government revenue and total government expenditure.
Deficit-debt adjustment (general government): the difference between the general government
defi cit and the change in general government debt.
Deficit ratio (general government): the ratio of the general government defi cit to GDP at current
market prices. It is the subject of one of the fi scal criteria laid down in Article 126(2) of the Treaty
on the Functioning of the European Union to defi ne the existence of an excessive defi cit. It is also
referred to as the budget defi cit ratio or the fi scal defi cit ratio.
Deflation: a generalised, persistent and self-reinforcing decline in a broad set of prices that results
from a drop in aggregate demand and becomes entrenched in expectations.
Deposit facility: a standing facility of the Eurosystem which counterparties may use to make
overnight deposits, remunerated at a pre-specifi ed interest rate, at an NCB.
Disinflation: a process of decelerating infl ation that may lead to negative infl ation rates of
a temporary nature.
Direct investment: cross-border investment for the purpose of obtaining a lasting interest in an
enterprise resident in another economy (assumed, in practice, for ownership of at least 10% of the
ordinary shares or voting power). Included are equity capital, reinvested earnings and other capital
associated with inter-company operations. The direct investment account records net transactions/
positions in assets abroad by euro area residents (as “direct investment abroad”) and net transactions/
positions in euro area assets by non-residents (as “direct investment in the euro area”).
Effective exchange rates (EERs) of the euro (nominal/real): weighted averages of bilateral
euro exchange rates against the currencies of the euro area’s main trading partners. The EER indices
of the euro are calculated against two groups of trading partners: the EER-21 (comprising the
11 non-euro area EU Member States and 10 trading partners outside the EU) and the EER-41
(composed of the EER-21 and 20 additional countries). The weights used refl ect the share of each
partner country in the euro area’s trade in manufactured goods and account for competition in
third markets. Real EERs are nominal EERs defl ated by a weighted average of foreign, relative to
domestic, prices or costs. They are thus measures of price and cost competitiveness.

ECB
Monthly Bulletin
January 2010
GLOSSARY
XIII
Enhanced credit support: the non-standard measures taken by the ECB/Eurosystem during the
fi nancial crisis with a view to supporting fi nancing conditions and credit fl ows above and beyond
what could be achieved through reductions in key ECB interest rates alone.
EONIA (euro overnight index average): a measure of the effective interest rate prevailing in the
euro interbank overnight market. It is calculated as a weighted average of the interest rates on unsecured
overnight lending transactions denominated in euro, as reported by a panel of contributing banks.
Equities: securities representing ownership of a stake in a corporation. They comprise shares traded
on stock exchanges (quoted shares), unquoted shares and other forms of equity. Equities usually
produce income in the form of dividends.
ERM II (exchange rate mechanism II): the exchange rate arrangement that provides the
framework for exchange rate policy cooperation between the euro area countries and the
EU Member States not participating in Stage Three of EMU.
EURIBOR (euro interbank offered rate): the rate at which a prime bank is willing to lend funds
in euro to another prime bank, computed daily for interbank deposits with different maturities of up
to 12 months.
Euro area: the area formed by those EU Member States in which the euro has been adopted as the
single currency in accordance with the Treaty on the Functioning of the European Union.
European Commission surveys: harmonised surveys of business and/or consumer sentiment
conducted on behalf of the European Commission in each of the EU Member States. Such
questionnaire-based surveys are addressed to managers in the manufacturing, construction, retail
and services industries, as well as to consumers. From each monthly survey, composite indicators
are calculated that summarise the replies to a number of different questions in a single indicator
(confi dence indicators).
Eurosystem: the central banking system made up of the ECB and the NCBs of those EU Member
States that have already adopted the euro.
Eurozone Purchasing Managers’ Surveys: surveys of business conditions in manufacturing and
in services industries conducted for a number of countries in the euro area and used to compile
indices. The Eurozone Manufacturing Purchasing Managers’ Index (PMI) is a weighted indicator
calculated from indices of output, new orders, employment, suppliers’ delivery times and stocks
of purchases. The services sector survey asks questions on business activity, expectations of future
business activity, the amount of business outstanding, incoming new business, employment, input
prices and prices charged. The Eurozone Composite Index is calculated by combining the results
from the manufacturing and services sector surveys.
External trade in goods: exports and imports of goods with countries outside the euro area,
measured in terms of value and as indices of volume and unit value. External trade statistics are
not comparable with the exports and imports recorded in the national accounts, as the latter include
both intra-euro area and extra-euro area transactions, and also combine goods and services. Nor are
they fully comparable with the goods item in b.o.p. statistics. Besides methodological adjustments,
the main difference is that imports in external trade statistics are recorded including insurance and
freight services, whereas they are recorded free on board in the goods item in the b.o.p. statistics.

ECB
Monthly Bulletin
January 2010
Financial account: a b.o.p. account that covers transactions between residents and non-residents in
direct investment, portfolio investment, other investment, fi nancial derivatives and reserve assets.
Financial accounts: part of the system of national (or euro area) accounts showing the fi nancial
positions (stocks or balance sheets), fi nancial transactions and other changes of the different
institutional sectors of an economy by type of fi nancial asset.
Fixed rate tender: a tender procedure in which the interest rate is specifi ed in advance by the
central bank and in which participating counterparties bid the amount of money they wish to
transact at the fi xed interest rate.
Fixed rate full-allotment tender procedure: a tender procedure in which the interest rate is
specifi ed by the central bank and in which counterparties bid the amount of money they want to
transact at that rate, knowing in advance that all their bids will be satisfi ed.
General government: a sector defi ned in the ESA 95 as comprising resident entities that are
engaged primarily in the production of non-market goods and services intended for individual and
collective consumption and/or in the redistribution of national income and wealth. Included are
central, regional and local government authorities as well as social security funds. Excluded are
government-owned entities that conduct commercial operations, such as public enterprises.
Gross domestic product (GDP): the value of an economy’s total output of goods and services less
intermediate consumption, plus net taxes on products and imports. GDP can be broken down by
output, expenditure or income components. The main expenditure aggregates that make up GDP are
household fi nal consumption, government fi nal consumption, gross fi xed capital formation, changes
in inventories, and imports and exports of goods and services (including intra-euro area trade).
Harmonised Index of Consumer Prices (HICP): a measure of the development of consumer
prices that is compiled by Eurostat and harmonised for all EU Member States.
Hourly labour cost index: a measure of labour costs, including gross wages and salaries
(in cash and in kind, including bonuses) and other labour costs (employers’ social contributions
plus employment-related taxes paid by the employer minus subsidies received by the employer),
per hour actually worked (including overtime).
Implied volatility: the expected volatility (i.e. standard deviation) in the rates of change of the
price of an asset (e.g. a share or a bond). It can be derived from the asset’s price, maturity date and
exercise price of its options, as well as from a riskless rate of return, using an option pricing model
such as the Black-Scholes model.
Index of negotiated wages: a measure of the direct outcome of collective bargaining in terms of
basic pay (i.e. excluding bonuses) at the euro area level. It refers to the implied average change in
monthly wages and salaries.
Industrial producer prices: factory-gate prices (transportation costs are not included) of all
products sold by industry excluding construction on the domestic markets of the euro area countries,
excluding imports.
Industrial production: the gross value added created by industry at constant prices.
XIV
ECB
Monthly Bulletin
January 2010
GLOSSARY
XV
Inflation: an increase in the general price level, e.g. in the consumer price index.
Inflation-indexed government bonds: debt securities issued by the general government, the
coupon payments and principal of which are linked to a specifi c consumer price index.
International investment position (i.i.p.): the value and composition of an economy’s outstanding
net fi nancial claims on (or fi nancial liabilities to) the rest of the world.
International reserves: external assets readily available to and controlled by monetary authorities
for directly fi nancing or regulating the magnitude of payments imbalances through intervention
in exchange markets. The international reserves of the euro area comprise non-euro denominated
claims on non-euro area residents, gold, special drawing rights and the reserve positions in the IMF
which are held by the Eurosystem.
Investment funds (except money market funds): fi nancial institutions that pool capital raised
from the public and invest it in fi nancial and non-fi nancial assets. See also MFIs.
Job vacancies: a collective term covering newly created jobs, unoccupied jobs or jobs about to
become vacant in the near future, for which the employer has recently taken active steps to fi nd a
suitable candidate.
Key ECB interest rates: the interest rates, set by the Governing Council, which refl ect the
monetary policy stance of the ECB. They are the rates at the main refi nancing operations, on the
marginal lending facility and on the deposit facility.
Labour force: the sum total of persons in employment and the number of unemployed.
Labour productivity: the output that can be produced with a given input of labour. It can be
measured in several ways, but is commonly measured as GDP (volume) divided by either total
employment or total hours worked.
Longer-term refinancing operations: credit operations with a maturity of more than one week that
are executed by the Eurosystem in the form of reverse transactions. The regular monthly operations
are conducted with a maturity of three months. During the fi nancial market turmoil that started in
August 2007, supplementary operations with maturities ranging from one maintenance period to
one year were conducted, the frequency of which varied.
M1: a narrow monetary aggregate that comprises currency in circulation plus overnight deposits
held with MFIs and central government (e.g. at the post offi ce or treasury).
M2: an intermediate monetary aggregate that comprises M1 plus deposits redeemable at a period
of notice of up to and including three months (i.e. short-term savings deposits) and deposits with an
agreed maturity of up to and including two years (i.e. short-term time deposits) held with MFIs and
central government.
M3: a broad monetary aggregate that comprises M2 plus marketable instruments, in particular
repurchase agreements, money market fund shares and units, and debt securities with a maturity of
up to and including two years issued by MFIs.

ECB
Monthly Bulletin
January 2010XVI
Main refinancing operation: a regular open market operation executed by the Eurosystem in the
form of reverse transactions. Such operations are carried out through a weekly standard tender and
normally have a maturity of one week.
Marginal lending facility: a standing facility of the Eurosystem which counterparties may use to
receive overnight credit from an NCB at a pre-specifi ed interest rate against eligible assets.
MFI credit to euro area residents: MFI loans granted to non-MFI euro area residents (including
general government and the private sector) and MFI holdings of securities (shares, other equity and
debt securities) issued by non-MFI euro area residents.
MFI interest rates: the interest rates that are applied by resident credit institutions and other MFIs,
excluding central banks and money market funds, to euro-denominated deposits and loans vis-à-vis
households and non-fi nancial corporations resident in the euro area.
MFI longer-term financial liabilities: deposits with an agreed maturity of over two years,
deposits redeemable at a period of notice of over three months, debt securities issued by euro area
MFIs with an original maturity of more than two years and the capital and reserves of the euro area
MFI sector.
MFI net external assets: the external assets of the euro area MFI sector (such as gold, foreign
currency banknotes and coins, securities issued by non-euro area residents and loans granted to
non-euro area residents) minus the external liabilities of the euro area MFI sector (such as non-euro
area residents’ deposits and repurchase agreements, as well as their holdings of money market fund
shares/units and debt securities issued by MFIs with a maturity of up to and including two years).
MFIs (monetary financial institutions): fi nancial institutions which together form the money-
issuing sector of the euro area. These include the Eurosystem, resident credit institutions (as defi ned
in Community law) and all other resident fi nancial institutions whose business is to receive deposits
and/or close substitutes for deposits from entities other than MFIs and, for their own account
(at least in economic terms), to grant credit and/or invest in securities. The latter group consists
predominantly of money market funds, i.e. funds that invest in short-term and low-risk instruments
usually with a maturity of one year or less.
Minimum bid rate: the lower limit to the interest rates at which counterparties may submit bids in
the variable tenders.
Other investment: an item in the b.o.p. and the i.i.p. that covers the fi nancial transactions/positions
with non-residents in trade credits, deposits and loans, and other accounts receivable and payable.
Portfolio investment: euro area residents’ net transactions and/or positions in securities issued
by non-residents of the euro area (“assets”) and non-residents’ net transactions and/or positions in
securities issued by euro area residents (“liabilities”). Included are equity securities and debt securities
(bonds and notes, and money market instruments). Transactions are recorded at the effective price
paid or received, less commissions and expenses. To be regarded as a portfolio asset, ownership in
an enterprise must be equivalent to less than 10% of the ordinary shares or voting power.
Price stability: the maintenance of price stability is the primary objective of the Eurosystem. The
Governing Council defi nes price stability as a year-on-year increase in the HICP for the euro area

ECB
Monthly Bulletin
January 2010
GLOSSARY
XVII
of below 2%. The Governing Council has also made it clear that, in the pursuit of price stability,
it aims to maintain infl ation rates below, but close to, 2% over the medium term.
Purchasing power parity (PPP): the rate at which one currency is converted into another so as
to equalise the purchasing power of the two currencies by eliminating the differences in the price
levels prevailing in the countries concerned. In their simplest form, PPPs show the ratio of the
prices in national currency of the same good or service in different countries.
Reference value for M3 growth: the annual growth rate of M3 over the medium term that is
consistent with the maintenance of price stability. At present, the reference value for annual M3
growth is 4½%.
Reserve requirement: the minimum amount of reserves a credit institution is required to hold
with the Eurosystem over a predefi ned maintenance period. Compliance with the requirement
is determined on the basis of the average of the daily balances in the reserve accounts over the
maintenance period.
Survey of Professional Forecasters (SPF): a quarterly survey that has been conducted by the
ECB since 1999 to collect macroeconomic forecasts on euro area infl ation, real GDP growth and
unemployment from a panel of experts affi liated to fi nancial and non-fi nancial organisations based
in the EU.
Unit labour costs: a measure of total labour costs per unit of output calculated for the euro area as
the ratio of total compensation per employee to labour productivity (defi ned as GDP (volume) per
person employed).
Variable rate tender: a tender procedure where the counterparties bid both the amount of money
they wish to transact with the central bank and the interest rate at which they wish to enter into the
transaction.
Volatility: the degree of fl uctuation in a given variable.
Write-down: a downward adjustment to the value of loans recorded in the balance sheets of MFIs
when it is recognised that the loans have become partly unrecoverable.
Write-off: the removal of the value of loans from the balance sheets of MFIs when the loans are
considered to be totally unrecoverable.
Yield curve: a graphical representation of the relationship between the interest rate or yield and the
residual maturity at a given point in time for suffi ciently homogenous debt securities with different
maturity dates. The slope of the yield curve can be measured as the difference between the interest
rates or yield at two selected maturities.