Embed Size (px)
Citation preview
EURO
PEAN
CEN
TRAL
BAN
K
MO
NTH
LY B
ULL
ETI
NEN
0812
009 0112009
02120090312009041200905120090612009071200908120090912009101200911120091212009
MONTHLY BULLET INAUGUST

MONTHLY BULLET IN
AUGUST 2009
In 2009 all ECB publications
feature a motif taken from the
€200 banknote.

© European Central Bank 2009
Address Kaiserstrasse 29
60311 Frankfurt am Main
Germany
Postal address Postfach 16 03 19
60066 Frankfurt am Main
Germany
Telephone +49 69 1344 0
Website http://www.ecb.europa.eu
Fax +49 69 1344 6000
This Bulletin was produced under the responsibility of the Executive Board of the ECB. Translations are prepared and published by the national central banks.
All rights reserved. Reproduction for educational and non-commercial purposes is permitted provided that the source is acknowledged.
The cut-off date for the statistics included in this issue was 5 August 2009.
ISSN 1561-0136 (print)
ISSN 1725-2822 (online)
3ECB
Monthly Bulletin
August 2009
CONTENTS
EDITORIAL 5
ECONOMIC AND MONETARY
DEVELOPMENTS
The external environment of the euro area 9
Monetary and fi nancial developments 14
Prices and costs 47
Output, demand and the labour market 57
Exchange rate and balance of payments
developments 70
Boxes:
Institutional differences between 1
mortgage markets in the euro area
and the United States 17
The results of the July 2009 bank 2
lending survey for the euro area 22
The impact of the fi rst one-year 3
longer-term refi nancing operation 34
Integrated euro area accounts 4
for the fi rst quarter of 2009 42
Results of the ECB Survey 5
of Professional Forecasters
for the third quarter of 2009 52
Uncertainty and the economic 6
prospects for the euro area 58
Seasonal adjustment of short-term 7
economic indicators for the euro area
in the current recession 63
ARTICLES
Housing fi nance in the euro area 77
Recent developments in the retail bank
interest rate pass-through in the euro area 93
EURO AREA STATISTICS S1
ANNEXES
Chronology of monetary policy
measures of the Eurosystem I
Documents published by the
European Central Bank since 2008 V
Glossary XI I I
4ECB
Monthly Bulletin
August 2009
ABBREVIATIONS
COUNTRIES LU Luxembourg
BE Belgium HU Hungary
BG Bulgaria MT Malta
CZ Czech Republic NL Netherlands
DK Denmark AT Austria
DE Germany PL Poland
EE Estonia PT Portugal
IE Ireland RO Romania
GR Greece SI Slovenia
ES Spain SK Slovakia
FR France FI Finland
IT Italy SE Sweden
CY Cyprus UK United Kingdom
LV Latvia JP Japan
LT Lithuania US United States
OTHERS
BIS Bank for International Settlements
b.o.p. balance of payments
BPM5 IMF Balance of Payments Manual (5th edition)
CD certifi cate of deposit
c.i.f. cost, insurance and freight at the importer’s border
CPI Consumer Price Index
ECB European Central Bank
EER effective exchange rate
EMI European Monetary Institute
EMU Economic and Monetary Union
ESA 95 European System of Accounts 1995
ESCB European System of Central Banks
EU European Union
EUR euro
f.o.b. free on board at the exporter’s border
GDP gross domestic product
HICP Harmonised Index of Consumer Prices
HWWI Hamburg Institute of International Economics
ILO International Labour Organization
IMF International Monetary Fund
MFI monetary fi nancial institution
NACE Rev. 1 Statistical classifi cation of economic activities in the European Community
NCB national central bank
OECD Organisation for Economic Co-operation and Development
PPI Producer Price Index
SITC Rev. 4 Standard International Trade Classifi cation (revision 4)
ULCM unit labour costs in manufacturing
ULCT unit labour costs in the total economy
In accordance with Community practice, the EU countries are listed in this Bulletin using the alphabetical order of the country names in the national languages.
5ECB
Monthly Bulletin
August 2009
EDITORIAL
On the basis of its regular economic and monetary
analyses, the Governing Council decided at
its meeting on 6 August to leave the key ECB
interest rates unchanged. The information and
analyses that have become available since the
Governing Council’s meeting on 2 July 2009
confi rm the view that the current rates remain
appropriate.
As anticipated, annual HICP infl ation in July
fell further into negative territory, refl ecting
mainly temporary effects. After a return to
positive infl ation rates during the second half
of the year, the Governing Council continues to
expect price developments to remain subdued
over the policy-relevant horizon. Recent data
releases and survey information still suggest
that economic activity over the remainder of this
year is likely to remain weak, although the pace
of contraction is clearly slowing down. This
assessment takes into account adverse lagged
effects, such as a further deterioration in labour
markets, which are likely to materialise over the
coming months. Looking ahead into next year,
after a phase of stabilisation, a gradual recovery
with positive quarterly growth rates is expected.
Available indicators of infl ation expectations
over the medium to longer term remain fi rmly
anchored in line with the Governing Council’s
aim of keeping infl ation rates below, but close
to, 2% over the medium term. The outcome of
the monetary analysis confi rms the assessment
of low infl ationary pressure, as money and credit
expansion continues to decelerate. Against this
background, the Governing Council expects the
current episode of extremely low or negative
infl ation rates to be short-lived and price stability
to be maintained over the medium term, thereby
continuing to support the purchasing power of
euro area households.
The economic data and survey information that
have become available since the Governing
Council’s meeting on 2 July 2009 have broadly
confi rmed previous expectations. While
uncertainty is still high, there are increasingly
signs that the global recession is bottoming out.
As regards the euro area, recent surveys suggest
that the pace of contraction is clearly slowing
down. However, economic activity over the
remainder of this year is expected to remain
weak. Looking ahead into next year, after a
phase of stabilisation, a gradual recovery with
positive quarterly growth rates is expected. The
signifi cant policy stimuli in all major economic
areas should support growth globally, including
in the euro area.
In the view of the Governing Council,
uncertainty remains high and ongoing volatility
in incoming data is very likely. Overall, the risks
to this outlook remain balanced. On the upside,
there may be stronger than anticipated effects
stemming from the extensive macroeconomic
stimulus being provided and from other policy
measures taken. Confi dence may also improve
more quickly than currently expected. On the
downside, concerns remain relating to a stronger
or more protracted negative feedback loop
between the real economy and the turmoil in
fi nancial markets, renewed increases in oil and
other commodity prices, the intensifi cation of
protectionist pressures, more unfavourable than
expected labour market conditions and, lastly,
adverse developments in the world economy
stemming from a disorderly correction of global
imbalances.
With regard to price developments, annual HICP
infl ation was, according to Eurostat’s fl ash
estimate, -0.6 % in July, compared with -0.1%
in June. This further decline in annual rates
of infl ation was anticipated by the Governing
Council and refl ects primarily base effects
resulting from the peaks observed in global
commodity prices a year ago.
Looking ahead, owing to these base effects,
annual infl ation rates are projected to remain
temporarily in negative territory, before turning
positive again later this year. However, such
short-term movements are not relevant from a
monetary policy perspective. Consistent with
available forecasts and projections, looking
further ahead, infl ation is expected to remain
in positive territory, while price and cost
6ECB
Monthly Bulletin
August 2009
developments are expected to remain subdued
in the wake of ongoing sluggish demand in
the euro area and elsewhere. In this respect,
indicators of infl ation expectations over the
medium to longer term remain fi rmly anchored
in line with the Governing Council’s aim of
keeping infl ation rates below, but close to,
2% over the medium term.
Risks to the outlook for infl ation are broadly
balanced. They relate, in particular, to the
outlook for economic activity and to higher
than expected commodity prices. Furthermore,
increases in indirect taxation and administered
prices may be stronger than currently expected
owing to the need for fi scal consolidation in the
coming years.
Turning to the monetary analysis, the latest data
confi rm the ongoing deceleration in broad money
and credit growth. The annual growth rates of
M3 and of loans to the private sector recorded
in June – 3.5% and 1.5% respectively – are the
lowest since the start of Stage Three of EMU.
These developments support the assessment
of a slower underlying pace of monetary
expansion and low infl ationary pressures over
the medium term.
The declining pace of monetary expansion
since the last quarter of 2008 continues to be
accompanied by volatility in the short-term
developments of M3 and its components. This
refl ects to a large extent the impact that absolute
and relative changes in interest rates have had
on the allocation of funds between fi nancial
investments inside and outside M3 and between
the different deposit categories within M3.
In this respect, the shift in allocation from
short-term time deposits to overnight deposits
within M3 has led to a further substantial
strengthening of annual M1 growth in June.
The fl ow of bank loans to the non-fi nancial
private sector remained subdued in June, albeit
with differences across borrowing sectors. The
fl ow of loans to non-fi nancial corporations
turned substantially more negative owing
to a sharp contraction in short-term lending.
At the same time, the fl ow of loans to
households was slightly more positive than last
month. The ongoing uncertainty seems to have
dampened borrowers’ demand for fi nancing.
However, according to the latest euro area bank
lending survey, lenders tightened their credit
standards to a signifi cantly lesser extent. Given
the challenges that lie ahead, banks should take
appropriate measures to strengthen further their
capital bases and, where necessary, take full
advantage of government measures to support
the fi nancial sector, particularly as regards
recapitalisation.
To sum up, the information and analyses that
have become available since the meeting of
the Governing Council on 2 July 2009 confi rm
its view that the current key ECB interest rates
remain appropriate. As anticipated, annual
HICP infl ation in July fell further into negative
territory, refl ecting mainly temporary effects.
After a return to positive infl ation rates during
the second half of the year, the Governing
Council continues to expect price developments
to remain subdued over the policy-relevant
horizon. Recent data releases and survey
information still suggest that economic activity
over the remainder of this year is likely to
remain weak, although the pace of contraction
is clearly slowing down. This assessment takes
into account adverse lagged effects, such as a
further deterioration in labour markets, which
are likely to materialise over the coming months.
Looking ahead into next year, after a phase of
stabilisation, a gradual recovery with positive
quarterly growth rates is expected. Available
indicators of infl ation expectations over the
medium to longer term remain fi rmly anchored
in line with the Governing Council’s aim of
keeping infl ation rates below, but close to,
2% over the medium term. A cross-check of the
outcome of the economic analysis with that of
the monetary analysis confi rms the assessment
of low infl ationary pressure, as money and credit
expansion continues to decelerate. Against this
background, the Governing Council expects the
current episode of extremely low or negative
infl ation rates to be short-lived and price stability
to be maintained over the medium term, thereby
7ECB
Monthly Bulletin
August 2009
EDITORIAL
continuing to support the purchasing power of
euro area households.
As the transmission of monetary policy works
with lags, the Governing Council’s policy
action should progressively feed through to the
economy in full. Hence, with all the measures
taken, including the covered bond purchases,
monetary policy will provide ongoing support
for households and corporations. Once the
macroeconomic environment improves, the
Governing Council will take care that the
measures taken are quickly unwound and that the
ample liquidity provided is absorbed. Hence, any
threat to price stability over the medium to longer
term will be effectively countered in a timely
fashion. The Governing Council will continue
to ensure a fi rm anchoring of medium-term
infl ation expectations. Such anchoring is
indispensable to supporting sustainable growth
and employment and contributes to fi nancial
stability. Accordingly, the Governing Council
will continue to monitor very closely all
developments over the period ahead.
Regarding fi scal policy, the Governing Council
welcomes the position of the Eurogroup
that, given the current economic outlook and
projected public defi cit and debt developments,
further fi scal stimulus is not warranted.
Budget plans for 2010, which are currently
being fi nalised in a number of countries, and
medium-term consolidation strategies must
refl ect a commitment to a swift return to sound
and sustainable public fi nances. Accordingly,
governments should prepare and communicate
ambitious and realistic fi scal exit and
consolidation strategies within the framework
of the Stability and Growth Pact. The structural
adjustment process should start, in any case, not
later than the economic recovery and in 2011
the consolidation efforts should be stepped up.
Structural consolidation efforts will need to
exceed signifi cantly the benchmark of 0.5% of
GDP per annum set in the Stability and Growth
Pact. In countries with high defi cits and/or debt
ratios the annual structural adjustment should
reach at least 1% of GDP. Given the risks of
lower potential economic growth in the euro
area for a prolonged period of time, governments
should adjust public expenditures appropriately
to the new macroeconomic conditions and
reverse the sharp rises in public expenditure
ratios as soon as possible. This is necessary
also to prepare government budgets for future
ageing-induced expenditure burdens.
Turning to structural policies, there is a need
to intensify structural reform efforts in order
to support sustainable growth in the euro
area. Appropriate wage-setting and suffi cient
fl exibility to get the unemployed back into work
are crucial to prevent the crisis from having a
lasting negative impact on labour markets.
It is therefore essential to create appropriate
incentives to work. At the same time, policies
to speed up restructuring and investment, in line
with the principle of an open market economy
and free competition, will create the business
opportunities and productivity gains needed to
spark a sustained recovery.
This issue of the Monthly Bulletin contains
two articles. The fi rst article presents an
overview of developments in housing fi nance
since 1999. The second article discusses the
determinants of banks’ interest rate-setting
behaviour and evaluates the impact of the recent
fi nancial market tensions on the monetary policy
transmission mechanism.

9ECB
Monthly Bulletin
August 2009
ECONOMIC AND MONETARYDEVELOPMENTS
The external
environment
of the euro area
ECONOMIC AND MONETARY DEVELOPMENTS
1 THE EXTERNAL ENVIRONMENT OF THE EURO AREA
While uncertainty is still high, global indicators are increasingly suggesting that the current recession is bottoming out, supported by the strong global stimulus measures and improving fi nancing conditions in key market segments. At the same time, the prevailing weakness of the global economy and negative base effects from last year’s increases in commodity prices have continued to exert downward pressure on global headline infl ation rates. Looking ahead, there is an increasing likelihood of a return to positive global economic growth rates later this year.
1.1 DEVELOPMENTS IN THE WORLD ECONOMY
While uncertainty is still high, global indicators
are increasingly suggesting that the current
recession is bottoming out, supported by the
strong global stimulus measures and improving
fi nancing conditions in key market segments.
Although the overall Global Purchasing
Managers’ Index (PMI) increased only slightly in
July, remaining below the expansion/contraction
threshold, it stood at the highest level since
August 2008. In the manufacturing sector, the PMI
has risen over the course of the past two months
to above the threshold value of 50, suggesting
that fi rms have started to step up activity again.
Firms in the services sector, however, continue to
scale back activity.
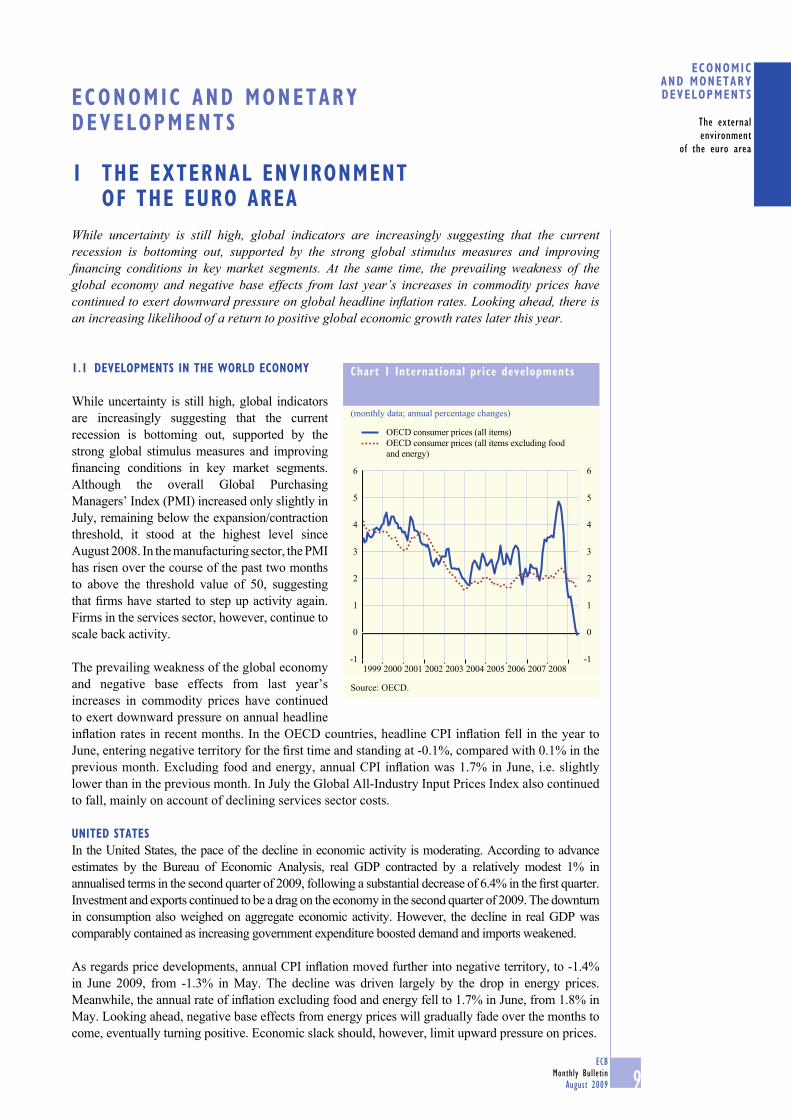
The prevailing weakness of the global economy
and negative base effects from last year’s
increases in commodity prices have continued
to exert downward pressure on annual headline
infl ation rates in recent months. In the OECD countries, headline CPI infl ation fell in the year to
June, entering negative territory for the fi rst time and standing at -0.1%, compared with 0.1% in the
previous month. Excluding food and energy, annual CPI infl ation was 1.7% in June, i.e. slightly
lower than in the previous month. In July the Global All-Industry Input Prices Index also continued
to fall, mainly on account of declining services sector costs.
UNITED STATES
In the United States, the pace of the decline in economic activity is moderating. According to advance
estimates by the Bureau of Economic Analysis, real GDP contracted by a relatively modest 1% in
annualised terms in the second quarter of 2009, following a substantial decrease of 6.4% in the fi rst quarter.
Investment and exports continued to be a drag on the economy in the second quarter of 2009. The downturn
in consumption also weighed on aggregate economic activity. However, the decline in real GDP was
comparably contained as increasing government expenditure boosted demand and imports weakened.
As regards price developments, annual CPI infl ation moved further into negative territory, to -1.4%
in June 2009, from -1.3% in May. The decline was driven largely by the drop in energy prices.
Meanwhile, the annual rate of infl ation excluding food and energy fell to 1.7% in June, from 1.8% in
May. Looking ahead, negative base effects from energy prices will gradually fade over the months to
come, eventually turning positive. Economic slack should, however, limit upward pressure on prices.
Chart 1 International price developments
(monthly data; annual percentage changes)
-1
0
1
2
3
4
5
6
-1
0
1
2
3
4
5
6
OECD consumer prices (all items)
OECD consumer prices (all items excluding food
and energy)
20001999 2001 2002 2003 2004 2005 2006 2007 2008
Source: OECD.
10ECB
Monthly Bulletin
August 2009
The projections of members of the Federal
Open Market Committee (published with the
minutes of the Committee’s meeting of 23-24
June 2009) expect output to expand sluggishly
over the remainder of the year. The central
tendency of the projections for real GDP growth
(measured as fourth-quarter year-on-year
growth rates) lies in the range of -1.5% to -1.0%
for 2009, a modest upward revision from the
April projections. The recovery is expected to be
gradual in 2010, with the central tendency of the
projections for year-on-year GDP growth lying
between 2.1% and 3.3% in the fourth quarter.
JAPAN
Following the severe contraction in economic
activity in previous quarters, there are now
some signs of stabilisation. After a record
contraction in real GDP of 3.8% quarter on
quarter in the fi rst quarter of 2009, business
conditions appear to have improved somewhat.
The Bank of Japan’s second-quarter Tankan
survey showed that business sentiment among
large manufacturers had risen signifi cantly from
the previous quarter’s record low. The business
sentiment index for large non-manufacturers
also registered its fi rst improvement in two
and a half years. Furthermore, some higher-
frequency indicators, including industrial output
and real consumption expenditure, provide some
evidence of improvement.
In Japan, overall annual CPI infl ation moved
signifi cantly further into negative territory,
to -1.8% in June 2009, compared with -1.1% in
May. This decrease refl ected base effects related
to energy costs and greater economic slack.
CPI infl ation excluding food and energy also
fell, to -0.7% on an annual basis in June, from
-0.5% in May.
On 15 July the Bank of Japan decided to keep its target for the uncollateralised overnight call rate
at around 0.1%.
UNITED KINGDOM
In the United Kingdom, there has been a further decline in real GDP and a moderation in infl ation
in recent quarters. Real GDP decreased by 2.4% quarter on quarter in the fi rst quarter of 2009
(revised down from the preliminary estimate of 1.9%). This decline was broad-based among
expenditure components. In the second quarter of 2009, according to preliminary estimates, real
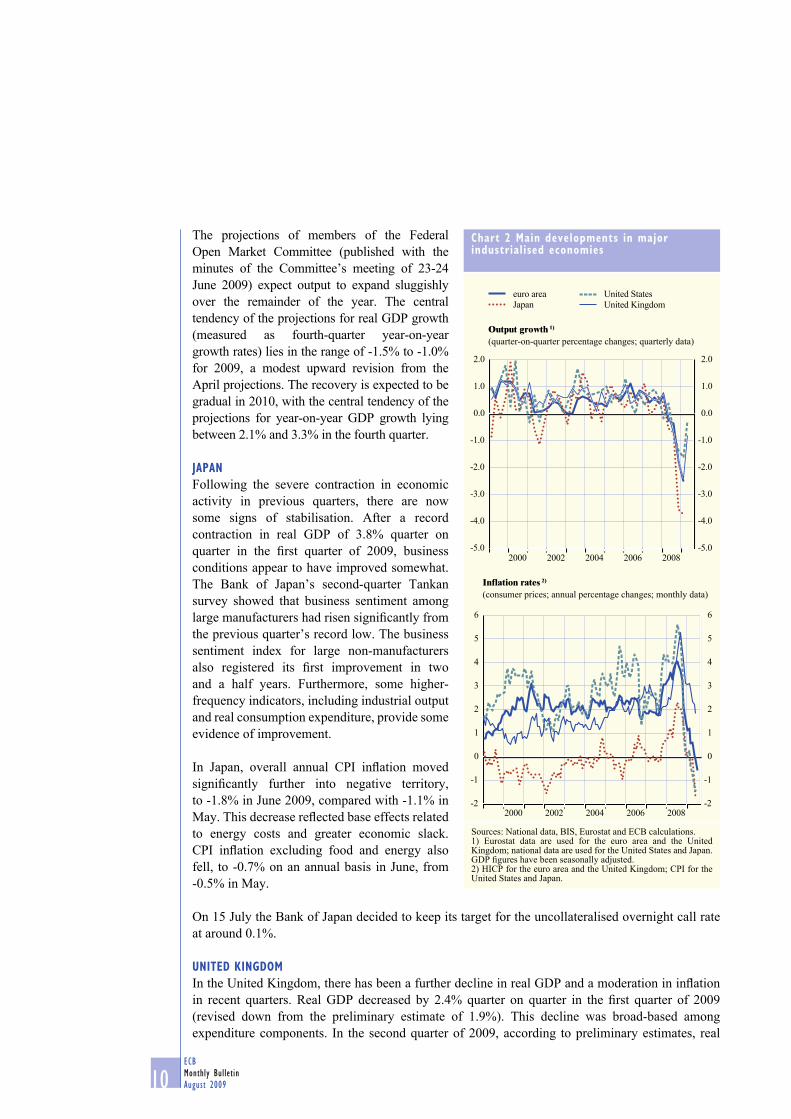
Chart 2 Main developments in major industrialised economies
euro area United States
Japan United Kingdom
Output growth 1)
(quarter-on-quarter percentage changes; quarterly data)
-5.0
-4.0
-3.0
-2.0
-1.0
0.0
1.0
2.0
-5.0
-4.0
-3.0
-2.0
-1.0
0.0
1.0
2.0
2000 2002 2004 2006 2008
Inflation rates 2)
(consumer prices; annual percentage changes; monthly data)
-2
-1
0
1
2
3
4
5
6
-2
-1
0
1
2
3
4
5
6
2000 2002 2004 2006 2008
Sources: National data, BIS, Eurostat and ECB calculations.1) Eurostat data are used for the euro area and the United Kingdom; national data are used for the United States and Japan. GDP fi gures have been seasonally adjusted.2) HICP for the euro area and the United Kingdom; CPI for the United States and Japan.

11ECB
Monthly Bulletin
August 2009
ECONOMIC AND MONETARYDEVELOPMENTS
The external
environment
of the euro area
GDP declined by 0.8% quarter on quarter. Looking ahead, real GDP is expected to shrink further,
albeit at a slower pace, as falling employment, lower housing and fi nancial wealth, and tight credit
conditions are likely to continue to weigh on consumer spending in the near term. Recent survey
data point to a possible stabilisation in activity towards the end of 2009. Following a slight increase
at the beginning of 2009, annual HICP infl ation has started to decline again, standing at 1.8% in
June 2009, down from 2.2% in May. House prices have been falling since the beginning of the
fi nancial crisis in mid-2007, but the underlying pace of the decline has been moderating recently.
In June 2009 the annual change in the Halifax House Price Index was -15.0%, after -16.3% in May.
Looking ahead, infl ation is expected to decline further and remain below the 2% target in the near
term. Between 5 March and 30 July 2009, the Bank of England purchased assets in the amount of
GBP 125 billion through its Asset Purchase Facility, GBP 122 billion of which were government
bonds. On 6 August the Monetary Policy Committee announced its decision to maintain the offi cial
Bank rate paid on reserves at 0.5%. The Committee also voted to increase the size of its programme
of asset purchases by GBP 50 billion to GBP 175 billion.
OTHER EUROPEAN COUNTRIES
In most other non-euro area EU countries, weak economic activity in recent quarters has been
accompanied by a decrease in infl ation. In Sweden, real GDP contracted by 0.9% quarter on quarter
in the fi rst quarter of 2009. In the second quarter of 2009 real GDP was unchanged compared with
the previous quarter (in seasonally and working day-adjusted terms). The rate of decline in the
majority of GDP components is decelerating markedly. In Denmark, output contracted by 1.1%
in the fi rst quarter amid weak external demand, tighter fi nancing conditions and declining private
consumption. In recent months HICP infl ation has decreased to fairly low levels in both countries.
In June HICP infl ation fell to 1.6% in Sweden and 0.9% in Denmark. On 2 July 2009 Sveriges
Riksbank decided to decrease its main policy rate by 25 basis points to 0.25%.
The largest central and eastern European EU Member States, with the exception of Poland,
experienced a decline in real GDP in the fi rst quarter of 2009. Quarter-on-quarter real GDP growth
contracted by 2.5% in Hungary, 3.4% in the Czech Republic and 4.6% in Romania. Economic
activity held up best in Poland, where quarter-on-quarter growth was still positive in the fi rst quarter
of 2009, at 0.4%, on account of the fact that domestic demand growth remained strong compared
with that in other countries in the region. Short-term indicators point to continued weakness in
economic activity in these countries. In June 2009 annual HICP infl ation rates decreased to 0.8%
and 3.7% in the Czech Republic and Hungary respectively, and remained unchanged at 4.2% and
5.9% in Poland and Romania respectively. On 27 July 2009 the Magyar Nemzeti Bank decided to
decrease its main policy rate by 100 basis points to 8.5%.
EMERGING ASIA
According to the latest data releases, most emerging Asian economies started to recover in the
second quarter of 2009. After the dramatic drop in foreign trade during the last quarter of 2008
and the fi rst quarter of 2009, recent data point to positive monthly changes in trade in several
countries. Preliminary indicators show that domestic demand has also rebounded, driven largely
by expansionary macroeconomic policies. However, the negative lagged effects of the global
fi nancial crisis, such as rising unemployment, are still holding back domestic private consumption.
Consumer price infl ation has continued to decline and has even entered negative territory in a
number of countries.
12ECB
Monthly Bulletin
August 2009
In China, annual real GDP growth increased to 7.9% in the second quarter of 2009, from 6.1% in
the fi rst quarter. External demand remained relatively weak, while very rapid investment growth
accounted for the bulk of GDP growth. In the fi rst six months of the year, fi xed asset investment
in urban areas increased by 34% year on year, owing mainly to soaring public investment in
infrastructure. Consumption growth has remained relatively robust, and the most recent data show
that the situation is also improving in the real estate sector. While fast investment growth has boosted
demand for imported commodities and other primary goods, exports appear to have stabilised at a
low level. Consequently, the trade surplus decreased signifi cantly in the second quarter of 2009,
although it nevertheless stood at USD 8.2 billion in June. In the same month, annual CPI infl ation
stood at -1.7%, compared with -1.4% in May.
LATIN AMERICA
In Latin America, economic activity has been showing tentative signs of recovery, albeit from a
low level, while infl ationary pressures are abating gradually. In Brazil, industrial production fell
by 10.9% year on year in June, having fallen by 11.2% in May. In June annual consumer price
infl ation reached 4.9%, down from 5.4% a month earlier. In response to the continued weakness
in economic activity, the Banco Central do Brasil cut its key interest rate by 50 basis points to
8.75% on 23 July. In Argentina, industrial production in May fell by 1.7% on an annual basis.
Annual consumer price infl ation continued to decline, to stand at 5.3% in June. Finally, economic
activity weakened further in Mexico, with industrial production in June falling by 10.6% on an
annual basis, having fallen by 8.8% in May. Infl ationary pressures nevertheless persisted, with
headline infl ation reaching 5.7% in June. On 17 July the Banco de México cut its overnight rate
by 25 basis points to 4.5%.
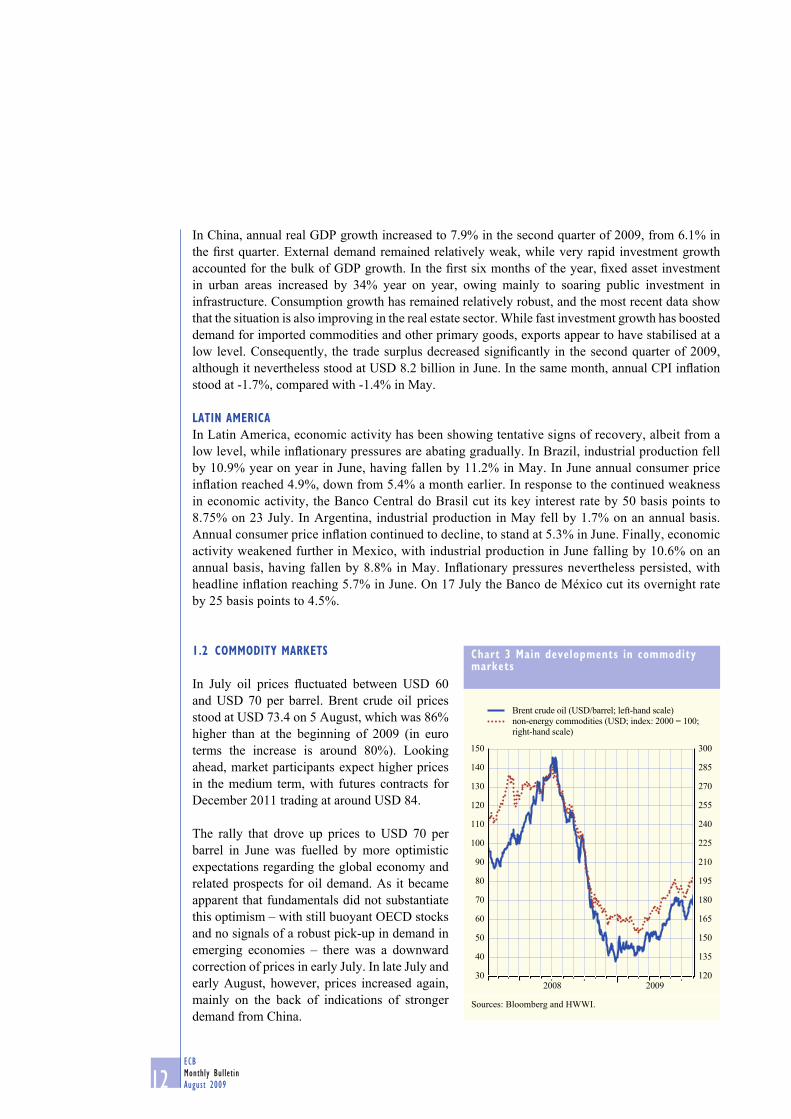
1.2 COMMODITY MARKETS
In July oil prices fl uctuated between USD 60
and USD 70 per barrel. Brent crude oil prices
stood at USD 73.4 on 5 August, which was 86%
higher than at the beginning of 2009 (in euro
terms the increase is around 80%). Looking
ahead, market participants expect higher prices
in the medium term, with futures contracts for
December 2011 trading at around USD 84.
The rally that drove up prices to USD 70 per
barrel in June was fuelled by more optimistic
expectations regarding the global economy and
related prospects for oil demand. As it became
apparent that fundamentals did not substantiate
this optimism – with still buoyant OECD stocks
and no signals of a robust pick-up in demand in
emerging economies – there was a downward
correction of prices in early July. In late July and
early August, however, prices increased again,
mainly on the back of indications of stronger
demand from China.
Chart 3 Main developments in commodity markets
30
40
50
60
70
80
90
100
110
120
130
140
150
120
135
150
165
180
195
210
225
240
255
270
285
300
Brent crude oil (USD/barrel; left-hand scale)
non-energy commodities (USD; index: 2000 = 100;
right-hand scale)
2008 2009
Sources: Bloomberg and HWWI.
13ECB
Monthly Bulletin
August 2009
ECONOMIC AND MONETARYDEVELOPMENTS
The external
environment
of the euro area
The prices of non-energy commodities have moderated somewhat over the last month.
The rally in metal prices observed during recent months came to a halt, but fundamentals remain
supportive for future increases. The prices of food commodities, in particular soybeans and
maize, decreased after the rally observed in June owing to destocking by the Chinese authorities.
By contrast, sugar prices posted sharp increases owing to weather-related concerns about the
crops in India. In aggregate terms, the price index for non-energy commodities (denominated in
US dollars) was approximately 19% higher in July than at the beginning of the year.
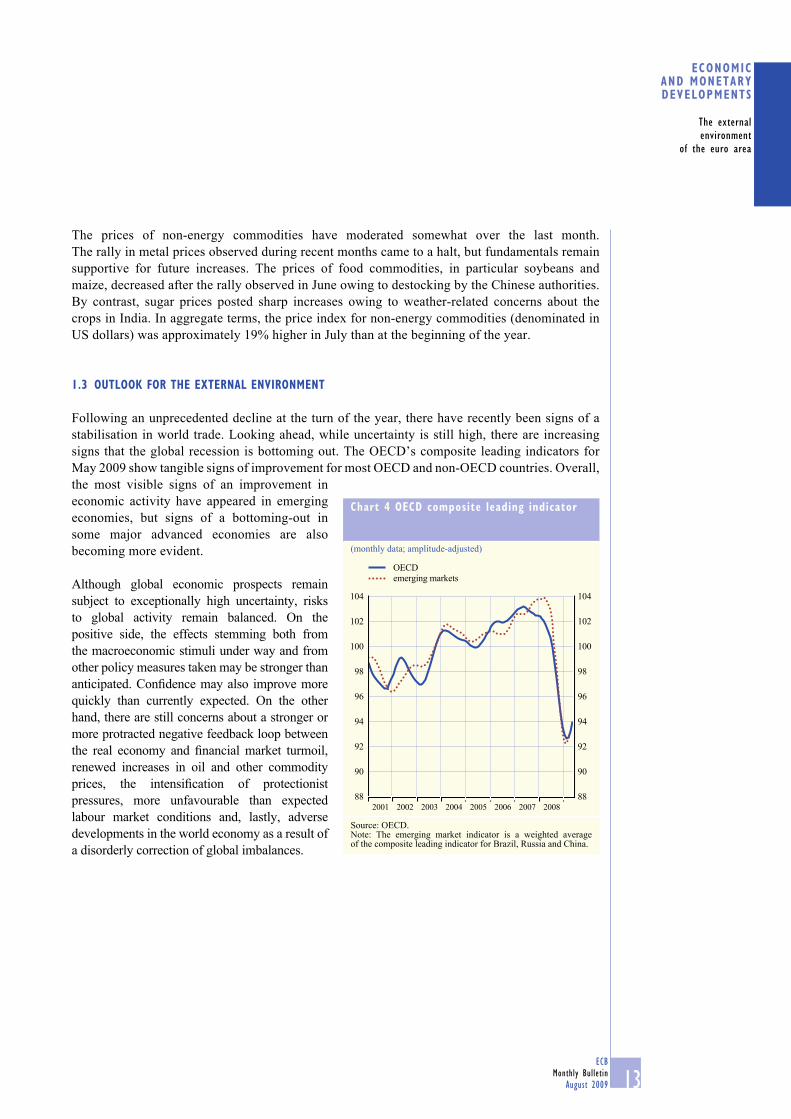
1.3 OUTLOOK FOR THE EXTERNAL ENVIRONMENT
Following an unprecedented decline at the turn of the year, there have recently been signs of a
stabilisation in world trade. Looking ahead, while uncertainty is still high, there are increasing
signs that the global recession is bottoming out. The OECD’s composite leading indicators for
May 2009 show tangible signs of improvement for most OECD and non-OECD countries. Overall,
the most visible signs of an improvement in
economic activity have appeared in emerging
economies, but signs of a bottoming-out in
some major advanced economies are also
becoming more evident.
Although global economic prospects remain
subject to exceptionally high uncertainty, risks
to global activity remain balanced. On the
positive side, the effects stemming both from
the macroeconomic stimuli under way and from
other policy measures taken may be stronger than
anticipated. Confi dence may also improve more
quickly than currently expected. On the other
hand, there are still concerns about a stronger or
more protracted negative feedback loop between
the real economy and fi nancial market turmoil,
renewed increases in oil and other commodity
prices, the intensifi cation of protectionist
pressures, more unfavourable than expected
labour market conditions and, lastly, adverse
developments in the world economy as a result of
a disorderly correction of global imbalances.
Chart 4 OECD composite leading indicator
(monthly data; amplitude-adjusted)
88
90
92
94
96
98
100
102
104
88
90
92
94
96
98
100
102
104
2002 2003 2004 2005 2006 2007 20082001
OECD
emerging markets
Source: OECD.Note: The emerging market indicator is a weighted average of the composite leading indicator for Brazil, Russia and China.

14ECB
Monthly Bulletin
August 2009
2 MONETARY AND FINANCIAL DEVELOPMENTS
2.1 MONEY AND MFI CREDIT
The monetary data for June confi rm the ongoing deceleration in the growth of both M3 andloans, pointing to a decline in the underlying rate of monetary growth. The fl ow of loans to the non-fi nancial private sector remained subdued, especially with regard to short-term lending to non-fi nancial corporations. To a large extent, the weak lending to non-fi nancial corporations and households refl ects the fact that a high degree of uncertainty continues to surround business, income and housing market prospects. The downward adjustment of the total asset holdings of MFIs lost momentum in June, with increases observed in external assets in particular following four months of negative fl ows.
THE BROAD MONETARY AGGREGATE M3
Monetary growth continued to decelerate
in June, with the annual growth rate of M3
standing at 3.5%, down from 3.7% in May
(see Chart 5). The month-on-month growth
rate was 0.2% in June (having stood at -0.5%
in May and 0.8% in April), thereby continuing
the pattern of alternating negative and positive
rates observed since the end of 2008. Looking
beyond this volatility in short-term growth
rates confi rms that the pace of monetary
expansion is markedly slower than it was prior
to the intensifi cation of the fi nancial turmoil in
September 2008.
The annual growth rate of MFI loans to the
private sector also continued to decline in June.
The monthly fl ow was signifi cantly positive, but
this was again related mainly to developments in
loans to non-monetary fi nancial intermediaries
other than insurance corporations and pension
funds. By contrast, lending to the non-fi nancial
private sector remained subdued, largely
refl ecting the fact that a high degree of uncertainty continues to surround business, income and
housing market prospects. These factors dampen demand for loans and also have a bearing on
banks’ assessment of borrowers’ creditworthiness.
With regard to credit institutions’ funding, the June MFI data indicate that while there were some
net sales of longer-term debt securities to non-MFIs, there were again large net redemptions of
short-term MFI debt securities. Overall, net issuance of MFI debt securities was negative –
a development that masks some gross issuance of bonds covered by government guarantees and
even larger redemptions of non-guaranteed bonds. Turning to deposits, infl ows were recorded from
both the money-holding sector and the rest of the world. The decline in the total asset holdings of
the banking sector lost momentum in June following four months of outfl ows, as MFIs resumed
their accumulation of asset holdings vis-à-vis the rest of the world and increased their lending to
euro area residents (particularly through the purchase of securities).
Chart 5 M3 growth
(percentage changes; adjusted for seasonal and calendar effects)
-2
0
2
4
6
8
10
12
14
-2
0
2
4
6
8
10
12
14
M3 (annual growth rate)
M3 (three-month centred moving average
of the annual growth rate)
M3 (six-month annualised growth rate)
1999 2000 2001 2002 2003 2004 2005 2006 2007 2008
Source: ECB.

15ECB
Monthly BulletinAugust 2009
Economic and monEtary dEvElopmEnts
Monetary and financial
developments
main componEnts oF m3The decline observed in June in the annual growth rate of M3 was driven by a fall in the contribution of short-term deposits other than overnight deposits (i.e. M2-M1). This was, however, partly offset by an increase in the overall contribution of M1 (i.e. currency in circulation and overnight deposits).
The annual growth rate of M1 resumed the strengthening observed since the third quarter of 2008, increasing to 9.3% in June, up from 7.9% in May (see Table 1). This increase mainly reflected a
strong monthly inflow for overnight deposits.
The annual growth rate of short-term deposits other than overnight deposits declined further to stand at 0.4% in June, down from 2.1% in May. Developments in the sub-components of this category of deposit continued to diverge: while the annual growth rate of deposits redeemable at notice of up to three months (i.e. short-term savings deposits) increased further in June, this was more than offset by a decline in the annual growth rate of deposits with an agreed maturity of up to two years (i.e. short-term time deposits), which fell significantly further to stand at -6.1%, down from -2.7%
in May.
Remuneration considerations appear to remain the principal factor influencing developments in the
various types of short-term deposit. The available data on MFI interest rates for the period up to May indicate that the remuneration of short-term time deposits continued to decline relative to that of overnight deposits and short-term savings deposits. This explains the outflows from short-term
time deposits and the relative resilience of the flows into overnight deposits and short-term savings
deposits. There may also have been an increase in the allocation of funds to financial assets outside
M3 as the remuneration of short-term deposits and marketable instruments declined further relative to the returns available on longer-term assets.
table 1 summary table of monetary variables
(quarterly figures are averages; adjusted for seasonal and calendar effects)
Outstanding amount as a
percentage of M3 1)
Annual growth rates2008
Q32008 Q4
2009Q1
2009Q2
2009 May
2009June
M1 45.0 0.7 2.7 5.3 7.9 7.9 9.3 Currency in circulation 7.8 7.5 12.4 13.6 13.2 13.1 12.8 Overnight deposits 37.2 -0.6 0.8 3.6 6.9 6.8 8.6
M2 - M1 (= other short-term deposits) 41.4 19.1 15.8 9.3 3.0 2.1 0.4 Deposits with an agreed maturity of up to two years 23.4 37.6 29.0 12.9 -0.8 -2.7 -6.1
Deposits redeemable at notice of up to three months 18.0 -1.7 -0.5 4.5 8.6 9.4 10.3
M2 86.4 9.2 8.9 7.2 5.5 5.0 4.8 M3 - M2 (= marketable instruments) 13.6 8.9 4.1 -0.8 -2.5 -3.7 -4.0 M3 100.0 9.1 8.2 6.0 4.3 3.7 3.5
Credit to euro area residents 9.1 7.4 5.9 4.3 3.9 4.2 Credit to general government 0.6 1.7 5.6 8.4 8.2 10.8 Loans to general government 2.1 2.9 2.3 1.5 1.4 2.5
Credit to the private sector 10.9 8.6 6.0 3.5 3.1 3.0 Loans to the private sector 9.1 7.4 4.6 2.2 1.8 1.5 Loans to the private sector adjusted for sales
and securitisation 10.1 8.5 6.1 3.6 3.3 2.8 Longer-term financial liabilities (excluding capital and reserves) 3.3 1.2 1.8 2.7 2.8 3.0
Source: ECB.1) As at the end of the last month available. Figures may not add up due to rounding.
16ECB
Monthly Bulletin
August 2009
The annual growth rate of marketable instruments declined further to stand at -4.0% in June,
down from -3.7% in May. As regards the sub-components of marketable instruments, the annual
growth rate of repurchase agreements increased strongly, while that of money market fund
shares/units remained broadly unchanged in positive territory. By contrast, the annual growth rate
of the money-holding sectors’ holdings of short-term MFI debt securities (i.e. debt securities with a
maturity of up to two years) became more negative, standing at -33.6% in June. The money-holding
sectors reduced their holdings of these securities in June, with similar reductions being observed in
the holdings of non-residents and the MFI sector itself.
The annual growth rate of M3 deposits – which comprise short-term deposits and repurchase
agreements and represent the broadest monetary aggregate for which a sectoral breakdown is
available – remained broadly unchanged at 4.4% in June. Households account for almost all of
this annual growth, but their contribution has gradually declined in recent months. By contrast, the
contribution made by non-fi nancial corporations has remained broadly stable, following a relatively
sharp decline to around zero at the turn of the year. A small monthly outfl ow was recorded in June
for the M3 deposits of the household sector – the fi rst since December 2004. This refl ects the lower
levels of remuneration currently available for these deposits relative to other types of fi nancial
investment or the repayment of outstanding debt. At the same time, both non-fi nancial corporations
and non-monetary fi nancial intermediaries increased their M3 deposit holdings in June.
MAIN COUNTERPARTS OF M3
Turning to the counterparts of M3, the annual growth rate of total MFI credit to euro area residents
increased to 4.2% in June, up from 3.9% in May (see Table 1). This refl ects an increase in the
annual growth rate of credit to general government (which rose to 10.8% in June, up from 8.2% in
May), while the annual growth rate of credit to the private sector remained broadly unchanged at
3.0%. In both cases, June saw very strong monthly fl ows related to MFIs’ purchases of public and
private sector debt securities.
By contrast, the annual growth rate of MFI loans to the private sector, the largest component of
credit to the private sector, declined further to stand at 1.5% in June, down from 1.8% in the previous
month. The monthly fl ow was positive, but this was due mainly to strong short-term borrowing by
non-monetary fi nancial intermediaries, as indicated above.
Following a period of intense true-sale securitisation activity at the end of 2008 – in which
originating credit institutions sold loans and acquired the securities issued for use as collateral
in Eurosystem credit operations – this type of activity has been more subdued in recent months.
While the distortionary effect that derecognition in the context of securitisation has on loans to the
private sector was thus relatively small in the month-on-month growth rates, it remained prevalent
in the annual growth rates (with the difference between the corrected and uncorrected annual series
standing at 1.3 percentage points in June, somewhat lower than in the previous month). The role
played by securitisation activity in the funding of credit institutions’ lending has been more limited
in the euro area than in the United States (see Box 1).

17ECB
Monthly Bulletin
August 2009
ECONOMIC AND MONETARYDEVELOPMENTS
Monetary and
financial
developments
Box 1
INSTITUTIONAL DIFFERENCES BETWEEN MORTGAGE MARKETS IN THE EURO AREA
AND THE UNITED STATES
There are several institutional differences between mortgage markets in the euro area and the
United States, including differences in mortgage characteristics and in mortgage fi nancing
structures. Such differences may contribute to explaining differences in household indebtedness
and the importance of securitisation. Against this background, this box investigates the role of
government-sponsored enterprises in mortgage funding in the United States and compares it
with mortgage funding practices in the euro area. It also discusses differences in foreclosure
procedures, which may have an impact on household borrowing behaviour.1
The role of government support in mortgage fi nancing in the United States compared with the euro area
A specifi c feature of the US mortgage market is the key role played by government-sponsored
enterprises (GSEs), which has its origin in the Great Depression, when a government agency called
the Federal National Mortgage Association (FNMA) was founded. The latter was then privatised
in 1968 and became known as Fannie Mae. In addition, a second private GSE operating in the
US mortgage market – i.e. the Federal Home Loan Mortgage Corporation (or Freddie Mac) – was
founded in 1968. Both GSEs acquired their current central role following the savings and loan
crisis in the 1980s, which led to major structural changes in the US mortgage markets. Up to
the late-1970s, savings and loan (S&L) institutions funded long-term fi xed rate mortgage loans
on the basis of mostly short-term deposits in an environment of stable interest rates. However,
the rise in nominal interest rates due to infl ation, in combination with ceilings on deposit rates,
led to withdrawals of funds by customers who placed their savings in higher-remunerated assets
(disintermediation). This development led to capital shortages at S&L institutions which were
further aggravated in the 1980s as a consequence of risky investments that these institutions
undertook following their deregulation. The removal of mortgage loans from the balance sheet
of S&L institutions, by selling them to the two GSEs, enabled S&L institutions to grant mortgage
loans despite lower deposit-to-loan ratios than in the past. In addition, after selling a fi xed-rate
mortgage loan (the type generally preferred by US homebuyers), the S&L institution does not
bear the risk of rising interest rates.
As a consequence of such historical developments, fi xed rate mortgages in the United States are
typically sold by mortgage banks to the GSEs, provided that they meet certain quality standards, or
to private issuers of asset-backed securities (ABSs), which either hold them on their balance sheet
or securitise them. In recent decades, the two GSEs enjoyed lower funding costs compared with
private banks when issuing mortgage-backed securities (MBSs) owing to an implicit government
guarantee. This guarantee was turned into an explicit guarantee in September 2008 given that
Fannie Mae and Freddie Mac were put under conservatorship. Under this arrangement, GSEs
and ultimately the US government support the provision of mortgage credit in the United States.
Moreover, by pooling mortgages and issuing relatively standardised mortgage-backed securities,
1 The evidence presented in this box relies mainly on R. K. Green and S. M. Wachter, “The American Mortgage in Historical and
International Context”, Journal of Economic Perspectives, Vol. 19, No. 4, Fall 2005, pages 93-114; A. Coles and J. Hardt, “Mortgage
markets: why US and EU markets are so different”, International Union for Housing Finance, December 2001; and European Central
Bank, “Housing fi nance in the euro area”, Occasional Paper Series No. 101, March 2009.

18ECB
Monthly Bulletin
August 2009
Fannie Mae and Freddie Mac promoted the liquidity in the US secondary mortgage market.
In terms of amounts outstanding, the GSEs are the main holders of mortgage debt. At the same
time, private ABS issuers, typically unregulated non-depository institutions, had considerably
increased their market share from 2004 up to the fi nancial turmoil, in parallel with the imposition
of regulatory limits on the activity of GSEs (see Chart A).2
By contrast with the United States, in the euro area, there is no comparable government support
for the provision of mortgage credit to euro area residents, i.e. euro area governments do not act
to reduce banks’ funding costs of mortgage loans or to favour the removal of loans from banks’
balance sheets. This picture has been altered somewhat by the fi nancial turmoil and the specifi c
government support measures which have been introduced at the country level. In addition, there
are considerable differences in accounting rules across euro area countries. Accounting rules in
some euro area countries only allow a full removal of true-sale securitised loans from banks’
balance sheets (i.e. a derecognition) when the securitisation transaction meets certain strict
criteria.3 By contrast, accounting rules in the United States make it generally easier to derecognise
loans from banks’ balance sheets and, hence, to move associated risks to third parties. These
reasons may explain to a large extent why the securitisation of mortgage loans by GSEs or private
ABS issuers has been so much more advanced in the United States compared with the euro area.
In the euro area, mortgage loans remain to a large extent on banks’ balance sheets (see Chart B).
In addition to deposits, which are generally the most important funding source of euro area banks,
housing loans are fi nanced directly via the issuance of mortgage covered bonds and residential
mortgage-backed securities (RMBSs), which are collateralised by mortgages (see Section 3 of the
2 According to the consolidated banking statistics from the Bank for International Settlements, 6% of the total foreign claims of euro area
banks were vis-à-vis the United States at the end of March 2009.
3 See Box 3 entitled “The importance of accounting standards for interpreting MFI loan statistics” in the March 2008 issue of the
Monthly Bulletin.
Chart B Financing of euro area households
(four-quarter cumulated transactions in EUR billions)
total financing
MFI loans
loans from non-MFIs
other accounts payable 1)
-500
50100150200250300350400450500550
2008-50050100150200250300350400450500550
2000 2002 2004 2006
Source: ECB.1) Also includes trade credit and net liabilities of fi nancial derivatives.
Chart A Financing of US households
(four-quarter cumulated transactions in USD billions)
-1,000
-750
-500
-250
0
250
500
750
1,000
1,250
1,500
2008-1,000
-750
-500
-250
0
250
500
750
1,000
1,250
1,500
other financing
loans from GSE ABS issuers 1)
loans from private ABS issuers
MFI 2) loans
total financing
2000 2002 2004 2006
Sources: Board of Governors of the Federal Reserve System and ECB calculations.1) Loans from GSEs and from agency and GSE-backed mortgage pools.2) Commercial banks, savings institutions and credit unions.
19ECB
Monthly Bulletin
August 2009
ECONOMIC AND MONETARYDEVELOPMENTS
Monetary and
financial
developments
article entitled “Housing fi nance in the euro area” in this issue of the Monthly Bulletin on the
funding of mortgage loans in the euro area). The collateralisation of the bond issuance generally
lowers banks’ funding costs. However, unlike the (implicit) government guarantee in the United
States, there is no comparable government support in mortgage funding costs in the euro area. In
the case of covered bond issuance, mortgage loans remain on banks’ balance sheets in the euro
area, and in the case of RMBSs, mortgage loans are only partly removed from banks’ balance
sheets, depending on the national accounting rules for derecognising true-sale securitised
loans. Hence, also the default risk associated with mortgage loans remains to a large extent on
banks’ balance sheets. Secured market-based funding of mortgage loans accounted for 21%
(9% for mortgage covered bonds and 12% for RMBSs) of the amount outstanding of housing
loans in the euro area at the end of 2007. In the United States, the share of securitised mortgage
loans was approximately 50% of the amount of mortgages outstanding.4
Implications of the structure of mortgage funding for mortgage loan characteristics
The importance of mortgage securitisation in the United States, including the role of GSEs and
private ABS issuers, led to the dominance of fi xed rate mortgage loans, which are traditionally
preferred by US homebuyers. An important reason for the willingness of banks to grant fi xed rate
mortgage loans is that banks did not need to bear the risk of fi nancing long-term assets with
short-term funds, as they could generally remove long-term mortgage loans from their balance
sheet. By contrast, in the euro area, there is a large number of countries in which variable rate
housing loans dominate and a minority of countries in which fi xed rate mortgage loan contracts
are dominant, related to demand, supply and institutional factors (see Section 2 of the article
entitled “Housing fi nance in the euro area” in this issue of the Monthly Bulletin).
In addition, during recent years and up to the fi nancial turmoil, new atypical contracts have been
introduced in the United States with so-called “teaser rates”, negative amortisation rates and
loan-to-value ratios of close to or above 100%, especially in the sub-prime segment. The higher
default risk of such sub-prime mortgage loans was to a large extent removed from banks’ balance
sheets, and was possibly mostly transferred to private ABS issuers which were less regulated
than GSEs. Such atypical contracts were used to a lower extent in the euro area, probably related
to accounting rules making it less easy to derecognise loans.
Furthermore, in the United States prepayment fees are generally minor or non-existent.
By contrast, while partial or total early repayments are allowed in all euro area countries, fees are
generally charged for the early repayment of fi xed rate housing loans, whereas early repayment
is free of charge in the case of variable rate housing loans in several euro area countries.
Insolvency and foreclosure procedures
With respect to further institutional differences between mortgage markets in the euro area
and the United States, there are also some key differences between insolvency and foreclosure
procedures in the euro area countries and the United States, which may contribute to explaining
differences in household indebtedness. Due to the limited availability of data and owing
to the heterogeneous situation among euro area countries, only a broad assessment based on
predominantly qualitative information is possible.
4 Referring to off-balance-sheet true-sale securitisation.

20ECB
Monthly Bulletin
August 2009
The annual growth rate of MFI loans to non-fi nancial corporations declined signifi cantly further to
stand at 2.8% in June, down from the 4.4% observed in May (see Table 2). Outstanding amounts
declined for all maturities, but particularly for loans with a maturity of up to one year. When
assessing this development, it should be borne in mind that owing to the differences in infl ation
expectations over the various maturities, the real cost of fi nancing is currently higher for short-term
While the number of personal bankruptcies has increased in the euro area and the United States
during recent years, personal insolvencies are still less common in the euro area than in the
United States. This is related to important differences in the legal framework between countries
governed by common law (e.g. the United States) and countries where legislation is based on
civil law, which is the case in most euro area countries. In the United States, the system in
the majority of US states tends, in practice, to work as if loans are non-recourse debt, i.e. debt
that is secured by collateral, but for which the borrower is not personally liable. By contrast, in
countries with civil law, borrowers are less easily released from the obligation to repay their
debt and remain personally liable for any difference between the value of the property and the
amount of the loan. In addition, judiciary procedures tend to be rather long in some euro area
countries, whereas countries governed by common law tend to prefer non-judiciary settlements.
Such differences in insolvency and foreclosure procedures may have an impact on the lending
conditions and thereafter the indebtedness of households. Moreover, in relation to the fi nancial
turmoil which had its origin in the US sub-prime market, the increase of personal insolvencies
was much stronger in the United States than in the euro area (based on limited information on a
few euro area countries) in 2007.
Conclusions
The specifi c features of the US mortgage market, with a dominant role for GSEs and private ABS
issuers and a relatively low proportion of mortgage loans remaining on banks’ balance sheets, are
advantageous in terms of lower funding costs and the pooling of risks through the securitisation
of mortgage loans. At the same time, banks’ ability to remove mortgage loans relatively easily
from their balance sheet has fuelled household mortgage indebtedness during recent years up to
the start of the fi nancial turmoil in mid-2007. In addition, structured transactions and the growth
of relatively lightly regulated private ABS issuers up to the fi nancial turmoil have led to an
opaque distribution and underestimation of risks in the fi nancial system. In the end, this triggered
the outbreak of the fi nancial turmoil.
By contrast, in the euro area, housing loans remain to a large extent on banks’ balance sheets
as they are mostly fi nanced via bank deposits or, to some extent, via the issuance of covered
bonds. Moreover, the importance of RMBS issuance in the euro area is relatively low. Generally,
while accounting rules differ across euro area countries, loans can be less easily removed from
banks’ balance sheets than in the United States. The fact that loans remain to a large extent on
the balance sheet of regulated institutions, i.e. banks, tends to support a more cautious behaviour
of lenders with respect to the loans originated. At the same time, the heterogeneous legislation
with respect to covered bond and RMBS issuance as well as non-standardised mortgage loans
have resulted in lower securitisation of mortgage loans in the euro area. Generally, higher loan
securitisation would enhance the liquidity of the secondary market and may reduce funding
costs, which would be benefi cial for borrowers. This notwithstanding, as the fi nancial turmoil
has shown, for the stability of the fi nancial system, it is important to keep risks transparent and,
to a signifi cant extent, on the balance sheets of well-regulated institutions.
21ECB
Monthly Bulletin
August 2009
ECONOMIC AND MONETARYDEVELOPMENTS
Monetary and
financial
developments
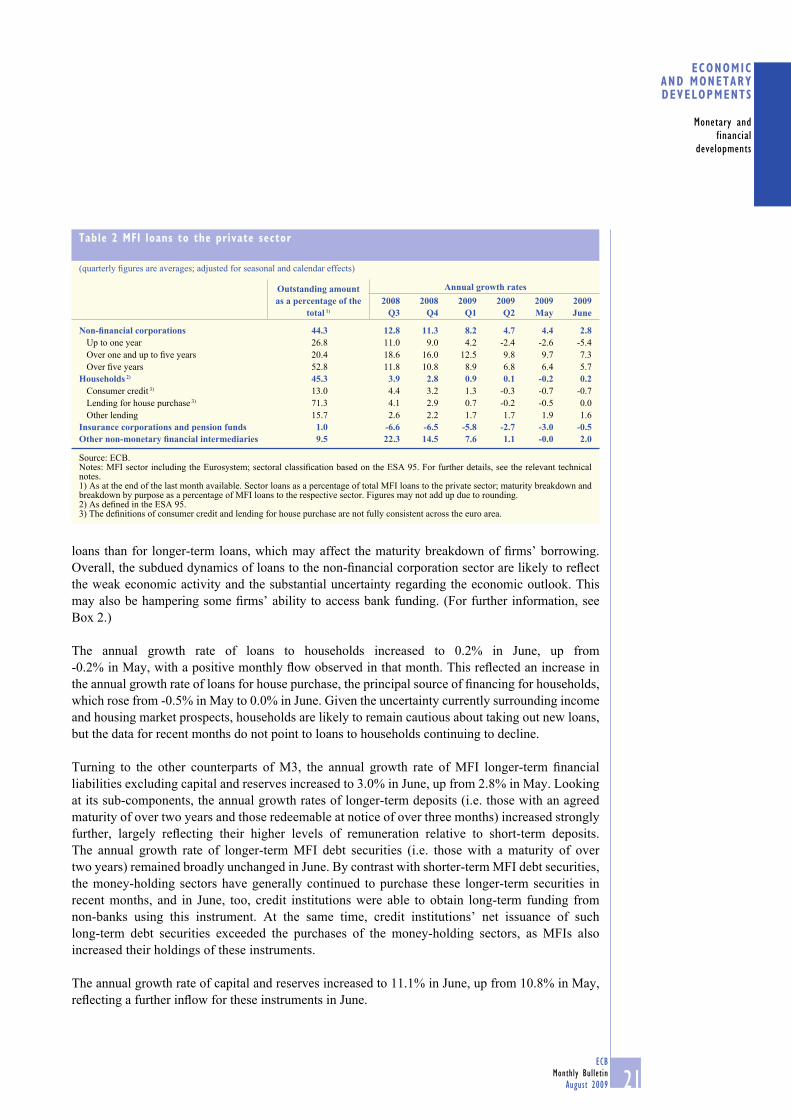
loans than for longer-term loans, which may affect the maturity breakdown of fi rms’ borrowing.
Overall, the subdued dynamics of loans to the non-fi nancial corporation sector are likely to refl ect
the weak economic activity and the substantial uncertainty regarding the economic outlook. This
may also be hampering some fi rms’ ability to access bank funding. (For further information, see
Box 2.)
The annual growth rate of loans to households increased to 0.2% in June, up from
-0.2% in May, with a positive monthly fl ow observed in that month. This refl ected an increase in
the annual growth rate of loans for house purchase, the principal source of fi nancing for households,
which rose from -0.5% in May to 0.0% in June. Given the uncertainty currently surrounding income
and housing market prospects, households are likely to remain cautious about taking out new loans,
but the data for recent months do not point to loans to households continuing to decline.
Turning to the other counterparts of M3, the annual growth rate of MFI longer-term fi nancial
liabilities excluding capital and reserves increased to 3.0% in June, up from 2.8% in May. Looking
at its sub-components, the annual growth rates of longer-term deposits (i.e. those with an agreed
maturity of over two years and those redeemable at notice of over three months) increased strongly
further, largely refl ecting their higher levels of remuneration relative to short-term deposits.
The annual growth rate of longer-term MFI debt securities (i.e. those with a maturity of over
two years) remained broadly unchanged in June. By contrast with shorter-term MFI debt securities,
the money-holding sectors have generally continued to purchase these longer-term securities in
recent months, and in June, too, credit institutions were able to obtain long-term funding from
non-banks using this instrument. At the same time, credit institutions’ net issuance of such
long-term debt securities exceeded the purchases of the money-holding sectors, as MFIs also
increased their holdings of these instruments.
The annual growth rate of capital and reserves increased to 11.1% in June, up from 10.8% in May,
refl ecting a further infl ow for these instruments in June.
Table 2 MFI loans to the private sector
(quarterly fi gures are averages; adjusted for seasonal and calendar effects)
Outstanding amount as a percentage of the
total 1)
Annual growth rates2008
Q3 2008
Q4 2009
Q1 2009
Q2 2009 May
2009 June
Non-fi nancial corporations 44.3 12.8 11.3 8.2 4.7 4.4 2.8Up to one year 26.8 11.0 9.0 4.2 -2.4 -2.6 -5.4
Over one and up to fi ve years 20.4 18.6 16.0 12.5 9.8 9.7 7.3
Over fi ve years 52.8 11.8 10.8 8.9 6.8 6.4 5.7
Households 2) 45.3 3.9 2.8 0.9 0.1 -0.2 0.2Consumer credit 3) 13.0 4.4 3.2 1.3 -0.3 -0.7 -0.7
Lending for house purchase 3) 71.3 4.1 2.9 0.7 -0.2 -0.5 0.0
Other lending 15.7 2.6 2.2 1.7 1.7 1.9 1.6
Insurance corporations and pension funds 1.0 -6.6 -6.5 -5.8 -2.7 -3.0 -0.5Other non-monetary fi nancial intermediaries 9.5 22.3 14.5 7.6 1.1 -0.0 2.0
Source: ECB.Notes: MFI sector including the Eurosystem; sectoral classifi cation based on the ESA 95. For further details, see the relevant technical notes.1) As at the end of the last month available. Sector loans as a percentage of total MFI loans to the private sector; maturity breakdown and breakdown by purpose as a percentage of MFI loans to the respective sector. Figures may not add up due to rounding.2) As defi ned in the ESA 95.3) The defi nitions of consumer credit and lending for house purchase are not fully consistent across the euro area.
22ECB
Monthly Bulletin
August 2009
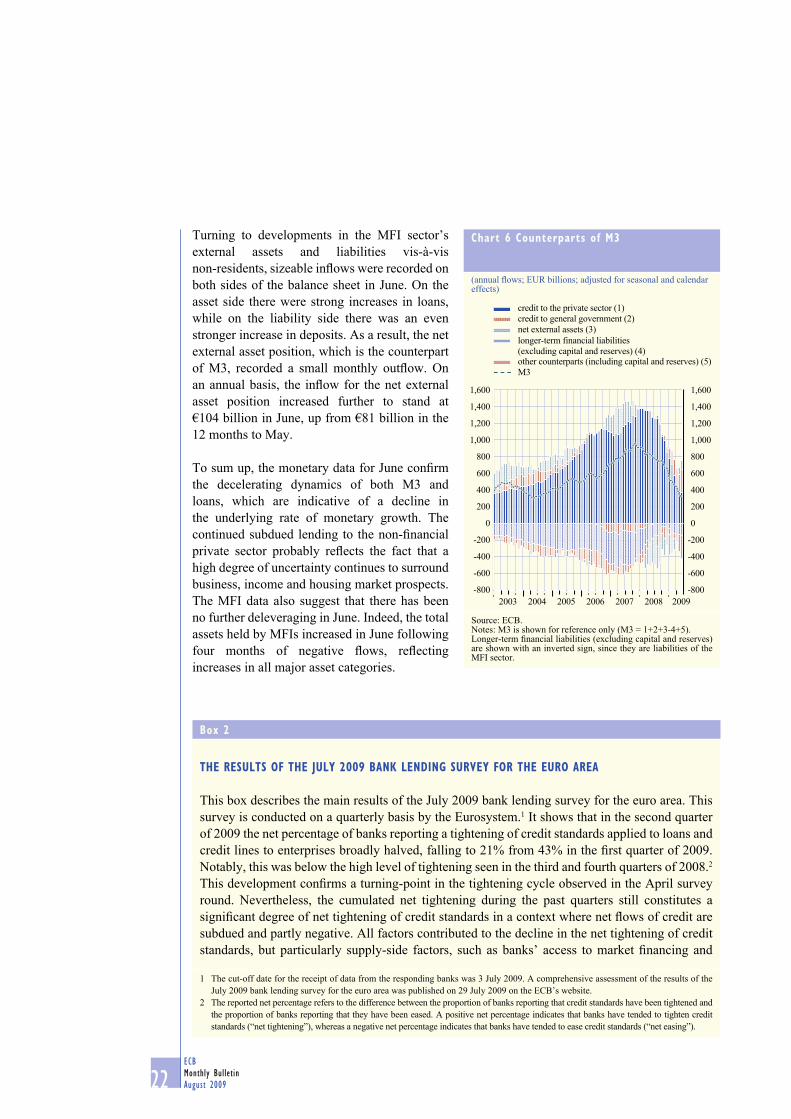
Turning to developments in the MFI sector’s
external assets and liabilities vis-à-vis
non-residents, sizeable infl ows were recorded on
both sides of the balance sheet in June. On the
asset side there were strong increases in loans,
while on the liability side there was an even
stronger increase in deposits. As a result, the net
external asset position, which is the counterpart
of M3, recorded a small monthly outfl ow. On
an annual basis, the infl ow for the net external
asset position increased further to stand at
€104 billion in June, up from €81 billion in the
12 months to May.
To sum up, the monetary data for June confi rm
the decelerating dynamics of both M3 and
loans, which are indicative of a decline in
the underlying rate of monetary growth. The
continued subdued lending to the non-fi nancial
private sector probably refl ects the fact that a
high degree of uncertainty continues to surround
business, income and housing market prospects.
The MFI data also suggest that there has been
no further deleveraging in June. Indeed, the total
assets held by MFIs increased in June following
four months of negative fl ows, refl ecting
increases in all major asset categories.
Chart 6 Counterparts of M3
(annual fl ows; EUR billions; adjusted for seasonal and calendar effects)
-800
-600
-400
-200
0
200
400
600
800
1,000
1,200
1,400
1,600
-800
-600
-400
-200
0
200
400
600
800
1,000
1,200
1,400
1,600
credit to the private sector (1)
credit to general government (2)
net external assets (3)
longer-term financial liabilities
(excluding capital and reserves) (4)other counterparts (including capital and reserves) (5)
M3
2003 2004 2005 2006 2007 2008 2009
Source: ECB.Notes: M3 is shown for reference only (M3 = 1+2+3-4+5).Longer-term fi nancial liabilities (excluding capital and reserves) are shown with an inverted sign, since they are liabilities of the MFI sector.
Box 2
THE RESULTS OF THE JULY 2009 BANK LENDING SURVEY FOR THE EURO AREA
This box describes the main results of the July 2009 bank lending survey for the euro area. This
survey is conducted on a quarterly basis by the Eurosystem.1 It shows that in the second quarter
of 2009 the net percentage of banks reporting a tightening of credit standards applied to loans and
credit lines to enterprises broadly halved, falling to 21% from 43% in the fi rst quarter of 2009.
Notably, this was below the high level of tightening seen in the third and fourth quarters of 2008.2
This development confi rms a turning-point in the tightening cycle observed in the April survey
round. Nevertheless, the cumulated net tightening during the past quarters still constitutes a
signifi cant degree of net tightening of credit standards in a context where net fl ows of credit are
subdued and partly negative. All factors contributed to the decline in the net tightening of credit
standards, but particularly supply-side factors, such as banks’ access to market fi nancing and
1 The cut-off date for the receipt of data from the responding banks was 3 July 2009. A comprehensive assessment of the results of the
July 2009 bank lending survey for the euro area was published on 29 July 2009 on the ECB’s website.
2 The reported net percentage refers to the difference between the proportion of banks reporting that credit standards have been tightened and
the proportion of banks reporting that they have been eased. A positive net percentage indicates that banks have tended to tighten credit
standards (“net tightening”), whereas a negative net percentage indicates that banks have tended to ease credit standards (“net easing”).
23ECB
Monthly Bulletin
August 2009
ECONOMIC AND MONETARYDEVELOPMENTS
Monetary and
financial
developments
banks’ liquidity position. Respondent banks also reported a decline in the net tightening of credit
standards for loans to households for house purchase and for consumer credit to 22% (from
28% in the fi rst quarter) and to 21% (from 26% in the fi rst quarter), respectively, in the second
quarter of 2009, and down from their historical peaks in the fourth quarter of 2008. For the third
quarter of 2009, banks expected a further decline in net tightening for all three loan categories.
Regarding loan demand, banks noted that net demand for loans to enterprises still declined, but
to a lower extent than in the fi rst quarter, whereas net demand for housing loans turned slightly
positive in the second quarter.3
As in recent survey rounds, the July 2009 survey likewise contained a set of ad hoc questions,
mainly addressing the effect of the fi nancial turmoil on credit standards and lending (see the last
section of this box).
Loans or credit lines to enterprises
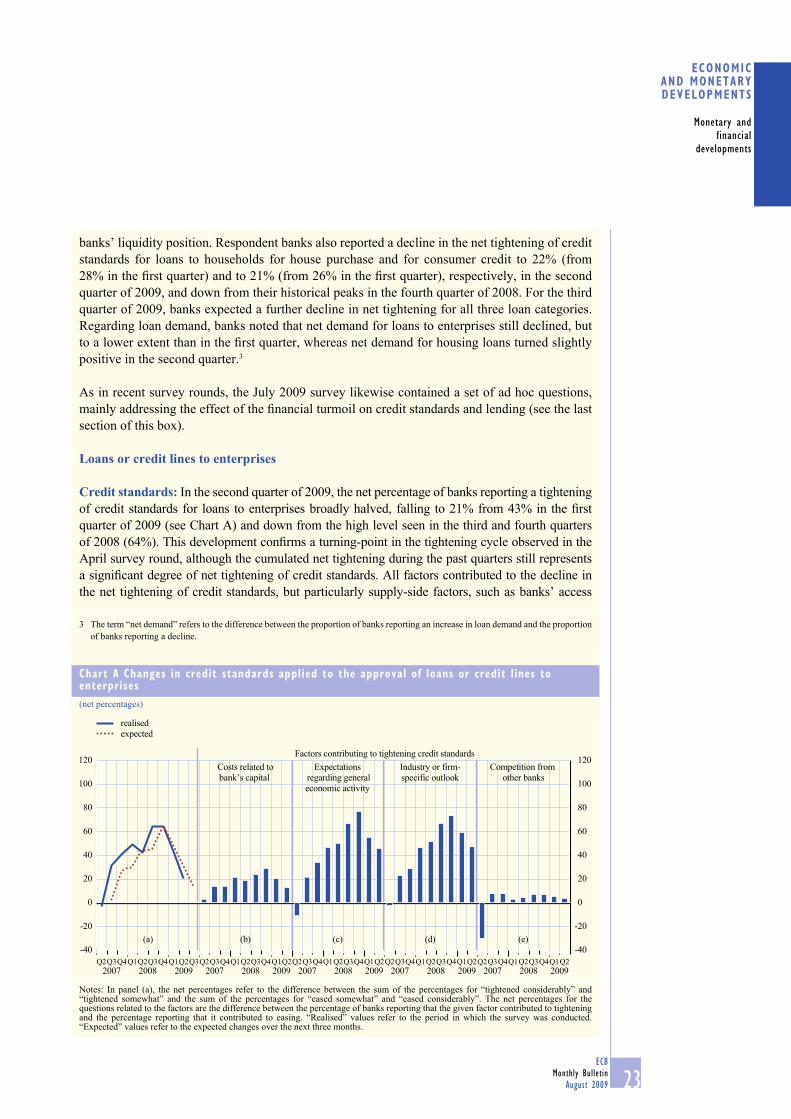
Credit standards: In the second quarter of 2009, the net percentage of banks reporting a tightening
of credit standards for loans to enterprises broadly halved, falling to 21% from 43% in the fi rst
quarter of 2009 (see Chart A) and down from the high level seen in the third and fourth quarters
of 2008 (64%). This development confi rms a turning-point in the tightening cycle observed in the
April survey round, although the cumulated net tightening during the past quarters still represents
a signifi cant degree of net tightening of credit standards. All factors contributed to the decline in
the net tightening of credit standards, but particularly supply-side factors, such as banks’ access
3 The term “net demand” refers to the difference between the proportion of banks reporting an increase in loan demand and the proportion
of banks reporting a decline.
Chart A Changes in credit standards applied to the approval of loans or credit lines to enterprises
(net percentages)
-40
-20
0
20
40
60
80
100
120
-40
-20
0
20
40
60
80
100
120
realised
expected
Factors contributing to tightening credit standards
(a) (e)(d)(c)(b)
Competition from
other banks
Costs related to
bank’s capital
Expectations
regarding general
economic activity
Industry or firm-
specific outlook
Q2Q3Q4 Q2Q1 Q3 Q2Q1 Q3Q4 Q3Q2 Q4Q1
2007 2008 2009 2007 2008 2009 2007 2008 2009 2007 2008 2009 2007 2008 2009Q3Q2 Q1Q2Q4 Q3Q2 Q4Q1 Q3Q2 Q1Q2Q4 Q3Q2 Q4Q1 Q3Q2 Q1Q2Q4 Q3Q2 Q4Q1 Q3Q2 Q1Q2Q4
Notes: In panel (a), the net percentages refer to the difference between the sum of the percentages for “tightened considerably” and “tightened somewhat” and the sum of the percentages for “eased somewhat” and “eased considerably”. The net percentages for the questions related to the factors are the difference between the percentage of banks reporting that the given factor contributed to tightening and the percentage reporting that it contributed to easing. “Realised” values refer to the period in which the survey was conducted. “Expected” values refer to the expected changes over the next three months.

24ECB
Monthly Bulletin
August 2009
to market fi nancing (7%, after 19% in the fi rst quarter) and banks’ liquidity position (-2%, after
14% in the fi rst quarter). The most important forces driving the net tightening of credit standards
on loans to enterprises continued to be expectations regarding general economic activity (46%,
after 55%) and the industry or fi rm-specifi c outlook (47%, after 59%), for which however the net
tightening also declined considerably in the second quarter of 2009.
Regarding the terms and conditions applied to loans to enterprises, banks continued to report
a net tightening in the second quarter of 2009, which however declined. In particular, the net
tightening of the margins on average loans was reduced signifi cantly, to 35%, from 58% in the
fi rst quarter of 2009, reaching its lowest level since the third quarter of 2007 (see Chart B).
Overall, the degree of net tightening was lower for the non-price terms and conditions than for
the price terms and conditions.
The decline in the net tightening of credit standards on loans to enterprises was refl ected in both
loans to large enterprises and loans to small and medium-sized enterprises (SMEs). As in most of
the previous survey rounds, the net tightening of credit standards was somewhat stronger in the
second quarter of 2009 for loans to large enterprises (25%, after 48% in the fi rst quarter of 2009)
than for loans to SMEs (21%, after 42% in the previous quarter). Both the cost of funds and
balance sheet constraints factor and the risk perception factor (i.e. mainly expectations regarding
general economic activity and the industry or fi rm-specifi c outlook) contributed considerably
to the more moderate net tightening of loans to large enterprises and SMEs. At the same time,
expectations regarding general economic activity and the industry or fi rm-specifi c outlook
continued to be the most important factors in explaining the degree of net tightening of credit
standards on loans to both large fi rms and SMEs. Costs related to the banks’ capital position
still played a somewhat more important role in the net tightening for large fi rms than for SMEs.
At the same time, large fi rms have profi ted somewhat more than SMEs from banks’ improved
liquidity position (in the sense that banks’ liquidity position contributed to an easing of credit
standards for large fi rms). The lower net tightening for loans to enterprises in the second quarter
of 2009 was also refl ected in the terms and conditions for both loans to large enterprises and
Chart B Changes in terms and conditions for approving loans or credit lines to enterprises
(net percentages of banks reporting tightening terms and conditions)
0
10
20
30
40
50
60
70
80
90
0
10
20
30
40
50
60
70
80
90Collateral
requirements
Loan
covenants
Non-interest
rate charges
MaturityMargins on
average loans
Margins on
riskier loans
Size of loan
or credit line
2008 2008 2008 2008 2008 2008 20082009 2009 2009 2009 2009 2009 2009Q2 Q2 Q2 Q2 Q2 Q2 Q2Q3 Q3 Q3 Q3Q4 Q4 Q4 Q4 Q3 Q4Q1 Q1 Q2 Q2Q1 Q3 Q4Q2 Q2Q1 Q3 Q4Q2 Q2Q1 Q2Q1Q1
Note: The net percentages refer to the difference between the sum of the percentages for “tightened considerably” and “tightened somewhat” and the sum of the percentages for “eased somewhat” and “eased considerably”.
25ECB
Monthly Bulletin
August 2009
ECONOMIC AND MONETARYDEVELOPMENTS
Monetary and
financial
developments
to SMEs. Overall, the degree of net tightening of terms and conditions was mostly higher for
large fi rms than for SMEs.
Expectations regarding credit standards applied to loans and credit lines to enterprises for the
third quarter of 2009 point to a further lessening of the net tightening (12%; see Chart A).
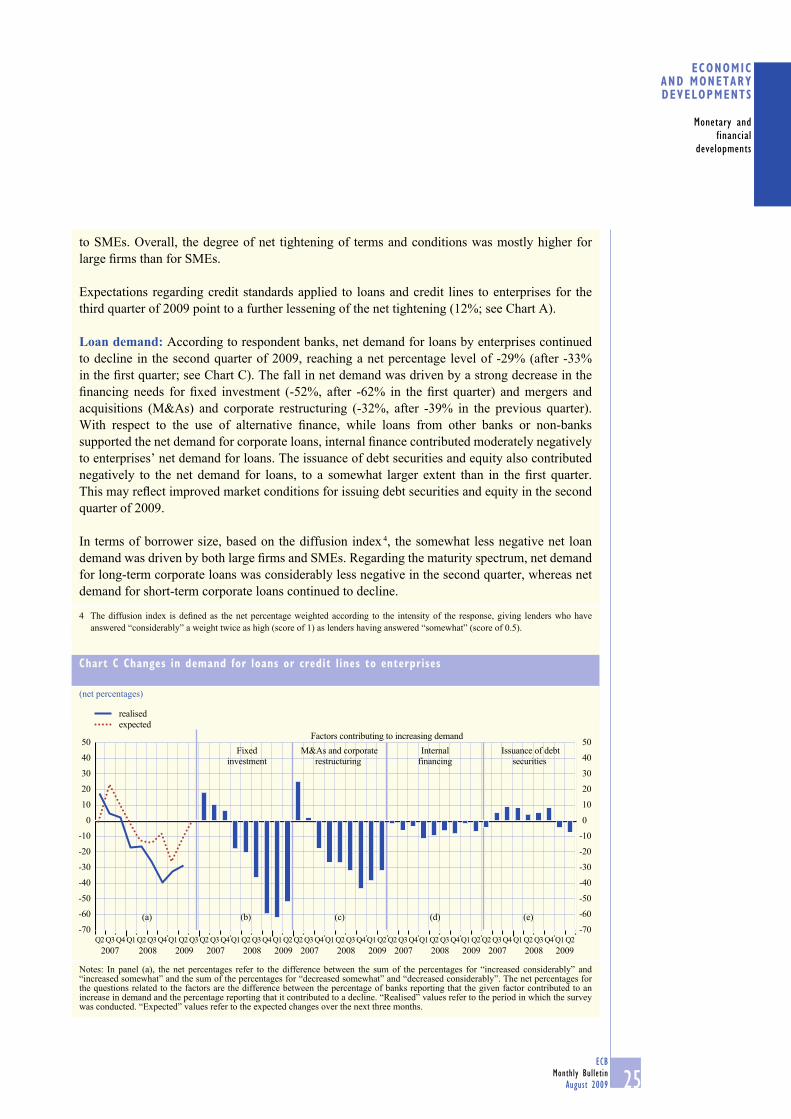
Loan demand: According to respondent banks, net demand for loans by enterprises continued
to decline in the second quarter of 2009, reaching a net percentage level of -29% (after -33%
in the fi rst quarter; see Chart C). The fall in net demand was driven by a strong decrease in the
fi nancing needs for fi xed investment (-52%, after -62% in the fi rst quarter) and mergers and
acquisitions (M&As) and corporate restructuring (-32%, after -39% in the previous quarter).
With respect to the use of alternative fi nance, while loans from other banks or non-banks
supported the net demand for corporate loans, internal fi nance contributed moderately negatively
to enterprises’ net demand for loans. The issuance of debt securities and equity also contributed
negatively to the net demand for loans, to a somewhat larger extent than in the fi rst quarter.
This may refl ect improved market conditions for issuing debt securities and equity in the second
quarter of 2009.
In terms of borrower size, based on the diffusion index 4, the somewhat less negative net loan
demand was driven by both large fi rms and SMEs. Regarding the maturity spectrum, net demand
for long-term corporate loans was considerably less negative in the second quarter, whereas net
demand for short-term corporate loans continued to decline.
4 The diffusion index is defi ned as the net percentage weighted according to the intensity of the response, giving lenders who have
answered “considerably” a weight twice as high (score of 1) as lenders having answered “somewhat” (score of 0.5).
Chart C Changes in demand for loans or credit lines to enterprises
(net percentages)
-70
-60
-50
-40
-30
-20
-10
0
10
20
30
40
50
-70
-60
-50
-40
-30
-20
-10
0
10
20
30
40
50
realised
expected
Fixed
investment
Issuance of debt
securities
M&As and corporate
restructuring
Factors contributing to increasing demand
Internal
financing
(e)(a) (d)(c)(b)
Q4 Q1Q2 Q3 Q4 Q4Q2 Q3Q4Q2 Q3 Q1 Q2 Q3 Q1 Q2 Q1 Q2 Q1 Q2 Q1 Q2 Q1 Q2Q2Q3 Q4Q1 Q2 Q3 Q4Q1 Q2 Q3 Q4Q1 Q2 Q3Q4Q3 Q2 Q4Q3 Q2 Q4Q3
2007 2007 20072008 2008 20082009 2009 2009 2007 2008 2009 2007 2008 2009
Notes: In panel (a), the net percentages refer to the difference between the sum of the percentages for “increased considerably” and “increased somewhat” and the sum of the percentages for “decreased somewhat” and “decreased considerably”. The net percentages for the questions related to the factors are the difference between the percentage of banks reporting that the given factor contributed to an increase in demand and the percentage reporting that it contributed to a decline. “Realised” values refer to the period in which the survey was conducted. “Expected” values refer to the expected changes over the next three months.

26ECB
Monthly Bulletin
August 2009
For the third quarter of 2009, net demand for loans by enterprises is expected to turn positive
(1%), which would be the case for the fi rst time since the fourth quarter of 2007 (see Chart C).
Loans to households for house purchase
Credit standards: In the second quarter of 2009, the net percentage of banks reporting a
tightening of credit standards for loans to households for house purchase decreased further to 22%
(see Chart D), after 28% in the fi rst quarter of 2009 and down from its historical peak in the fourth
quarter of 2008 (at 41%). Expectations regarding general economic activity (29%, after 40% in
the fi rst quarter) and housing market prospects (22%, after 33% in the previous quarter) remained
the main factors contributing to the net tightening of credit standards. By contrast with loans
to enterprises, banks’ cost of funds and balance sheet constraints contributed to a slight further
tightening of credit standards for housing loans in the second quarter of 2009 (9%, after 7% in the
previous quarter).
As regards the terms and conditions for loans for house purchase, the net tightening of margins
was reduced considerably in the second quarter, in particular for average loans (10%, after 38%),
but also for riskier loans (35%, after 52% in the fi rst quarter). By contrast, for non-price terms
and conditions, the net tightening was hardly reduced in the second quarter. In particular, the net
tightening of loan-to-value ratios remained constant at a still relatively high level by historical
standards of 25%. In addition, the net tightening of collateral requirements remained broadly
unchanged at 18% (after 19% in the previous quarter).
Looking ahead to the third quarter of 2009, credit standards for loans for house purchase are
expected to tighten somewhat less (12%; see Chart D).
Chart D Changes in credit standards applied to the approval of loans to households for house purchase
(net percentages)
-20
-10
0
10
20
30
40
50
60
70
-20
-10
0
10
20
30
40
50
60
70
realised
expectedFactors contributing to tightening credit standards
Expectations
regarding general
economic activity
Housing market
prospects
Competition from
other banks
(a) (d)
Cost of funds and
balance sheet
constraints
(e)(b) (c)
Q4 Q1Q2 Q3 Q4 Q4Q2 Q3Q4Q2 Q3 Q1 Q2 Q3 Q1 Q2 Q1 Q2 Q1 Q2 Q1 Q2 Q1 Q2Q2Q3 Q4Q1 Q2 Q3 Q4Q1 Q2 Q3 Q4Q1 Q2 Q3Q4Q3 Q2 Q4Q3 Q2 Q4Q3
2007 2007 20072008 2008 20082009 2009 2009 2007 2008 2009 2007 2008 2009
Note: See notes to Chart A.
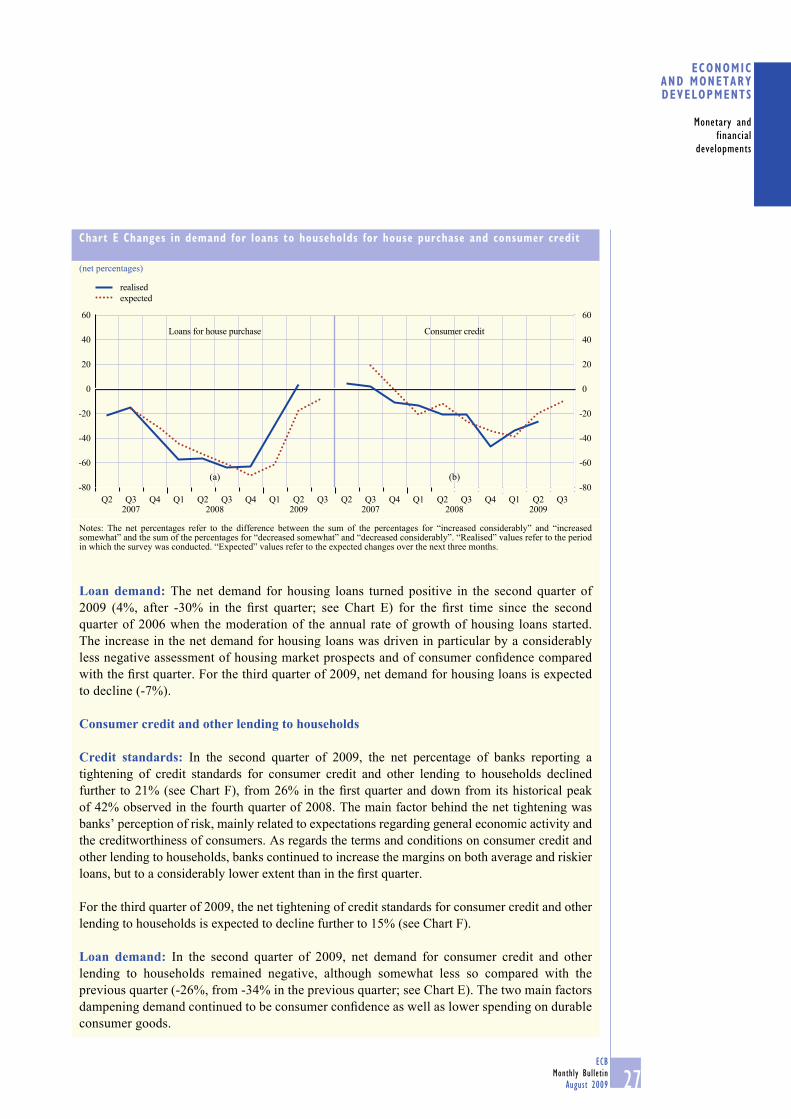
27ECB
Monthly Bulletin
August 2009
ECONOMIC AND MONETARYDEVELOPMENTS
Monetary and
financial
developments
Loan demand: The net demand for housing loans turned positive in the second quarter of
2009 (4%, after -30% in the fi rst quarter; see Chart E) for the fi rst time since the second
quarter of 2006 when the moderation of the annual rate of growth of housing loans started.
The increase in the net demand for housing loans was driven in particular by a considerably
less negative assessment of housing market prospects and of consumer confi dence compared
with the fi rst quarter. For the third quarter of 2009, net demand for housing loans is expected
to decline (-7%).
Consumer credit and other lending to households
Credit standards: In the second quarter of 2009, the net percentage of banks reporting a
tightening of credit standards for consumer credit and other lending to households declined
further to 21% (see Chart F), from 26% in the fi rst quarter and down from its historical peak
of 42% observed in the fourth quarter of 2008. The main factor behind the net tightening was
banks’ perception of risk, mainly related to expectations regarding general economic activity and
the creditworthiness of consumers. As regards the terms and conditions on consumer credit and
other lending to households, banks continued to increase the margins on both average and riskier
loans, but to a considerably lower extent than in the fi rst quarter.
For the third quarter of 2009, the net tightening of credit standards for consumer credit and other
lending to households is expected to decline further to 15% (see Chart F).
Loan demand: In the second quarter of 2009, net demand for consumer credit and other
lending to households remained negative, although somewhat less so compared with the
previous quarter (-26%, from -34% in the previous quarter; see Chart E). The two main factors
dampening demand continued to be consumer confi dence as well as lower spending on durable
consumer goods.
Chart E Changes in demand for loans to households for house purchase and consumer credit
(net percentages)
-80
-60
-40
-20
0
20
40
60
-80
-60
-40
-20
0
20
40
60
realised
expected
(a) (b)
Q2 Q3 Q4 Q3 Q4Q1 Q2 Q3 Q4Q1 Q2 Q3Q1 Q2Q3 Q4Q2Q3Q1 Q22007 2008 2009 2007 2008 2009
Loans for house purchase Consumer credit
Notes: The net percentages refer to the difference between the sum of the percentages for “increased considerably” and “increased somewhat” and the sum of the percentages for “decreased somewhat” and “decreased considerably”. “Realised” values refer to the period in which the survey was conducted. “Expected” values refer to the expected changes over the next three months.
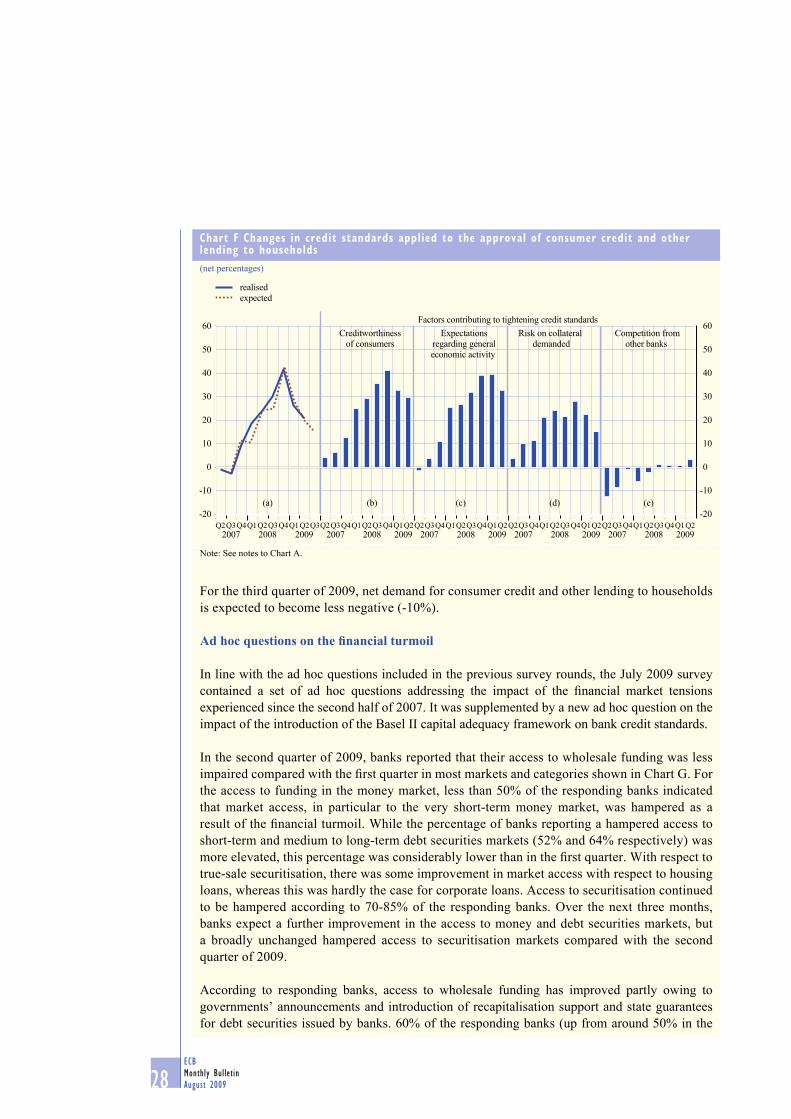
28ECB
Monthly Bulletin
August 2009
For the third quarter of 2009, net demand for consumer credit and other lending to households
is expected to become less negative (-10%).
Ad hoc questions on the fi nancial turmoil
In line with the ad hoc questions included in the previous survey rounds, the July 2009 survey
contained a set of ad hoc questions addressing the impact of the fi nancial market tensions
experienced since the second half of 2007. It was supplemented by a new ad hoc question on the
impact of the introduction of the Basel II capital adequacy framework on bank credit standards.
In the second quarter of 2009, banks reported that their access to wholesale funding was less
impaired compared with the fi rst quarter in most markets and categories shown in Chart G. For
the access to funding in the money market, less than 50% of the responding banks indicated
that market access, in particular to the very short-term money market, was hampered as a
result of the fi nancial turmoil. While the percentage of banks reporting a hampered access to
short-term and medium to long-term debt securities markets (52% and 64% respectively) was
more elevated, this percentage was considerably lower than in the fi rst quarter. With respect to
true-sale securitisation, there was some improvement in market access with respect to housing
loans, whereas this was hardly the case for corporate loans. Access to securitisation continued
to be hampered according to 70-85% of the responding banks. Over the next three months,
banks expect a further improvement in the access to money and debt securities markets, but
a broadly unchanged hampered access to securitisation markets compared with the second
quarter of 2009.
According to responding banks, access to wholesale funding has improved partly owing to
governments’ announcements and introduction of recapitalisation support and state guarantees
for debt securities issued by banks. 60% of the responding banks (up from around 50% in the
Chart F Changes in credit standards applied to the approval of consumer credit and other lending to households
(net percentages)
-20
-10
0
10
20
30
40
50
60
-20
-10
10
0
20
30
40
50
60
realised
expected
Factors contributing to tightening credit standards
Expectations
regarding general
economic activity
Creditworthiness
of consumers
Competition from
other banks
(d)
Risk on collateral
demanded
(e)(a) (b) (c)
Q2Q3Q4 Q2Q1 Q3 Q2Q1 Q3Q4 Q3Q2 Q4Q1
2007 2008 2009 2007 2008 2009 2007 2008 2009 2007 2008 2009 2007 2008 2009Q3Q2 Q1Q2Q4 Q3Q2 Q4Q1 Q3Q2 Q1Q2Q4 Q3Q2 Q4Q1 Q3Q2 Q1Q2Q4 Q3Q2 Q4Q1 Q3Q2 Q1Q2Q4
Note: See notes to Chart A.
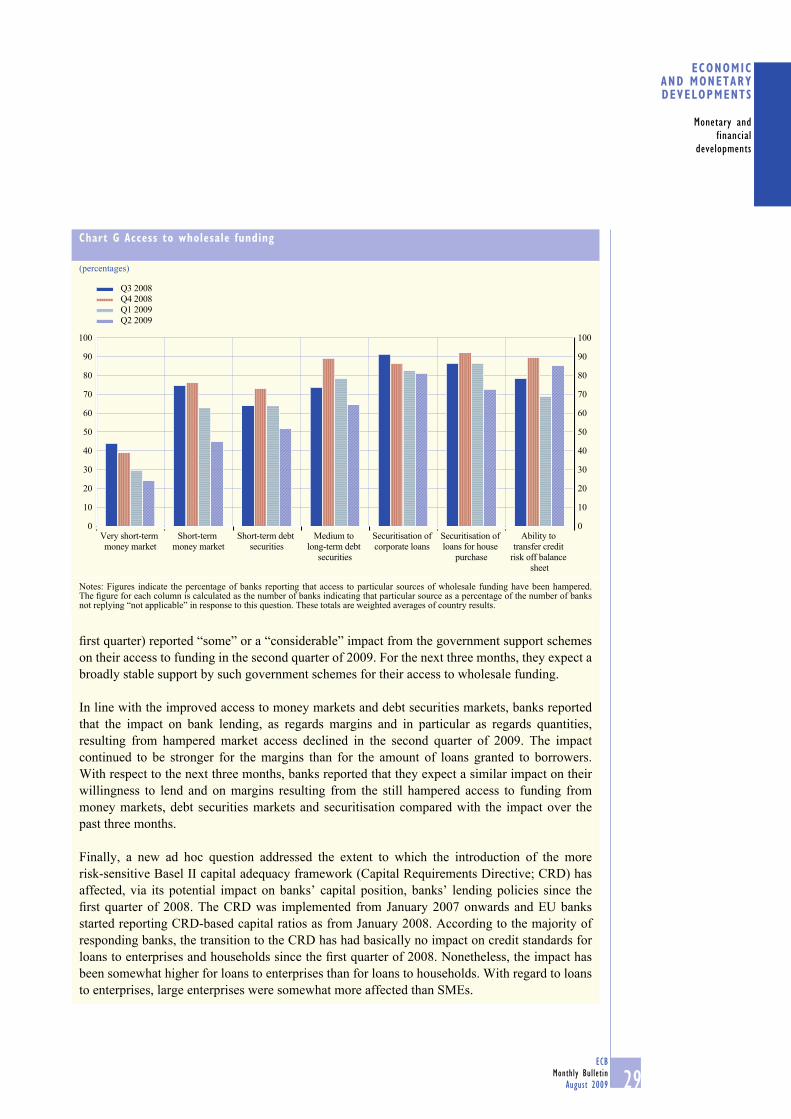
29ECB
Monthly Bulletin
August 2009
ECONOMIC AND MONETARYDEVELOPMENTS
Monetary and
financial
developments
fi rst quarter) reported “some” or a “considerable” impact from the government support schemes
on their access to funding in the second quarter of 2009. For the next three months, they expect a
broadly stable support by such government schemes for their access to wholesale funding.
In line with the improved access to money markets and debt securities markets, banks reported
that the impact on bank lending, as regards margins and in particular as regards quantities,
resulting from hampered market access declined in the second quarter of 2009. The impact
continued to be stronger for the margins than for the amount of loans granted to borrowers.
With respect to the next three months, banks reported that they expect a similar impact on their
willingness to lend and on margins resulting from the still hampered access to funding from
money markets, debt securities markets and securitisation compared with the impact over the
past three months.
Finally, a new ad hoc question addressed the extent to which the introduction of the more
risk-sensitive Basel II capital adequacy framework (Capital Requirements Directive; CRD) has
affected, via its potential impact on banks’ capital position, banks’ lending policies since the
fi rst quarter of 2008. The CRD was implemented from January 2007 onwards and EU banks
started reporting CRD-based capital ratios as from January 2008. According to the majority of
responding banks, the transition to the CRD has had basically no impact on credit standards for
loans to enterprises and households since the fi rst quarter of 2008. Nonetheless, the impact has
been somewhat higher for loans to enterprises than for loans to households. With regard to loans
to enterprises, large enterprises were somewhat more affected than SMEs.
Chart G Access to wholesale funding
(percentages)
0
10
20
30
40
50
60
70
80
90
100
0
10
20
30
40
50
60
70
80
90
100
Very short-term
money market
Short-term
money market
Short-term debt
securities
Medium to
long-term debt
securities
Securitisation of
corporate loans
Securitisation of
loans for house
purchase
Ability to
transfer credit
risk off balance
sheet
Q3 2008
Q4 2008
Q1 2009
Q2 2009
Notes: Figures indicate the percentage of banks reporting that access to particular sources of wholesale funding have been hampered. The fi gure for each column is calculated as the number of banks indicating that particular source as a percentage of the number of banks not replying “not applicable” in response to this question. These totals are weighted averages of country results.
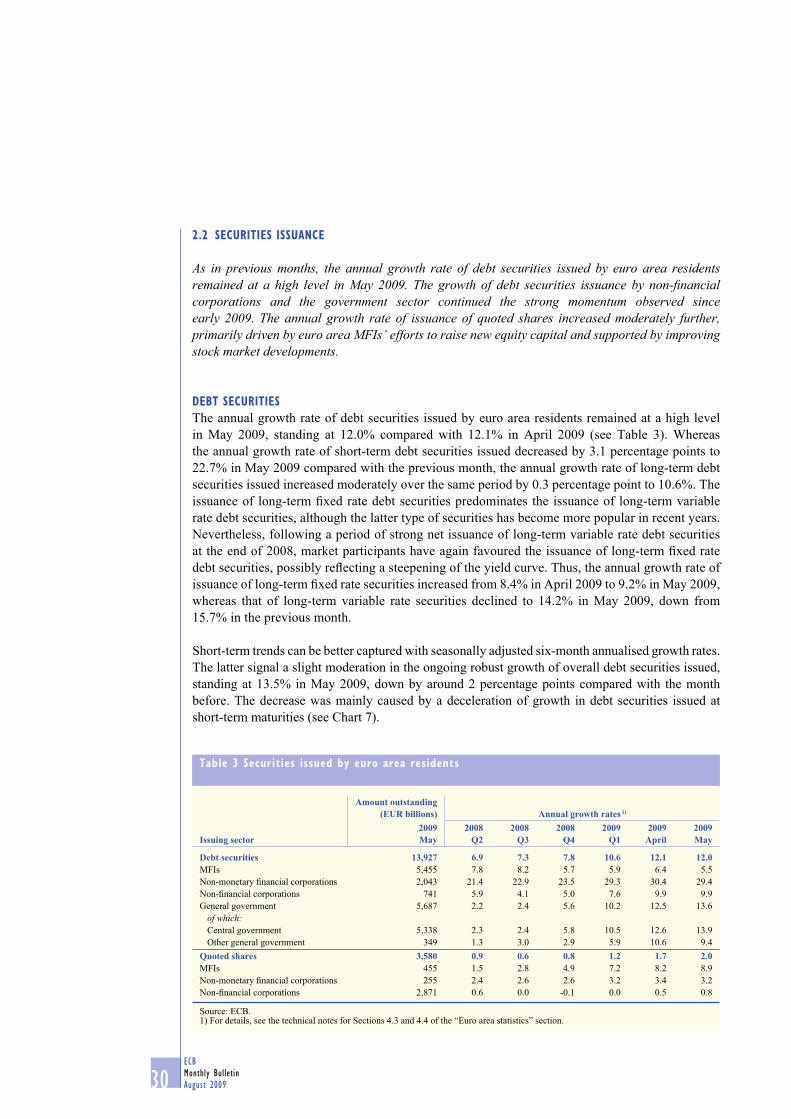
30ECB
Monthly Bulletin
August 2009
2.2 SECURITIES ISSUANCE
As in previous months, the annual growth rate of debt securities issued by euro area residents remained at a high level in May 2009. The growth of debt securities issuance by non-fi nancial corporations and the government sector continued the strong momentum observed since early 2009. The annual growth rate of issuance of quoted shares increased moderately further, primarily driven by euro area MFIs’ efforts to raise new equity capital and supported by improving stock market developments.
DEBT SECURITIES
The annual growth rate of debt securities issued by euro area residents remained at a high level
in May 2009, standing at 12.0% compared with 12.1% in April 2009 (see Table 3). Whereas
the annual growth rate of short-term debt securities issued decreased by 3.1 percentage points to
22.7% in May 2009 compared with the previous month, the annual growth rate of long-term debt
securities issued increased moderately over the same period by 0.3 percentage point to 10.6%. The
issuance of long-term fi xed rate debt securities predominates the issuance of long-term variable
rate debt securities, although the latter type of securities has become more popular in recent years.
Nevertheless, following a period of strong net issuance of long-term variable rate debt securities
at the end of 2008, market participants have again favoured the issuance of long-term fi xed rate
debt securities, possibly refl ecting a steepening of the yield curve. Thus, the annual growth rate of
issuance of long-term fi xed rate securities increased from 8.4% in April 2009 to 9.2% in May 2009,
whereas that of long-term variable rate securities declined to 14.2% in May 2009, down from
15.7% in the previous month.
Short-term trends can be better captured with seasonally adjusted six-month annualised growth rates.
The latter signal a slight moderation in the ongoing robust growth of overall debt securities issued,
standing at 13.5% in May 2009, down by around 2 percentage points compared with the month
before. The decrease was mainly caused by a deceleration of growth in debt securities issued at
short-term maturities (see Chart 7).
Table 3 Securities issued by euro area residents
Issuing sector
Amount outstanding (EUR billions) Annual growth rates 1)
2009May
2008Q2
2008Q3
2008Q4
2009Q1
2009April
2009May
Debt securities 13,927 6.9 7.3 7.8 10.6 12.1 12.0 MFIs 5,455 7.8 8.2 5.7 5.9 6.4 5.5
Non-monetary fi nancial corporations 2,043 21.4 22.9 23.5 29.3 30.4 29.4
Non-fi nancial corporations 741 5.9 4.1 5.0 7.6 9.9 9.9
General government 5,687 2.2 2.4 5.6 10.2 12.5 13.6
of which:Central government 5,338 2.3 2.4 5.8 10.5 12.6 13.9
Other general government 349 1.3 3.0 2.9 5.9 10.6 9.4
Quoted shares 3,580 0.9 0.6 0.8 1.2 1.7 2.0 MFIs 455 1.5 2.8 4.9 7.2 8.2 8.9
Non-monetary fi nancial corporations 255 2.4 2.6 2.6 3.2 3.4 3.2
Non-fi nancial corporations 2,871 0.6 0.0 -0.1 0.0 0.5 0.8
Source: ECB.1) For details, see the technical notes for Sections 4.3 and 4.4 of the “Euro area statistics” section.
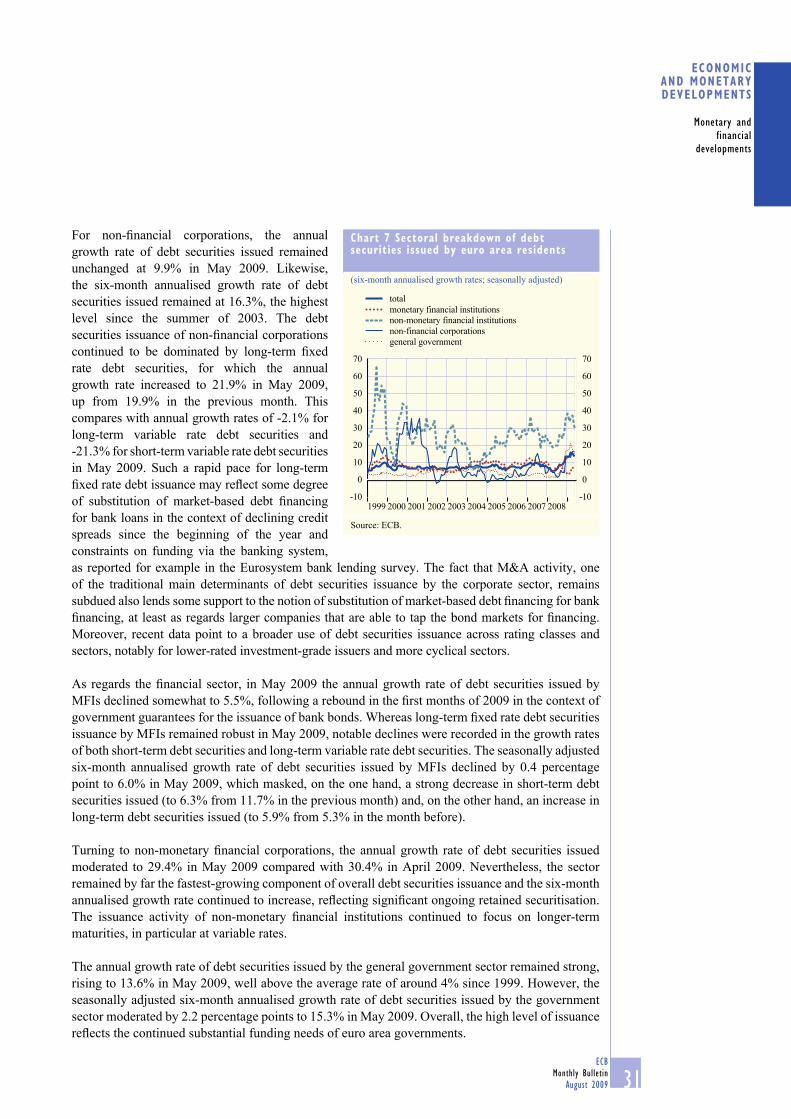
31ECB
Monthly Bulletin
August 2009
ECONOMIC AND MONETARYDEVELOPMENTS
Monetary and
financial
developments
For non-fi nancial corporations, the annual
growth rate of debt securities issued remained
unchanged at 9.9% in May 2009. Likewise,
the six-month annualised growth rate of debt
securities issued remained at 16.3%, the highest
level since the summer of 2003. The debt
securities issuance of non-fi nancial corporations
continued to be dominated by long-term fi xed
rate debt securities, for which the annual
growth rate increased to 21.9% in May 2009,
up from 19.9% in the previous month. This
compares with annual growth rates of -2.1% for
long-term variable rate debt securities and
-21.3% for short-term variable rate debt securities
in May 2009. Such a rapid pace for long-term
fi xed rate debt issuance may refl ect some degree
of substitution of market-based debt fi nancing
for bank loans in the context of declining credit
spreads since the beginning of the year and
constraints on funding via the banking system,
as reported for example in the Eurosystem bank lending survey. The fact that M&A activity, one
of the traditional main determinants of debt securities issuance by the corporate sector, remains
subdued also lends some support to the notion of substitution of market-based debt fi nancing for bank
fi nancing, at least as regards larger companies that are able to tap the bond markets for fi nancing.
Moreover, recent data point to a broader use of debt securities issuance across rating classes and
sectors, notably for lower-rated investment-grade issuers and more cyclical sectors.
As regards the fi nancial sector, in May 2009 the annual growth rate of debt securities issued by
MFIs declined somewhat to 5.5%, following a rebound in the fi rst months of 2009 in the context of
government guarantees for the issuance of bank bonds. Whereas long-term fi xed rate debt securities
issuance by MFIs remained robust in May 2009, notable declines were recorded in the growth rates
of both short-term debt securities and long-term variable rate debt securities. The seasonally adjusted
six-month annualised growth rate of debt securities issued by MFIs declined by 0.4 percentage
point to 6.0% in May 2009, which masked, on the one hand, a strong decrease in short-term debt
securities issued (to 6.3% from 11.7% in the previous month) and, on the other hand, an increase in
long-term debt securities issued (to 5.9% from 5.3% in the month before).
Turning to non-monetary fi nancial corporations, the annual growth rate of debt securities issued
moderated to 29.4% in May 2009 compared with 30.4% in April 2009. Nevertheless, the sector
remained by far the fastest-growing component of overall debt securities issuance and the six-month
annualised growth rate continued to increase, refl ecting signifi cant ongoing retained securitisation.
The issuance activity of non-monetary fi nancial institutions continued to focus on longer-term
maturities, in particular at variable rates.
The annual growth rate of debt securities issued by the general government sector remained strong,
rising to 13.6% in May 2009, well above the average rate of around 4% since 1999. However, the
seasonally adjusted six-month annualised growth rate of debt securities issued by the government
sector moderated by 2.2 percentage points to 15.3% in May 2009. Overall, the high level of issuance
refl ects the continued substantial funding needs of euro area governments.
Chart 7 Sectoral breakdown of debt securities issued by euro area residents
(six-month annualised growth rates; seasonally adjusted)
-10
0
10
20
30
40
50
60
70
-10
0
10
20
30
40
50
60
70
total
monetary financial institutions
non-monetary financial institutions
non-financial corporations
general government
1999 2000 2001 2002 2003 2004 2005 2006 2007 2008
Source: ECB.

32ECB
Monthly Bulletin
August 2009
QUOTED SHARES
The annual growth rate of quoted shares issued
by euro area residents continued to increase
moderately overall, reaching 2.0% in May 2009
(see Chart 8). While almost all sectors contributed
to this increase, the annual growth rate of equity
issuance by MFIs remained particularly high
at 8.9%, refl ecting the efforts of many euro
area banks to strengthen their balance sheets
by bolstering their capital bases. In addition,
the annual growth rate of quoted shares issued
by non-fi nancial corporations rose to 0.8% in
May 2009, possibly fostered by positive stock
market developments in recent months.
2.3 MONEY MARKET INTEREST RATES
Both unsecured and secured money market interest rates generally declined in July 2009. The spread between unsecured and secured interest rates at the three-month maturity also declined during that period, as unsecured rates fell faster than secured rates. The Eurosystem continued to provide the fi nancial system with abundant amounts of liquidity in July by means of fi xed rate tender procedures with full allotment in its main and longer-term refi nancing operations. In addition, in July the Eurosystem began conducting outright purchases of covered bonds in the context of the covered bond purchase programme decided in June.
Unsecured money market rates declined in July 2009. On 5 August the one-month, three-month,
six-month and twelve-month EURIBOR rates stood at 0.523%, 0.884%, 1.133% and 1.345%
respectively – i.e. 22, 20, 17 and 15 basis points below the levels observed on 1 July. The decline
was slightly more pronounced for shorter maturities, with the result that the spread between the
twelve-month and one-month EURIBOR rates rose slightly to stand at 82 basis points on 5 August,
compared with 76 basis points on 1 July (see Chart 9).
EONIA swap rates broadly declined in July, albeit at a slower pace than unsecured money market
interest rates. As a result, spreads between EURIBOR rates and EONIA swap rates also declined
in that month. For the three-month segment, this spread declined slightly, falling from 49 basis
points on 1 July to 42 basis points on 5 August, a level last seen in March 2008. It thereby reached
levels signifi cantly below those observed in the period following the intensifi cation of the fi nancial
turmoil in September 2008.
The interest rates implied by the prices of three-month EURIBOR futures maturing in
September 2009, December 2009 and March 2010 also declined slightly to stand at 0.875%, 1.060%
and 1.285% respectively on 5 August – i.e. 16 and 10 basis points below and 1 basis point above
the rates prevailing on 1 July.
Chart 8 Sectoral breakdown of quoted shares issued by euro area residents
(annual growth rates)
-4.0
-2.0
0.0
2.0
4.0
6.0
8.0
10.0
-4.0
-2.0
0.0
2.0
4.0
6.0
8.0
10.0
19992000 2001200220032004 20052006 20072008
total
monetary financial institutions
non-monetary financial institutions
non-financial corporations
Source: ECB.Note: Growth rates are calculated on the basis of fi nancial transactions.
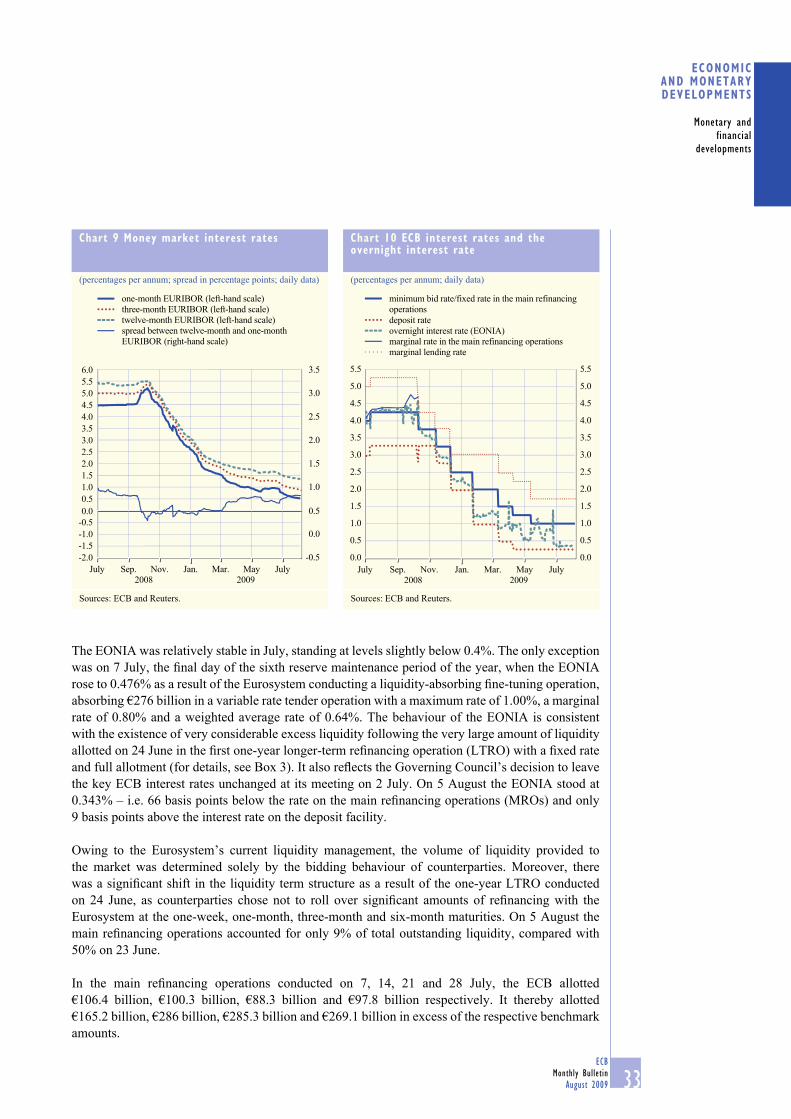
33ECB
Monthly Bulletin
August 2009
ECONOMIC AND MONETARYDEVELOPMENTS
Monetary and
financial
developments
The EONIA was relatively stable in July, standing at levels slightly below 0.4%. The only exception
was on 7 July, the fi nal day of the sixth reserve maintenance period of the year, when the EONIA
rose to 0.476% as a result of the Eurosystem conducting a liquidity-absorbing fi ne-tuning operation,
absorbing €276 billion in a variable rate tender operation with a maximum rate of 1.00%, a marginal
rate of 0.80% and a weighted average rate of 0.64%. The behaviour of the EONIA is consistent
with the existence of very considerable excess liquidity following the very large amount of liquidity
allotted on 24 June in the fi rst one-year longer-term refi nancing operation (LTRO) with a fi xed rate
and full allotment (for details, see Box 3). It also refl ects the Governing Council’s decision to leave
the key ECB interest rates unchanged at its meeting on 2 July. On 5 August the EONIA stood at
0.343% – i.e. 66 basis points below the rate on the main refi nancing operations (MROs) and only
9 basis points above the interest rate on the deposit facility.
Owing to the Eurosystem’s current liquidity management, the volume of liquidity provided to
the market was determined solely by the bidding behaviour of counterparties. Moreover, there
was a signifi cant shift in the liquidity term structure as a result of the one-year LTRO conducted
on 24 June, as counterparties chose not to roll over signifi cant amounts of refi nancing with the
Eurosystem at the one-week, one-month, three-month and six-month maturities. On 5 August the
main refi nancing operations accounted for only 9% of total outstanding liquidity, compared with
50% on 23 June.
In the main refi nancing operations conducted on 7, 14, 21 and 28 July, the ECB allotted
€106.4 billion, €100.3 billion, €88.3 billion and €97.8 billion respectively. It thereby allotted
€165.2 billion, €286 billion, €285.3 billion and €269.1 billion in excess of the respective benchmark
amounts.
Chart 9 Money market interest rates
(percentages per annum; spread in percentage points; daily data)
-2.0
-1.5
-1.0
-0.5
0.0
0.5
1.0
1.5
2.0
2.5
3.0
3.5
4.0
4.5
5.0
5.5
6.0
-0.5
0.0
0.5
1.0
1.5
2.0
2.5
3.0
3.5
one-month EURIBOR (left-hand scale)
three-month EURIBOR (left-hand scale)
twelve-month EURIBOR (left-hand scale)
spread between twelve-month and one-month
EURIBOR (right-hand scale)
July JulySep. Nov. Jan. Mar. May
2008 2009
Sources: ECB and Reuters.
Chart 10 ECB interest rates and the overnight interest rate
(percentages per annum; daily data)
0.0
0.5
1.0
1.5
2.0
2.5
3.0
3.5
4.0
4.5
5.0
5.5
0.0
0.5
1.0
1.5
2.0
2.5
3.0
3.5
4.0
4.5
5.0
5.5
minimum bid rate/fixed rate in the main refinancing
operations
deposit rate
overnight interest rate (EONIA)
marginal rate in the main refinancing operations
marginal lending rate
July Sep. Nov. Jan. Mar. May July
2008 2009
Sources: ECB and Reuters.

34ECB
Monthly Bulletin
August 2009
As regards longer-term operations, the ECB conducted three special LTROs with maturities of one,
three and six months, as well as a regular three-month LTRO. The ECB allotted €38.3 billion in the
special LTRO with a maturity of one month on 7 July, and €3 billion and €9 billion respectively
in the special LTROs with maturities of three and six months on 8 July. In the regular LTRO on
29 July the ECB allotted €9.5 billion. The net liquidity drain from the decline in the refi nancing
volumes of LTROs in the maintenance period starting on 8 July was around €48 billion.
As a result of the signifi cant decline in MRO allotment amounts, the amount of excess liquidity
in the euro area money markets declined gradually in the course of the month. Nevertheless,
counterparties generally obtained liquidity in excess of what would have been required in order
to fulfi l their reserve requirements and accommodate autonomous factors. Excess liquidity was
mainly absorbed by recourse to the deposit facility, which reached a record high of €316 billion
per day towards the end of the maintenance period ending on 7 July, marginally above its previous
peak in January. Daily recourse to the deposit facility stood at €133.4 billion at the beginning of
the maintenance period starting on 8 July, before rising fairly steadily thereafter. On 5 August daily
recourse to the deposit facility stood at €225.9 billion.
Furthermore, using its reciprocal currency arrangements (swap lines) with the Federal Reserve, the
Eurosystem continued to provide US dollar funding against collateral eligible in the Eurosystem,
conducting operations on 2, 9, 16, 23 and 30 July with various maturities. The ECB also continued
to provide Eurosystem counterparties with US dollar and Swiss franc funding against euro cash via
foreign exchange swap operations.
Finally, between 6 July and 5 August the central banks of the Eurosystem purchased eligible
covered bonds with an outstanding nominal value of €5.0 billion.
Box 3
THE IMPACT OF THE FIRST ONE-YEAR LONGER-TERM REFINANCING OPERATION
On 24 June 2009, in the context of its enhanced credit support, the Eurosystem conducted its fi rst
liquidity-providing longer-term refi nancing operation with a maturity of one year. This measure
is designed to improve banks’ liquidity positions on a longer-term basis, further promoting
the reduction of term spreads in the money market while encouraging banks to maintain and
increase their provision of credit to the real economy. This measure is fully in line with those
undertaken since October 2008, which have focused primarily on banks as the main source of
credit in the euro area economy. That fi rst one-year LTRO resulted in a record €442 billion being
allotted to the euro area banking system at a fi xed rate of 1%. This exceptional amount represents
around 1.4% of the total assets of euro area credit institutions as at June 2009 and mainly refl ects
banks’ current demand for liquidity available at longer horizons. This one-year operation, by
further alleviating the liquidity risk faced by banks, fulfi ls one of the conditions necessary in
order for banks to increase their provision of credit.
The one-year operation created a large liquidity surplus at the time of its allotment, which should,
in turn, encourage the expansion of credit by reducing the liquidity risks faced by banks. Having
peaked in January 2009, banks’ liquidity surplus – i.e. the difference between total outstanding

35ECB
Monthly Bulletin
August 2009
ECONOMIC AND MONETARYDEVELOPMENTS
Monetary and
financial
developments
liquidity and the actual liquidity needs of the system (calculated as the sum of net autonomous
factors and reserve requirements) – almost disappeared in the fi rst half of this year, before
increasing again to stand at a new record high following the one-year operation on 24 June.
Providing banks with large amounts of liquidity for one year at a favourable rate allows them
to build up liquidity buffers in case negative liquidity shocks occur over the maturity of the
operation. This, in turn, helps to enhance confi dence, thereby increasing banks’ willingness to
lend to the real economy.
The fact that this liquidity buffer is largely held in the deposit facility does not affect its
confi dence-enhancing impact in the presence of heightened liquidity risks. Recourse to the
deposit facility is mechanically linked to the liquidity surplus, as long as the deposit facility is
remunerated at more than 0%.1 Directly after the operation, given the duration of credit approval
processes and the lagged nature of reserve requirements, credit institutions deposited the surplus
liquidity in the deposit facility. The use of the deposit facility to accommodate variations in
surplus liquidity is naturally much more immediate than the process of initiating credit
expansion. Even if banks use these extra funds to increase credit to the real economy promptly,
as long as those funds end up in banks somewhere within the euro area banking system, surplus
liquidity will remain and the funds will still need to be deposited with the Eurosystem on a daily
basis. In the longer term, by contrast, banks can be expected to grant credit to the economy
and, at the same time, create deposits that are subject to reserve requirements. Thus, the reserve
base will gradually increase and lead to a decline in the liquidity surplus, all other things being
equal. However, this hinges on a broad set of economic determinants, as well as banks’ business
considerations. Just as an increase in lending does not necessarily imply a reduction in the use of
1 Instead of having recourse to the deposit facility, banks could place these funds in their current accounts, thereby either fulfi lling
their reserve requirements or increasing their excess reserves. Funds placed in the deposit facility are currently remunerated at a rate
of 0.25%, and funds used for the fulfi lment of minimum reserve requirements are remunerated at the rate on the main refi nancing
operations (currently 1%). By contrast, excess reserves on banks’ current accounts are not remunerated at all.
Recourse to the deposit facility and excess liquidity
(EUR billions)
-200
-150
-100
-50
0
50
100
150
200
250
300
350
-200
-150
-100
-50
0
50
100
150
200
250
300
350
deposit facilityexcess liquidity
2007 2008 2009
Sources: ECB and ECB calculations.Note: Excess liquidity is calculated as the difference between outstanding liquidity provided through Eurosystem operations and liquidity needs (measured as the sum of autonomous factors and reserve requirements).

36ECB
Monthly Bulletin
August 2009
2.4 BOND MARKETS
Bond markets showed mixed developments in July. At the same time, an increase in investor confi dence was also visible in the spreads of euro area government bonds versus German government bonds. Implied bond market volatility declined further in the euro area, although it increased somewhat in the United States.
Between end-June and 5 August, ten-year
government bond yields in the euro area
declined by 20 basis points, standing at 3.7%
on 5 August. In the United States meanwhile,
ten-year government bond yields increased
by about 20 basis points to stand at 3.8%
(see Chart 11). Accordingly, the ten-year
nominal interest rate differential between US
and euro area government bonds narrowed to
around -10 basis points. Developments in bond
markets during most of July were primarily
related to lower risk aversion and a more positive
assessment of the economic outlook. At the same
time, improvements in the euro area bond market
are also refl ected in the option-implied volatility,
which continued to decline further, reaching
levels last observed in the summer of 2008. This
is in contrast with the US bond market implied
volatility, which increased during July, reversing
the declines registered in June.
the deposit facility, conversely, a reduction in recourse to the deposit facility does not necessarily
imply increased lending to fi rms and households, as it may refl ect other adjustments to banks’
liquidity positions.
Thus, banks’ balance sheet developments need to be monitored carefully in order to obtain
indications as to the utilisation of the liquidity provided by the Eurosystem. What has been
observed so far is that the amounts deposited with the Eurosystem through the deposit facility
have developed in line with the size of the liquidity surplus in the period following Lehman
Brothers’ collapse and have increased markedly following the one-year operation carried out in
June (see chart).
To summarise, banks’ propensity to lend to the real economy does not follow from the amount
of surplus liquidity; rather, it depends on the extent to which there is an associated reduction in
liquidity risk, with markets assured that liquidity will be available in abundance over the maturity
of the operation in question. In this sense, the one-year operation conducted on 24 June should
help banks to increase their loans to the real economy, despite the fact that, at an aggregate level,
the excess liquidity generated by means of this operation is, for the time being, apparently being
absorbed by the deposit facility on a daily basis.
Chart 11 Long-term government bond yields
(percentages per annum; daily data)
2.00
2.50
3.00
3.50
4.00
4.50
5.00
1.00
1.50
2.00
2.50
3.00
3.50
4.00
Aug. Aug.
euro area (left-hand scale)
United States (left-hand scale)
Japan (right-hand scale)
Oct. Dec. Feb. Apr. June2008 2009
Sources: Bloomberg and Reuters.Note: Long-term government bond yields refer to ten-year bonds or to the closest available bond maturity.
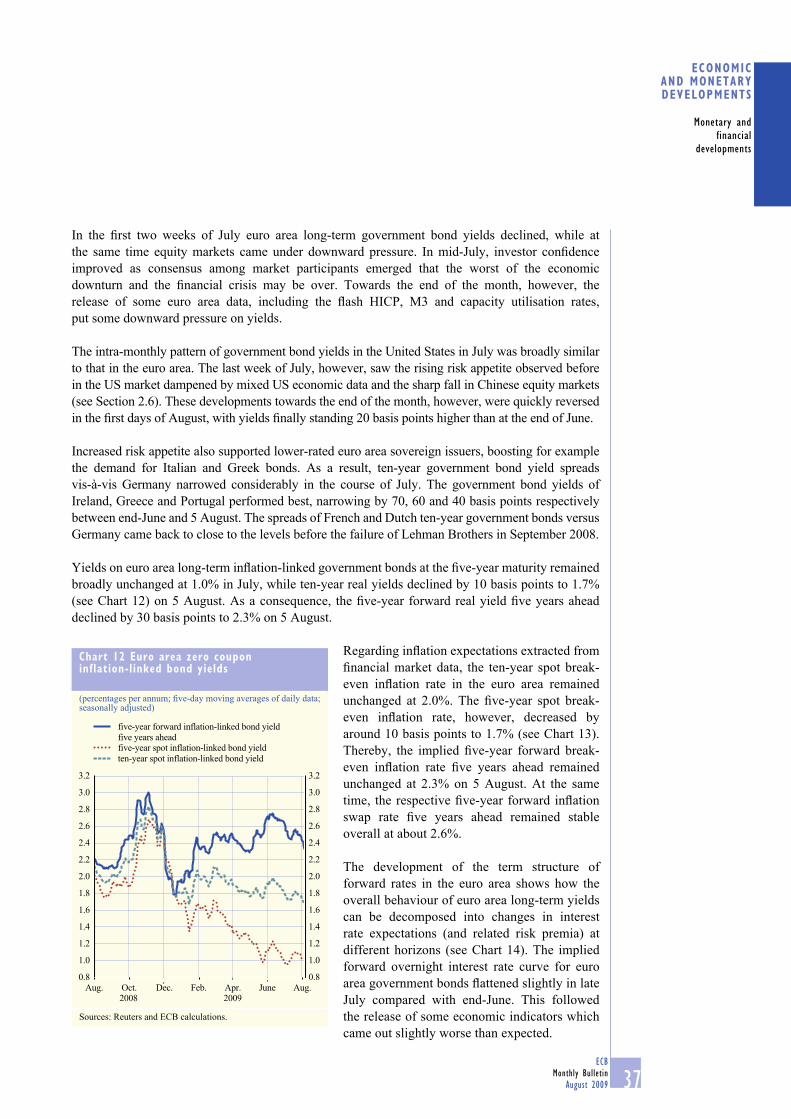
37ECB
Monthly Bulletin
August 2009
ECONOMIC AND MONETARYDEVELOPMENTS
Monetary and
financial
developments
In the fi rst two weeks of July euro area long-term government bond yields declined, while at
the same time equity markets came under downward pressure. In mid-July, investor confi dence
improved as consensus among market participants emerged that the worst of the economic
downturn and the fi nancial crisis may be over. Towards the end of the month, however, the
release of some euro area data, including the fl ash HICP, M3 and capacity utilisation rates,
put some downward pressure on yields.
The intra-monthly pattern of government bond yields in the United States in July was broadly similar
to that in the euro area. The last week of July, however, saw the rising risk appetite observed before
in the US market dampened by mixed US economic data and the sharp fall in Chinese equity markets
(see Section 2.6). These developments towards the end of the month, however, were quickly reversed
in the fi rst days of August, with yields fi nally standing 20 basis points higher than at the end of June.
Increased risk appetite also supported lower-rated euro area sovereign issuers, boosting for example
the demand for Italian and Greek bonds. As a result, ten-year government bond yield spreads
vis-à-vis Germany narrowed considerably in the course of July. The government bond yields of
Ireland, Greece and Portugal performed best, narrowing by 70, 60 and 40 basis points respectively
between end-June and 5 August. The spreads of French and Dutch ten-year government bonds versus
Germany came back to close to the levels before the failure of Lehman Brothers in September 2008.
Yields on euro area long-term infl ation-linked government bonds at the fi ve-year maturity remained
broadly unchanged at 1.0% in July, while ten-year real yields declined by 10 basis points to 1.7%
(see Chart 12) on 5 August. As a consequence, the fi ve-year forward real yield fi ve years ahead
declined by 30 basis points to 2.3% on 5 August.
Regarding infl ation expectations extracted from
fi nancial market data, the ten-year spot break-
even infl ation rate in the euro area remained
unchanged at 2.0%. The fi ve-year spot break-
even infl ation rate, however, decreased by
around 10 basis points to 1.7% (see Chart 13).
Thereby, the implied fi ve-year forward break-
even infl ation rate fi ve years ahead remained
unchanged at 2.3% on 5 August. At the same
time, the respective fi ve-year forward infl ation
swap rate fi ve years ahead remained stable
overall at about 2.6%.
The development of the term structure of
forward rates in the euro area shows how the
overall behaviour of euro area long-term yields
can be decomposed into changes in interest
rate expectations (and related risk premia) at
different horizons (see Chart 14). The implied
forward overnight interest rate curve for euro
area government bonds fl attened slightly in late
July compared with end-June. This followed
the release of some economic indicators which
came out slightly worse than expected.
Chart 12 Euro area zero coupon inflation-linked bond yields
(percentages per annum; fi ve-day moving averages of daily data; seasonally adjusted)
0.8
1.0
1.2
1.4
1.6
1.8
2.0
2.2
2.4
2.6
2.8
3.0
3.2
0.8
1.0
1.2
1.4
1.6
1.8
2.0
2.2
2.4
2.6
2.8
3.0
3.2
five-year forward inflation-linked bond yield
five years aheadfive-year spot inflation-linked bond yield
ten-year spot inflation-linked bond yield
Aug. Oct. Dec. Feb. Apr. June Aug.2008 2009
Sources: Reuters and ECB calculations.

38ECB
Monthly Bulletin
August 2009
Corporate bond spreads in the euro area continued to decline in July, falling in some cases back to
the levels that prevailed before the bankruptcy of Lehman Brothers. The observed trend towards
lower risk aversion, coupled with the more benign expectations about the economic outlook
which characterised the second quarter of 2009, continued in July. Once more, this is refl ected in
particular in the narrowing of corporate bond spreads for lower-investment-grade fi nancial bonds
and speculative-grade bonds.
2.5 INTEREST RATES ON LOANS AND DEPOSITS
In June 2009 most MFI interest rates on new loans to and deposits from households and non-fi nancial corporations decreased somewhat further. The downward trend in MFI interest rates that started in November 2008 is consistent with the reductions in key ECB interest rates and falls in money market rates and bond yields over this period, showing a degree of pass-through broadly in line with past patterns.
In June 2009 most short-term MFI interest rates on new loans and deposits were lower than in the
previous month, refl ecting a continued pass-through of the substantial decrease of money market
rates recorded since November 2008 (see Chart 15). Whereas in June 2009 most of the short-term
deposit rates declined slightly less than the three-month EURIBOR, with the exception of rates
Chart 13 Euro area zero coupon break-even inflation rates
(percentages per annum; fi ve-day moving averages of daily data; seasonally adjusted)
0.8
1.2
1.6
2.0
2.4
2.8
3.2
0.8
1.2
1.6
2.0
2.4
2.8
3.2
five-year forward break-even inflation rate
five years ahead
five-year spot break-even inflation rateten-year spot break-even inflation rate
0.4 0.4
Aug. Oct. Dec.
2008 2009Feb. Apr. June Aug.
Sources: Reuters and ECB calculations.
Chart 14 Implied forward euro area overnight interest rates
(percentages per annum; daily data)
0.0
1.0
2.0
3.0
4.0
5.0
6.0
0.0
1.0
2.0
3.0
4.0
5.0
6.0
2009
5 August 2009
30 June 2009
2011 2013 2015 2017 2019
Sources: ECB, EuroMTS (underlying data) and Fitch Ratings (ratings).Notes: The implied forward yield curve, which is derived from the term structure of interest rates observed in the market, refl ects market expectations of future levels for short-term interest rates. The method used to calculate these implied forward yield curves is outlined in the “Euro area yield curve” section of the ECB’s website. The data used in the estimate are euro area AAA-rated government bond yields.
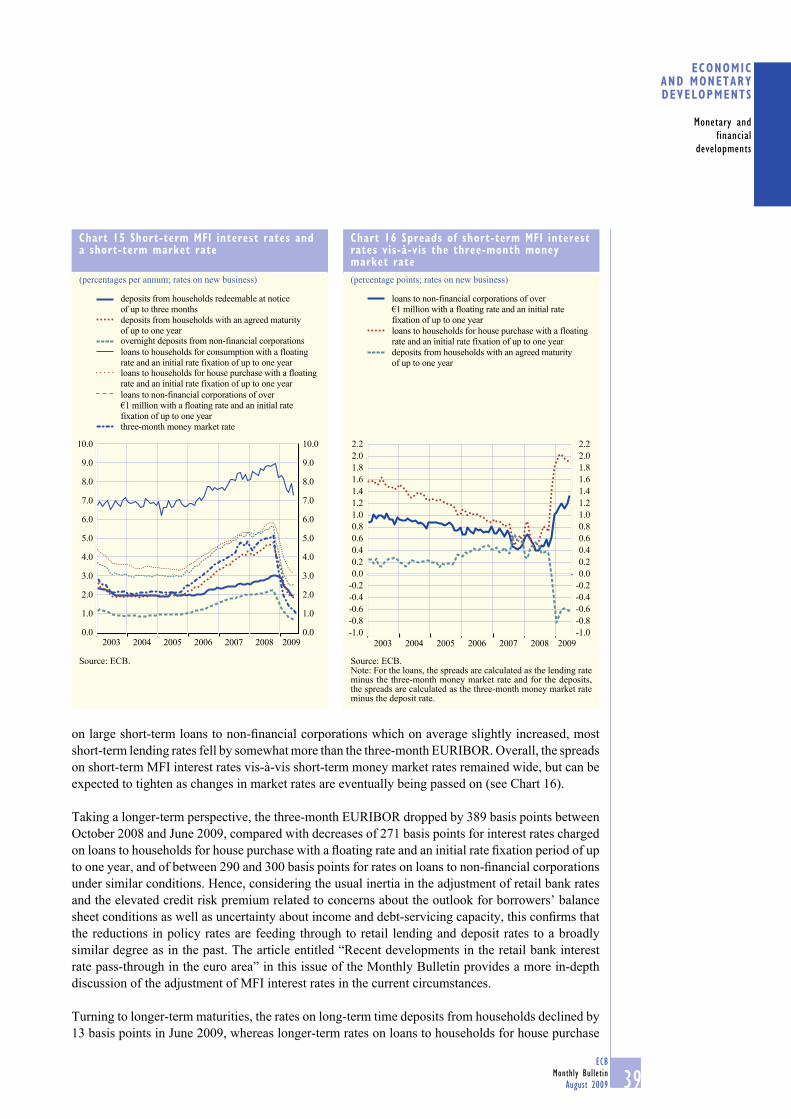
39ECB
Monthly Bulletin
August 2009
ECONOMIC AND MONETARYDEVELOPMENTS
Monetary and
financial
developments
on large short-term loans to non-fi nancial corporations which on average slightly increased, most
short-term lending rates fell by somewhat more than the three-month EURIBOR. Overall, the spreads
on short-term MFI interest rates vis-à-vis short-term money market rates remained wide, but can be
expected to tighten as changes in market rates are eventually being passed on (see Chart 16).
Taking a longer-term perspective, the three-month EURIBOR dropped by 389 basis points between
October 2008 and June 2009, compared with decreases of 271 basis points for interest rates charged
on loans to households for house purchase with a fl oating rate and an initial rate fi xation period of up
to one year, and of between 290 and 300 basis points for rates on loans to non-fi nancial corporations
under similar conditions. Hence, considering the usual inertia in the adjustment of retail bank rates
and the elevated credit risk premium related to concerns about the outlook for borrowers’ balance
sheet conditions as well as uncertainty about income and debt-servicing capacity, this confi rms that
the reductions in policy rates are feeding through to retail lending and deposit rates to a broadly
similar degree as in the past. The article entitled “Recent developments in the retail bank interest
rate pass-through in the euro area” in this issue of the Monthly Bulletin provides a more in-depth
discussion of the adjustment of MFI interest rates in the current circumstances.
Turning to longer-term maturities, the rates on long-term time deposits from households declined by
13 basis points in June 2009, whereas longer-term rates on loans to households for house purchase
Chart 15 Short-term MFI interest rates and a short-term market rate
(percentages per annum; rates on new business)
0.0
1.0
2.0
3.0
4.0
5.0
6.0
7.0
8.0
9.0
10.0
0.0
1.0
2.0
3.0
4.0
5.0
6.0
7.0
8.0
9.0
10.0
deposits from households redeemable at notice
of up to three months
deposits from households with an agreed maturity
of up to one yearovernight deposits from non-financial corporations
loans to households for consumption with a floating
rate and an initial rate fixation of up to one yearloans to households for house purchase with a floating
rate and an initial rate fixation of up to one year
loans to non-financial corporations of over
€1 million with a floating rate and an initial rate
fixation of up to one year
three-month money market rate
2003 2004 2005 2006 2007 2008 2009
Source: ECB.
Chart 16 Spreads of short-term MFI interest rates vis-à-vis the three-month money market rate
(percentage points; rates on new business)
-1.0
-0.8
-0.6
-0.4
-0.2
0.0
0.2
0.4
0.6
0.8
1.0
1.2
1.4
1.6
1.8
2.0
2.2
-1.0
-0.8
-0.6
-0.4
-0.2
0.0
0.2
0.4
0.6
0.8
1.0
1.2
1.4
1.6
1.8
2.0
2.2
loans to non-financial corporations of over
€1 million with a floating rate and an initial rate
fixation of up to one year
loans to households for house purchase with a floating
rate and an initial rate fixation of up to one year
deposits from households with an agreed maturity
of up to one year
2003 2004 2005 2006 2007 2008 2009
Source: ECB.Note: For the loans, the spreads are calculated as the lending rate minus the three-month money market rate and for the deposits, the spreads are calculated as the three-month money market rate minus the deposit rate.

40ECB
Monthly Bulletin
August 2009
and on small loans to non-fi nancial corporations
remained broadly unchanged in the same month.
By contrast, in June 2009 large long-term loans
declined by some 30 basis points. This compares
with a slight increase in fi ve-year government
bond yields in June 2009.
From a longer-term perspective, the continued
downward trend in most long-term MFI
interest rates recorded since mid-2008
should be viewed against the background
of the substantial declines in long-term
market rates. For example, by June 2009 the
fi ve-year government bond yield stood
161 basis points lower than the level observed
in June 2008, whereas over the same period
MFI interest rates on long-term deposits
from non-fi nancial corporations and from
households fell by 193 and 99 basis points
respectively. Between mid-2008 and June 2009
long-term interest rates on small and large
loans to non-fi nancial corporations declined
by 94 and 184 basis points, respectively. By
contrast, long-term loans to households for
house purchase (with over fi ve and up to ten
years’ initial rate fi xation) only declined by
57 basis points over the same period, indicating a substantial widening of the lending spread for
this category. Overall, these developments might refl ect, on the one hand, the typical sluggish
adjustment of retail bank interest rates to changes in market rates and, on the other hand, some
widening of credit risk premia in light of the ongoing economic slowdown.
Euro area banks’ profi tability depends inter alia on loan-deposit margins on outstanding amounts
and on new business rates. Between February and June 2009 both measures remained broadly
unchanged. This refl ects the fact that banks have passed on the recent reductions in policy rates
to their retail lending and deposit rates to a similar degree. Nonetheless, loan-deposit margins are
currently well below the levels recorded prior to the fi nancial turmoil. This reduction in loan-deposit
margins may, in particular, refl ect banks’ tendency during the crisis to offer higher deposit rates in
order to attract retail deposits to substitute for wholesale funding. At the same time, evidence from
corporate reports shows that a number of banks have recently been able to generate signifi cant
income from other businesses.
2.6 EQUITY MARKETS
Global stock prices increased in the course of July, reaching the highest values of the year. Favourable earnings announcements and a more positive market assessment of the economic outlook underlie these developments. Stock price increases have been broadly based across all sectors. Implied stock market volatility continued to decline on both sides of the Atlantic.
Chart 17 Long-term MFI interest rates and a long-term market rate
(percentages per annum; rates on new business)
2.0
2.5
3.0
3.5
4.0
4.5
5.0
5.5
6.0
2.0
2.5
3.0
3.5
4.0
4.5
5.0
5.5
6.0
2008 2009
deposits from non-financial corporations with
an agreed maturity of over two years
deposits from households with an agreed maturity
of over two years
loans to non-financial corporations of over €1 million
with an initial rate fixation of over five years
loans to households for house purchase with an initial
rate fixation of over five and up to ten yearsfive-year government bond yield
2003 2004 2005 2006 2007
Source: ECB.

41ECB
Monthly Bulletin
August 2009
ECONOMIC AND MONETARYDEVELOPMENTS
Monetary and
financial
developments
Between the end of June and 5 August, euro area stock prices, as measured by the broad-based
Dow Jones EURO STOXX index, increased by around 11% (see Chart 18). Over the same period,
stock prices in the United States, as measured by the Standard & Poor’s 500 index, increased by
around 9%, while in Japan stock prices, as measured by the Nikkei 225 index, rose by around 4%.
Favourable earnings announcements for the second quarter of 2009 in the United States, together
with the more positive assessment of the US economic outlook by the Federal Open Market
Committee, and higher than expected GDP growth fi gures for China in the second quarter of 2009
have been the major drivers of recent developments in world stock markets. Short-term market
uncertainty, as measured by option-implied volatility, continued to decline on both sides of the
Atlantic, reaching levels last seen in the summer of 2008 (see Chart 19).
Following a disappointing performance at the beginning of the month, positive macroeconomic
news, coupled with improvements in expectations about economic activity, helped equity prices
to pick up steadily from the second week of July. This upward trend was only briefl y interrupted
towards the end of the month, following the release of some economic data and the sharp fall
in Chinese equity markets. Improvements in share prices were broadly based across sectors. In
the euro area, share prices for the fi nancial sector increased by 14% compared with 8% for the
non-fi nancial sector. This is in line with developments in the United States where share prices
increased by 17% and 8% for the fi nancial and non-fi nancial sector respectively.
Actual and expected earnings growth for euro area listed companies remained depressed in July.
Actual annual earnings-per-share growth for the fi rms covered by the Dow Jones EURO STOXX
Chart 18 Stock price indices
(index: 1 August 2008 = 100; daily data)
40
60
80
100
120
40
60
80
100
120
Aug. Aug.
euro area
United States
Japan
Oct. Dec. Feb. Apr. June
2008 2009
Sources: Reuters and Thomson Financial Datastream.Note: The indices used are the Dow Jones EURO STOXX broad index for the euro area, the Standard & Poor’s 500 index for the United States and the Nikkei 225 index for Japan.
Chart 19 Implied stock market volatility
(percentages per annum; fi ve-day moving average of daily data)
10
20
30
40
50
60
70
80
90
100
10
20
30
40
50
60
70
80
90
100
euro areaUnited States
Japan
Aug. Oct. Dec. Feb. Apr. June Aug.
2008 2009
Source: Bloomberg.Notes: The implied volatility series refl ects the expected standard deviation of percentage changes in stock prices over a period of up to three months, as implied in the prices of options on stock price indices. The equity indices to which the implied volatilities refer are the Dow Jones EURO STOXX 50 for the euro area, the Standard & Poor’s 500 for the United States and the Nikkei 225 for Japan.

42ECB
Monthly Bulletin
August 2009
index came to -36.9% in July, after -35.9% in June. However, the expected growth of earnings
per share 12 months ahead was forecasted to improve to 2.2%, compared with -1.2% in June. For
the fi rst time since the summer of 2008, a positive trend in expected growth of earnings per share
12 months ahead has been recorded for both the non-fi nancial and fi nancial sectors. At the same
time, the euro area price/earnings ratio remains slightly below its historical average.
Box 4
INTEGRATED EURO AREA ACCOUNTS FOR THE FIRST QUARTER OF 2009
The integrated euro area accounts released on 30 July 2009 offer comprehensive and consistent
information on the income, spending, fi nancing and portfolio decisions of all sectors of the euro
area economy up to the fi rst quarter of 2009,1 and show how economic agents have reacted
to the acute contraction of activity brought about by the intensifi cation of the fi nancial crisis
and the associated rise in uncertainty since September 2008. Relative to other data sources,
the euro area accounts offer three main benefi ts. First, they include some new information
not previously reported, in particular on the non-fi nancial private sectors (households and
non-fi nancial corporations). Second, they contain consistent information on each institutional
sector taken as a whole, integrating the fi nancial and non-fi nancial sides of the accounts. Third,
they bring together the data within a unifi ed framework, thus enhancing the scope for analysing
interactions between fi nancial and real
economy variables, as well as interrelations
across institutional sectors.2
Following a moderate cyclical slowdown
in production and income up to the summer
of 2008, the euro area economy recorded
an exceptionally large contraction of activity
in the fourth quarter of 2008 and in the fi rst
quarter of 2009, when disposable income
of the euro area as a whole experienced the
largest annual nominal decline on record,
impacting all sectors, with the non-fi nancial
corporations sector the most severely affected
(see Chart A).
Behaviour of institutional sectors
In the fi rst quarter of 2009, the growth of households’ nominal income declined again, continuing along the path of rapid slowdown that had started in the last quarter of 2008. The pronounced deceleration in the growth
1 These data can be found on the ECB’s website at http://sdw.ecb.europa.eu/browse.do?node=2019181.
2 For an introduction to the euro area accounts, see the article entitled “The introduction of quarterly sectoral accounts statistics for the
euro area” in the November 2007 issue of the Monthly Bulletin.
Chart A Euro area gross disposable income-contribution by sectors
(annual percentage changes; percentage point contributions)
-5
-3
-1
1
3
5
7
-5
-3
-1
1
3
5
7
households
non-financial corporationsfinancial corporations
government
euro area economy
2000 2001 2002 2003 2004 2005 2006 2007 2008
Sources: Eurostat and ECB.
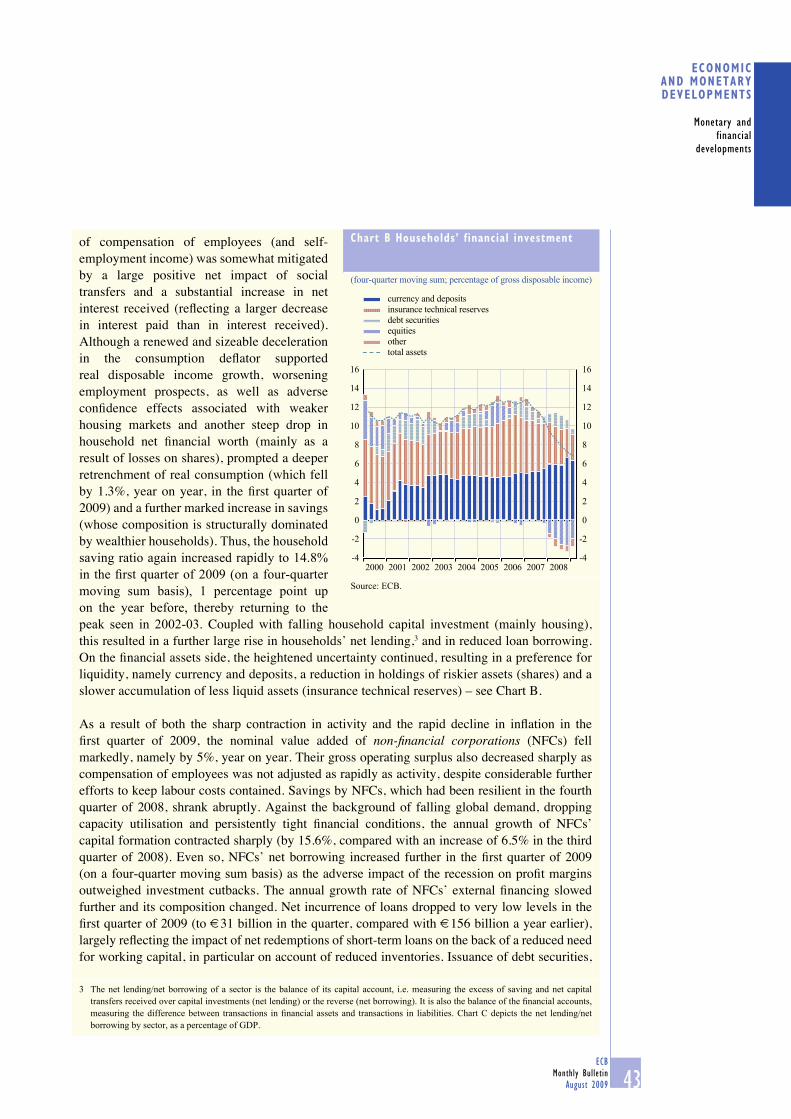
43ECB
Monthly Bulletin
August 2009
ECONOMIC AND MONETARYDEVELOPMENTS
Monetary and
financial
developments
of compensation of employees (and self-employment income) was somewhat mitigated by a large positive net impact of social transfers and a substantial increase in net interest received (refl ecting a larger decrease in interest paid than in interest received). Although a renewed and sizeable deceleration in the consumption defl ator supported real disposable income growth, worsening employment prospects, as well as adverse confi dence effects associated with weaker housing markets and another steep drop in household net fi nancial worth (mainly as a result of losses on shares), prompted a deeper retrenchment of real consumption (which fell by 1.3%, year on year, in the fi rst quarter of 2009) and a further marked increase in savings (whose composition is structurally dominated by wealthier households). Thus, the household
saving ratio again increased rapidly to 14.8%
in the fi rst quarter of 2009 (on a four-quarter
moving sum basis), 1 percentage point up
on the year before, thereby returning to the
peak seen in 2002-03. Coupled with falling household capital investment (mainly housing), this resulted in a further large rise in households’ net lending,3 and in reduced loan borrowing. On the fi nancial assets side, the heightened uncertainty continued, resulting in a preference for liquidity, namely currency and deposits, a reduction in holdings of riskier assets (shares) and a slower accumulation of less liquid assets (insurance technical reserves) – see Chart B.
As a result of both the sharp contraction in activity and the rapid decline in infl ation in the fi rst quarter of 2009, the nominal value added of non-fi nancial corporations (NFCs) fell markedly, namely by 5%, year on year. Their gross operating surplus also decreased sharply as compensation of employees was not adjusted as rapidly as activity, despite considerable further efforts to keep labour costs contained. Savings by NFCs, which had been resilient in the fourth quarter of 2008, shrank abruptly. Against the background of falling global demand, dropping capacity utilisation and persistently tight fi nancial conditions, the annual growth of NFCs’ capital formation contracted sharply (by 15.6%, compared with an increase of 6.5% in the third quarter of 2008). Even so, NFCs’ net borrowing increased further in the fi rst quarter of 2009 (on a four-quarter moving sum basis) as the adverse impact of the recession on profi t margins outweighed investment cutbacks. The annual growth rate of NFCs’ external fi nancing slowed further and its composition changed. Net incurrence of loans dropped to very low levels in the fi rst quarter of 2009 (to €31 billion in the quarter, compared with €156 billion a year earlier), largely refl ecting the impact of net redemptions of short-term loans on the back of a reduced need for working capital, in particular on account of reduced inventories. Issuance of debt securities,
3 The net lending/net borrowing of a sector is the balance of its capital account, i.e. measuring the excess of saving and net capital
transfers received over capital investments (net lending) or the reverse (net borrowing). It is also the balance of the fi nancial accounts,
measuring the difference between transactions in fi nancial assets and transactions in liabilities. Chart C depicts the net lending/net
borrowing by sector, as a percentage of GDP.
Chart B Households’ financial investment
(four-quarter moving sum; percentage of gross disposable income)
-4
-2
4
6
8
10
12
14
16
-2
4
6
8
10
12
14
16
currency and deposits
insurance technical reserves
debt securities
equities
other
total assets
2000 2001 2002 2003 2004 2005 2006 2007 2008
0
2
0
2
-4
Source: ECB.
44ECB
Monthly Bulletin
August 2009
by contrast, picked up further in the fi rst quarter of 2009, rebounding strongly after the complete freeze observed in the securities market in the wake of the bankruptcy of Lehman Brothers. The reopening of this market, albeit at high yields, offered an attractive substitute for bank fi nancing, with banks arranging issuance for a fee, instead of carrying assets on their balance sheets. The dynamic issuing activity probably also refl ected a growing need for fi nance by fi rms that had postponed issuance in the fi rst part of 2008, or attempts to lock in more favourable fi nancing conditions in the corporate bond market. Similarly, issuance of quoted shares picked up as well. At the same time, NFCs again reduced their net purchases of quoted equity in the fi rst quarter of 2009, and continued to draw down their liquidity buffers, as their accumulation of deposits decelerated further, while the pace of net disposals of securities and mutual fund shares slowed down.
The further and rapid deterioration of the general government accounts largely refl ected the impact of automatic stabilisers, with an increase in the growth of social benefi t expenditure, a sharp decline in the growth of social contributions, falling indirect taxes and declining direct taxes on households and NFCs. Treasuries continued to step up their debt issuance considerably in the fi rst quarter of 2009, in order to fi nance not only existing defi cits, but also the large-scale purchases of assets (loans, debt securities and unquoted equity) carried out in the context of fi nancial rescue packages (around €190 billion in the fourth quarter alone) and massive accumulation of cash. This increasing net debt issuance was absorbed by accelerated MFI purchases, seeking safe placements, rather than directly by households, while non-residents likewise remained large-scale purchasers thereof.
The disposable income of fi nancial corporations contracted, albeit less rapidly than in the fourth quarter of 2008, but remained at a high level. This decline was due mainly to reduced net interest earned, while the gross operating surplus grew solidly, the latter refl ecting increased bank margins on deposits and loans (which, according to national accounts conventions, are not recorded under “interest” – but rather as “output”, thus entering value added) and falling compensation of employees. In the context of ongoing pressures for deleveraging, additions to their balance sheets decreased markedly (at less than €100 billion per quarter in the fourth quarter of 2008 and the fi rst quarter of 2009, compared with up to €1 trillion per quarter during the preceding leverage boom) and entailed a shift towards safer assets, with massive acquisitions of government securities and a general reduction of cross-border exposures.
Euro area income and net lending/net borrowing
Gross disposable income in the euro area fell by 3.8%, year on year, in nominal terms in the
fi rst quarter of 2009 (after -0.1% in the fourth quarter of 2008 and +3.0% in the third quarter of
2008), on the back of the sharp contraction in nominal GDP. The disposable income of NFCs,
which had hitherto held up well, shrank by 22.9%, year on year, in the fi rst quarter of 2009
(after -2.9% in the fourth quarter of 2008). Household income growth continued to decelerate,
with year-on-year growth standing at 1.1% (after 2.7% in the fourth quarter of 2008 and 4.7%
in the third quarter). Government gross disposable income again dropped sharply, namely by
8.6%, year on year, in the fi rst quarter of 2009, after -5.2% in the fourth quarter of 2008. The
net disposable income of fi nancial corporations also fell in year-on-year terms in the fi rst quarter
of 2009 (see Chart A).

45ECB
Monthly Bulletin
August 2009
ECONOMIC AND MONETARYDEVELOPMENTS
Monetary and
financial
developments
The decline in gross saving for the euro area
as a whole accelerated dramatically in the fi rst
quarter of 2009 (to -18.8%, year on year, after
-7.6% in the fourth quarter of 2008), with the
sharp reduction in saving by the government
and NFCs (in roughly equal measure) more
than compensating for increased household
saving. Gross fi xed capital formation in the
euro area, which had started abruptly to fall
on a year-on-year basis in the fourth quarter
of 2008, contracted more rapidly in the fi rst
quarter of 2009, namely by 10.6%. Nominal
capital investment was retrenched in the case
of both households (residential investment and
capital formation by unincorporated businesses,
-11.6% in the year to the fi rst quarter of 2009)
and NFCs (-12.8%, after -4.9% in the fourth
quarter of 2008 and +5.8% in the third quarter
of 2008).
As saving contracted more than capital
investment, net lending/net borrowing in
the euro area deteriorated yet again, to a defi cit of 1.4% of GDP in the fi rst quarter of 2009
on a four-quarter moving sum basis. This development over one-and-a-half years was due,
in about equal measure, to a deterioration of the trade balance and to reduced net property
income received. From a sectoral point of view, the negative trend in euro area net lending/net
borrowing refl ects the sharp increase in net borrowing by the government sector, which was
higher than the increase in net lending by households (see Chart D).
The euro area thus again had a net fi nancing requirement. The protracted fi nancial turbulence led
to a considerable slowdown in gross cross-border transactions in both the fourth quarter of 2008
and the fi rst quarter of 2009. As interbank cross-border relationships were seriously affected
by the insolvency of Lehman Brothers, substantial redemptions of interbank deposits were
reported, after elevated “net infl ows” (i.e. infl ows net of outfl ows) in the three previous quarters.
Accelerated net infl ows in debt securities compensated for these signifi cantly reduced net infl ows
in deposits. Furthermore, the euro area recorded net annual outfl ows in equity securities (notably
quoted shares) and loans.
Non-fi nancial sectors fi nancing and the fi nancial markets
After the rebound observed in the fourth quarter of 2008, caused by very active government debt
issuance, the annual rate of growth in the total fi nancing of the non-fi nancial sectors resumed its
course of gradual moderation, as non-government fi nancing continued to slow down.4 On the
fi nancial investment side, net acquisitions of fi nancial assets by the non-fi nancial sectors slowed
down as well, after a government-driven rebound in the fourth quarter of 2008.
4 The annual growth rate of total fi nancing available from the euro area accounts is more subdued than the growth rate of the fi nancing
components available from both the ECB’s money and banking statistics and its securities statistics, owing to a broader coverage and
other methodological differences.
Chart C Euro area net lending/net borrowing
(as a percent of GDP; four-quarter moving sum)
-6
-4
-2
0
2
4
6
-6
-4
-2
0
2
4
6
households
non-financial corporationsfinancial corporations
government
euro area economy
2000 2001 2002 2003 2004 2005 2006 2007 2008
Sources: Eurostat and ECB.

46ECB
Monthly Bulletin
August 2009
Viewed in terms of individual instruments,
the market for debt securities saw a further
massive increase in net issuance by the
government. MFIs were large net purchasers
of debt securities (notably government debt
securities), while their net issuance remained
negative for the second consecutive quarter.
NFCs, too, increased their net issuance. The
rest of the world expanded its net purchases,
while purchases by both households and
insurance corporations and pension funds
declined. In the market for mutual funds, net
redemptions accelerated (with considerable
redemptions in non-money market mutual
fund shares). In the market for quoted shares,
there was a resumption of net issuance by
NFCs and fi nancial corporations. NFCs
diminished their purchases, and households
and the rest of the world suspended their
massive selling, while MFIs continued to sell
holdings of quoted shares.
Balance sheet dynamics dominated by holding losses
Balance sheet movements were often dominated by valuation changes, i.e. holding gains or
losses, during recent quarters. In particular, falling global equity prices had a negative impact
on the net fi nancial worth 5 of households, in the order of a cumulated €1.1 trillion in the year up
to the fi rst quarter of 2009. Chart D shows the contributions of fi nancial transactions (i.e. the net
lending/net borrowing) and other economic fl ows (mostly holding gains or losses) to the change
in the net fi nancial worth of households. Valuation changes (and other fl ows) constitute the most
volatile component of the change in their net fi nancial worth. At the same time, in the bond
market, increases in the prices of government bonds (and exchange rate effects) over the three
most recent quarters translated into substantial holding gains, which offset the large holding
losses on the “toxic assets” held by fi nancial corporations.6
5 Defi ned as the difference between fi nancial assets and liabilities.
6 It should be noted that, where loans are concerned, which are valued at nominal value in the ESA 95, impairment only has an impact on
the fi nancial wealth of creditors when they are actually written off, so that there is generally a noticeable delay.
Chart D Change in net financial worth of households
(four-quarter moving sum; percentage of gross disposable income)
-15
-10
-5
0
5
10
15
20
-15
-10
-5
0
5
10
15
20
2000 2001 2002 2003 2004 2005 2006 2007 2008
other (mainly holding gains and losses)
net transactions in financial instruments
change in net financial worth
Source: ECB.
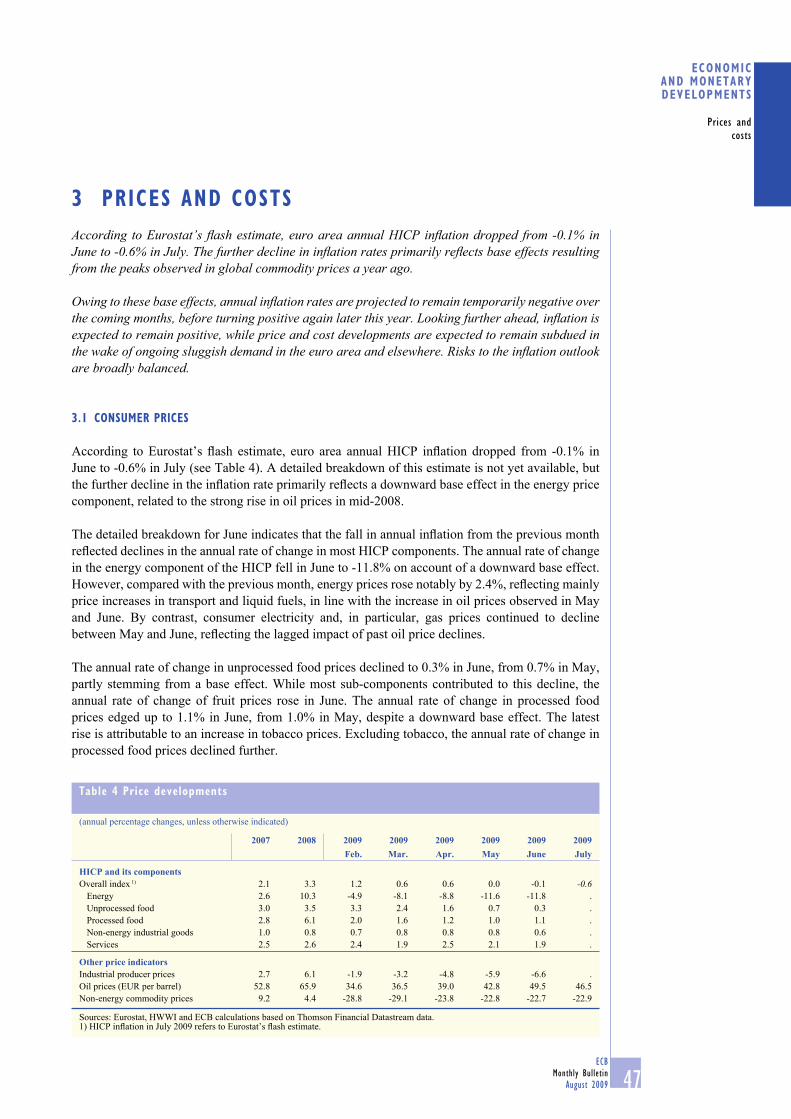
47ECB
Monthly Bulletin
August 2009
ECONOMIC AND MONETARYDEVELOPMENTS
Prices and
costs
According to Eurostat’s fl ash estimate, euro area annual HICP infl ation dropped from -0.1% in June to -0.6% in July. The further decline in infl ation rates primarily refl ects base effects resulting from the peaks observed in global commodity prices a year ago.
Owing to these base effects, annual infl ation rates are projected to remain temporarily negative over the coming months, before turning positive again later this year. Looking further ahead, infl ation is expected to remain positive, while price and cost developments are expected to remain subdued in the wake of ongoing sluggish demand in the euro area and elsewhere. Risks to the infl ation outlook are broadly balanced.
3.1 CONSUMER PRICES
According to Eurostat’s fl ash estimate, euro area annual HICP infl ation dropped from -0.1% in
June to -0.6% in July (see Table 4). A detailed breakdown of this estimate is not yet available, but
the further decline in the infl ation rate primarily refl ects a downward base effect in the energy price
component, related to the strong rise in oil prices in mid-2008.
The detailed breakdown for June indicates that the fall in annual infl ation from the previous month
refl ected declines in the annual rate of change in most HICP components. The annual rate of change
in the energy component of the HICP fell in June to -11.8% on account of a downward base effect.
However, compared with the previous month, energy prices rose notably by 2.4%, refl ecting mainly
price increases in transport and liquid fuels, in line with the increase in oil prices observed in May
and June. By contrast, consumer electricity and, in particular, gas prices continued to decline
between May and June, refl ecting the lagged impact of past oil price declines.
The annual rate of change in unprocessed food prices declined to 0.3% in June, from 0.7% in May,
partly stemming from a base effect. While most sub-components contributed to this decline, the
annual rate of change of fruit prices rose in June. The annual rate of change in processed food
prices edged up to 1.1% in June, from 1.0% in May, despite a downward base effect. The latest
rise is attributable to an increase in tobacco prices. Excluding tobacco, the annual rate of change in
processed food prices declined further.
3 PRICES AND COSTS
Table 4 Price developments
(annual percentage changes, unless otherwise indicated)
2007 2008 2009 2009 2009 2009 2009 2009 Feb. Mar. Apr. May June July
HICP and its componentsOverall index 1) 2.1 3.3 1.2 0.6 0.6 0.0 -0.1 -0.6
Energy 2.6 10.3 -4.9 -8.1 -8.8 -11.6 -11.8 .
Unprocessed food 3.0 3.5 3.3 2.4 1.6 0.7 0.3 .
Processed food 2.8 6.1 2.0 1.6 1.2 1.0 1.1 .
Non-energy industrial goods 1.0 0.8 0.7 0.8 0.8 0.8 0.6 .
Services 2.5 2.6 2.4 1.9 2.5 2.1 1.9 .
Other price indicatorsIndustrial producer prices 2.7 6.1 -1.9 -3.2 -4.8 -5.9 -6.6 .
Oil prices (EUR per barrel) 52.8 65.9 34.6 36.5 39.0 42.8 49.5 46.5
Non-energy commodity prices 9.2 4.4 -28.8 -29.1 -23.8 -22.8 -22.7 -22.9
Sources: Eurostat, HWWI and ECB calculations based on Thomson Financial Datastream data.1) HICP infl ation in July 2009 refers to Eurostat’s fl ash estimate.
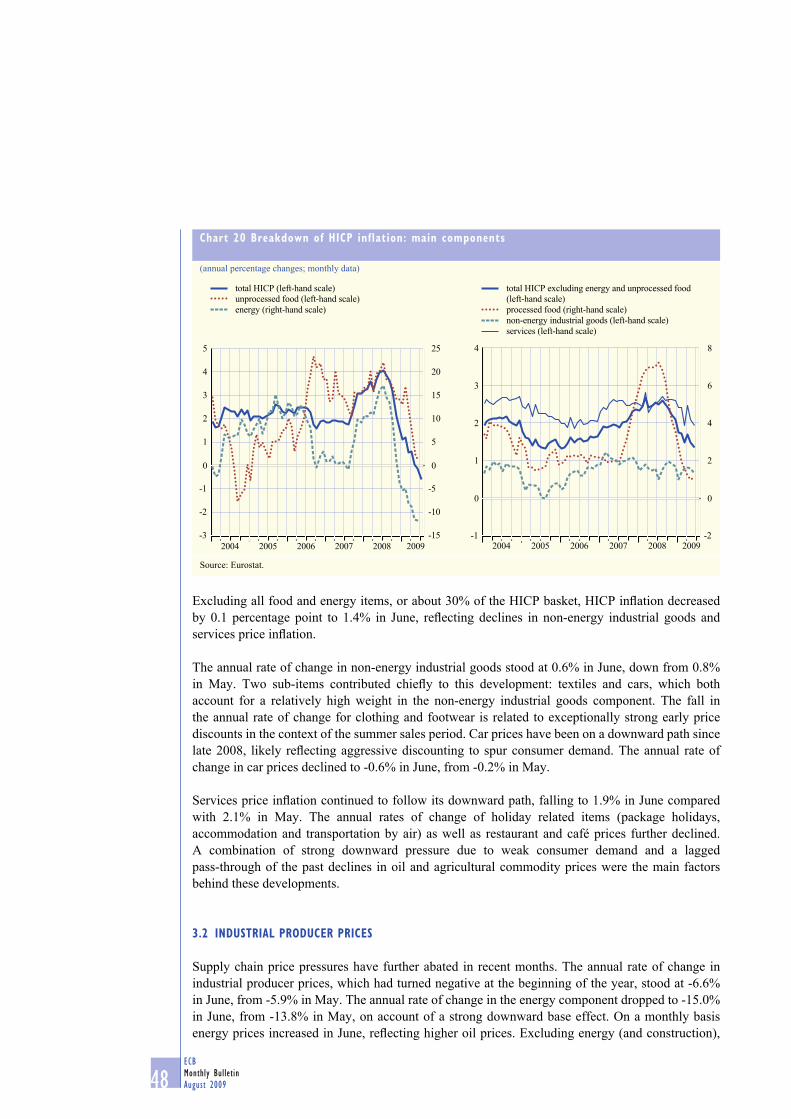
48ECB
Monthly Bulletin
August 2009
Excluding all food and energy items, or about 30% of the HICP basket, HICP infl ation decreased
by 0.1 percentage point to 1.4% in June, refl ecting declines in non-energy industrial goods and
services price infl ation.
The annual rate of change in non-energy industrial goods stood at 0.6% in June, down from 0.8%
in May. Two sub-items contributed chiefl y to this development: textiles and cars, which both
account for a relatively high weight in the non-energy industrial goods component. The fall in
the annual rate of change for clothing and footwear is related to exceptionally strong early price
discounts in the context of the summer sales period. Car prices have been on a downward path since
late 2008, likely refl ecting aggressive discounting to spur consumer demand. The annual rate of
change in car prices declined to -0.6% in June, from -0.2% in May.
Services price infl ation continued to follow its downward path, falling to 1.9% in June compared
with 2.1% in May. The annual rates of change of holiday related items (package holidays,
accommodation and transportation by air) as well as restaurant and café prices further declined.
A combination of strong downward pressure due to weak consumer demand and a lagged
pass-through of the past declines in oil and agricultural commodity prices were the main factors
behind these developments.
3.2 INDUSTRIAL PRODUCER PRICES
Supply chain price pressures have further abated in recent months. The annual rate of change in
industrial producer prices, which had turned negative at the beginning of the year, stood at -6.6%
in June, from -5.9% in May. The annual rate of change in the energy component dropped to -15.0%
in June, from -13.8% in May, on account of a strong downward base effect. On a monthly basis
energy prices increased in June, refl ecting higher oil prices. Excluding energy (and construction),
Chart 20 Breakdown of HICP inflation: main components
(annual percentage changes; monthly data)
-3
-2
-1
0
1
2
3
4
5
-15
-10
-5
0
5
10
15
20
25
total HICP (left-hand scale)
unprocessed food (left-hand scale)
energy (right-hand scale)
2004 2005 2006 2007 2008 2009 2008 2009-1
0
1
2
3
4
-2
0
2
4
6
8
total HICP excluding energy and unprocessed food
(left-hand scale)
processed food (right-hand scale)
non-energy industrial goods (left-hand scale)
services (left-hand scale)
2004 2005 2006 2007
Source: Eurostat.

49ECB
Monthly Bulletin
August 2009
ECONOMIC AND MONETARYDEVELOPMENTS
Prices and
costs
annual producer prices infl ation fell to -3.5% in June, with all components contributing to this further
decline. The annual rate of change in intermediate goods prices dropped to -6.4% in June, from
-5.7% in May, mainly due to a base effect. At the later stages of the production chain, the annual
rates of changes of capital goods prices slowed further to 0.3% in June, while that of consumer
goods prices declined to -2.3% (see Chart 21).
Information from surveys on the price-setting behaviour of fi rms over recent months indicates,
however, that the pace at which pipeline price pressures are easing is diminishing in the
manufacturing sector and price pressures in the services sector seem to be stabilising (see Chart 22).
Bearing in mind its volatility, the Purchasing Managers’ input price index for the manufacturing
sector continued to edge up in July, which indicates a further moderation in the pace of downward
pipeline price pressures, most likely on account of the month-on-month increases in commodity
prices observed in recent months. For the services sector, the July data was broadly in line with
the past few months’ observations, thereby confi rming that downward pipeline pressures in the
sector are stabilising. At the same time, the indices of producer prices charged remained broadly
unchanged in July, both for the manufacturing and services sectors. The overall low levels of
producer input and output prices evidenced in the surveys still signal that prices are, on average,
declining, but at a lower rate compared with the previous month.
3.3 LABOUR COST INDICATORS
The annual rate of growth in negotiated wages eased to 3.2% in the fi rst quarter of 2009, compared
with 3.6% in the last quarter of 2008. Annual wage growth has thus remained elevated in the euro
area on the back of the sharp increases recorded in 2008. The rather resilient trend maintained by
Chart 21 Breakdown of industrial producer prices
(annual percentage changes; monthly data)
-8
-6
-4
-2
0
2
4
6
8
10
-24
-18
-12
-6
0
6
12
18
24
30
total industry excluding construction (left-hand scale)
intermediate goods (left-hand scale)capital goods (left-hand scale)
consumer goods (left-hand scale)energy (right-hand scale)
20082004 2005 2006 2007
Sources: Eurostat and ECB calculations.
Chart 22 Producer input and output price surveys
(diffusion indices; monthly data)
20
30
40
50
60
70
80
20
30
40
50
60
70
80
2004 2005 2006 2007 2008 2009
manufacturing; input prices
manufacturing; prices charged
services; input prices
services; prices charged
Source: Markit.Note: An index value above 50 indicates an increase in prices, whereas a value below 50 indicates a decrease.
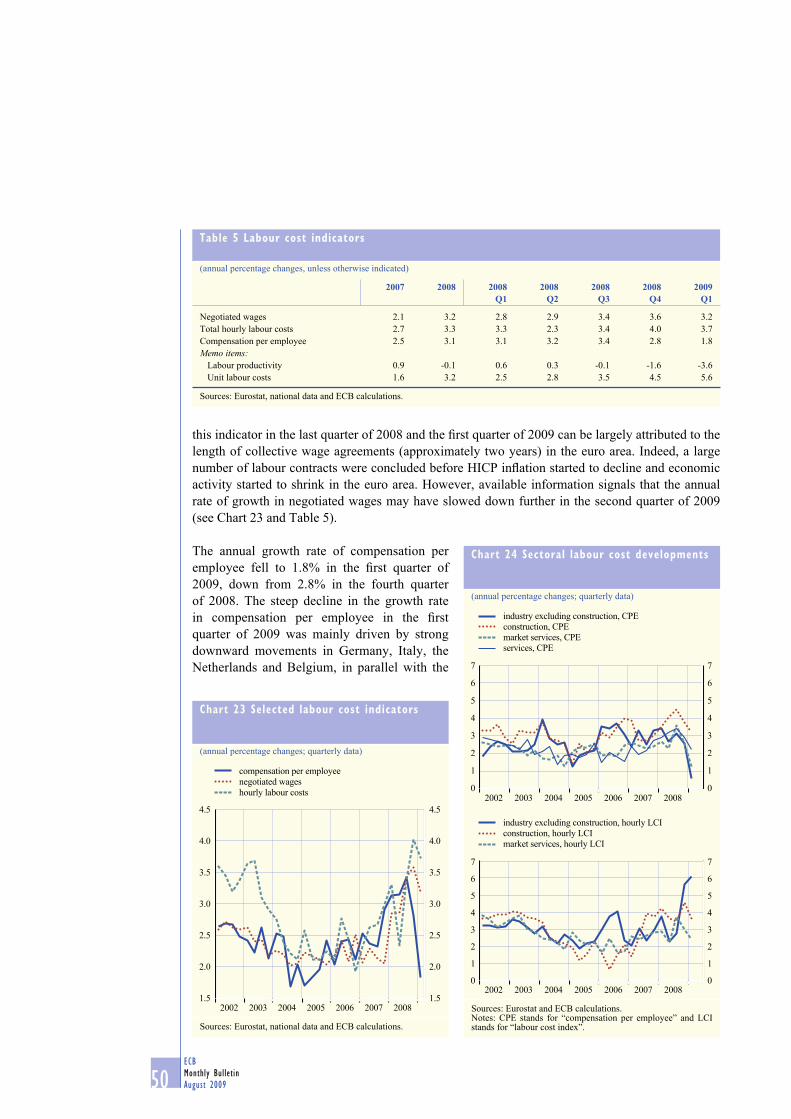
50ECB
Monthly Bulletin
August 2009
this indicator in the last quarter of 2008 and the fi rst quarter of 2009 can be largely attributed to the
length of collective wage agreements (approximately two years) in the euro area. Indeed, a large
number of labour contracts were concluded before HICP infl ation started to decline and economic
activity started to shrink in the euro area. However, available information signals that the annual
rate of growth in negotiated wages may have slowed down further in the second quarter of 2009
(see Chart 23 and Table 5).
The annual growth rate of compensation per
employee fell to 1.8% in the fi rst quarter of
2009, down from 2.8% in the fourth quarter
of 2008. The steep decline in the growth rate
in compensation per employee in the fi rst
quarter of 2009 was mainly driven by strong
downward movements in Germany, Italy, the
Netherlands and Belgium, in parallel with the
Table 5 Labour cost indicators
(annual percentage changes, unless otherwise indicated)
2007 2008 2008Q1
2008Q2
2008Q3
2008Q4
2009Q1
Negotiated wages 2.1 3.2 2.8 2.9 3.4 3.6 3.2
Total hourly labour costs 2.7 3.3 3.3 2.3 3.4 4.0 3.7
Compensation per employee 2.5 3.1 3.1 3.2 3.4 2.8 1.8
Memo items:Labour productivity 0.9 -0.1 0.6 0.3 -0.1 -1.6 -3.6
Unit labour costs 1.6 3.2 2.5 2.8 3.5 4.5 5.6
Sources: Eurostat, national data and ECB calculations.
Chart 23 Selected labour cost indicators
(annual percentage changes; quarterly data)
20081.5
2.0
2.5
3.0
3.5
4.0
4.5
1.5
2.0
2.5
3.0
3.5
4.0
4.5
compensation per employee
negotiated wages
hourly labour costs
2002 2003 2004 2005 2006 2007
Sources: Eurostat, national data and ECB calculations.
Chart 24 Sectoral labour cost developments
(annual percentage changes; quarterly data)
0
1
2
3
4
5
6
7
0
1
2
3
4
5
6
7
industry excluding construction, CPE
construction, CPE
market services, CPE
services, CPE
2002 2003 2004 2005 2006 2007 2008
0
1
2
3
4
5
6
7
0
1
2
3
4
5
6
7
industry excluding construction, hourly LCI
construction, hourly LCI
market services, hourly LCI
2002 2003 2004 2005 2006 2007 2008
Sources: Eurostat and ECB calculations.Notes: CPE stands for “compensation per employee” and LCI stands for “labour cost index”.
51ECB
Monthly Bulletin
August 2009
ECONOMIC AND MONETARYDEVELOPMENTS
Prices and
costs
short-time working schemes in place in these countries, which are extensively used to reduce the
numbers of hours worked per employee. The strong deceleration in compensation per employee
is, therefore, mainly a phenomenon of reduced overall compensation on account of fewer hours
worked per employee, as well as cuts in other fl exible pay elements, such as bonuses. The
sectoral decomposition indicates that the slowdown in compensation per employee growth in the
fi rst quarter was primarily driven by developments in market related services (including trade,
transport, communications, fi nancial and business services) and industry (excluding construction).
More muted declines were observed in the construction and non-market services sectors.
The annual growth rate of hourly labour costs in the euro area weakened somewhat to 3.7%
in the fi rst quarter of 2009, from 4.0% in the fourth quarter of 2008. The still strong growth in
hourly labour costs is largely due to past wage agreements as well as to the impact of various
measures taken to reduce the number of hours worked per employee, particularly in Germany, as
the reduction in hours worked is often accompanied by a less than proportional decrease in labour
remuneration (see the box entitled “Labour market adjustments during the current contraction
of economic activity” in the June 2009 issue of the Monthly Bulletin). Due to the fact that the
industrial sector is most strongly impacted by such measures, hourly labour costs increased more in
this sector, by 6.1%, compared with 3.6% in the construction sector and 2.4% in the services sector
(see Chart 24).
Productivity dropped more rapidly from -1.6%, year on year, in the last quarter of 2008, to -3.6% in
the fi rst quarter of 2009, as employment fell less sharply than the contraction in economic activity.
The accelerated drop in productivity, in turn, led to a strong surge in unit labour cost growth, from
4.5% in the fourth quarter of 2008 to 5.6% in the fi rst quarter of 2009, a new record high since the
start of EMU.
3.4 THE OUTLOOK FOR INFLATION
Over the short term, the outlook for annual HICP infl ation will continue to be characterised by
base effects relating to energy price movements in 2008. For this reason, annual infl ation rates are
projected to remain negative over the coming months, before turning positive again later this year.
Looking further ahead, infl ation is expected to remain positive, while price and cost developments
are expected to remain subdued in the wake of ongoing sluggish demand in the euro area and
elsewhere. Indicators of infl ation expectations over the medium to longer term remain fi rmly
anchored in line with the Governing Council’s aim of keeping infl ation rates below, but close to,
2% over the medium term.
The latest ECB Survey of Professional Forecasters (SPF) shows that short-term infl ation expectations
have been further revised downwards for 2009 and 2010 and lie within the ranges published in the
June Eurosystem staff macroeconomic projections for the euro area (see Box 5). The SPF long-term
infl ation expectations have been marginally revised upwards, to 1.98%, from 1.93% in the previous
survey round. However, the dispersion of long-term infl ation forecasts has fallen signifi cantly in the
latest survey.
Risks to the infl ation outlook are broadly balanced. These risks relate, in particular, to the outlook
for economic activity as well as to higher than expected commodity prices. Furthermore, increases
in indirect taxation and administered prices may be stronger than currently expected owing to the
need for fi scal consolidation over the coming years.
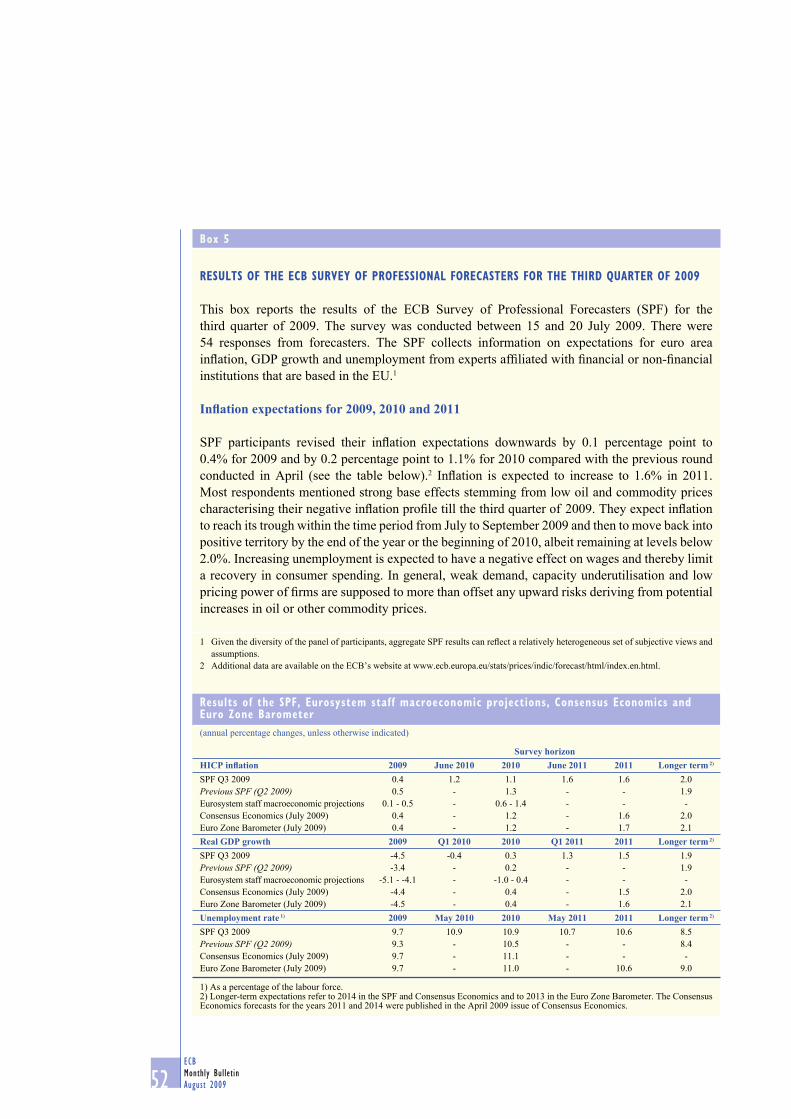
52ECB
Monthly Bulletin
August 2009
Box 5
RESULTS OF THE ECB SURVEY OF PROFESSIONAL FORECASTERS FOR THE THIRD QUARTER OF 2009
This box reports the results of the ECB Survey of Professional Forecasters (SPF) for the
third quarter of 2009. The survey was conducted between 15 and 20 July 2009. There were
54 responses from forecasters. The SPF collects information on expectations for euro area
infl ation, GDP growth and unemployment from experts affi liated with fi nancial or non-fi nancial
institutions that are based in the EU.1
Infl ation expectations for 2009, 2010 and 2011
SPF participants revised their infl ation expectations downwards by 0.1 percentage point to
0.4% for 2009 and by 0.2 percentage point to 1.1% for 2010 compared with the previous round
conducted in April (see the table below).2 Infl ation is expected to increase to 1.6% in 2011.
Most respondents mentioned strong base effects stemming from low oil and commodity prices
characterising their negative infl ation profi le till the third quarter of 2009. They expect infl ation
to reach its trough within the time period from July to September 2009 and then to move back into
positive territory by the end of the year or the beginning of 2010, albeit remaining at levels below
2.0%. Increasing unemployment is expected to have a negative effect on wages and thereby limit
a recovery in consumer spending. In general, weak demand, capacity underutilisation and low
pricing power of fi rms are supposed to more than offset any upward risks deriving from potential
increases in oil or other commodity prices.
1 Given the diversity of the panel of participants, aggregate SPF results can refl ect a relatively heterogeneous set of subjective views and
assumptions.
2 Additional data are available on the ECB’s website at www.ecb.europa.eu/stats/prices/indic/forecast/html/index.en.html.
Results of the SPF, Eurosystem staff macroeconomic projections, Consensus Economics and Euro Zone Barometer
(annual percentage changes, unless otherwise indicated)
Survey horizonHICP infl ation 2009 June 2010 2010 June 2011 2011 Longer term 2) SPF Q3 2009 0.4 1.2 1.1 1.6 1.6 2.0
Previous SPF (Q2 2009) 0.5 - 1.3 - - 1.9
Eurosystem staff macroeconomic projections 0.1 - 0.5 - 0.6 - 1.4 - - -
Consensus Economics (July 2009) 0.4 - 1.2 - 1.6 2.0
Euro Zone Barometer (July 2009) 0.4 - 1.2 - 1.7 2.1
Real GDP growth 2009 Q1 2010 2010 Q1 2011 2011 Longer term 2) SPF Q3 2009 -4.5 -0.4 0.3 1.3 1.5 1.9
Previous SPF (Q2 2009) -3.4 - 0.2 - - 1.9
Eurosystem staff macroeconomic projections -5.1 - -4.1 - -1.0 - 0.4 - - -
Consensus Economics (July 2009) -4.4 - 0.4 - 1.5 2.0
Euro Zone Barometer (July 2009) -4.5 - 0.4 - 1.6 2.1
Unemployment rate 1) 2009 May 2010 2010 May 2011 2011 Longer term 2) SPF Q3 2009 9.7 10.9 10.9 10.7 10.6 8.5
Previous SPF (Q2 2009) 9.3 - 10.5 - - 8.4
Consensus Economics (July 2009) 9.7 - 11.1 - - -
Euro Zone Barometer (July 2009) 9.7 - 11.0 - 10.6 9.0
1) As a percentage of the labour force.2) Longer-term expectations refer to 2014 in the SPF and Consensus Economics and to 2013 in the Euro Zone Barometer. The Consensus Economics forecasts for the years 2011 and 2014 were published in the April 2009 issue of Consensus Economics.
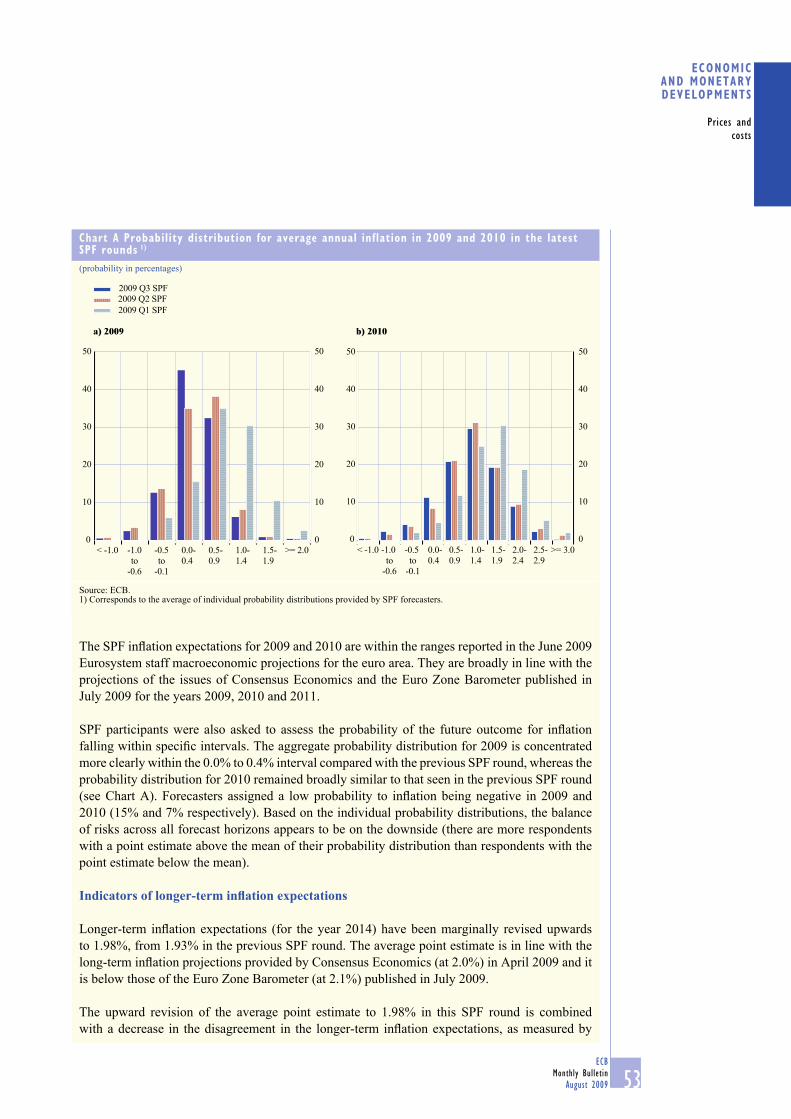
53ECB
Monthly Bulletin
August 2009
ECONOMIC AND MONETARYDEVELOPMENTS
Prices and
costs
The SPF infl ation expectations for 2009 and 2010 are within the ranges reported in the June 2009
Eurosystem staff macroeconomic projections for the euro area. They are broadly in line with the
projections of the issues of Consensus Economics and the Euro Zone Barometer published in
July 2009 for the years 2009, 2010 and 2011.
SPF participants were also asked to assess the probability of the future outcome for infl ation
falling within specifi c intervals. The aggregate probability distribution for 2009 is concentrated
more clearly within the 0.0% to 0.4% interval compared with the previous SPF round, whereas the
probability distribution for 2010 remained broadly similar to that seen in the previous SPF round
(see Chart A). Forecasters assigned a low probability to infl ation being negative in 2009 and
2010 (15% and 7% respectively). Based on the individual probability distributions, the balance
of risks across all forecast horizons appears to be on the downside (there are more respondents
with a point estimate above the mean of their probability distribution than respondents with the
point estimate below the mean).
Indicators of longer-term infl ation expectations
Longer-term infl ation expectations (for the year 2014) have been marginally revised upwards
to 1.98%, from 1.93% in the previous SPF round. The average point estimate is in line with the
long-term infl ation projections provided by Consensus Economics (at 2.0%) in April 2009 and it
is below those of the Euro Zone Barometer (at 2.1%) published in July 2009.
The upward revision of the average point estimate to 1.98% in this SPF round is combined
with a decrease in the disagreement in the longer-term infl ation expectations, as measured by
Chart A Probability distribution for average annual inflation in 2009 and 2010 in the latest SPF rounds 1)
(probability in percentages)
2009 Q3 SPF
2009 Q2 SPF
2009 Q1 SPF
a) 2009 b) 2010
0
10
20
30
40
50
0
10
20
30
40
50
-1.0
to
-0.6
-0.5
to
-0.1
>= 2.0< -1.0 0.0-
0.4
0.5-
0.9
1.0-
1.4
1.5-
1.9
0
10
20
30
40
50
0
10
20
30
40
50
-1.0
to
-0.6
-0.5
to
-0.1
0.0-
0.4
0.5-
0.9
1.0-
1.4
1.5-
1.9
2.0-
2.4
2.5-
2.9
>= 3.0< -1.0
Source: ECB.1) Corresponds to the average of individual probability distributions provided by SPF forecasters.
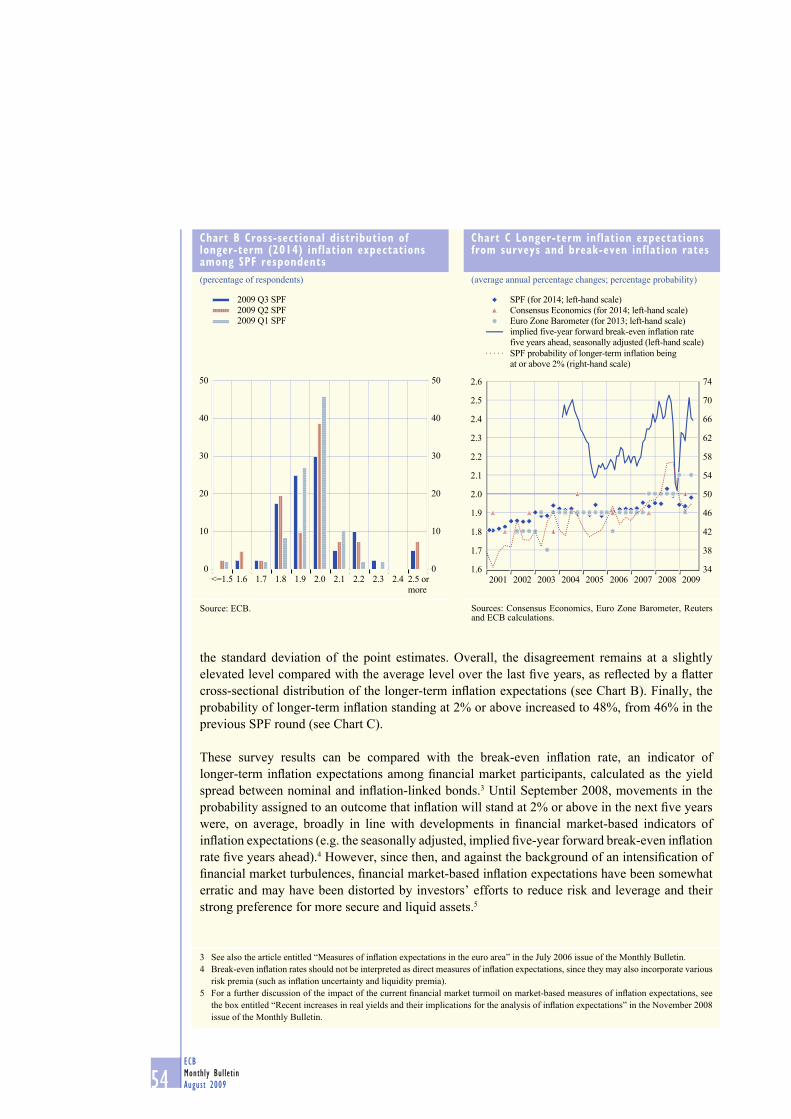
54ECB
Monthly Bulletin
August 2009
the standard deviation of the point estimates. Overall, the disagreement remains at a slightly
elevated level compared with the average level over the last fi ve years, as refl ected by a fl atter
cross-sectional distribution of the longer-term infl ation expectations (see Chart B). Finally, the
probability of longer-term infl ation standing at 2% or above increased to 48%, from 46% in the
previous SPF round (see Chart C).
These survey results can be compared with the break-even infl ation rate, an indicator of
longer-term infl ation expectations among fi nancial market participants, calculated as the yield
spread between nominal and infl ation-linked bonds.3 Until September 2008, movements in the
probability assigned to an outcome that infl ation will stand at 2% or above in the next fi ve years
were, on average, broadly in line with developments in fi nancial market-based indicators of
infl ation expectations (e.g. the seasonally adjusted, implied fi ve-year forward break-even infl ation
rate fi ve years ahead).4 However, since then, and against the background of an intensifi cation of
fi nancial market turbulences, fi nancial market-based infl ation expectations have been somewhat
erratic and may have been distorted by investors’ efforts to reduce risk and leverage and their
strong preference for more secure and liquid assets.5
3 See also the article entitled “Measures of infl ation expectations in the euro area” in the July 2006 issue of the Monthly Bulletin.
4 Break-even infl ation rates should not be interpreted as direct measures of infl ation expectations, since they may also incorporate various
risk premia (such as infl ation uncertainty and liquidity premia).
5 For a further discussion of the impact of the current fi nancial market turmoil on market-based measures of infl ation expectations, see
the box entitled “Recent increases in real yields and their implications for the analysis of infl ation expectations” in the November 2008
issue of the Monthly Bulletin.
Chart B Cross-sectional distribution of longer-term (2014) inflation expectations among SPF respondents
(percentage of respondents)
0
10
20
30
40
50
0
10
20
30
40
50
2.5 or
more
2009 Q3 SPF
2009 Q2 SPF2009 Q1 SPF
<=1.5 1.6 1.7 1.8 1.9 2.0 2.1 2.2 2.3 2.4
Source: ECB.
Chart C Longer-term inflation expectations from surveys and break-even inflation rates
(average annual percentage changes; percentage probability)
1.6
1.7
1.8
1.9
2.0
2.1
2.2
2.3
2.4
2.5
2.6
34
38
42
46
50
54
58
62
66
70
74
2001 2002 2003 2004 2005 2006 2007 2008 2009
SPF (for 2014; left-hand scale)
Consensus Economics (for 2014; left-hand scale)
Euro Zone Barometer (for 2013; left-hand scale)
implied five-year forward break-even inflation rate
five years ahead, seasonally adjusted (left-hand scale)
SPF probability of longer-term inflation being
at or above 2% (right-hand scale)
Sources: Consensus Economics, Euro Zone Barometer, Reuters and ECB calculations.

55ECB
Monthly Bulletin
August 2009
ECONOMIC AND MONETARYDEVELOPMENTS
Prices and
costs
Real GDP growth expectations
SPF respondents have revised their growth expectations for 2009 further downwards since the
last survey, by 1.1 percentage points, and now expect euro area real GDP to contract by 4.5%
in 2009. Real GDP is then expected to grow by 0.3% in 2010, which is an upward revision by
0.1 percentage point, and by 1.5% in 2011. In their comments, the respondents referred to
weakness in domestic and external demand, as well as ongoing tensions in the fi nancial markets
and tight fi nancing conditions as the main factors characterising the short to medium-term
outlook for real GDP growth.
The SPF growth expectations for 2009 are well within the range reported in the June 2009
Eurosystem staff macroeconomic projections for the euro area, while those for 2010 are close
to the upper limit of the range. The SPF growth expectations are broadly in line with the Euro
Zone Barometer and Consensus Economics forecasts for 2009 and 2010, but slightly below these
forecasts for 2011.
In line with the downward revision of expected real GDP growth, the aggregate probability
distribution for 2009 shifted towards lower outcomes. The aggregate probability distribution for
2010 remained quite fl at and was concentrated in the range of the outcomes between 0.0% and
0.9%. The SPF respondents assign a 32% probability to annual real GDP growth being negative
in 2010 compared with a 37% probability in the previous SPF round (see Chart D).
Uncertainty derived from the aggregate probability distribution for one-year-ahead and
two-years-ahead real GDP forecasts has declined, but continues to remain at an elevated level
(see Box 6 in Section 4). According to the comments provided by several respondents, most of
them expect a moderate recovery to take place in 2010, with a few respondents expecting euro
area real GDP growth to return to full potential only by 2011 and beyond. As the main factors
helping the recovery, respondents mentioned an improvement in the euro area exports markets
Chart D Probability distribution for average annual real GDP growth in 2009 and 2010 in the latest SPF rounds 1)
(probability in percentages)
2009 Q3 SPF
2009 Q2 SPF
2009 Q1 SPF
a) 2009 b) 2010
0
10
20
30
40
50
60
70
0
10
20
30
40
50
60
70
-3.5
to
-3.1
-3.0
to
-2.6
-2.5
to
-2.1
-2.0
to
-1.6
-1.5
to
-1.1
-1.0
to
-0.6
-0.5
to
-0.1
>=0.0-5.5
to
-5.1
-5.0
to
-4.6
-4.5
to
-4.1
-4.0
to
-3.6
< -5.50
10
20
30
40
50
60
70
0
10
20
30
40
50
60
70
< -2.0 -2.0
to
-1.6
-1.5
to
-1.1
-1.0
to
-0.6
-0.5
to
-0.1
>=2.00.0-
0.4
0.5-
0.9
1.0-
1.4
1.5-
1.9
Source: ECB.1) Corresponds to the average of individual probability distributions provided by SPF forecasters.
56ECB
Monthly Bulletin
August 2009
and world trade, as well as the impact of fi scal and monetary policy measures. However, the
respondents also emphasised that the timing and strength of the recovery is highly uncertain. More
specifi cally, the uncertainty is related to the outlook for trade and labour market developments, with
the latter posing major downside risks to consumer spending on account of rising unemployment.
Longer-term growth expectations (for 2014) have remained unchanged at 1.9%, as in the previous
round, and are slightly below those provided by Consensus Economics in April and the Euro Zone
Barometer in July. Overall, respondents assess the balance of risks as being on the downside.
Expectations for the euro area unemployment rate
SPF respondents revised their unemployment rate expectations upwards for both 2009 and 2010
by 0.4 percentage point. On average, the unemployment rate is now expected to reach 9.7% in
2009, to further increase to 10.9% in 2010 and then ease slightly to 10.6% in 2011. Longer-term
unemployment rate expectations were also revised upwards, by 0.1 percentage point, and now
stand at 8.5%.

57ECB
Monthly Bulletin
August 2009
ECONOMIC AND MONETARYDEVELOPMENTS
Output,
demand and the
labour market
4 OUTPUT, DEMAND AND THE LABOUR MARKET
Recent surveys of economic activity in the euro area suggest that the pace of contraction is clearly slowing down. However, economic activity is expected to remain weak throughout the remainder of this year. Looking ahead into next year, after a phase of stabilisation, a gradual recovery with positive quarterly growth rates is expected. The signifi cant policy stimuli in all major economic areas should support growth globally, including in the euro area. The risks to this outlook for economic activity remain balanced.
4.1 REAL GDP AND DEMAND COMPONENTS
The pace of euro area activity declined markedly in early 2009, following a continued contraction
of both domestic and global demand. According to Eurostat’s second estimate, real GDP in the euro
area contracted by 2.5% (quarter on quarter) in the fi rst quarter of 2009, after a decline of 1.8% in the
last quarter of 2008 (see Chart 25). Euro area real GDP probably continued to shrink in the second
quarter, albeit at a slower pace than in the fi rst quarter. The contraction is expected to moderate further
throughout the rest of 2009, and economic growth is projected, after a phase of stabilisation, to recover
gradually in 2010. The uncertainty surrounding this outlook remains high. Indeed measures derived
from various forecasters’ projections indicate that uncertainty about the economic outlook has rarely
been higher (see Box 6). At the same time, the results of the ECB Survey of Professional Forecasters
for the third quarter of 2009 show that the uncertainty for one-year-ahead and two-years-ahead
real GDP forecasts has slightly declined compared to the previous round (see Box 5).
Eurostat’s second estimate confi rmed that the deterioration in demand was broadly based across
all components in the fi rst quarter of 2009. External demand fell rapidly, refl ecting the collapse in
world trade. Domestic demand weakened as well, with investment registering a signifi cant decline
and consumption contracting. Inventories also made a negative contribution to growth.
Chart 25 Real GDP growth and contributions
(quarter-on-quarter growth rate and quarterly percentage point contributions; seasonally adjusted)
Q1
-3.0
-2.5
-2.0
-1.5
-1.0
-0.5
0.0
0.5
1.0
-3.0
-2.5
-2.0
-1.5
-1.0
-0.5
0.0
0.5
1.0
domestic demand (excluding inventories)
changes in inventories
net exports
total GDP growth
Q1
2008 2009
Q2 Q3 Q4
Sources: Eurostat and ECB calculations.
Chart 26 Retail sales and confidence in the retail trade and household sectors
(monthly data)
-3
-2
-1
0
1
2
3
4
-30
-20
-10
0
10
20
30
40
2004 2005 2006 2007 2008 2009
total retail sales 1) (left-hand scale)
consumer confidence 2) (right-hand scale)
retail confidence 2) (right-hand scale)
Sources: European Commission Business and Consumer Surveys and Eurostat.1) Annual percentage changes; three-month moving averages; working day-adjusted. Also excludes fuel.2) Percentage balances; seasonally and mean-adjusted.

58ECB
Monthly Bulletin
August 2009
Box 6
UNCERTAINTY AND THE ECONOMIC PROSPECTS FOR THE EURO AREA
Since the autumn of 2008, renewed fi nancial turbulence and a sharp deterioration in global and
domestic demand have heightened uncertainty about the euro area’s economic outlook. That
uncertainty has been evident in the widening dispersion of forecasters’ projections for euro
area growth. This box examines some indicators of the dispersion of forecasters’ projections
for growth and discusses what the current uncertainty about the outlook might imply for the
evolution of demand in the near term.
Uncertainty matters because it can have a major infl uence on current demand. Business
investment, for example, may be affected because decisions on capital expenditure are typically
irreversible, so that it may, in an uncertain environment, induce fi rms to delay investment
decisions until the outlook for demand becomes clearer. Uncertainty can infl uence household
decisions in a similar way. Greater uncertainty about the economic outlook – in particular about
job prospects – may induce households to reduce their current consumption and, instead, build
up precautionary savings against possible fl uctuations in future income.
Various approaches are available for assessing the degree of uncertainty. A common method
is to look at the volatility of economic or fi nancial indicators. For example, the variation of
equity indices provides one indication of current volatility in fi nancial markets, while implied
volatilities from option contracts provide an insight into market participants’ views on future
volatility.1 For the real economy, it is also possible to look at recent volatility in macro series –
for example, the evolution of recent changes in GDP or industrial production.
Another possible measure of the uncertainty about the outlook is the dispersion of projections
for growth among forecasters. Charts A and B show the standard deviation of GDP growth
forecasts by Consensus Economics, which collects projections for major economies from a
number of forecasters. In the Consensus Economics survey, contributors are asked for their
1 For a discussion of volatility in stock market indices, see Box 4, entitled “Abnormal volatility in global stock markets”, in the
November 2008 issue of the Monthly Bulletin.
Private consumption contracted by 0.5% (quarter on quarter) in the fi rst quarter of 2009. Recent
developments in indicators of consumption demand suggest a less negative reading of the quarterly
rate of growth in consumer spending in the second quarter of 2009. Three key factors support this
assessment. First, keeping in mind the volatility of the series, although retail sales continued to
fall in the second quarter, the decline was somewhat smaller than in the previous quarter. Thus,
recent dynamics in retail trade point to a bottoming-out of the downward trend observed since mid-
2008. Second, relatively strong data on new car registrations suggest that the recent introduction of
government-sponsored subsidies for consumers to scrap old cars and buy new ones have provided
support for household spending in the second quarter. Third, the index of consumer confi dence rose
in quarterly terms in the second quarter of 2009, thus reversing the downward trend observed since
mid-2007. However, despite the fact that consumer confi dence has risen over the past few months,
its persistently low level is consistent with weak consumer spending in the second quarter of 2009
(see Chart 26).
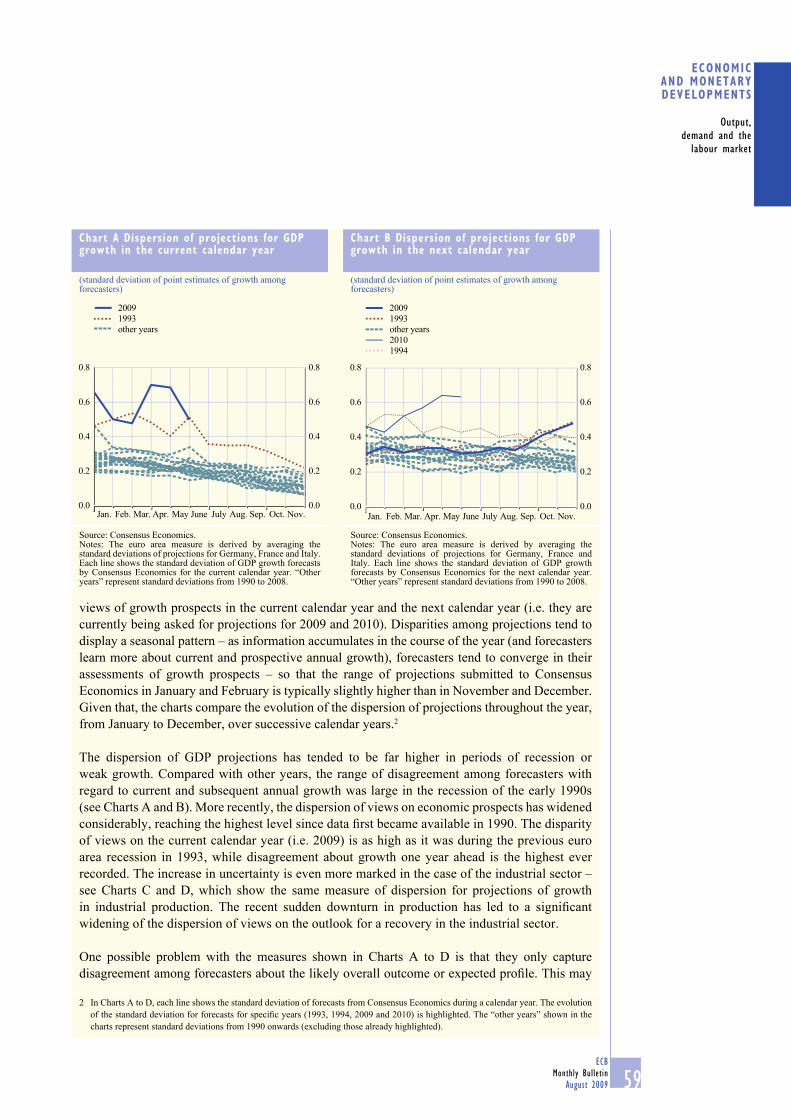
59ECB
Monthly Bulletin
August 2009
ECONOMIC AND MONETARYDEVELOPMENTS
Output,
demand and the
labour market
views of growth prospects in the current calendar year and the next calendar year (i.e. they are
currently being asked for projections for 2009 and 2010). Disparities among projections tend to
display a seasonal pattern – as information accumulates in the course of the year (and forecasters
learn more about current and prospective annual growth), forecasters tend to converge in their
assessments of growth prospects – so that the range of projections submitted to Consensus
Economics in January and February is typically slightly higher than in November and December.
Given that, the charts compare the evolution of the dispersion of projections throughout the year,
from January to December, over successive calendar years.2
The dispersion of GDP projections has tended to be far higher in periods of recession or
weak growth. Compared with other years, the range of disagreement among forecasters with
regard to current and subsequent annual growth was large in the recession of the early 1990s
(see Charts A and B). More recently, the dispersion of views on economic prospects has widened
considerably, reaching the highest level since data fi rst became available in 1990. The disparity
of views on the current calendar year (i.e. 2009) is as high as it was during the previous euro
area recession in 1993, while disagreement about growth one year ahead is the highest ever
recorded. The increase in uncertainty is even more marked in the case of the industrial sector –
see Charts C and D, which show the same measure of dispersion for projections of growth
in industrial production. The recent sudden downturn in production has led to a signifi cant
widening of the dispersion of views on the outlook for a recovery in the industrial sector.
One possible problem with the measures shown in Charts A to D is that they only capture
disagreement among forecasters about the likely overall outcome or expected profi le. This may
2 In Charts A to D, each line shows the standard deviation of forecasts from Consensus Economics during a calendar year. The evolution
of the standard deviation for forecasts for specifi c years (1993, 1994, 2009 and 2010) is highlighted. The “other years” shown in the
charts represent standard deviations from 1990 onwards (excluding those already highlighted).
Chart B Dispersion of projections for GDP growth in the next calendar year
(standard deviation of point estimates of growth among forecasters)
0.0
0.2
0.4
0.6
0.8
Oct.0.0
0.2
0.4
0.6
0.8
2009
1993
1994
2010
other years
Jan. Apr. JulyFeb. Mar. May June Aug. Sep. Nov.
Source: Consensus Economics.Notes: The euro area measure is derived by averaging the standard deviations of projections for Germany, France and Italy. Each line shows the standard deviation of GDP growth forecasts by Consensus Economics for the next calendar year. “Other years” represent standard deviations from 1990 to 2008.
Chart A Dispersion of projections for GDP growth in the current calendar year
(standard deviation of point estimates of growth among forecasters)
0.0
0.2
0.4
0.6
0.8
Apr.Mar. May June Aug. Sep. Nov.Feb. July Oct.Jan.0.0
0.2
0.4
0.6
0.8
other years
1993
2009
Source: Consensus Economics.Notes: The euro area measure is derived by averaging the standard deviations of projections for Germany, France and Italy. Each line shows the standard deviation of GDP growth forecasts by Consensus Economics for the current calendar year. “Other years” represent standard deviations from 1990 to 2008.
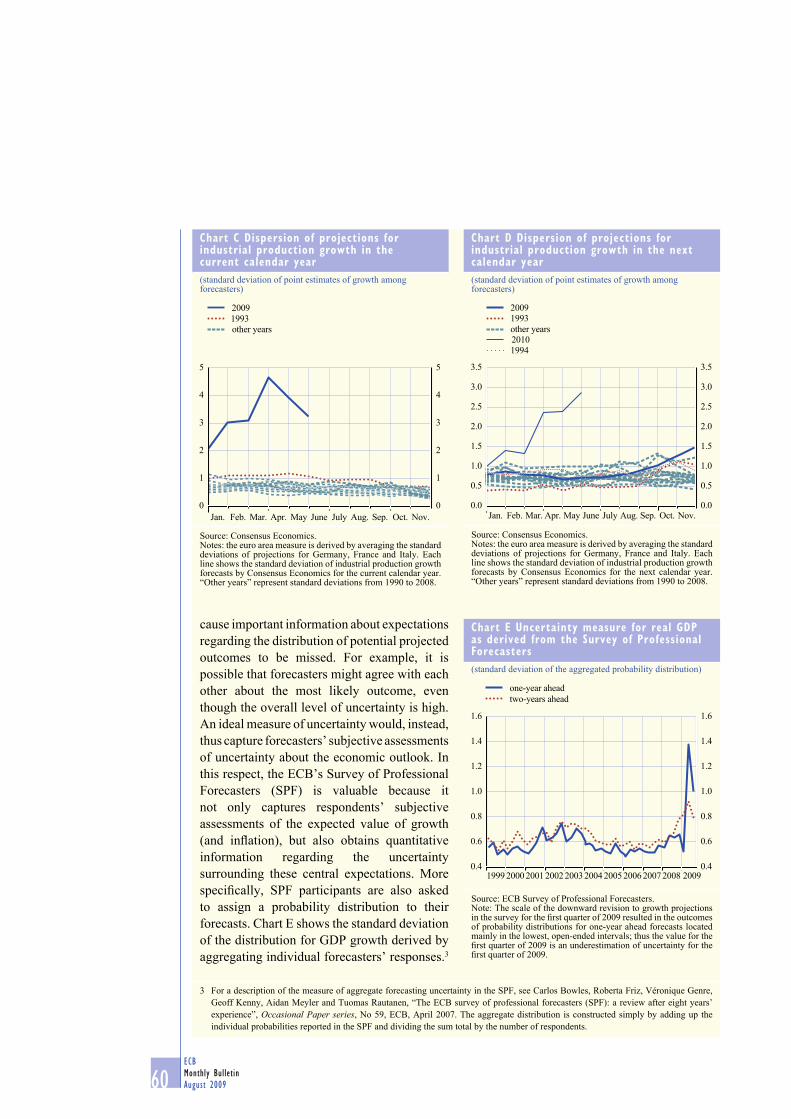
60ECB
Monthly Bulletin
August 2009
cause important information about expectations
regarding the distribution of potential projected
outcomes to be missed. For example, it is
possible that forecasters might agree with each
other about the most likely outcome, even
though the overall level of uncertainty is high.
An ideal measure of uncertainty would, instead,
thus capture forecasters’ subjective assessments
of uncertainty about the economic outlook. In
this respect, the ECB’s Survey of Professional
Forecasters (SPF) is valuable because it
not only captures respondents’ subjective
assessments of the expected value of growth
(and infl ation), but also obtains quantitative
information regarding the uncertainty
surrounding these central expectations. More
specifi cally, SPF participants are also asked
to assign a probability distribution to their
forecasts. Chart E shows the standard deviation
of the distribution for GDP growth derived by
aggregating individual forecasters’ responses.3
3 For a description of the measure of aggregate forecasting uncertainty in the SPF, see Carlos Bowles, Roberta Friz, Véronique Genre,
Geoff Kenny, Aidan Meyler and Tuomas Rautanen, “The ECB survey of professional forecasters (SPF): a review after eight years’
experience”, Occasional Paper series, No 59, ECB, April 2007. The aggregate distribution is constructed simply by adding up the
individual probabilities reported in the SPF and dividing the sum total by the number of respondents.
Chart E Uncertainty measure for real GDP as derived from the Survey of Professional Forecasters
(standard deviation of the aggregated probability distribution)
0.4
0.6
0.8
1.0
1.2
1.4
1.6
0.4
0.6
0.8
1.0
1.2
1.4
1.6
one-year ahead
two-years ahead
1999 2000 2001 2002 2003 2004 2005 2006 2007 2008 2009
Source: ECB Survey of Professional Forecasters.Note: The scale of the downward revision to growth projections in the survey for the fi rst quarter of 2009 resulted in the outcomes of probability distributions for one-year ahead forecasts located mainly in the lowest, open-ended intervals; thus the value for the fi rst quarter of 2009 is an underestimation of uncertainty for the fi rst quarter of 2009.
Chart C Dispersion of projections for industrial production growth in the current calendar year
(standard deviation of point estimates of growth among forecasters)
0
1
2
3
4
5
0
1
2
3
4
5
2009
1993
other years
Jan. Feb. Mar. Apr. May June July Aug. Sep. Oct. Nov.
Source: Consensus Economics. Notes: the euro area measure is derived by averaging the standard deviations of projections for Germany, France and Italy. Each line shows the standard deviation of industrial production growth forecasts by Consensus Economics for the current calendar year. “Other years” represent standard deviations from 1990 to 2008.
Chart D Dispersion of projections for industrial production growth in the next calendar year
(standard deviation of point estimates of growth among forecasters)
0.5
1.0
1.5
2.0
2.5
3.0
3.5
0.00.0
0.5
1.0
1.5
2.0
2.5
3.0
3.5
1993
1994
other years
2009
2010
Jan. Feb. Mar. Apr. May June July Aug. Sep. Oct. Nov.
Source: Consensus Economics.Notes: the euro area measure is derived by averaging the standard deviations of projections for Germany, France and Italy. Each line shows the standard deviation of industrial production growth forecasts by Consensus Economics for the next calendar year. “Other years” represent standard deviations from 1990 to 2008.
61ECB
Monthly Bulletin
August 2009
ECONOMIC AND MONETARYDEVELOPMENTS
Output,
demand and the
labour market
Looking further ahead, in the second half of 2009, consumption is projected to remain relatively
subdued on account of an expected further deterioration in the labour markets. The substantial
decline in commodity prices since last year has supported households’ real disposable income
and should continue to support spending. At the same time, there are some risks that households
may decide to increase their savings in anticipation of a more restrictive fi scal policy in the future.
Finally, there are uncertainties about the extent to which private consumption will be affected when
the current schemes for scrapping old cars are abolished.
In line with the pattern observed in previous periods of economic recession, gross fi xed capital
formation has been a main driver of the current slowdown in economic activity. In the fi rst
quarter of 2009, gross fi xed capital formation declined by 4.2%, quarter on quarter. Eurostat’s
second estimate confi rmed that non-construction investment (mainly assets intended for use in the
production of goods and services) contributed to the bulk of the drop in aggregate investment, while
the fall in construction investment was less pronounced.
Investment will probably continue to contribute negatively to economic growth throughout 2009.
The projected contraction in overall domestic and foreign activity, and the low expected profi tability
of fi rms, will probably weigh on both construction and non-construction investment. The ongoing
correction of residential and commercial property prices in the euro area also suggests subdued
construction investment in the future.
4.2 OUTPUT, SUPPLY AND LABOUR MARKET DEVELOPMENTS
Eurostat’s second estimate of the real value added in the fi rst quarter of 2009 showed contractions
in both the industry and the services sectors. The value added in industry (excluding construction)
fell by 8.5% (quarter on quarter), while that in the construction sector dropped by 1%. The decline
in value added in services amounted to 1.1% (quarter on quarter).
Currently, it provides a picture that is broadly similar to that of the previous measures, confi rming
that uncertainty about the economic outlook is exceptionally high – although it has come down
somewhat in the latest SPF, based on forecasts collected in July.
To sum up, since the autumn of 2008, renewed fi nancial turbulence, together with a sharp
deterioration in global and domestic demand, has increased the uncertainty about the euro
area’s economic prospects. Indeed, measures derived from forecasters’ projections indicate
that uncertainty about the economic outlook has rarely been higher. This heightened
uncertainty is likely to be one of the factors that currently dampen demand. Anecdotal
evidence suggests that it has been a prominent factor in shaping fi rms’ investment
expenditure in recent months. Looking ahead, the fi scal stimulus packages, combined with
the monetary loosening and signifi cant efforts to restore the functioning of the fi nancial
system, are expected to contribute to the lessening of uncertainty about the economic outlook.
In addition, the projected improvement in global and domestic conditions as fi nancial
markets normalise should gradually improve confi dence and reduce uncertainty in the
months ahead. Indeed, as could be seen in the latest SPF, there are already signs that uncertainty
among forecasters is declining again.

62ECB
Monthly Bulletin
August 2009
Monthly indicators suggest that activity remained weak in the second quarter of 2009, but that
the pace of contraction is declining. Euro area industrial production (excluding construction) was
up 0.6% (month on month) in May. This was the fi rst monthly increase of production after eight
months of consecutive and, in most cases, extremely sharp falls. Overall, the small increase in May,
together with the deceleration in the pace of decline in March and April in comparison with the
large monthly contraction rates in the months since September 2008, indicate a clear moderation
of the downward trend of industrial production (see Chart 27). Averaging-out monthly volatility, it
appears that there has also been a minor easing of the pace of decline in construction activity over
recent months, despite the deterioration observed in May.
It is important to note that indicators of short-term developments – for example, the monthly
rates of change in seasonally adjusted series such as industrial production – should currently be
interpreted even more cautiously than in more normal times. As explained in Box 7, recent economic
developments have probably increased the uncertainty of seasonally adjusted macroeconomic
series.
Business surveys also point towards a further moderation in the pace of decline in economic
activity in the second quarter (see Chart 28). The Purchasing Managers’ index (PMI), for instance,
continued to improve in July (although it remained below 50, indicating that the economy is still
contracting). Similarly, the European Commission’s business surveys generally confi rm the less
pessimistic reading from the PMI.
Chart 27 Industrial production growth and contributions
(growth rate and percentage point contributions; monthly data; seasonally adjusted)
2008
-9.0
-6.0
-3.0
0.0
3.0
-9.0
-6.0
-3.0
0.0
3.0
capital goods
consumer goodsintermediate goods
energy
total excluding construction
2004 2005 2006 2007
Sources: Eurostat and ECB calculations.Notes: Data shown are calculated as three-month moving averages against the corresponding average three months earlier.
Chart 28 Industrial production, industrial confidence and the PMI
(monthly data; seasonally adjusted)
-10
-9
-8
-7
-6
-5
-4
-3
-2
-1
0
1
2
3
-40
-36
-32
-28
-24
-20
-16
-12
-8
-4
0
4
8
12
2004 2005 2006 2007 2008 2009
industrial production 1) (left-hand scale)industrial confidence 2) (right-hand scale)PMI 3) (right-hand scale)
Sources: Eurostat, European Commission Business and Consumer Surveys, Markit and ECB calculations.Notes: All series refer to manufacturing.1) Three-month-on-three-month percentage changes.2) Percentage balances.3) Purchasing Managers’ index; deviations from an index value of 50.
63ECB
Monthly Bulletin
August 2009
ECONOMIC AND MONETARYDEVELOPMENTS
Output,
demand and the
labour market
Box 7
SEASONAL ADJUSTMENT OF SHORT-TERM ECONOMIC INDICATORS FOR THE EURO AREA IN
THE CURRENT RECESSION
Many short-term economic indicators are signifi cantly affected by events that recur regularly
at the same time each year. Summer holidays, for instance, lead to a sharp decline in industrial
production every August, and Christmas shopping boosts retail trade turnover every December.
Such seasonal effects make the assessment of short-term economic developments more diffi cult.
Therefore, in order to meaningfully interpret the data in conjunctural analysis, the time series
of short-term economic indicators are adjusted for seasonal variations. Certain economic
developments like the current sharp recession, however, pose additional challenges for seasonal
adjustment procedures as they make it harder to identify the part of the movement of the series
that is due to recurring seasonal developments.
This box initially outlines the basic concept of seasonal adjustment. It continues with an
explanation of how the seasonal adjustment of short-term economic indicators is conducted in
the euro area. Using euro area industrial production as an example, it illustrates how seasonal
adjustment works in general and how recent economic developments may have increased the
uncertainty surrounding seasonally adjusted data.
Basic concept of seasonal adjustment
Seasonal adjustment procedures are aimed at identifying and extracting the seasonal pattern
from e.g. a monthly or quarterly economic indicator, i.e. at eliminating those effects that
occur year after year in the same month or quarter and impact on the series by approximately
the same amount each time.1 The most widely used seasonal adjustment methods rely on the
decomposition of an economic time series into non-observable components, i.e. a trend-cycle
component, a seasonal component and an irregular component. After seasonal adjustment, the
series refl ects the trend-cycle component, which is typically the focus of conjunctural analysis,
but also irregular movements, including outliers.
While stable seasonal patterns can be estimated and extracted in a straightforward manner,
modelling seasonality in practice usually requires allowing for gradual changes in the seasonal
component over time. Time-varying seasonality may, however, signifi cantly increase the
uncertainty in estimating a seasonally adjusted series. Unusual developments in the most recent
data of a series may imply additional uncertainty, since it is hard to isolate the movement in the
seasonal component from the overall dynamics of the series. Sharp upturns or downturns, for
instance, can signifi cantly increase the uncertainties involved in identifying and estimating the
seasonal pattern of a time series.
A number of different methods are available for seasonal adjustment; the most frequently used
are TRAMO-SEATS, which extracts the seasonal pattern from a time series by fi nding a suitable
1 A related issue is calendar adjustment, which is conducted in addition to seasonal adjustment. It is aimed at eliminating calendar
effects, i.e. effects that are specifi c to the situation in a given calendar year, e.g. on whether 1 May falls on a weekend or within a week,
or on whether Easter is in March or April. However, calendar effects related to the “average” calendar situation in a given month or
quarter, e.g. on the fact that 1 May falls on weekdays more often than on weekends and that Easter is more often in April than in March,
are eliminated by the seasonal adjustment process.

64ECB
Monthly Bulletin
August 2009
mathematical decomposition of an ARIMA model into seasonal and non-seasonal components,
and X-12-ARIMA, which – in essence – estimates the impact of seasonal movements on the
basis of moving averages applied to seasonal periods.
Seasonal adjustment of short-term economic indicators in the euro area
For the euro area as a whole, Eurostat, the Statistical Offi ce of the European Communities,
estimates seasonally adjusted short-term economic indicators (e.g. industrial production, new
orders and retail sales) by aggregating non-seasonally adjusted country data and then directly
adjusting the euro area aggregate (thus using the so-called “direct approach” to seasonal
adjustment). Another approach to obtaining seasonally adjusted data for the euro area is the
aggregation of the seasonally adjusted national series. This “indirect approach” to seasonal
adjustment is often applied by market analysts, who use already released seasonally adjusted
national data to compute a fi rst estimate for the euro area as a whole, prior to its offi cial
release by Eurostat.2 Since seasonal adjustment normally implies non-linear transformations,
the outcome of the direct adjustment of euro area aggregates usually differs from that of the
aggregation of adjusted national results. The production of reliable euro area results through
indirect adjustment requires that all countries adjust on the basis of the same program and
apply the same adjustment policy with respect to e.g. the criteria used not only for selecting
and adapting models and functions, but also for revising back data. This is not yet the case for
short-term economic indicators in the euro area as an only limited degree of harmonisation has
been reached across national statistical institutes, so that the aggregated nationally adjusted data
might refl ect spurious effects.3
Seasonal adjustment of euro area industrial production data
The effect of seasonal adjustment can be
illustrated by comparing the seasonally
adjusted and unadjusted time series of euro
area industrial production, as compiled by
Eurostat. Chart A highlights the extreme
volatility of the seasonally unadjusted series of
industrial production (excluding construction)
with its strong, but very regular seasonal
pattern. The most striking effect of seasonal
adjustment is recorded in August every year
when production regularly falls by about 20%,
month on month, in unadjusted terms and
rebounds sharply thereafter, which compares
with a typical order of magnitude of close to
or below 1% in absolute terms for the monthly
rates of change in the seasonally adjusted series
2 The release dates of national data on short-term economic indicators are not synchronised.
3 In order to foster the harmonisation of seasonal adjustment procedures, the European Statistical System and central banks have recently
developed comprehensive guidelines on seasonal adjustment, in which the use of either TRAMO-SEATS or X-12 is recommended.
See http://epp.eurostat.ec.europa.eu/cache/ITY_OFFPUB/KS-RA-09-006/EN/KS-RA-09-006-EN.PDF.
Chart A Euro area industrial production (excluding construction)
(index: 2005 = 100)
70
80
90
100
110
120
70
80
90
100
110
120
2005 2006 2007 2008
working day and seasonally adjusted
working day-adjusted but not seasonally adjusted
Source: Eurostat.

65ECB
Monthly Bulletin
August 2009
ECONOMIC AND MONETARYDEVELOPMENTS
Output,
demand and the
labour market
(see Chart B). This illustrates that, in practice,
unadjusted production data are not very
informative for conjunctural analysis.
Uncertainty in seasonally adjusted industrial production data in the context of the current recession
As mentioned earlier, uncertainty in seasonally
adjusted series can be much higher in times
of unusual developments such as during the
current sharp recession. Chart C illustrates the
outcome based on different seasonal adjustment
approaches and methods. Chart C, panel (a),
shows the differences between the monthly
rates of change in Eurostat’s offi cial industrial
production fi gures for the euro area, based on
TRAMO-SEATS, and the aggregate of seasonally adjusted national data. Chart C, panel (b),
depicts the differences between Eurostat’s fi gures and an X-12 test calculation applied directly
to the euro area fi gures.4 While larger deviations between Eurostat’s offi cial euro area fi gures
and the aggregation of national results are occasionally also observed for the period prior to the
recession, Chart C, panel (a), highlights that the magnitude of these deviations has increased
during the current recession, in particular since its intensifi cation in September 2008. There has
also been an accumulation of consecutive deviations in the same direction. Moreover, Chart C,
4 X-12 was applied by keeping the seasonal pattern reasonably stable and not allowing the detection of outliers at the most recent end of
the series.
Chart B Euro area industrial production (excluding construction)
(monthly percentage changes)
30
20
10
0
-10
-20
30
20
10
0
-10
-20
working day-adjusted but not seasonally adjusted
working day and seasonally adjusted
2007 2008 2009
Sources: Eurostat and ECB computations.
Chart C Euro area industrial production (excluding construction) – differences between the monthly rates of change in Eurostat’s seasonally adjusted data and alternative calculations
(percentage points)
(a) Aggregate of national data (b) Data adjusted with X-12
-1.5
-1.0
-0.5
0.0
0.5
1.0
1.5
-1.5
-1.0
-0.5
0.0
0.5
1.0
1.5
2008200720062005
1.5
1.0
0.5
0.0
-0.5
-1.0
-1.5
1.5
1.0
0.5
0.0
-0.5
-1.0
-1.52005 2006 2007 2008
Sources: Eurostat and ECB computations.

66ECBMonthly BulletinAugust 2009
panel (b), shows a rather unusual clustering of consecutive differences in the same direction between Eurostat’s official euro area data
and those of direct adjustment with X-12 during the sharpest part of the recession, but the magnitude of these discrepancies appears to be within the normal margin of statistical uncertainty.
While the larger or more protracted discrepancies observed between the outcomes of different seasonal adjustment approaches and methods provide indications of larger uncertainties in the seasonally adjusted figures,
it is important to note that, as of January 2009, the data have also been significantly affected
by the introduction of the new classification of
economic activities (NACE Rev2) and by the use of updated weights that refer to the base year 2005. These methodological changes have also led to exceptional revisions to adjusted and unadjusted data during, in particular, the first quarter of 2009.5 More generally, the most recent data in Chart C, panels (a) and (b), may imply somewhat larger discrepancies, given that Eurostat’s first euro area data release includes estimates for some countries.6 Moreover, due consideration must be given to the fact that any estimation of the movement in the seasonal pattern over time is generally prone to higher statistical uncertainties at the recent end of a time series. These uncertainties are amplified by the sharp drop recorded as a consequence of the
current recession.
Chart D shows the differences between the Eurostat figures and the aggregate of seasonally adjusted
country data on the basis of real time data (i.e. unrevised data reflecting the respective information
at the time of the first release of the Eurostat data), which takes account of the generally higher
statistical uncertainties at the recent end of a time series. It shows that deviations in earlier years based on real time data have in fact been somewhat larger, on average, than those reflected in
current data (as depicted in Chart C, panel (a)), and occasionally also very large. It also highlights very clearly, however, that the recent deviations, as shown in Chart C, panel (a), were initially even more exceptional in terms of both their magnitude and their persistence, and have led to a more protracted divergence than usual between the estimates obtained on the basis of the different approaches.
The increased discrepancies between Eurostat’s production figures and the aggregate of country
data also entail increased uncertainties for conjunctural analysis. Although seasonally adjusted country data are compiled in a non-harmonised manner, the aggregate of these national data has often been used to derive early signals concerning Eurostat’s seasonally adjusted euro area
5 For further details, see the box entitled “Recent changes in short-term statistics” in the April 2009 issue of the Monthly Bulletin.6 Certain countries may not provide data for the most recent month at the time of the first release of Eurostat data. In such cases, Eurostat
estimates the data for the missing countries and integrates these estimates in the calculation of the euro area aggregates; the individual estimates (at country level) are not published. These country data have likewise not been included in the country aggregations in Chart D.
Chart D Difference between Eurostat’s figures on seasonally adjusted industrial production (excluding construction) and the aggregate of the corresponding national figures, based on real time data(percentage points)
1.5
1.0
0.5
-0.5
-1.0
-1.5
0.0
1.5
1.0
0.5
-0.5
-1.0
-1.5
0.0
2005 2006 2007 2008
Sources: Eurostat and ECB computations.

67ECB
Monthly Bulletin
August 2009
ECONOMIC AND MONETARYDEVELOPMENTS
Output,
demand and the
labour market
fi gures. While it is evident from occasionally larger past deviations that the country aggregation
does not necessarily – not even in normal times – provide a good estimate of the Eurostat fi gure,
it is clear from Chart D that such approximations have become even more uncertain in recent
times. Overall, given the increased uncertainties in seasonally adjusted fi gures, users should
avoid extracting strong signals from short-term developments, such as monthly rates of change,
in the current circumstances even more than in less exceptional times.
LABOUR MARKET
Conditions in euro area labour markets have continued to deteriorate in recent months. Eurostat’s
second estimate confi rmed a clear acceleration in the pace of employment losses in the fi rst quarter
of the year. Euro area employment decreased by 0.9% (quarter on quarter) in the fi rst quarter
of 2009, marking the third consecutive quarterly decline (see Table 6). The strong acceleration of
the contraction of employment in the fi rst quarter was largely due to the sharp decline in both the
industrial and the construction sector. After several quarters of a gradual slowdown, and virtual
stagnation in the second half of 2008, employment in the services sector likewise began to decline
in the fi rst quarter of 2009.
Looking ahead, the latest business surveys point to a further deterioration in employment in the
second quarter of 2009 (see Chart 29). In July employment intentions remained at very low levels
for both the industrial and the services sector. The latest surveys on employment intentions by the
European Commission also suggest a bleak outlook for employment.
As a result of the strong fall in activity, labour productivity (measured in terms of output per
employee) declined substantially in the fi rst quarter of 2009, namely by 1.7%, quarter on quarter
(see Chart 30). The bulk of the decline in labour productivity was accounted for by the industrial
sector (excluding construction), where it fell by 7.4% (quarter on quarter) in the fi rst quarter of
2009. Looking ahead, productivity is expected to recover in the latter part of 2009, driven by a
combination of further contractions in employment and less marked contractions in activity.
Table 6 Employment growth
(percentage changes compared with the previous period; seasonally adjusted)
Annual rates Quarterly rates2007 2008 2008
Q12008
Q22008
Q32008
Q42009
Q1
Whole economy 1.8 0.8 0.4 0.1 -0.2 -0.4 -0.9
of which:Agriculture and fi shing -1.4 -1.5 0.7 -1.4 -0.6 0.3 -1.0
Industry 1.4 -0.9 0.1 -0.5 -0.8 -1.4 -1.7
Excluding construction 0.3 -0.2 0.3 -0.2 -0.4 -1.0 -1.4
Construction 4.0 -2.4 -0.4 -1.2 -1.5 -2.2 -2.6
Services 2.1 1.5 0.5 0.3 0.1 0.0 -0.6
Trade and transport 1.9 1.3 0.7 0.1 0.0 -0.4 -1.0
Finance and business 4.0 2.5 1.2 0.2 0.1 -0.6 -1.0
Public administration 1) 1.3 1.2 0.0 0.6 0.1 0.6 0.0
Sources: Eurostat and ECB calculations.1) Also includes education, health and other services.
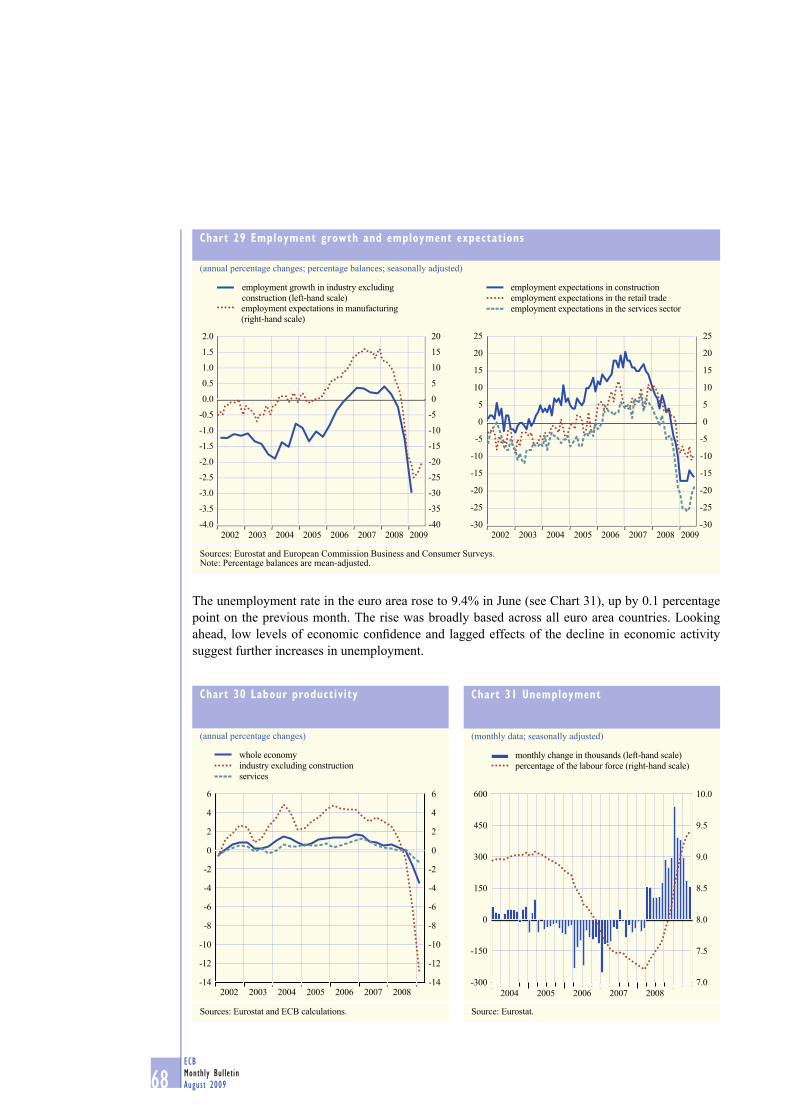
68ECB
Monthly Bulletin
August 2009
The unemployment rate in the euro area rose to 9.4% in June (see Chart 31), up by 0.1 percentage
point on the previous month. The rise was broadly based across all euro area countries. Looking
ahead, low levels of economic confi dence and lagged effects of the decline in economic activity
suggest further increases in unemployment.
Chart 29 Employment growth and employment expectations
(annual percentage changes; percentage balances; seasonally adjusted)
-4.0
-3.5
-3.0
-2.5
-2.0
-1.5
-1.0
-0.5
0.0
0.5
1.0
1.5
2.0
-40
20
2002 2003 2004 2005 2006 2007 2008 2009
employment growth in industry excluding
construction (left-hand scale)employment expectations in manufacturing
(right-hand scale)
-35
-30
-25
-20
-15
-10
-5
0
5
10
15
-30
-25
-20
-15
-10
-5
0
5
10
15
20
25
-30
-25
-20
-15
-10
-5
0
5
10
15
20
25
employment expectations in construction
employment expectations in the retail trade
employment expectations in the services sector
2002 2003 2004 2005 2006 2007 2008 2009
Sources: Eurostat and European Commission Business and Consumer Surveys.Note: Percentage balances are mean-adjusted.
Chart 30 Labour productivity
(annual percentage changes)
-14
-12
-10
-8
-6
-4
-2
0
2
4
6
-14
-12
-10
-8
-6
-4
-2
0
2
4
6
whole economy
industry excluding construction
services
2002 2003 2004 2005 2006 2007 2008
Sources: Eurostat and ECB calculations.
Chart 31 Unemployment
(monthly data; seasonally adjusted)
-300
-150
0
150
300
450
600
7.0
7.5
8.0
8.5
9.0
9.5
10.0
2008
monthly change in thousands (left-hand scale)
percentage of the labour force (right-hand scale)
2004 2005 2006 2007
Source: Eurostat.

69ECB
Monthly Bulletin
August 2009
ECONOMIC AND MONETARYDEVELOPMENTS
Output,
demand and the
labour market
4.3 THE OUTLOOK FOR ECONOMIC ACTIVITY
Recent surveys of economic activity in the euro area suggest that the pace of contraction is clearly
slowing down. However, economic activity is expected to remain weak over the remainder of this
year. Looking ahead into next year, after a phase of stabilisation, a gradual recovery with positive
quarterly growth rates is expected. The signifi cant policy stimuli in all major economic areas should
support growth globally, including in the euro area.
The risks to this outlook for economic activity remain balanced. On the upside, there may be stronger
than anticipated effects stemming from the extensive macroeconomic stimulus being provided
and from other policy measures taken. Confi dence may also improve more quickly than currently
expected. On the downside, there remain concerns relating to a stronger or more protracted negative
feedback loop between the real economy and the turmoil in fi nancial markets, renewed increases
in oil and other commodity prices, the intensifi cation of protectionist pressures, more unfavourable
than expected labour market conditions and, lastly, adverse developments in the world economy
stemming from a disorderly correction of global imbalances.

70ECB
Monthly Bulletin
August 2009
5 EXCHANGE RATE AND BALANCE OF PAYMENTS DEVELOPMENTS
5.1 EXCHANGE RATES
Notwithstanding some fl uctuation, the euro has appreciated moderately in nominal effective terms since the end of April 2009, mainly due to a strengthening against the US dollar and the Japanese yen that was partly offset by a depreciation vis-à-vis the pound sterling.
EFFECTIVE EXCHANGE RATE OF THE EURO
On 5 August 2009 the nominal effective
exchange rate of the euro – as measured against
the currencies of 21 of the euro area’s most
important trading partners – stood 1.7% above
the level prevailing at the end of April 2009
and close to its 2008 average (see Chart 32).
The appreciation of the euro since the end of
April 2009 refl ects mainly a strengthening
vis-à-vis the US dollar and the Japanese yen that
was partly offset by a weakening against the
pound sterling.
After appreciating sharply in May, possibly
refl ecting diminished safe-haven demand for
the US dollar, the euro depreciated in the fi rst
part of June, remaining broadly unchanged
thereafter.
US DOLLAR/EURO
The broad stability of the euro against the
US dollar between early June and the end of
July followed a phase of sharp appreciation
in May, possibly related to the further decline
in implied volatility and rising equity prices,
which have increased investors’ risk appetite. In
early August the euro resumed its appreciation
vis-à-vis the US dollar. On 5 August the
euro traded at USD 1.44, 8.5% above the
level prevailing at the end of April but still
2% weaker than its average level in 2008
(see Chart 33).
JAPANESE YEN/EURO
The behaviour of the euro vis-à-vis the Japanese
yen broadly mirrored that of the euro against
the US dollar. The broad stability of the euro
vis-à-vis the Japanese currency since June
followed a period spanning the second half
Chart 32 Euro effective exchange rate and its decomposition 1)
(daily data)
Index: Q1 1999 = 100
May June July2009
111
112
113
114
115
116
111
112
113
114
115
116
Contributions to EER changes 2)
From 30 April 2009 to 5 August 2009
(percentage points)
EER-21Other
-2
-1
0
1
2
3
-2
-1
0
1
2
3
USD JPY CHF OMSGBP CNY SEK
Contributions to EER changes 2)
From 3 January 2005 to 5 August 2009
(percentage points)
-1
0
1
2
3
4
5
6
-1
0
1
2
3
4
5
6
EER-21Other
USD JPY CHF OMSGBP CNY SEK
Source: ECB.1) An upward movement of the index represents an appreciation of the euro against the currencies of 21 of the most important trading partners of the euro area and all non-euro area EU Member States.2) Contributions to EER-21 changes are displayed individually for the currencies of the six main trading partners of the euro area. The category “Other Member States” (OMS) refers to the aggregate contribution of the currencies of the non-euro area Member States (except the pound sterling and the Swedish krona). The category “Other” refers to the aggregate contribution of the remaining six trading partners of the euro area in the EER-21 index. Changes are calculated using the corresponding overall trade weights in the EER-21 index.
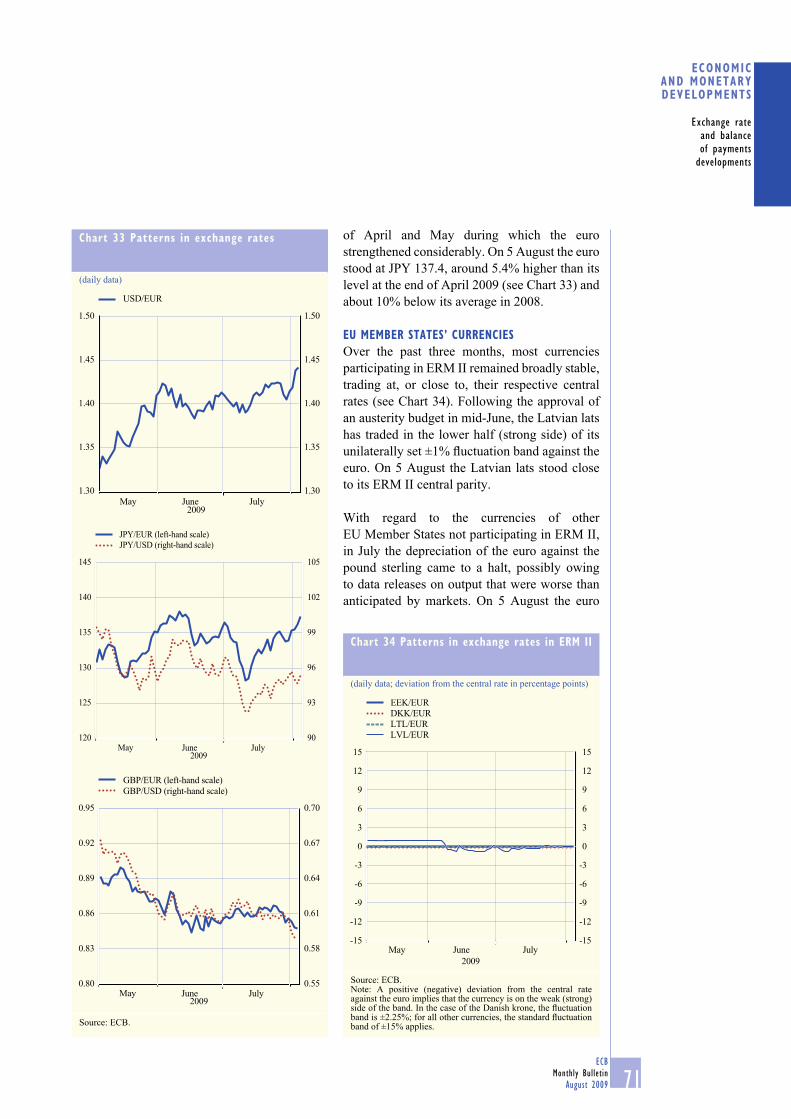
71ECB
Monthly Bulletin
August 2009
ECONOMIC AND MONETARYDEVELOPMENTS
Exchange rate
and balance
of payments
developments
of April and May during which the euro
strengthened considerably. On 5 August the euro
stood at JPY 137.4, around 5.4% higher than its
level at the end of April 2009 (see Chart 33) and
about 10% below its average in 2008.
EU MEMBER STATES’ CURRENCIES
Over the past three months, most currencies
participating in ERM II remained broadly stable,
trading at, or close to, their respective central
rates (see Chart 34). Following the approval of
an austerity budget in mid-June, the Latvian lats
has traded in the lower half (strong side) of its
unilaterally set ±1% fl uctuation band against the
euro. On 5 August the Latvian lats stood close
to its ERM II central parity.
With regard to the currencies of other
EU Member States not participating in ERM II,
in July the depreciation of the euro against the
pound sterling came to a halt, possibly owing
to data releases on output that were worse than
anticipated by markets. On 5 August the euro
Chart 33 Patterns in exchange rates
(daily data)
July2009
1.30
1.35
1.40
1.45
1.50
1.30
1.35
1.40
1.45
1.50
USD/EUR
May June
July2009
120
125
130
135
140
145
90
93
96
99
102
105
JPY/EUR (left-hand scale)
JPY/USD (right-hand scale)
May June
0.80
0.83
0.86
0.89
0.92
0.95
0.55
0.58
0.61
0.64
0.67
0.70
GBP/EUR (left-hand scale)
GBP/USD (right-hand scale)
July2009
May June
Source: ECB.
Chart 34 Patterns in exchange rates in ERM II
(daily data; deviation from the central rate in percentage points)
July
2009
-15
-12
-9
-6
-3
0
3
6
9
12
15
-15
-12
-9
-6
-3
0
3
6
9
12
15
EEK/EUR
DKK/EUR
LTL/EUR
LVL/EUR
May June
Source: ECB.Note: A positive (negative) deviation from the central rate against the euro implies that the currency is on the weak (strong) side of the band. In the case of the Danish krone, the fl uctuation band is ±2.25%; for all other currencies, the standard fl uctuation band of ±15% applies.
72ECB
Monthly Bulletin
August 2009
traded at GBP 0.85, 5.2% lower than its level at the end of April but 6.4% higher than its 2008
average. Over the past three months the euro has depreciated against the Czech koruna (2.8%), the
Hungarian forint (7.8%) and the Polish zloty (6.8%).
OTHER CURRENCIES
Between the end of April and 5 August 2009, some large swings notwithstanding, the euro
appreciated slightly against the Swiss franc. Most of this appreciation took place at the end of June
(around 2% in three days) and followed reported interventions in the foreign exchange markets
by the Swiss National Bank. On 5 August the euro traded at around CHF 1.53, 1.7% higher
than its level at the end of April but 3.5% lower than its average in 2008. Between the end of
April and 5 August, the euro weakened by 1.8% against the Canadian dollar and by 5.9% against
the Australian dollar.
5.2 BALANCE OF PAYMENTS
In the year to May 2009, the euro area current account defi cit reached €125.1 billion in working day and seasonally adjusted terms (or about 1.4% of GDP). Looking at the most recent trade developments, the signifi cant contraction in trade observed since the deepening of the fi nancial crisis in September 2008 seems to have moderated, particularly on the exports side. In the fi nancial account, combined direct and portfolio investment recorded net infl ows of €418.1 billion in the year to May 2009, as net infl ows in portfolio investment exceeded net outfl ows in direct investment.
TRADE AND THE CURRENT ACCOUNT
In the three months to May 2009, the euro area current account recorded an average monthly defi cit
of €5.7 billion (working day and seasonally adjusted), compared with a defi cit of €16.4 billion in
the previous three-month period to February 2009. This reduction was driven mostly by a shift from
defi cit to surplus in the goods balance and by a decrease in the defi cit for income (see Table 7).
The signifi cant contraction in trade that has been observed since the deepening of the fi nancial
crisis in September 2008 seems to have moderated somewhat. In the three-month period to
May 2009, exports of goods and services declined in value terms by 4.8%, compared with a fall of
12.2% in the previous three-month period. This milder contraction was due mainly to developments
in goods exports, which over the three-month period to May 2009 declined by 5.0% – almost
10 percentage points less than the decline over the previous three-month period. Meanwhile,
services exports declined by 4.3%. The contraction of imports of goods and services also
decelerated in the three months to May 2009, but the deceleration was less pronounced
than for exports: imports fell by 7.9%, down from the 10.4% decline in the three months to
February 2009.
The breakdown of euro area goods trade into volumes and prices, available up to April 2009, shows
that the deceleration of the decline in import and export values was due to developments in both
the volumes and prices of traded goods. From a geographical perspective, it appears that exports
to China, other emerging Asian economies and OPEC countries have recently shown some signs
of rebounding, both in value and volume terms. At the same time, exports to central and eastern
EU Member States have stabilised in volume terms. Nevertheless, total extra-euro area exports
remain subdued owing primarily to the weaker performance of exports to developed countries.
In terms of broad categories of goods, signifi cant declines in export volumes continued for capital

73ECB
Monthly Bulletin
August 2009
ECONOMIC AND MONETARYDEVELOPMENTS
Exchange rate
and balance
of payments
developments
goods, which fell back to levels not observed since 2004. By contrast, exports of consumer and
intermediate goods appear to have stabilised. Meanwhile, imports continued to post high rates of
decline, especially in the case of intermediate and capital goods.
From a longer-term perspective, the 12-month cumulated current account defi cit reached
€125.1 billion in May 2009 (working day and seasonally adjusted), corresponding to about 1.4%
of GDP. This fi gure compares with a defi cit of €21.7 billion for the same period a year earlier.
The deterioration was driven by a shift from surplus to defi cit in the goods balance, as well as a
decrease in the surplus for services and increases in the defi cits for income and current transfers.
The shift in the goods trade balance, which stems mainly from the high energy import prices
observed in the summer of 2008, brought the defi cit in the goods balance to €12.5 billion in
the year to May 2009. This compares with a surplus of €32.4 billion a year earlier. The surplus
in services decreased to €31.1 billion in the year to May 2009 – from €51.9 billion a year
earlier. Over the same period, the defi cit in the income account widened from €12.3 billion to
€42.8 billion, resulting largely from lower income receipts from non-euro area residents.
Finally, the defi cit in current transfers increased only slightly – from €93.8 to €101.0 billion
(see Chart 35).
Table 7 Main items of the euro area balance of payments
(seasonally adjusted, unless otherwise indicated)
Three-month moving average fi gures ending
12-month cumulatedfi gures ending
2009Apr.
2009May
2008Aug.
2008Nov.
2009Feb.
2009May
2008May
2009May
EUR billions
Current account -6.1 -1.2 -7.6 -11.9 -16.4 -5.7 -21.7 -125.1
Goods balance 2.5 2.9 -1.2 -0.3 -4.0 1.4 32.4 -12.5
Exports 104.1 103.1 134.7 128.4 109.7 104.1 1,564.2 1,430.6
Imports 101.7 100.2 135.9 128.7 113.7 102.7 1,531.7 1,443.1
Services balance 3.0 2.2 3.5 2.2 2.7 2.0 51.9 31.1
Exports 38.7 38.3 41.9 42.5 40.4 38.7 504.2 490.6
Imports 35.7 36.0 38.4 40.4 37.7 36.7 452.3 459.5
Income balance -3.0 1.6 -2.0 -5.5 -6.4 -0.4 -12.3 -42.8
Current transfers balance -8.6 -7.9 -7.9 -8.2 -8.7 -8.8 -93.8 -101.0
Financial account 1) -2.5 24.7 21.3 34.3 38.7 30.1 115.6 373.0
Combined net direct and
portfolio investment -13.4 59.9 17.9 61.0 20.0 40.5 -17.9 418.1
Net direct investment -4.5 6.1 -12.8 -28.8 -10.6 -6.3 -147.5 -175.5
Net portfolio investment -9.0 53.8 30.7 89.8 30.5 46.8 129.6 593.6
Equities -19.5 7.9 5.9 -13.7 -6.8 10.4 81.1 -12.7
Debt instruments 10.5 45.8 24.9 103.5 37.3 36.4 48.4 606.3
Bonds and notes -22.3 52.3 16.2 24.6 26.2 28.0 147.2 285.1
Money market instruments 32.8 -6.5 8.6 78.9 11.2 8.4 -98.7 321.3
Percentage changes over previous periodGoods and services
Exports -1.0 -1.0 0.6 -3.2 -12.2 -4.8 8.2 -7.1
Imports -5.0 -0.8 1.3 -3.0 -10.4 -7.9 8.2 -4.1
GoodsExports -1.0 -1.0 1.0 -4.7 -14.6 -5.0 7.6 -8.5
Imports -4.4 -1.4 1.8 -5.4 -11.6 -9.7 7.9 -5.8
ServicesExports -1.2 -1.1 -0.9 1.7 -5.0 -4.3 10.1 -2.7
Imports -6.9 1.0 -0.2 5.2 -6.6 -2.8 9.1 1.6
Source: ECB.Note: Figures may not add up due to rounding.1) Figures refer to balances (net fl ows). A positive (negative) sign indicates a net infl ow (outfl ow). Not seasonally adjusted.

74ECB
Monthly Bulletin
August 2009
FINANCIAL ACCOUNT
In the three-month period to May 2009, combined direct and portfolio investment recorded average
monthly net infl ows of €40.5 billion, compared with net infl ows of €20.0 billion over the previous
three months (see Table 7 and Chart 36). These developments were due primarily to a shift to net
infl ows of equity securities, which in the three months to May 2009 amounted to an average of
€10.4 billion, compared with an outfl ow of €6.8 billion over the period to February 2009. This
development, driven by a return to positive net purchases of euro area equities by non-residents,
was due mainly to investments by non-MFIs and possibly supported by an attenuation of investors’
preferences for more liquid and shorter-term assets. Meanwhile, net investment in debt instruments
remained largely unchanged in the three-month period ending in May 2009, posting net infl ows of
€36.4 billion, of which €28 billion originated from bonds and notes. The geographical breakdown
of portfolio investment, available up to the fi rst quarter of 2009, indicates that net sales of foreign
securities by euro area investors comprised primarily securities issues in offshore fi nancial centres,
the United Kingdom and Japan. At the same time, net purchases were recorded primarily in
securities issued by EU institutions and emerging countries.
Turning to net direct investment, both foreign direct investment abroad by euro area residents and
foreign direct investment in the euro area by non-residents rebounded in the three-month period
to May 2009, possibly signalling global strategies of market consolidation. While foreign direct
investment in the euro area recorded somewhat stronger infl ows, it was still outpaced by direct
investment abroad by euro area residents, resulting in net outfl ows of direct investment amounting
to €6.3 billion over the three months to May 2009 – down from €10.6 billion over the previous
three months. The geographical breakdown of direct investment, available up to the fi rst quarter
of 2009, indicates that the largest outfl ows in direct investment were directed to the United States,
Chart 35 The euro area current account and trade balances
(EUR billions; monthly data; seasonally adjusted)
-150
-100
-50
0
50
100
150
200
100
110
120
130
140
150
160
170
180
current account balance
(12-month cumulated data; left-hand scale)
trade balance
(12-month cumulated data; left-hand scale)exports of goods and services
(3-month moving average; right-hand scale)
imports of goods and services
(3-month moving average; right-hand scale)
2005 2006 2007 2008
Source: ECB.
Chart 36 Euro area combined direct and portfolio investment
(EUR billions; monthly data; 12-month cumulated fl ows)
2008
-300
-200
-100
0
100
200
300
400
500
600
700
-300
-200
-100
0
100
200
300
400
500
600
700
net direct and portfolio investment
net foreign direct investment
net debt instruments
net equity flows
2005 2006 2007
Source: ECB.

75ECB
Monthly Bulletin
August 2009
ECONOMIC AND MONETARYDEVELOPMENTS
Exchange rate
and balance
of payments
developments
the United Kingdom and emerging economies. By contrast, net infl ows were mainly recorded from
offshore fi nancial centres and Canada.
Overall, net infl ows in combined direct and portfolio investment in the 12-month period to
May 2009 rose to €418.1 billion (compared with net outfl ows of €17.9 billion in the same period
a year earlier), mainly driven by a rise in net infl ows in portfolio investment (see Chart 36).
The breakdown of portfolio investment by main categories of instruments indicates that these
developments were driven mostly by net infl ows in the money market segment. In particular, net
infl ows in euro area money market instruments soared to €321.3 billion in the 12-month period to
May 2009, compared with net outfl ows of €98.7 billion for the previous year. These developments
are likely to be associated mainly with the unfolding dynamics of the fi nancial crisis, where the high
level of volatility in the capital markets, as well as the exceptionally high degree of uncertainty and
the gloomy global economic outlook, have tilted investors’ preferences not only towards quality
and safety but also towards more liquid and shorter-term assets. Meanwhile, developments in direct
investment over the past year seem to signal an overall increase in home bias. Despite their recent
rebound, direct investment fl ows were signifi cantly lower in the 12-month period to May 2009
compared with the previous year, in terms of both assets and liabilities. However, as the decline
in net direct investment by non-residents in the euro area exceeded the contraction in euro area net
direct investment abroad, net outfl ows reached €175.5 billion in the 12-month period to May 2009,
up from €147.5 billion in the previous year.
Finally, turning to the euro area international investment position, data for the fi rst quarter of 2009
indicate an increase in the net liability position, to 21.6% of GDP, refl ecting mainly further net
infl ows of portfolio investment into the euro area.

77ECB
Monthly Bulletin
August 2009
1 INTRODUCTION
The monitoring and assessment of developments
in housing fi nance plays an important role in the
analyses carried out in the ECB and the
Eurosystem. This refl ects the fact that fi nancing
the purchase of a home is typically the largest
fi nancial transaction a household conducts over
its lifetime, and the loans taken out for that
purpose constitute by far the largest liability of
the household sector.1 In the euro area, most
housing loans are provided by banks, and in
aggregate they account for about one-third of
total lending by MFIs.2 Broadly speaking, there
are at least three main areas from which the
ECB’s interest in housing fi nance issues arises.
First, mortgage fi nancing plays a direct role
in transmitting changes in monetary policy to
aggregate spending, via residential investment
and private consumption. Its importance to
some extent depends on whether loans for house
purchase have fi xed or variable interest rates,
as the monetary policy transmission will in
principle be quicker in the latter case.
Second, understanding developments in housing
fi nance is important for assessing the nature
of monetary trends as part of a broad-based
monetary analysis. In this respect, it is for
instance relevant whether strong growth
in loans and indebtedness refl ects business
cycle-related or structural infl uences, and/or
whether it refl ects fundamental determinants.
Third, cross-country differences in mortgage
fi nancing terms, mortgage practices and
relevant institutions have an effect on the level
of integration in the euro area fi nancial system.
From a monetary policy point of view, closer
integration of housing fi nance markets, as
regards both housing loan characteristics and
the funding of such loans, in principle fosters
convergence in the speed and strength with
which monetary policy affects the real economy
and prices in the various national economies.
All three areas of interest have come to the
foreground with the housing crisis that started
in the United States and has led to a global
fi nancial crisis. Substantial price decreases
in some housing markets, unfavourable
household income prospects and increasing
diffi culties for banks in accessing bond markets
to fi nance mortgage loans have characterised
The data in this article are taken to a large extent from the 1
ECB Occasional Paper entitled “Housing fi nance in the euro
area”, No 101, 2009, which was prepared by a task force of the
Monetary Policy Committee of the ESCB.
This article uses the terms “housing loans”, “loans for house 2
purchase” and “mortgages” interchangeably. As the analysis
underlying the article refers to the period from 1999 to 2008, it
excludes Slovakia.
Developments in housing fi nance play an important role in the analyses carried out by the ECB, notably the analysis of the transmission of monetary policy, the monetary analysis and the monitoring of the integration of fi nancial markets. This article presents an overview of relevant developments in housing fi nance since 1999, as regards both the granting of loans for house purchase to households and the way in which banks have funded these loans. The growth of housing loans was strong in the period 1999-2007, causing an increase in household indebtedness, but has been moderating since 2006 and became very slow in 2008. While the characteristics of housing loans continue to differ across euro area countries, an increase in market-based funding, including securitisation, was witnessed in most countries in the period 1999-2007. However, the recent fi nancial turmoil has caused some reversal of this development in favour of more traditional deposit-based funding. The increase in households’ interest burden owing to higher indebtedness tends to strengthen the transmission of monetary policy, whereas a rise in market-based funding for MFIs tends to work in the opposite direction. Finally, despite a process of deregulation and liberalisation of fi nancial markets over the past two decades, which has led to a greater availability of mortgage products, differences in mortgage loan characteristics across euro area countries indicate some potential for further mortgage market integration.
ART ICLES
HOUSING FINANCE IN THE EURO AREA
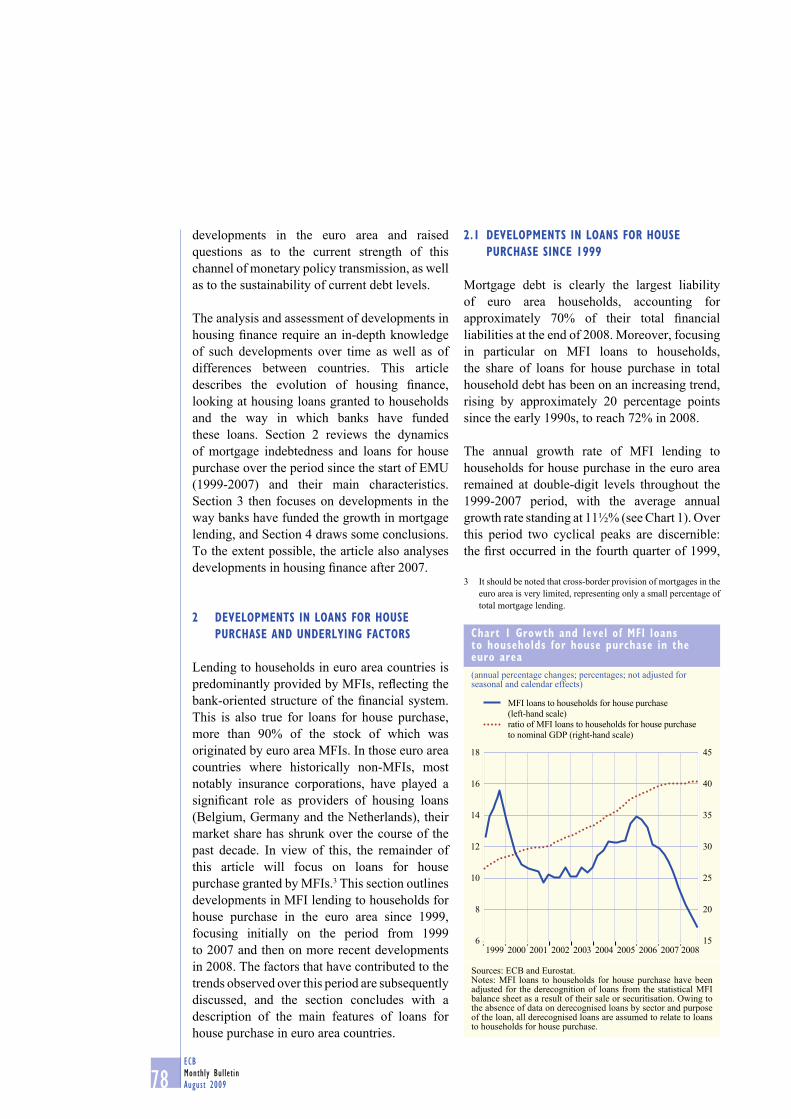
78ECB
Monthly Bulletin
August 2009
developments in the euro area and raised
questions as to the current strength of this
channel of monetary policy transmission, as well
as to the sustainability of current debt levels.
The analysis and assessment of developments in
housing fi nance require an in-depth knowledge
of such developments over time as well as of
differences between countries. This article
describes the evolution of housing fi nance,
looking at housing loans granted to households
and the way in which banks have funded
these loans. Section 2 reviews the dynamics
of mortgage indebtedness and loans for house
purchase over the period since the start of EMU
(1999-2007) and their main characteristics.
Section 3 then focuses on developments in the
way banks have funded the growth in mortgage
lending, and Section 4 draws some conclusions.
To the extent possible, the article also analyses
developments in housing fi nance after 2007.
2 DEVELOPMENTS IN LOANS FOR HOUSE
PURCHASE AND UNDERLYING FACTORS
Lending to households in euro area countries is
predominantly provided by MFIs, refl ecting the
bank-oriented structure of the fi nancial system.
This is also true for loans for house purchase,
more than 90% of the stock of which was
originated by euro area MFIs. In those euro area
countries where historically non-MFIs, most
notably insurance corporations, have played a
signifi cant role as providers of housing loans
(Belgium, Germany and the Netherlands), their
market share has shrunk over the course of the
past decade. In view of this, the remainder of
this article will focus on loans for house
purchase granted by MFIs.3 This section outlines
developments in MFI lending to households for
house purchase in the euro area since 1999,
focusing initially on the period from 1999
to 2007 and then on more recent developments
in 2008. The factors that have contributed to the
trends observed over this period are subsequently
discussed, and the section concludes with a
description of the main features of loans for
house purchase in euro area countries.
2.1 DEVELOPMENTS IN LOANS FOR HOUSE
PURCHASE SINCE 1999
Mortgage debt is clearly the largest liability
of euro area households, accounting for
approximately 70% of their total fi nancial
liabilities at the end of 2008. Moreover, focusing
in particular on MFI loans to households,
the share of loans for house purchase in total
household debt has been on an increasing trend,
rising by approximately 20 percentage points
since the early 1990s, to reach 72% in 2008.
The annual growth rate of MFI lending to
households for house purchase in the euro area
remained at double-digit levels throughout the
1999-2007 period, with the average annual
growth rate standing at 11½% (see Chart 1). Over
this period two cyclical peaks are discernible:
the fi rst occurred in the fourth quarter of 1999,
It should be noted that cross-border provision of mortgages in the 3
euro area is very limited, representing only a small percentage of
total mortgage lending.
Chart 1 Growth and level of MFI loans to households for house purchase in the euro area
(annual percentage changes; percentages; not adjusted for seasonal and calendar effects)
6
8
10
12
14
16
18
15
20
25
30
35
40
45
MFI loans to households for house purchase
(left-hand scale)ratio of MFI loans to households for house purchase
to nominal GDP (right-hand scale)
1999 2000 2001 2002 2003 2004 2005 2006 2007 2008
Sources: ECB and Eurostat.Notes: MFI loans to households for house purchase have been adjusted for the derecognition of loans from the statistical MFI balance sheet as a result of their sale or securitisation. Owing to the absence of data on derecognised loans by sector and purpose of the loan, all derecognised loans are assumed to relate to loans to households for house purchase.
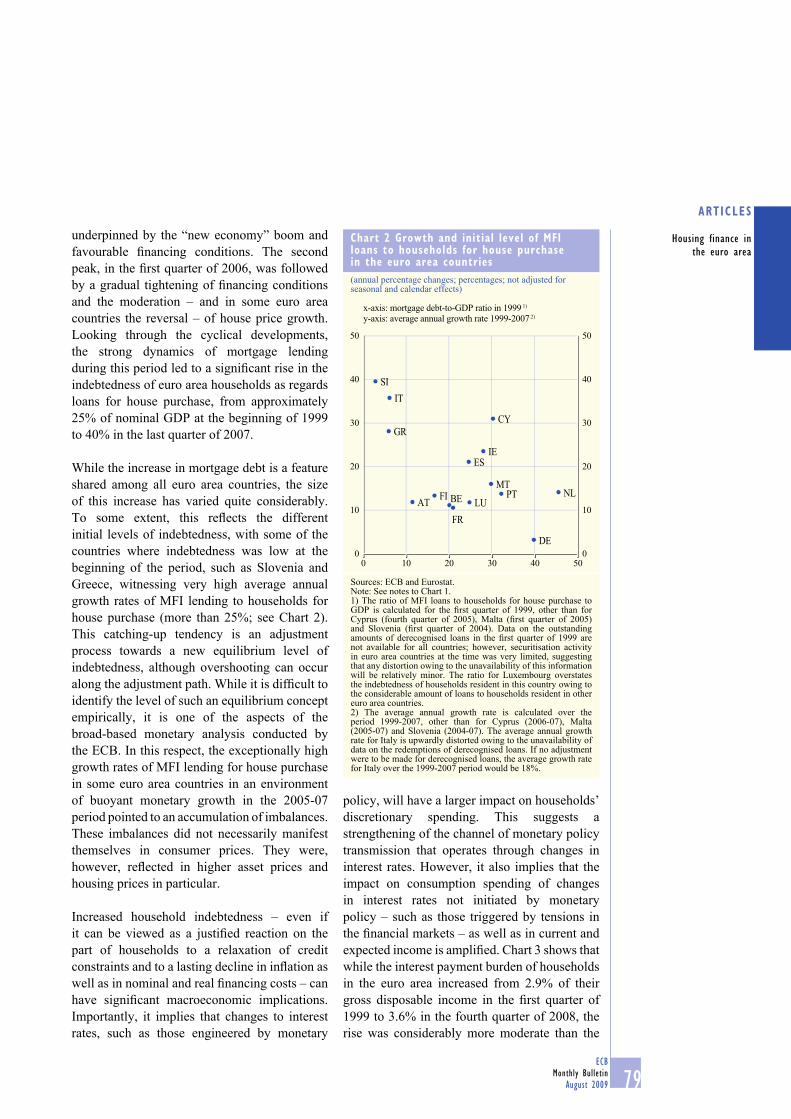
79ECB
Monthly Bulletin
August 2009
ARTICLES
Housing finance in
the euro area
underpinned by the “new economy” boom and
favourable fi nancing conditions. The second
peak, in the fi rst quarter of 2006, was followed
by a gradual tightening of fi nancing conditions
and the moderation – and in some euro area
countries the reversal – of house price growth.
Looking through the cyclical developments,
the strong dynamics of mortgage lending
during this period led to a signifi cant rise in the
indebtedness of euro area households as regards
loans for house purchase, from approximately
25% of nominal GDP at the beginning of 1999
to 40% in the last quarter of 2007.
While the increase in mortgage debt is a feature
shared among all euro area countries, the size
of this increase has varied quite considerably.
To some extent, this refl ects the different
initial levels of indebtedness, with some of the
countries where indebtedness was low at the
beginning of the period, such as Slovenia and
Greece, witnessing very high average annual
growth rates of MFI lending to households for
house purchase (more than 25%; see Chart 2).
This catching-up tendency is an adjustment
process towards a new equilibrium level of
indebtedness, although overshooting can occur
along the adjustment path. While it is diffi cult to
identify the level of such an equilibrium concept
empirically, it is one of the aspects of the
broad-based monetary analysis conducted by
the ECB. In this respect, the exceptionally high
growth rates of MFI lending for house purchase
in some euro area countries in an environment
of buoyant monetary growth in the 2005-07
period pointed to an accumulation of imbalances.
These imbalances did not necessarily manifest
themselves in consumer prices. They were,
however, refl ected in higher asset prices and
housing prices in particular.
Increased household indebtedness – even if
it can be viewed as a justifi ed reaction on the
part of households to a relaxation of credit
constraints and to a lasting decline in infl ation as
well as in nominal and real fi nancing costs – can
have signifi cant macroeconomic implications.
Importantly, it implies that changes to interest
rates, such as those engineered by monetary
policy, will have a larger impact on households’
discretionary spending. This suggests a
strengthening of the channel of monetary policy
transmission that operates through changes in
interest rates. However, it also implies that the
impact on consumption spending of changes
in interest rates not initiated by monetary
policy – such as those triggered by tensions in
the fi nancial markets – as well as in current and
expected income is amplifi ed. Chart 3 shows that
while the interest payment burden of households
in the euro area increased from 2.9% of their
gross disposable income in the fi rst quarter of
1999 to 3.6% in the fourth quarter of 2008, the
rise was considerably more moderate than the
Chart 2 Growth and initial level of MFI loans to households for house purchase in the euro area countries
(annual percentage changes; percentages; not adjusted for seasonal and calendar effects)
x-axis: mortgage debt-to-GDP ratio in 1999 1)
y-axis: average annual growth rate 1999-2007 2)
0
10
20
30
40
50
0
10
20
30
40
50
50
AT BE
CY
DE
ES
FI
FR
GR
IE
IT
LU
MTNLPT
SI
0 10 20 30 40
Sources: ECB and Eurostat.Note: See notes to Chart 1.1) The ratio of MFI loans to households for house purchase to GDP is calculated for the fi rst quarter of 1999, other than for Cyprus (fourth quarter of 2005), Malta (fi rst quarter of 2005) and Slovenia (fi rst quarter of 2004). Data on the outstanding amounts of derecognised loans in the fi rst quarter of 1999 are not available for all countries; however, securitisation activity in euro area countries at the time was very limited, suggesting that any distortion owing to the unavailability of this information will be relatively minor. The ratio for Luxembourg overstates the indebtedness of households resident in this country owing to the considerable amount of loans to households resident in other euro area countries.2) The average annual growth rate is calculated over the period 1999-2007, other than for Cyprus (2006-07), Malta (2005-07) and Slovenia (2004-07). The average annual growth rate for Italy is upwardly distorted owing to the unavailability of data on the redemptions of derecognised loans. If no adjustment were to be made for derecognised loans, the average growth rate for Italy over the 1999-2007 period would be 18%.

80ECB
Monthly Bulletin
August 2009
rise in indebtedness. Moreover, the increase
was not continuous throughout the period, as
the interest payment burden decreased between
2001 and mid-2005 in the context of falling and
then stable interest rates. From late 2005, by
contrast, the gradual removal of monetary policy
accommodation was refl ected in a renewed
rise in the interest payment burden, which was
interrupted by the steep decline in key policy
rates in the last quarter of 2008.
The increase in household indebtedness related
to loans for house purchase is mirrored in the
acquisition of housing wealth by households.
Despite the strong rise in household indebtedness
since 1999, net housing wealth (i.e. housing
wealth net of loans for house purchase) has
increased. This refl ects both a valuation effect
stemming from the robust house price dynamics
throughout most of this period as well as the fact
that households in euro area countries typically
need to complement the funds borrowed with
own resources in order to acquire housing (in
other words, loan-to-value ratios are typically
well below 100%).4
The monitoring of developments in household
indebtedness, interest payment burden and
net wealth is crucial not only in view of the
macroeconomic considerations outlined above
but also for assessing the vulnerability of the
household sector.5 This, in turn, has implications
for the stability of the MFI sector, which is the
largest lender to households. At the same time,
aggregate developments for the household
sector as a whole can mask risk concentrations
arising from a skewed distribution of debt
across individual households and mismatches
between the levels of assets and liabilities
among households, suggesting that this analysis
needs to be complemented by an examination of
household-level data provided by surveys.6
When tensions erupted in the fi nancial markets
in the summer of 2007, the dynamics of MFI
lending to households for house purchase were
already on a moderating path, as house price
growth was losing steam and lending rates were
rising in response to the gradual tightening of
monetary policy after December 2005. The
rapid deterioration in the macroeconomic
environment and the sharp increase in
uncertainty that ensued further weakened
demand for mortgage loans. Developments in
the housing market and the macroeconomic
environment also affected credit institutions’
attitudes towards lending, leading to a marked
tightening of their credit standards. Moreover,
factors relating to the condition of the banking
sector, such as balance sheet constraints as
For a review of developments in housing wealth in the euro area 4
and their link with private consumption, see the article entitled
“Housing wealth and private consumption in the euro area” in
the January 2009 issue of the Monthly Bulletin.
An assessment of the vulnerability of the household sector on the 5
basis of, among other things, these indicators is made regularly
in the ECB’s Financial Stability Review.
An analysis of the available survey data from euro area countries 6
is presented in the box entitled “Distribution of mortgage debt
across the population: indications from national household
surveys” in “Housing fi nance in the euro area”, ECB Occasional
Paper No 101, 2009.
Chart 3 Household interest payments and net housing wealth in the euro area
(percentages of gross disposable household income; not adjusted for seasonal and calendar effects)
2.0
2.5
3.0
3.5
4.0
4.5
1999 2000 2001 2002 2003 2004 2005 2006 2007 2008200
250
300
350
400
450
household interest payments (left-hand scale) 1)
household net housing wealth (right-hand scale) 2)
Sources: ECB and Eurostat.1) Interest payments refer to all payments of interest made by households, regardless of the purpose of the underlying loan.2) Household net housing wealth is calculated as household housing wealth (net of depreciation) less MFI loans to households for house purchase adjusted for the derecognition of loans (see notes to Chart 1).

81ECB
Monthly Bulletin
August 2009
ARTICLES
Housing finance in
the euro area
well as funding and liquidity considerations,
reinforced this tightening (see Chart 4). As a
result, the moderation in MFI lending dynamics
continued unabated, resulting in annual growth
rates that were lower than those observed
during the trough of the previous cycle at the
end of 2001. Indeed, in nominal terms the
growth rate observed in the fi rst quarter of
2009 for MFI loans to households for house
purchase was the lowest since the series began
in 1980. However, in real terms (using the GDP
defl ator) the annual growth rate of MFI loans to
households for house purchase has not dropped
to the levels observed in 1982 and 1991. In any
case, the weak dynamics in such lending over
the most recent quarters should be put into
perspective against the unprecedented level of
household indebtedness and the exceptionally
high growth rates witnessed in some euro area
countries in the preceding years. In this respect,
the current weakness of mortgage lending could
be viewed as part of a warranted unwinding of
past imbalances.
2.2 DETERMINANTS OF TRENDS IN LOANS FOR
HOUSE PURCHASE
Besides the level of household indebtedness,
other factors have clearly been instrumental in
shaping the dynamics of mortgage lending in
the euro area. These factors relate to, among
other things, housing market developments,
the macroeconomic environment (as refl ected
in the level and volatility of income growth
and infl ation as well as in the level of interest
rates), demographic developments and the
characteristics of the fi nancial systems in terms
of their degree of liberalisation and effi ciency.
Moreover, cross-country heterogeneity in these
factors is crucial for understanding the disparity
in the average rate of increase of household
indebtedness across euro area countries.
The evolution of household borrowing for
house purchase is closely linked to housing
market developments. Between 1999 and 2007
residential property prices increased at an
average annual rate of 6.1% in the euro area,
which implies a cumulated increase of around
70% (see Chart 5). Considerable heterogeneity
was observed among euro area countries,
however, with particularly high average annual
growth in housing prices in Ireland and Spain,
countries where household borrowing for house
purchase also increased very markedly. In
Germany, housing prices declined at an average
annual rate of 0.4% during the period under
consideration, which is consistent with the very
weak loan growth dynamics also observed. In
principle, higher property prices tend to lead to
higher funding needs and therefore increased
borrowing. In addition, the amount of borrowing
that households can obtain is typically
constrained by the value of the collateral they
can offer. Increased property prices raise the
value of borrowers’ collateral and therefore
their borrowing capacity. At the same time, the
increased availability of credit can also exert an
upward infl uence on house prices, particularly in
the short run when the supply of housing cannot
fully adjust. A bi-directional causal relationship
is most plausible; however, this is ultimately an
empirical question.
Chart 4 Changes in credit standards applied to loans to households for house purchase, contributing factors and changes in perceptions of loan demand
(net percentages)
-80
-60
-40
-20
0
20
40
60
-80
-60
-40
-20
0
20
40
60
cost of funds and balance sheet constraints
expectations regarding economic activity
housing market prospects
credit standardsdemand for loans
2003 2004 2005 2006 2007 2008
Source: ECB.Notes: Vertical lines denote the start of the fi nancial market turmoil (black line) and its intensifi cation following the collapse of Lehman Brothers (blue line). The series shown refer to net percentages of answers to the relevant questions as reported in the respective bank lending surveys for the euro area.
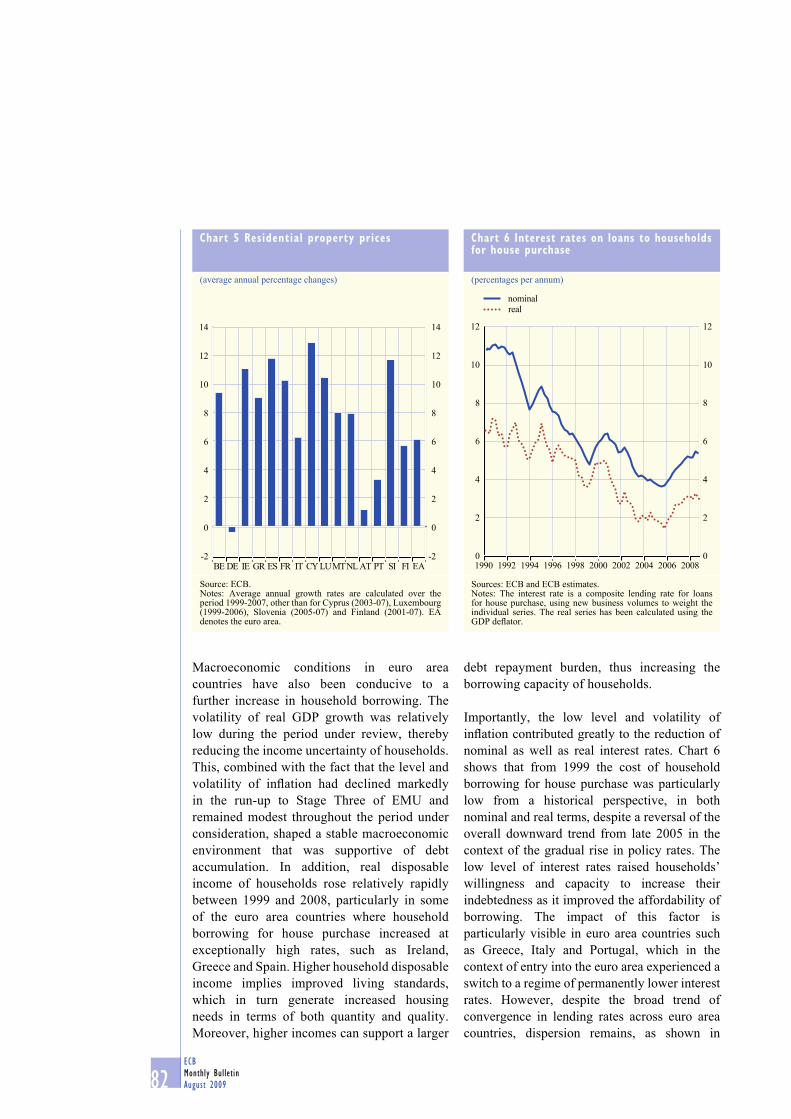
82ECB
Monthly Bulletin
August 2009
Macroeconomic conditions in euro area
countries have also been conducive to a
further increase in household borrowing. The
volatility of real GDP growth was relatively
low during the period under review, thereby
reducing the income uncertainty of households.
This, combined with the fact that the level and
volatility of infl ation had declined markedly
in the run-up to Stage Three of EMU and
remained modest throughout the period under
consideration, shaped a stable macroeconomic
environment that was supportive of debt
accumulation. In addition, real disposable
income of households rose relatively rapidly
between 1999 and 2008, particularly in some
of the euro area countries where household
borrowing for house purchase increased at
exceptionally high rates, such as Ireland,
Greece and Spain. Higher household disposable
income implies improved living standards,
which in turn generate increased housing
needs in terms of both quantity and quality.
Moreover, higher incomes can support a larger
debt repayment burden, thus increasing the
borrowing capacity of households.
Importantly, the low level and volatility of
infl ation contributed greatly to the reduction of
nominal as well as real interest rates. Chart 6
shows that from 1999 the cost of household
borrowing for house purchase was particularly
low from a historical perspective, in both
nominal and real terms, despite a reversal of the
overall downward trend from late 2005 in the
context of the gradual rise in policy rates. The
low level of interest rates raised households’
willingness and capacity to increase their
indebtedness as it improved the affordability of
borrowing. The impact of this factor is
particularly visible in euro area countries such
as Greece, Italy and Portugal, which in the
context of entry into the euro area experienced a
switch to a regime of permanently lower interest
rates. However, despite the broad trend of
convergence in lending rates across euro area
countries, dispersion remains, as shown in
Chart 5 Residential property prices
(average annual percentage changes)
-2
0
2
4
6
8
10
12
14
-2
0
2
4
6
8
10
12
14
BE DE IE GR ES FR IT CY LUMTNL AT PT SI FI EA
Source: ECB.Notes: Average annual growth rates are calculated over the period 1999-2007, other than for Cyprus (2003-07), Luxembourg (1999-2006), Slovenia (2005-07) and Finland (2001-07). EA denotes the euro area.
Chart 6 Interest rates on loans to households for house purchase
(percentages per annum)
0
2
4
6
8
10
12
0
2
4
6
8
10
12
nominal
real
1990 1992 1994 1996 1998 2000 2002 2004 2006 2008
Sources: ECB and ECB estimates.Notes: The interest rate is a composite lending rate for loans for house purchase, using new business volumes to weight the individual series. The real series has been calculated using the GDP defl ator.
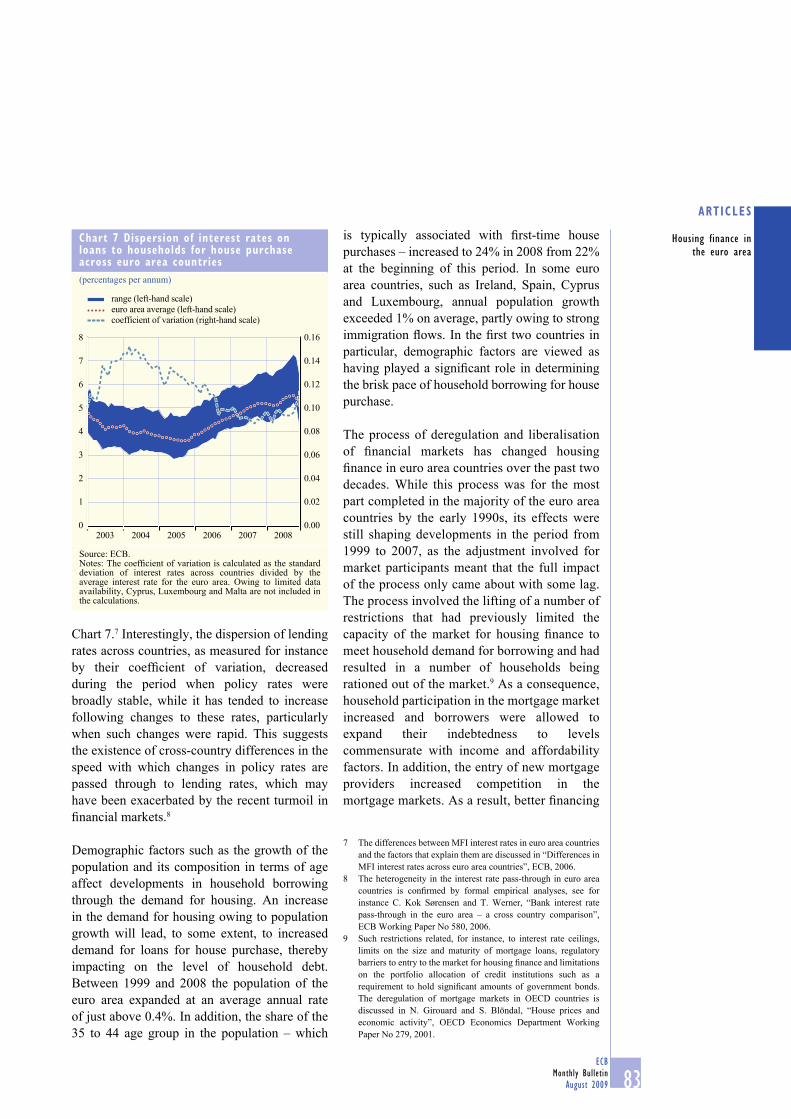
83
ARTICLES
Housing finance in
the euro area
ECB
Monthly Bulletin
August 2009
Chart 7.7 Interestingly, the dispersion of lending
rates across countries, as measured for instance
by their coeffi cient of variation, decreased
during the period when policy rates were
broadly stable, while it has tended to increase
following changes to these rates, particularly
when such changes were rapid. This suggests
the existence of cross-country differences in the
speed with which changes in policy rates are
passed through to lending rates, which may
have been exacerbated by the recent turmoil in
fi nancial markets.8
Demographic factors such as the growth of the
population and its composition in terms of age
affect developments in household borrowing
through the demand for housing. An increase
in the demand for housing owing to population
growth will lead, to some extent, to increased
demand for loans for house purchase, thereby
impacting on the level of household debt.
Between 1999 and 2008 the population of the
euro area expanded at an average annual rate
of just above 0.4%. In addition, the share of the
35 to 44 age group in the population – which
is typically associated with fi rst-time house
purchases – increased to 24% in 2008 from 22%
at the beginning of this period. In some euro
area countries, such as Ireland, Spain, Cyprus
and Luxembourg, annual population growth
exceeded 1% on average, partly owing to strong
immigration fl ows. In the fi rst two countries in
particular, demographic factors are viewed as
having played a signifi cant role in determining
the brisk pace of household borrowing for house
purchase.
The process of deregulation and liberalisation
of fi nancial markets has changed housing
fi nance in euro area countries over the past two
decades. While this process was for the most
part completed in the majority of the euro area
countries by the early 1990s, its effects were
still shaping developments in the period from
1999 to 2007, as the adjustment involved for
market participants meant that the full impact
of the process only came about with some lag.
The process involved the lifting of a number of
restrictions that had previously limited the
capacity of the market for housing fi nance to
meet household demand for borrowing and had
resulted in a number of households being
rationed out of the market.9 As a consequence,
household participation in the mortgage market
increased and borrowers were allowed to
expand their indebtedness to levels
commensurate with income and affordability
factors. In addition, the entry of new mortgage
providers increased competition in the
mortgage markets. As a result, better fi nancing
The differences between MFI interest rates in euro area countries 7
and the factors that explain them are discussed in “Differences in
MFI interest rates across euro area countries”, ECB, 2006.
The heterogeneity in the interest rate pass-through in euro area 8
countries is confi rmed by formal empirical analyses, see for
instance C. Kok Sørensen and T. Werner, “Bank interest rate
pass-through in the euro area – a cross country comparison”,
ECB Working Paper No 580, 2006.
Such restrictions related, for instance, to interest rate ceilings, 9
limits on the size and maturity of mortgage loans, regulatory
barriers to entry to the market for housing fi nance and limitations
on the portfolio allocation of credit institutions such as a
requirement to hold signifi cant amounts of government bonds.
The deregulation of mortgage markets in OECD countries is
discussed in N. Girouard and S. Blöndal, “House prices and
economic activity”, OECD Economics Department Working
Paper No 279, 2001.
Chart 7 Dispersion of interest rates on loans to households for house purchase across euro area countries
(percentages per annum)
0
1
2
3
4
5
6
7
8
0.00
0.02
0.04
0.06
0.08
0.10
0.12
0.14
0.16
20082003 2004 2005 2006 2007
range (left-hand scale)
coefficient of variation (right-hand scale)
euro area average (left-hand scale)
Source: ECB.Notes: The coeffi cient of variation is calculated as the standard deviation of interest rates across countries divided by the average interest rate for the euro area. Owing to limited data availability, Cyprus, Luxembourg and Malta are not included in the calculations.
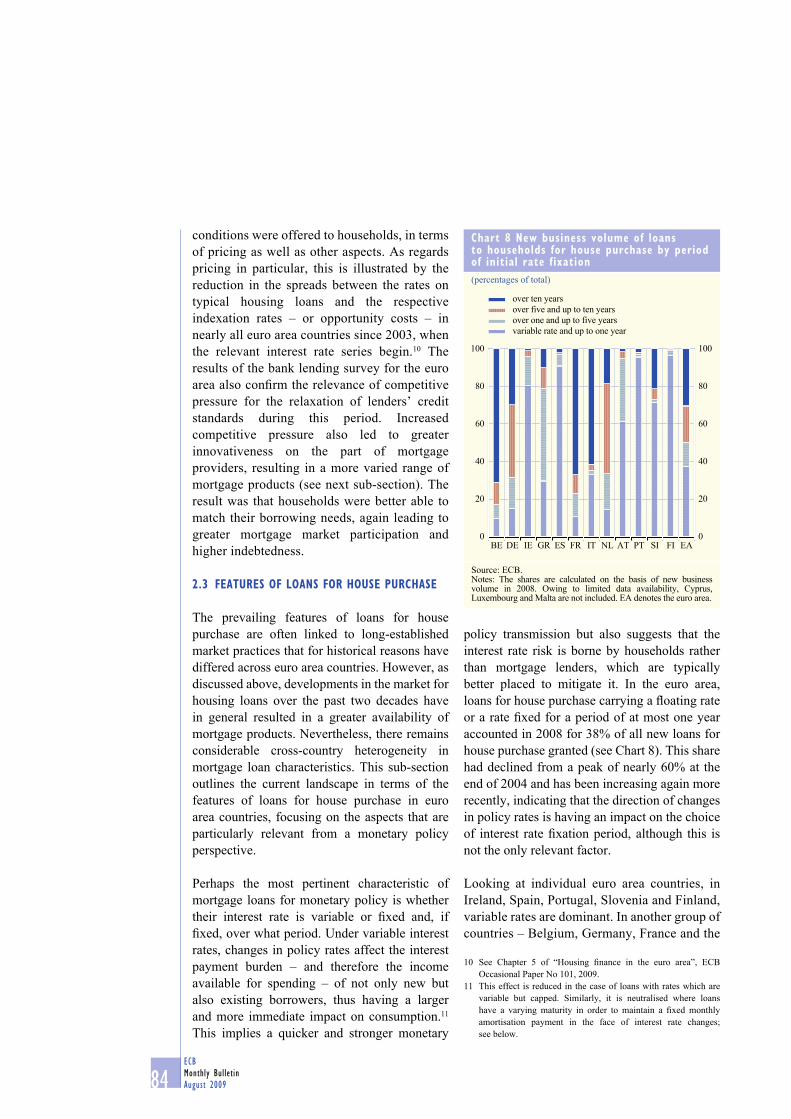
84ECB
Monthly Bulletin
August 2009
conditions were offered to households, in terms
of pricing as well as other aspects. As regards
pricing in particular, this is illustrated by the
reduction in the spreads between the rates on
typical housing loans and the respective
indexation rates – or opportunity costs – in
nearly all euro area countries since 2003, when
the relevant interest rate series begin.10 The
results of the bank lending survey for the euro
area also confi rm the relevance of competitive
pressure for the relaxation of lenders’ credit
standards during this period. Increased
competitive pressure also led to greater
innovativeness on the part of mortgage
providers, resulting in a more varied range of
mortgage products (see next sub-section). The
result was that households were better able to
match their borrowing needs, again leading to
greater mortgage market participation and
higher indebtedness.
2.3 FEATURES OF LOANS FOR HOUSE PURCHASE
The prevailing features of loans for house
purchase are often linked to long-established
market practices that for historical reasons have
differed across euro area countries. However, as
discussed above, developments in the market for
housing loans over the past two decades have
in general resulted in a greater availability of
mortgage products. Nevertheless, there remains
considerable cross-country heterogeneity in
mortgage loan characteristics. This sub-section
outlines the current landscape in terms of the
features of loans for house purchase in euro
area countries, focusing on the aspects that are
particularly relevant from a monetary policy
perspective.
Perhaps the most pertinent characteristic of
mortgage loans for monetary policy is whether
their interest rate is variable or fi xed and, if
fi xed, over what period. Under variable interest
rates, changes in policy rates affect the interest
payment burden – and therefore the income
available for spending – of not only new but
also existing borrowers, thus having a larger
and more immediate impact on consumption.11
This implies a quicker and stronger monetary
policy transmission but also suggests that the
interest rate risk is borne by households rather
than mortgage lenders, which are typically
better placed to mitigate it. In the euro area,
loans for house purchase carrying a fl oating rate
or a rate fi xed for a period of at most one year
accounted in 2008 for 38% of all new loans for
house purchase granted (see Chart 8). This share
had declined from a peak of nearly 60% at the
end of 2004 and has been increasing again more
recently, indicating that the direction of changes
in policy rates is having an impact on the choice
of interest rate fi xation period, although this is
not the only relevant factor.
Looking at individual euro area countries, in
Ireland, Spain, Portugal, Slovenia and Finland,
variable rates are dominant. In another group of
countries – Belgium, Germany, France and the
See Chapter 5 of “Housing fi nance in the euro area”, ECB 10
Occasional Paper No 101, 2009.
This effect is reduced in the case of loans with rates which are 11
variable but capped. Similarly, it is neutralised where loans
have a varying maturity in order to maintain a fi xed monthly
amortisation payment in the face of interest rate changes;
see below.
Chart 8 New business volume of loans to households for house purchase by period of initial rate fixation
(percentages of total)
0
20
40
60
80
100
0
20
40
60
80
100
over ten years
over five and up to ten years
over one and up to five years
variable rate and up to one year
BE DE IE GR ES FR IT NL AT PT SI FI EA
Source: ECB.Notes: The shares are calculated on the basis of new business volume in 2008. Owing to limited data availability, Cyprus, Luxembourg and Malta are not included. EA denotes the euro area.
85ECB
Monthly Bulletin
August 2009
ARTICLES
Housing finance in
the euro area
Netherlands – loans with an initial rate fi xation
period of more than fi ve years account for well
above 60% of all new loans for house purchase
granted. While the breakdown for this country
grouping has remained relatively stable over
time, in Italy and particularly Greece the share
of loans with a fl oating rate or a rate fi xed
for a period of up to one year has decreased
sharply since 2007. The reference rate used
for adjusting variable rates is in most cases
the EURIBOR (at the three, six and twelve-
month maturities), although in some countries
other reference rates are also used, notably
the rate on the main refi nancing operations
of the Eurosystem. While under normally
functioning money markets the choice of
reference rate is not of great importance, since
the onset of the fi nancial market turmoil it has
become a matter of some consequence as the
unprecedented increase in the spread between
market and policy rates, which was not priced
in, has implied a relatively lower interest rate
for borrowers with loans indexed to the rate
on the main refi nancing operations of the
Eurosystem.
From a monetary policy perspective, fi xation
of interest rates on loans for house purchase
needs to be considered in conjunction with
the existence and cost of the option of early
repayment. This is because even borrowers with
loans carrying a fi xed interest rate can benefi t
directly from a reduction in interest rates if they
are able to refi nance their loans. In addition,
these borrowers are shielded from upward
movements in interest rates, which implies that
the effects of monetary policy in tightening
and loosening phases can be asymmetric. The
ability of borrowers to refi nance depends on
whether early repayment of their existing loan is
possible and at what cost. Partial and total early
repayments are in principle possible in all euro
area countries. Whereas in several countries
early repayment is free of charge in the case of
variable rate loans, the repayment of fi xed rate
loans typically carries a fee, the size of which
depends on factors such as the amount to be
repaid and the remaining maturity of the loan.
While in some countries such fees are capped
by law, in others they are too high to make early
repayment attractive to borrowers. Finally, in
some cases no fee is charged upon repayment
but the inclusion of the option to repay in the
mortgage contract implies an increase in the
interest rate of about 50 basis points.
The typical maturity of loans for house purchase
in euro area countries ranges between 20 and
30 years and has increased on average since
1999, refl ecting the impact of higher house
prices, increased life expectancy and greater
availability – at least before the emergence of the
fi nancial market turmoil – of longer-term funding
sources for mortgage lenders. An interesting
development has been the introduction of loans
with variable maturity, i.e. a maturity that is
extended or reduced so as to maintain a constant
monthly instalment in the face of changes in
interest rates. These loans allow households to
smooth the effect that changes in interest rates
have on their discretionary spending.
The gradual increase in the typical maturity of
loans for house purchase since 1999 is also
related to a rise in the loan-to-value (LTV) ratios
that has been observed in most euro area
countries during this period, as extended
maturities allow larger amounts to be borrowed
while maintaining the affordability of monthly
amortisation payments. In 2007 the average
LTV of new loans for house purchase 12 in the
euro area was around 80%, with the typical
ratios in individual countries ranging from 63%
(in Malta) to 101% (in the Netherlands). Higher
LTV ratios imply that house purchases become
more attainable for fi rst-time buyers, given that
they are less constrained by the amount that they
can offer as a downpayment. At the same time,
higher LTV ratios entail an increased risk that
adverse house price movements will push
borrowers into negative equity on their property.
This can be a particularly challenging situation
when, for instance, the period for which the rate
on the loan has been agreed is expiring and the
pricing of the loan needs to be renegotiated.
This refers to the LTV ratio for a fi rst-time buyer.12
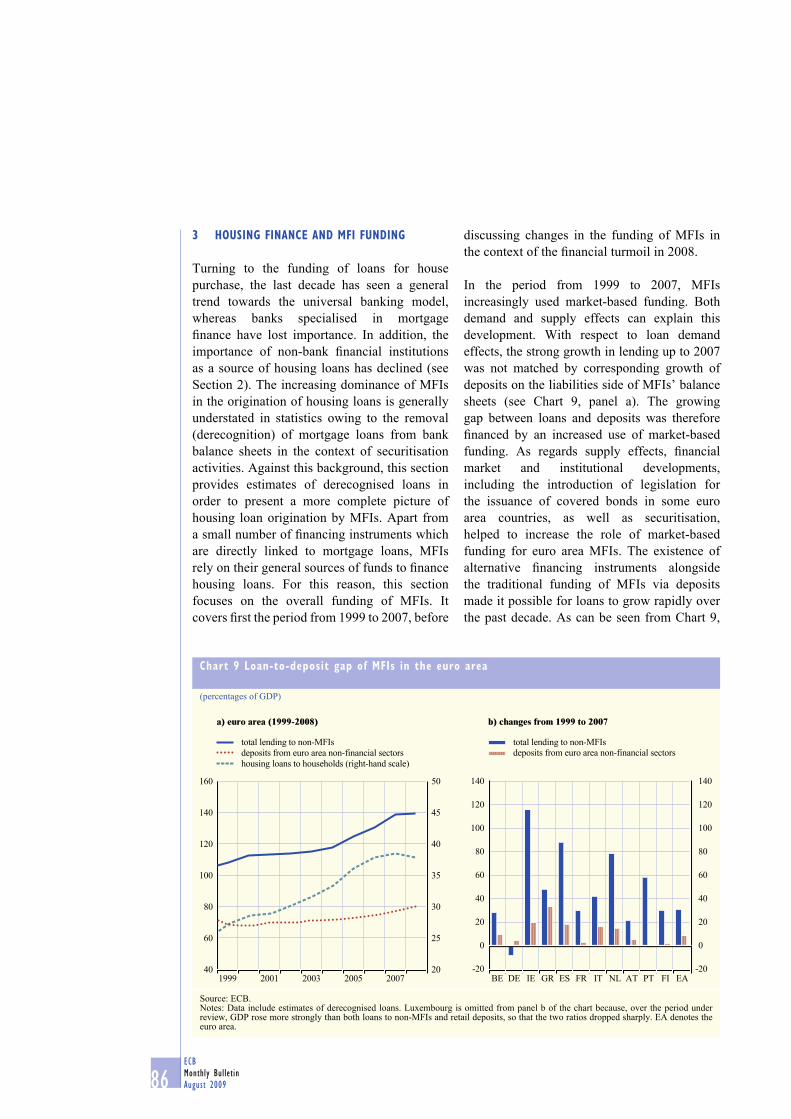
86ECB
Monthly Bulletin
August 2009
3 HOUSING FINANCE AND MFI FUNDING
Turning to the funding of loans for house
purchase, the last decade has seen a general
trend towards the universal banking model,
whereas banks specialised in mortgage
fi nance have lost importance. In addition, the
importance of non-bank fi nancial institutions
as a source of housing loans has declined (see
Section 2). The increasing dominance of MFIs
in the origination of housing loans is generally
understated in statistics owing to the removal
(derecognition) of mortgage loans from bank
balance sheets in the context of securitisation
activities. Against this background, this section
provides estimates of derecognised loans in
order to present a more complete picture of
housing loan origination by MFIs. Apart from
a small number of fi nancing instruments which
are directly linked to mortgage loans, MFIs
rely on their general sources of funds to fi nance
housing loans. For this reason, this section
focuses on the overall funding of MFIs. It
covers fi rst the period from 1999 to 2007, before
discussing changes in the funding of MFIs in
the context of the fi nancial turmoil in 2008.
In the period from 1999 to 2007, MFIs
increasingly used market-based funding. Both
demand and supply effects can explain this
development. With respect to loan demand
effects, the strong growth in lending up to 2007
was not matched by corresponding growth of
deposits on the liabilities side of MFIs’ balance
sheets (see Chart 9, panel a). The growing
gap between loans and deposits was therefore
fi nanced by an increased use of market-based
funding. As regards supply effects, fi nancial
market and institutional developments,
including the introduction of legislation for
the issuance of covered bonds in some euro
area countries, as well as securitisation,
helped to increase the role of market-based
funding for euro area MFIs. The existence of
alternative fi nancing instruments alongside
the traditional funding of MFIs via deposits
made it possible for loans to grow rapidly over
the past decade. As can be seen from Chart 9,
Chart 9 Loan-to-deposit gap of MFIs in the euro area
(percentages of GDP)
a) euro area (1999-2008) b) changes from 1999 to 2007
40
60
80
100
120
140
160
20
25
30
35
40
45
50
total lending to non-MFIs
deposits from euro area non-financial sectors
housing loans to households (right-hand scale)
1999 2001 2003 2005 2007-20
0
20
40
60
80
100
120
140
-20
0
20
40
60
80
100
120
140
total lending to non-MFIs
deposits from euro area non-financial sectors
BE DE IE GR ES FR IT NL AT PT FI EA
Source: ECB.Notes: Data include estimates of derecognised loans. Luxembourg is omitted from panel b of the chart because, over the period under review, GDP rose more strongly than both loans to non-MFIs and retail deposits, so that the two ratios dropped sharply. EA denotes the euro area.

87ECB
Monthly Bulletin
August 2009
ARTICLES
Housing finance in
the euro area
panel b, euro area countries with the highest
growth in total loans (including derecognised
loans) to non-MFIs in relation to GDP over
the period from 1999 to 2007 (Ireland, Spain,
the Netherlands and Portugal) were those that
experienced the strongest increases in loan-
to-deposit gaps. It was only in Germany that
the growth of deposits from the euro area
non-fi nancial sectors slightly exceeded that of
total loans, which was negative in relation to
GDP in the period under review.
3.1 SOURCES OF FUNDING OF MFIs
To analyse MFIs’ funding, bank liabilities
have been classifi ed into several categories
(see Chart 10). Deposits from the euro area
non-fi nancial sectors can be seen as a proxy for
retail deposits and represent a relatively stable
source of funding for MFIs, but their maturity
is on average much shorter than the maturity of
housing loans. Retail deposits are generally less
sensitive to changes in risk perceptions, and their
remuneration is typically lower, compared with
wholesale deposits. At the same time, heightened
competition from internet banks and mutual
funds has helped to increase the remuneration
of retail deposits in recent years. Deposits from
non-MFIs not resident in the euro area, which
can be characterised as wholesale deposits,
are somewhat less stable, owing to foreign
exchange risks and a greater dependence on
economic sentiment. With few exceptions, they
are placed by large fi rms or fi nancial companies.
Sources of funding such as interbank fi nancing,
the issuance of debt securities and securitisation
are even less stable sources of funding, as
they are either of a very short-term nature or
are strongly dependent on market conditions,
as has been experienced in the context of the
recent fi nancial turmoil. For the MFI sector
as a whole, net interbank lending, which is
the difference between inter-MFI deposits
and inter-MFI loans, is generally of relatively
limited importance, as it disregards the lending
and borrowing positions within the MFI sector.
The issuance of debt securities by MFIs, in the
form of secured or unsecured bonds, is more
Chart 10 Alternative sources of funding
(Q4 1999 and Q4 2007; percentages of total MFI loan fi nancing provided to non-MFIs)
-100
-50
50
0
100
150
200
250
-100
-50
50
0
100
150
200
250
BE DE IE GR ES FR IT CY LU MT NL AT PT SI FI EA
net interbank depositsdebt securities issued by MFIs
deposits from euro area non-MFI financial institutions and securitisation
deposits from non-MFIs not resident in the euro area
deposits from euro area non-financial sectors
Source: ECB.Notes: For each country, the fi rst bar refers to the fourth quarter of 1999 and the second bar to the fourth quarter of 2007. For Cyprus, Malta and Slovenia, data are not available for the fourth quarter of 1999. “Deposits from euro area non-MFI fi nancial institutions and securitisation” includes deposits from OFIs and ICPFs and estimates of derecognised loans and represents an estimate of true-sale securitisation. EA denotes the euro area.

88ECB
Monthly Bulletin
August 2009
sensitive than deposits to market conditions.
However, it helps to reduce the maturity
mismatch between assets and liabilities as debt
securities mostly have a longer-term maturity
than deposits. Finally, true-sale securitisation
is a source of funding for MFIs, one which is
highly sensitive to market conditions. As a
result of heterogeneous regulatory requirements
across euro area countries, true-sale securitised
loans are not always derecognised from banks’
balance sheets but are booked as deposits from
“other fi nancial institutions” (OFIs). In order to
take this into account, deposits from OFIs and,
for the sake of simplicity, insurance corporations
and pension funds (ICPFs) are added to the
estimate of derecognised loans in order to obtain
an estimate for true-sale securitisation.
From 1999 to 2007 there were remarkable
changes in the composition of the funding of
MFIs across euro area countries. In all euro area
countries with the exception of Germany, the
ratio of retail deposits to total bank loan
fi nancing provided to non-MFIs declined
(see Chart 10).13 For the euro area, the ratio fell
from 63% in 1999 to 55% in 2007. However,
retail deposits remained the most important
funding source for MFIs, followed by debt
securities, the ratio of which increased by
3 percentage points from 1999 to 2007.
Securitisation, measured as described above,
increased by 8 percentage points over the period
under review. Hence, taking these two funding
sources together, the importance of market-
based funding increased by 11 percentage points
in relation to total bank loan fi nancing provided
to non-MFIs from 1999 to 2007. Such
developments have tended to weaken the
transmission of monetary policy.
The importance of the funding alternatives
varies considerably across euro area countries.
For instance, the share of debt securities ranged
from 1% in Greece to nearly 60% in Germany
in 2007. Securitisation, measured as described
above, was of signifi cant importance particularly
in Spain and the Netherlands in the period under
review. In Greece and Finland, retail deposit-
to-loan ratios were elevated in 1999, so these
countries did not have to resort extensively to
market-based funding sources. In Germany,
Ireland, Spain and Austria, the importance of
debt securities increased considerably in the
funding of MFI loans from 1999 to 2007. In
Germany, this development was mainly due to
weak loan growth and took place despite the
fact that the amount outstanding of mortgage
covered bonds declined from 2005 to 2007.
In Spain, the increased importance of debt
securities was accompanied by an increase
in the importance of securitisation, linked to
the need for greater market-based funding in
view of the strongly rising loan-to-deposit
ratio. In Belgium, Luxembourg and Portugal,
securitisation also gained importance in the
funding of the growing loan-to-deposit ratio
over the period.
3.2 THE ROLE OF COLLATERALISED DEBT
SECURITIES
The growing importance of debt securities
issuance and securitisation in the funding of
housing loans originated by MFIs becomes
particularly visible in an analysis of debt
securities collateralised by mortgage loans
(see Chart 11). These collateralised debt
securities, which are directly linked to the
funding of housing loans, encompass both
mortgage covered bonds and residential
mortgage-backed securities (RMBSs). The two
funding alternatives differ in that, in the case of
covered bonds, which are among the debt
securities issued by MFIs, the covered asset
remains on the originator’s balance sheet; in the
case of RMBSs, the pooled collateral is transferred
to a special purpose vehicle, which then issues
the securities. RMBSs refl ect the amount of
true-sale securitisation of housing loans.
Depending on accounting rules, RMBSs may
allow the originator to remove loans from its
balance sheet and thus obtain capital relief,
Total bank loan fi nancing includes an estimate of derecognised 13
loans. Since total bank loan fi nancing provided to non-MFIs
does not include all bank assets, total funding may exceed total
lending, the difference being other assets held by banks, which
are mainly debt securities.

89ECB
Monthly Bulletin
August 2009
ARTICLES
Housing finance in
the euro area
whereas covered bonds are used mainly to raise
funding in a cost-effi cient manner.14 Together,
the two funding instruments represented about
21% of the amount outstanding of housing loans
in the euro area at the end of 2007, up from 10%
at the end of 1999.
The importance of the two types of collateralised
debt security varies considerably across euro area
countries. At the end of 2007, mortgage covered
bonds were particularly important in relation to
total housing loans in Germany and Spain (both
at 14%) and Ireland and France (both at 10%),
whereas they were of lesser importance in the
other euro area countries. By contrast, RMBSs
were of no importance in Germany but of
considerable importance in Spain (31%), Italy,
the Netherlands and Portugal (between 20% and
25% in these three countries) and Ireland (12%)
in relation to total housing loans.
The increase in the share of RMBSs over the
period under review, compared with a relatively
stable share of mortgage covered bonds, shows
the growing importance of securitisation of
housing loans in the euro area, although it
remained at a low level compared with that
in the United States (see the box entitled
“Institutional differences between mortgage
markets in the euro area and the United States”
in this issue of the Monthly Bulletin). In
addition, it shows that mortgage covered bonds
already played a relevant role in the fi nancing of
housing loans in 1999, particularly in Germany,
where covered bonds have long been used as
a funding instrument for MFIs. The share of
covered bonds in the funding of housing loans
did not change considerably over this period,
mainly as a result of equally strong growth in
housing loans. This notwithstanding, there
has been signifi cant growth of this market in a
number of euro area countries, helped by the
introduction of a legislative framework for
the issuance of covered bonds and by housing
market developments.
3.3 IMPACT OF THE FINANCIAL TURMOIL ON MFI
FUNDING
The fi nancial turmoil which started in mid-2007
had a severe impact on banks’ funding as the
raising of new funds in fi nancial markets was
seriously hampered by investors’ increased risk
aversion and uncertainty about banks’ exposure
to distressed assets.
To some extent, the stronger market orientation
of banks in their funding up to 2007 was
reversed in the context of the fi nancial turmoil
in favour of the more traditional funding based
mainly on deposits, for which banks competed
intensively. The growing importance of deposits
in MFIs’ funding was supported by investors’
reluctance to invest in debt securities and by
the enhanced deposit guarantees provided by
most euro area governments when the fi nancial
turmoil intensifi ed after the Lehman Brothers
bankruptcy in September 2008. The ratio
of retail deposits to total MFI lending to
non-MFIs increased by around 2 percentage
For a detailed explanation of the institutional characteristics of 14
covered bonds and securitisation, see Section 4.4 of “Housing
fi nance in the euro area”, ECB Occasional Paper No 101, 2009.
Chart 11 Secured funding
(Q4 1999 and Q4 2007; percentages of total loans to households for house purchase)
0
5
10
15
20
25
30
35
40
45
50
0
5
10
15
20
25
30
35
40
45
50
EA
covered bonds
residential mortgage-backed securities
BE DE IE GR ES FR IT CY LU MT NL AT PT SI FI
Sources: ECB, NCBs, European Securitisation Forum, European Covered Bond Council and Moody’s.Notes: For each country, the fi rst bar refers to the fourth quarter of 1999 and the second bar to the fourth quarter of 2007. Data include estimates of derecognised loans. In the case of Spain and Portugal, the overwhelming majority of securitisation does not entail derecognition. EA denotes the euro area.
90ECB
Monthly Bulletin
August 2009
points, to 57%, in the euro area in 2008 compared
with 2007. By contrast, market-based funding of
MFIs declined considerably in 2008. The annual
volume of debt securities issued by MFIs fell by
around 40% in 2008 compared with 2007, when
it had been relatively strong. At the same time,
however, securitisation continued in the form
of private placements of collateralised debt
securities, issued by OFIs on the basis of loans
originated by MFIs. MFIs bought back such
debt securities (retained securitisation), to use
them as collateral in central bank open market
operations in order to gain liquidity. This is
refl ected in the slightly larger share of estimated
securitisation in the total loan funding of MFIs
in 2008. By contrast, the relative importance
of funding via deposits from non-MFIs not
resident in the euro area (wholesale deposits)
declined, in line with their greater sensitivity to
the economic environment.
Overall, during the fi nancial turmoil, euro area
banks have shifted away from market-based
fi nancing, owing to the diffi culty of raising funds
in fi nancial markets. Consequently, the move
up to 2007 towards the originate-to-distribute
model, i.e. the repackaging and selling of
credit which banks have originated to other
market participants, has been to some extent
reversed in favour of a more traditional banking
model, where deposits play a major role in
the funding. While the effects of the removal
of loans from banks’ balance sheets vary
across euro area countries owing to different
regulatory frameworks, the adoption of this
model has been, overall, limited in the euro
area, in part owing to accounting rules which
make it more diffi cult to derecognise loans
than in other major industrialised countries
(see the box entitled “Institutional differences
between mortgage markets in the euro area and
the United States” in this issue of the Monthly
Bulletin). A review of the rules governing
the derecognition of loans, with a view to
improving transparency and the incentives
for credit monitoring, will be important for
the normalisation of securitisation markets.
At the same time, the experience during
the fi nancial turmoil may result in greater
recourse to alternative – existing or new –
market-based types of bank funding. In this
respect, on-balance sheet funding through the
issuance of covered bonds is likely to play an
increasing role in the funding of MFIs in the
future.
4 CONCLUSION
This article has presented an overview of the
main developments in housing loans granted to
households and their determinants, as well as in
the funding of housing loans by MFIs, over the
period from 1999 to 2007, and in 2008 where
possible.
The strong growth in household mortgage
debt during the past decade was supported by
favourable fi nancing conditions, rising house
prices, increases in households’ real disposable
income and, in some countries, demographic
factors. At the same time, differences in such
factors resulted in considerable heterogeneity of
housing fi nance developments across euro area
countries. Differences in prevailing mortgage
characteristics across euro area countries also
remain, for instance as regards the dominance of
variable or fi xed rate mortgage contracts.
Funding developments over the past decade
refl ect the strong growth in lending. In most euro
area countries housing lending was typically
provided by banks, which increasingly used
market-based funding, including securitisation.
This, in turn, contributed to the easing of credit
standards and the strong growth in housing
loans.
Taken together, these developments seem to
have had a limited effect on the transmission
of monetary policy. It needs to be kept in mind
that the euro area remains a predominantly
bank-based fi nancial system, where, in particular
compared with the United States, non-bank
fi nancing plays a limited role. While higher
household indebtedness points in the direction
of a stronger effect of policy rates on spending,
other developments, such as the increased role of
91ECB
Monthly Bulletin
August 2009
ARTICLES
Housing finance in
the euro area
securitisation, are likely to have weakened the
transmission.
The fi nancial turmoil has changed the
environment for housing fi nance considerably,
strengthening the decline in the annual growth
of housing loans that was already under way.
The deterioration in macroeconomic conditions
and, in some euro area countries, declining
house prices have put strains on households’ net
wealth. At the same time, monetary policy has
helped to lower households’ interest payment
burden, supporting consumer spending. With
respect to banks’ funding, the stronger market
orientation of banks in their funding has to
some extent been reversed in favour of more
traditional deposit-based funding.
Overall, some of the features of the market for
housing fi nance in the euro area, for instance
the overall level of household indebtedness,
the dominant mortgage contract characteristics
and the funding practices of mortgage lenders,
create a structure that makes households, banks
and the economy as a whole more resilient to
shocks than in economies where mortgage
markets are more fl exible. At the same time,
further integration of mortgage markets across
euro area countries would tend to increase the
range of products available to households and
promote competition in the supply of mortgages,
with benefi cial effects for borrowers as well as,
from a broader perspective, the effectiveness of
the monetary policy transmission mechanism.

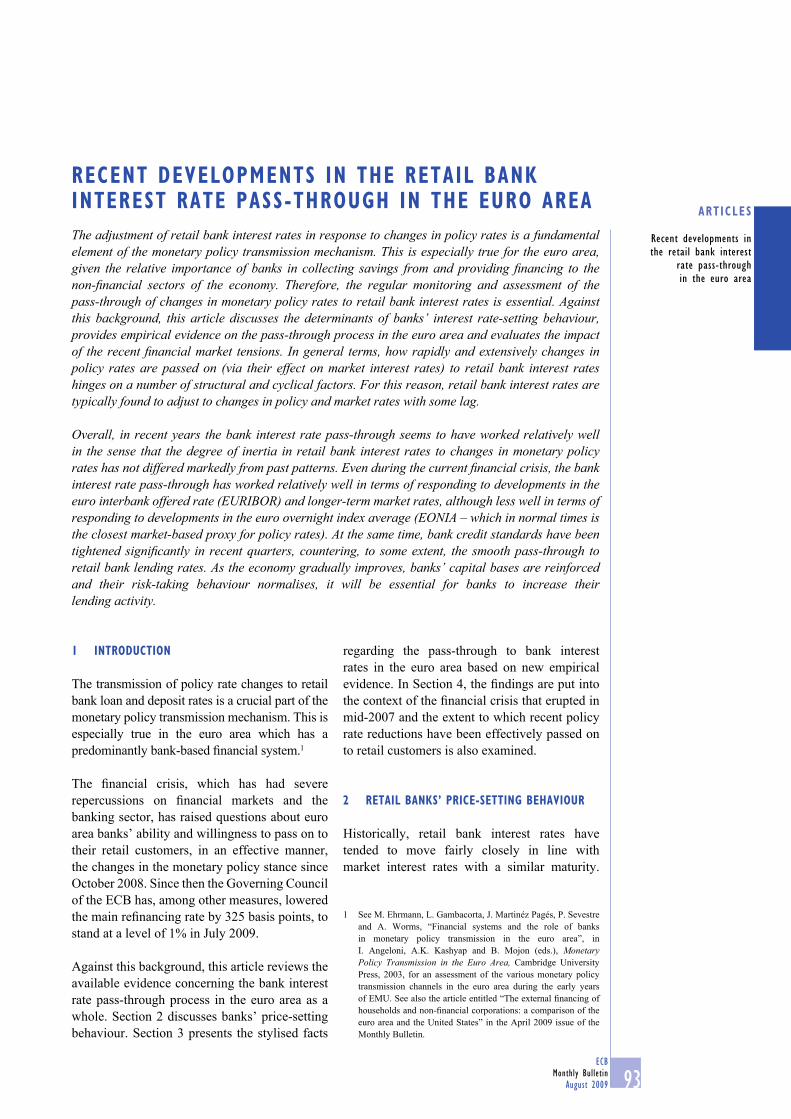
93ECB
Monthly Bulletin
August 2009
ARTICLES
Recent developments in
the retail bank interest
rate pass-through
in the euro area
RECENT DEVELOPMENTS IN THE RETAIL BANK INTEREST RATE PASS-THROUGH IN THE EURO AREA
The adjustment of retail bank interest rates in response to changes in policy rates is a fundamental element of the monetary policy transmission mechanism. This is especially true for the euro area, given the relative importance of banks in collecting savings from and providing fi nancing to the non-fi nancial sectors of the economy. Therefore, the regular monitoring and assessment of the pass-through of changes in monetary policy rates to retail bank interest rates is essential. Against this background, this article discusses the determinants of banks’ interest rate-setting behaviour, provides empirical evidence on the pass-through process in the euro area and evaluates the impact of the recent fi nancial market tensions. In general terms, how rapidly and extensively changes in policy rates are passed on (via their effect on market interest rates) to retail bank interest rates hinges on a number of structural and cyclical factors. For this reason, retail bank interest rates are typically found to adjust to changes in policy and market rates with some lag.
Overall, in recent years the bank interest rate pass-through seems to have worked relatively well in the sense that the degree of inertia in retail bank interest rates to changes in monetary policy rates has not differed markedly from past patterns. Even during the current fi nancial crisis, the bank interest rate pass-through has worked relatively well in terms of responding to developments in the euro interbank offered rate (EURIBOR) and longer-term market rates, although less well in terms of responding to developments in the euro overnight index average (EONIA – which in normal times is the closest market-based proxy for policy rates). At the same time, bank credit standards have been tightened signifi cantly in recent quarters, countering, to some extent, the smooth pass-through to retail bank lending rates. As the economy gradually improves, banks’ capital bases are reinforced and their risk-taking behaviour normalises, it will be essential for banks to increase their lending activity.
1 INTRODUCTION
The transmission of policy rate changes to retail
bank loan and deposit rates is a crucial part of the
monetary policy transmission mechanism. This is
especially true in the euro area which has a
predominantly bank-based fi nancial system.1
The fi nancial crisis, which has had severe
repercussions on fi nancial markets and the
banking sector, has raised questions about euro
area banks’ ability and willingness to pass on to
their retail customers, in an effective manner,
the changes in the monetary policy stance since
October 2008. Since then the Governing Council
of the ECB has, among other measures, lowered
the main refi nancing rate by 325 basis points, to
stand at a level of 1% in July 2009.
Against this background, this article reviews the
available evidence concerning the bank interest
rate pass-through process in the euro area as a
whole. Section 2 discusses banks’ price-setting
behaviour. Section 3 presents the stylised facts
regarding the pass-through to bank interest
rates in the euro area based on new empirical
evidence. In Section 4, the fi ndings are put into
the context of the fi nancial crisis that erupted in
mid-2007 and the extent to which recent policy
rate reductions have been effectively passed on
to retail customers is also examined.
2 RETAIL BANKS’ PRICE-SETTING BEHAVIOUR
Historically, retail bank interest rates have
tended to move fairly closely in line with
market interest rates with a similar maturity.
See M. Ehrmann, L. Gambacorta, J. Martinéz Pagés, P. Sevestre 1
and A. Worms, “Financial systems and the role of banks
in monetary policy transmission in the euro area”, in
I. Angeloni, A.K. Kashyap and B. Mojon (eds.), Monetary Policy Transmission in the Euro Area, Cambridge University
Press, 2003, for an assessment of the various monetary policy
transmission channels in the euro area during the early years
of EMU. See also the article entitled “The external fi nancing of
households and non-fi nancial corporations: a comparison of the
euro area and the United States” in the April 2009 issue of the
Monthly Bulletin.
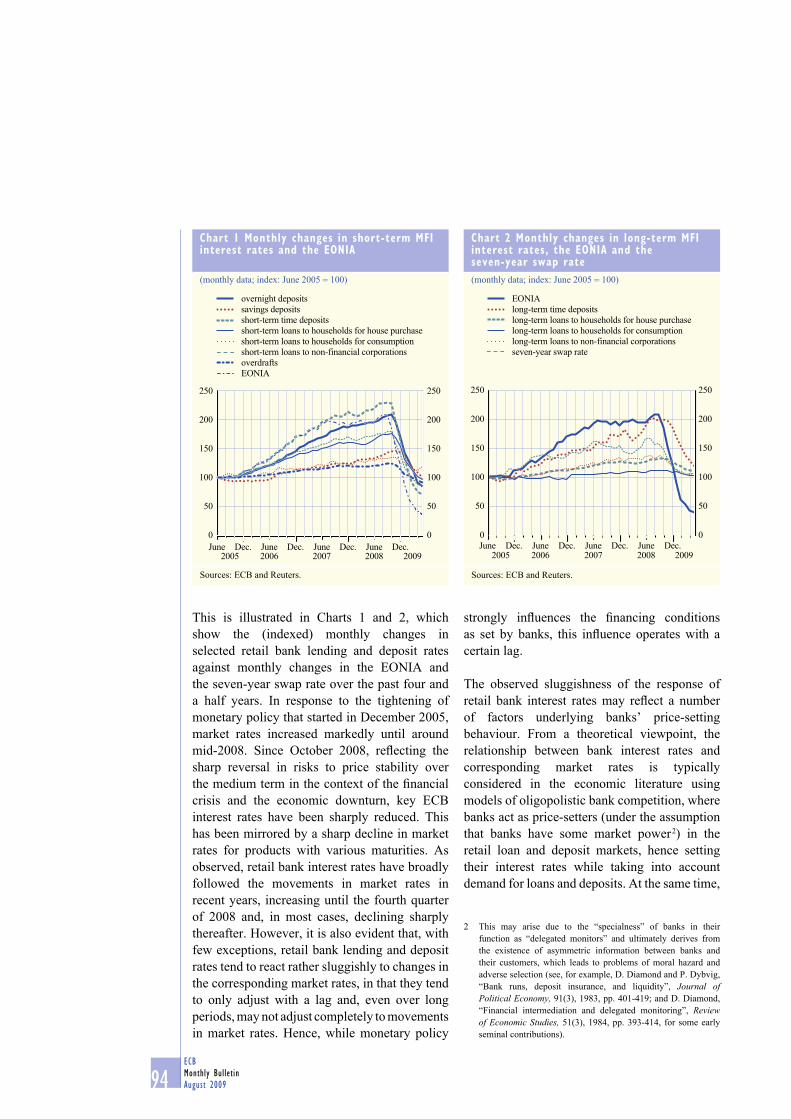
94ECB
Monthly Bulletin
August 2009
This is illustrated in Charts 1 and 2, which
show the (indexed) monthly changes in
selected retail bank lending and deposit rates
against monthly changes in the EONIA and
the seven-year swap rate over the past four and
a half years. In response to the tightening of
monetary policy that started in December 2005,
market rates increased markedly until around
mid-2008. Since October 2008, refl ecting the
sharp reversal in risks to price stability over
the medium term in the context of the fi nancial
crisis and the economic downturn, key ECB
interest rates have been sharply reduced. This
has been mirrored by a sharp decline in market
rates for products with various maturities. As
observed, retail bank interest rates have broadly
followed the movements in market rates in
recent years, increasing until the fourth quarter
of 2008 and, in most cases, declining sharply
thereafter. However, it is also evident that, with
few exceptions, retail bank lending and deposit
rates tend to react rather sluggishly to changes in
the corresponding market rates, in that they tend
to only adjust with a lag and, even over long
periods, may not adjust completely to movements
in market rates. Hence, while monetary policy
strongly infl uences the fi nancing conditions
as set by banks, this infl uence operates with a
certain lag.
The observed sluggishness of the response of
retail bank interest rates may refl ect a number
of factors underlying banks’ price-setting
behaviour. From a theoretical viewpoint, the
relationship between bank interest rates and
corresponding market rates is typically
considered in the economic literature using
models of oligopolistic bank competition, where
banks act as price-setters (under the assumption
that banks have some market power 2) in the
retail loan and deposit markets, hence setting
their interest rates while taking into account
demand for loans and deposits. At the same time,
This may arise due to the “specialness” of banks in their 2
function as “delegated monitors” and ultimately derives from
the existence of asymmetric information between banks and
their customers, which leads to problems of moral hazard and
adverse selection (see, for example, D. Diamond and P. Dybvig,
“Bank runs, deposit insurance, and liquidity”, Journal of Political Economy, 91(3), 1983, pp. 401-419; and D. Diamond,
“Financial intermediation and delegated monitoring”, Review of Economic Studies, 51(3), 1984, pp. 393-414, for some early
seminal contributions).
Chart 1 Monthly changes in short-term MFI interest rates and the EONIA
(monthly data; index: June 2005 = 100)
June2005 2006 2007 2008 2009
June June June
0
50
100
150
200
250
0
50
100
150
200
250
overnight deposits
savings deposits
short-term time deposits
short-term loans to households for house purchase
short-term loans to households for consumption
short-term loans to non-financial corporations
overdrafts
EONIA
Dec. Dec. Dec. Dec.
Sources: ECB and Reuters.
Chart 2 Monthly changes in long-term MFI interest rates, the EONIA and the seven-year swap rate
(monthly data; index: June 2005 = 100)
0
50
100
150
200
250
0
50
100
150
200
250
EONIA
long-term time deposits
long-term loans to households for house purchase
long-term loans to households for consumption
long-term loans to non-financial corporations
seven-year swap rate
June2005 2006 2007 2008 2009
June June JuneDec. Dec. Dec. Dec.
Sources: ECB and Reuters.

95ECB
Monthly Bulletin
August 2009
ARTICLES
Recent developments in
the retail bank interest
rate pass-through
in the euro area
banks are usually assumed to be price takers in
the interbank market and the capital markets
where they seek additional funds (i.e. non-retail
deposit funding) or place surplus liquidity.3
Given the market power of banks, market rates
are normally expected to stand between bank
lending rates and bank deposit rates (representing
the funding costs of loans and the opportunity
costs of deposits respectively). However, bank
loans and deposits are not necessarily priced
independently of each other, as banks may engage
in cross-selling and cross-subsidising activities
(e.g. by offering high deposit rates in order to
obtain loan business).4 In general, banks’ interest
rate-setting behaviour, as measured by the spread
between retail bank rates and market rates, can be
expected to depend on the degree of competition
(or bank market power) and on factors related
to the cost of intermediation, such as interest
rate risk, credit risk, the banks’ degree of risk
aversion, unit operating costs, bank liquidity and
product diversifi cation.
Against this background, Chart 3 presents a
stylised picture of the transmission of monetary
policy rate changes to retail bank interest rates,
via their impact on market rates, and highlights
the various factors affecting bank spreads, both
structural and related to the credit cycle. These
factors infl uence banks’ interest rate-setting
behaviour and help to explain some of the
apparent inertia in the reaction of bank interest
rates to policy changes.
See X. Freixas and J.-C. Rochet, 3 Microeconomics of Banking, The
MIT Press, Cambridge (Massachusetts), second edition, 2008.
P.A. Chiappori, D. Perez-Castrillo and T. Verdier, “Spatial 4
competition in the banking system, localization, cross-subsidies
and the regulation of deposit rates”, European Economic Review, 39(5), 1995, pp. 889-919.
Chart 3 Transmission of policy rate changes to retail bank interest rates
Policy rate changes
Changes in money market rates
Changes in longer-term market rates
and the yield curve
Competition, financial structure and bank characteristics
Collateral values and cash flows(credit risk)
Bank lending and deposit rates
Spending and investment
Inflation and economic activity
Bank interest rate pass-through

96ECB
Monthly Bulletin
August 2009
Nonetheless, the most direct determinants of retail
bank lending and deposit rates for households
and fi rms are policy (and hence market) rate
changes. Indeed, market rates are important
components of bank marginal costs and are directly
affected by changes in monetary policy rates. As a
result, in the literature on the interest rate channel
for monetary policy transmission, particular focus
has usually been put on how rapidly and
extensively changes in policy rates are passed on,
via changes in market rates, to retail bank loan and
deposit rates – particularly given that retail bank
interest rates are often priced against, and
sometimes even indexed to, a market rate.5
The sluggishness observed in the response of
bank interest rates is generally assumed to stem
from the fact that banks may not fi nd it profi table
to adjust their retail interest rates frequently. For
example, as a result of customer switching costs
for many retail bank products, demand may be
relatively inelastic to market rate changes, at
least in the short run.6 Furthermore, there may be
nominal rigidities when banks set their interest
rates (i.e. fi xed adjustment costs of changing their
retail rates). Such “menu costs” may, for example,
become a deterrent when banks are uncertain
about the permanence of market rate changes or if
such changes are only minor.7
Likewise, the importance of relationship banking,
which, in the predominantly bank-based euro area
fi nancial system, may be particularly pertinent,
is likely to induce banks to smooth movements
in retail interest rates over the cycle. This stems
from the impetus to share the risk with bank retail
customers in order to sustain a viable long-term
bank/customer relationship, with the bank seeking
to shield its customers from volatile market
rate developments by keeping retail bank rates
relatively stable over time.8 Moreover, the market
power of banks to set their retail rates, and hence
the banks’ incentive to adjust them when market
conditions change, also hinges on the bargaining
position of borrowers. Thus, for example,
corporate lending rates may be expected to adjust
relatively quickly compared with rates on loans to
households for consumer credit, simply because
companies have better access to substitute sources
of non-bank fi nancing (such as debt securities
and equity issuance, trade credit, etc.) than the
typical household. Hence, the pass-through to
bank interest rates may differ considerably across
different types of retail bank product, being
quicker in those segments where banks face
more competition from other banks and non-bank
fi nancing sources.
Heterogeneity across products in terms of pass-
through can also be caused by cross-country
differences in retail bank regulation and taxation,
which may provide banks with different constraints
and incentives when pricing their retail products.9
More generally, a higher degree of competition
from banks and non-banks,10 as well as fi nancial
development and more effi cient fi nancial
structures, for example triggered by fi nancial
innovations such as securitisation and derivatives,11
Other components infl uencing bank rates and margins are 5
of a more structural nature (competition and effi ciency) or
less volatile, at least in the short run (credit risk and funding
gaps). Hence, identifying the importance of such factors on a
continuous basis when assessing the impact of monetary policy
changes on bank interest rates offered to households and fi rms
is less straightforward; see, for example, L.M. Ausubel, “The
failure of competition in the credit card market”, American Economic Review, 81, March 1991, pp. 50-81.
See, for example, P.S. Calem, M.B. Gordy and L.J. Mester, 6
“Switching costs and adverse selection in the market for credit
cards: New evidence”, Journal of Banking & Finance, 30, 2006,
pp. 1653-1685, who argue that information barriers between
banks and their customers create non-negligible switching costs.
See, for example, T.H. Hannan and A.N. Berger, “The rigidity 7
of prices: Evidence from the banking industry”, American Economic Review, 81, September 1991, pp. 938-945, as well
as B. Hofmann and P. Mizen, “Interest rate pass-through and
monetary transmission: Evidence from individual fi nancial
institutions’ retail rates”, Economica, 71, 2004, pp. 99-123.
See, for example, A.N. Berger and G.F. Udell, “Some evidence 8
on the empirical signifi cance of credit rationing”, Journal of Political Economy, 100, October 1992, pp. 1047-1077.
For a survey of the factors contributing to the cross-country 9
dispersion of the level of MFI interest rates, see ECB, Differences in MFI interest rates across euro area countries, September 2006.
See, among others, H. Sander and S. Kleimeier, “Convergence 10
in euro-zone retail banking? What interest rate pass-through
tells us about monetary policy transmission, competition, and
integration”, Journal of International Money and Finance, 23(3),
2004, pp. 461-492; and M. Van Leuvensteijn, C. Kok Sørensen,
J.A. Bikker and A. Van Rixtel, “Impact of bank competition on
the interest rate pass-through in the euro area”, ECB Working
Paper No 885, 2008.
See, for example, A. Estrella, “Securitization and the effi cacy of 11
monetary policy”, Economic Policy Review, Vol. 8, No 1, Federal
Reserve Bank of New York, May 2002, pp. 243-255; and R. Gropp,
C. Kok Sørensen and J.-D. Lichtenberger, “The dynamics of
bank spreads and fi nancial structure”, ECB Working Paper
No 714, 2007.
97ECB
Monthly Bulletin
August 2009
ARTICLES
Recent developments in
the retail bank interest
rate pass-through
in the euro area
is expected to exert a positive impact on the speed
and degree of the pass-through. Finally, to the
extent that banks in a given situation do not want
to fully satisfy demand (as, for example, in a
situation of credit rationing), they may decide to
hold retail rates relatively stable in order to avoid a
“lemons problem” in the sense of attracting a large
number of non-creditworthy borrowers.12
3 BANK INTEREST RATE PASS-THROUGH IN THE
EURO AREA – EMPIRICAL EVIDENCE
This section presents recent empirical evidence
on the bank interest rate pass-through for the
euro area for a selection of representative loan
and deposit categories.
Monetary policy typically has a signifi cant
and fairly immediate effect on market rates at
various maturities. In particular, changes in
policy rates in normal circumstances will spill
over more or less one-to-one to unsecured
short-term money market rates, such as the
EONIA and, to a somewhat lesser extent, the
term EURIBOR rates. Through its infl uence
on expectations about future policy actions,
changes in the monetary policy stance will often
also have a strong impact on longer-term market
rates, such as long-term government bond yields
and swap rates, by moving the yield curve.13
However, as mentioned in the previous section,
the extent to which the policy-induced changes
in market rates are eventually passed on to retail
bank interest rates offered to borrowers and
depositors hinges on a number of structural and
cyclical factors.
There is a wealth of empirical literature on the
retail bank interest rate pass-through process.
Largely independently of the estimation method,
sample period or geographical area involved,
most empirical studies tend to confi rm that retail
bank interest rates respond sluggishly to changes
in policy and market rates. Typically, banks are
found to only pass a small part of the immediate
change in market rates on to their retail rates
and, even long after, bank retail rates are not
always adjusted to the full extent.14 At the same
time, how rapidly and extensively banks adjust
their retail rates is typically found to differ
substantially across different types of bank loan
and deposit product, as well as across euro area
countries.15 This cross-country heterogeneity
can, to some extent, be explained by differences
in bank characteristics and fi nancial structures.
Moreover, a number of studies fi nd evidence of
some asymmetry in the pass-through over the
interest rate cycle, with loan rates tending to
be stickier when market rates decline, whereas
deposit rates are typically found to react more
sluggishly when market rates increase. This
phenomenon, it is argued, depends on the degree
of demand elasticity and bank competition.16
In the spirit of J.E. Stiglitz and A. Weiss, “Credit rationing in 12
markets with imperfect information”, American Economic Review, 71, 1981, pp. 393-410. A number of US-based empirical studies
found, however, only mixed support for this hypothesis; see, for
example, S.R. King, “Monetary transmission: through bank loans or
bank liabilities?”, Journal of Money, Credit and Banking, 18, 1986,
pp. 290-303 and A.N. Berger and G.F. Udell (op. cit.).
See also G.J. de Bondt, B. Mojon and N. Valla, “Term structure 13
and the sluggishness of retail bank interest rates in euro area
countries”, ECB Working Paper No 518, 2005.
See T.H. Hannan and A.N. Berger (op. cit.); A.N. Berger and 14
G.F. Udell (op. cit); C. Borio and W. Fritz, “The response of
short-term bank lending rates to policy rates: A cross-country
perspective”, BIS Working Paper No 27, 1995; and M. Berlin
and L.J. Mester, “Deposits and relationship lending”, Review of Financial Studies, 12(3), 1999, pp. 579-607, for some early
contributions at the individual country level. For more recent
evidence covering euro area countries, see, for example, B.
Mojon, “Financial structure and the interest rate channel of
ECB monetary policy”, Economie et Provision, 147(1), 2001,
pp. 89-115; G.J. de Bondt, “Interest rate pass-through: Empirical
results for the euro area”, German Economic Review, 6(1), 2005,
pp. 37-78; L. Gambacorta, “How do banks set interest rates?”,
European Economic Review, 52(5), 2005, pp. 792-819; and
Gropp et al. (op. cit.).
For some recent studies, see, for example, C. Kok Sørensen and 15
T. Werner, “Bank interest rate pass-through in the euro area:
A cross-country comparison”, ECB Working Paper No 580,
2006; and J. Nakajima and Y. Teranashi, “The evolution of
loan rate stickiness across the euro area”, Bank of Japan IMES
Discussion Paper No 09-E-010, 2009.
See, for example, T.H. Hannan and A.N. Berger (op. cit.); 16
and L.J. Mester and A. Saunders, “When does the prime
rate change?”, Journal of Banking & Finance, 19(5), 1995,
pp. 743-764, for US-based evidence; and B. Mojon (op. cit.);
and Gropp et al. (op. cit.) for evidence based on the euro
area. Furthermore, H. Sander and S. Kleimeier, “Expected
versus unexpected monetary policy impulses and interest rate
pass-through in euro-zone retail banking markets”, Journal of Banking & Finance, 30, 2006, pp. 1839-1870, point to the
importance of predictable monetary policy in smoothing the
pass-through process.
98ECB
Monthly Bulletin
August 2009
In the light of these “stylised” facts, using
an updated sample of euro area retail bank
interest rates, Box 1 presents evidence on the
pass-through process at the aggregate euro area
level, which indeed points to a wide dispersion
in the (estimated) “stickiness” of bank lending
and deposit rates in the euro area across
product type. Thus, whereas rates on loans to
households for house purchase, rates on loans to
non-fi nancial corporations and, to a somewhat
lesser extent, time deposit rates eventually
fully adjust to the changes in market rates with
a corresponding rate fi xation period, the retail
bank rate adjustment is largely incomplete as
regards overnight and savings deposits and rates
on loans to households for consumer credit.
As mentioned above, the product differences
possibly refl ect inter alia the market (and
bargaining) power of banks vis-à-vis different
categories of customer. This may arise in the
context of competitive pressures from other
banks, as well as from non-banks (e.g. capital
markets, trade credit and other fi nancial
intermediaries). Likewise, the size and time-
varying nature of the credit risk premium is
likely to differ across loan products, which
may, for example, help explain the generally
weaker pass-through of (typically non-
collateralised) consumer credit rates compared
with (collateralised) mortgage rates.
Box 1
RESULTS OF THE PASS-THROUGH TO EURO AREA RETAIL BANK INTEREST RATES USING AN ERROR
CORRECTION MODELLING APPROACH
According to the bank interest rate pass-through literature, the transmission of monetary policy
rates, via changes in market rates, to bank interest rates can be modelled using an error correction
modelling framework, where changes in a specifi c bank interest rate, ΔBRt , are regressed on
simultaneous (and lagged) changes in a relevant market rate, ΔMRt , and (possibly) lagged
changes in the bank interest rate itself with an error correction term refl ecting the extent to which
the bank rate had diverged from its long-run equilibrium relationship with the market rate in the
previous period.1 This is illustrated in the equation below:2
∆ BRt = + (BRt−1− MRt−1
− ) + 1 ∆MRt +
2 ∆MRt−1
+ ∆BRt−1+ t ϕ γ β κ αα η ε
The results of running this model for each of the 11 broad categories of retail lending and deposit
rates offered by euro area MFIs for the period January 1997 to June 2007 (see the table) point to
notable differences in terms of the pass-through of changes in market rates across the different
types of product and are not affected by the fi nancial crisis that erupted in August 2007.3
1 This specifi cation hinges on whether bank and market rates are non-stationary (i.e. do not tend to return to their past values) and
whether they are cointegrated (i.e. whether a stable long-run relationship between the variables can be estimated) – see S. Johansen and
K. Juselius, “Maximum likelihood estimation and inference on cointegration – with applications to the demand for money”, Oxford Bulletin of Economics and Statistics, 52, 1990, pp. 169-210; and S. Johansen, “Estimation and hypothesis testing of cointegration
vectors in Gaussian Vector Autoregressive Models”, Econometrica, 59, 1991, pp. 1551-1580. Standard unit root and cointegration tests
confi rmed that for the bank and market interest rates the conditions for using the error correction model were satisfi ed. Only in the case
of short-term rates on loans for consumer credit could a cointegration relationship not be easily detected.
2 κ can be interpreted as representing all other factors, apart from the market rate, that determine the level of the bank rate, such as bank
market power and effi ciency, credit and interest rate risk, cross-subsidisation effects, etc. Although this model specifi cation may not
entirely correct for potential “omitted variable” bias, residual tests do not point to signifi cant misspecifi cation problems. However,
an alternative model specifi cation could have directly incorporated factors, such as the level of banking competition, business cycle
indicators, etc., as was the case in some of the studies mentioned in footnotes 10 and 11.
3 The data used in these regressions are based on the MFI interest rate statistics compiled by the ECB. Offi cial statistics are available
from January 2003, whereas, for the period prior to January 2003, the series have been “backcast” using consistent methods across the
euro area countries. The “backdata” are not publicly available.
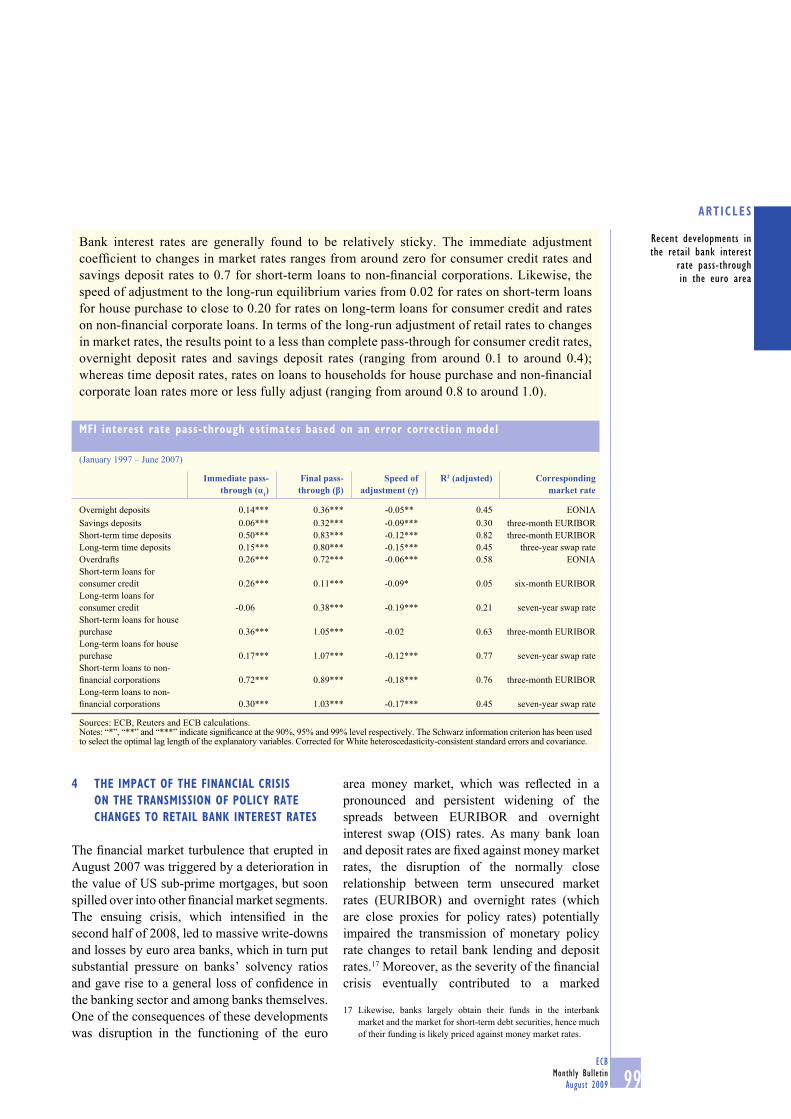
99ECB
Monthly Bulletin
August 2009
ARTICLES
Recent developments in
the retail bank interest
rate pass-through
in the euro area
4 THE IMPACT OF THE FINANCIAL CRISIS
ON THE TRANSMISSION OF POLICY RATE
CHANGES TO RETAIL BANK INTEREST RATES
The fi nancial market turbulence that erupted in
August 2007 was triggered by a deterioration in
the value of US sub-prime mortgages, but soon
spilled over into other fi nancial market segments.
The ensuing crisis, which intensifi ed in the
second half of 2008, led to massive write-downs
and losses by euro area banks, which in turn put
substantial pressure on banks’ solvency ratios
and gave rise to a general loss of confi dence in
the banking sector and among banks themselves.
One of the consequences of these developments
was disruption in the functioning of the euro
area money market, which was refl ected in a
pronounced and persistent widening of the
spreads between EURIBOR and overnight
interest swap (OIS) rates. As many bank loan
and deposit rates are fi xed against money market
rates, the disruption of the normally close
relationship between term unsecured market
rates (EURIBOR) and overnight rates (which
are close proxies for policy rates) potentially
impaired the transmission of monetary policy
rate changes to retail bank lending and deposit
rates.17 Moreover, as the severity of the fi nancial
crisis eventually contributed to a marked
Likewise, banks largely obtain their funds in the interbank 17
market and the market for short-term debt securities, hence much
of their funding is likely priced against money market rates.
Bank interest rates are generally found to be relatively sticky. The immediate adjustment
coeffi cient to changes in market rates ranges from around zero for consumer credit rates and
savings deposit rates to 0.7 for short-term loans to non-fi nancial corporations. Likewise, the
speed of adjustment to the long-run equilibrium varies from 0.02 for rates on short-term loans
for house purchase to close to 0.20 for rates on long-term loans for consumer credit and rates
on non-fi nancial corporate loans. In terms of the long-run adjustment of retail rates to changes
in market rates, the results point to a less than complete pass-through for consumer credit rates,
overnight deposit rates and savings deposit rates (ranging from around 0.1 to around 0.4);
whereas time deposit rates, rates on loans to households for house purchase and non-fi nancial
corporate loan rates more or less fully adjust (ranging from around 0.8 to around 1.0).
MFI interest rate pass-through estimates based on an error correction model
(January 1997 – June 2007)
Immediate pass-through (α1)
Final pass-through (β)
Speed of adjustment (γ)
R2 (adjusted) Corresponding market rate
Overnight deposits 0.14*** 0.36*** -0.05** 0.45 EONIA
Savings deposits 0.06*** 0.32*** -0.09*** 0.30 three-month EURIBOR
Short-term time deposits 0.50*** 0.83*** -0.12*** 0.82 three-month EURIBOR
Long-term time deposits 0.15*** 0.80*** -0.15*** 0.45 three-year swap rate
Overdrafts 0.26*** 0.72*** -0.06*** 0.58 EONIA
Short-term loans for
consumer credit 0.26*** 0.11*** -0.09* 0.05 six-month EURIBOR
Long-term loans for
consumer credit -0.06 0.38*** -0.19*** 0.21 seven-year swap rate
Short-term loans for house
purchase 0.36*** 1.05*** -0.02 0.63 three-month EURIBOR
Long-term loans for house
purchase 0.17*** 1.07*** -0.12*** 0.77 seven-year swap rate
Short-term loans to non-
fi nancial corporations 0.72*** 0.89*** -0.18*** 0.76 three-month EURIBOR
Long-term loans to non-
fi nancial corporations 0.30*** 1.03*** -0.17*** 0.45 seven-year swap rate
Sources: ECB, Reuters and ECB calculations.Notes: “*”, “**” and “***” indicate signifi cance at the 90%, 95% and 99% level respectively. The Schwarz information criterion has been used to select the optimal lag length of the explanatory variables. Corrected for White heteroscedasticity-consistent standard errors and covariance.
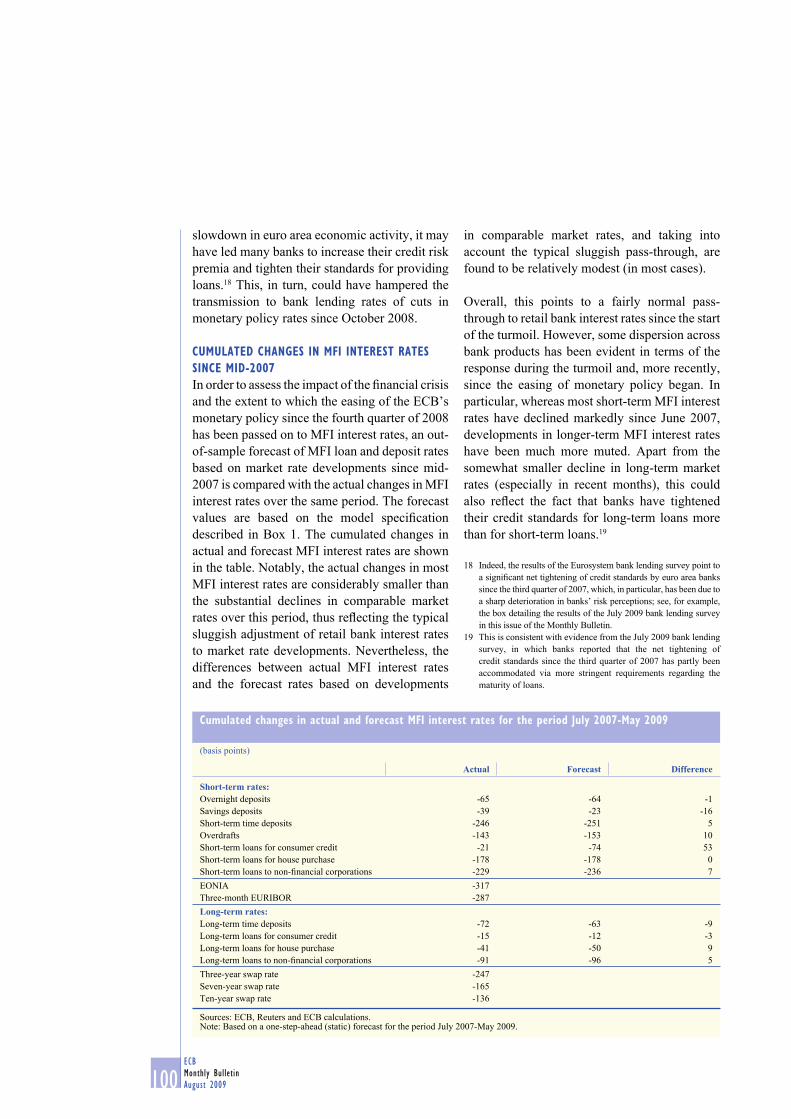
100ECB
Monthly Bulletin
August 2009
slowdown in euro area economic activity, it may
have led many banks to increase their credit risk
premia and tighten their standards for providing
loans.18 This, in turn, could have hampered the
transmission to bank lending rates of cuts in
monetary policy rates since October 2008.
CUMULATED CHANGES IN MFI INTEREST RATES
SINCE MID-2007
In order to assess the impact of the fi nancial crisis
and the extent to which the easing of the ECB’s
monetary policy since the fourth quarter of 2008
has been passed on to MFI interest rates, an out-
of-sample forecast of MFI loan and deposit rates
based on market rate developments since mid-
2007 is compared with the actual changes in MFI
interest rates over the same period. The forecast
values are based on the model specifi cation
described in Box 1. The cumulated changes in
actual and forecast MFI interest rates are shown
in the table. Notably, the actual changes in most
MFI interest rates are considerably smaller than
the substantial declines in comparable market
rates over this period, thus refl ecting the typical
sluggish adjustment of retail bank interest rates
to market rate developments. Nevertheless, the
differences between actual MFI interest rates
and the forecast rates based on developments
in comparable market rates, and taking into
account the typical sluggish pass-through, are
found to be relatively modest (in most cases).
Overall, this points to a fairly normal pass-
through to retail bank interest rates since the start
of the turmoil. However, some dispersion across
bank products has been evident in terms of the
response during the turmoil and, more recently,
since the easing of monetary policy began. In
particular, whereas most short-term MFI interest
rates have declined markedly since June 2007,
developments in longer-term MFI interest rates
have been much more muted. Apart from the
somewhat smaller decline in long-term market
rates (especially in recent months), this could
also refl ect the fact that banks have tightened
their credit standards for long-term loans more
than for short-term loans.19
Indeed, the results of the Eurosystem bank lending survey point to 18
a signifi cant net tightening of credit standards by euro area banks
since the third quarter of 2007, which, in particular, has been due to
a sharp deterioration in banks’ risk perceptions; see, for example,
the box detailing the results of the July 2009 bank lending survey
in this issue of the Monthly Bulletin.
This is consistent with evidence from the July 2009 bank lending 19
survey, in which banks reported that the net tightening of
credit standards since the third quarter of 2007 has partly been
accommodated via more stringent requirements regarding the
maturity of loans.
Cumulated changes in actual and forecast MFI interest rates for the period July 2007-May 2009
(basis points)
Actual Forecast Difference
Short-term rates:Overnight deposits -65 -64 -1
Savings deposits -39 -23 -16
Short-term time deposits -246 -251 5
Overdrafts -143 -153 10
Short-term loans for consumer credit -21 -74 53
Short-term loans for house purchase -178 -178 0
Short-term loans to non-fi nancial corporations -229 -236 7
EONIA -317
Three-month EURIBOR -287
Long-term rates:Long-term time deposits -72 -63 -9
Long-term loans for consumer credit -15 -12 -3
Long-term loans for house purchase -41 -50 9
Long-term loans to non-fi nancial corporations -91 -96 5
Three-year swap rate -247
Seven-year swap rate -165
Ten-year swap rate -136
Sources: ECB, Reuters and ECB calculations.Note: Based on a one-step-ahead (static) forecast for the period July 2007-May 2009.
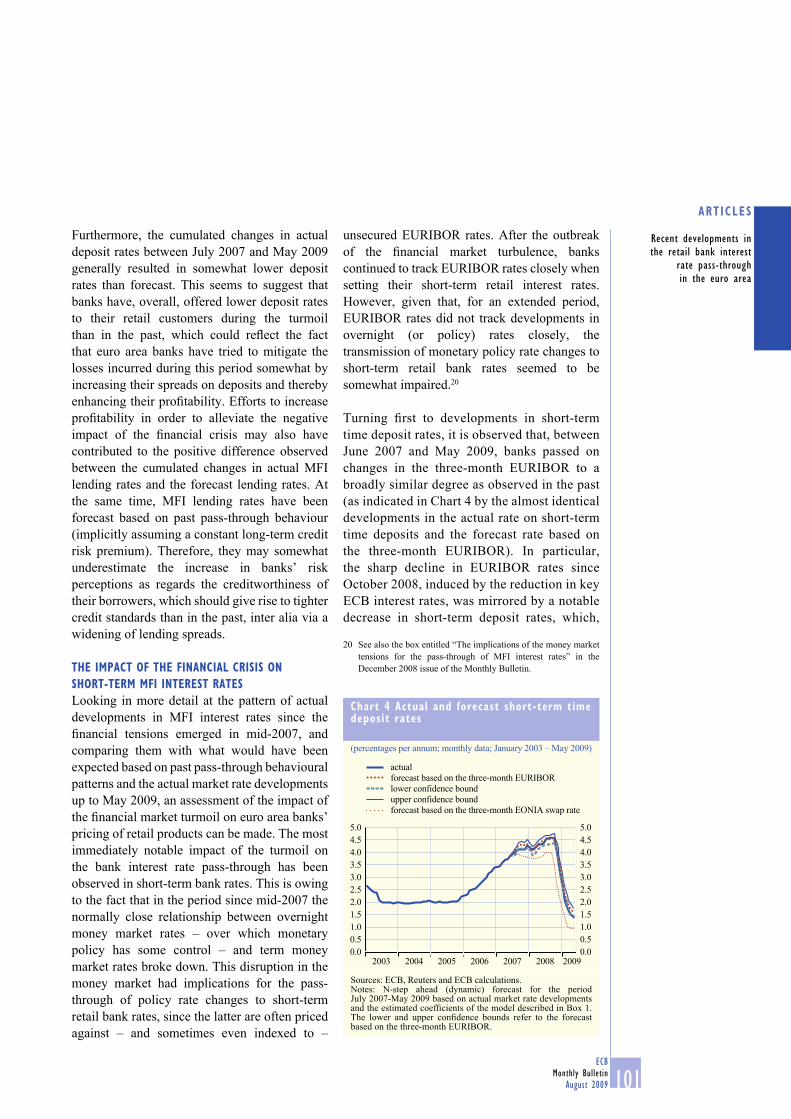
101ECB
Monthly Bulletin
August 2009
ARTICLES
Recent developments in
the retail bank interest
rate pass-through
in the euro area
Furthermore, the cumulated changes in actual
deposit rates between July 2007 and May 2009
generally resulted in somewhat lower deposit
rates than forecast. This seems to suggest that
banks have, overall, offered lower deposit rates
to their retail customers during the turmoil
than in the past, which could refl ect the fact
that euro area banks have tried to mitigate the
losses incurred during this period somewhat by
increasing their spreads on deposits and thereby
enhancing their profi tability. Efforts to increase
profi tability in order to alleviate the negative
impact of the fi nancial crisis may also have
contributed to the positive difference observed
between the cumulated changes in actual MFI
lending rates and the forecast lending rates. At
the same time, MFI lending rates have been
forecast based on past pass-through behaviour
(implicitly assuming a constant long-term credit
risk premium). Therefore, they may somewhat
underestimate the increase in banks’ risk
perceptions as regards the creditworthiness of
their borrowers, which should give rise to tighter
credit standards than in the past, inter alia via a
widening of lending spreads.
THE IMPACT OF THE FINANCIAL CRISIS ON
SHORT-TERM MFI INTEREST RATES
Looking in more detail at the pattern of actual
developments in MFI interest rates since the
fi nancial tensions emerged in mid-2007, and
comparing them with what would have been
expected based on past pass-through behavioural
patterns and the actual market rate developments
up to May 2009, an assessment of the impact of
the fi nancial market turmoil on euro area banks’
pricing of retail products can be made. The most
immediately notable impact of the turmoil on
the bank interest rate pass-through has been
observed in short-term bank rates. This is owing
to the fact that in the period since mid-2007 the
normally close relationship between overnight
money market rates – over which monetary
policy has some control – and term money
market rates broke down. This disruption in the
money market had implications for the pass-
through of policy rate changes to short-term
retail bank rates, since the latter are often priced
against – and sometimes even indexed to –
unsecured EURIBOR rates. After the outbreak
of the fi nancial market turbulence, banks
continued to track EURIBOR rates closely when
setting their short-term retail interest rates.
However, given that, for an extended period,
EURIBOR rates did not track developments in
overnight (or policy) rates closely, the
transmission of monetary policy rate changes to
short-term retail bank rates seemed to be
somewhat impaired.20
Turning fi rst to developments in short-term
time deposit rates, it is observed that, between
June 2007 and May 2009, banks passed on
changes in the three-month EURIBOR to a
broadly similar degree as observed in the past
(as indicated in Chart 4 by the almost identical
developments in the actual rate on short-term
time deposits and the forecast rate based on
the three-month EURIBOR). In particular,
the sharp decline in EURIBOR rates since
October 2008, induced by the reduction in key
ECB interest rates, was mirrored by a notable
decrease in short-term deposit rates, which,
See also the box entitled “The implications of the money market 20
tensions for the pass-through of MFI interest rates” in the
December 2008 issue of the Monthly Bulletin.
Chart 4 Actual and forecast short-term time deposit rates
(percentages per annum; monthly data; January 2003 – May 2009)
0.0
0.5
1.0
1.5
2.0
2.5
3.0
3.5
4.0
4.5
5.0
0.0
0.5
1.0
1.5
2.0
2.5
3.0
3.5
4.0
4.5
5.0
2003 2004 2005 2006 2007 2008 2009
actual
forecast based on the three-month EURIBOR
lower confidence bound
upper confidence bound
forecast based on the three-month EONIA swap rate
Sources: ECB, Reuters and ECB calculations.Notes: N-step ahead (dynamic) forecast for the periodJuly 2007-May 2009 based on actual market rate developments and the estimated coeffi cients of the model described in Box 1. The lower and upper confi dence bounds refer to the forecast based on the three-month EURIBOR.
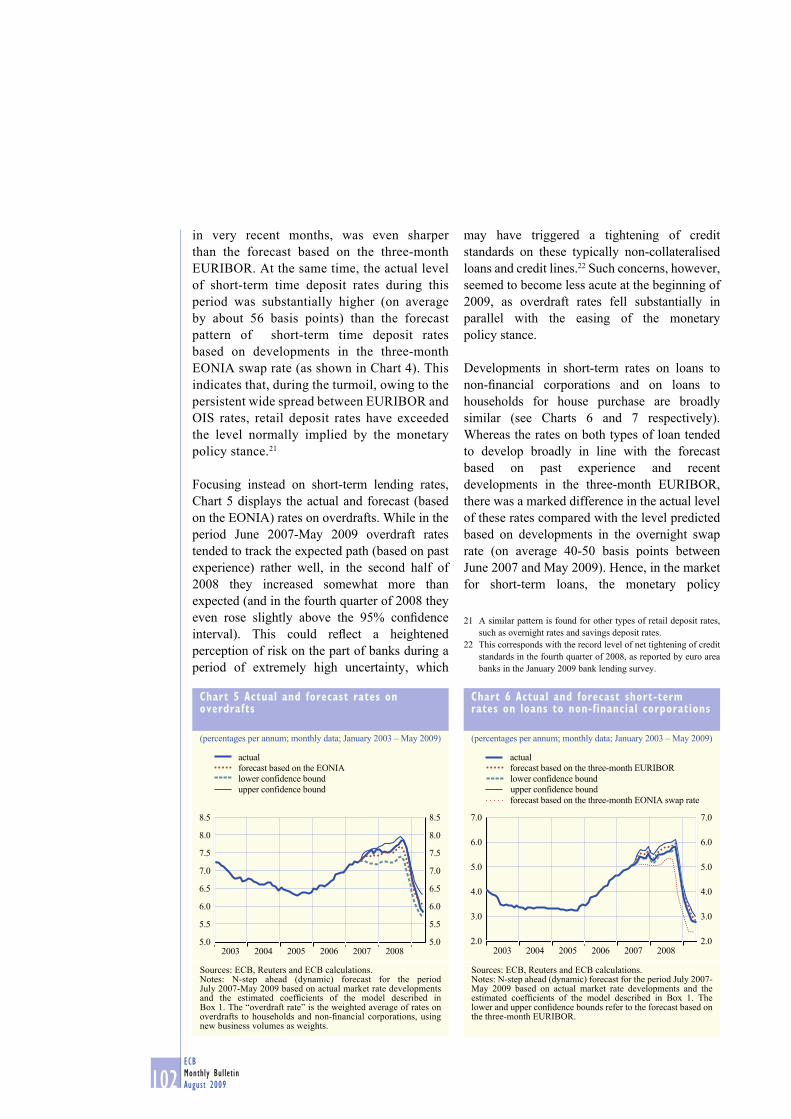
102ECB
Monthly Bulletin
August 2009
in very recent months, was even sharper
than the forecast based on the three-month
EURIBOR. At the same time, the actual level
of short-term time deposit rates during this
period was substantially higher (on average
by about 56 basis points) than the forecast
pattern of short-term time deposit rates
based on developments in the three-month
EONIA swap rate (as shown in Chart 4). This
indicates that, during the turmoil, owing to the
persistent wide spread between EURIBOR and
OIS rates, retail deposit rates have exceeded
the level normally implied by the monetary
policy stance.21
Focusing instead on short-term lending rates,
Chart 5 displays the actual and forecast (based
on the EONIA) rates on overdrafts. While in the
period June 2007-May 2009 overdraft rates
tended to track the expected path (based on past
experience) rather well, in the second half of
2008 they increased somewhat more than
expected (and in the fourth quarter of 2008 they
even rose slightly above the 95% confi dence
interval). This could refl ect a heightened
perception of risk on the part of banks during a
period of extremely high uncertainty, which
may have triggered a tightening of credit
standards on these typically non-collateralised
loans and credit lines.22 Such concerns, however,
seemed to become less acute at the beginning of
2009, as overdraft rates fell substantially in
parallel with the easing of the monetary
policy stance.
Developments in short-term rates on loans to
non-fi nancial corporations and on loans to
households for house purchase are broadly
similar (see Charts 6 and 7 respectively).
Whereas the rates on both types of loan tended
to develop broadly in line with the forecast
based on past experience and recent
developments in the three-month EURIBOR,
there was a marked difference in the actual level
of these rates compared with the level predicted
based on developments in the overnight swap
rate (on average 40-50 basis points between
June 2007 and May 2009). Hence, in the market
for short-term loans, the monetary policy
A similar pattern is found for other types of retail deposit rates, 21
such as overnight rates and savings deposit rates.
This corresponds with the record level of net tightening of credit 22
standards in the fourth quarter of 2008, as reported by euro area
banks in the January 2009 bank lending survey.
Chart 6 Actual and forecast short-term rates on loans to non-financial corporations
(percentages per annum; monthly data; January 2003 – May 2009)
2.0
3.0
4.0
5.0
6.0
7.0
2.0
3.0
4.0
5.0
6.0
7.0
2003 2004 2005 2006 2007 2008
actual
forecast based on the three-month EURIBOR
lower confidence boundupper confidence bound
forecast based on the three-month EONIA swap rate
Sources: ECB, Reuters and ECB calculations.Notes: N-step ahead (dynamic) forecast for the period July 2007-May 2009 based on actual market rate developments and the estimated coeffi cients of the model described in Box 1. The lower and upper confi dence bounds refer to the forecast based on the three-month EURIBOR.
Chart 5 Actual and forecast rates onoverdrafts
(percentages per annum; monthly data; January 2003 – May 2009)
actual
forecast based on the EONIA
lower confidence bound
upper confidence bound
5.0
5.5
6.0
6.5
7.0
7.5
8.0
8.5
5.0
5.5
6.0
6.5
7.0
7.5
8.0
8.5
2003 2004 2005 2006 2007 2008
Sources: ECB, Reuters and ECB calculations.Notes: N-step ahead (dynamic) forecast for the periodJuly 2007-May 2009 based on actual market rate developments and the estimated coeffi cients of the model described inBox 1. The “overdraft rate” is the weighted average of rates on overdrafts to households and non-fi nancial corporations, using new business volumes as weights.

103ECB
Monthly Bulletin
August 2009
ARTICLES
Recent developments in
the retail bank interest
rate pass-through
in the euro area
transmission mechanism was likewise somewhat
impaired, especially in the period from
mid-2007 to late 2008. Nonetheless, short-term
lending rates to both households and non-
fi nancial corporations have been lowered
dramatically since November 2008, refl ecting
the reductions in key ECB interest rates – along
with other measures taken by the ECB to foster
a gradual normalisation of money market
conditions. 23 In May 2009 they stood
substantially lower (at 180-230 basis points)
than the level immediately before the turmoil
erupted. However, the possibility that part of the
reduction in short-term lending rates in recent
months has been driven by a lack of demand for
loans on the part of fi rms and households in the
context of a weakening economy cannot be
ruled out.24
The divergence between the EURIBOR and
OIS rates during the fi nancial crisis affected
the extent to which banks passed on changes
in policy rates in almost all euro area countries.
This is illustrated in Charts 8 and 9 which show
the cross-country dispersion of differences
Such as the decision of 18 December 2008 to restore the corridor 23
of standing facility rates and the launch of various supplementary
longer-term refi nancing operations with full allotment and,
following the Governing Council’s decision of 7 May 2009, with
maturities of up to one year.
This is, for example, refl ected in the strongly negative net loan 24
demand reported in the July 2009 bank lending survey.
Chart 7 Actual and forecast short-term rates on loans to households for house purchase
(percentages per annum; monthly data; January 2003 – May 2009)
2.0
3.0
4.0
5.0
6.0
7.0
2.0
3.0
4.0
5.0
6.0
7.0
2003 2004 2005 2006 2007 2008
actual
forecast based on the three-month EURIBOR
lower confidence bound
upper confidence bound
forecast based on the three-month EONIA swap rate
Sources: ECB, Reuters and ECB calculations.Notes: N-step ahead (dynamic) forecast for the period July 2007-May 2009 based on actual market rate developments and the estimated coeffi cients of the model described in Box 1. The lower and upper confi dence bounds refer to the forecast based on the three-month EURIBOR.
Chart 8 Cross-country dispersion of differences between actual short-term rates on large loans to non-financial corporations and forecast rates based on the three-month EONIA swap rate
(basis points; monthly data; June 2007 – April 2009)
-50
0
50
100
150
200
-50
0
50
100
150
200
maximum
75th percentile
median
25th percentile
minimum
June Dec. June Dec.2007 2008
Sources: ECB, Reuters and ECB calculations. Note: N-step ahead (dynamic) forecast for the period July 2007-April 2009 based on actual market rate developments and the estimated coeffi cients of a country-specifi c error correction model.
Chart 9 Cross-country dispersion of differences between actual short-term rates on loans to households for house purchase and forecast rates based on the three-month EONIA swap rate
(basis points; monthly data; June 2007 – April 2009)
250
200
150
100
50
0
-50
-100
-150
250
200
150
100
50
0
-50
-100
-150
June Dec. June Dec.2007 2008
maximum
75th percentile
median
25th percentile
minimum
Sources: ECB, Reuters and ECB calculations.Note: N-step ahead (dynamic) forecast for the period July 2007-April 2009 based on actual market rate developments and the estimated coeffi cients of a country-specifi c error correction model.

104ECB
Monthly Bulletin
August 2009
between actual rates on short-term loans to
non-fi nancial corporations and households
for house purchase respectively and forecast
rates based on the three-month EONIA swap
rate. Nonetheless, throughout the period a
wide dispersion was observed across banks
in different countries in terms of the impact
of the money market malfunctioning on the
pass-through process. In addition, whereas the
median difference between the level of actual
short-term lending rates and the OIS-based
forecast has declined somewhat since autumn
2008, the cross-country dispersion has widened
notably. This dispersion could refl ect the fact
that banks in some euro area countries are
more prone to pricing their loan rates against
EURIBOR rates. It may also refl ect the fact that
the bank balance sheet position and the credit
risk outlook in these countries are somewhat
less benign and hence force banks to operate
with higher spreads vis-à-vis market rates. It
is likewise possible that competitive forces
in some countries have induced banks to start
indexing their rates against the EONIA rather
than the EURIBOR and hence to re-establish
the close link between monetary policy rates
and short-term retail interest rates.
THE IMPACT OF THE FINANCIAL CRISIS ON
LONG-TERM MFI INTEREST RATES
Finally, turning to the pass-through evidence
regarding longer-term loan rates since the start of
the fi nancial crisis in mid-2007, Charts 10 and 11
show the actual long-term rates on loans to
non-fi nancial corporations and households for
house purchase respectively, against forecast
rates based on the error correction model
described in Box 1 and the seven-year swap rate.
Overall, based on market rate developments
between June 2007 and May 2009, changes
in monetary policy rates were passed on to
long-term rates on both types of loan in a
manner which was broadly consistent with past
behaviour. In the second half of 2007 and most
of 2008 the (rather volatile) long-term non-
fi nancial corporate loan rate hovered somewhat
above the level predicted by the pass-through
model, which may refl ect banks’ practice of
setting relatively high interest rates in the
context of continued high loan demand during
this period of high uncertainty. Furthermore,
like short-term MFI interest rates, long-term
lending rates have also declined markedly in
recent months and, despite the problems facing
banks in terms of their profi tability and balance
Chart 10 Actual and forecast long-term rates on loans to non-financial corporations
(percentages per annum; monthly data; January 2003 – May 2009)
6.0
5.0
4.0
3.0
2.0
6.0
5.0
4.0
3.0
2.02003 2004 2005 2006 2007 2008
actual
forecast (based on the seven-year swap yield)lower confidence bound
upper confidence bound
Sources: ECB, Reuters and ECB calculations.Note: N-step ahead (dynamic) forecast for the period July 2007-May 2009 based on actual market rate developments and the estimated coeffi cients of the model described in Box 1.
Chart 11 Actual and forecast long-term rates on loans to households for house purchase
(percentages per annum; monthly data; January 2003 – May 2009)
3.0
4.0
5.0
6.0
3.0
4.0
5.0
6.0
2003 2004 2005 2006 2007 2008
actual
forecast (based on the seven-year swap yield)
lower confidence bound
upper confidence bound
Sources: ECB, Reuters and ECB calculations.Note: N-step ahead (dynamic) forecast for the period July 2007-May 2009 based on actual market rate developments and the estimated coeffi cients of the model described in Box 1.

105ECB
Monthly Bulletin
August 2009
ARTICLES
Recent developments in
the retail bank interest
rate pass-through
in the euro area
sheet position, euro area banks appear to have
passed on the policy rate reductions to a broadly
similar extent as in the past, although in very
recent months the actual rates on loans for house
purchase have been somewhat higher than the
forecast based on the seven-year swap rate.
All in all, the pass-through to long-term lending
rates does not seem to have been notably more
sluggish than in the past. This development
should, however, also be seen in the context of
weaker loan demand on the part of fi rms and
households, as reported in the latest rounds
of the bank lending survey, which may have
put downward pressure on bank lending rates.
Owing to the many countervailing factors
currently affecting bank lending rates in the
context of continued high uncertainty, close
monitoring of developments in the coming
months will be essential.
5 CONCLUSION
As the euro area has a bank-based fi nancial
system, the extent to which monetary policy
rates are transmitted to the interest rates
offered to euro area banks’ retail customers
is a crucial aspect of the monetary policy
transmission process. This article has discussed
the main factors affecting the bank interest rate
pass-through. It has also examined the available
empirical evidence for the euro area and
considered the functioning of the pass-through
process during the recent period of fi nancial
market tensions. Overall, notwithstanding some
underlying disparities across euro area countries,
in recent years the bank interest rate pass-
through seems to have worked satisfactorily in
the sense that the co-movement between retail
bank interest rates and market rates has not
seemed to differ markedly from past patterns.
Even during the current fi nancial crisis, the bank
interest rate pass-through has worked relatively
well in terms of responding to developments in
EURIBOR rates and longer-term market rates,
although less well in terms of responding to
developments in the EONIA in the context of
continued stress in the interbank money market
over this period. At the same time, bank credit
standards have been tightened signifi cantly in
recent quarters, countering, to some extent, the
smooth pass-through to retail bank lending rates.
As the economy gradually improves, banks’
capital bases are reinforced and their risk-taking
behaviour normalises, it will be essential for
banks to increase their lending activity.


S 1ECB
Monthly Bulletin
August 2009
EURO AREA STATISTICS

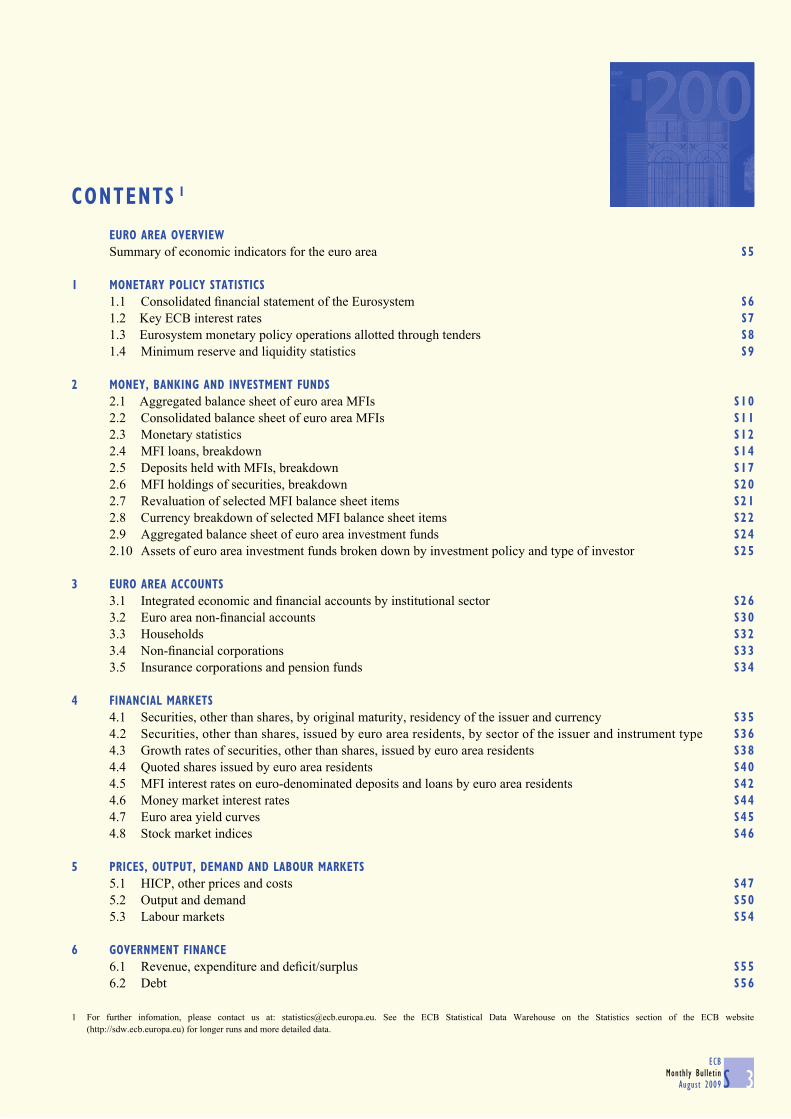
S 3ECB
Monthly Bulletin
August 2009
CONTENTS 1
For further infomation, please contact us at: [email protected]. See the ECB Statistical Data Warehouse on the Statistics section of the ECB website 1
(http://sdw.ecb.europa.eu) for longer runs and more detailed data.
EURO AREA OVERVIEW
Summary of economic indicators for the euro area S5
1 MONETARY POLICY STATISTICS
1.1 Consolidated fi nancial statement of the Eurosystem S6
1.2 Key ECB interest rates S7
1.3 Eurosystem monetary policy operations allotted through tenders S8
1.4 Minimum reserve and liquidity statistics S9
2 MONEY, BANKING AND INVESTMENT FUNDS
2.1 Aggregated balance sheet of euro area MFIs S10
2.2 Consolidated balance sheet of euro area MFIs S11
2.3 Monetary statistics S12
2.4 MFI loans, breakdown S14
2.5 Deposits held with MFIs, breakdown S17
2.6 MFI holdings of securities, breakdown S20
2.7 Revaluation of selected MFI balance sheet items S21
2.8 Currency breakdown of selected MFI balance sheet items S22
2.9 Aggregated balance sheet of euro area investment funds S24
2.10 Assets of euro area investment funds broken down by investment policy and type of investor S25
3 EURO AREA ACCOUNTS
3.1 Integrated economic and fi nancial accounts by institutional sector S26
3.2 Euro area non-fi nancial accounts S30
3.3 Households S32
3.4 Non-fi nancial corporations S33
3.5 Insurance corporations and pension funds S34
4 FINANCIAL MARKETS
4.1 Securities, other than shares, by original maturity, residency of the issuer and currency S35
4.2 Securities, other than shares, issued by euro area residents, by sector of the issuer and instrument type S36
4.3 Growth rates of securities, other than shares, issued by euro area residents S38
4.4 Quoted shares issued by euro area residents S40
4.5 MFI interest rates on euro-denominated deposits and loans by euro area residents S42
4.6 Money market interest rates S44
4.7 Euro area yield curves S45
4.8 Stock market indices S46
5 PRICES, OUTPUT, DEMAND AND LABOUR MARKETS
5.1 HICP, other prices and costs S47
5.2 Output and demand S50
5.3 Labour markets S54
6 GOVERNMENT FINANCE
6.1 Revenue, expenditure and defi cit/surplus S55
6.2 Debt S56
ECB
Monthly Bulletin
August 2009
Conventions used in the tables
“-” data do not exist/data are not applicable
“.” data are not yet available
“…” nil or negligible
“billion” 109
(p) provisional
s.a. seasonally adjusted
n.s.a. non-seasonally adjusted
S 4
ENLARGEMENT OF THE EURO AREA ON 1 JANUARY 2009 TO INCLUDE SLOVAKIA
Unless otherwise indicated, all data series covering observations for 2009 relate to the Euro 16 (the euro area including
Slovakia) for the whole time series. For interest rates, monetary statistics and the HICP (and, for consistency reasons,
the components and counterparts of M3 and the components of the HICP), the statistical series relating to the euro area
cover the EU Member States that had adopted the euro at the time to which the statistics relate. Where applicable, this is
indicated in the tables by means of a footnote. In such cases, where underlying data are available, absolute and percentage
changes for the respective year of entry into the euro area of Greece (2001), Slovenia (2007), Cyprus (2008), Malta (2008)
and Slovakia (2009), calculated from bases covering the year prior to the year of entry, use a series in which the impact
of these countries’ joining the euro area is taken into account. Historical data referring to the euro area before the entry of
Slovakia are available on the ECB’s website at http://www.ecb.europa.eu/stats/services/downloads/html/index.en.html
6.3 Change in debt S57
6.4 Quarterly revenue, expenditure and defi cit/surplus S58
6.5 Quarterly debt and change in debt S59
7 EXTERNAL TRANSACTIONS AND POSITIONS
7.1 Summary balance of payments S60
7.2 Current and capital accounts S61
7.3 Financial account S63
7.4 Monetary presentation of the balance of payments S69
7.5 Trade in goods S70
8 EXCHANGE RATES
8.1 Effective exchange rates S72
8.2 Bilateral exchange rates S73
9 DEVELOPMENTS OUTSIDE THE EURO AREA
9.1 In other EU Member States S74
9.2 In the United States and Japan S75
LIST OF CHARTS S76
TECHNICAL NOTES S77
GENERAL NOTES S83

ECB
Monthly Bulletin
August 2009 S 5
EURO AREA OVERVIEW
Summary of economic indicators for the euro area (annual percentage changes, unless otherwise indicated)
1. Monetary developments and interest rates 1)
M1 2) M2 2) M3 2), 3) M3 2), 3) MFI loans to Securities other 3-month 10-year3-month euro area than shares issued interest rate spot rate
moving average residents in euro by non-MFI (EURIBOR, (% per annum,(centred) excluding MFIs corporations 2) % per annum, end-of-
and general period period) 4)
government 2) averages)
1 2 3 4 5 6 7 82007 6.5 9.9 11.2 - 10.8 18.6 4.28 4.382008 2.4 9.7 9.7 - 9.5 18.7 4.64 3.69
2008 Q3 0.7 9.2 9.1 - 9.1 18.2 4.98 4.34 Q4 2.7 8.9 8.2 - 7.4 19.8 4.24 3.692009 Q1 5.3 7.2 6.0 - 4.6 25.1 2.01 3.77 Q2 7.9 5.5 4.3 - 2.2 . 1.31 3.99
2009 Feb. 6.1 6.9 5.8 5.6 4.3 25.9 1.94 3.85 Mar. 5.9 6.2 5.1 5.2 3.1 26.7 1.64 3.77 Apr. 8.3 5.9 4.9 4.6 2.3 26.8 1.42 3.79 May 7.9 5.0 3.7 4.1 1.8 26.0 1.28 4.18 June 9.3 4.8 3.5 . 1.5 . 1.23 3.99 July . . . . . . 0.97 3.74
2. Prices, output, demand and labour markets 5)
HICP 1) Industrial Hourly Real GDP Industrial Capacity Employment Unemploymentproducer labour production utilisation in (% of labour
prices costs excluding manufacturing force)construction (percentages)
1 2 3 4 5 6 7 82007 2.1 2.7 2.7 2.7 3.7 84.1 1.8 7.52008 3.3 6.1 3.3 0.7 -1.8 81.8 0.8 7.5
2008 Q4 2.3 3.4 4.0 -1.7 -8.9 78.1 0.0 8.02009 Q1 1.0 -2.0 3.7 -4.9 -18.2 72.5 -1.3 8.8 Q2 0.2 -5.8 . . . 69.9 . 9.3
2009 Feb. 1.2 -1.9 - - -19.2 - - 8.8 Mar. 0.6 -3.2 - - -18.7 - - 9.0 Apr. 0.6 -4.8 - - -20.6 70.3 - 9.2 May 0.0 -5.9 - - -17.0 - - 9.3 June -0.1 -6.6 - - . - - 9.4 July -0.6 . - - . 69.5 - .
3. Balance of payments, reserve assets and exchange rates(EUR billions, unless otherwise indicated)
Balance of payments (net transactions) Reserve assets Effective exchange rate of USD/EUR (end-of-period the euro: EER-21 6) exchange rate
Current and Direct Portfolio positions) (index, 1999 Q1 = 100)capital Goods investment investment
accounts Nominal Real (CPI)
1 2 3 4 5 6 7 82007 24.8 46.4 -92.5 159.7 347.2 107.9 109.0 1.37052008 -89.0 -6.0 -242.3 441.5 374.2 113.0 113.6 1.4708
2008 Q3 -21.2 -9.0 -35.9 121.5 372.5 114.1 114.3 1.5050 Q4 -28.5 -0.6 -77.7 204.2 374.2 109.1 109.6 1.31802009 Q1 -40.8 -10.3 -38.5 179.4 395.7 111.9 112.2 1.3029 Q2 . . . . 381.5 113.2 113.4 1.3632
2009 Feb. -6.5 0.3 -8.5 81.4 423.1 110.4 110.7 1.2785 Mar. -6.1 3.3 -20.6 95.7 395.7 113.3 113.5 1.3050 Apr. -7.4 3.9 -4.5 -9.0 386.3 112.5 112.8 1.3190 May -12.7 2.2 6.1 53.8 392.2 113.0 113.2 1.3650 June . . . . 381.5 114.0 114.2 1.4016 July . . . . . 113.8 114.0 1.4088
Sources: ECB, European Commission (Eurostat and Economic and Financial Affairs DG) and Reuters.Note: For more information on the data, see the relevant tables later in this section.1) Data refer to the changing composition of the euro area. For further information, see the General notes.2) Annual percentage changes of monthly data refer to the end of the month, whereas those of quarterly and yearly data refer to the annual change in the period average of the series.
See the Technical notes for details.3) M3 and its components exclude holdings by non-euro area residents of money market fund shares/units and debt securities with a maturity of up to two years.4) Based on AAA-rated euro area central government bond yield curves. For further information, see table 4.7.5) Unless otherwise indicated, data refer to Euro 16.6) For the definition of the trading partner groups and other information, please refer to the General notes.
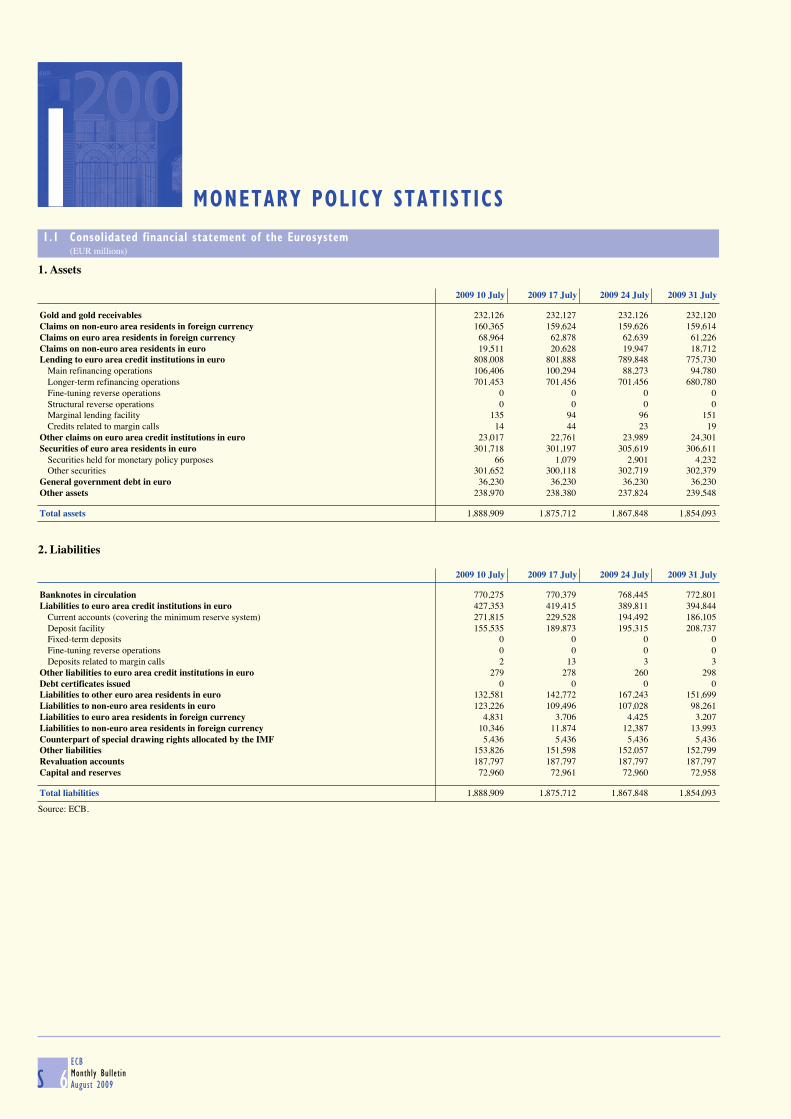
ECB
Monthly Bulletin
August 2009
1
S 6
MONETARY POLICY STATISTICS
1.1 Consolidated financial statement of the Eurosystem (EUR millions)
1. Assets
2009 10 July 2009 17 July 2009 24 July 2009 31 July
Gold and gold receivables 232,126 232,127 232,126 232,120Claims on non-euro area residents in foreign currency 160,365 159,624 159,626 159,614Claims on euro area residents in foreign currency 68,964 62,878 62,639 61,226Claims on non-euro area residents in euro 19,511 20,628 19,947 18,712Lending to euro area credit institutions in euro 808,008 801,888 789,848 775,730
Main refinancing operations 106,406 100,294 88,273 94,780Longer-term refinancing operations 701,453 701,456 701,456 680,780Fine-tuning reverse operations 0 0 0 0Structural reverse operations 0 0 0 0Marginal lending facility 135 94 96 151Credits related to margin calls 14 44 23 19
Other claims on euro area credit institutions in euro 23,017 22,761 23,989 24,301Securities of euro area residents in euro 301,718 301,197 305,619 306,611
Securities held for monetary policy purposes 66 1,079 2,901 4,232Other securities 301,652 300,118 302,719 302,379
General government debt in euro 36,230 36,230 36,230 36,230Other assets 238,970 238,380 237,824 239,548
Total assets 1,888,909 1,875,712 1,867,848 1,854,093
2. Liabilities
2009 10 July 2009 17 July 2009 24 July 2009 31 July
Banknotes in circulation 770,275 770,379 768,445 772,801Liabilities to euro area credit institutions in euro 427,353 419,415 389,811 394,844
Current accounts (covering the minimum reserve system) 271,815 229,528 194,492 186,105Deposit facility 155,535 189,873 195,315 208,737Fixed-term deposits 0 0 0 0Fine-tuning reverse operations 0 0 0 0Deposits related to margin calls 2 13 3 3
Other liabilities to euro area credit institutions in euro 279 278 260 298Debt certificates issued 0 0 0 0Liabilities to other euro area residents in euro 132,581 142,772 167,243 151,699Liabilities to non-euro area residents in euro 123,226 109,496 107,028 98,261Liabilities to euro area residents in foreign currency 4,831 3,706 4,425 3,207Liabilities to non-euro area residents in foreign currency 10,346 11,874 12,387 13,993Counterpart of special drawing rights allocated by the IMF 5,436 5,436 5,436 5,436Other liabilities 153,826 151,598 152,057 152,799Revaluation accounts 187,797 187,797 187,797 187,797Capital and reserves 72,960 72,961 72,960 72,958
Total liabilities 1,888,909 1,875,712 1,867,848 1,854,093
Source: ECB.
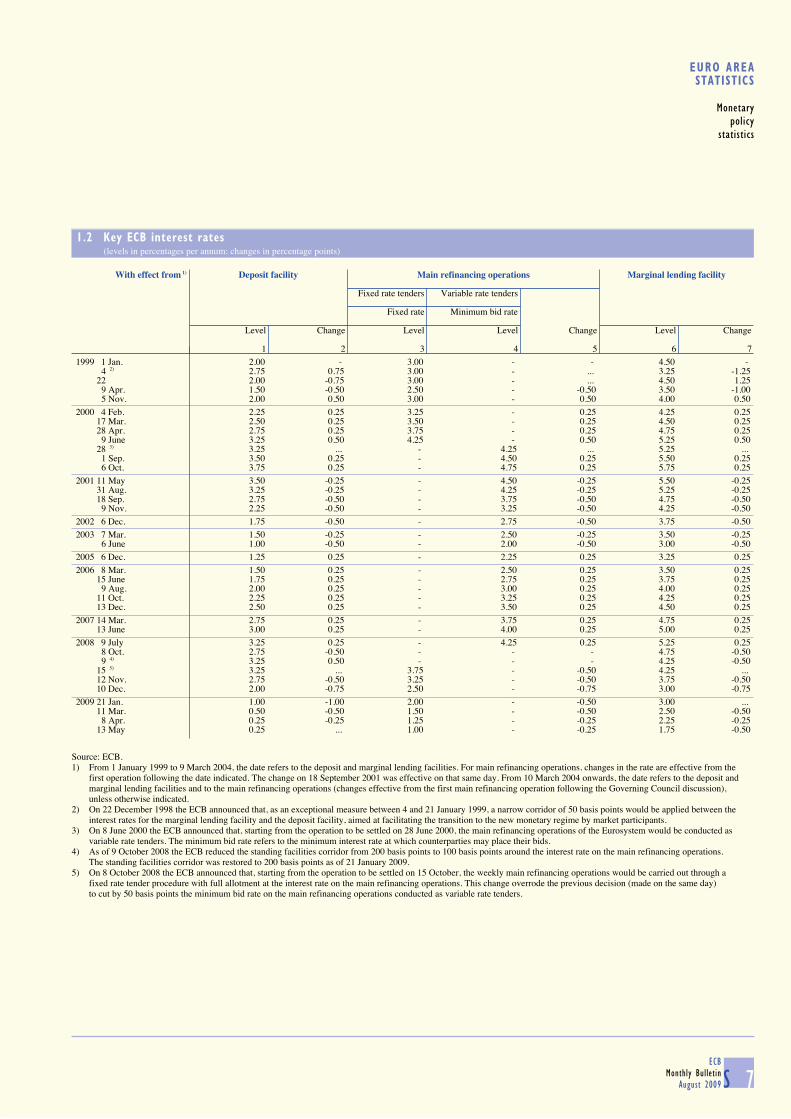
S 7ECB
Monthly Bulletin
August 2009
EURO AREASTATISTICS
Monetary
policy
statistics
1.2 Key ECB interest rates (levels in percentages per annum; changes in percentage points)
With effect from 1) Deposit facility Main refinancing operations Marginal lending facility
Fixed rate tenders Variable rate tenders Fixed rate Minimum bid rate
Level Change Level Level Change Level Change
1 2 3 4 5 6 71999 1 Jan. 2.00 - 3.00 - - 4.50 -
4 2) 2.75 0.75 3.00 - ... 3.25 -1.2522 2.00 -0.75 3.00 - ... 4.50 1.25
9 Apr. 1.50 -0.50 2.50 - -0.50 3.50 -1.005 Nov. 2.00 0.50 3.00 - 0.50 4.00 0.50
2000 4 Feb. 2.25 0.25 3.25 - 0.25 4.25 0.2517 Mar. 2.50 0.25 3.50 - 0.25 4.50 0.2528 Apr. 2.75 0.25 3.75 - 0.25 4.75 0.25
9 June 3.25 0.50 4.25 - 0.50 5.25 0.5028 3) 3.25 ... - 4.25 ... 5.25 ...
1 Sep. 3.50 0.25 - 4.50 0.25 5.50 0.256 Oct. 3.75 0.25 - 4.75 0.25 5.75 0.25
2001 11 May 3.50 -0.25 - 4.50 -0.25 5.50 -0.2531 Aug. 3.25 -0.25 - 4.25 -0.25 5.25 -0.2518 Sep. 2.75 -0.50 - 3.75 -0.50 4.75 -0.50
9 Nov. 2.25 -0.50 - 3.25 -0.50 4.25 -0.502002 6 Dec. 1.75 -0.50 - 2.75 -0.50 3.75 -0.502003 7 Mar. 1.50 -0.25 - 2.50 -0.25 3.50 -0.25
6 June 1.00 -0.50 - 2.00 -0.50 3.00 -0.502005 6 Dec. 1.25 0.25 - 2.25 0.25 3.25 0.252006 8 Mar. 1.50 0.25 - 2.50 0.25 3.50 0.25
15 June 1.75 0.25 - 2.75 0.25 3.75 0.259 Aug. 2.00 0.25 - 3.00 0.25 4.00 0.25
11 Oct. 2.25 0.25 - 3.25 0.25 4.25 0.2513 Dec. 2.50 0.25 - 3.50 0.25 4.50 0.25
2007 14 Mar. 2.75 0.25 - 3.75 0.25 4.75 0.2513 June 3.00 0.25 - 4.00 0.25 5.00 0.25
2008 9 July 3.25 0.25 - 4.25 0.25 5.25 0.258 Oct. 2.75 -0.50 - - - 4.75 -0.509 4) 3.25 0.50 - - - 4.25 -0.50
15 5) 3.25 ... 3.75 - -0.50 4.25 ... 12 Nov. 2.75 -0.50 3.25 - -0.50 3.75 -0.5010 Dec. 2.00 -0.75 2.50 - -0.75 3.00 -0.75
2009 21 Jan. 1.00 -1.00 2.00 - -0.50 3.00 ... 11 Mar. 0.50 -0.50 1.50 - -0.50 2.50 -0.50
8 Apr. 0.25 -0.25 1.25 - -0.25 2.25 -0.2513 May 0.25 ... 1.00 - -0.25 1.75 -0.50
Source: ECB.1) From 1 January 1999 to 9 March 2004, the date refers to the deposit and marginal lending facilities. For main refinancing operations, changes in the rate are effective from the
first operation following the date indicated. The change on 18 September 2001 was effective on that same day. From 10 March 2004 onwards, the date refers to the deposit andmarginal lending facilities and to the main refinancing operations (changes effective from the first main refinancing operation following the Governing Council discussion),unless otherwise indicated.
2) On 22 December 1998 the ECB announced that, as an exceptional measure between 4 and 21 January 1999, a narrow corridor of 50 basis points would be applied between theinterest rates for the marginal lending facility and the deposit facility, aimed at facilitating the transition to the new monetary regime by market participants.
3) On 8 June 2000 the ECB announced that, starting from the operation to be settled on 28 June 2000, the main refinancing operations of the Eurosystem would be conducted asvariable rate tenders. The minimum bid rate refers to the minimum interest rate at which counterparties may place their bids.
4) As of 9 October 2008 the ECB reduced the standing facilities corridor from 200 basis points to 100 basis points around the interest rate on the main refinancing operations.The standing facilities corridor was restored to 200 basis points as of 21 January 2009.
5) On 8 October 2008 the ECB announced that, starting from the operation to be settled on 15 October, the weekly main refinancing operations would be carried out through afixed rate tender procedure with full allotment at the interest rate on the main refinancing operations. This change overrode the previous decision (made on the same day)to cut by 50 basis points the minimum bid rate on the main refinancing operations conducted as variable rate tenders.
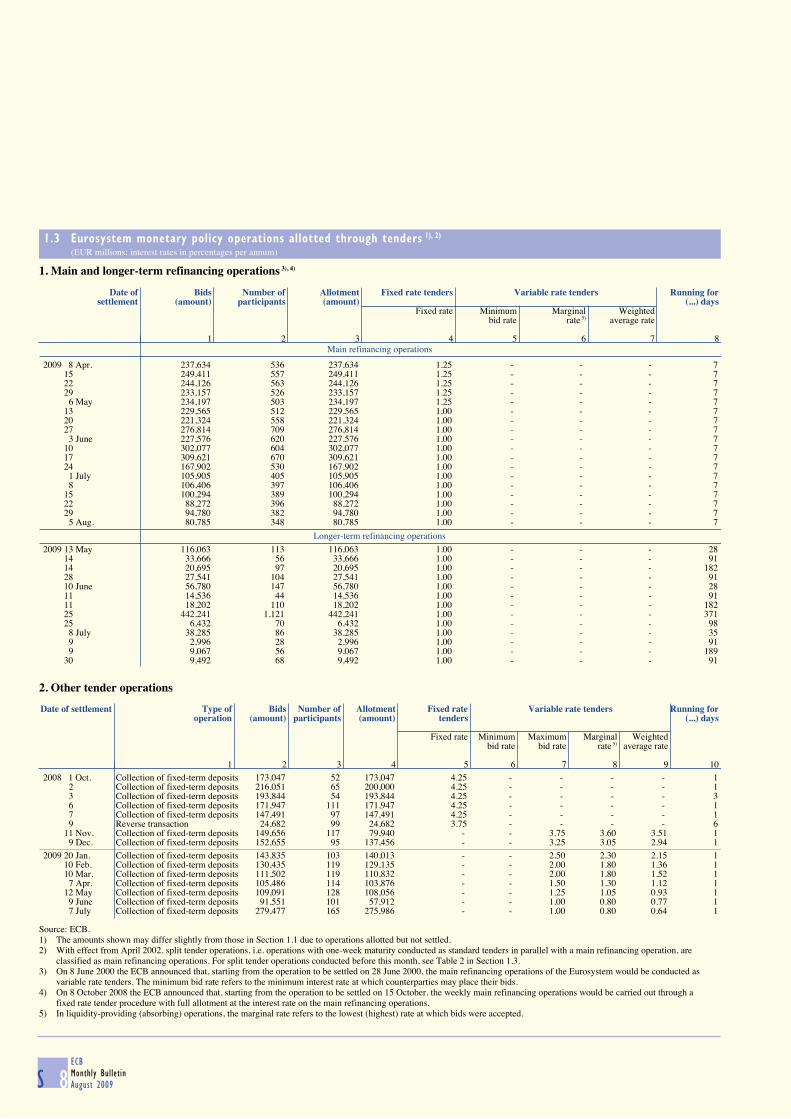
ECB
Monthly Bulletin
August 2009S 8
1.3 Eurosystem monetary policy operations allotted through tenders 1), 2) (EUR millions; interest rates in percentages per annum)
1. Main and longer-term refinancing operations 3), 4)
Main refinancing operations
Date of Bids Number of Allotment Fixed rate tenders Variable rate tenders Running for
settlement (amount) participants (amount) (...) daysFixed rate Minimum Marginal Weighted
bid rate rate 5) average rate
1 2 3 4 5 6 7 8
2009 8 Apr. 237,634 536 237,634 1.25 - - - 715 249,411 557 249,411 1.25 - - - 722 244,126 563 244,126 1.25 - - - 729 233,157 526 233,157 1.25 - - - 7
6 May 234,197 503 234,197 1.25 - - - 713 229,565 512 229,565 1.00 - - - 720 221,324 558 221,324 1.00 - - - 727 276,814 709 276,814 1.00 - - - 7
3 June 227,576 620 227,576 1.00 - - - 710 302,077 604 302,077 1.00 - - - 717 309,621 670 309,621 1.00 - - - 724 167,902 530 167,902 1.00 - - - 7
1 July 105,905 405 105,905 1.00 - - - 78 106,406 397 106,406 1.00 - - - 7
15 100,294 389 100,294 1.00 - - - 722 88,272 396 88,272 1.00 - - - 729 94,780 382 94,780 1.00 - - - 7
5 Aug. 80,785 348 80,785 1.00 - - - 7Longer-term refinancing operations
2009 13 May 116,063 113 116,063 1.00 - - - 2814 33,666 56 33,666 1.00 - - - 9114 20,695 97 20,695 1.00 - - - 18228 27,541 104 27,541 1.00 - - - 9110 June 56,780 147 56,780 1.00 - - - 2811 14,536 44 14,536 1.00 - - - 9111 18,202 110 18,202 1.00 - - - 18225 442,241 1,121 442,241 1.00 - - - 37125 6,432 70 6,432 1.00 - - - 98
8 July 38,285 86 38,285 1.00 - - - 359 2,996 28 2,996 1.00 - - - 919 9,067 56 9,067 1.00 - - - 189
30 9,492 68 9,492 1.00 - - - 91
2. Other tender operations
Date of settlement Type of Bids Number of Allotment Fixed rate Variable rate tenders Running for
operation (amount) participants (amount) tenders (...) days
Fixed rate Minimum Maximum Marginal Weightedbid rate bid rate rate 5) average rate
1 2 3 4 5 6 7 8 9 102008 1 Oct. Collection of fixed-term deposits 173,047 52 173,047 4.25 - - - - 1
2 Collection of fixed-term deposits 216,051 65 200,000 4.25 - - - - 13 Collection of fixed-term deposits 193,844 54 193,844 4.25 - - - - 36 Collection of fixed-term deposits 171,947 111 171,947 4.25 - - - - 17 Collection of fixed-term deposits 147,491 97 147,491 4.25 - - - - 19 Reverse transaction 24,682 99 24,682 3.75 - - - - 6
11 Nov. Collection of fixed-term deposits 149,656 117 79,940 - - 3.75 3.60 3.51 19 Dec. Collection of fixed-term deposits 152,655 95 137,456 - - 3.25 3.05 2.94 1
2009 20 Jan. Collection of fixed-term deposits 143,835 103 140,013 - - 2.50 2.30 2.15 110 Feb. Collection of fixed-term deposits 130,435 119 129,135 - - 2.00 1.80 1.36 110 Mar. Collection of fixed-term deposits 111,502 119 110,832 - - 2.00 1.80 1.52 1
7 Apr. Collection of fixed-term deposits 105,486 114 103,876 - - 1.50 1.30 1.12 112 May Collection of fixed-term deposits 109,091 128 108,056 - - 1.25 1.05 0.93 1
9 June Collection of fixed-term deposits 91,551 101 57,912 - - 1.00 0.80 0.77 17 July Collection of fixed-term deposits 279,477 165 275,986 - - 1.00 0.80 0.64 1
Source: ECB.1) The amounts shown may differ slightly from those in Section 1.1 due to operations allotted but not settled.2) With effect from April 2002, split tender operations, i.e. operations with one-week maturity conducted as standard tenders in parallel with a main refinancing operation, are
classified as main refinancing operations. For split tender operations conducted before this month, see Table 2 in Section 1.3.3) On 8 June 2000 the ECB announced that, starting from the operation to be settled on 28 June 2000, the main refinancing operations of the Eurosystem would be conducted as
variable rate tenders. The minimum bid rate refers to the minimum interest rate at which counterparties may place their bids.4) On 8 October 2008 the ECB announced that, starting from the operation to be settled on 15 October, the weekly main refinancing operations would be carried out through a
fixed rate tender procedure with full allotment at the interest rate on the main refinancing operations.5) In liquidity-providing (absorbing) operations, the marginal rate refers to the lowest (highest) rate at which bids were accepted.

S 9ECB
Monthly Bulletin
August 2009
EURO AREASTATISTICS
Monetary
policy
statistics
1.4 Minimum reserve and liquidity statistics (EUR billions; period averages of daily positions, unless otherwise indicated; interest rates as percentages per annum)
1. Reserve base of credit institutions subject to reserve requirements
Reserve Total Liabilities to which a 2% reserve coefficient is applied Liabilities to which a 0% reserve coefficient is applied
baseas at 1) Deposits Debt securities Deposits Repos Debt securities
(overnight, up to 2 years’ (over 2 years’ over 2 years’up to 2 years’ agreed maturity agreed maturity agreed maturity
agreed maturity and notice period)and notice period)
1 2 3 4 5 62007 17,394.7 9,438.8 815.0 2,143.1 1,364.0 3,633.92008 18,169.6 10,056.8 848.7 2,376.9 1,243.5 3,643.72009 Feb. 18,466.6 10,142.2 870.3 2,438.4 1,272.4 3,743.2 Mar. 18,269.2 10,015.6 845.4 2,443.0 1,203.2 3,761.9 Apr. 18,447.1 10,085.4 846.1 2,452.5 1,253.3 3,809.8 May 18,490.5 9,973.6 854.6 2,404.8 1,225.6 4,031.9
2. Reserve maintenance
Maintenance Required Credit institutions’ Excess Deficiencies Interest rate onperiod reserves current accounts reserves minimum reserves
ending on:1 2 3 4 5
2007 195.9 196.8 1.0 0.0 4.172008 217.2 218.7 1.5 0.0 3.25
2009 10 Feb. 221.1 222.1 1.0 0.0 2.0010 Mar. 217.6 218.6 1.0 0.0 2.00
7 Apr. 220.8 221.6 0.8 0.0 1.5012 May 219.7 220.8 1.1 0.0 1.25
9 June 216.7 217.9 1.2 0.0 1.007 July 218.1 219.2 1.1 0.0 1.00
11 Aug. 216.0 . . . .
3. Liquidity
Maintenance Liquidity-providing factors Liquidity-absorbing factors Credit Base
period institutions’ moneyending on: Monetary policy operations of the Eurosystem current
accountsEurosystem’s Main Longer-term Marginal Other Deposit Other Banknotes Central Other
net assets refinancing refinancing lending liquidity- facility liquidity- in government factorsin gold operations operations facility providing absorbing circulation deposits (net) 2)
and foreign operations operations with thecurrency Eurosystem
1 2 3 4 5 6 7 8 9 10 11 122007 327.5 173.0 278.6 0.3 0.0 0.4 2.2 644.6 61.9 -126.6 196.8 841.92008 580.5 337.3 457.2 2.7 0.0 200.9 4.9 731.1 107.8 114.3 218.7 1,150.7
2009 10 Feb. 547.4 224.9 551.4 2.1 0.0 175.4 6.1 740.2 102.7 79.3 222.1 1,137.710 Mar. 512.7 224.3 472.4 1.6 0.0 95.5 4.0 741.5 110.1 41.4 218.6 1,055.5
7 Apr. 508.0 230.5 443.1 1.1 0.0 57.8 3.7 747.3 139.0 13.3 221.6 1,026.612 May 512.4 239.7 426.9 0.7 0.0 42.7 3.1 757.5 141.9 13.7 220.8 1,021.0
9 June 487.9 238.8 400.6 0.7 0.0 22.3 2.1 759.8 141.7 -15.8 217.9 1,000.07 July 457.1 221.4 504.9 1.3 0.0 119.7 9.9 763.1 137.9 -65.1 219.2 1,102.0
Source: ECB.1) End of period.2) Starting from 1 January 2009, includes monetary policy operations which were conducted by the Národná Banka Slovenska before 1 January 2009 and were still outstanding after
this date.

ECB
Monthly Bulletin
August 2009
2
S 10
MONEY, BANKING AND INVESTMENT FUNDS
2.1 Aggregated balance sheet of euro area MFIs 1) (EUR billions; outstanding amounts at end of period)
1. Assets
Eurosystem
Total Loans to euro area residents Holdings of securities other than Money Holdings External Fixed Remaining
shares issued by euro area residents market of shares/ assets assets assetsfund other equity
Total General Other MFIs Total General Other MFIs shares/ issued bygovernment euro area government euro area units 2) euro area
residents residents residents
1 2 3 4 5 6 7 8 9 10 11 12 13 14
2006 1,558.2 695.7 19.7 0.6 675.3 217.0 187.5 2.5 27.0 - 17.2 351.4 14.7 262.42007 2,046.1 1,031.7 17.8 0.6 1,013.3 268.6 225.1 1.9 41.6 - 17.4 373.7 15.2 339.62008 Q3 2,473.4 1,342.5 18.5 0.7 1,323.3 278.9 237.4 2.4 39.1 - 14.7 482.4 16.0 338.9 Q4 2,983.0 1,809.4 18.6 0.6 1,790.1 350.8 307.9 2.4 40.4 - 14.4 479.8 15.7 313.02009 Jan. 2,830.2 1,606.0 18.6 0.7 1,586.8 362.5 314.6 2.5 45.4 - 14.2 523.8 16.0 307.7 Feb. 2,772.6 1,537.1 18.6 0.7 1,517.8 366.5 318.3 2.7 45.6 - 13.6 530.5 15.9 309.0 Mar. 2,783.6 1,555.3 18.7 0.7 1,535.9 374.1 322.7 2.5 48.9 - 13.9 491.0 15.7 333.5 Apr. 2,710.2 1,479.4 18.1 0.7 1,460.7 378.1 326.5 2.4 49.2 - 14.7 487.5 15.8 334.7 May 2,678.1 1,452.0 18.1 0.7 1,433.2 375.8 322.9 2.5 50.4 - 15.0 488.6 15.8 331.0 June (p) 2,893.3 1,671.5 17.7 0.7 1,653.1 381.0 327.0 2.7 51.3 - 15.0 486.1 16.4 323.4
MFIs excluding the Eurosystem
2006 25,944.6 14,881.7 809.0 9,134.7 4,938.0 3,561.5 1,278.8 645.8 1,636.9 83.5 1,171.4 4,336.6 172.6 1,737.42007 29,448.1 16,894.2 954.5 10,139.0 5,800.8 3,890.1 1,196.9 952.9 1,740.3 93.5 1,293.8 4,886.1 205.7 2,184.72008 Q3 31,534.6 18,134.4 978.8 10,800.1 6,355.5 4,207.8 1,195.4 1,106.8 1,905.6 101.8 1,316.1 5,125.7 203.2 2,445.5 Q4 31,840.7 18,053.4 967.6 10,768.2 6,317.6 4,630.8 1,244.7 1,406.3 1,979.8 98.7 1,199.7 4,756.6 211.6 2,889.92009 Jan. 32,287.8 18,203.0 983.2 10,854.8 6,364.9 4,769.0 1,308.3 1,409.5 2,051.1 101.6 1,205.1 4,861.4 210.6 2,937.0 Feb. 32,133.5 18,071.0 979.8 10,831.8 6,259.4 4,849.5 1,342.4 1,430.3 2,076.8 102.8 1,189.0 4,770.4 215.0 2,935.7 Mar. 31,747.4 17,907.7 970.7 10,810.5 6,126.6 4,920.7 1,387.3 1,447.5 2,085.9 104.1 1,185.7 4,545.4 215.1 2,868.7 Apr. 31,862.8 17,907.6 982.4 10,806.9 6,118.3 4,993.6 1,405.1 1,472.9 2,115.6 103.8 1,217.8 4,611.3 214.0 2,814.7 May 31,525.3 17,863.1 974.7 10,804.1 6,084.2 5,034.7 1,421.9 1,469.7 2,143.1 102.6 1,214.5 4,475.6 214.5 2,620.4 June (p) 31,815.3 18,051.5 998.5 10,834.6 6,218.4 5,079.9 1,468.2 1,488.1 2,123.6 94.8 1,198.2 4,428.7 215.1 2,747.2
2. Liabilities
Eurosystem
Total Currency Deposits of euro area residents Money Debt Capital External Remaining
in market securities and liabilities liabilitiescirculation Total Central Other general MFIs fund issued 4) reserves
government government/ shares/other euro units 3)
area residents
1 2 3 4 5 6 7 8 9 10 11
2006 1,558.2 647.0 431.6 33.7 15.9 382.0 - 0.1 208.6 35.3 235.62007 2,046.1 697.0 714.7 23.9 19.1 671.8 - 0.1 238.0 66.0 330.32008 Q3 2,473.4 705.4 932.3 51.3 17.7 863.3 - 0.1 264.4 288.1 283.1 Q4 2,983.0 784.8 1,217.5 68.8 16.6 1,132.1 - 0.1 274.0 383.3 323.42009 Jan. 2,830.2 761.9 1,093.1 102.5 19.1 971.6 - 0.1 302.6 329.1 343.3 Feb. 2,772.6 763.8 1,075.8 110.9 22.3 942.6 - 0.1 313.8 301.5 317.6 Mar. 2,783.6 768.9 1,114.9 135.6 23.3 956.0 - 0.1 296.4 301.6 301.8 Apr. 2,710.2 781.0 1,046.9 140.3 21.5 885.1 - 0.1 293.2 274.9 314.1 May 2,678.1 783.4 1,053.1 137.2 19.0 897.0 - 0.1 291.5 249.0 300.9 June (p) 2,893.3 785.9 1,257.5 125.1 23.6 1,108.7 - 0.1 283.3 208.0 358.5
MFIs excluding the Eurosystem
2006 25,944.6 - 13,265.1 124.1 7,901.8 5,239.3 698.3 4,233.6 1,454.1 3,991.4 2,302.22007 29,448.1 - 15,098.2 126.9 8,885.4 6,085.8 754.1 4,631.4 1,683.6 4,533.4 2,747.42008 Q3 31,534.6 - 16,234.4 139.9 9,347.6 6,746.8 833.2 4,851.4 1,756.1 4,890.5 2,968.9 Q4 31,840.7 - 16,759.8 190.8 9,710.5 6,858.5 825.4 4,848.3 1,767.5 4,396.0 3,243.82009 Jan. 32,287.8 - 16,816.0 222.6 9,753.5 6,839.9 861.9 4,920.9 1,786.0 4,670.8 3,232.1 Feb. 32,133.5 - 16,704.9 228.2 9,758.6 6,718.1 883.1 4,971.3 1,781.9 4,560.5 3,231.8 Mar. 31,747.4 - 16,609.3 216.2 9,786.1 6,607.0 885.2 4,936.2 1,778.7 4,343.8 3,194.2 Apr. 31,862.8 - 16,646.7 198.0 9,870.6 6,578.2 886.1 4,975.9 1,790.6 4,399.8 3,163.7 May 31,525.3 - 16,572.1 194.4 9,877.2 6,500.5 874.5 5,000.3 1,804.3 4,264.1 3,010.0 June (p) 31,815.3 - 16,797.2 227.5 9,935.0 6,634.7 844.1 4,979.7 1,827.2 4,221.0 3,146.1
Source: ECB.1) Data refer to the changing composition of the euro area. For further information, see the General notes.2) Amounts issued by euro area residents. Amounts issued by non-euro area residents are included in external assets.3) Amounts held by euro area residents.4) Amounts issued with maturity up to two years held by non-euro area residents are included in external liabilities.
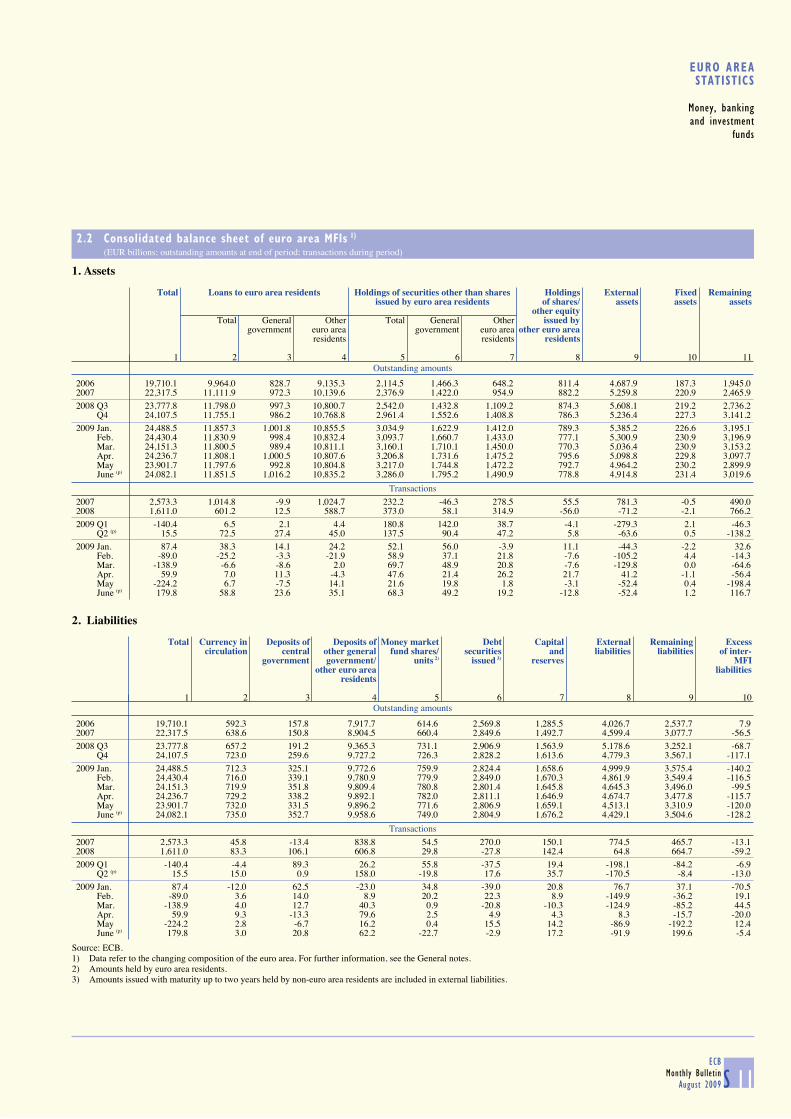
S 11ECB
Monthly Bulletin
August 2009
EURO AREASTATISTICS
Money, banking
and investment
funds
2.2 Consolidated balance sheet of euro area MFIs 1) (EUR billions; outstanding amounts at end of period; transactions during period)
1. Assets
Outstanding amounts
Total Loans to euro area residents Holdings of securities other than shares Holdings External Fixed Remaining
issued by euro area residents of shares/ assets assets assetsother equity
Total General Other Total General Other issued bygovernment euro area government euro area other euro area
residents residents residents
1 2 3 4 5 6 7 8 9 10 11
2006 19,710.1 9,964.0 828.7 9,135.3 2,114.5 1,466.3 648.2 811.4 4,687.9 187.3 1,945.02007 22,317.5 11,111.9 972.3 10,139.6 2,376.9 1,422.0 954.9 882.2 5,259.8 220.9 2,465.92008 Q3 23,777.8 11,798.0 997.3 10,800.7 2,542.0 1,432.8 1,109.2 874.3 5,608.1 219.2 2,736.2 Q4 24,107.5 11,755.1 986.2 10,768.8 2,961.4 1,552.6 1,408.8 786.3 5,236.4 227.3 3,141.22009 Jan. 24,488.5 11,857.3 1,001.8 10,855.5 3,034.9 1,622.9 1,412.0 789.3 5,385.2 226.6 3,195.1 Feb. 24,430.4 11,830.9 998.4 10,832.4 3,093.7 1,660.7 1,433.0 777.1 5,300.9 230.9 3,196.9 Mar. 24,151.3 11,800.5 989.4 10,811.1 3,160.1 1,710.1 1,450.0 770.3 5,036.4 230.9 3,153.2 Apr. 24,236.7 11,808.1 1,000.5 10,807.6 3,206.8 1,731.6 1,475.2 795.6 5,098.8 229.8 3,097.7 May 23,901.7 11,797.6 992.8 10,804.8 3,217.0 1,744.8 1,472.2 792.7 4,964.2 230.2 2,899.9 June (p) 24,082.1 11,851.5 1,016.2 10,835.2 3,286.0 1,795.2 1,490.9 778.8 4,914.8 231.4 3,019.6
Transactions
2007 2,573.3 1,014.8 -9.9 1,024.7 232.2 -46.3 278.5 55.5 781.3 -0.5 490.02008 1,611.0 601.2 12.5 588.7 373.0 58.1 314.9 -56.0 -71.2 -2.1 766.22009 Q1 -140.4 6.5 2.1 4.4 180.8 142.0 38.7 -4.1 -279.3 2.1 -46.3 Q2 (p) 15.5 72.5 27.4 45.0 137.5 90.4 47.2 5.8 -63.6 0.5 -138.22009 Jan. 87.4 38.3 14.1 24.2 52.1 56.0 -3.9 11.1 -44.3 -2.2 32.6 Feb. -89.0 -25.2 -3.3 -21.9 58.9 37.1 21.8 -7.6 -105.2 4.4 -14.3 Mar. -138.9 -6.6 -8.6 2.0 69.7 48.9 20.8 -7.6 -129.8 0.0 -64.6 Apr. 59.9 7.0 11.3 -4.3 47.6 21.4 26.2 21.7 41.2 -1.1 -56.4 May -224.2 6.7 -7.5 14.1 21.6 19.8 1.8 -3.1 -52.4 0.4 -198.4 June (p) 179.8 58.8 23.6 35.1 68.3 49.2 19.2 -12.8 -52.4 1.2 116.7
2. Liabilities
Outstanding amounts
Total Currency in Deposits of Deposits of Money market Debt Capital External Remaining Excesscirculation central other general fund shares/ securities and liabilities liabilities of inter-
government government/ units 2) issued 3) reserves MFIother euro area liabilities
residents
1 2 3 4 5 6 7 8 9 10
2006 19,710.1 592.3 157.8 7,917.7 614.6 2,569.8 1,285.5 4,026.7 2,537.7 7.92007 22,317.5 638.6 150.8 8,904.5 660.4 2,849.6 1,492.7 4,599.4 3,077.7 -56.52008 Q3 23,777.8 657.2 191.2 9,365.3 731.1 2,906.9 1,563.9 5,178.6 3,252.1 -68.7 Q4 24,107.5 723.0 259.6 9,727.2 726.3 2,828.2 1,613.6 4,779.3 3,567.1 -117.12009 Jan. 24,488.5 712.3 325.1 9,772.6 759.9 2,824.4 1,658.6 4,999.9 3,575.4 -140.2 Feb. 24,430.4 716.0 339.1 9,780.9 779.9 2,849.0 1,670.3 4,861.9 3,549.4 -116.5 Mar. 24,151.3 719.9 351.8 9,809.4 780.8 2,801.4 1,645.8 4,645.3 3,496.0 -99.5 Apr. 24,236.7 729.2 338.2 9,892.1 782.0 2,811.1 1,646.9 4,674.7 3,477.8 -115.7 May 23,901.7 732.0 331.5 9,896.2 771.6 2,806.9 1,659.1 4,513.1 3,310.9 -120.0 June (p) 24,082.1 735.0 352.7 9,958.6 749.0 2,804.9 1,676.2 4,429.1 3,504.6 -128.2
Transactions
2007 2,573.3 45.8 -13.4 838.8 54.5 270.0 150.1 774.5 465.7 -13.12008 1,611.0 83.3 106.1 606.8 29.8 -27.8 142.4 64.8 664.7 -59.22009 Q1 -140.4 -4.4 89.3 26.2 55.8 -37.5 19.4 -198.1 -84.2 -6.9 Q2 (p) 15.5 15.0 0.9 158.0 -19.8 17.6 35.7 -170.5 -8.4 -13.02009 Jan. 87.4 -12.0 62.5 -23.0 34.8 -39.0 20.8 76.7 37.1 -70.5 Feb. -89.0 3.6 14.0 8.9 20.2 22.3 8.9 -149.9 -36.2 19.1 Mar. -138.9 4.0 12.7 40.3 0.9 -20.8 -10.3 -124.9 -85.2 44.5 Apr. 59.9 9.3 -13.3 79.6 2.5 4.9 4.3 8.3 -15.7 -20.0 May -224.2 2.8 -6.7 16.2 0.4 15.5 14.2 -86.9 -192.2 12.4 June (p) 179.8 3.0 20.8 62.2 -22.7 -2.9 17.2 -91.9 199.6 -5.4
Source: ECB.1) Data refer to the changing composition of the euro area. For further information, see the General notes.2) Amounts held by euro area residents.3) Amounts issued with maturity up to two years held by non-euro area residents are included in external liabilities.
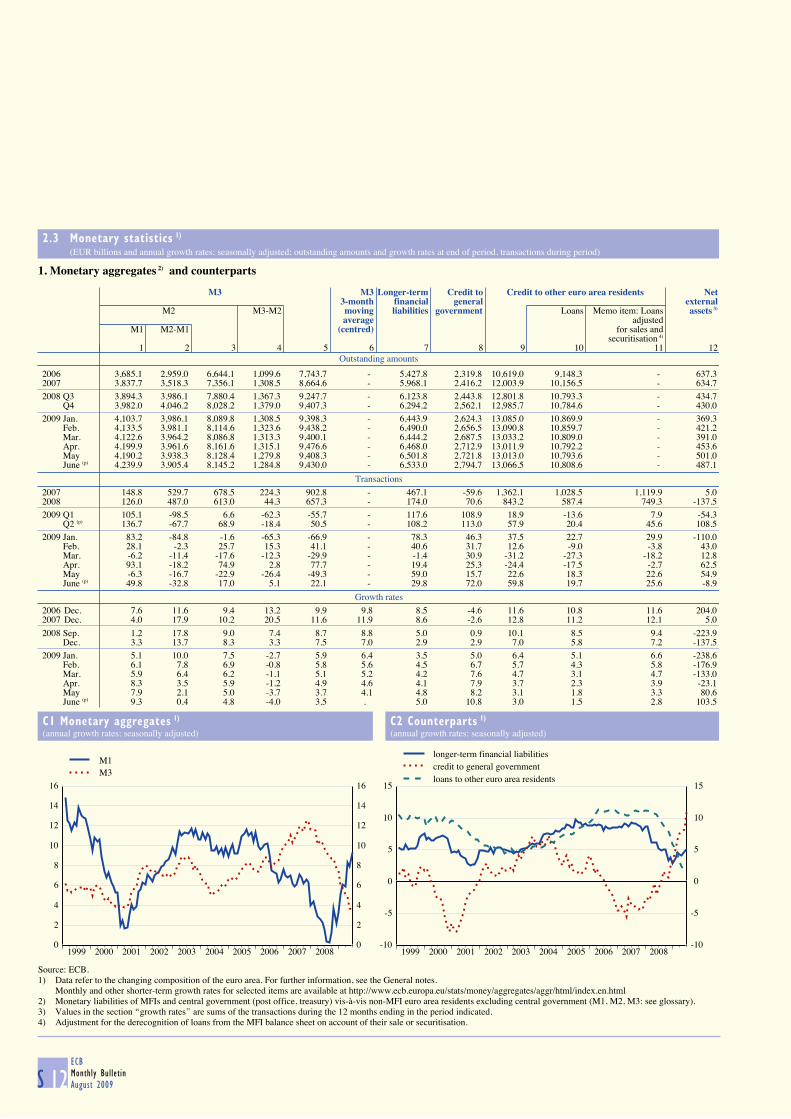
ECB
Monthly Bulletin
August 2009S 12
2.3 Monetary statistics 1) (EUR billions and annual growth rates; seasonally adjusted; outstanding amounts and growth rates at end of period, transactions during period)
1. Monetary aggregates 2) and counterparts
Outstanding amounts
M3 M3 Longer-term Credit to Credit to other euro area residents Net
3-month financial general external M2 M3-M2 moving liabilities government Loans Memo item: Loans assets 3)
average adjustedM1 M2-M1 (centred) for sales and
securitisation 4)
1 2 3 4 5 6 7 8 9 10 11 12
2006 3,685.1 2,959.0 6,644.1 1,099.6 7,743.7 - 5,427.8 2,319.8 10,619.0 9,148.3 - 637.32007 3,837.7 3,518.3 7,356.1 1,308.5 8,664.6 - 5,968.1 2,416.2 12,003.9 10,156.5 - 634.72008 Q3 3,894.3 3,986.1 7,880.4 1,367.3 9,247.7 - 6,123.8 2,443.8 12,801.8 10,793.3 - 434.7 Q4 3,982.0 4,046.2 8,028.2 1,379.0 9,407.3 - 6,294.2 2,562.1 12,985.7 10,784.6 - 430.02009 Jan. 4,103.7 3,986.1 8,089.8 1,308.5 9,398.3 - 6,443.9 2,624.3 13,085.0 10,869.9 - 369.3 Feb. 4,133.5 3,981.1 8,114.6 1,323.6 9,438.2 - 6,490.0 2,656.5 13,090.8 10,859.7 - 421.2 Mar. 4,122.6 3,964.2 8,086.8 1,313.3 9,400.1 - 6,444.2 2,687.5 13,033.2 10,809.0 - 391.0 Apr. 4,199.9 3,961.6 8,161.6 1,315.1 9,476.6 - 6,468.0 2,712.9 13,011.9 10,792.2 - 453.6 May 4,190.2 3,938.3 8,128.4 1,279.8 9,408.3 - 6,501.8 2,721.8 13,013.0 10,793.6 - 501.0 June (p) 4,239.9 3,905.4 8,145.2 1,284.8 9,430.0 - 6,533.0 2,794.7 13,066.5 10,808.6 - 487.1
Transactions
2007 148.8 529.7 678.5 224.3 902.8 - 467.1 -59.6 1,362.1 1,028.5 1,119.9 5.02008 126.0 487.0 613.0 44.3 657.3 - 174.0 70.6 843.2 587.4 749.3 -137.52009 Q1 105.1 -98.5 6.6 -62.3 -55.7 - 117.6 108.9 18.9 -13.6 7.9 -54.3 Q2 (p) 136.7 -67.7 68.9 -18.4 50.5 - 108.2 113.0 57.9 20.4 45.6 108.52009 Jan. 83.2 -84.8 -1.6 -65.3 -66.9 - 78.3 46.3 37.5 22.7 29.9 -110.0 Feb. 28.1 -2.3 25.7 15.3 41.1 - 40.6 31.7 12.6 -9.0 -3.8 43.0 Mar. -6.2 -11.4 -17.6 -12.3 -29.9 - -1.4 30.9 -31.2 -27.3 -18.2 12.8 Apr. 93.1 -18.2 74.9 2.8 77.7 - 19.4 25.3 -24.4 -17.5 -2.7 62.5 May -6.3 -16.7 -22.9 -26.4 -49.3 - 59.0 15.7 22.6 18.3 22.6 54.9 June (p) 49.8 -32.8 17.0 5.1 22.1 - 29.8 72.0 59.8 19.7 25.6 -8.9
Growth rates
2006 Dec. 7.6 11.6 9.4 13.2 9.9 9.8 8.5 -4.6 11.6 10.8 11.6 204.02007 Dec. 4.0 17.9 10.2 20.5 11.6 11.9 8.6 -2.6 12.8 11.2 12.1 5.0
2008 Sep. 1.2 17.8 9.0 7.4 8.7 8.8 5.0 0.9 10.1 8.5 9.4 -223.9 Dec. 3.3 13.7 8.3 3.3 7.5 7.0 2.9 2.9 7.0 5.8 7.2 -137.5
2009 Jan. 5.1 10.0 7.5 -2.7 5.9 6.4 3.5 5.0 6.4 5.1 6.6 -238.6 Feb. 6.1 7.8 6.9 -0.8 5.8 5.6 4.5 6.7 5.7 4.3 5.8 -176.9 Mar. 5.9 6.4 6.2 -1.1 5.1 5.2 4.2 7.6 4.7 3.1 4.7 -133.0 Apr. 8.3 3.5 5.9 -1.2 4.9 4.6 4.1 7.9 3.7 2.3 3.9 -23.1 May 7.9 2.1 5.0 -3.7 3.7 4.1 4.8 8.2 3.1 1.8 3.3 80.6 June (p) 9.3 0.4 4.8 -4.0 3.5 . 5.0 10.8 3.0 1.5 2.8 103.5
C1 Monetary aggregates 1) (annual growth rates; seasonally adjusted)
C2 Counterparts 1) (annual growth rates; seasonally adjusted)
0
2
4
6
8
10
12
14
16
1999 2000 2001 2002 2003 2004 2005 2006 2007 20080
2
4
6
8
10
12
14
16
M1M3
-10
-5
0
5
10
15
1999 2000 2001 2002 2003 2004 2005 2006 2007 2008-10
-5
0
5
10
15
longer-term financial liabilitiescredit to general governmentloans to other euro area residents
Source: ECB.1) Data refer to the changing composition of the euro area. For further information, see the General notes.
Monthly and other shorter-term growth rates for selected items are available at http://www.ecb.europa.eu/stats/money/aggregates/aggr/html/index.en.html2) Monetary liabilities of MFIs and central government (post office, treasury) vis-à-vis non-MFI euro area residents excluding central government (M1, M2, M3: see glossary).3) Values in the section ‘‘growth rates’’ are sums of the transactions during the 12 months ending in the period indicated.4) Adjustment for the derecognition of loans from the MFI balance sheet on account of their sale or securitisation.
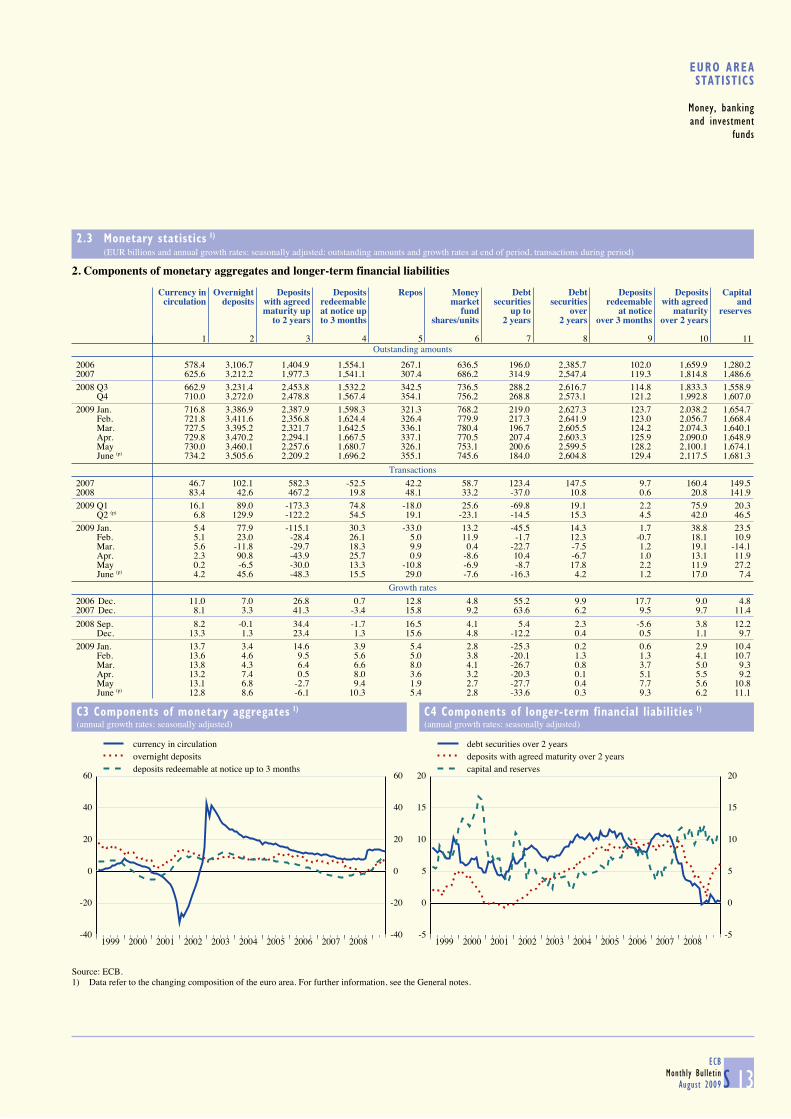
S 13ECB
Monthly Bulletin
August 2009
EURO AREASTATISTICS
Money, banking
and investment
funds
2.3 Monetary statistics 1) (EUR billions and annual growth rates; seasonally adjusted; outstanding amounts and growth rates at end of period, transactions during period)
2. Components of monetary aggregates and longer-term financial liabilities
Outstanding amounts
Currency in Overnight Deposits Deposits Repos Money Debt Debt Deposits Deposits Capitalcirculation deposits with agreed redeemable market securities securities redeemable with agreed and
maturity up at notice up fund up to over at notice maturity reservesto 2 years to 3 months shares/units 2 years 2 years over 3 months over 2 years
1 2 3 4 5 6 7 8 9 10 11
2006 578.4 3,106.7 1,404.9 1,554.1 267.1 636.5 196.0 2,385.7 102.0 1,659.9 1,280.22007 625.6 3,212.2 1,977.3 1,541.1 307.4 686.2 314.9 2,547.4 119.3 1,814.8 1,486.62008 Q3 662.9 3,231.4 2,453.8 1,532.2 342.5 736.5 288.2 2,616.7 114.8 1,833.3 1,558.9 Q4 710.0 3,272.0 2,478.8 1,567.4 354.1 756.2 268.8 2,573.1 121.2 1,992.8 1,607.02009 Jan. 716.8 3,386.9 2,387.9 1,598.3 321.3 768.2 219.0 2,627.3 123.7 2,038.2 1,654.7 Feb. 721.8 3,411.6 2,356.8 1,624.4 326.4 779.9 217.3 2,641.9 123.0 2,056.7 1,668.4 Mar. 727.5 3,395.2 2,321.7 1,642.5 336.1 780.4 196.7 2,605.5 124.2 2,074.3 1,640.1 Apr. 729.8 3,470.2 2,294.1 1,667.5 337.1 770.5 207.4 2,603.3 125.9 2,090.0 1,648.9 May 730.0 3,460.1 2,257.6 1,680.7 326.1 753.1 200.6 2,599.5 128.2 2,100.1 1,674.1 June (p) 734.2 3,505.6 2,209.2 1,696.2 355.1 745.6 184.0 2,604.8 129.4 2,117.5 1,681.3
Transactions
2007 46.7 102.1 582.3 -52.5 42.2 58.7 123.4 147.5 9.7 160.4 149.52008 83.4 42.6 467.2 19.8 48.1 33.2 -37.0 10.8 0.6 20.8 141.92009 Q1 16.1 89.0 -173.3 74.8 -18.0 25.6 -69.8 19.1 2.2 75.9 20.3 Q2 (p) 6.8 129.9 -122.2 54.5 19.1 -23.1 -14.5 15.3 4.5 42.0 46.52009 Jan. 5.4 77.9 -115.1 30.3 -33.0 13.2 -45.5 14.3 1.7 38.8 23.5 Feb. 5.1 23.0 -28.4 26.1 5.0 11.9 -1.7 12.3 -0.7 18.1 10.9 Mar. 5.6 -11.8 -29.7 18.3 9.9 0.4 -22.7 -7.5 1.2 19.1 -14.1 Apr. 2.3 90.8 -43.9 25.7 0.9 -8.6 10.4 -6.7 1.0 13.1 11.9 May 0.2 -6.5 -30.0 13.3 -10.8 -6.9 -8.7 17.8 2.2 11.9 27.2 June (p) 4.2 45.6 -48.3 15.5 29.0 -7.6 -16.3 4.2 1.2 17.0 7.4
Growth rates
2006 Dec. 11.0 7.0 26.8 0.7 12.8 4.8 55.2 9.9 17.7 9.0 4.82007 Dec. 8.1 3.3 41.3 -3.4 15.8 9.2 63.6 6.2 9.5 9.7 11.4
2008 Sep. 8.2 -0.1 34.4 -1.7 16.5 4.1 5.4 2.3 -5.6 3.8 12.2 Dec. 13.3 1.3 23.4 1.3 15.6 4.8 -12.2 0.4 0.5 1.1 9.7
2009 Jan. 13.7 3.4 14.6 3.9 5.4 2.8 -25.3 0.2 0.6 2.9 10.4 Feb. 13.6 4.6 9.5 5.6 5.0 3.8 -20.1 1.3 1.3 4.1 10.7 Mar. 13.8 4.3 6.4 6.6 8.0 4.1 -26.7 0.8 3.7 5.0 9.3 Apr. 13.2 7.4 0.5 8.0 3.6 3.2 -20.3 0.1 5.1 5.5 9.2 May 13.1 6.8 -2.7 9.4 1.9 2.7 -27.7 0.4 7.7 5.6 10.8 June (p) 12.8 8.6 -6.1 10.3 5.4 2.8 -33.6 0.3 9.3 6.2 11.1
C3 Components of monetary aggregates 1) (annual growth rates; seasonally adjusted)
C4 Components of longer-term financial liabilities 1) (annual growth rates; seasonally adjusted)
-40
-20
0
20
40
60
1999 2000 2001 2002 2003 2004 2005 2006 2007 2008-40
-20
0
20
40
60
currency in circulationovernight depositsdeposits redeemable at notice up to 3 months
-5
0
5
10
15
20
1999 2000 2001 2002 2003 2004 2005 2006 2007 2008-5
0
5
10
15
20
debt securities over 2 yearsdeposits with agreed maturity over 2 yearscapital and reserves
Source: ECB.1) Data refer to the changing composition of the euro area. For further information, see the General notes.
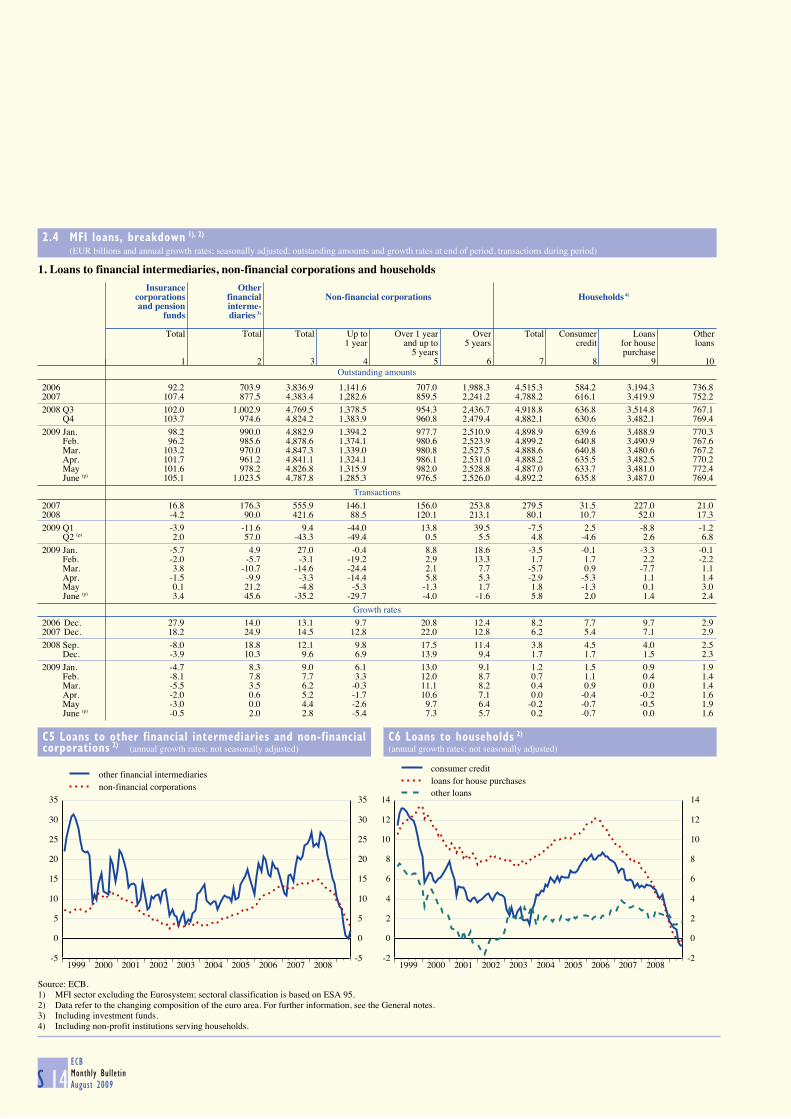
S 14ECB
Monthly Bulletin
August 2009
2.4 MFI loans, breakdown 1), 2) (EUR billions and annual growth rates; seasonally adjusted; outstanding amounts and growth rates at end of period, transactions during period)
1. Loans to financial intermediaries, non-financial corporations and households
Outstanding amounts
Insurance Other
corporations financial Non-financial corporations Households 4) and pension interme-
funds diaries 3)
Total Total Total Up to Over 1 year Over Total Consumer Loans Other1 year and up to 5 years credit for house loans
5 years purchase1 2 3 4 5 6 7 8 9 10
2006 92.2 703.9 3,836.9 1,141.6 707.0 1,988.3 4,515.3 584.2 3,194.3 736.82007 107.4 877.5 4,383.4 1,282.6 859.5 2,241.2 4,788.2 616.1 3,419.9 752.22008 Q3 102.0 1,002.9 4,769.5 1,378.5 954.3 2,436.7 4,918.8 636.8 3,514.8 767.1 Q4 103.7 974.6 4,824.2 1,383.9 960.8 2,479.4 4,882.1 630.6 3,482.1 769.42009 Jan. 98.2 990.0 4,882.9 1,394.2 977.7 2,510.9 4,898.9 639.6 3,488.9 770.3 Feb. 96.2 985.6 4,878.6 1,374.1 980.6 2,523.9 4,899.2 640.8 3,490.9 767.6 Mar. 103.2 970.0 4,847.3 1,339.0 980.8 2,527.5 4,888.6 640.8 3,480.6 767.2 Apr. 101.7 961.2 4,841.1 1,324.1 986.1 2,531.0 4,888.2 635.5 3,482.5 770.2 May 101.6 978.2 4,826.8 1,315.9 982.0 2,528.8 4,887.0 633.7 3,481.0 772.4 June (p) 105.1 1,023.5 4,787.8 1,285.3 976.5 2,526.0 4,892.2 635.8 3,487.0 769.4
Transactions
2007 16.8 176.3 555.9 146.1 156.0 253.8 279.5 31.5 227.0 21.02008 -4.2 90.0 421.6 88.5 120.1 213.1 80.1 10.7 52.0 17.32009 Q1 -3.9 -11.6 9.4 -44.0 13.8 39.5 -7.5 2.5 -8.8 -1.2 Q2 (p) 2.0 57.0 -43.3 -49.4 0.5 5.5 4.8 -4.6 2.6 6.82009 Jan. -5.7 4.9 27.0 -0.4 8.8 18.6 -3.5 -0.1 -3.3 -0.1 Feb. -2.0 -5.7 -3.1 -19.2 2.9 13.3 1.7 1.7 2.2 -2.2 Mar. 3.8 -10.7 -14.6 -24.4 2.1 7.7 -5.7 0.9 -7.7 1.1 Apr. -1.5 -9.9 -3.3 -14.4 5.8 5.3 -2.9 -5.3 1.1 1.4 May 0.1 21.2 -4.8 -5.3 -1.3 1.7 1.8 -1.3 0.1 3.0 June (p) 3.4 45.6 -35.2 -29.7 -4.0 -1.6 5.8 2.0 1.4 2.4
Growth rates
2006 Dec. 27.9 14.0 13.1 9.7 20.8 12.4 8.2 7.7 9.7 2.92007 Dec. 18.2 24.9 14.5 12.8 22.0 12.8 6.2 5.4 7.1 2.92008 Sep. -8.0 18.8 12.1 9.8 17.5 11.4 3.8 4.5 4.0 2.5 Dec. -3.9 10.3 9.6 6.9 13.9 9.4 1.7 1.7 1.5 2.32009 Jan. -4.7 8.3 9.0 6.1 13.0 9.1 1.2 1.5 0.9 1.9 Feb. -8.1 7.8 7.7 3.3 12.0 8.7 0.7 1.1 0.4 1.4 Mar. -5.5 3.5 6.2 -0.3 11.1 8.2 0.4 0.9 0.0 1.4 Apr. -2.0 0.6 5.2 -1.7 10.6 7.1 0.0 -0.4 -0.2 1.6 May -3.0 0.0 4.4 -2.6 9.7 6.4 -0.2 -0.7 -0.5 1.9 June (p) -0.5 2.0 2.8 -5.4 7.3 5.7 0.2 -0.7 0.0 1.6
C5 Loans to other financial intermediaries and non-financialcorporations 2) (annual growth rates; not seasonally adjusted)
C6 Loans to households 2) (annual growth rates; not seasonally adjusted)
-5
0
5
10
15
20
25
30
35
1999 2000 2001 2002 2003 2004 2005 2006 2007 2008-5
0
5
10
15
20
25
30
35
other financial intermediariesnon-financial corporations
-2
0
2
4
6
8
10
12
14
1999 2000 2001 2002 2003 2004 2005 2006 2007 2008-2
0
2
4
6
8
10
12
14
consumer creditloans for house purchasesother loans
Source: ECB.1) MFI sector excluding the Eurosystem; sectoral classification is based on ESA 95.2) Data refer to the changing composition of the euro area. For further information, see the General notes.3) Including investment funds.4) Including non-profit institutions serving households.

S 15ECB
Monthly Bulletin
August 2009
EURO AREASTATISTICS
Money, banking
and investment
funds
2.4 MFI loans, breakdown 1), 2) (EUR billions and annual growth rates; not seasonally adjusted; outstanding amounts and growth rates at end of period, transactions during period)
2. Loans to financial intermediaries and non-financial corporations
Outstanding amounts
Insurance corporations and pension funds Other financial intermediaries 3) Non-financial corporations
Total Up to Over 1 year Over Total Up to Over 1 year Over Total Up to Over 1 year Over1 year and up to 5 years 1 year and up to 5 years 1 year and up to 5 years
5 years 5 years 5 years1 2 3 4 5 6 7 8 9 10 11 12
2007 95.6 71.2 7.5 17.0 862.2 522.5 148.0 191.7 4,386.2 1,278.0 859.2 2,249.12008 Q3 101.8 78.0 6.4 17.5 1,011.6 616.3 169.5 225.8 4,761.1 1,374.6 953.5 2,433.0 Q4 92.3 68.5 5.7 18.0 960.8 553.9 168.8 238.0 4,827.0 1,378.3 960.6 2,488.1
2009 Mar. 102.1 75.7 6.2 20.2 986.5 568.6 179.9 238.0 4,843.0 1,336.2 981.2 2,525.6 Apr. 103.7 77.3 5.7 20.7 984.0 562.6 180.4 241.0 4,844.0 1,328.1 985.6 2,530.3 May 105.7 78.9 5.7 21.0 993.6 575.6 179.4 238.6 4,826.5 1,312.5 982.8 2,531.2 June (p) 107.8 82.6 7.5 17.7 1,023.2 597.8 183.3 242.1 4,803.4 1,300.3 976.6 2,526.5
Transactions
2007 15.0 16.7 -5.2 3.5 175.0 113.4 34.1 27.5 555.7 144.9 156.1 254.72008 -3.8 -2.9 -1.8 0.9 91.4 27.2 21.5 42.7 421.7 87.6 120.1 213.92009 Q1 6.5 5.8 0.6 0.1 18.7 10.0 11.1 -2.4 2.3 -41.1 14.6 28.9 Q2 (p) 5.9 7.0 1.3 -2.5 40.2 31.9 3.1 5.2 -23.4 -31.6 0.2 8.0
2009 Mar. 4.7 4.4 -0.3 0.5 9.1 11.7 1.1 -3.7 -7.9 -20.1 4.5 7.8 Apr. 1.6 1.6 -0.5 0.5 -3.6 -6.8 0.1 3.1 3.9 -7.6 4.8 6.6 May 2.2 1.8 0.0 0.4 13.9 15.4 -0.2 -1.2 -8.0 -12.8 -0.1 4.8 June (p) 2.1 3.6 1.9 -3.4 29.9 23.3 3.2 3.3 -19.3 -11.2 -4.6 -3.4
Growth rates
2007 Dec. 18.2 30.6 -41.1 23.5 25.1 27.2 29.6 16.7 14.5 12.7 22.1 12.82008 Sep. -7.6 -10.6 -26.1 18.7 18.9 15.6 24.5 24.7 12.1 9.8 17.5 11.4 Dec. -3.9 -4.0 -23.7 5.0 10.7 5.4 14.6 22.2 9.6 6.8 13.9 9.42009 Mar. -5.2 -7.2 -18.0 10.4 3.5 -5.3 19.6 17.5 6.3 -0.3 11.1 8.2 Apr. -2.0 -2.0 -25.1 8.3 0.7 -9.5 19.1 18.4 5.2 -1.7 10.6 7.1 May -3.1 -4.4 -22.7 11.2 0.0 -9.2 16.7 16.0 4.4 -2.6 9.7 6.4 June (p) -0.3 0.9 -1.1 -4.2 2.0 -4.6 14.2 12.2 2.8 -5.4 7.4 5.7
3. Loans to households 4)
Outstanding amounts
Total Consumer credit Loans for house purchase Other loans
Total Up to Over 1 year Over Total Up to Over 1 year Over Total Up to Over 1 year Over1 year and up to 5 years 1 year and up to 5 years 1 year and up to 5 years
5 years 5 years 5 years1 2 3 4 5 6 7 8 9 10 11 12 13
2007 4,794.9 618.4 137.5 203.9 276.9 3,423.3 15.9 73.7 3,333.7 753.2 147.4 104.0 501.82008 Q3 4,925.6 638.3 139.3 201.4 297.6 3,519.9 16.8 71.7 3,431.4 767.3 149.6 100.0 517.8 Q4 4,888.2 632.8 138.8 196.1 298.0 3,484.8 17.2 67.5 3,400.2 770.5 155.0 90.5 524.9
2009 Mar. 4,878.9 637.8 136.2 199.9 301.7 3,475.2 16.3 65.6 3,393.2 765.9 150.7 88.4 526.8 Apr. 4,875.3 633.8 134.5 198.1 301.2 3,473.8 16.2 65.5 3,392.2 767.7 148.2 88.6 530.9 May 4,878.4 632.4 133.3 197.6 301.4 3,475.9 16.3 65.4 3,394.2 770.2 147.2 88.6 534.4 June (p) 4,900.1 639.2 136.0 199.1 304.1 3,486.9 16.1 65.8 3,404.9 774.1 155.2 88.5 530.4
Transactions
2007 278.9 31.5 3.8 1.1 26.6 226.4 0.9 2.3 223.2 21.1 1.7 4.4 14.92008 79.4 10.7 1.1 -9.1 18.6 51.4 1.1 -3.8 54.1 17.4 2.5 -5.3 20.22009 Q1 -23.2 -2.7 -2.4 -2.1 1.8 -17.0 -0.9 -3.3 -12.7 -3.5 -4.2 -1.8 2.6 Q2 (p) 22.4 1.8 0.1 -0.4 2.2 7.9 -0.5 0.2 8.1 12.7 4.8 0.4 7.6
2009 Mar. -3.8 3.3 0.7 0.0 2.6 -8.1 -0.8 -1.2 -6.1 1.0 0.7 -0.3 0.7 Apr. -6.1 -4.1 -1.7 -1.7 -0.7 -2.2 -0.4 -0.1 -1.6 0.1 -2.5 0.2 2.4 May 6.1 -0.9 -1.1 -0.3 0.5 3.7 0.2 -0.1 3.6 3.3 -0.7 0.1 4.0 June (p) 22.4 6.8 2.9 1.6 2.3 6.3 -0.2 0.4 6.1 9.3 8.1 0.1 1.1
Growth rates
2007 Dec. 6.2 5.4 2.8 0.5 10.7 7.1 6.0 3.2 7.2 2.9 1.2 4.3 3.02008 Sep. 3.8 4.5 4.2 -1.3 9.0 4.0 4.8 -1.3 4.1 2.5 2.2 -2.3 3.5 Dec. 1.7 1.7 0.8 -4.4 6.7 1.5 7.0 -5.2 1.6 2.3 1.7 -5.1 4.02009 Mar. 0.4 0.9 0.2 -4.5 5.1 0.0 1.0 -9.0 0.2 1.4 -0.2 -7.5 3.7 Apr. 0.0 -0.4 -0.8 -6.1 3.8 -0.2 -1.5 -9.0 0.0 1.6 -1.0 -5.4 3.7 May -0.2 -0.6 -1.8 -6.0 3.7 -0.5 1.1 -9.2 -0.3 1.9 -0.7 -5.1 4.0 June (p) 0.2 -0.7 -2.1 -5.2 3.1 0.1 -0.2 -8.8 0.2 1.6 -1.1 -5.5 3.8
Source: ECB.1) MFI sector excluding the Eurosystem; sectoral classification is based on ESA 95.2) Data refer to the changing composition of the euro area. For further information, see the General notes.3) Including investment funds.4) Including non-profit institutions serving households.

S 16ECB
Monthly Bulletin
August 2009
2.4 MFI loans, breakdown 1), 2) (EUR billions and annual growth rates; not seasonally adjusted; outstanding amounts and growth rates at end of period, transactions during period)
4. Loans to government and non-euro area residents
Outstanding amounts
General government Non-euro area residents
Total Central Other general government Total Banks 3) Non-banks
governmentState Local Social Total General Other
government government security governmentfunds
1 2 3 4 5 6 7 8 9 10
2006 809.0 104.0 232.5 446.6 25.8 2,931.8 2,070.6 861.2 63.1 798.12007 954.5 213.4 217.6 494.0 29.4 3,307.6 2,352.4 955.1 59.8 895.32008 Q2 974.0 220.4 215.1 496.4 42.0 3,321.2 2,312.5 1,008.8 63.0 945.8 Q3 978.8 225.6 210.0 497.8 45.4 3,525.7 2,461.8 1,063.9 61.8 1,002.0 Q4 967.6 226.9 210.1 508.4 22.2 3,250.1 2,284.6 965.5 57.8 907.72009 Q1 (p) 970.7 229.4 205.6 512.8 22.3 3,056.6 2,114.5 942.0 57.1 884.9
Transactions
2007 -8.0 -4.5 -13.0 6.0 3.6 541.6 382.1 159.5 0.3 159.22008 13.3 12.3 -8.1 16.3 -7.2 -51.7 -82.8 30.9 0.6 30.32008 Q2 17.7 9.7 2.1 1.1 4.8 -98.9 -93.4 -5.4 1.6 -7.0 Q3 4.5 4.9 -5.2 1.4 3.4 90.8 73.5 17.3 -3.2 20.5 Q4 -9.4 1.1 -0.2 12.8 -23.2 -256.3 -182.5 -73.9 -0.7 -73.22009 Q1 (p) 2.0 2.1 -4.4 3.8 0.1 -236.8 -197.7 -39.3 -1.9 -37.5
Growth rates
2006 Dec. -1.6 -14.0 -5.8 5.2 -11.6 21.9 24.0 17.2 -0.1 18.92007 Dec. -1.0 -4.3 -5.6 1.3 13.8 18.6 18.6 18.8 0.5 20.3
2008 June 2.4 7.5 -1.8 2.4 11.7 7.8 4.7 15.4 9.5 15.8 Sep. 3.4 13.2 -1.9 2.7 9.6 8.0 5.2 15.0 1.8 15.9 Dec. 1.4 5.8 -3.7 3.3 -24.4 -1.5 -3.5 3.3 0.9 3.52009 Mar. (p) 1.5 8.4 -3.6 3.9 -40.0 -14.2 -16.1 -9.7 -6.8 -9.9
C7 Loans to government 2) (annual growth rates; not seasonally adjusted)
C8 Loans to non-euro area residents 2) (annual growth rates; not seasonally adjusted)
-20
-15
-10
-5
0
5
10
15
1999 2000 2001 2002 2003 2004 2005 2006 2007 2008-20
-15
-10
-5
0
5
10
15
central governmentother general government
-20
-10
0
10
20
30
40
1999 2000 2001 2002 2003 2004 2005 2006 2007 2008-20
-10
0
10
20
30
40
non-resident banksnon-resident non-banks
Source: ECB.1) MFI sector excluding the Eurosystem; sectoral classification is based on ESA 95.2) Data refer to the changing composition of the euro area. For further information, see the General notes.3) The term ‘‘banks’’ is used in this table to indicate institutions of a similar type to MFIs resident outside the euro area.
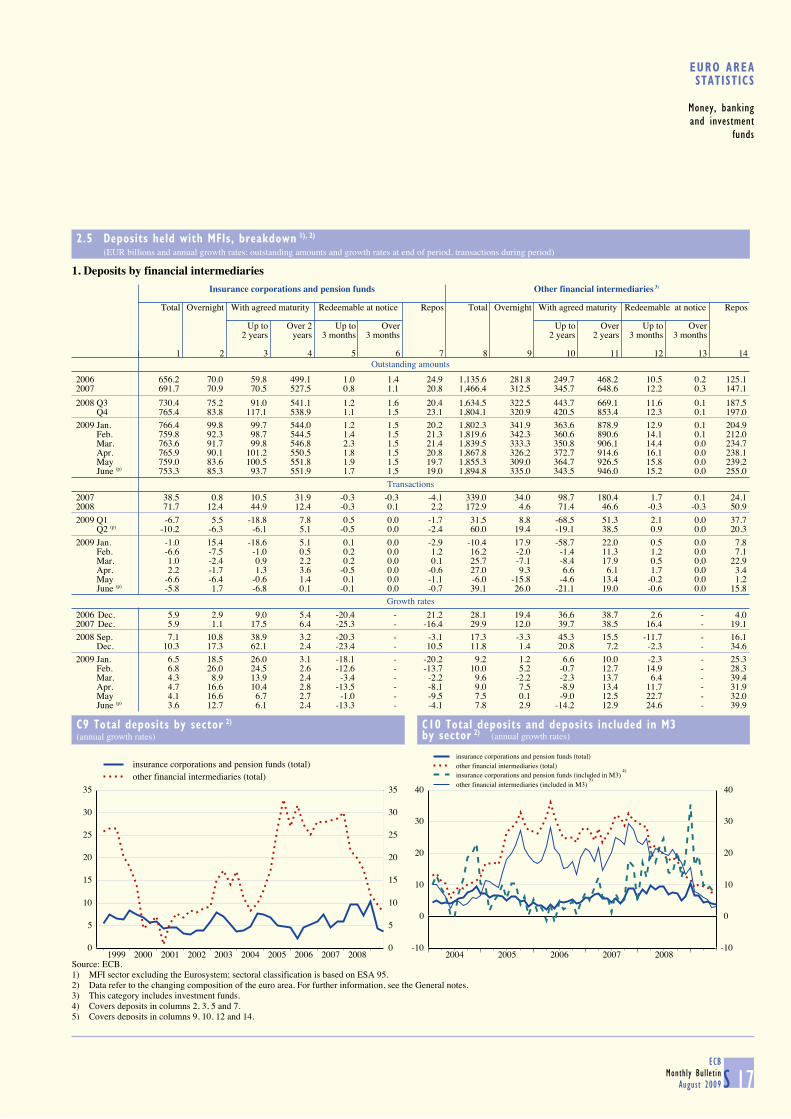
S 17ECB
Monthly Bulletin
August 2009
EURO AREASTATISTICS
Money, banking
and investment
funds
2.5 Deposits held with MFIs, breakdown 1), 2) (EUR billions and annual growth rates; outstanding amounts and growth rates at end of period, transactions during period)
1. Deposits by financial intermediaries
Outstanding amounts
Insurance corporations and pension funds Other financial intermediaries 3)
Total Overnight With agreed maturity Redeemable at notice Repos Total Overnight With agreed maturity Redeemable at notice Repos
Up to Over 2 Up to Over Up to Over Up to Over2 years years 3 months 3 months 2 years 2 years 3 months 3 months
1 2 3 4 5 6 7 8 9 10 11 12 13 14
2006 656.2 70.0 59.8 499.1 1.0 1.4 24.9 1,135.6 281.8 249.7 468.2 10.5 0.2 125.12007 691.7 70.9 70.5 527.5 0.8 1.1 20.8 1,466.4 312.5 345.7 648.6 12.2 0.3 147.1
2008 Q3 730.4 75.2 91.0 541.1 1.2 1.6 20.4 1,634.5 322.5 443.7 669.1 11.6 0.1 187.5 Q4 765.4 83.8 117.1 538.9 1.1 1.5 23.1 1,804.1 320.9 420.5 853.4 12.3 0.1 197.0
2009 Jan. 766.4 99.8 99.7 544.0 1.2 1.5 20.2 1,802.3 341.9 363.6 878.9 12.9 0.1 204.9 Feb. 759.8 92.3 98.7 544.5 1.4 1.5 21.3 1,819.6 342.3 360.6 890.6 14.1 0.1 212.0 Mar. 763.6 91.7 99.8 546.8 2.3 1.5 21.4 1,839.5 333.3 350.8 906.1 14.4 0.0 234.7 Apr. 765.9 90.1 101.2 550.5 1.8 1.5 20.8 1,867.8 326.2 372.7 914.6 16.1 0.0 238.1 May 759.0 83.6 100.5 551.8 1.9 1.5 19.7 1,855.3 309.0 364.7 926.5 15.8 0.0 239.2 June (p) 753.3 85.3 93.7 551.9 1.7 1.5 19.0 1,894.8 335.0 343.5 946.0 15.2 0.0 255.0
Transactions
2007 38.5 0.8 10.5 31.9 -0.3 -0.3 -4.1 339.0 34.0 98.7 180.4 1.7 0.1 24.12008 71.7 12.4 44.9 12.4 -0.3 0.1 2.2 172.9 4.6 71.4 46.6 -0.3 -0.3 50.9
2009 Q1 -6.7 5.5 -18.8 7.8 0.5 0.0 -1.7 31.5 8.8 -68.5 51.3 2.1 0.0 37.7 Q2 (p) -10.2 -6.3 -6.1 5.1 -0.5 0.0 -2.4 60.0 19.4 -19.1 38.5 0.9 0.0 20.3
2009 Jan. -1.0 15.4 -18.6 5.1 0.1 0.0 -2.9 -10.4 17.9 -58.7 22.0 0.5 0.0 7.8 Feb. -6.6 -7.5 -1.0 0.5 0.2 0.0 1.2 16.2 -2.0 -1.4 11.3 1.2 0.0 7.1 Mar. 1.0 -2.4 0.9 2.2 0.2 0.0 0.1 25.7 -7.1 -8.4 17.9 0.5 0.0 22.9 Apr. 2.2 -1.7 1.3 3.6 -0.5 0.0 -0.6 27.0 9.3 6.6 6.1 1.7 0.0 3.4 May -6.6 -6.4 -0.6 1.4 0.1 0.0 -1.1 -6.0 -15.8 -4.6 13.4 -0.2 0.0 1.2 June (p) -5.8 1.7 -6.8 0.1 -0.1 0.0 -0.7 39.1 26.0 -21.1 19.0 -0.6 0.0 15.8
Growth rates
2006 Dec. 5.9 2.9 9.0 5.4 -20.4 - 21.2 28.1 19.4 36.6 38.7 2.6 - 4.02007 Dec. 5.9 1.1 17.5 6.4 -25.3 - -16.4 29.9 12.0 39.7 38.5 16.4 - 19.12008 Sep. 7.1 10.8 38.9 3.2 -20.3 - -3.1 17.3 -3.3 45.3 15.5 -11.7 - 16.1 Dec. 10.3 17.3 62.1 2.4 -23.4 - 10.5 11.8 1.4 20.8 7.2 -2.3 - 34.62009 Jan. 6.5 18.5 26.0 3.1 -18.1 - -20.2 9.2 1.2 6.6 10.0 -2.3 - 25.3 Feb. 6.8 26.0 24.5 2.6 -12.6 - -13.7 10.0 5.2 -0.7 12.7 14.9 - 28.3 Mar. 4.3 8.9 13.9 2.4 -3.4 - -2.2 9.6 -2.2 -2.3 13.7 6.4 - 39.4 Apr. 4.7 16.6 10.4 2.8 -13.5 - -8.1 9.0 7.5 -8.9 13.4 11.7 - 31.9 May 4.1 16.6 6.7 2.7 -1.0 - -9.5 7.5 0.1 -9.0 12.5 22.7 - 32.0 June (p) 3.6 12.7 6.1 2.4 -13.3 - -4.1 7.8 2.9 -14.2 12.9 24.6 - 39.9
C9 Total deposits by sector 2) (annual growth rates)
C10 Total deposits and deposits included in M3by sector 2) (annual growth rates)
0
5
10
15
20
25
30
35
1999 2000 2001 2002 2003 2004 2005 2006 2007 20080
5
10
15
20
25
30
35
insurance corporations and pension funds (total)other financial intermediaries (total)
-10
0
10
20
30
40
2004 2005 2006 2007 2008-10
0
10
20
30
40
insurance corporations and pension funds (total)other financial intermediaries (total)insurance corporations and pension funds (included in M3)other financial intermediaries (included in M3)
Source: ECB.1) MFI sector excluding the Eurosystem; sectoral classification is based on ESA 95.2) Data refer to the changing composition of the euro area. For further information, see the General notes.3) This category includes investment funds.4) Covers deposits in columns 2, 3, 5 and 7.5) Covers deposits in columns 9, 10, 12 and 14.
4)
5)
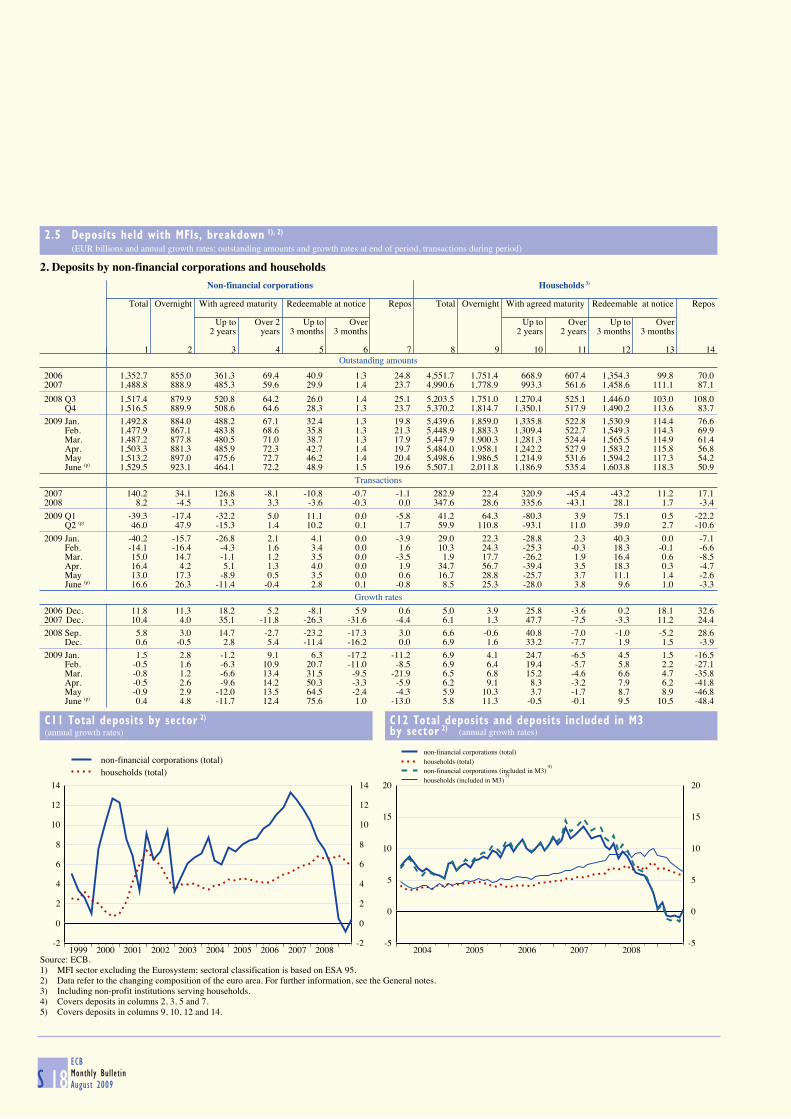
S 18ECB
Monthly Bulletin
August 2009
2.5 Deposits held with MFIs, breakdown 1), 2) (EUR billions and annual growth rates; outstanding amounts and growth rates at end of period, transactions during period)
2. Deposits by non-financial corporations and households
Outstanding amounts
Non-financial corporations Households 3)
Total Overnight With agreed maturity Redeemable at notice Repos Total Overnight With agreed maturity Redeemable at notice Repos
Up to Over 2 Up to Over Up to Over Up to Over2 years years 3 months 3 months 2 years 2 years 3 months 3 months
1 2 3 4 5 6 7 8 9 10 11 12 13 14
2006 1,352.7 855.0 361.3 69.4 40.9 1.3 24.8 4,551.7 1,751.4 668.9 607.4 1,354.3 99.8 70.02007 1,488.8 888.9 485.3 59.6 29.9 1.4 23.7 4,990.6 1,778.9 993.3 561.6 1,458.6 111.1 87.1
2008 Q3 1,517.4 879.9 520.8 64.2 26.0 1.4 25.1 5,203.5 1,751.0 1,270.4 525.1 1,446.0 103.0 108.0 Q4 1,516.5 889.9 508.6 64.6 28.3 1.3 23.7 5,370.2 1,814.7 1,350.1 517.9 1,490.2 113.6 83.7
2009 Jan. 1,492.8 884.0 488.2 67.1 32.4 1.3 19.8 5,439.6 1,859.0 1,335.8 522.8 1,530.9 114.4 76.6 Feb. 1,477.9 867.1 483.8 68.6 35.8 1.3 21.3 5,448.9 1,883.3 1,309.4 522.7 1,549.3 114.3 69.9 Mar. 1,487.2 877.8 480.5 71.0 38.7 1.3 17.9 5,447.9 1,900.3 1,281.3 524.4 1,565.5 114.9 61.4 Apr. 1,503.3 881.3 485.9 72.3 42.7 1.4 19.7 5,484.0 1,958.1 1,242.2 527.9 1,583.2 115.8 56.8 May 1,513.2 897.0 475.6 72.7 46.2 1.4 20.4 5,498.6 1,986.5 1,214.9 531.6 1,594.2 117.3 54.2 June (p) 1,529.5 923.1 464.1 72.2 48.9 1.5 19.6 5,507.1 2,011.8 1,186.9 535.4 1,603.8 118.3 50.9
Transactions
2007 140.2 34.1 126.8 -8.1 -10.8 -0.7 -1.1 282.9 22.4 320.9 -45.4 -43.2 11.2 17.12008 8.2 -4.5 13.3 3.3 -3.6 -0.3 0.0 347.6 28.6 335.6 -43.1 28.1 1.7 -3.4
2009 Q1 -39.3 -17.4 -32.2 5.0 11.1 0.0 -5.8 41.2 64.3 -80.3 3.9 75.1 0.5 -22.2 Q2 (p) 46.0 47.9 -15.3 1.4 10.2 0.1 1.7 59.9 110.8 -93.1 11.0 39.0 2.7 -10.6
2009 Jan. -40.2 -15.7 -26.8 2.1 4.1 0.0 -3.9 29.0 22.3 -28.8 2.3 40.3 0.0 -7.1 Feb. -14.1 -16.4 -4.3 1.6 3.4 0.0 1.6 10.3 24.3 -25.3 -0.3 18.3 -0.1 -6.6 Mar. 15.0 14.7 -1.1 1.2 3.5 0.0 -3.5 1.9 17.7 -26.2 1.9 16.4 0.6 -8.5 Apr. 16.4 4.2 5.1 1.3 4.0 0.0 1.9 34.7 56.7 -39.4 3.5 18.3 0.3 -4.7 May 13.0 17.3 -8.9 0.5 3.5 0.0 0.6 16.7 28.8 -25.7 3.7 11.1 1.4 -2.6 June (p) 16.6 26.3 -11.4 -0.4 2.8 0.1 -0.8 8.5 25.3 -28.0 3.8 9.6 1.0 -3.3
Growth rates
2006 Dec. 11.8 11.3 18.2 5.2 -8.1 5.9 0.6 5.0 3.9 25.8 -3.6 0.2 18.1 32.62007 Dec. 10.4 4.0 35.1 -11.8 -26.3 -31.6 -4.4 6.1 1.3 47.7 -7.5 -3.3 11.2 24.42008 Sep. 5.8 3.0 14.7 -2.7 -23.2 -17.3 3.0 6.6 -0.6 40.8 -7.0 -1.0 -5.2 28.6 Dec. 0.6 -0.5 2.8 5.4 -11.4 -16.2 0.0 6.9 1.6 33.2 -7.7 1.9 1.5 -3.92009 Jan. 1.5 2.8 -1.2 9.1 6.3 -17.2 -11.2 6.9 4.1 24.7 -6.5 4.5 1.5 -16.5 Feb. -0.5 1.6 -6.3 10.9 20.7 -11.0 -8.5 6.9 6.4 19.4 -5.7 5.8 2.2 -27.1 Mar. -0.8 1.2 -6.6 13.4 31.5 -9.5 -21.9 6.5 6.8 15.2 -4.6 6.6 4.7 -35.8 Apr. -0.5 2.6 -9.6 14.2 50.3 -3.3 -5.9 6.2 9.1 8.3 -3.2 7.9 6.2 -41.8 May -0.9 2.9 -12.0 13.5 64.5 -2.4 -4.3 5.9 10.3 3.7 -1.7 8.7 8.9 -46.8 June (p) 0.4 4.8 -11.7 12.4 75.6 1.0 -13.0 5.8 11.3 -0.5 -0.1 9.5 10.5 -48.4
C11 Total deposits by sector 2) (annual growth rates)
C12 Total deposits and deposits included in M3by sector 2) (annual growth rates)
-2
0
2
4
6
8
10
12
14
1999 2000 2001 2002 2003 2004 2005 2006 2007 2008-2
0
2
4
6
8
10
12
14
non-financial corporations (total)households (total)
-5
0
5
10
15
20
2004 2005 2006 2007 2008-5
0
5
10
15
20
non-financial corporations (total)households (total)non-financial corporations (included in M3)households (included in M3)
Source: ECB.1) MFI sector excluding the Eurosystem; sectoral classification is based on ESA 95.2) Data refer to the changing composition of the euro area. For further information, see the General notes.3) Including non-profit institutions serving households.4) Covers deposits in columns 2, 3, 5 and 7.5) Covers deposits in columns 9, 10, 12 and 14.
4)
5)
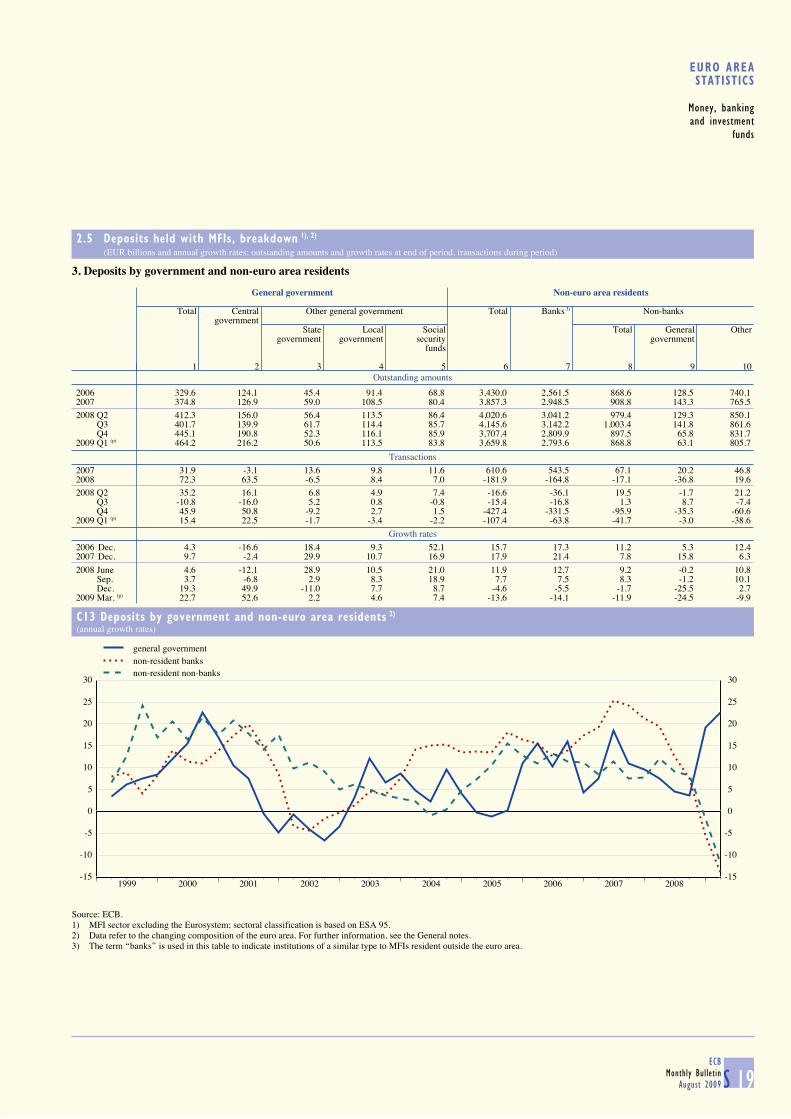
S 19ECB
Monthly Bulletin
August 2009
EURO AREASTATISTICS
Money, banking
and investment
funds
2.5 Deposits held with MFIs, breakdown 1), 2) (EUR billions and annual growth rates; outstanding amounts and growth rates at end of period, transactions during period)
3. Deposits by government and non-euro area residents
Outstanding amounts
General government Non-euro area residents
Total Central Other general government Total Banks 3) Non-banks
governmentState Local Social Total General Other
government government security governmentfunds
1 2 3 4 5 6 7 8 9 10
2006 329.6 124.1 45.4 91.4 68.8 3,430.0 2,561.5 868.6 128.5 740.12007 374.8 126.9 59.0 108.5 80.4 3,857.3 2,948.5 908.8 143.3 765.52008 Q2 412.3 156.0 56.4 113.5 86.4 4,020.6 3,041.2 979.4 129.3 850.1 Q3 401.7 139.9 61.7 114.4 85.7 4,145.6 3,142.2 1,003.4 141.8 861.6 Q4 445.1 190.8 52.3 116.1 85.9 3,707.4 2,809.9 897.5 65.8 831.72009 Q1 (p) 464.2 216.2 50.6 113.5 83.8 3,659.8 2,793.6 868.8 63.1 805.7
Transactions
2007 31.9 -3.1 13.6 9.8 11.6 610.6 543.5 67.1 20.2 46.82008 72.3 63.5 -6.5 8.4 7.0 -181.9 -164.8 -17.1 -36.8 19.62008 Q2 35.2 16.1 6.8 4.9 7.4 -16.6 -36.1 19.5 -1.7 21.2 Q3 -10.8 -16.0 5.2 0.8 -0.8 -15.4 -16.8 1.3 8.7 -7.4 Q4 45.9 50.8 -9.2 2.7 1.5 -427.4 -331.5 -95.9 -35.3 -60.62009 Q1 (p) 15.4 22.5 -1.7 -3.4 -2.2 -107.4 -63.8 -41.7 -3.0 -38.6
Growth rates
2006 Dec. 4.3 -16.6 18.4 9.3 52.1 15.7 17.3 11.2 5.3 12.42007 Dec. 9.7 -2.4 29.9 10.7 16.9 17.9 21.4 7.8 15.8 6.3
2008 June 4.6 -12.1 28.9 10.5 21.0 11.9 12.7 9.2 -0.2 10.8 Sep. 3.7 -6.8 2.9 8.3 18.9 7.7 7.5 8.3 -1.2 10.1 Dec. 19.3 49.9 -11.0 7.7 8.7 -4.6 -5.5 -1.7 -25.5 2.72009 Mar. (p) 22.7 52.6 2.2 4.6 7.4 -13.6 -14.1 -11.9 -24.5 -9.9
C13 Deposits by government and non-euro area residents 2) (annual growth rates)
-15
-10
-5
0
5
10
15
20
25
30
1999 2000 2001 2002 2003 2004 2005 2006 2007 2008-15
-10
-5
0
5
10
15
20
25
30
general governmentnon-resident banksnon-resident non-banks
Source: ECB.1) MFI sector excluding the Eurosystem; sectoral classification is based on ESA 95.2) Data refer to the changing composition of the euro area. For further information, see the General notes.3) The term ‘‘banks’’ is used in this table to indicate institutions of a similar type to MFIs resident outside the euro area.

S 20ECB
Monthly Bulletin
August 2009
2.6 MFI holdings of securities, breakdown 1), 2) (EUR billions and annual growth rates; outstanding amounts and growth rates at end of period, transactions during period)
Outstanding amounts
Securities other than shares Shares and other equity
Total MFIs General Other euro Non-euro area Total MFIs Non-MFIs Non-euro area
government area residents residents residents
Euro Non-euro Euro Non-euro Euro Non-euro
1 2 3 4 5 6 7 8 9 10 11 12
2006 4,671.3 1,564.7 72.3 1,262.7 16.1 615.7 30.1 1,109.8 1,465.0 372.7 798.7 293.62007 5,124.7 1,656.3 84.0 1,180.3 16.6 919.6 33.3 1,234.6 1,636.5 424.5 869.3 342.72008 Q3 5,516.3 1,803.6 102.0 1,179.8 15.6 1,057.4 49.4 1,308.5 1,605.7 452.1 864.0 289.5 Q4 5,858.4 1,887.4 92.4 1,225.4 19.3 1,355.2 51.2 1,227.5 1,477.1 423.3 776.4 277.42009 Jan. 6,033.5 1,948.2 102.9 1,285.0 23.4 1,354.2 55.4 1,264.5 1,490.5 425.4 779.7 285.4 Feb. 6,121.0 1,969.9 106.9 1,321.5 21.0 1,374.5 55.8 1,271.4 1,463.7 421.0 768.0 274.8 Mar. 6,136.4 1,982.3 103.5 1,366.7 20.6 1,396.9 50.6 1,215.7 1,457.1 424.5 761.2 271.5 Apr. 6,211.2 2,012.8 102.9 1,384.2 20.9 1,421.9 50.9 1,217.6 1,491.9 432.1 785.7 274.1 May 6,228.3 2,036.5 106.7 1,402.7 19.2 1,422.2 47.5 1,193.6 1,488.6 431.9 782.6 274.1 June (p) 6,278.7 2,017.2 106.4 1,447.9 20.3 1,440.8 47.4 1,198.9 1,473.7 429.5 768.7 275.6
Transactions
2007 543.8 136.1 18.0 -86.2 1.5 269.5 9.5 195.4 147.8 51.3 55.4 41.02008 600.3 212.5 6.0 36.6 1.9 295.3 19.1 28.8 -84.1 22.9 -56.5 -50.52009 Q1 255.1 95.6 8.6 133.7 0.4 41.4 -2.7 -21.9 -4.4 3.0 -4.2 -3.2 Q2 (p) 165.5 36.4 3.7 84.8 0.3 48.8 -1.9 -6.7 15.8 7.8 5.6 2.42009 Jan. 110.4 59.1 3.7 52.4 2.1 -4.1 0.1 -2.8 24.6 4.4 11.0 9.3 Feb. 89.7 24.8 3.7 36.9 -2.4 21.6 -0.1 5.1 -18.8 -2.9 -7.6 -8.3 Mar. 54.9 11.7 1.3 44.5 0.6 23.8 -2.8 -24.2 -10.3 1.5 -7.6 -4.2 Apr. 64.7 30.1 -2.2 17.8 0.1 26.6 -0.3 -7.5 28.3 5.1 21.7 1.6 May 53.7 24.9 6.7 22.2 -0.8 3.1 -1.4 -1.0 1.2 4.6 -3.2 -0.2 June (p) 47.0 -18.7 -0.8 44.8 1.0 19.1 -0.2 1.8 -13.8 -2.0 -12.9 1.1
Growth rates
2006 Dec. 7.7 8.5 16.5 -8.7 4.4 19.2 25.6 24.1 15.5 20.1 13.6 15.12007 Dec. 11.7 8.7 25.3 -6.8 10.7 43.3 33.4 17.7 10.0 13.7 6.9 13.9
2008 Sep. 11.5 11.1 24.2 -1.8 6.5 31.6 46.0 10.0 3.9 11.0 7.9 -14.6 Dec. 11.7 12.7 8.2 3.1 9.9 32.2 57.5 2.4 -5.3 5.4 -6.7 -15.3
2009 Jan. 11.6 14.4 3.8 6.2 16.4 31.1 43.9 -1.3 -4.5 5.2 -6.5 -11.9 Feb. 11.7 13.9 6.1 9.3 19.0 30.0 45.0 -2.8 -4.9 2.4 -5.4 -13.6 Mar. 11.8 14.4 10.7 12.5 16.4 30.4 3.1 -5.2 -4.5 0.5 -6.5 -6.4 Apr. 11.2 14.8 3.8 12.8 20.3 28.8 -3.7 -7.0 -6.3 0.4 -9.5 -6.6 May 10.2 13.5 2.8 14.0 18.4 26.0 -6.5 -8.3 -6.5 -1.1 -9.2 -6.6 June (p) 10.5 12.0 1.4 18.1 19.3 24.5 -6.0 -8.0 -3.5 0.8 -5.5 -4.3
C14 MFI holdings of securities 2) (annual growth rates)
-10
-5
0
5
10
15
20
25
30
1999 2000 2001 2002 2003 2004 2005 2006 2007 2008-10
-5
0
5
10
15
20
25
30
securities other than sharesshares and other equity
Source: ECB.1) MFI sector excluding the Eurosystem; sectoral classification is based on ESA 95.2) Data refer to the changing composition of the euro area. For further information, see the General notes.

S 21ECB
Monthly Bulletin
August 2009
EURO AREASTATISTICS
Money, banking
and investment
funds
2.7 Revaluation of selected MFI balance sheet items 1), 2) (EUR billions)
1. Write-offs/write-downs of loans to households 3)
Consumer credit Lending for house purchase Other lending
Total Up to Over 1 year Over Total Up to Over 1 year Over Total Up to Over 1 year Over1 year and up to 5 years 1 year and up to 5 years 1 year and up to 5 years
5 years 5 years 5 years
1 2 3 4 5 6 7 8 9 10 11 122007 -4.2 -1.2 -1.4 -1.6 -2.7 -0.2 -0.2 -2.3 -6.9 -0.8 -2.3 -3.72008 -4.5 -1.1 -1.5 -1.9 -2.7 0.0 -0.2 -2.5 -6.7 -1.2 -2.3 -3.22008 Q4 -1.5 -0.3 -0.5 -0.7 -0.6 0.0 -0.1 -0.5 -2.1 -0.4 -0.8 -1.02009 Q1 -1.8 -0.5 -0.5 -0.8 -1.2 0.0 -0.1 -1.1 -2.2 -0.7 -0.2 -1.32009 Jan. -0.6 -0.2 -0.2 -0.3 -0.6 0.0 0.0 -0.6 -0.9 -0.5 0.0 -0.4 Feb. -0.5 0.0 -0.2 -0.3 -0.1 0.0 0.0 -0.1 -0.5 -0.1 -0.1 -0.4 Mar. -0.7 -0.3 -0.2 -0.3 -0.5 0.0 0.0 -0.4 -0.8 -0.2 -0.1 -0.5 Apr. -0.6 0.0 -0.2 -0.3 -0.2 0.0 0.0 -0.2 -0.2 0.0 0.0 -0.2 May -0.3 -0.1 -0.1 -0.2 -0.3 0.0 0.0 -0.3 -0.3 0.0 0.0 -0.3 June (p) -0.6 -0.2 -0.2 -0.2 -0.5 0.0 0.0 -0.4 -0.5 -0.1 -0.1 -0.3
2. Write-offs/write-downs of loans to non-financial corporations and non-euro area residents
Non-financial corporations Non-euro area residents
Total Up to Over 1 year Over Total Up to Over 11 year and up to 5 years 1 year year
5 years
1 2 3 4 5 6 72007 -12.5 -2.1 -5.4 -4.9 -5.2 -3.4 -1.82008 -17.7 -4.0 -9.1 -4.5 -6.6 -3.4 -3.22008 Q4 -5.5 -1.2 -2.7 -1.6 -2.9 -0.8 -2.12009 Q1 -7.1 -3.5 -1.6 -2.0 -2.7 -1.3 -1.32009 Jan. -1.8 -0.8 -0.4 -0.6 -1.3 -0.9 -0.5 Feb. -1.4 -0.6 -0.3 -0.4 -0.4 -0.1 -0.3 Mar. -3.9 -2.0 -0.9 -1.0 -1.0 -0.3 -0.6 Apr. -1.8 -0.7 -0.6 -0.6 0.1 -0.1 0.2 May -1.2 -0.2 -0.6 -0.3 -0.2 -0.1 -0.1 June (p) -2.7 -0.7 -1.2 -0.8 -0.9 -0.2 -0.7
3. Revaluation of securities held by MFIs
Securities other than shares Shares and other equity
Total MFIs General Other euro Non-euro area Total MFIs Non-MFIs Non-euro area
government area residents residents residents
Euro Non-euro Euro Non-euro Euro Non-euro
1 2 3 4 5 6 7 8 9 10 11 122007 -14.2 -3.3 0.1 -0.3 -0.2 -3.2 -0.6 -6.7 27.6 3.8 11.7 12.12008 -56.4 -8.0 0.0 5.2 0.0 -20.1 -2.2 -31.2 -60.6 -8.2 -44.1 -8.22008 Q4 -12.9 -0.8 0.1 7.6 0.1 -10.1 -1.2 -8.6 -28.2 -7.2 -14.8 -6.12009 Q1 -15.8 -0.8 -0.1 -3.2 0.0 -3.9 0.4 -8.3 -16.0 -3.5 -11.4 -1.12009 Jan. -9.1 1.1 0.0 -3.6 0.0 -0.9 0.2 -5.9 -11.7 -3.9 -8.2 0.4 Feb. -5.4 -2.6 0.0 -0.3 0.0 -1.7 0.2 -1.1 -8.0 -1.6 -4.1 -2.3 Mar. -1.3 0.7 0.0 0.8 0.0 -1.4 0.0 -1.3 3.7 2.0 0.8 0.9 Apr. -0.1 1.1 0.2 -0.4 0.0 -1.7 0.2 0.6 6.5 2.5 2.9 1.1 May -2.8 0.5 -0.1 -1.1 -0.2 -0.8 0.0 -1.2 2.0 1.1 0.7 0.2 June (p) -0.3 -0.7 0.0 0.4 0.0 -0.6 0.0 0.5 -1.1 -0.4 -1.0 0.4
Source: ECB.1) MFI sector excluding the Eurosystem; sectoral classification is based on ESA 95.2) Data refer to the changing composition of the euro area. For further information, see the General notes.3) Including non-profit institutions serving households.
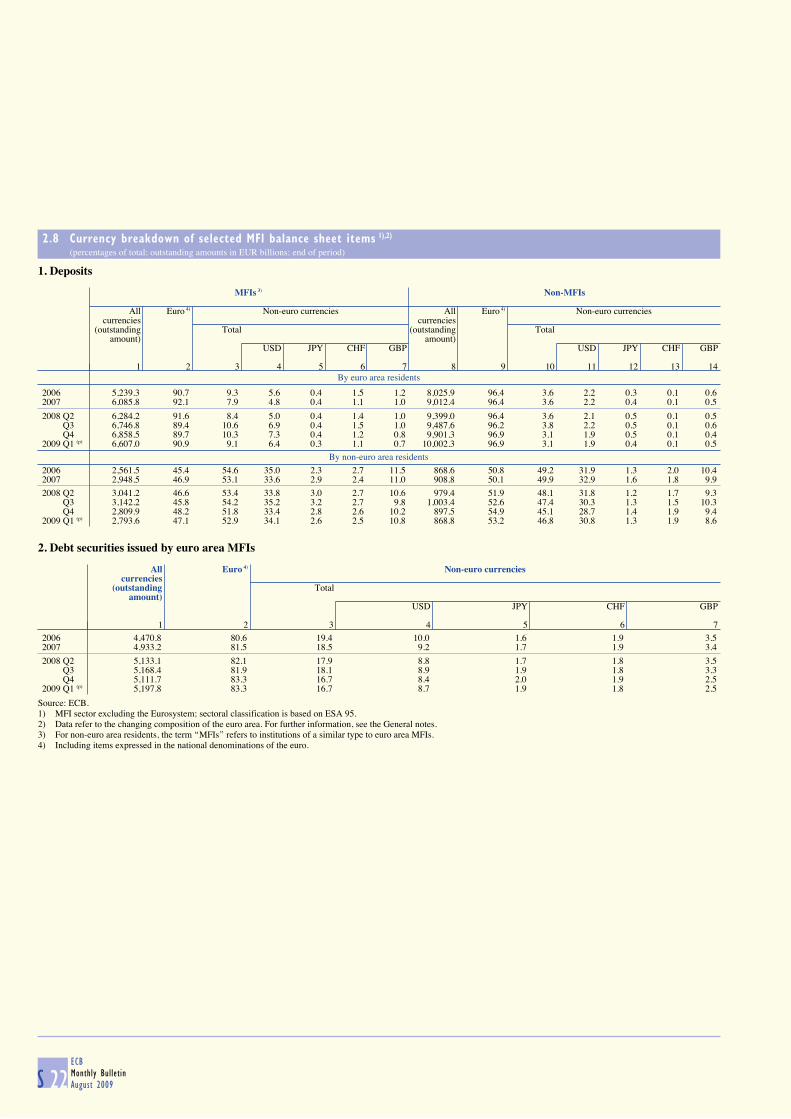
S 22ECB
Monthly Bulletin
August 2009
2.8 Currency breakdown of selected MFI balance sheet items 1),2) (percentages of total; outstanding amounts in EUR billions; end of period)
1. Deposits
By euro area residents
MFIs 3) Non-MFIs
All Euro 4) Non-euro currencies All Euro 4) Non-euro currencies
currencies currencies (outstanding Total (outstanding Total
amount) amount)USD JPY CHF GBP USD JPY CHF GBP
1 2 3 4 5 6 7 8 9 10 11 12 13 14
2006 5,239.3 90.7 9.3 5.6 0.4 1.5 1.2 8,025.9 96.4 3.6 2.2 0.3 0.1 0.62007 6,085.8 92.1 7.9 4.8 0.4 1.1 1.0 9,012.4 96.4 3.6 2.2 0.4 0.1 0.5
2008 Q2 6,284.2 91.6 8.4 5.0 0.4 1.4 1.0 9,399.0 96.4 3.6 2.1 0.5 0.1 0.5 Q3 6,746.8 89.4 10.6 6.9 0.4 1.5 1.0 9,487.6 96.2 3.8 2.2 0.5 0.1 0.6 Q4 6,858.5 89.7 10.3 7.3 0.4 1.2 0.8 9,901.3 96.9 3.1 1.9 0.5 0.1 0.42009 Q1 (p) 6,607.0 90.9 9.1 6.4 0.3 1.1 0.7 10,002.3 96.9 3.1 1.9 0.4 0.1 0.5
By non-euro area residents
2006 2,561.5 45.4 54.6 35.0 2.3 2.7 11.5 868.6 50.8 49.2 31.9 1.3 2.0 10.42007 2,948.5 46.9 53.1 33.6 2.9 2.4 11.0 908.8 50.1 49.9 32.9 1.6 1.8 9.9
2008 Q2 3,041.2 46.6 53.4 33.8 3.0 2.7 10.6 979.4 51.9 48.1 31.8 1.2 1.7 9.3 Q3 3,142.2 45.8 54.2 35.2 3.2 2.7 9.8 1,003.4 52.6 47.4 30.3 1.3 1.5 10.3 Q4 2,809.9 48.2 51.8 33.4 2.8 2.6 10.2 897.5 54.9 45.1 28.7 1.4 1.9 9.42009 Q1 (p) 2,793.6 47.1 52.9 34.1 2.6 2.5 10.8 868.8 53.2 46.8 30.8 1.3 1.9 8.6
2. Debt securities issued by euro area MFIs
All Euro 4) Non-euro currencies
currencies (outstanding Total
amount)USD JPY CHF GBP
1 2 3 4 5 6 72006 4,470.8 80.6 19.4 10.0 1.6 1.9 3.52007 4,933.2 81.5 18.5 9.2 1.7 1.9 3.4
2008 Q2 5,133.1 82.1 17.9 8.8 1.7 1.8 3.5 Q3 5,168.4 81.9 18.1 8.9 1.9 1.8 3.3 Q4 5,111.7 83.3 16.7 8.4 2.0 1.9 2.52009 Q1 (p) 5,197.8 83.3 16.7 8.7 1.9 1.8 2.5
Source: ECB.1) MFI sector excluding the Eurosystem; sectoral classification is based on ESA 95.2) Data refer to the changing composition of the euro area. For further information, see the General notes.3) For non-euro area residents, the term ‘‘MFIs’’ refers to institutions of a similar type to euro area MFIs.4) Including items expressed in the national denominations of the euro.
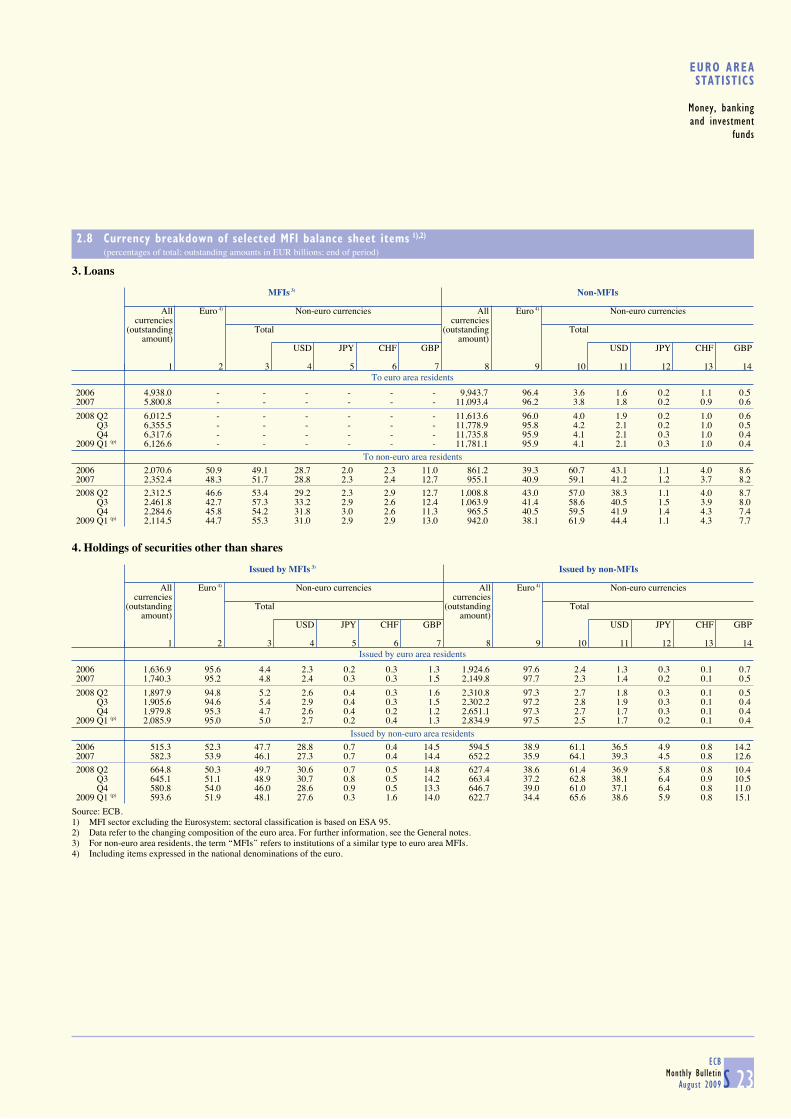
S 23ECB
Monthly Bulletin
August 2009
EURO AREASTATISTICS
Money, banking
and investment
funds
2.8 Currency breakdown of selected MFI balance sheet items 1),2) (percentages of total; outstanding amounts in EUR billions; end of period)
3. Loans
To euro area residents
MFIs 3) Non-MFIs
All Euro 4) Non-euro currencies All Euro 4) Non-euro currencies
currencies currencies (outstanding Total (outstanding Total
amount) amount)USD JPY CHF GBP USD JPY CHF GBP
1 2 3 4 5 6 7 8 9 10 11 12 13 14
2006 4,938.0 - - - - - - 9,943.7 96.4 3.6 1.6 0.2 1.1 0.52007 5,800.8 - - - - - - 11,093.4 96.2 3.8 1.8 0.2 0.9 0.6
2008 Q2 6,012.5 - - - - - - 11,613.6 96.0 4.0 1.9 0.2 1.0 0.6 Q3 6,355.5 - - - - - - 11,778.9 95.8 4.2 2.1 0.2 1.0 0.5 Q4 6,317.6 - - - - - - 11,735.8 95.9 4.1 2.1 0.3 1.0 0.42009 Q1 (p) 6,126.6 - - - - - - 11,781.1 95.9 4.1 2.1 0.3 1.0 0.4
To non-euro area residents
2006 2,070.6 50.9 49.1 28.7 2.0 2.3 11.0 861.2 39.3 60.7 43.1 1.1 4.0 8.62007 2,352.4 48.3 51.7 28.8 2.3 2.4 12.7 955.1 40.9 59.1 41.2 1.2 3.7 8.2
2008 Q2 2,312.5 46.6 53.4 29.2 2.3 2.9 12.7 1,008.8 43.0 57.0 38.3 1.1 4.0 8.7 Q3 2,461.8 42.7 57.3 33.2 2.9 2.6 12.4 1,063.9 41.4 58.6 40.5 1.5 3.9 8.0 Q4 2,284.6 45.8 54.2 31.8 3.0 2.6 11.3 965.5 40.5 59.5 41.9 1.4 4.3 7.42009 Q1 (p) 2,114.5 44.7 55.3 31.0 2.9 2.9 13.0 942.0 38.1 61.9 44.4 1.1 4.3 7.7
4. Holdings of securities other than shares
Issued by euro area residents
Issued by MFIs 3) Issued by non-MFIs
All Euro 4) Non-euro currencies All Euro 4) Non-euro currencies
currencies currencies (outstanding Total (outstanding Total
amount) amount)USD JPY CHF GBP USD JPY CHF GBP
1 2 3 4 5 6 7 8 9 10 11 12 13 14
2006 1,636.9 95.6 4.4 2.3 0.2 0.3 1.3 1,924.6 97.6 2.4 1.3 0.3 0.1 0.72007 1,740.3 95.2 4.8 2.4 0.3 0.3 1.5 2,149.8 97.7 2.3 1.4 0.2 0.1 0.5
2008 Q2 1,897.9 94.8 5.2 2.6 0.4 0.3 1.6 2,310.8 97.3 2.7 1.8 0.3 0.1 0.5 Q3 1,905.6 94.6 5.4 2.9 0.4 0.3 1.5 2,302.2 97.2 2.8 1.9 0.3 0.1 0.4 Q4 1,979.8 95.3 4.7 2.6 0.4 0.2 1.2 2,651.1 97.3 2.7 1.7 0.3 0.1 0.42009 Q1 (p) 2,085.9 95.0 5.0 2.7 0.2 0.4 1.3 2,834.9 97.5 2.5 1.7 0.2 0.1 0.4
Issued by non-euro area residents
2006 515.3 52.3 47.7 28.8 0.7 0.4 14.5 594.5 38.9 61.1 36.5 4.9 0.8 14.22007 582.3 53.9 46.1 27.3 0.7 0.4 14.4 652.2 35.9 64.1 39.3 4.5 0.8 12.6
2008 Q2 664.8 50.3 49.7 30.6 0.7 0.5 14.8 627.4 38.6 61.4 36.9 5.8 0.8 10.4 Q3 645.1 51.1 48.9 30.7 0.8 0.5 14.2 663.4 37.2 62.8 38.1 6.4 0.9 10.5 Q4 580.8 54.0 46.0 28.6 0.9 0.5 13.3 646.7 39.0 61.0 37.1 6.4 0.8 11.02009 Q1 (p) 593.6 51.9 48.1 27.6 0.3 1.6 14.0 622.7 34.4 65.6 38.6 5.9 0.8 15.1
Source: ECB.1) MFI sector excluding the Eurosystem; sectoral classification is based on ESA 95.2) Data refer to the changing composition of the euro area. For further information, see the General notes.3) For non-euro area residents, the term ‘‘MFIs’’ refers to institutions of a similar type to euro area MFIs.4) Including items expressed in the national denominations of the euro.
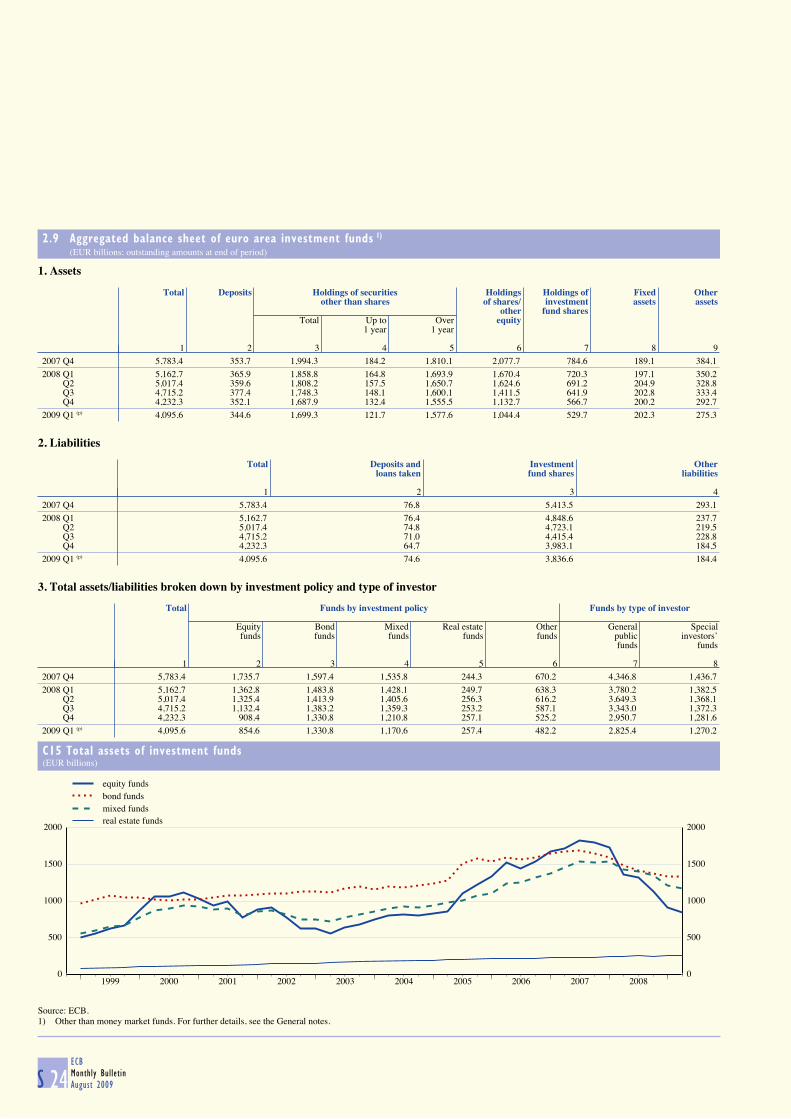
S 24ECB
Monthly Bulletin
August 2009
2.9 Aggregated balance sheet of euro area investment funds 1) (EUR billions; outstanding amounts at end of period)
1. Assets
Total Deposits Holdings of securities Holdings Holdings of Fixed Other
other than shares of shares/ investment assets assetsother fund shares
Total Up to Over equity1 year 1 year
1 2 3 4 5 6 7 8 92007 Q4 5,783.4 353.7 1,994.3 184.2 1,810.1 2,077.7 784.6 189.1 384.12008 Q1 5,162.7 365.9 1,858.8 164.8 1,693.9 1,670.4 720.3 197.1 350.2 Q2 5,017.4 359.6 1,808.2 157.5 1,650.7 1,624.6 691.2 204.9 328.8 Q3 4,715.2 377.4 1,748.3 148.1 1,600.1 1,411.5 641.9 202.8 333.4 Q4 4,232.3 352.1 1,687.9 132.4 1,555.5 1,132.7 566.7 200.2 292.72009 Q1 (p) 4,095.6 344.6 1,699.3 121.7 1,577.6 1,044.4 529.7 202.3 275.3
2. Liabilities
Total Deposits and Investment Otherloans taken fund shares liabilities
1 2 3 42007 Q4 5,783.4 76.8 5,413.5 293.12008 Q1 5,162.7 76.4 4,848.6 237.7 Q2 5,017.4 74.8 4,723.1 219.5 Q3 4,715.2 71.0 4,415.4 228.8 Q4 4,232.3 64.7 3,983.1 184.52009 Q1 (p) 4,095.6 74.6 3,836.6 184.4
3. Total assets/liabilities broken down by investment policy and type of investor
Total Funds by investment policy Funds by type of investor
Equity Bond Mixed Real estate Other General Specialfunds funds funds funds funds public investors’
funds funds
1 2 3 4 5 6 7 82007 Q4 5,783.4 1,735.7 1,597.4 1,535.8 244.3 670.2 4,346.8 1,436.72008 Q1 5,162.7 1,362.8 1,483.8 1,428.1 249.7 638.3 3,780.2 1,382.5 Q2 5,017.4 1,325.4 1,413.9 1,405.6 256.3 616.2 3,649.3 1,368.1 Q3 4,715.2 1,132.4 1,383.2 1,359.3 253.2 587.1 3,343.0 1,372.3 Q4 4,232.3 908.4 1,330.8 1,210.8 257.1 525.2 2,950.7 1,281.62009 Q1 (p) 4,095.6 854.6 1,330.8 1,170.6 257.4 482.2 2,825.4 1,270.2
C15 Total assets of investment funds(EUR billions)
0
500
1000
1500
2000
1999 2000 2001 2002 2003 2004 2005 2006 2007 20080
500
1000
1500
2000
equity fundsbond fundsmixed fundsreal estate funds
Source: ECB.1) Other than money market funds. For further details, see the General notes.
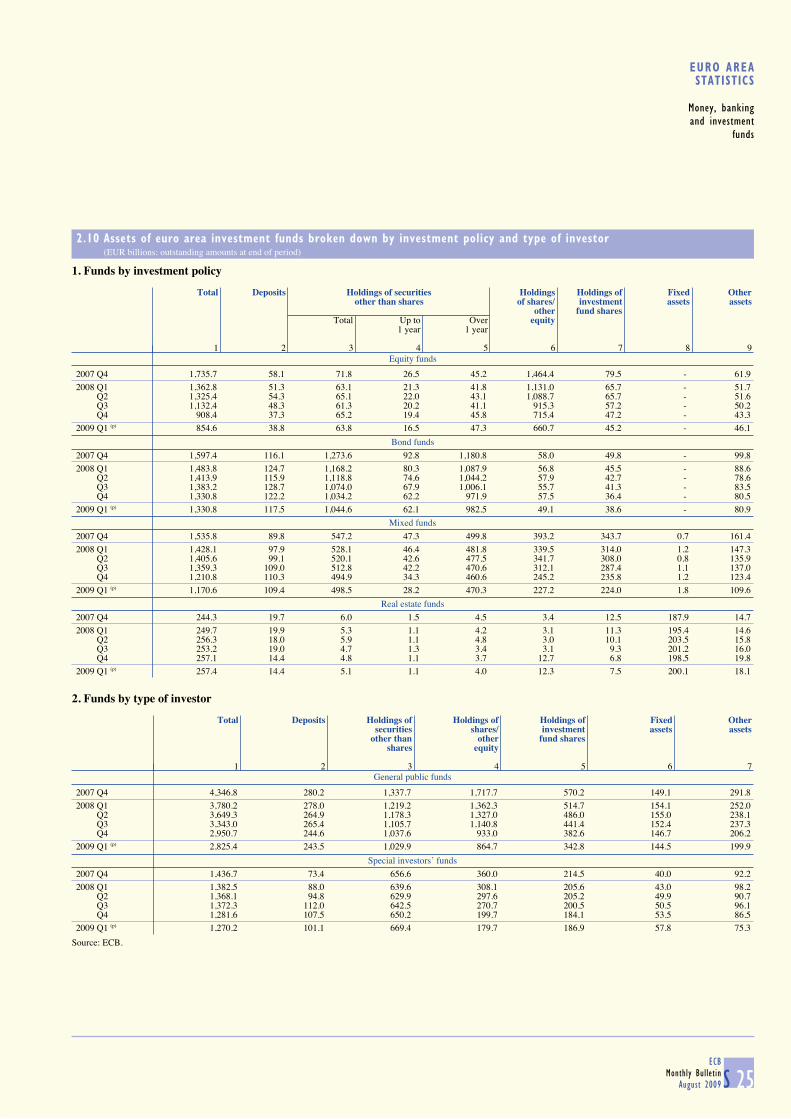
S 25ECB
Monthly Bulletin
August 2009
EURO AREASTATISTICS
Money, banking
and investment
funds
2.10 Assets of euro area investment funds broken down by investment policy and type of investor (EUR billions; outstanding amounts at end of period)
1. Funds by investment policy
Equity funds
Total Deposits Holdings of securities Holdings Holdings of Fixed Other
other than shares of shares/ investment assets assetsother fund shares
Total Up to Over equity1 year 1 year
1 2 3 4 5 6 7 8 9
2007 Q4 1,735.7 58.1 71.8 26.5 45.2 1,464.4 79.5 - 61.92008 Q1 1,362.8 51.3 63.1 21.3 41.8 1,131.0 65.7 - 51.7 Q2 1,325.4 54.3 65.1 22.0 43.1 1,088.7 65.7 - 51.6 Q3 1,132.4 48.3 61.3 20.2 41.1 915.3 57.2 - 50.2 Q4 908.4 37.3 65.2 19.4 45.8 715.4 47.2 - 43.32009 Q1 (p) 854.6 38.8 63.8 16.5 47.3 660.7 45.2 - 46.1
Bond funds
2007 Q4 1,597.4 116.1 1,273.6 92.8 1,180.8 58.0 49.8 - 99.82008 Q1 1,483.8 124.7 1,168.2 80.3 1,087.9 56.8 45.5 - 88.6 Q2 1,413.9 115.9 1,118.8 74.6 1,044.2 57.9 42.7 - 78.6 Q3 1,383.2 128.7 1,074.0 67.9 1,006.1 55.7 41.3 - 83.5 Q4 1,330.8 122.2 1,034.2 62.2 971.9 57.5 36.4 - 80.52009 Q1 (p) 1,330.8 117.5 1,044.6 62.1 982.5 49.1 38.6 - 80.9
Mixed funds
2007 Q4 1,535.8 89.8 547.2 47.3 499.8 393.2 343.7 0.7 161.42008 Q1 1,428.1 97.9 528.1 46.4 481.8 339.5 314.0 1.2 147.3 Q2 1,405.6 99.1 520.1 42.6 477.5 341.7 308.0 0.8 135.9 Q3 1,359.3 109.0 512.8 42.2 470.6 312.1 287.4 1.1 137.0 Q4 1,210.8 110.3 494.9 34.3 460.6 245.2 235.8 1.2 123.42009 Q1 (p) 1,170.6 109.4 498.5 28.2 470.3 227.2 224.0 1.8 109.6
Real estate funds
2007 Q4 244.3 19.7 6.0 1.5 4.5 3.4 12.5 187.9 14.72008 Q1 249.7 19.9 5.3 1.1 4.2 3.1 11.3 195.4 14.6 Q2 256.3 18.0 5.9 1.1 4.8 3.0 10.1 203.5 15.8 Q3 253.2 19.0 4.7 1.3 3.4 3.1 9.3 201.2 16.0 Q4 257.1 14.4 4.8 1.1 3.7 12.7 6.8 198.5 19.82009 Q1 (p) 257.4 14.4 5.1 1.1 4.0 12.3 7.5 200.1 18.1
2. Funds by type of investor
General public funds
Total Deposits Holdings of Holdings of Holdings of Fixed Othersecurities shares/ investment assets assets
other than other fund sharesshares equity
1 2 3 4 5 6 7
2007 Q4 4,346.8 280.2 1,337.7 1,717.7 570.2 149.1 291.82008 Q1 3,780.2 278.0 1,219.2 1,362.3 514.7 154.1 252.0 Q2 3,649.3 264.9 1,178.3 1,327.0 486.0 155.0 238.1 Q3 3,343.0 265.4 1,105.7 1,140.8 441.4 152.4 237.3 Q4 2,950.7 244.6 1,037.6 933.0 382.6 146.7 206.22009 Q1 (p) 2,825.4 243.5 1,029.9 864.7 342.8 144.5 199.9
Special investors’ funds
2007 Q4 1,436.7 73.4 656.6 360.0 214.5 40.0 92.22008 Q1 1,382.5 88.0 639.6 308.1 205.6 43.0 98.2 Q2 1,368.1 94.8 629.9 297.6 205.2 49.9 90.7 Q3 1,372.3 112.0 642.5 270.7 200.5 50.5 96.1 Q4 1,281.6 107.5 650.2 199.7 184.1 53.5 86.52009 Q1 (p) 1,270.2 101.1 669.4 179.7 186.9 57.8 75.3
Source: ECB.
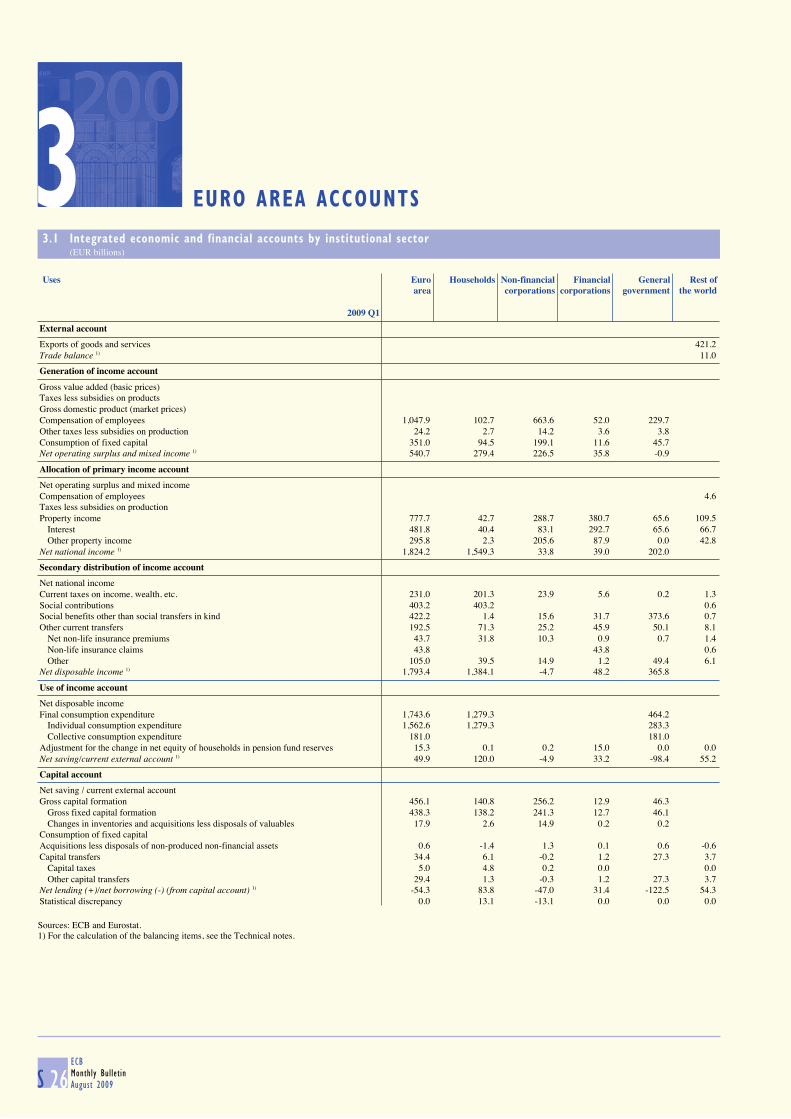
S 26ECB
Monthly Bulletin
August 2009
3 EURO AREA ACCOUNTS
3.1 Integrated economic and financial accounts by institutional sector (EUR billions)
Uses Euro Households Non-financial Financial General Rest ofarea corporations corporations government the world
2009 Q1
External account
Exports of goods and services 421.2 Trade balance 1) 11.0
Generation of income account
Gross value added (basic prices) Taxes less subsidies on products Gross domestic product (market prices) Compensation of employees 1,047.9 102.7 663.6 52.0 229.7 Other taxes less subsidies on production 24.2 2.7 14.2 3.6 3.8 Consumption of fixed capital 351.0 94.5 199.1 11.6 45.7 Net operating surplus and mixed income 1) 540.7 279.4 226.5 35.8 -0.9
Allocation of primary income account
Net operating surplus and mixed income Compensation of employees 4.6 Taxes less subsidies on production Property income 777.7 42.7 288.7 380.7 65.6 109.5 Interest 481.8 40.4 83.1 292.7 65.6 66.7 Other property income 295.8 2.3 205.6 87.9 0.0 42.8 Net national income 1) 1,824.2 1,549.3 33.8 39.0 202.0
Secondary distribution of income account
Net national income Current taxes on income, wealth, etc. 231.0 201.3 23.9 5.6 0.2 1.3 Social contributions 403.2 403.2 0.6 Social benefits other than social transfers in kind 422.2 1.4 15.6 31.7 373.6 0.7 Other current transfers 192.5 71.3 25.2 45.9 50.1 8.1 Net non-life insurance premiums 43.7 31.8 10.3 0.9 0.7 1.4 Non-life insurance claims 43.8 43.8 0.6 Other 105.0 39.5 14.9 1.2 49.4 6.1 Net disposable income 1) 1,793.4 1,384.1 -4.7 48.2 365.8
Use of income account
Net disposable income Final consumption expenditure 1,743.6 1,279.3 464.2 Individual consumption expenditure 1,562.6 1,279.3 283.3 Collective consumption expenditure 181.0 181.0 Adjustment for the change in net equity of households in pension fund reserves 15.3 0.1 0.2 15.0 0.0 0.0 Net saving/current external account 1) 49.9 120.0 -4.9 33.2 -98.4 55.2
Capital account
Net saving / current external account Gross capital formation 456.1 140.8 256.2 12.9 46.3 Gross fixed capital formation 438.3 138.2 241.3 12.7 46.1 Changes in inventories and acquisitions less disposals of valuables 17.9 2.6 14.9 0.2 0.2 Consumption of fixed capital Acquisitions less disposals of non-produced non-financial assets 0.6 -1.4 1.3 0.1 0.6 -0.6 Capital transfers 34.4 6.1 -0.2 1.2 27.3 3.7 Capital taxes 5.0 4.8 0.2 0.0 0.0 Other capital transfers 29.4 1.3 -0.3 1.2 27.3 3.7 Net lending (+)/net borrowing (-) (from capital account) 1) -54.3 83.8 -47.0 31.4 -122.5 54.3 Statistical discrepancy 0.0 13.1 -13.1 0.0 0.0 0.0
Sources: ECB and Eurostat.1) For the calculation of the balancing items, see the Technical notes.
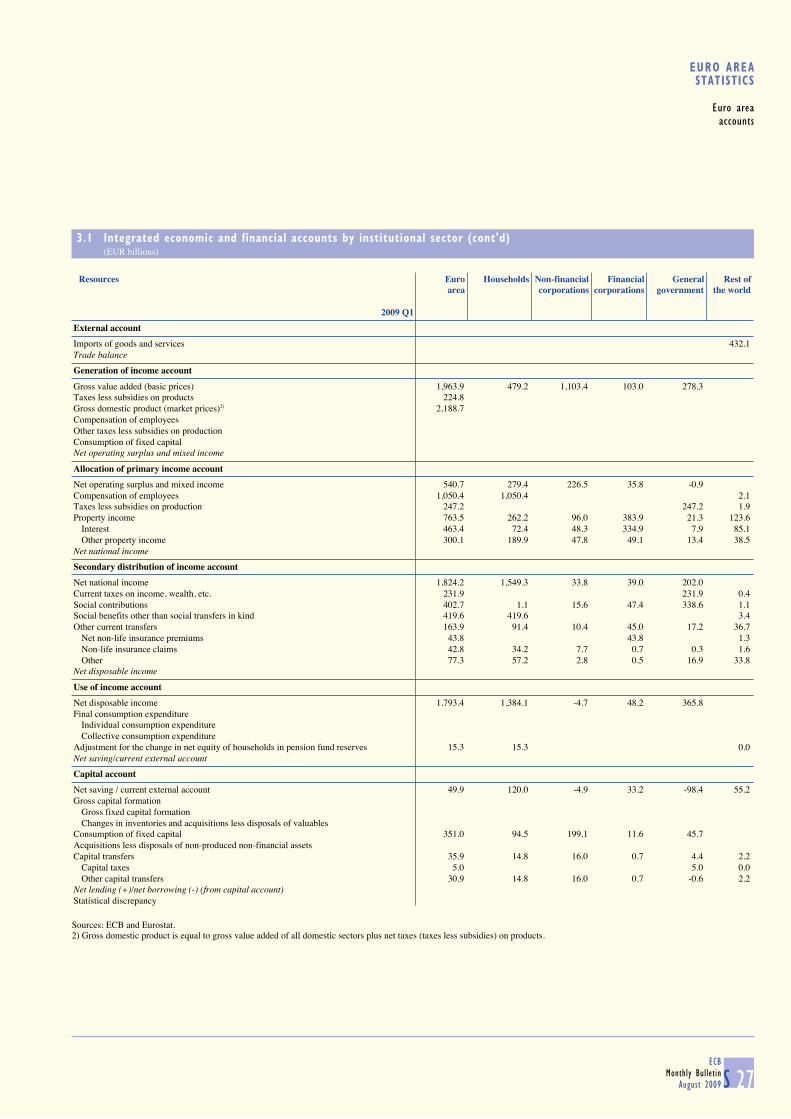
S 27ECB
Monthly Bulletin
August 2009
EURO AREASTATISTICS
Euro area
accounts
3.1 Integrated economic and financial accounts by institutional sector (cont'd) (EUR billions)
Resources Euro Households Non-financial Financial General Rest ofarea corporations corporations government the world
2009 Q1
External account
Imports of goods and services 432.1 Trade balance Generation of income account
Gross value added (basic prices) 1,963.9 479.2 1,103.4 103.0 278.3 Taxes less subsidies on products 224.8 Gross domestic product (market prices)2) 2,188.7 Compensation of employees Other taxes less subsidies on production Consumption of fixed capital Net operating surplus and mixed income Allocation of primary income account
Net operating surplus and mixed income 540.7 279.4 226.5 35.8 -0.9 Compensation of employees 1,050.4 1,050.4 2.1 Taxes less subsidies on production 247.2 247.2 1.9 Property income 763.5 262.2 96.0 383.9 21.3 123.6 Interest 463.4 72.4 48.3 334.9 7.9 85.1 Other property income 300.1 189.9 47.8 49.1 13.4 38.5 Net national income Secondary distribution of income account
Net national income 1,824.2 1,549.3 33.8 39.0 202.0 Current taxes on income, wealth, etc. 231.9 231.9 0.4 Social contributions 402.7 1.1 15.6 47.4 338.6 1.1 Social benefits other than social transfers in kind 419.6 419.6 3.4 Other current transfers 163.9 91.4 10.4 45.0 17.2 36.7 Net non-life insurance premiums 43.8 43.8 1.3 Non-life insurance claims 42.8 34.2 7.7 0.7 0.3 1.6 Other 77.3 57.2 2.8 0.5 16.9 33.8 Net disposable income Use of income account
Net disposable income 1,793.4 1,384.1 -4.7 48.2 365.8 Final consumption expenditure Individual consumption expenditure Collective consumption expenditure Adjustment for the change in net equity of households in pension fund reserves 15.3 15.3 0.0 Net saving/current external account Capital account
Net saving / current external account 49.9 120.0 -4.9 33.2 -98.4 55.2 Gross capital formation Gross fixed capital formation Changes in inventories and acquisitions less disposals of valuables Consumption of fixed capital 351.0 94.5 199.1 11.6 45.7 Acquisitions less disposals of non-produced non-financial assets Capital transfers 35.9 14.8 16.0 0.7 4.4 2.2 Capital taxes 5.0 5.0 0.0 Other capital transfers 30.9 14.8 16.0 0.7 -0.6 2.2 Net lending (+)/net borrowing (-) (from capital account) Statistical discrepancy
Sources: ECB and Eurostat.2) Gross domestic product is equal to gross value added of all domestic sectors plus net taxes (taxes less subsidies) on products.

S 28ECB
Monthly Bulletin
August 2009
3.1 Integrated economic and financial accounts by institutional sector (cont'd) (EUR billions)
Assets Euro Households Non-financial MFIs Other Insurance General Rest ofarea corporations financial corporations govern- the world
inter- and pension ment2009 Q1 mediaries funds
Opening balance sheet, financial assets
Total financial assets 16,629.4 14,160.4 23,728.5 9,484.6 5,963.5 3,159.6 14,898.2 Monetary gold and special drawing rights (SDRs) 221.8 Currency and deposits 6,120.0 1,835.6 2,393.9 1,800.1 874.8 641.5 4,206.6 Short-term debt securities 60.3 94.3 154.5 327.8 331.2 37.6 855.6 Long-term debt securities 1,256.5 213.8 4,253.6 1,631.7 2,017.2 322.8 2,942.3 Loans 65.7 2,531.9 12,755.1 2,112.2 364.8 442.6 1,775.9 of which long-term 47.7 1,404.8 9,679.5 1,684.7 287.6 354.5 . Shares and other equity 3,750.4 6,067.4 1,599.1 3,413.1 1,919.6 1,136.0 4,434.8 Quoted shares 611.6 1,106.3 470.7 1,505.7 426.0 263.2 . Unquoted shares and other equity 1,820.0 4,652.7 915.5 1,374.8 433.0 751.9 . Mutual fund shares 1,318.9 308.5 212.9 532.6 1,060.6 120.9 . Insurance technical reserves 5,148.6 136.9 1.8 0.0 142.3 3.1 149.3 Other accounts receivable and financial derivatives 227.9 3,280.4 2,348.6 199.6 313.5 575.9 533.8 Net financial worth Financial account, transactions in financial assets
Total transactions in financial assets 101.5 -5.9 -116.1 118.4 54.8 94.6 -131.3 Monetary gold and special drawing rights (SDRs) -0.9 0.9 Currency and deposits 27.3 -41.6 -223.9 59.4 -1.4 92.8 -188.2 Short-term debt securities -14.8 -7.9 -9.1 3.2 7.4 -11.6 45.9 Long-term debt securities 37.3 -18.0 161.2 9.7 32.3 -4.6 67.3 Loans -1.1 80.9 -31.1 75.0 2.8 4.3 -31.9 of which long-term -1.1 62.4 19.9 76.9 10.6 4.4 . Shares and other equity 12.4 77.2 -5.5 -35.3 2.8 10.5 21.6 Quoted shares 3.0 26.7 -3.1 -30.7 -0.2 2.3 . Unquoted shares and other equity 6.4 38.2 16.1 27.3 4.4 7.9 . Mutual fund shares 3.0 12.3 -18.4 -31.8 -1.3 0.2 . Insurance technical reserves 42.6 1.2 0.0 0.0 3.7 0.0 -10.5 Other accounts receivable and financial derivatives -2.3 -97.8 -6.9 6.4 7.2 3.3 -36.4 Changes in net financial worth due to transactions Other changes account, financial assets
Total other changes in financial assets -264.6 -348.9 58.5 -91.9 -71.2 -44.1 -41.5 Monetary gold and special drawing rights (SDRs) 24.4 Currency and deposits 14.4 -3.4 25.4 5.8 4.2 0.0 47.2 Short-term debt securities -0.5 -0.2 -1.3 7.7 0.3 -0.5 0.9 Long-term debt securities -2.0 -8.7 13.6 -5.2 1.8 -1.1 0.0 Loans 0.0 8.3 23.1 6.1 -4.3 0.0 -1.3 of which long-term 0.0 5.6 15.6 4.1 -2.5 -0.1 . Shares and other equity -247.1 -389.9 -61.6 -107.5 -75.8 -40.1 -98.6 Quoted shares -89.5 -151.6 -50.4 -75.9 -33.1 -42.0 . Unquoted shares and other equity -120.8 -225.0 -33.3 -54.5 -23.2 5.3 . Mutual fund shares -36.8 -13.3 22.1 22.9 -19.5 -3.4 . Insurance technical reserves -36.6 0.0 0.0 0.0 0.1 0.0 2.6 Other accounts receivable and financial derivatives 7.2 45.1 34.8 1.2 2.6 -2.5 7.8 Other changes in net financial worth Closing balance sheet, financial assets
Total financial assets 16,466.3 13,805.6 23,670.9 9,511.0 5,947.1 3,210.0 14,724.6 Monetary gold and special drawing rights (SDRs) 245.2 Currency and deposits 6,161.7 1,790.6 2,195.4 1,865.3 877.7 734.4 4,065.6 Short-term debt securities 45.0 86.2 144.2 338.6 338.9 25.6 902.4 Long-term debt securities 1,291.9 187.1 4,428.4 1,636.2 2,051.2 317.1 3,009.5 Loans 64.6 2,621.1 12,747.2 2,193.4 363.3 446.8 1,742.7 of which long-term 46.7 1,472.8 9,715.0 1,765.7 295.8 358.8 . Shares and other equity 3,515.8 5,754.8 1,532.0 3,270.3 1,846.6 1,106.4 4,357.8 Quoted shares 525.1 981.4 417.1 1,399.1 392.7 223.5 . Unquoted shares and other equity 1,705.5 4,465.9 898.3 1,347.6 414.2 765.1 . Mutual fund shares 1,285.1 307.5 216.6 523.6 1,039.7 117.8 . Insurance technical reserves 5,154.6 138.1 1.9 0.0 146.1 3.1 141.4 Other accounts receivable and financial derivatives 232.8 3,227.6 2,376.6 207.2 323.2 576.6 505.2 Net financial worthSource: ECB.
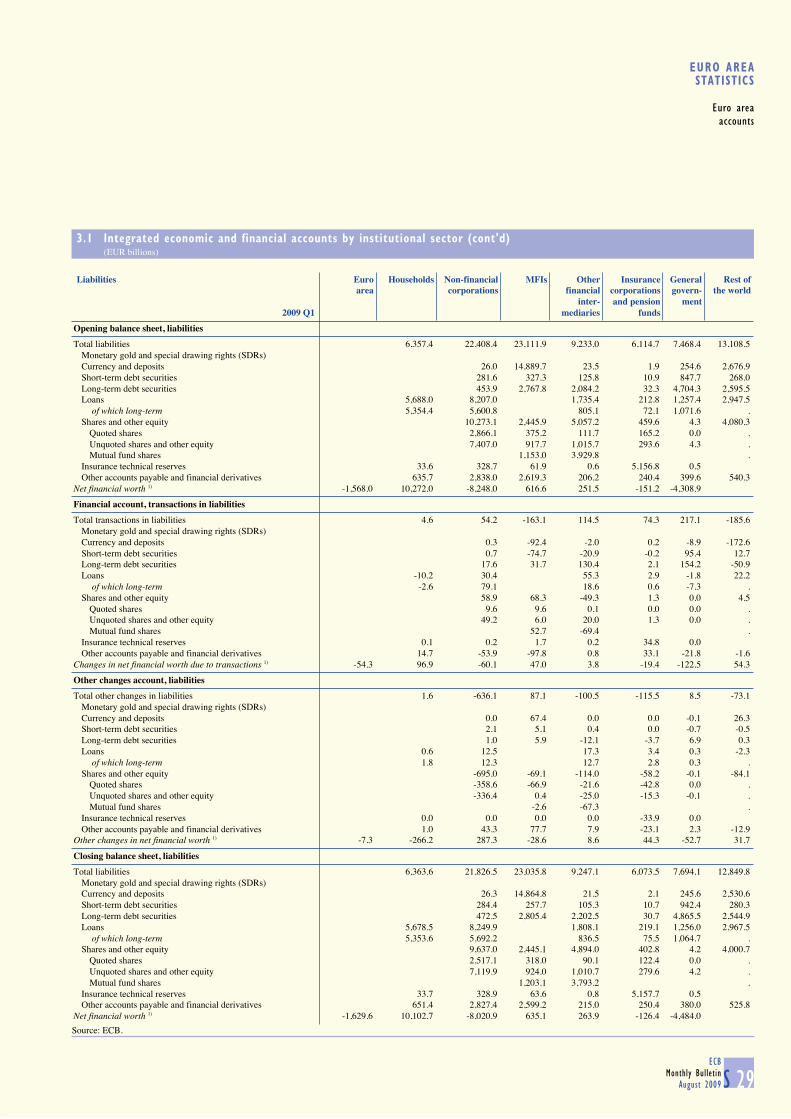
S 29ECB
Monthly Bulletin
August 2009
EURO AREASTATISTICS
Euro area
accounts
3.1 Integrated economic and financial accounts by institutional sector (cont'd) (EUR billions)
Liabilities Euro Households Non-financial MFIs Other Insurance General Rest ofarea corporations financial corporations govern- the world
inter- and pension ment2009 Q1 mediaries funds
Opening balance sheet, liabilities
Total liabilities 6,357.4 22,408.4 23,111.9 9,233.0 6,114.7 7,468.4 13,108.5 Monetary gold and special drawing rights (SDRs) Currency and deposits 26.0 14,889.7 23.5 1.9 254.6 2,676.9 Short-term debt securities 281.6 327.3 125.8 10.9 847.7 268.0 Long-term debt securities 453.9 2,767.8 2,084.2 32.3 4,704.3 2,595.5 Loans 5,688.0 8,207.0 1,735.4 212.8 1,257.4 2,947.5 of which long-term 5,354.4 5,600.8 805.1 72.1 1,071.6 . Shares and other equity 10,273.1 2,445.9 5,057.2 459.6 4.3 4,080.3 Quoted shares 2,866.1 375.2 111.7 165.2 0.0 . Unquoted shares and other equity 7,407.0 917.7 1,015.7 293.6 4.3 . Mutual fund shares 1,153.0 3,929.8 . Insurance technical reserves 33.6 328.7 61.9 0.6 5,156.8 0.5 Other accounts payable and financial derivatives 635.7 2,838.0 2,619.3 206.2 240.4 399.6 540.3 Net financial worth 1) -1,568.0 10,272.0 -8,248.0 616.6 251.5 -151.2 -4,308.9
Financial account, transactions in liabilities
Total transactions in liabilities 4.6 54.2 -163.1 114.5 74.3 217.1 -185.6 Monetary gold and special drawing rights (SDRs) Currency and deposits 0.3 -92.4 -2.0 0.2 -8.9 -172.6 Short-term debt securities 0.7 -74.7 -20.9 -0.2 95.4 12.7 Long-term debt securities 17.6 31.7 130.4 2.1 154.2 -50.9 Loans -10.2 30.4 55.3 2.9 -1.8 22.2 of which long-term -2.6 79.1 18.6 0.6 -7.3 . Shares and other equity 58.9 68.3 -49.3 1.3 0.0 4.5 Quoted shares 9.6 9.6 0.1 0.0 0.0 . Unquoted shares and other equity 49.2 6.0 20.0 1.3 0.0 . Mutual fund shares 52.7 -69.4 . Insurance technical reserves 0.1 0.2 1.7 0.2 34.8 0.0 Other accounts payable and financial derivatives 14.7 -53.9 -97.8 0.8 33.1 -21.8 -1.6 Changes in net financial worth due to transactions 1) -54.3 96.9 -60.1 47.0 3.8 -19.4 -122.5 54.3
Other changes account, liabilities
Total other changes in liabilities 1.6 -636.1 87.1 -100.5 -115.5 8.5 -73.1 Monetary gold and special drawing rights (SDRs) Currency and deposits 0.0 67.4 0.0 0.0 -0.1 26.3 Short-term debt securities 2.1 5.1 0.4 0.0 -0.7 -0.5 Long-term debt securities 1.0 5.9 -12.1 -3.7 6.9 0.3 Loans 0.6 12.5 17.3 3.4 0.3 -2.3 of which long-term 1.8 12.3 12.7 2.8 0.3 . Shares and other equity -695.0 -69.1 -114.0 -58.2 -0.1 -84.1 Quoted shares -358.6 -66.9 -21.6 -42.8 0.0 . Unquoted shares and other equity -336.4 0.4 -25.0 -15.3 -0.1 . Mutual fund shares -2.6 -67.3 . Insurance technical reserves 0.0 0.0 0.0 0.0 -33.9 0.0 Other accounts payable and financial derivatives 1.0 43.3 77.7 7.9 -23.1 2.3 -12.9 Other changes in net financial worth 1) -7.3 -266.2 287.3 -28.6 8.6 44.3 -52.7 31.7
Closing balance sheet, liabilities
Total liabilities 6,363.6 21,826.5 23,035.8 9,247.1 6,073.5 7,694.1 12,849.8 Monetary gold and special drawing rights (SDRs) Currency and deposits 26.3 14,864.8 21.5 2.1 245.6 2,530.6 Short-term debt securities 284.4 257.7 105.3 10.7 942.4 280.3 Long-term debt securities 472.5 2,805.4 2,202.5 30.7 4,865.5 2,544.9 Loans 5,678.5 8,249.9 1,808.1 219.1 1,256.0 2,967.5 of which long-term 5,353.6 5,692.2 836.5 75.5 1,064.7 . Shares and other equity 9,637.0 2,445.1 4,894.0 402.8 4.2 4,000.7 Quoted shares 2,517.1 318.0 90.1 122.4 0.0 . Unquoted shares and other equity 7,119.9 924.0 1,010.7 279.6 4.2 . Mutual fund shares 1,203.1 3,793.2 . Insurance technical reserves 33.7 328.9 63.6 0.8 5,157.7 0.5 Other accounts payable and financial derivatives 651.4 2,827.4 2,599.2 215.0 250.4 380.0 525.8 Net financial worth 1) -1,629.6 10,102.7 -8,020.9 635.1 263.9 -126.4 -4,484.0 Source: ECB.
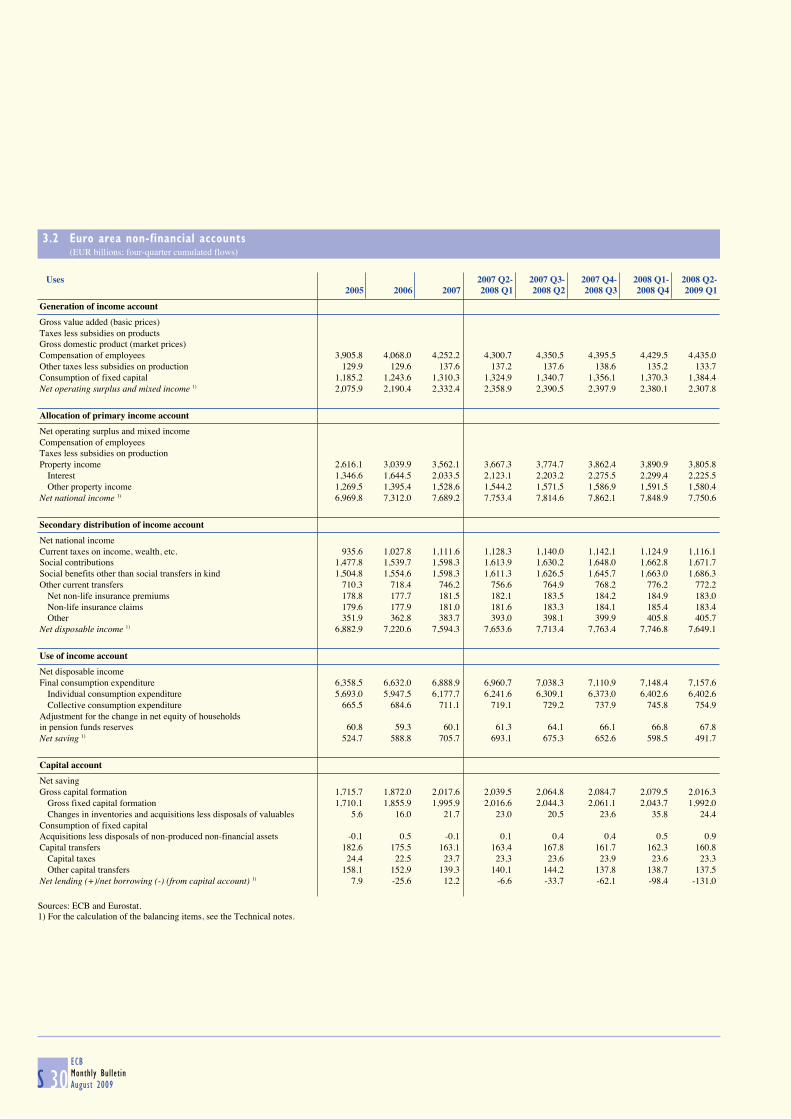
S 30ECB
Monthly Bulletin
August 2009
3.2 Euro area non-financial accounts (EUR billions; four-quarter cumulated flows)
Uses 2007 Q2- 2007 Q3- 2007 Q4- 2008 Q1- 2008 Q2-2005 2006 2007 2008 Q1 2008 Q2 2008 Q3 2008 Q4 2009 Q1
Generation of income account
Gross value added (basic prices) Taxes less subsidies on products Gross domestic product (market prices) Compensation of employees 3,905.8 4,068.0 4,252.2 4,300.7 4,350.5 4,395.5 4,429.5 4,435.0 Other taxes less subsidies on production 129.9 129.6 137.6 137.2 137.6 138.6 135.2 133.7 Consumption of fixed capital 1,185.2 1,243.6 1,310.3 1,324.9 1,340.7 1,356.1 1,370.3 1,384.4 Net operating surplus and mixed income 1) 2,075.9 2,190.4 2,332.4 2,358.9 2,390.5 2,397.9 2,380.1 2,307.8
Allocation of primary income account
Net operating surplus and mixed income Compensation of employees Taxes less subsidies on production Property income 2,616.1 3,039.9 3,562.1 3,667.3 3,774.7 3,862.4 3,890.9 3,805.8 Interest 1,346.6 1,644.5 2,033.5 2,123.1 2,203.2 2,275.5 2,299.4 2,225.5 Other property income 1,269.5 1,395.4 1,528.6 1,544.2 1,571.5 1,586.9 1,591.5 1,580.4 Net national income 1) 6,969.8 7,312.0 7,689.2 7,753.4 7,814.6 7,862.1 7,848.9 7,750.6
Secondary distribution of income account
Net national income Current taxes on income, wealth, etc. 935.6 1,027.8 1,111.6 1,128.3 1,140.0 1,142.1 1,124.9 1,116.1 Social contributions 1,477.8 1,539.7 1,598.3 1,613.9 1,630.2 1,648.0 1,662.8 1,671.7 Social benefits other than social transfers in kind 1,504.8 1,554.6 1,598.3 1,611.3 1,626.5 1,645.7 1,663.0 1,686.3 Other current transfers 710.3 718.4 746.2 756.6 764.9 768.2 776.2 772.2 Net non-life insurance premiums 178.8 177.7 181.5 182.1 183.5 184.2 184.9 183.0 Non-life insurance claims 179.6 177.9 181.0 181.6 183.3 184.1 185.4 183.4 Other 351.9 362.8 383.7 393.0 398.1 399.9 405.8 405.7 Net disposable income 1) 6,882.9 7,220.6 7,594.3 7,653.6 7,713.4 7,763.4 7,746.8 7,649.1
Use of income account
Net disposable income Final consumption expenditure 6,358.5 6,632.0 6,888.9 6,960.7 7,038.3 7,110.9 7,148.4 7,157.6 Individual consumption expenditure 5,693.0 5,947.5 6,177.7 6,241.6 6,309.1 6,373.0 6,402.6 6,402.6 Collective consumption expenditure 665.5 684.6 711.1 719.1 729.2 737.9 745.8 754.9 Adjustment for the change in net equity of households in pension funds reserves 60.8 59.3 60.1 61.3 64.1 66.1 66.8 67.8 Net saving 1) 524.7 588.8 705.7 693.1 675.3 652.6 598.5 491.7
Capital account
Net saving Gross capital formation 1,715.7 1,872.0 2,017.6 2,039.5 2,064.8 2,084.7 2,079.5 2,016.3 Gross fixed capital formation 1,710.1 1,855.9 1,995.9 2,016.6 2,044.3 2,061.1 2,043.7 1,992.0 Changes in inventories and acquisitions less disposals of valuables 5.6 16.0 21.7 23.0 20.5 23.6 35.8 24.4 Consumption of fixed capital Acquisitions less disposals of non-produced non-financial assets -0.1 0.5 -0.1 0.1 0.4 0.4 0.5 0.9 Capital transfers 182.6 175.5 163.1 163.4 167.8 161.7 162.3 160.8 Capital taxes 24.4 22.5 23.7 23.3 23.6 23.9 23.6 23.3 Other capital transfers 158.1 152.9 139.3 140.1 144.2 137.8 138.7 137.5 Net lending (+)/net borrowing (-) (from capital account) 1) 7.9 -25.6 12.2 -6.6 -33.7 -62.1 -98.4 -131.0 Sources: ECB and Eurostat.1) For the calculation of the balancing items, see the Technical notes.
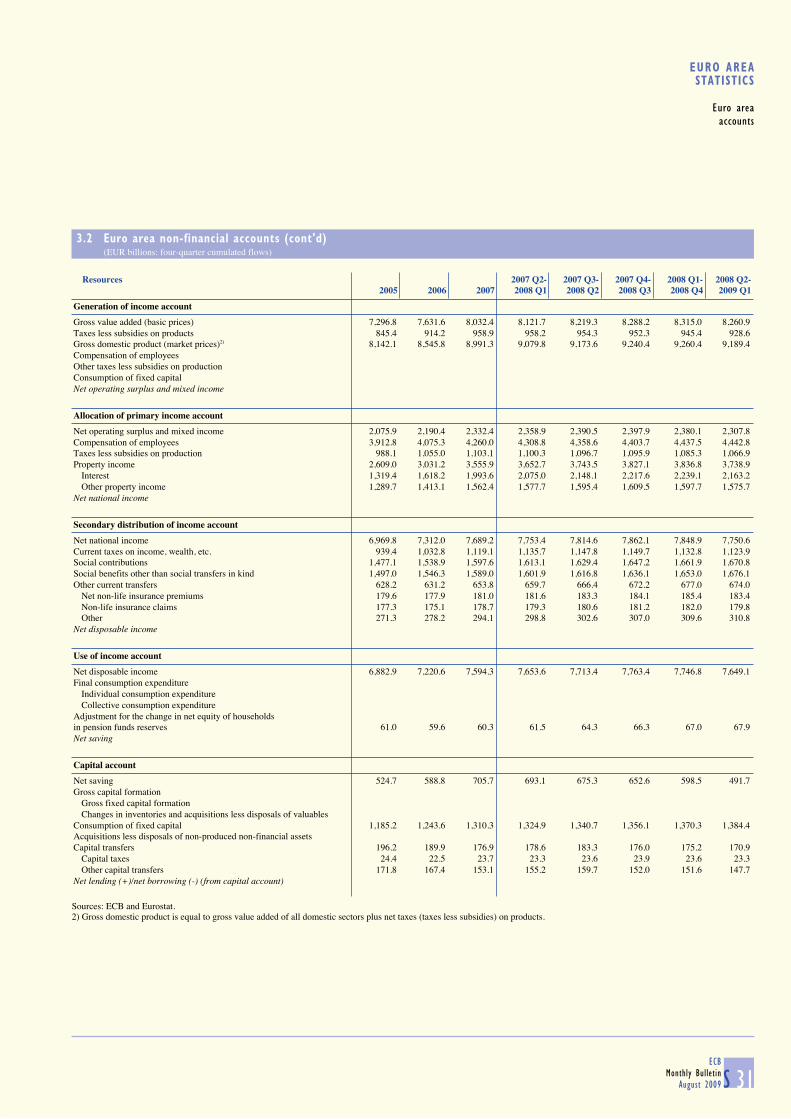
S 31ECB
Monthly Bulletin
August 2009
EURO AREASTATISTICS
Euro area
accounts
3.2 Euro area non-financial accounts (cont'd) (EUR billions; four-quarter cumulated flows)
Resources 2007 Q2- 2007 Q3- 2007 Q4- 2008 Q1- 2008 Q2-2005 2006 2007 2008 Q1 2008 Q2 2008 Q3 2008 Q4 2009 Q1
Generation of income account
Gross value added (basic prices) 7,296.8 7,631.6 8,032.4 8,121.7 8,219.3 8,288.2 8,315.0 8,260.9 Taxes less subsidies on products 845.4 914.2 958.9 958.2 954.3 952.3 945.4 928.6 Gross domestic product (market prices)2) 8,142.1 8,545.8 8,991.3 9,079.8 9,173.6 9,240.4 9,260.4 9,189.4 Compensation of employees Other taxes less subsidies on production Consumption of fixed capital Net operating surplus and mixed income
Allocation of primary income account
Net operating surplus and mixed income 2,075.9 2,190.4 2,332.4 2,358.9 2,390.5 2,397.9 2,380.1 2,307.8 Compensation of employees 3,912.8 4,075.3 4,260.0 4,308.8 4,358.6 4,403.7 4,437.5 4,442.8 Taxes less subsidies on production 988.1 1,055.0 1,103.1 1,100.3 1,096.7 1,095.9 1,085.3 1,066.9 Property income 2,609.0 3,031.2 3,555.9 3,652.7 3,743.5 3,827.1 3,836.8 3,738.9 Interest 1,319.4 1,618.2 1,993.6 2,075.0 2,148.1 2,217.6 2,239.1 2,163.2 Other property income 1,289.7 1,413.1 1,562.4 1,577.7 1,595.4 1,609.5 1,597.7 1,575.7 Net national income
Secondary distribution of income account
Net national income 6,969.8 7,312.0 7,689.2 7,753.4 7,814.6 7,862.1 7,848.9 7,750.6 Current taxes on income, wealth, etc. 939.4 1,032.8 1,119.1 1,135.7 1,147.8 1,149.7 1,132.8 1,123.9 Social contributions 1,477.1 1,538.9 1,597.6 1,613.1 1,629.4 1,647.2 1,661.9 1,670.8 Social benefits other than social transfers in kind 1,497.0 1,546.3 1,589.0 1,601.9 1,616.8 1,636.1 1,653.0 1,676.1 Other current transfers 628.2 631.2 653.8 659.7 666.4 672.2 677.0 674.0 Net non-life insurance premiums 179.6 177.9 181.0 181.6 183.3 184.1 185.4 183.4 Non-life insurance claims 177.3 175.1 178.7 179.3 180.6 181.2 182.0 179.8 Other 271.3 278.2 294.1 298.8 302.6 307.0 309.6 310.8 Net disposable income
Use of income account
Net disposable income 6,882.9 7,220.6 7,594.3 7,653.6 7,713.4 7,763.4 7,746.8 7,649.1 Final consumption expenditure Individual consumption expenditure Collective consumption expenditure Adjustment for the change in net equity of households in pension funds reserves 61.0 59.6 60.3 61.5 64.3 66.3 67.0 67.9 Net saving
Capital account
Net saving 524.7 588.8 705.7 693.1 675.3 652.6 598.5 491.7 Gross capital formation Gross fixed capital formation Changes in inventories and acquisitions less disposals of valuables Consumption of fixed capital 1,185.2 1,243.6 1,310.3 1,324.9 1,340.7 1,356.1 1,370.3 1,384.4 Acquisitions less disposals of non-produced non-financial assets Capital transfers 196.2 189.9 176.9 178.6 183.3 176.0 175.2 170.9 Capital taxes 24.4 22.5 23.7 23.3 23.6 23.9 23.6 23.3 Other capital transfers 171.8 167.4 153.1 155.2 159.7 152.0 151.6 147.7 Net lending (+)/net borrowing (-) (from capital account) Sources: ECB and Eurostat.2) Gross domestic product is equal to gross value added of all domestic sectors plus net taxes (taxes less subsidies) on products.
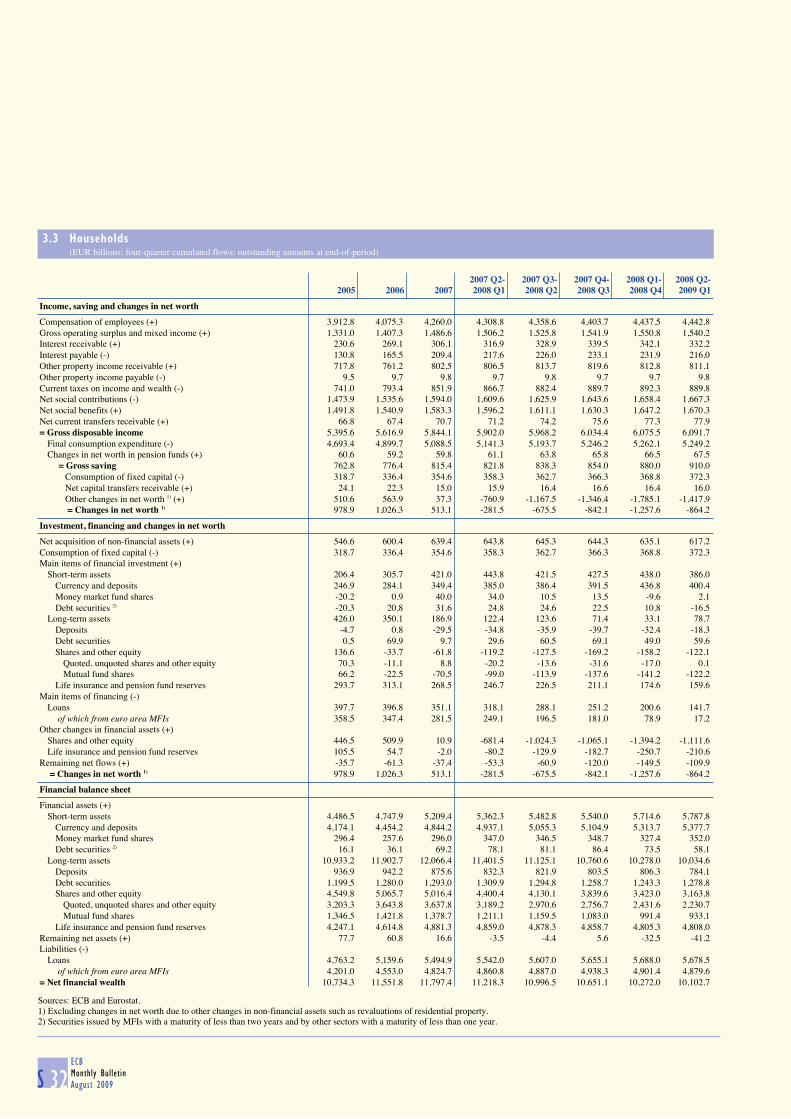
S 32ECB
Monthly Bulletin
August 2009
3.3 Households (EUR billions; four-quarter cumulated flows; outstanding amounts at end-of-period)
2007 Q2- 2007 Q3- 2007 Q4- 2008 Q1- 2008 Q2-2005 2006 2007 2008 Q1 2008 Q2 2008 Q3 2008 Q4 2009 Q1
Income, saving and changes in net worth
Compensation of employees (+) 3,912.8 4,075.3 4,260.0 4,308.8 4,358.6 4,403.7 4,437.5 4,442.8 Gross operating surplus and mixed income (+) 1,331.0 1,407.3 1,486.6 1,506.2 1,525.8 1,541.9 1,550.8 1,540.2 Interest receivable (+) 230.6 269.1 306.1 316.9 328.9 339.5 342.1 332.2 Interest payable (-) 130.8 165.5 209.4 217.6 226.0 233.1 231.9 216.0 Other property income receivable (+) 717.8 761.2 802.5 806.5 813.7 819.6 812.8 811.1 Other property income payable (-) 9.5 9.7 9.8 9.7 9.8 9.7 9.7 9.8 Current taxes on income and wealth (-) 741.0 793.4 851.9 866.7 882.4 889.7 892.3 889.8 Net social contributions (-) 1,473.9 1,535.6 1,594.0 1,609.6 1,625.9 1,643.6 1,658.4 1,667.3 Net social benefits (+) 1,491.8 1,540.9 1,583.3 1,596.2 1,611.1 1,630.3 1,647.2 1,670.3 Net current transfers receivable (+) 66.8 67.4 70.7 71.2 74.2 75.6 77.3 77.9 = Gross disposable income 5,395.6 5,616.9 5,844.1 5,902.0 5,968.2 6,034.4 6,075.5 6,091.7 Final consumption expenditure (-) 4,693.4 4,899.7 5,088.5 5,141.3 5,193.7 5,246.2 5,262.1 5,249.2 Changes in net worth in pension funds (+) 60.6 59.2 59.8 61.1 63.8 65.8 66.5 67.5 = Gross saving 762.8 776.4 815.4 821.8 838.3 854.0 880.0 910.0 Consumption of fixed capital (-) 318.7 336.4 354.6 358.3 362.7 366.3 368.8 372.3 Net capital transfers receivable (+) 24.1 22.3 15.0 15.9 16.4 16.6 16.4 16.0 Other changes in net worth 1) (+) 510.6 563.9 37.3 -760.9 -1,167.5 -1,346.4 -1,785.1 -1,417.9 = Changes in net worth 1) 978.9 1,026.3 513.1 -281.5 -675.5 -842.1 -1,257.6 -864.2
Investment, financing and changes in net worth
Net acquisition of non-financial assets (+) 546.6 600.4 639.4 643.8 645.3 644.3 635.1 617.2 Consumption of fixed capital (-) 318.7 336.4 354.6 358.3 362.7 366.3 368.8 372.3 Main items of financial investment (+) Short-term assets 206.4 305.7 421.0 443.8 421.5 427.5 438.0 386.0 Currency and deposits 246.9 284.1 349.4 385.0 386.4 391.5 436.8 400.4 Money market fund shares -20.2 0.9 40.0 34.0 10.5 13.5 -9.6 2.1 Debt securities 2) -20.3 20.8 31.6 24.8 24.6 22.5 10.8 -16.5 Long-term assets 426.0 350.1 186.9 122.4 123.6 71.4 33.1 78.7 Deposits -4.7 0.8 -29.5 -34.8 -35.9 -39.7 -32.4 -18.3 Debt securities 0.5 69.9 9.7 29.6 60.5 69.1 49.0 59.6 Shares and other equity 136.6 -33.7 -61.8 -119.2 -127.5 -169.2 -158.2 -122.1 Quoted, unquoted shares and other equity 70.3 -11.1 8.8 -20.2 -13.6 -31.6 -17.0 0.1 Mutual fund shares 66.2 -22.5 -70.5 -99.0 -113.9 -137.6 -141.2 -122.2 Life insurance and pension fund reserves 293.7 313.1 268.5 246.7 226.5 211.1 174.6 159.6 Main items of financing (-) Loans 397.7 396.8 351.1 318.1 288.1 251.2 200.6 141.7 of which from euro area MFIs 358.5 347.4 281.5 249.1 196.5 181.0 78.9 17.2 Other changes in financial assets (+) Shares and other equity 446.5 509.9 10.9 -681.4 -1,024.3 -1,065.1 -1,394.2 -1,111.6 Life insurance and pension fund reserves 105.5 54.7 -2.0 -80.2 -129.9 -182.7 -250.7 -210.6 Remaining net flows (+) -35.7 -61.3 -37.4 -53.3 -60.9 -120.0 -149.5 -109.9 = Changes in net worth 1) 978.9 1,026.3 513.1 -281.5 -675.5 -842.1 -1,257.6 -864.2
Financial balance sheet
Financial assets (+) Short-term assets 4,486.5 4,747.9 5,209.4 5,362.3 5,482.8 5,540.0 5,714.6 5,787.8 Currency and deposits 4,174.1 4,454.2 4,844.2 4,937.1 5,055.3 5,104.9 5,313.7 5,377.7 Money market fund shares 296.4 257.6 296.0 347.0 346.5 348.7 327.4 352.0 Debt securities 2) 16.1 36.1 69.2 78.1 81.1 86.4 73.5 58.1 Long-term assets 10,933.2 11,902.7 12,066.4 11,401.5 11,125.1 10,760.6 10,278.0 10,034.6 Deposits 936.9 942.2 875.6 832.3 821.9 803.5 806.3 784.1 Debt securities 1,199.5 1,280.0 1,293.0 1,309.9 1,294.8 1,258.7 1,243.3 1,278.8 Shares and other equity 4,549.8 5,065.7 5,016.4 4,400.4 4,130.1 3,839.6 3,423.0 3,163.8 Quoted, unquoted shares and other equity 3,203.3 3,643.8 3,637.8 3,189.2 2,970.6 2,756.7 2,431.6 2,230.7 Mutual fund shares 1,346.5 1,421.8 1,378.7 1,211.1 1,159.5 1,083.0 991.4 933.1 Life insurance and pension fund reserves 4,247.1 4,614.8 4,881.3 4,859.0 4,878.3 4,858.7 4,805.3 4,808.0 Remaining net assets (+) 77.7 60.8 16.6 -3.5 -4.4 5.6 -32.5 -41.2 Liabilities (-) Loans 4,763.2 5,159.6 5,494.9 5,542.0 5,607.0 5,655.1 5,688.0 5,678.5 of which from euro area MFIs 4,201.0 4,553.0 4,824.7 4,860.8 4,887.0 4,938.3 4,901.4 4,879.6 = Net financial wealth 10,734.3 11,551.8 11,797.4 11,218.3 10,996.5 10,651.1 10,272.0 10,102.7
Sources: ECB and Eurostat.1) Excluding changes in net worth due to other changes in non-financial assets such as revaluations of residential property.2) Securities issued by MFIs with a maturity of less than two years and by other sectors with a maturity of less than one year.

S 33ECB
Monthly Bulletin
August 2009
EURO AREASTATISTICS
Euro area
accounts
3.4 Non-financial corporations (EUR billions; four-quarter cumulated flows; outstanding amounts at end-of-period)
2007 Q2- 2007 Q3- 2007 Q4- 2008 Q1- 2008 Q2-2005 2006 2007 2008 Q1 2008 Q2 2008 Q3 2008 Q4 2009 Q1
Income and saving
Gross value added (basic prices) (+) 4,175.6 4,380.6 4,631.9 4,683.7 4,740.1 4,777.8 4,780.5 4,722.8 Compensation of employees (-) 2,478.4 2,591.8 2,719.7 2,754.1 2,784.9 2,814.5 2,835.3 2,831.5 Other taxes less subsidies on production (-) 73.0 75.9 81.3 81.7 82.4 83.5 80.4 79.0 = Gross operating surplus (+) 1,624.1 1,712.9 1,830.8 1,848.0 1,872.8 1,879.8 1,864.8 1,812.2 Consumption of fixed capital (-) 672.1 703.2 741.3 749.8 759.0 768.3 777.6 786.1 = Net operating surplus (+) 952.0 1,009.7 1,089.5 1,098.2 1,113.9 1,111.5 1,087.2 1,026.2 Property income receivable (+) 437.3 496.1 574.4 587.1 602.3 610.7 614.1 593.8 Interest receivable 136.7 162.5 197.6 207.3 215.9 221.2 223.7 217.0 Other property income receivable 300.6 333.6 376.8 379.8 386.4 389.5 390.4 376.8 Interest and rents payable (-) 236.3 282.1 339.0 357.7 375.7 392.2 403.0 392.9 = Net entrepreneurial income (+) 1,153.1 1,223.7 1,324.9 1,327.5 1,340.5 1,329.9 1,298.2 1,227.0 Distributed income (-) 882.6 953.2 1,021.3 1,025.1 1,048.7 1,057.9 1,058.5 1,059.0 Taxes on income and wealth payable (-) 149.6 189.2 211.8 213.8 213.9 210.0 192.4 187.4 Social contributions receivable (+) 72.8 74.7 64.9 63.8 63.3 63.2 62.9 63.0 Social benefits payable (-) 60.7 60.5 62.4 62.7 62.5 62.4 62.3 62.2 Other net transfers (-) 61.9 65.9 57.3 57.2 58.2 57.9 57.1 56.8 = Net saving 71.0 29.6 37.2 32.5 20.5 5.0 -9.2 -75.4
Investment, financing and saving
Net acquisition of non-financial assets (+) 255.6 311.1 366.6 372.5 380.5 388.5 376.0 320.0 Gross fixed capital formation (+) 920.5 994.0 1,084.1 1,098.6 1,118.5 1,133.6 1,119.9 1,084.5 Consumption of fixed capital (-) 672.1 703.2 741.3 749.8 759.0 768.3 777.6 786.1 Net acquisition of other non-financial assets (+) 7.2 20.2 23.9 23.8 21.0 23.2 33.6 21.6 Main items of financial investment (+) Short-term assets 128.3 164.1 161.9 164.2 121.4 94.3 47.8 -26.8 Currency and deposits 113.6 146.1 154.9 127.7 115.9 90.2 16.5 -11.2 Money market fund shares 8.3 2.6 -18.1 -10.0 -9.3 7.9 31.5 19.4 Debt securities 1) 6.3 15.4 25.2 46.5 14.8 -3.8 -0.2 -35.1 Long-term assets 370.2 475.2 474.1 497.9 500.7 538.1 641.2 640.0 Deposits 28.0 28.5 24.3 5.3 -25.6 2.8 10.7 17.1 Debt securities -34.9 1.2 -48.2 -88.2 -105.7 -60.2 -36.6 3.5 Shares and other equity 242.8 261.8 328.0 367.5 389.0 353.7 354.1 325.5 Other, mainly intercompany loans 134.4 183.7 169.9 213.3 242.9 241.8 313.0 293.9 Remaining net assets (+) 105.6 165.2 208.9 137.5 62.9 -9.1 -78.2 -149.2 Main items of financing (-) Debt 447.0 757.4 802.5 778.6 733.6 734.4 668.8 553.3 of which loans from euro area MFIs 264.5 448.9 558.9 592.1 562.6 515.7 422.0 284.9 of which debt securities 13.6 40.1 40.2 37.4 15.9 38.2 42.6 52.4 Shares and other equity 279.7 256.1 304.3 292.4 241.5 199.4 249.7 225.7 Quoted shares 104.1 42.0 42.2 23.5 -12.6 -29.2 1.8 9.9 Unquoted shares and other equity 175.6 214.1 262.1 269.0 254.1 228.6 247.9 215.7 Net capital transfers receivable (-) 62.0 72.5 68.4 69.6 73.6 75.7 75.5 77.9 = Net saving 71.0 29.6 37.2 32.5 20.5 5.0 -9.2 -75.4
Financial balance sheet
Financial assets Short-term assets 1,517.5 1,675.2 1,820.4 1,842.2 1,845.0 1,855.2 1,871.4 1,841.0 Currency and deposits 1,229.3 1,367.0 1,519.3 1,506.6 1,534.6 1,548.7 1,553.5 1,517.0 Money market fund shares 176.5 184.9 162.0 183.0 183.2 184.4 189.8 204.1 Debt securities 1) 111.8 123.3 139.1 152.6 127.2 122.1 128.1 119.9 Long-term assets 8,667.0 10,024.9 10,750.3 10,098.1 9,897.4 9,630.1 8,871.7 8,598.8 Deposits 191.2 223.6 266.8 256.8 243.3 268.7 282.1 273.6 Debt securities 281.5 282.9 236.3 170.6 160.9 167.8 180.1 153.5 Shares and other equity 6,328.5 7,486.0 8,025.8 7,355.1 7,112.3 6,755.7 5,877.6 5,550.7 Other, mainly intercompany loans 1,865.9 2,032.4 2,221.5 2,315.7 2,380.9 2,437.9 2,531.9 2,621.1 Remaining net assets 386.5 457.0 638.9 642.0 599.6 608.6 605.3 564.6 Liabilities Debt 7,097.8 7,834.6 8,593.8 8,749.4 8,957.7 9,117.0 9,271.2 9,335.8 of which loans from euro area MFIs 3,429.3 3,878.8 4,418.2 4,559.5 4,683.3 4,775.9 4,841.9 4,843.0 of which debt securities 675.7 694.5 695.1 696.0 701.3 716.1 735.5 757.0 Shares and other equity 10,974.7 12,938.0 13,932.0 12,581.4 12,141.1 11,377.0 10,273.1 9,637.0 Quoted shares 3,712.2 4,491.5 5,008.5 4,229.2 3,999.5 3,459.8 2,866.1 2,517.1 Unquoted shares and other equity 7,262.5 8,446.5 8,923.5 8,352.2 8,141.7 7,917.2 7,407.0 7,119.9Sources: ECB and Eurostat.1) Securities issued by MFIs with a maturity of less than two years and by other sectors with a maturity of less than one year.

S 34ECB
Monthly Bulletin
August 2009
3.5 Insurance corporations and pension funds (EUR billions; four-quarter cumulated flows; outstanding amounts at end-of-period)
2007 Q2- 2007 Q3- 2007 Q4- 2008 Q1- 2008 Q2-2005 2006 2007 2008 Q1 2008 Q2 2008 Q3 2008 Q4 2009 Q1
Financial account, financial transactions
Main items of financial investment (+) Short-term assets 25.6 64.8 87.8 110.0 102.8 88.8 106.7 50.7 Currency and deposits 7.2 11.0 6.4 32.7 35.7 32.1 59.1 18.7 Money market fund shares -0.5 3.5 3.1 15.8 14.2 20.9 22.2 13.6 Debt securities 1) 18.9 50.2 78.3 61.6 52.9 35.8 25.3 18.4 Long-term assets 284.3 317.1 220.4 214.1 172.9 156.3 131.9 111.6 Deposits 17.2 76.8 51.5 27.8 15.8 0.6 -1.2 9.9 Debt securities 133.1 126.7 92.9 83.0 74.1 90.4 70.1 72.6 Loans -4.1 2.5 -13.6 20.2 16.3 20.0 30.3 6.3 Quoted shares 30.8 -1.4 -5.8 -2.9 -1.7 -9.4 -6.0 -4.4 Unquoted shares and other equity 19.9 28.6 29.6 44.7 39.7 41.7 34.3 26.0 Mutual fund shares 87.4 84.1 65.8 41.3 28.5 12.8 4.5 1.2 Remaining net assets (+) 12.2 3.2 -26.7 -20.9 -17.4 -7.8 23.7 -5.2 Main items of financing (-) Debt securities -0.4 5.7 3.9 4.4 5.1 5.4 9.3 9.8 Loans 17.3 35.9 21.7 44.0 18.1 4.1 21.7 -9.9 Shares and other equity 10.6 11.5 1.7 -0.9 -1.9 -7.1 3.6 4.5 Insurance technical reserves 335.5 323.9 287.0 269.6 252.2 237.8 193.1 160.2 Net equity of households in life insurance and pension fund reserves 292.8 310.0 283.3 264.3 242.1 222.5 179.0 152.1 Prepayments of insurance premiums and reserves for outstanding claims 42.6 14.0 3.6 5.4 10.2 15.3 14.2 8.1 = Changes in net financial worth due to transactions -40.9 8.1 -32.8 -13.8 -15.3 -3.0 34.6 -7.4
Other changes account
Other changes in financial assets (+) Shares and other equity 190.7 180.5 -12.0 -218.4 -327.5 -399.1 -540.5 -437.6 Other net assets 76.1 -34.5 -58.7 -1.9 -19.1 -27.8 35.0 27.1 Other changes in liabilities (-) Shares and other equity 118.4 35.0 -31.4 -92.7 -148.2 -146.7 -187.7 -188.4 Insurance technical reserves 137.8 52.9 -3.3 -80.8 -132.3 -188.5 -255.5 -215.5 Net equity of households in life insurance and pension fund reserves 146.9 56.2 -2.8 -78.1 -127.6 -180.8 -246.2 -208.6 Prepayments of insurance premiums and reserves for outstanding claims -9.1 -3.3 -0.4 -2.7 -4.7 -7.7 -9.3 -6.9 = Other changes in net financial worth 10.6 58.2 -36.0 -46.8 -66.1 -91.6 -62.3 -6.6
Financial balance sheet
Financial assets (+) Short-term assets 437.2 509.4 591.2 650.1 659.3 664.1 702.3 707.8 Currency and deposits 146.6 157.1 164.6 192.5 182.6 189.5 226.6 216.8 Money market fund shares 75.6 81.5 82.4 95.4 94.8 98.3 102.2 109.9 Debt securities 1) 215.0 270.8 344.1 362.2 381.9 376.3 373.5 381.1 Long-term assets 4,608.2 5,045.0 5,198.6 5,102.6 5,039.0 4,974.1 4,805.3 4,770.0 Deposits 524.7 602.4 650.6 649.3 653.4 648.7 648.2 660.8 Debt securities 1,776.4 1,848.5 1,893.5 1,941.7 1,921.2 1,966.9 1,974.9 2,009.1 Loans 353.5 351.2 331.8 359.1 355.0 356.9 364.8 363.3 Quoted shares 653.3 725.1 708.3 613.9 595.1 536.3 426.0 392.7 Unquoted shares and other equity 392.8 471.0 506.5 485.5 468.7 455.7 433.0 414.2 Mutual fund shares 907.5 1,046.9 1,107.9 1,053.1 1,045.7 1,009.6 958.4 929.8 Remaining net assets (+) 176.9 203.3 171.9 192.0 176.9 175.5 213.5 216.9 Liabilities (-) Debt securities 21.3 35.9 35.2 35.8 36.5 36.7 43.2 41.5 Loans 136.4 167.7 187.2 221.6 211.4 206.7 212.8 219.1 Shares and other equity 626.9 673.4 643.6 586.6 548.3 527.1 459.6 402.8 Insurance technical reserves 4,558.7 4,935.5 5,219.2 5,213.0 5,237.5 5,221.3 5,156.8 5,157.7 Net equity of households in life insurance and pension fund reserves 3,892.0 4,258.2 4,538.7 4,526.1 4,547.7 4,530.5 4,471.5 4,469.6 Prepayments of insurance premiums and reserves for outstanding claims 666.7 677.3 680.5 686.9 689.8 690.8 685.4 688.1 = Net financial wealth -121.0 -54.7 -123.5 -112.3 -158.5 -178.0 -151.2 -126.4
Source: ECB.1) Securities issued by MFIs with a maturity of less than two years and by other sectors with a maturity of less than one year.

S 35ECB
Monthly Bulletin
August 2009
4FINANCIAL MARKETS
4.1 Securities, other than shares, by original maturity, residency of the issuer and currency (EUR billions and period growth rates; seasonally adjusted; transactions during the month and end-of-period outstanding amounts; nominal values)
Total
By euro area residents
Total in euro 1) In euro In all currencies
Outstanding Gross issues Net issues Outstanding Gross issues Net issues Outstanding Gross issues Net issues Annual Seasonally adjusted 2)
amounts amounts amounts growth rates6-month
Net issues growth rates1 2 3 4 5 6 7 8 9 10 11 12
2008 May 13,359.1 1,126.3 177.9 11,177.2 1,036.5 138.4 12,467.5 1,110.2 153.2 6.7 98.0 5.7 June 13,494.6 1,155.6 135.8 11,251.6 1,040.3 74.8 12,539.1 1,113.5 82.1 6.8 88.9 5.6 July 13,506.9 1,139.5 11.1 11,309.0 1,073.9 55.6 12,614.4 1,160.6 74.9 7.1 97.2 6.8 Aug. 13,632.7 880.7 123.0 11,416.8 816.0 105.2 12,744.1 889.5 110.5 7.8 161.5 8.8 Sep. 13,635.6 1,022.0 1.4 11,384.4 930.3 -33.9 12,704.1 1,001.2 -43.3 7.0 -14.7 8.2 Oct. 13,733.7 1,454.3 97.4 11,535.3 1,417.3 150.3 12,903.1 1,494.5 145.4 6.9 103.7 8.9 Nov. 13,951.8 1,422.3 218.5 11,762.5 1,369.7 228.0 13,096.1 1,436.9 213.7 8.1 199.6 10.5 Dec. 14,137.3 1,537.4 189.1 11,914.6 1,448.7 155.9 13,168.5 1,526.0 142.4 9.5 274.7 13.62009 Jan. 14,240.2 1,503.8 98.7 12,055.1 1,451.4 137.2 13,370.4 1,530.0 146.5 10.1 103.9 13.6 Feb. 14,434.6 1,261.0 191.8 12,241.4 1,199.7 183.8 13,574.1 1,285.2 203.4 11.1 165.9 13.5 Mar. 14,609.7 1,317.5 173.5 12,380.5 1,229.3 137.6 13,678.8 1,322.6 148.6 11.9 117.4 15.7 Apr. . . . 12,478.5 1,163.8 100.8 13,790.1 1,246.9 108.9 12.1 90.7 15.4 May . . . 12,650.0 1,067.2 171.5 13,926.7 1,153.6 166.7 12.0 100.9 13.5
Long-term
2008 May 11,974.0 290.8 153.2 9,937.1 235.0 113.4 11,028.0 257.5 122.5 5.1 68.7 4.9 June 12,087.6 283.9 113.8 10,024.0 230.3 87.2 11,115.1 254.5 95.5 5.2 68.4 4.8 July 12,114.2 208.7 25.1 10,055.9 178.5 30.1 11,154.1 196.7 35.6 5.3 60.7 5.7 Aug. 12,203.4 160.0 87.2 10,133.9 133.8 76.1 11,252.7 149.2 76.8 6.1 132.6 7.7 Sep. 12,192.3 183.4 -10.4 10,111.7 145.4 -21.3 11,236.1 158.4 -31.8 5.7 -17.9 7.1 Oct. 12,216.8 199.0 24.8 10,147.7 182.7 36.4 11,329.2 195.4 30.9 5.3 23.2 6.2 Nov. 12,392.1 275.5 174.4 10,323.4 253.9 175.0 11,484.9 262.5 165.9 6.2 145.9 7.6 Dec. 12,570.8 362.8 179.9 10,494.7 328.3 172.7 11,579.3 340.0 153.3 7.3 182.4 9.72009 Jan. 12,650.8 294.8 78.3 10,584.9 276.9 89.3 11,714.2 300.3 90.1 8.2 111.9 10.6 Feb. 12,822.7 302.4 170.4 10,746.7 269.4 160.6 11,887.1 296.5 172.8 9.2 148.7 10.8 Mar. 13,006.1 319.3 153.7 10,920.0 279.7 143.6 12,024.9 301.4 144.7 10.4 138.8 13.7 Apr. . . . 10,986.4 254.0 69.7 12,101.3 272.9 73.3 10.3 68.7 14.6 May . . . 11,153.7 277.9 168.5 12,249.2 298.2 172.6 10.6 110.5 13.7
C16 Total outstanding amounts and gross issues of securities, other than shares, issued by euro area residents(EUR billions)
2000
4000
6000
8000
10000
12000
14000
16000
18000
1994 1995 1996 1997 1998 1999 2000 2001 2002 2003 2004 2005 2006 2007 20080
200
400
600
800
1000
1200
1400
1600
total gross issues (right-hand scale)total outstanding amounts (left-hand scale)outstanding amounts in euro (left-hand scale)
Sources: ECB and BIS (for issues by non-euro area residents).1) Total euro-denominated securities, other than shares, issued by euro area residents and non-euro area residents.2) For the calculation of the growth rates, see the Technical notes. The 6-month growth rates have been annualised.

S 36ECB
Monthly Bulletin
August 2009
4.2 Securities, other than shares, issued by euro area residents, by sector of the issuer and instrument type (EUR billions ; transactions during the month and end-of-period outstanding amounts; nominal values)
1. Outstanding amounts and gross issues
Total
Outstanding amounts Gross issues 1)
Total MFIs Non-MFI corporations General government Total MFIs Non-MFI corporations General government
(including (includingEurosystem) Financial Non-financial Central Other Eurosystem) Financial Non-financial Central Other
corporations corporations government general corporations corporations government generalother than government other than government
MFIs MFIs1 2 3 4 5 6 7 8 9 10 11 12
2007 12,066 5,046 1,506 653 4,534 327 1,138 841 59 109 116 122008 13,169 5,266 1,916 696 4,950 340 1,177 817 73 100 163 242008 Q2 12,539 5,231 1,622 670 4,696 320 1,120 786 69 102 142 20 Q3 12,704 5,267 1,686 680 4,747 324 1,017 691 54 97 148 27 Q4 13,169 5,266 1,916 696 4,950 340 1,486 1,006 132 107 214 282009 Q1 13,679 5,392 1,997 718 5,228 343 1,379 922 68 92 261 352009 Feb. 13,574 5,407 1,979 718 5,133 338 1,285 873 72 82 236 23 Mar. 13,679 5,392 1,997 718 5,228 343 1,323 878 58 90 269 27 Apr. 13,790 5,419 2,024 730 5,268 350 1,247 806 58 90 266 26 May 13,927 5,455 2,043 741 5,338 349 1,154 744 56 88 249 17
Short-term
2007 1,287 787 36 100 345 18 946 754 18 101 64 92008 1,589 822 61 115 566 25 962 723 26 92 101 192008 Q2 1,424 835 51 111 415 11 873 666 21 92 77 17 Q3 1,468 826 62 111 457 13 849 614 25 92 94 24 Q4 1,589 822 61 115 566 25 1,220 911 38 95 152 232009 Q1 1,654 838 41 98 659 18 1,080 806 17 74 156 272009 Feb. 1,687 884 38 103 643 19 989 748 16 67 140 18 Mar. 1,654 838 41 98 659 18 1,021 764 17 74 149 17 Apr. 1,689 829 42 95 705 17 974 694 16 74 173 16 May 1,678 832 40 89 701 15 855 626 13 64 142 10
Long-term 2)
2007 10,779 4,259 1,470 553 4,189 309 191 86 41 8 52 32008 11,579 4,445 1,855 581 4,384 315 215 95 47 8 62 42008 Q2 11,115 4,397 1,571 559 4,280 309 247 121 48 10 65 3 Q3 11,236 4,441 1,625 570 4,290 311 168 76 29 5 54 3 Q4 11,579 4,445 1,855 581 4,384 315 266 95 93 11 62 52009 Q1 12,025 4,554 1,957 621 4,570 324 299 116 51 18 105 82009 Feb. 11,887 4,523 1,940 615 4,490 319 296 125 56 15 95 6 Mar. 12,025 4,554 1,957 621 4,570 324 301 114 42 16 120 10 Apr. 12,101 4,589 1,982 635 4,562 333 273 112 42 16 93 10 May 12,249 4,622 2,003 652 4,637 335 298 118 43 24 106 6
Of which long-term fixed rate
2007 7,324 2,263 594 419 3,797 250 107 44 10 5 45 32008 7,611 2,326 625 445 3,966 250 119 48 8 6 54 32008 Q2 7,478 2,347 605 424 3,853 248 145 66 11 9 56 2 Q3 7,535 2,370 619 432 3,865 248 101 42 7 3 47 2 Q4 7,611 2,326 625 445 3,966 250 120 42 9 10 57 22009 Q1 7,931 2,396 663 487 4,133 252 207 72 17 18 96 52009 Feb. 7,839 2,384 661 479 4,065 250 203 76 22 15 86 4 Mar. 7,931 2,396 663 487 4,133 252 205 65 11 15 108 6 Apr. 7,981 2,418 672 501 4,131 258 183 61 14 15 85 7 May 8,104 2,458 672 519 4,195 260 208 77 9 23 94 5
Of which long-term variable rate
2007 3,001 1,621 857 123 342 58 69 31 30 3 4 02008 3,480 1,724 1,200 126 365 64 81 36 38 1 5 12008 Q2 3,181 1,683 940 124 373 60 90 47 35 1 6 1 Q3 3,229 1,698 979 129 362 61 53 24 21 2 4 1 Q4 3,480 1,724 1,200 126 365 64 129 39 83 1 3 22009 Q1 3,590 1,757 1,268 123 371 70 75 32 34 0 5 32009 Feb. 3,540 1,731 1,252 125 365 68 80 38 34 0 6 2 Mar. 3,590 1,757 1,268 123 371 70 81 39 30 1 7 4 Apr. 3,606 1,763 1,284 124 362 73 72 37 27 1 5 3 May 3,619 1,749 1,305 123 369 73 70 25 33 1 9 1
Source: ECB.1) Monthly averages of/monthly data for the transactions during this period.2) The residual difference between total long-term debt securities and fixed and variable rate long-term debt securities consists of zero coupon bonds and revaluation effects.

S 37ECB
Monthly Bulletin
August 2009
EURO AREASTATISTICS
Financial
markets
4.2 Securities, other than shares, issued by euro area residents, by sector of the issuer and instrument type (EUR billions unless otherwise indicated; transactions during the period; nominal values)
2. Net issues
Total
Non-seasonally adjusted 1) Seasonally adjusted 1)
Total MFIs Non-MFI corporations General government Total MFIs Non-MFI corporations General government
(including (includingEurosystem) Financial Non-financial Central Other Eurosystem) Financial Non-financial Central Other
corporations corporations government general corporations corporations government generalother than government other than government
MFIs MFIs1 2 3 4 5 6 7 8 9 10 11 12
2007 83.6 40.7 27.7 4.2 9.9 1.2 84.2 41.3 27.2 4.3 10.2 1.22008 95.1 23.2 34.2 3.9 32.8 1.1 96.6 23.3 33.5 4.0 34.7 1.12008 Q2 105.5 46.7 34.5 4.8 18.7 0.9 83.0 48.6 30.4 0.7 2.8 0.6 Q3 47.3 10.9 18.7 1.9 14.7 1.2 81.3 18.8 31.9 5.2 23.1 2.4 Q4 167.2 11.4 77.3 5.9 67.2 5.3 192.7 21.4 55.6 7.8 103.1 4.82009 Q1 166.2 40.6 25.9 7.0 91.8 0.9 129.1 21.0 38.6 6.3 62.6 0.62009 Feb. 203.4 67.4 43.7 7.6 83.8 0.9 165.9 48.1 43.5 7.8 66.2 0.3 Mar. 148.6 13.9 24.8 4.1 100.9 4.9 117.4 5.1 30.2 4.9 71.2 6.1 Apr. 108.9 27.9 25.1 10.2 38.6 7.2 90.7 14.7 27.7 7.3 34.0 7.0 May 166.7 54.4 23.0 13.6 76.0 -0.3 100.9 34.5 16.1 5.9 45.1 -0.6
Long-term
2007 61.8 23.9 27.0 2.4 7.8 0.7 61.4 24.1 26.5 2.4 7.8 0.72008 65.7 16.2 32.1 2.5 14.4 0.5 65.2 16.3 31.5 2.5 14.4 0.52008 Q2 96.8 42.6 33.6 3.9 15.8 0.9 68.5 36.2 29.6 0.4 1.5 0.7 Q3 26.9 7.4 15.2 2.5 1.3 0.5 58.5 15.2 27.8 4.1 9.8 1.6 Q4 116.7 2.9 77.5 4.4 30.5 1.5 117.2 11.0 56.8 3.8 45.0 0.52009 Q1 135.9 25.8 32.7 12.9 61.4 3.0 133.2 16.6 45.0 15.7 52.9 3.02009 Feb. 172.8 44.9 43.5 12.6 71.3 0.5 148.7 24.9 43.5 14.7 65.0 0.6 Mar. 144.7 23.6 22.1 9.4 83.9 5.6 138.8 15.3 27.4 11.8 78.9 5.5 Apr. 73.3 36.0 23.9 13.2 -8.0 8.3 68.7 30.3 27.1 12.7 -10.5 9.2 May 172.6 47.4 25.0 19.1 78.9 2.1 110.5 27.2 17.0 13.2 50.8 2.2
C17 Net issues of securities, other than shares, seasonally adjusted and non-seasonally adjusted(EUR billions; transactions during the month; nominal values)
-100
-50
0
50
100
150
200
250
300
2003 2004 2005 2006 2007 2008-100
-50
0
50
100
150
200
250
300
net issuesnet issues, seasonally adjusted
Source: ECB.1) Monthly averages of/monthly data for the transactions during this period.
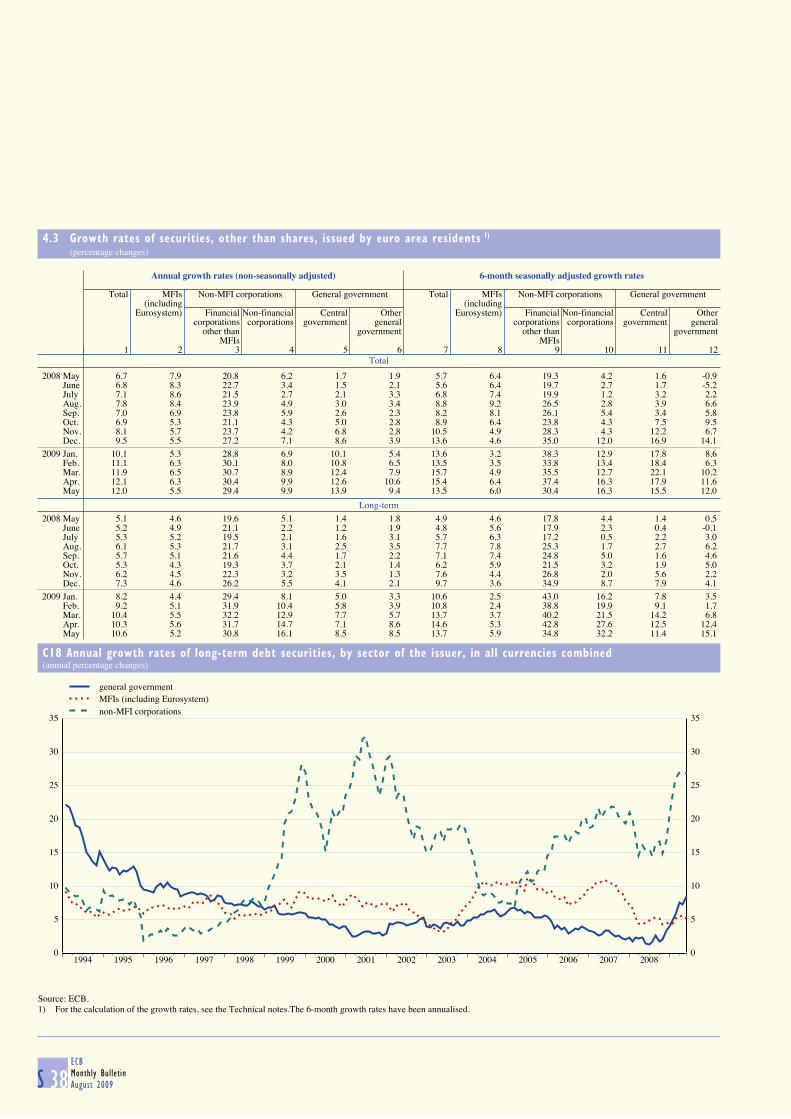
S 38ECB
Monthly Bulletin
August 2009
4.3 Growth rates of securities, other than shares, issued by euro area residents 1) (percentage changes)
Total
Annual growth rates (non-seasonally adjusted) 6-month seasonally adjusted growth rates
Total MFIs Non-MFI corporations General government Total MFIs Non-MFI corporations General government
(including (includingEurosystem) Financial Non-financial Central Other Eurosystem) Financial Non-financial Central Other
corporations corporations government general corporations corporations government generalother than government other than government
MFIs MFIs1 2 3 4 5 6 7 8 9 10 11 12
2008 May 6.7 7.9 20.8 6.2 1.7 1.9 5.7 6.4 19.3 4.2 1.6 -0.9 June 6.8 8.3 22.7 3.4 1.5 2.1 5.6 6.4 19.7 2.7 1.7 -5.2 July 7.1 8.6 21.5 2.7 2.1 3.3 6.8 7.4 19.9 1.2 3.2 2.2 Aug. 7.8 8.4 23.9 4.9 3.0 3.4 8.8 9.2 26.5 2.8 3.9 6.6 Sep. 7.0 6.9 23.8 5.9 2.6 2.3 8.2 8.1 26.1 5.4 3.4 5.8 Oct. 6.9 5.3 21.1 4.3 5.0 2.8 8.9 6.4 23.8 4.3 7.5 9.5 Nov. 8.1 5.7 23.7 4.2 6.8 2.8 10.5 4.9 28.3 4.3 12.2 6.7 Dec. 9.5 5.5 27.2 7.1 8.6 3.9 13.6 4.6 35.0 12.0 16.9 14.12009 Jan. 10.1 5.3 28.8 6.9 10.1 5.4 13.6 3.2 38.3 12.9 17.8 8.6 Feb. 11.1 6.3 30.1 8.0 10.8 6.5 13.5 3.5 33.8 13.4 18.4 6.3 Mar. 11.9 6.5 30.7 8.9 12.4 7.9 15.7 4.9 35.5 12.7 22.1 10.2 Apr. 12.1 6.3 30.4 9.9 12.6 10.6 15.4 6.4 37.4 16.3 17.9 11.6 May 12.0 5.5 29.4 9.9 13.9 9.4 13.5 6.0 30.4 16.3 15.5 12.0
Long-term
2008 May 5.1 4.6 19.6 5.1 1.4 1.8 4.9 4.6 17.8 4.4 1.4 0.5 June 5.2 4.9 21.1 2.2 1.2 1.9 4.8 5.6 17.9 2.3 0.4 -0.1 July 5.3 5.2 19.5 2.1 1.6 3.1 5.7 6.3 17.2 0.5 2.2 3.0 Aug. 6.1 5.3 21.7 3.1 2.5 3.5 7.7 7.8 25.3 1.7 2.7 6.2 Sep. 5.7 5.1 21.6 4.4 1.7 2.2 7.1 7.4 24.8 5.0 1.6 4.6 Oct. 5.3 4.3 19.3 3.7 2.1 1.4 6.2 5.9 21.5 3.2 1.9 5.0 Nov. 6.2 4.5 22.3 3.2 3.5 1.3 7.6 4.4 26.8 2.0 5.6 2.2 Dec. 7.3 4.6 26.2 5.5 4.1 2.1 9.7 3.6 34.9 8.7 7.9 4.12009 Jan. 8.2 4.4 29.4 8.1 5.0 3.3 10.6 2.5 43.0 16.2 7.8 3.5 Feb. 9.2 5.1 31.9 10.4 5.8 3.9 10.8 2.4 38.8 19.9 9.1 1.7 Mar. 10.4 5.5 32.2 12.9 7.7 5.7 13.7 3.7 40.2 21.5 14.2 6.8 Apr. 10.3 5.6 31.7 14.7 7.1 8.6 14.6 5.3 42.8 27.6 12.5 12.4 May 10.6 5.2 30.8 16.1 8.5 8.5 13.7 5.9 34.8 32.2 11.4 15.1
C18 Annual growth rates of long-term debt securities, by sector of the issuer, in all currencies combined(annual percentage changes)
0
5
10
15
20
25
30
35
1994 1995 1996 1997 1998 1999 2000 2001 2002 2003 2004 2005 2006 2007 20080
5
10
15
20
25
30
35
general governmentMFIs (including Eurosystem)non-MFI corporations
Source: ECB.1) For the calculation of the growth rates, see the Technical notes.The 6-month growth rates have been annualised.
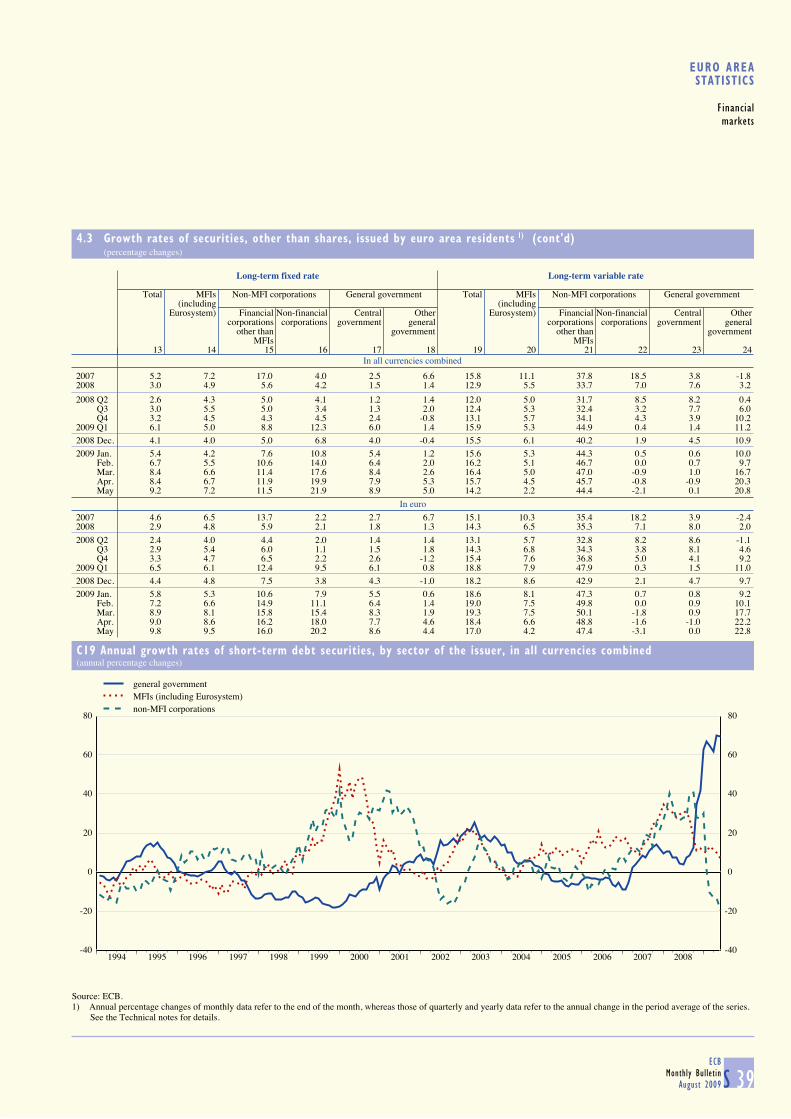
S 39ECB
Monthly Bulletin
August 2009
EURO AREASTATISTICS
Financial
markets
4.3 Growth rates of securities, other than shares, issued by euro area residents 1) (cont'd) (percentage changes)
In all currencies combined
Long-term fixed rate Long-term variable rate
Total MFIs Non-MFI corporations General government Total MFIs Non-MFI corporations General government
(including (includingEurosystem) Financial Non-financial Central Other Eurosystem) Financial Non-financial Central Other
corporations corporations government general corporations corporations government generalother than government other than government
MFIs MFIs13 14 15 16 17 18 19 20 21 22 23 24
2007 5.2 7.2 17.0 4.0 2.5 6.6 15.8 11.1 37.8 18.5 3.8 -1.82008 3.0 4.9 5.6 4.2 1.5 1.4 12.9 5.5 33.7 7.0 7.6 3.2
2008 Q2 2.6 4.3 5.0 4.1 1.2 1.4 12.0 5.0 31.7 8.5 8.2 0.4 Q3 3.0 5.5 5.0 3.4 1.3 2.0 12.4 5.3 32.4 3.2 7.7 6.0 Q4 3.2 4.5 4.3 4.5 2.4 -0.8 13.1 5.7 34.1 4.3 3.9 10.22009 Q1 6.1 5.0 8.8 12.3 6.0 1.4 15.9 5.3 44.9 0.4 1.4 11.2
2008 Dec. 4.1 4.0 5.0 6.8 4.0 -0.4 15.5 6.1 40.2 1.9 4.5 10.92009 Jan. 5.4 4.2 7.6 10.8 5.4 1.2 15.6 5.3 44.3 0.5 0.6 10.0 Feb. 6.7 5.5 10.6 14.0 6.4 2.0 16.2 5.1 46.7 0.0 0.7 9.7 Mar. 8.4 6.6 11.4 17.6 8.4 2.6 16.4 5.0 47.0 -0.9 1.0 16.7 Apr. 8.4 6.7 11.9 19.9 7.9 5.3 15.7 4.5 45.7 -0.8 -0.9 20.3 May 9.2 7.2 11.5 21.9 8.9 5.0 14.2 2.2 44.4 -2.1 0.1 20.8
In euro
2007 4.6 6.5 13.7 2.2 2.7 6.7 15.1 10.3 35.4 18.2 3.9 -2.42008 2.9 4.8 5.9 2.1 1.8 1.3 14.3 6.5 35.3 7.1 8.0 2.0
2008 Q2 2.4 4.0 4.4 2.0 1.4 1.4 13.1 5.7 32.8 8.2 8.6 -1.1 Q3 2.9 5.4 6.0 1.1 1.5 1.8 14.3 6.8 34.3 3.8 8.1 4.6 Q4 3.3 4.7 6.5 2.2 2.6 -1.2 15.4 7.6 36.8 5.0 4.1 9.22009 Q1 6.5 6.1 12.4 9.5 6.1 0.8 18.8 7.9 47.9 0.3 1.5 11.0
2008 Dec. 4.4 4.8 7.5 3.8 4.3 -1.0 18.2 8.6 42.9 2.1 4.7 9.72009 Jan. 5.8 5.3 10.6 7.9 5.5 0.6 18.6 8.1 47.3 0.7 0.8 9.2 Feb. 7.2 6.6 14.9 11.1 6.4 1.4 19.0 7.5 49.8 0.0 0.9 10.1 Mar. 8.9 8.1 15.8 15.4 8.3 1.9 19.3 7.5 50.1 -1.8 0.9 17.7 Apr. 9.0 8.6 16.2 18.0 7.7 4.6 18.4 6.6 48.8 -1.6 -1.0 22.2 May 9.8 9.5 16.0 20.2 8.6 4.4 17.0 4.2 47.4 -3.1 0.0 22.8
C19 Annual growth rates of short-term debt securities, by sector of the issuer, in all currencies combined(annual percentage changes)
-40
-20
0
20
40
60
80
1994 1995 1996 1997 1998 1999 2000 2001 2002 2003 2004 2005 2006 2007 2008-40
-20
0
20
40
60
80
general governmentMFIs (including Eurosystem)non-MFI corporations
Source: ECB.1) Annual percentage changes of monthly data refer to the end of the month, whereas those of quarterly and yearly data refer to the annual change in the period average of the series. See the Technical notes for details.
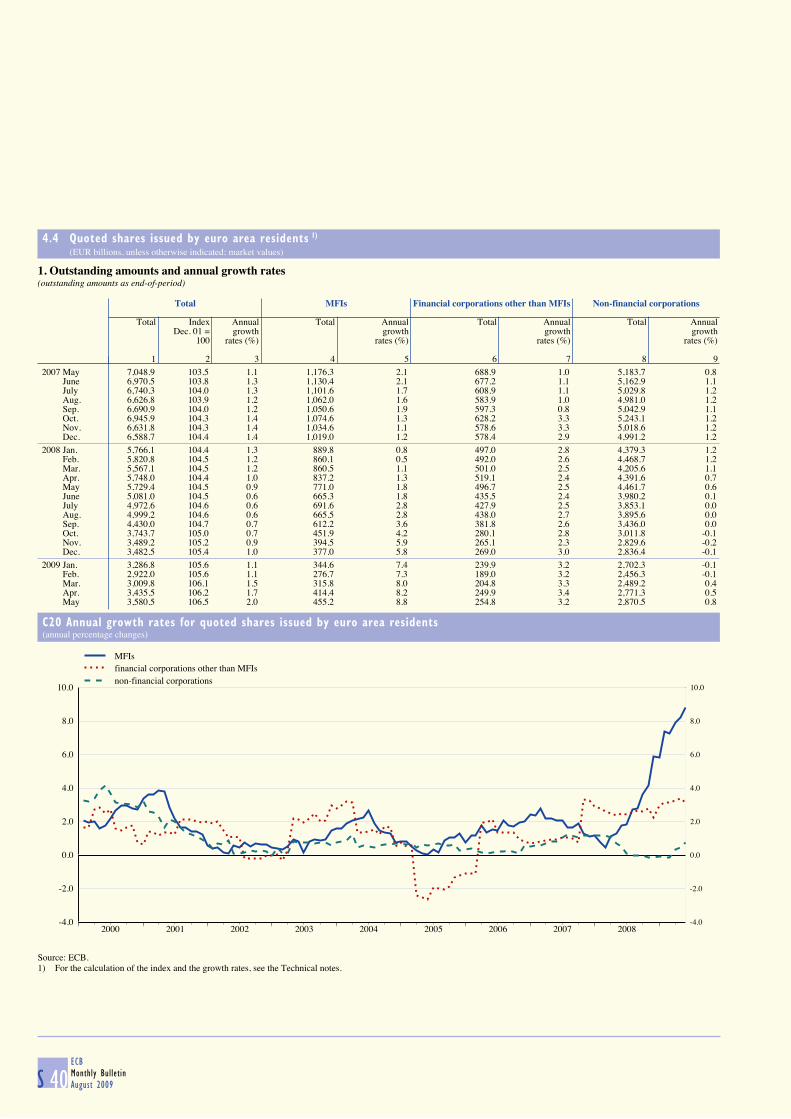
S 40ECB
Monthly Bulletin
August 2009
4.4 Quoted shares issued by euro area residents 1) (EUR billions, unless otherwise indicated; market values)
1. Outstanding amounts and annual growth rates(outstanding amounts as end-of-period)
Total MFIs Financial corporations other than MFIs Non-financial corporations
Total Index Annual Total Annual Total Annual Total AnnualDec. 01 = growth growth growth growth
100 rates (%) rates (%) rates (%) rates (%)
1 2 3 4 5 6 7 8 92007 May 7,048.9 103.5 1.1 1,176.3 2.1 688.9 1.0 5,183.7 0.8 June 6,970.5 103.8 1.3 1,130.4 2.1 677.2 1.1 5,162.9 1.1 July 6,740.3 104.0 1.3 1,101.6 1.7 608.9 1.1 5,029.8 1.2 Aug. 6,626.8 103.9 1.2 1,062.0 1.6 583.9 1.0 4,981.0 1.2 Sep. 6,690.9 104.0 1.2 1,050.6 1.9 597.3 0.8 5,042.9 1.1 Oct. 6,945.9 104.3 1.4 1,074.6 1.3 628.2 3.3 5,243.1 1.2 Nov. 6,631.8 104.3 1.4 1,034.6 1.1 578.6 3.3 5,018.6 1.2 Dec. 6,588.7 104.4 1.4 1,019.0 1.2 578.4 2.9 4,991.2 1.22008 Jan. 5,766.1 104.4 1.3 889.8 0.8 497.0 2.8 4,379.3 1.2 Feb. 5,820.8 104.5 1.2 860.1 0.5 492.0 2.6 4,468.7 1.2 Mar. 5,567.1 104.5 1.2 860.5 1.1 501.0 2.5 4,205.6 1.1 Apr. 5,748.0 104.4 1.0 837.2 1.3 519.1 2.4 4,391.6 0.7 May 5,729.4 104.5 0.9 771.0 1.8 496.7 2.5 4,461.7 0.6 June 5,081.0 104.5 0.6 665.3 1.8 435.5 2.4 3,980.2 0.1 July 4,972.6 104.6 0.6 691.6 2.8 427.9 2.5 3,853.1 0.0 Aug. 4,999.2 104.6 0.6 665.5 2.8 438.0 2.7 3,895.6 0.0 Sep. 4,430.0 104.7 0.7 612.2 3.6 381.8 2.6 3,436.0 0.0 Oct. 3,743.7 105.0 0.7 451.9 4.2 280.1 2.8 3,011.8 -0.1 Nov. 3,489.2 105.2 0.9 394.5 5.9 265.1 2.3 2,829.6 -0.2 Dec. 3,482.5 105.4 1.0 377.0 5.8 269.0 3.0 2,836.4 -0.12009 Jan. 3,286.8 105.6 1.1 344.6 7.4 239.9 3.2 2,702.3 -0.1 Feb. 2,922.0 105.6 1.1 276.7 7.3 189.0 3.2 2,456.3 -0.1 Mar. 3,009.8 106.1 1.5 315.8 8.0 204.8 3.3 2,489.2 0.4 Apr. 3,435.5 106.2 1.7 414.4 8.2 249.9 3.4 2,771.3 0.5 May 3,580.5 106.5 2.0 455.2 8.8 254.8 3.2 2,870.5 0.8
C20 Annual growth rates for quoted shares issued by euro area residents(annual percentage changes)
-4.0
-2.0
0.0
2.0
4.0
6.0
8.0
10.0
2000 2001 2002 2003 2004 2005 2006 2007 2008-4.0
-2.0
0.0
2.0
4.0
6.0
8.0
10.0
MFIsfinancial corporations other than MFIsnon-financial corporations
Source: ECB.1) For the calculation of the index and the growth rates, see the Technical notes.
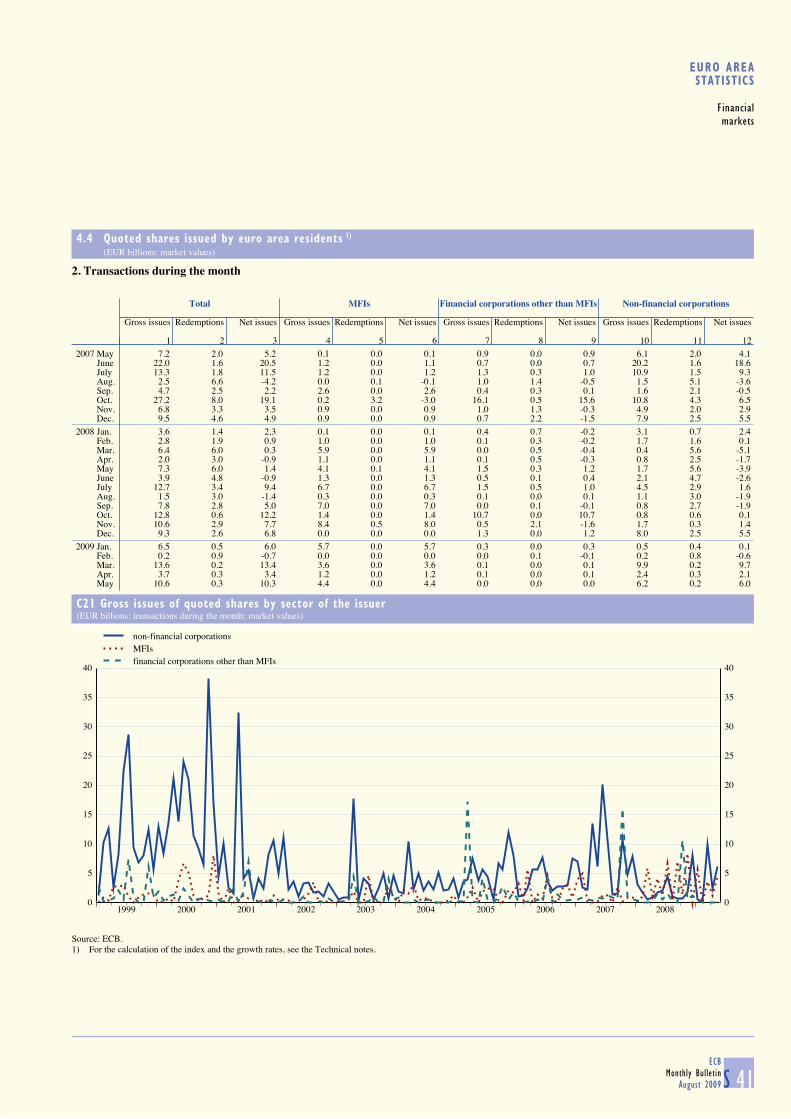
S 41ECB
Monthly Bulletin
August 2009
EURO AREASTATISTICS
Financial
markets
4.4 Quoted shares issued by euro area residents 1) (EUR billions; market values)
2. Transactions during the month
Total MFIs Financial corporations other than MFIs Non-financial corporations
Gross issues Redemptions Net issues Gross issues Redemptions Net issues Gross issues Redemptions Net issues Gross issues Redemptions Net issues
1 2 3 4 5 6 7 8 9 10 11 122007 May 7.2 2.0 5.2 0.1 0.0 0.1 0.9 0.0 0.9 6.1 2.0 4.1 June 22.0 1.6 20.5 1.2 0.0 1.1 0.7 0.0 0.7 20.2 1.6 18.6 July 13.3 1.8 11.5 1.2 0.0 1.2 1.3 0.3 1.0 10.9 1.5 9.3 Aug. 2.5 6.6 -4.2 0.0 0.1 -0.1 1.0 1.4 -0.5 1.5 5.1 -3.6 Sep. 4.7 2.5 2.2 2.6 0.0 2.6 0.4 0.3 0.1 1.6 2.1 -0.5 Oct. 27.2 8.0 19.1 0.2 3.2 -3.0 16.1 0.5 15.6 10.8 4.3 6.5 Nov. 6.8 3.3 3.5 0.9 0.0 0.9 1.0 1.3 -0.3 4.9 2.0 2.9 Dec. 9.5 4.6 4.9 0.9 0.0 0.9 0.7 2.2 -1.5 7.9 2.5 5.52008 Jan. 3.6 1.4 2.3 0.1 0.0 0.1 0.4 0.7 -0.2 3.1 0.7 2.4 Feb. 2.8 1.9 0.9 1.0 0.0 1.0 0.1 0.3 -0.2 1.7 1.6 0.1 Mar. 6.4 6.0 0.3 5.9 0.0 5.9 0.0 0.5 -0.4 0.4 5.6 -5.1 Apr. 2.0 3.0 -0.9 1.1 0.0 1.1 0.1 0.5 -0.3 0.8 2.5 -1.7 May 7.3 6.0 1.4 4.1 0.1 4.1 1.5 0.3 1.2 1.7 5.6 -3.9 June 3.9 4.8 -0.9 1.3 0.0 1.3 0.5 0.1 0.4 2.1 4.7 -2.6 July 12.7 3.4 9.4 6.7 0.0 6.7 1.5 0.5 1.0 4.5 2.9 1.6 Aug. 1.5 3.0 -1.4 0.3 0.0 0.3 0.1 0.0 0.1 1.1 3.0 -1.9 Sep. 7.8 2.8 5.0 7.0 0.0 7.0 0.0 0.1 -0.1 0.8 2.7 -1.9 Oct. 12.8 0.6 12.2 1.4 0.0 1.4 10.7 0.0 10.7 0.8 0.6 0.1 Nov. 10.6 2.9 7.7 8.4 0.5 8.0 0.5 2.1 -1.6 1.7 0.3 1.4 Dec. 9.3 2.6 6.8 0.0 0.0 0.0 1.3 0.0 1.2 8.0 2.5 5.52009 Jan. 6.5 0.5 6.0 5.7 0.0 5.7 0.3 0.0 0.3 0.5 0.4 0.1 Feb. 0.2 0.9 -0.7 0.0 0.0 0.0 0.0 0.1 -0.1 0.2 0.8 -0.6 Mar. 13.6 0.2 13.4 3.6 0.0 3.6 0.1 0.0 0.1 9.9 0.2 9.7 Apr. 3.7 0.3 3.4 1.2 0.0 1.2 0.1 0.0 0.1 2.4 0.3 2.1 May 10.6 0.3 10.3 4.4 0.0 4.4 0.0 0.0 0.0 6.2 0.2 6.0
C21 Gross issues of quoted shares by sector of the issuer(EUR billions; transactions during the month; market values)
0
5
10
15
20
25
30
35
40
1999 2000 2001 2002 2003 2004 2005 2006 2007 20080
5
10
15
20
25
30
35
40
non-financial corporationsMFIsfinancial corporations other than MFIs
Source: ECB.1) For the calculation of the index and the growth rates, see the Technical notes.
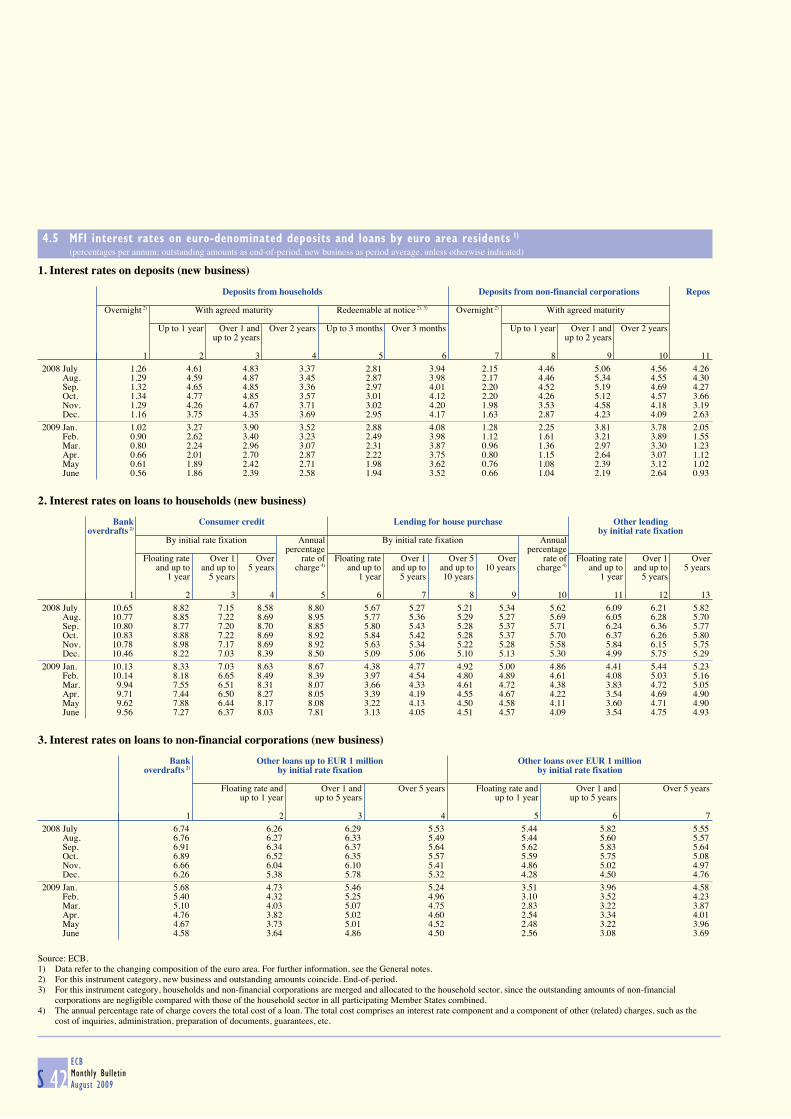
S 42ECB
Monthly Bulletin
August 2009
4.5 MFI interest rates on euro-denominated deposits and loans by euro area residents 1) (percentages per annum; outstanding amounts as end-of-period, new business as period average, unless otherwise indicated)
1. Interest rates on deposits (new business)
Deposits from households Deposits from non-financial corporations Repos
Overnight 2) With agreed maturity Redeemable at notice 2), 3) Overnight 2) With agreed maturity
Up to 1 year Over 1 and Over 2 years Up to 3 months Over 3 months Up to 1 year Over 1 and Over 2 yearsup to 2 years up to 2 years
1 2 3 4 5 6 7 8 9 10 112008 July 1.26 4.61 4.83 3.37 2.81 3.94 2.15 4.46 5.06 4.56 4.26 Aug. 1.29 4.59 4.87 3.45 2.87 3.98 2.17 4.46 5.34 4.55 4.30 Sep. 1.32 4.65 4.85 3.36 2.97 4.01 2.20 4.52 5.19 4.69 4.27 Oct. 1.34 4.77 4.85 3.57 3.01 4.12 2.20 4.26 5.12 4.57 3.66 Nov. 1.29 4.26 4.67 3.71 3.02 4.20 1.98 3.53 4.58 4.18 3.19 Dec. 1.16 3.75 4.35 3.69 2.95 4.17 1.63 2.87 4.23 4.09 2.632009 Jan. 1.02 3.27 3.90 3.52 2.88 4.08 1.28 2.25 3.81 3.78 2.05 Feb. 0.90 2.62 3.40 3.23 2.49 3.98 1.12 1.61 3.21 3.89 1.55 Mar. 0.80 2.24 2.96 3.07 2.31 3.87 0.96 1.36 2.97 3.30 1.23 Apr. 0.66 2.01 2.70 2.87 2.22 3.75 0.80 1.15 2.64 3.07 1.12 May 0.61 1.89 2.42 2.71 1.98 3.62 0.76 1.08 2.39 3.12 1.02 June 0.56 1.86 2.39 2.58 1.94 3.52 0.66 1.04 2.19 2.64 0.93
2. Interest rates on loans to households (new business)
Bank Consumer credit Lending for house purchase Other lending
overdrafts 2) by initial rate fixation By initial rate fixation Annual By initial rate fixation Annual
percentage percentageFloating rate Over 1 Over rate of Floating rate Over 1 Over 5 Over rate of Floating rate Over 1 Over
and up to and up to 5 years charge 4) and up to and up to and up to 10 years charge 4) and up to and up to 5 years1 year 5 years 1 year 5 years 10 years 1 year 5 years
1 2 3 4 5 6 7 8 9 10 11 12 132008 July 10.65 8.82 7.15 8.58 8.80 5.67 5.27 5.21 5.34 5.62 6.09 6.21 5.82 Aug. 10.77 8.85 7.22 8.69 8.95 5.77 5.36 5.29 5.27 5.69 6.05 6.28 5.70 Sep. 10.80 8.77 7.20 8.70 8.85 5.80 5.43 5.28 5.37 5.71 6.24 6.36 5.77 Oct. 10.83 8.88 7.22 8.69 8.92 5.84 5.42 5.28 5.37 5.70 6.37 6.26 5.80 Nov. 10.78 8.98 7.17 8.69 8.92 5.63 5.34 5.22 5.28 5.58 5.84 6.15 5.75 Dec. 10.46 8.22 7.03 8.39 8.50 5.09 5.06 5.10 5.13 5.30 4.99 5.75 5.292009 Jan. 10.13 8.33 7.03 8.63 8.67 4.38 4.77 4.92 5.00 4.86 4.41 5.44 5.23 Feb. 10.14 8.18 6.65 8.49 8.39 3.97 4.54 4.80 4.89 4.61 4.08 5.03 5.16 Mar. 9.94 7.55 6.51 8.31 8.07 3.66 4.33 4.61 4.72 4.38 3.83 4.72 5.05 Apr. 9.71 7.44 6.50 8.27 8.05 3.39 4.19 4.55 4.67 4.22 3.54 4.69 4.90 May 9.62 7.88 6.44 8.17 8.08 3.22 4.13 4.50 4.58 4.11 3.60 4.71 4.90 June 9.56 7.27 6.37 8.03 7.81 3.13 4.05 4.51 4.57 4.09 3.54 4.75 4.93
3. Interest rates on loans to non-financial corporations (new business)
Bank Other loans up to EUR 1 million Other loans over EUR 1 million
overdrafts 2) by initial rate fixation by initial rate fixation
Floating rate and Over 1 and Over 5 years Floating rate and Over 1 and Over 5 yearsup to 1 year up to 5 years up to 1 year up to 5 years
1 2 3 4 5 6 72008 July 6.74 6.26 6.29 5.53 5.44 5.82 5.55 Aug. 6.76 6.27 6.33 5.49 5.44 5.60 5.57 Sep. 6.91 6.34 6.37 5.64 5.62 5.83 5.64 Oct. 6.89 6.52 6.35 5.57 5.59 5.75 5.08 Nov. 6.66 6.04 6.10 5.41 4.86 5.02 4.97 Dec. 6.26 5.38 5.78 5.32 4.28 4.50 4.762009 Jan. 5.68 4.73 5.46 5.24 3.51 3.96 4.58 Feb. 5.40 4.32 5.25 4.96 3.10 3.52 4.23 Mar. 5.10 4.03 5.07 4.75 2.83 3.22 3.87 Apr. 4.76 3.82 5.02 4.60 2.54 3.34 4.01 May 4.67 3.73 5.01 4.52 2.48 3.22 3.96 June 4.58 3.64 4.86 4.50 2.56 3.08 3.69
Source: ECB.1) Data refer to the changing composition of the euro area. For further information, see the General notes.2) For this instrument category, new business and outstanding amounts coincide. End-of-period.3) For this instrument category, households and non-financial corporations are merged and allocated to the household sector, since the outstanding amounts of non-financial
corporations are negligible compared with those of the household sector in all participating Member States combined.4) The annual percentage rate of charge covers the total cost of a loan. The total cost comprises an interest rate component and a component of other (related) charges, such as the
cost of inquiries, administration, preparation of documents, guarantees, etc.
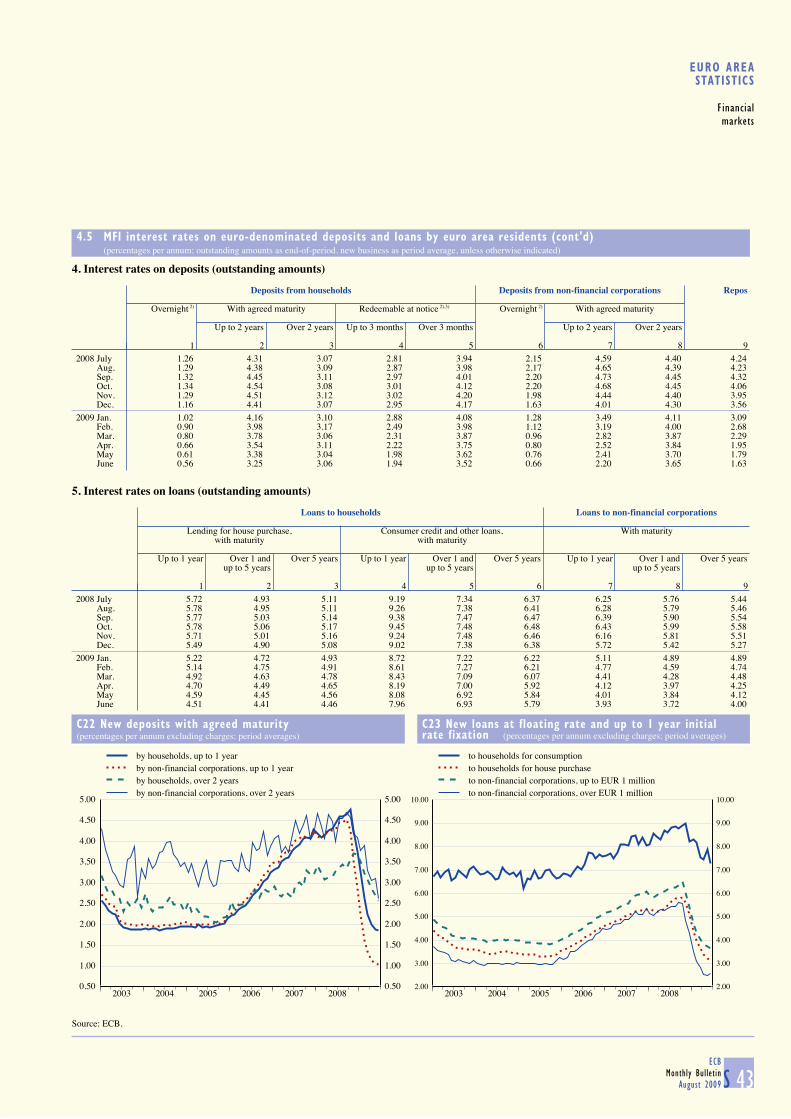
S 43ECB
Monthly Bulletin
August 2009
EURO AREASTATISTICS
Financial
markets
4.5 MFI interest rates on euro-denominated deposits and loans by euro area residents (cont'd) (percentages per annum; outstanding amounts as end-of-period, new business as period average, unless otherwise indicated)
4. Interest rates on deposits (outstanding amounts)
Deposits from households Deposits from non-financial corporations Repos
Overnight 2) With agreed maturity Redeemable at notice 2),3) Overnight 2) With agreed maturity
Up to 2 years Over 2 years Up to 3 months Over 3 months Up to 2 years Over 2 years
1 2 3 4 5 6 7 8 92008 July 1.26 4.31 3.07 2.81 3.94 2.15 4.59 4.40 4.24 Aug. 1.29 4.38 3.09 2.87 3.98 2.17 4.65 4.39 4.23 Sep. 1.32 4.45 3.11 2.97 4.01 2.20 4.73 4.45 4.32 Oct. 1.34 4.54 3.08 3.01 4.12 2.20 4.68 4.45 4.06 Nov. 1.29 4.51 3.12 3.02 4.20 1.98 4.44 4.40 3.95 Dec. 1.16 4.41 3.07 2.95 4.17 1.63 4.01 4.30 3.562009 Jan. 1.02 4.16 3.10 2.88 4.08 1.28 3.49 4.11 3.09 Feb. 0.90 3.98 3.17 2.49 3.98 1.12 3.19 4.00 2.68 Mar. 0.80 3.78 3.06 2.31 3.87 0.96 2.82 3.87 2.29 Apr. 0.66 3.54 3.11 2.22 3.75 0.80 2.52 3.84 1.95 May 0.61 3.38 3.04 1.98 3.62 0.76 2.41 3.70 1.79 June 0.56 3.25 3.06 1.94 3.52 0.66 2.20 3.65 1.63
5. Interest rates on loans (outstanding amounts)
Loans to households Loans to non-financial corporations
Lending for house purchase, Consumer credit and other loans, With maturity
with maturity with maturity
Up to 1 year Over 1 and Over 5 years Up to 1 year Over 1 and Over 5 years Up to 1 year Over 1 and Over 5 yearsup to 5 years up to 5 years up to 5 years
1 2 3 4 5 6 7 8 92008 July 5.72 4.93 5.11 9.19 7.34 6.37 6.25 5.76 5.44 Aug. 5.78 4.95 5.11 9.26 7.38 6.41 6.28 5.79 5.46 Sep. 5.77 5.03 5.14 9.38 7.47 6.47 6.39 5.90 5.54 Oct. 5.78 5.06 5.17 9.45 7.48 6.48 6.43 5.99 5.58 Nov. 5.71 5.01 5.16 9.24 7.48 6.46 6.16 5.81 5.51 Dec. 5.49 4.90 5.08 9.02 7.38 6.38 5.72 5.42 5.272009 Jan. 5.22 4.72 4.93 8.72 7.22 6.22 5.11 4.89 4.89 Feb. 5.14 4.75 4.91 8.61 7.27 6.21 4.77 4.59 4.74 Mar. 4.92 4.63 4.78 8.43 7.09 6.07 4.41 4.28 4.48 Apr. 4.70 4.49 4.65 8.19 7.00 5.92 4.12 3.97 4.25 May 4.59 4.45 4.56 8.08 6.92 5.84 4.01 3.84 4.12 June 4.51 4.41 4.46 7.96 6.93 5.79 3.93 3.72 4.00
C22 New deposits with agreed maturity(percentages per annum excluding charges; period averages)
C23 New loans at floating rate and up to 1 year initialrate fixation (percentages per annum excluding charges; period averages)
0.50
1.00
1.50
2.00
2.50
3.00
3.50
4.00
4.50
5.00
2003 2004 2005 2006 2007 20080.50
1.00
1.50
2.00
2.50
3.00
3.50
4.00
4.50
5.00
by households, up to 1 yearby non-financial corporations, up to 1 yearby households, over 2 yearsby non-financial corporations, over 2 years
2.00
3.00
4.00
5.00
6.00
7.00
8.00
9.00
10.00
2003 2004 2005 2006 2007 20082.00
3.00
4.00
5.00
6.00
7.00
8.00
9.00
10.00
to households for consumptionto households for house purchaseto non-financial corporations, up to EUR 1 millionto non-financial corporations, over EUR 1 million
Source: ECB.
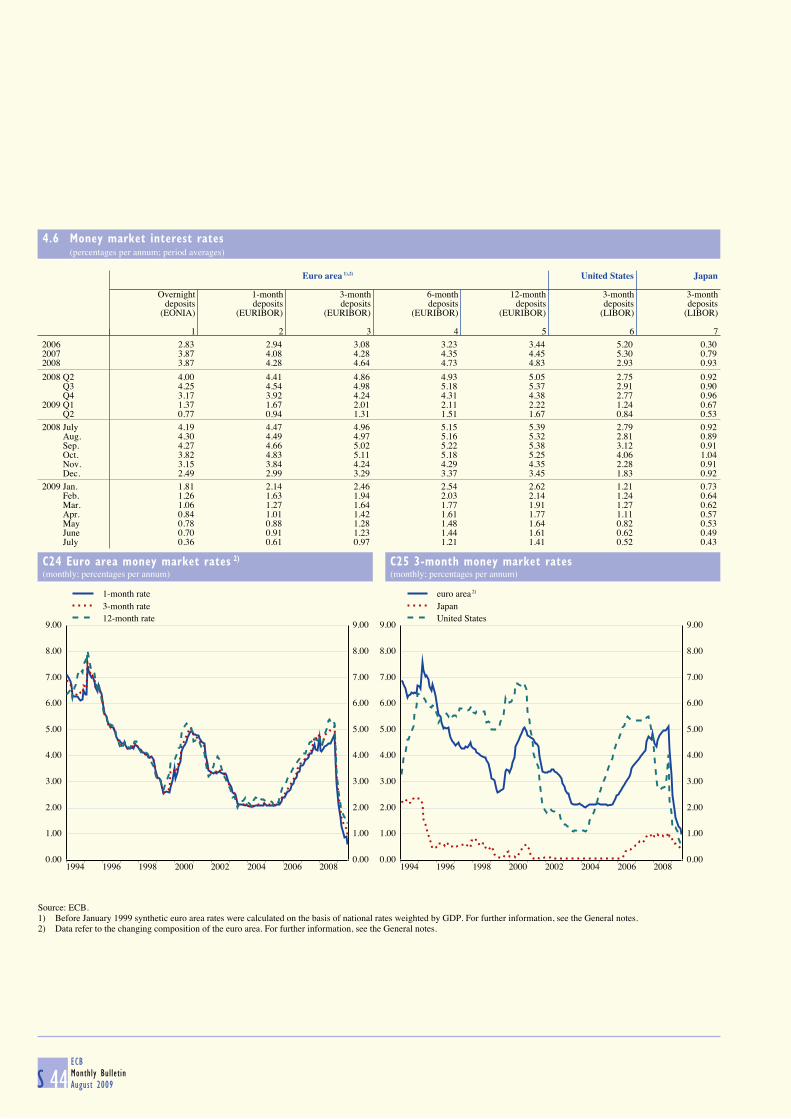
S 44ECB
Monthly Bulletin
August 2009
4.6 Money market interest rates (percentages per annum; period averages)
Euro area 1),2) United States Japan
Overnight 1-month 3-month 6-month 12-month 3-month 3-monthdeposits deposits deposits deposits deposits deposits deposits
(EONIA) (EURIBOR) (EURIBOR) (EURIBOR) (EURIBOR) (LIBOR) (LIBOR)
1 2 3 4 5 6 72006 2.83 2.94 3.08 3.23 3.44 5.20 0.302007 3.87 4.08 4.28 4.35 4.45 5.30 0.792008 3.87 4.28 4.64 4.73 4.83 2.93 0.93
2008 Q2 4.00 4.41 4.86 4.93 5.05 2.75 0.92 Q3 4.25 4.54 4.98 5.18 5.37 2.91 0.90 Q4 3.17 3.92 4.24 4.31 4.38 2.77 0.962009 Q1 1.37 1.67 2.01 2.11 2.22 1.24 0.67 Q2 0.77 0.94 1.31 1.51 1.67 0.84 0.53
2008 July 4.19 4.47 4.96 5.15 5.39 2.79 0.92 Aug. 4.30 4.49 4.97 5.16 5.32 2.81 0.89 Sep. 4.27 4.66 5.02 5.22 5.38 3.12 0.91 Oct. 3.82 4.83 5.11 5.18 5.25 4.06 1.04 Nov. 3.15 3.84 4.24 4.29 4.35 2.28 0.91 Dec. 2.49 2.99 3.29 3.37 3.45 1.83 0.922009 Jan. 1.81 2.14 2.46 2.54 2.62 1.21 0.73 Feb. 1.26 1.63 1.94 2.03 2.14 1.24 0.64 Mar. 1.06 1.27 1.64 1.77 1.91 1.27 0.62 Apr. 0.84 1.01 1.42 1.61 1.77 1.11 0.57 May 0.78 0.88 1.28 1.48 1.64 0.82 0.53 June 0.70 0.91 1.23 1.44 1.61 0.62 0.49 July 0.36 0.61 0.97 1.21 1.41 0.52 0.43
C24 Euro area money market rates 2)
(monthly; percentages per annum)C25 3-month money market rates(monthly; percentages per annum)
0.00
1.00
2.00
3.00
4.00
5.00
6.00
7.00
8.00
9.00
1994 1996 1998 2000 2002 2004 2006 20080.00
1.00
2.00
3.00
4.00
5.00
6.00
7.00
8.00
9.00
1-month rate3-month rate12-month rate
0.00
1.00
2.00
3.00
4.00
5.00
6.00
7.00
8.00
9.00
1994 1996 1998 2000 2002 2004 2006 20080.00
1.00
2.00
3.00
4.00
5.00
6.00
7.00
8.00
9.00
euro areaJapanUnited States
Source: ECB.1) Before January 1999 synthetic euro area rates were calculated on the basis of national rates weighted by GDP. For further information, see the General notes.2) Data refer to the changing composition of the euro area. For further information, see the General notes.
2)
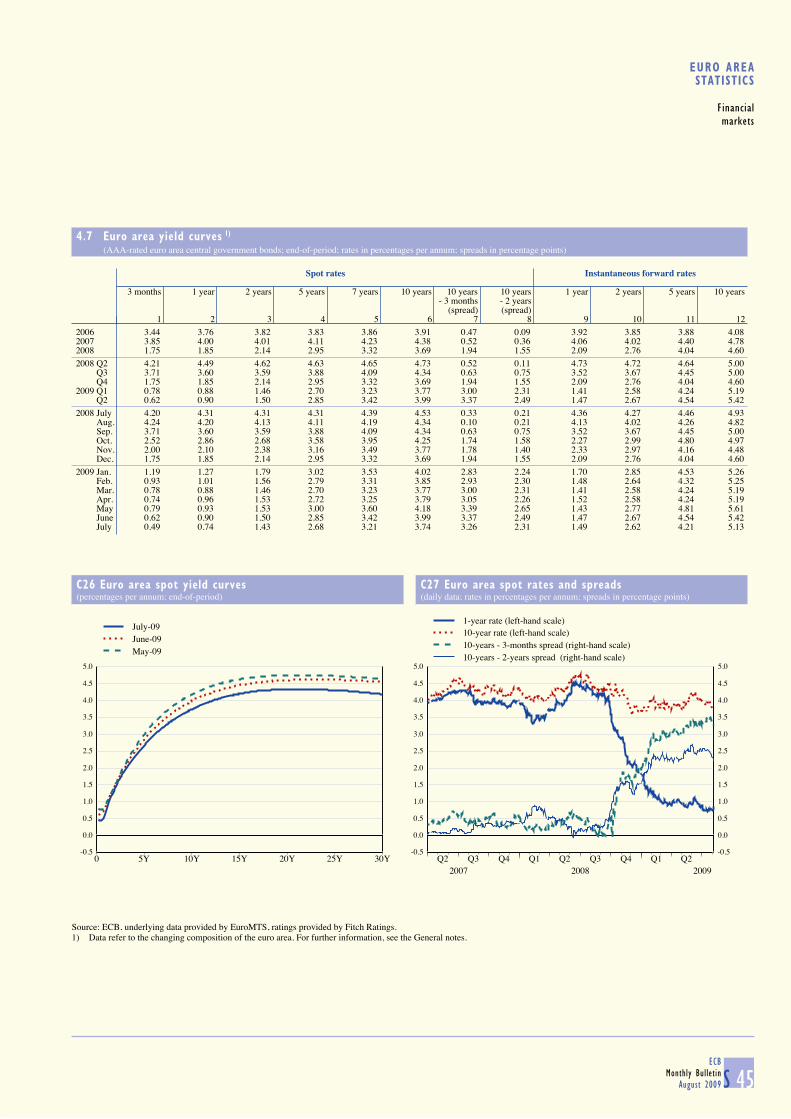
S 45ECB
Monthly Bulletin
August 2009
EURO AREASTATISTICS
Financial
markets
4.7 Euro area yield curves 1)
(AAA-rated euro area central government bonds; end-of-period; rates in percentages per annum; spreads in percentage points)
Spot rates Instantaneous forward rates
3 months 1 year 2 years 5 years 7 years 10 years 10 years 10 years 1 year 2 years 5 years 10 years- 3 months - 2 years
(spread) (spread)1 2 3 4 5 6 7 8 9 10 11 12
2006 3.44 3.76 3.82 3.83 3.86 3.91 0.47 0.09 3.92 3.85 3.88 4.082007 3.85 4.00 4.01 4.11 4.23 4.38 0.52 0.36 4.06 4.02 4.40 4.782008 1.75 1.85 2.14 2.95 3.32 3.69 1.94 1.55 2.09 2.76 4.04 4.602008 Q2 4.21 4.49 4.62 4.63 4.65 4.73 0.52 0.11 4.73 4.72 4.64 5.00 Q3 3.71 3.60 3.59 3.88 4.09 4.34 0.63 0.75 3.52 3.67 4.45 5.00 Q4 1.75 1.85 2.14 2.95 3.32 3.69 1.94 1.55 2.09 2.76 4.04 4.602009 Q1 0.78 0.88 1.46 2.70 3.23 3.77 3.00 2.31 1.41 2.58 4.24 5.19 Q2 0.62 0.90 1.50 2.85 3.42 3.99 3.37 2.49 1.47 2.67 4.54 5.422008 July 4.20 4.31 4.31 4.31 4.39 4.53 0.33 0.21 4.36 4.27 4.46 4.93 Aug. 4.24 4.20 4.13 4.11 4.19 4.34 0.10 0.21 4.13 4.02 4.26 4.82 Sep. 3.71 3.60 3.59 3.88 4.09 4.34 0.63 0.75 3.52 3.67 4.45 5.00 Oct. 2.52 2.86 2.68 3.58 3.95 4.25 1.74 1.58 2.27 2.99 4.80 4.97 Nov. 2.00 2.10 2.38 3.16 3.49 3.77 1.78 1.40 2.33 2.97 4.16 4.48 Dec. 1.75 1.85 2.14 2.95 3.32 3.69 1.94 1.55 2.09 2.76 4.04 4.602009 Jan. 1.19 1.27 1.79 3.02 3.53 4.02 2.83 2.24 1.70 2.85 4.53 5.26 Feb. 0.93 1.01 1.56 2.79 3.31 3.85 2.93 2.30 1.48 2.64 4.32 5.25 Mar. 0.78 0.88 1.46 2.70 3.23 3.77 3.00 2.31 1.41 2.58 4.24 5.19 Apr. 0.74 0.96 1.53 2.72 3.25 3.79 3.05 2.26 1.52 2.58 4.24 5.19 May 0.79 0.93 1.53 3.00 3.60 4.18 3.39 2.65 1.43 2.77 4.81 5.61 June 0.62 0.90 1.50 2.85 3.42 3.99 3.37 2.49 1.47 2.67 4.54 5.42 July 0.49 0.74 1.43 2.68 3.21 3.74 3.26 2.31 1.49 2.62 4.21 5.13
C26 Euro area spot yield curves(percentages per annum; end-of-period)
C27 Euro area spot rates and spreads(daily data; rates in percentages per annum; spreads in percentage points)
-0.5
0.0
0.5
1.0
1.5
2.0
2.5
3.0
3.5
4.0
4.5
5.0
0 5Y 10Y 15Y 20Y 25Y 30Y
July-09June-09May-09
-0.5
0.0
0.5
1.0
1.5
2.0
2.5
3.0
3.5
4.0
4.5
5.0
Q2 Q3 Q4 Q1 Q2 Q3 Q4 Q1 Q22007 2008 2009
-0.5
0.0
0.5
1.0
1.5
2.0
2.5
3.0
3.5
4.0
4.5
5.0
1-year rate (left-hand scale)10-year rate (left-hand scale)10-years - 3-months spread (right-hand scale)10-years - 2-years spread (right-hand scale)
Source: ECB, underlying data provided by EuroMTS, ratings provided by Fitch Ratings.1) Data refer to the changing composition of the euro area. For further information, see the General notes.
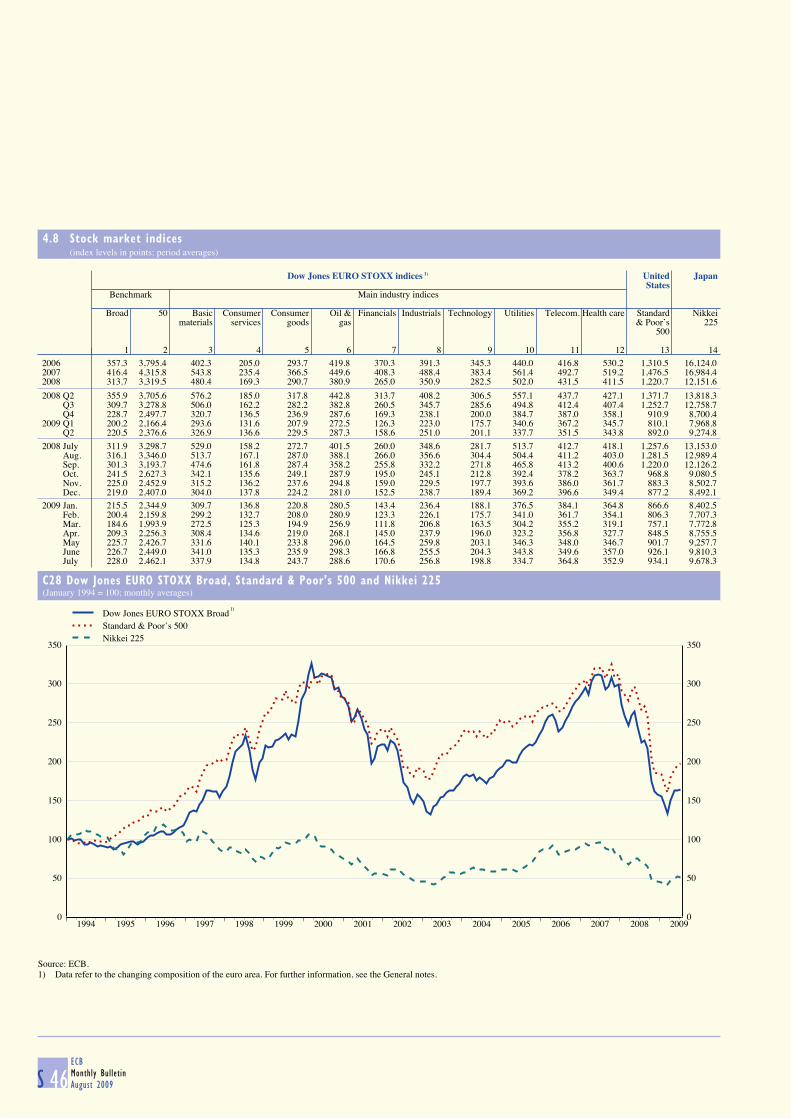
S 46ECB
Monthly Bulletin
August 2009
4.8 Stock market indices (index levels in points; period averages)
Dow Jones EURO STOXX indices 1) United Japan
States Benchmark Main industry indices
Broad 50 Basic Consumer Consumer Oil & Financials Industrials Technology Utilities Telecom. Health care Standard Nikkeimaterials services goods gas & Poor’s 225
500
1 2 3 4 5 6 7 8 9 10 11 12 13 142006 357.3 3,795.4 402.3 205.0 293.7 419.8 370.3 391.3 345.3 440.0 416.8 530.2 1,310.5 16,124.02007 416.4 4,315.8 543.8 235.4 366.5 449.6 408.3 488.4 383.4 561.4 492.7 519.2 1,476.5 16,984.42008 313.7 3,319.5 480.4 169.3 290.7 380.9 265.0 350.9 282.5 502.0 431.5 411.5 1,220.7 12,151.6
2008 Q2 355.9 3,705.6 576.2 185.0 317.8 442.8 313.7 408.2 306.5 557.1 437.7 427.1 1,371.7 13,818.3 Q3 309.7 3,278.8 506.0 162.2 282.2 382.8 260.5 345.7 285.6 494.8 412.4 407.4 1,252.7 12,758.7 Q4 228.7 2,497.7 320.7 136.5 236.9 287.6 169.3 238.1 200.0 384.7 387.0 358.1 910.9 8,700.42009 Q1 200.2 2,166.4 293.6 131.6 207.9 272.5 126.3 223.0 175.7 340.6 367.2 345.7 810.1 7,968.8 Q2 220.5 2,376.6 326.9 136.6 229.5 287.3 158.6 251.0 201.1 337.7 351.5 343.8 892.0 9,274.8
2008 July 311.9 3,298.7 529.0 158.2 272.7 401.5 260.0 348.6 281.7 513.7 412.7 418.1 1,257.6 13,153.0 Aug. 316.1 3,346.0 513.7 167.1 287.0 388.1 266.0 356.6 304.4 504.4 411.2 403.0 1,281.5 12,989.4 Sep. 301.3 3,193.7 474.6 161.8 287.4 358.2 255.8 332.2 271.8 465.8 413.2 400.6 1,220.0 12,126.2 Oct. 241.5 2,627.3 342.1 135.6 249.1 287.9 195.0 245.1 212.8 392.4 378.2 363.7 968.8 9,080.5 Nov. 225.0 2,452.9 315.2 136.2 237.6 294.8 159.0 229.5 197.7 393.6 386.0 361.7 883.3 8,502.7 Dec. 219.0 2,407.0 304.0 137.8 224.2 281.0 152.5 238.7 189.4 369.2 396.6 349.4 877.2 8,492.12009 Jan. 215.5 2,344.9 309.7 136.8 220.8 280.5 143.4 236.4 188.1 376.5 384.1 364.8 866.6 8,402.5 Feb. 200.4 2,159.8 299.2 132.7 208.0 280.9 123.3 226.1 175.7 341.0 361.7 354.1 806.3 7,707.3 Mar. 184.6 1,993.9 272.5 125.3 194.9 256.9 111.8 206.8 163.5 304.2 355.2 319.1 757.1 7,772.8 Apr. 209.3 2,256.3 308.4 134.6 219.0 268.1 145.0 237.9 196.0 323.2 356.8 327.7 848.5 8,755.5 May 225.7 2,426.7 331.6 140.1 233.8 296.0 164.5 259.8 203.1 346.3 348.0 346.7 901.7 9,257.7 June 226.7 2,449.0 341.0 135.3 235.9 298.3 166.8 255.5 204.3 343.8 349.6 357.0 926.1 9,810.3 July 228.0 2,462.1 337.9 134.8 243.7 288.6 170.6 256.8 198.8 334.7 364.8 352.9 934.1 9,678.3
C28 Dow Jones EURO STOXX Broad, Standard & Poor's 500 and Nikkei 225(January 1994 = 100; monthly averages)
0
50
100
150
200
250
300
350
1994 1995 1996 1997 1998 1999 2000 2001 2002 2003 2004 2005 2006 2007 2008 20090
50
100
150
200
250
300
350
Dow Jones EURO STOXX BroadStandard & Poor’s 500Nikkei 225
Source: ECB.1) Data refer to the changing composition of the euro area. For further information, see the General notes.
1)
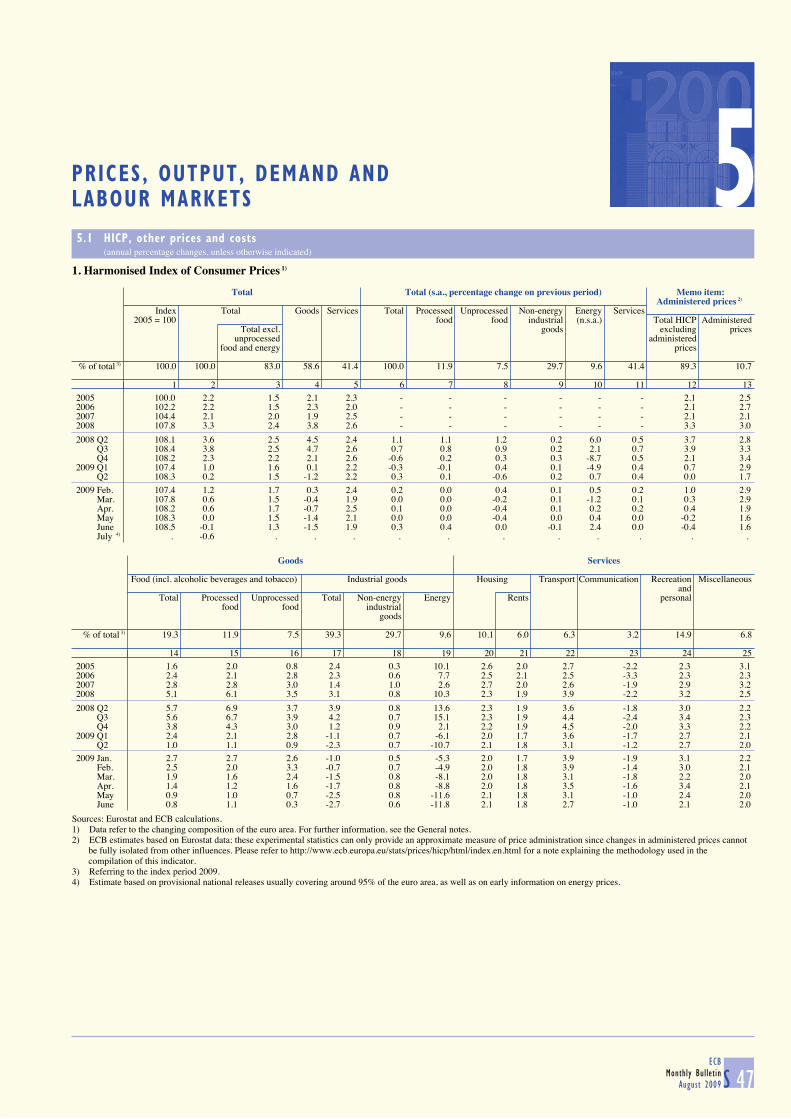
S 47ECB
Monthly Bulletin
August 2009
5PRICES, OUTPUT, DEMAND AND LABOUR MARKETS
5.1 HICP, other prices and costs (annual percentage changes, unless otherwise indicated)
1. Harmonised Index of Consumer Prices 1)
Total Total (s.a., percentage change on previous period) Memo item: Administered prices 2)
Index Total Goods Services Total Processed Unprocessed Non-energy Energy Services2005 = 100 food food industrial (n.s.a.) Total HICP Administered
Total excl. goods excluding pricesunprocessed administered
food and energy prices
% of total 3) 100.0 100.0 83.0 58.6 41.4 100.0 11.9 7.5 29.7 9.6 41.4 89.3 10.7
1 2 3 4 5 6 7 8 9 10 11 12 132005 100.0 2.2 1.5 2.1 2.3 - - - - - - 2.1 2.52006 102.2 2.2 1.5 2.3 2.0 - - - - - - 2.1 2.72007 104.4 2.1 2.0 1.9 2.5 - - - - - - 2.1 2.12008 107.8 3.3 2.4 3.8 2.6 - - - - - - 3.3 3.0
2008 Q2 108.1 3.6 2.5 4.5 2.4 1.1 1.1 1.2 0.2 6.0 0.5 3.7 2.8 Q3 108.4 3.8 2.5 4.7 2.6 0.7 0.8 0.9 0.2 2.1 0.7 3.9 3.3 Q4 108.2 2.3 2.2 2.1 2.6 -0.6 0.2 0.3 0.3 -8.7 0.5 2.1 3.42009 Q1 107.4 1.0 1.6 0.1 2.2 -0.3 -0.1 0.4 0.1 -4.9 0.4 0.7 2.9 Q2 108.3 0.2 1.5 -1.2 2.2 0.3 0.1 -0.6 0.2 0.7 0.4 0.0 1.7
2009 Feb. 107.4 1.2 1.7 0.3 2.4 0.2 0.0 0.4 0.1 0.5 0.2 1.0 2.9 Mar. 107.8 0.6 1.5 -0.4 1.9 0.0 0.0 -0.2 0.1 -1.2 0.1 0.3 2.9 Apr. 108.2 0.6 1.7 -0.7 2.5 0.1 0.0 -0.4 0.1 0.2 0.2 0.4 1.9 May 108.3 0.0 1.5 -1.4 2.1 0.0 0.0 -0.4 0.0 0.4 0.0 -0.2 1.6 June 108.5 -0.1 1.3 -1.5 1.9 0.3 0.4 0.0 -0.1 2.4 0.0 -0.4 1.6 July 4) . -0.6 . . . . . . . . . . .
Goods Services
Food (incl. alcoholic beverages and tobacco) Industrial goods Housing Transport Communication Recreation Miscellaneous
andTotal Processed Unprocessed Total Non-energy Energy Rents personal
food food industrialgoods
% of total 3) 19.3 11.9 7.5 39.3 29.7 9.6 10.1 6.0 6.3 3.2 14.9 6.8
14 15 16 17 18 19 20 21 22 23 24 252005 1.6 2.0 0.8 2.4 0.3 10.1 2.6 2.0 2.7 -2.2 2.3 3.12006 2.4 2.1 2.8 2.3 0.6 7.7 2.5 2.1 2.5 -3.3 2.3 2.32007 2.8 2.8 3.0 1.4 1.0 2.6 2.7 2.0 2.6 -1.9 2.9 3.22008 5.1 6.1 3.5 3.1 0.8 10.3 2.3 1.9 3.9 -2.2 3.2 2.5
2008 Q2 5.7 6.9 3.7 3.9 0.8 13.6 2.3 1.9 3.6 -1.8 3.0 2.2 Q3 5.6 6.7 3.9 4.2 0.7 15.1 2.3 1.9 4.4 -2.4 3.4 2.3 Q4 3.8 4.3 3.0 1.2 0.9 2.1 2.2 1.9 4.5 -2.0 3.3 2.22009 Q1 2.4 2.1 2.8 -1.1 0.7 -6.1 2.0 1.7 3.6 -1.7 2.7 2.1 Q2 1.0 1.1 0.9 -2.3 0.7 -10.7 2.1 1.8 3.1 -1.2 2.7 2.0
2009 Jan. 2.7 2.7 2.6 -1.0 0.5 -5.3 2.0 1.7 3.9 -1.9 3.1 2.2 Feb. 2.5 2.0 3.3 -0.7 0.7 -4.9 2.0 1.8 3.9 -1.4 3.0 2.1 Mar. 1.9 1.6 2.4 -1.5 0.8 -8.1 2.0 1.8 3.1 -1.8 2.2 2.0 Apr. 1.4 1.2 1.6 -1.7 0.8 -8.8 2.0 1.8 3.5 -1.6 3.4 2.1 May 0.9 1.0 0.7 -2.5 0.8 -11.6 2.1 1.8 3.1 -1.0 2.4 2.0 June 0.8 1.1 0.3 -2.7 0.6 -11.8 2.1 1.8 2.7 -1.0 2.1 2.0
Sources: Eurostat and ECB calculations.1) Data refer to the changing composition of the euro area. For further information, see the General notes.2) ECB estimates based on Eurostat data; these experimental statistics can only provide an approximate measure of price administration since changes in administered prices cannot be fully isolated from other influences. Please refer to http://www.ecb.europa.eu/stats/prices/hicp/html/index.en.html for a note explaining the methodology used in the compilation of this indicator.3) Referring to the index period 2009.4) Estimate based on provisional national releases usually covering around 95% of the euro area, as well as on early information on energy prices.
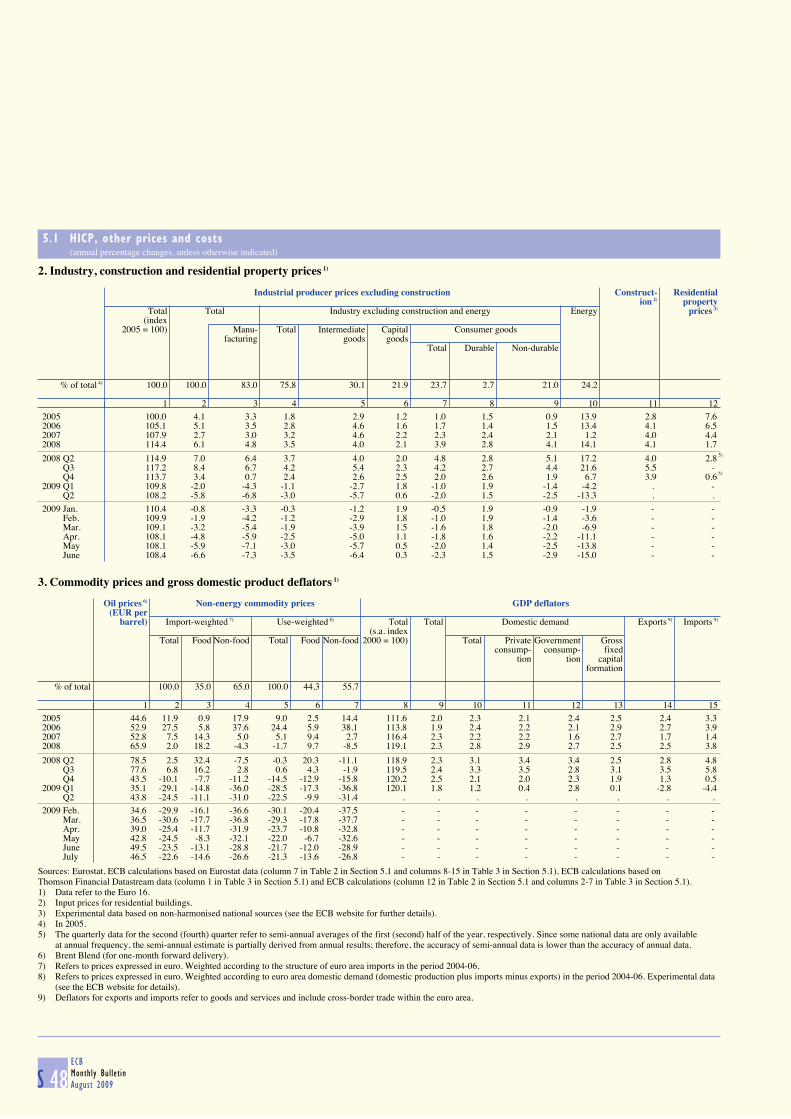
S 48ECB
Monthly Bulletin
August 2009
5.1 HICP, other prices and costs (annual percentage changes, unless otherwise indicated)
2. Industry, construction and residential property prices 1)
Industrial producer prices excluding construction Construct- Residential
ion 2) propertyTotal Total Industry excluding construction and energy Energy prices 3)
(index 2005 = 100) Manu- Total Intermediate Capital Consumer goods
facturing goods goodsTotal Durable Non-durable
% of total 4) 100.0 100.0 83.0 75.8 30.1 21.9 23.7 2.7 21.0 24.2
1 2 3 4 5 6 7 8 9 10 11 122005 100.0 4.1 3.3 1.8 2.9 1.2 1.0 1.5 0.9 13.9 2.8 7.62006 105.1 5.1 3.5 2.8 4.6 1.6 1.7 1.4 1.5 13.4 4.1 6.52007 107.9 2.7 3.0 3.2 4.6 2.2 2.3 2.4 2.1 1.2 4.0 4.42008 114.4 6.1 4.8 3.5 4.0 2.1 3.9 2.8 4.1 14.1 4.1 1.7
2008 Q2 114.9 7.0 6.4 3.7 4.0 2.0 4.8 2.8 5.1 17.2 4.0 2.8 5)
Q3 117.2 8.4 6.7 4.2 5.4 2.3 4.2 2.7 4.4 21.6 5.5 - Q4 113.7 3.4 0.7 2.4 2.6 2.5 2.0 2.6 1.9 6.7 3.9 0.6 5)
2009 Q1 109.8 -2.0 -4.3 -1.1 -2.7 1.8 -1.0 1.9 -1.4 -4.2 . - Q2 108.2 -5.8 -6.8 -3.0 -5.7 0.6 -2.0 1.5 -2.5 -13.3 . .
2009 Jan. 110.4 -0.8 -3.3 -0.3 -1.2 1.9 -0.5 1.9 -0.9 -1.9 - - Feb. 109.9 -1.9 -4.2 -1.2 -2.9 1.8 -1.0 1.9 -1.4 -3.6 - - Mar. 109.1 -3.2 -5.4 -1.9 -3.9 1.5 -1.6 1.8 -2.0 -6.9 - - Apr. 108.1 -4.8 -5.9 -2.5 -5.0 1.1 -1.8 1.6 -2.2 -11.1 - - May 108.1 -5.9 -7.1 -3.0 -5.7 0.5 -2.0 1.4 -2.5 -13.8 - - June 108.4 -6.6 -7.3 -3.5 -6.4 0.3 -2.3 1.5 -2.9 -15.0 - -
3. Commodity prices and gross domestic product deflators 1)
Oil prices 6) Non-energy commodity prices GDP deflators
(EUR per barrel) Import-weighted 7) Use-weighted 8) Total Total Domestic demand Exports 9) Imports 9)
(s.a. indexTotal Food Non-food Total Food Non-food 2000 = 100) Total Private Government Gross
consump- consump- fixedtion tion capital
formation
% of total 100.0 35.0 65.0 100.0 44.3 55.7
1 2 3 4 5 6 7 8 9 10 11 12 13 14 152005 44.6 11.9 0.9 17.9 9.0 2.5 14.4 111.6 2.0 2.3 2.1 2.4 2.5 2.4 3.32006 52.9 27.5 5.8 37.6 24.4 5.9 38.1 113.8 1.9 2.4 2.2 2.1 2.9 2.7 3.92007 52.8 7.5 14.3 5.0 5.1 9.4 2.7 116.4 2.3 2.2 2.2 1.6 2.7 1.7 1.42008 65.9 2.0 18.2 -4.3 -1.7 9.7 -8.5 119.1 2.3 2.8 2.9 2.7 2.5 2.5 3.8
2008 Q2 78.5 2.5 32.4 -7.5 -0.3 20.3 -11.1 118.9 2.3 3.1 3.4 3.4 2.5 2.8 4.8 Q3 77.6 6.8 16.2 2.8 0.6 4.3 -1.9 119.5 2.4 3.3 3.5 2.8 3.1 3.5 5.8 Q4 43.5 -10.1 -7.7 -11.2 -14.5 -12.9 -15.8 120.2 2.5 2.1 2.0 2.3 1.9 1.3 0.52009 Q1 35.1 -29.1 -14.8 -36.0 -28.5 -17.3 -36.8 120.1 1.8 1.2 0.4 2.8 0.1 -2.8 -4.4 Q2 43.8 -24.5 -11.1 -31.0 -22.5 -9.9 -31.4 . . . . . . . .
2009 Feb. 34.6 -29.9 -16.1 -36.6 -30.1 -20.4 -37.5 - - - - - - - - Mar. 36.5 -30.6 -17.7 -36.8 -29.3 -17.8 -37.7 - - - - - - - - Apr. 39.0 -25.4 -11.7 -31.9 -23.7 -10.8 -32.8 - - - - - - - - May 42.8 -24.5 -8.3 -32.1 -22.0 -6.7 -32.6 - - - - - - - - June 49.5 -23.5 -13.1 -28.8 -21.7 -12.0 -28.9 - - - - - - - - July 46.5 -22.6 -14.6 -26.6 -21.3 -13.6 -26.8 - - - - - - - -
Sources: Eurostat, ECB calculations based on Eurostat data (column 7 in Table 2 in Section 5.1 and columns 8-15 in Table 3 in Section 5.1), ECB calculations based onThomson Financial Datastream data (column 1 in Table 3 in Section 5.1) and ECB calculations (column 12 in Table 2 in Section 5.1 and columns 2-7 in Table 3 in Section 5.1).1) Data refer to the Euro 16.2) Input prices for residential buildings.3) Experimental data based on non-harmonised national sources (see the ECB website for further details).4) In 2005.5) The quarterly data for the second (fourth) quarter refer to semi-annual averages of the first (second) half of the year, respectively. Since some national data are only available
at annual frequency, the semi-annual estimate is partially derived from annual results; therefore, the accuracy of semi-annual data is lower than the accuracy of annual data.6) Brent Blend (for one-month forward delivery).7) Refers to prices expressed in euro. Weighted according to the structure of euro area imports in the period 2004-06.8) Refers to prices expressed in euro. Weighted according to euro area domestic demand (domestic production plus imports minus exports) in the period 2004-06. Experimental data
(see the ECB website for details).9) Deflators for exports and imports refer to goods and services and include cross-border trade within the euro area.
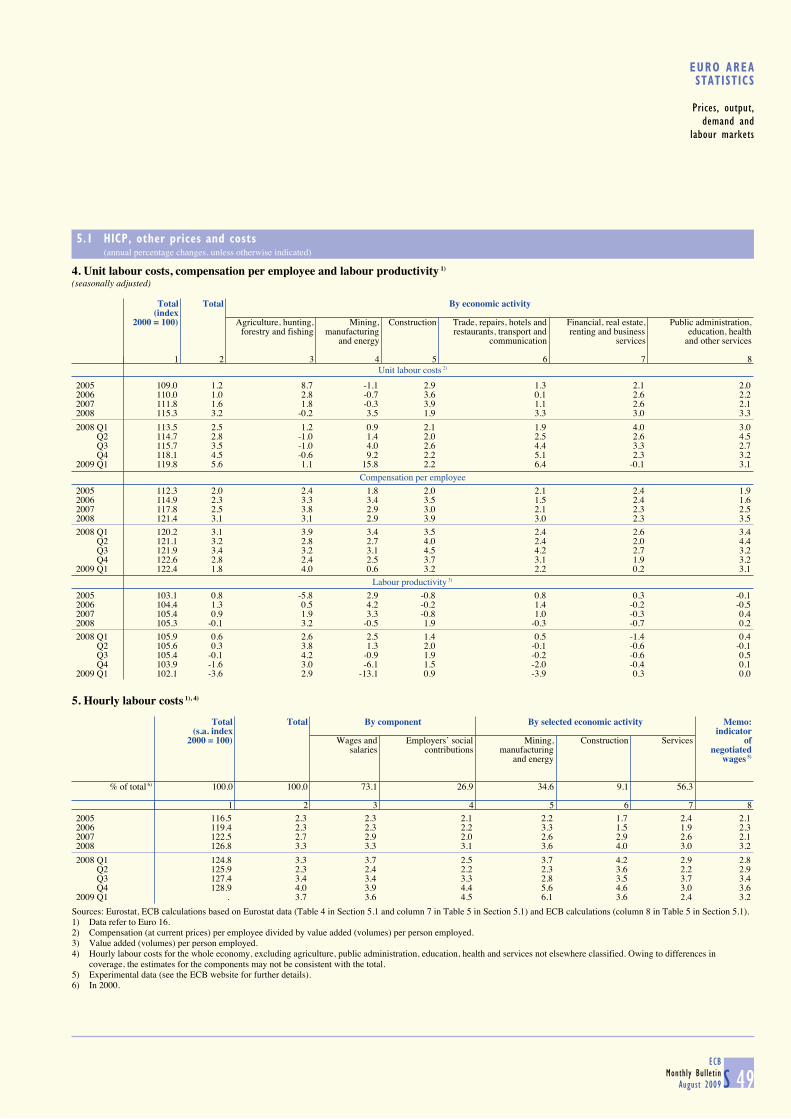
S 49ECB
Monthly Bulletin
August 2009
EURO AREASTATISTICS
Prices, output,
demand and
labour markets
5.1 HICP, other prices and costs (annual percentage changes, unless otherwise indicated)
4. Unit labour costs, compensation per employee and labour productivity 1) (seasonally adjusted)
Unit labour costs 2)
Total Total By economic activity
(index2000 = 100) Agriculture, hunting, Mining, Construction Trade, repairs, hotels and Financial, real estate, Public administration,
forestry and fishing manufacturing restaurants, transport and renting and business education, healthand energy communication services and other services
1 2 3 4 5 6 7 8
2005 109.0 1.2 8.7 -1.1 2.9 1.3 2.1 2.02006 110.0 1.0 2.8 -0.7 3.6 0.1 2.6 2.22007 111.8 1.6 1.8 -0.3 3.9 1.1 2.6 2.12008 115.3 3.2 -0.2 3.5 1.9 3.3 3.0 3.3
2008 Q1 113.5 2.5 1.2 0.9 2.1 1.9 4.0 3.0 Q2 114.7 2.8 -1.0 1.4 2.0 2.5 2.6 4.5 Q3 115.7 3.5 -1.0 4.0 2.6 4.4 3.3 2.7 Q4 118.1 4.5 -0.6 9.2 2.2 5.1 2.3 3.22009 Q1 119.8 5.6 1.1 15.8 2.2 6.4 -0.1 3.1
Compensation per employee
2005 112.3 2.0 2.4 1.8 2.0 2.1 2.4 1.92006 114.9 2.3 3.3 3.4 3.5 1.5 2.4 1.62007 117.8 2.5 3.8 2.9 3.0 2.1 2.3 2.52008 121.4 3.1 3.1 2.9 3.9 3.0 2.3 3.5
2008 Q1 120.2 3.1 3.9 3.4 3.5 2.4 2.6 3.4 Q2 121.1 3.2 2.8 2.7 4.0 2.4 2.0 4.4 Q3 121.9 3.4 3.2 3.1 4.5 4.2 2.7 3.2 Q4 122.6 2.8 2.4 2.5 3.7 3.1 1.9 3.22009 Q1 122.4 1.8 4.0 0.6 3.2 2.2 0.2 3.1
Labour productivity 3)
2005 103.1 0.8 -5.8 2.9 -0.8 0.8 0.3 -0.12006 104.4 1.3 0.5 4.2 -0.2 1.4 -0.2 -0.52007 105.4 0.9 1.9 3.3 -0.8 1.0 -0.3 0.42008 105.3 -0.1 3.2 -0.5 1.9 -0.3 -0.7 0.2
2008 Q1 105.9 0.6 2.6 2.5 1.4 0.5 -1.4 0.4 Q2 105.6 0.3 3.8 1.3 2.0 -0.1 -0.6 -0.1 Q3 105.4 -0.1 4.2 -0.9 1.9 -0.2 -0.6 0.5 Q4 103.9 -1.6 3.0 -6.1 1.5 -2.0 -0.4 0.12009 Q1 102.1 -3.6 2.9 -13.1 0.9 -3.9 0.3 0.0
5. Hourly labour costs 1), 4)
Total Total By component By selected economic activity Memo:
(s.a. index indicator2000 = 100) Wages and Employers’ social Mining, Construction Services of
salaries contributions manufacturing negotiatedand energy wages 5)
% of total 6) 100.0 100.0 73.1 26.9 34.6 9.1 56.3
1 2 3 4 5 6 7 82005 116.5 2.3 2.3 2.1 2.2 1.7 2.4 2.12006 119.4 2.3 2.3 2.2 3.3 1.5 1.9 2.32007 122.5 2.7 2.9 2.0 2.6 2.9 2.6 2.12008 126.8 3.3 3.3 3.1 3.6 4.0 3.0 3.2
2008 Q1 124.8 3.3 3.7 2.5 3.7 4.2 2.9 2.8 Q2 125.9 2.3 2.4 2.2 2.3 3.6 2.2 2.9 Q3 127.4 3.4 3.4 3.3 2.8 3.5 3.7 3.4 Q4 128.9 4.0 3.9 4.4 5.6 4.6 3.0 3.62009 Q1 . 3.7 3.6 4.5 6.1 3.6 2.4 3.2
Sources: Eurostat, ECB calculations based on Eurostat data (Table 4 in Section 5.1 and column 7 in Table 5 in Section 5.1) and ECB calculations (column 8 in Table 5 in Section 5.1).1) Data refer to Euro 16.2) Compensation (at current prices) per employee divided by value added (volumes) per person employed.3) Value added (volumes) per person employed.4) Hourly labour costs for the whole economy, excluding agriculture, public administration, education, health and services not elsewhere classified. Owing to differences in
coverage, the estimates for the components may not be consistent with the total.5) Experimental data (see the ECB website for further details).6) In 2000.
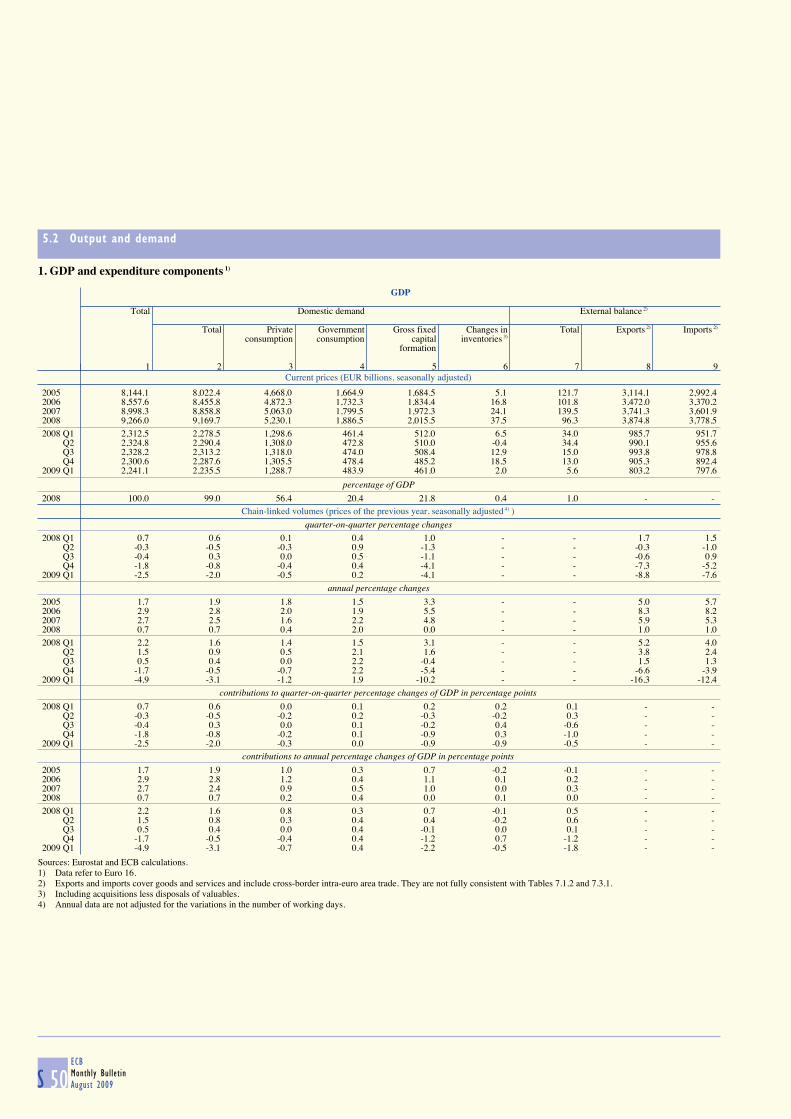
S 50ECB
Monthly Bulletin
August 2009
5.2 Output and demand
1. GDP and expenditure components 1)
Current prices (EUR billions, seasonally adjusted)
GDP
Total Domestic demand External balance 2)
Total Private Government Gross fixed Changes in Total Exports 2) Imports 2)
consumption consumption capital inventories 3)
formation
1 2 3 4 5 6 7 8 9
2005 8,144.1 8,022.4 4,668.0 1,664.9 1,684.5 5.1 121.7 3,114.1 2,992.42006 8,557.6 8,455.8 4,872.3 1,732.3 1,834.4 16.8 101.8 3,472.0 3,370.22007 8,998.3 8,858.8 5,063.0 1,799.5 1,972.3 24.1 139.5 3,741.3 3,601.92008 9,266.0 9,169.7 5,230.1 1,886.5 2,015.5 37.5 96.3 3,874.8 3,778.52008 Q1 2,312.5 2,278.5 1,298.6 461.4 512.0 6.5 34.0 985.7 951.7 Q2 2,324.8 2,290.4 1,308.0 472.8 510.0 -0.4 34.4 990.1 955.6 Q3 2,328.2 2,313.2 1,318.0 474.0 508.4 12.9 15.0 993.8 978.8 Q4 2,300.6 2,287.6 1,305.5 478.4 485.2 18.5 13.0 905.3 892.42009 Q1 2,241.1 2,235.5 1,288.7 483.9 461.0 2.0 5.6 803.2 797.6
percentage of GDP 2008 100.0 99.0 56.4 20.4 21.8 0.4 1.0 - -
Chain-linked volumes (prices of the previous year, seasonally adjusted 4) )
quarter-on-quarter percentage changes
2008 Q1 0.7 0.6 0.1 0.4 1.0 - - 1.7 1.5 Q2 -0.3 -0.5 -0.3 0.9 -1.3 - - -0.3 -1.0 Q3 -0.4 0.3 0.0 0.5 -1.1 - - -0.6 0.9 Q4 -1.8 -0.8 -0.4 0.4 -4.1 - - -7.3 -5.22009 Q1 -2.5 -2.0 -0.5 0.2 -4.1 - - -8.8 -7.6
annual percentage changes
2005 1.7 1.9 1.8 1.5 3.3 - - 5.0 5.72006 2.9 2.8 2.0 1.9 5.5 - - 8.3 8.22007 2.7 2.5 1.6 2.2 4.8 - - 5.9 5.32008 0.7 0.7 0.4 2.0 0.0 - - 1.0 1.0
2008 Q1 2.2 1.6 1.4 1.5 3.1 - - 5.2 4.0 Q2 1.5 0.9 0.5 2.1 1.6 - - 3.8 2.4 Q3 0.5 0.4 0.0 2.2 -0.4 - - 1.5 1.3 Q4 -1.7 -0.5 -0.7 2.2 -5.4 - - -6.6 -3.92009 Q1 -4.9 -3.1 -1.2 1.9 -10.2 - - -16.3 -12.4
contributions to quarter-on-quarter percentage changes of GDP in percentage points
2008 Q1 0.7 0.6 0.0 0.1 0.2 0.2 0.1 - - Q2 -0.3 -0.5 -0.2 0.2 -0.3 -0.2 0.3 - - Q3 -0.4 0.3 0.0 0.1 -0.2 0.4 -0.6 - - Q4 -1.8 -0.8 -0.2 0.1 -0.9 0.3 -1.0 - - 2009 Q1 -2.5 -2.0 -0.3 0.0 -0.9 -0.9 -0.5 - -
contributions to annual percentage changes of GDP in percentage points
2005 1.7 1.9 1.0 0.3 0.7 -0.2 -0.1 - - 2006 2.9 2.8 1.2 0.4 1.1 0.1 0.2 - - 2007 2.7 2.4 0.9 0.5 1.0 0.0 0.3 - - 2008 0.7 0.7 0.2 0.4 0.0 0.1 0.0 - -
2008 Q1 2.2 1.6 0.8 0.3 0.7 -0.1 0.5 - - Q2 1.5 0.8 0.3 0.4 0.4 -0.2 0.6 - - Q3 0.5 0.4 0.0 0.4 -0.1 0.0 0.1 - - Q4 -1.7 -0.5 -0.4 0.4 -1.2 0.7 -1.2 - - 2009 Q1 -4.9 -3.1 -0.7 0.4 -2.2 -0.5 -1.8 - -
Sources: Eurostat and ECB calculations.1) Data refer to Euro 16.2) Exports and imports cover goods and services and include cross-border intra-euro area trade. They are not fully consistent with Tables 7.1.2 and 7.3.1.3) Including acquisitions less disposals of valuables.4) Annual data are not adjusted for the variations in the number of working days.

S 51ECB
Monthly Bulletin
August 2009
EURO AREASTATISTICS
Prices, output,
demand and
labour markets
5.2 Output and demand
2. Value added by economic activity 1)
Current prices (EUR billions, seasonally adjusted)
Gross value added (basic prices) Taxes less
subsidies onTotal Agriculture, Mining, Construction Trade, repairs, Financial, real Public products
hunting, manufacturing hotels and estate, renting administration,forestry and energy restaurants, and business education,
and fishing transport and activities health andactivities communication other services
1 2 3 4 5 6 7 8
2005 7,299.2 144.1 1,482.4 441.7 1,540.5 2,021.2 1,669.4 844.92006 7,643.6 142.0 1,557.3 476.7 1,602.6 2,137.9 1,727.1 914.02007 8,040.2 151.9 1,643.5 514.7 1,672.9 2,261.6 1,795.6 958.12008 8,311.7 148.1 1,672.4 536.8 1,727.2 2,357.3 1,869.9 954.32008 Q1 2,070.6 38.7 424.0 135.2 431.3 583.0 458.4 241.9 Q2 2,085.3 37.2 425.8 134.8 431.0 589.0 467.5 239.6 Q3 2,088.7 36.6 422.2 135.0 434.5 592.5 467.9 239.5 Q4 2,067.2 35.6 400.4 131.8 430.5 592.8 476.2 233.42009 Q1 2,014.1 36.2 361.6 130.8 418.4 587.3 479.8 227.0
percentage of value added 2008 100.0 1.8 20.1 6.5 20.8 28.4 22.5 -
Chain-linked volumes (prices of the previous year, seasonally adjusted 2) )
quarter-on-quarter percentage changes
2008 Q1 0.6 1.6 0.6 1.8 0.7 0.6 0.2 1.5 Q2 -0.1 -0.4 -0.7 -2.1 -0.4 0.5 0.4 -1.3 Q3 -0.4 -0.3 -1.6 -1.8 -0.2 0.0 0.6 -0.4 Q4 -1.7 1.1 -5.7 -1.6 -1.8 -0.6 0.2 -2.12009 Q1 -2.5 -0.2 -8.5 -1.0 -2.9 -0.8 0.1 -2.4
annual percentage changes
2005 1.7 -6.5 1.8 1.8 1.5 2.8 1.3 1.82006 2.9 -1.5 3.9 2.6 3.1 3.7 1.3 3.32007 3.0 0.5 3.5 3.1 3.0 3.7 1.6 0.72008 0.9 1.7 -0.8 -0.5 1.0 1.8 1.4 -0.7
2008 Q1 2.4 1.3 2.9 1.7 3.0 2.6 1.3 0.3 Q2 1.6 1.7 1.4 0.3 1.6 2.4 1.3 0.1 Q3 0.7 2.5 -1.1 -1.2 0.7 1.6 1.5 -1.0 Q4 -1.6 2.0 -7.3 -3.7 -1.7 0.5 1.4 -2.32009 Q1 -4.7 0.2 -15.7 -6.4 -5.2 -1.0 1.3 -6.0
contributions to quarter-on-quarter percentage changes of value added in percentage points
2008 Q1 0.6 0.0 0.1 0.1 0.1 0.2 0.0 - Q2 -0.1 0.0 -0.1 -0.1 -0.1 0.1 0.1 - Q3 -0.4 0.0 -0.3 -0.1 0.0 0.0 0.1 - Q4 -1.7 0.0 -1.2 -0.1 -0.4 -0.2 0.0 - 2009 Q1 -2.5 0.0 -1.6 -0.1 -0.6 -0.2 0.0 -
contributions to annual percentage changes of value added in percentage points
2005 1.7 -0.1 0.4 0.1 0.3 0.8 0.3 - 2006 2.9 0.0 0.8 0.2 0.7 1.0 0.3 - 2007 3.0 0.0 0.7 0.2 0.6 1.0 0.4 - 2008 0.9 0.0 -0.2 0.0 0.2 0.5 0.3 -
2008 Q1 2.4 0.0 0.6 0.1 0.6 0.7 0.3 - Q2 1.6 0.0 0.3 0.0 0.3 0.7 0.3 - Q3 0.7 0.0 -0.2 -0.1 0.1 0.5 0.3 - Q4 -1.6 0.0 -1.5 -0.2 -0.4 0.1 0.3 - 2009 Q1 -4.7 0.0 -3.2 -0.4 -1.1 -0.3 0.3 -
Sources: Eurostat and ECB calculations.1) Data refer to Euro 16.2) Annual data are not adjusted for the variations in the number of working days.
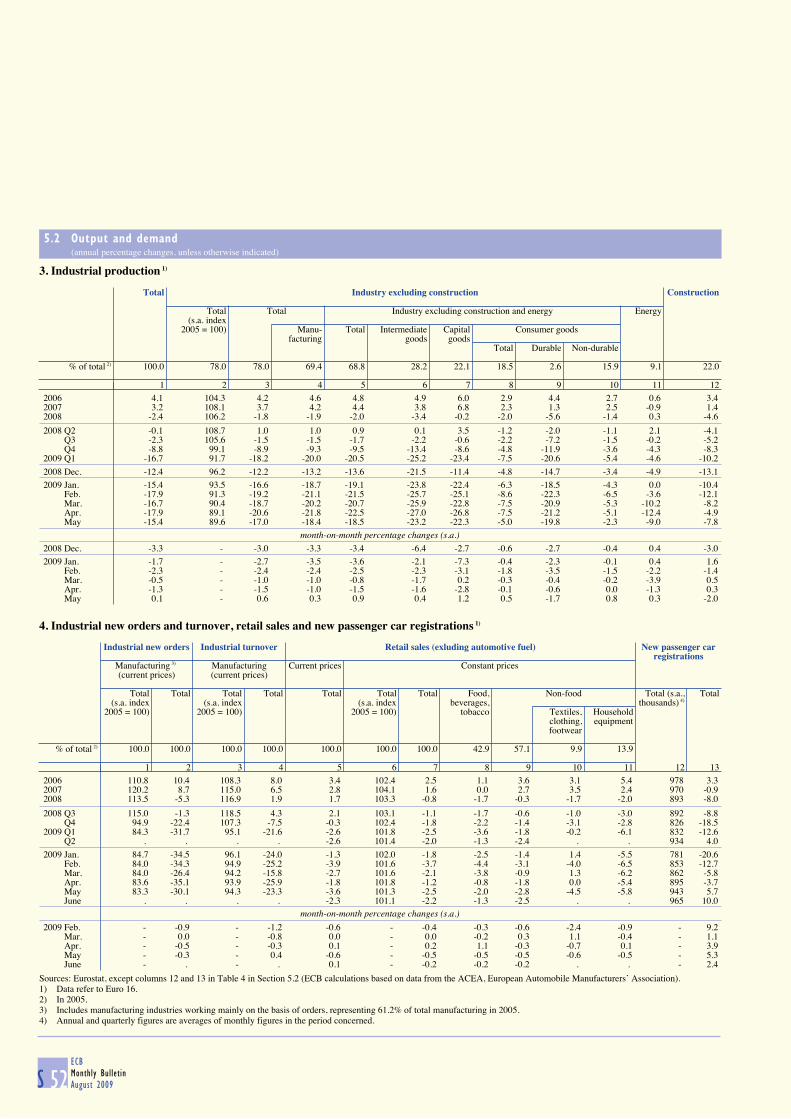
S 52ECB
Monthly Bulletin
August 2009
5.2 Output and demand (annual percentage changes, unless otherwise indicated)
3. Industrial production 1)
Total Industry excluding construction Construction
Total Total Industry excluding construction and energy Energy
(s.a. index 2005 = 100) Manu- Total Intermediate Capital Consumer goods
facturing goods goodsTotal Durable Non-durable
% of total 2) 100.0 78.0 78.0 69.4 68.8 28.2 22.1 18.5 2.6 15.9 9.1 22.0
1 2 3 4 5 6 7 8 9 10 11 122006 4.1 104.3 4.2 4.6 4.8 4.9 6.0 2.9 4.4 2.7 0.6 3.42007 3.2 108.1 3.7 4.2 4.4 3.8 6.8 2.3 1.3 2.5 -0.9 1.42008 -2.4 106.2 -1.8 -1.9 -2.0 -3.4 -0.2 -2.0 -5.6 -1.4 0.3 -4.6
2008 Q2 -0.1 108.7 1.0 1.0 0.9 0.1 3.5 -1.2 -2.0 -1.1 2.1 -4.1 Q3 -2.3 105.6 -1.5 -1.5 -1.7 -2.2 -0.6 -2.2 -7.2 -1.5 -0.2 -5.2 Q4 -8.8 99.1 -8.9 -9.3 -9.5 -13.4 -8.6 -4.8 -11.9 -3.6 -4.3 -8.32009 Q1 -16.7 91.7 -18.2 -20.0 -20.5 -25.2 -23.4 -7.5 -20.6 -5.4 -4.6 -10.2
2008 Dec. -12.4 96.2 -12.2 -13.2 -13.6 -21.5 -11.4 -4.8 -14.7 -3.4 -4.9 -13.12009 Jan. -15.4 93.5 -16.6 -18.7 -19.1 -23.8 -22.4 -6.3 -18.5 -4.3 0.0 -10.4 Feb. -17.9 91.3 -19.2 -21.1 -21.5 -25.7 -25.1 -8.6 -22.3 -6.5 -3.6 -12.1 Mar. -16.7 90.4 -18.7 -20.2 -20.7 -25.9 -22.8 -7.5 -20.9 -5.3 -10.2 -8.2 Apr. -17.9 89.1 -20.6 -21.8 -22.5 -27.0 -26.8 -7.5 -21.2 -5.1 -12.4 -4.9 May -15.4 89.6 -17.0 -18.4 -18.5 -23.2 -22.3 -5.0 -19.8 -2.3 -9.0 -7.8
month-on-month percentage changes (s.a.)
2008 Dec. -3.3 - -3.0 -3.3 -3.4 -6.4 -2.7 -0.6 -2.7 -0.4 0.4 -3.02009 Jan. -1.7 - -2.7 -3.5 -3.6 -2.1 -7.3 -0.4 -2.3 -0.1 0.4 1.6 Feb. -2.3 - -2.4 -2.4 -2.5 -2.3 -3.1 -1.8 -3.5 -1.5 -2.2 -1.4 Mar. -0.5 - -1.0 -1.0 -0.8 -1.7 0.2 -0.3 -0.4 -0.2 -3.9 0.5 Apr. -1.3 - -1.5 -1.0 -1.5 -1.6 -2.8 -0.1 -0.6 0.0 -1.3 0.3 May 0.1 - 0.6 0.3 0.9 0.4 1.2 0.5 -1.7 0.8 0.3 -2.0
4. Industrial new orders and turnover, retail sales and new passenger car registrations 1)
Industrial new orders Industrial turnover Retail sales (exluding automotive fuel) New passenger car
registrations Manufacturing 3) Manufacturing Current prices Constant prices (current prices) (current prices)
Total Total Total Total Total Total Total Food, Non-food Total (s.a., Total
(s.a. index (s.a. index (s.a. index beverages, thousands) 4)
2005 = 100) 2005 = 100) 2005 = 100) tobacco Textiles, Householdclothing, equipmentfootwear
% of total 2) 100.0 100.0 100.0 100.0 100.0 100.0 100.0 42.9 57.1 9.9 13.9
1 2 3 4 5 6 7 8 9 10 11 12 132006 110.8 10.4 108.3 8.0 3.4 102.4 2.5 1.1 3.6 3.1 5.4 978 3.32007 120.2 8.7 115.0 6.5 2.8 104.1 1.6 0.0 2.7 3.5 2.4 970 -0.92008 113.5 -5.3 116.9 1.9 1.7 103.3 -0.8 -1.7 -0.3 -1.7 -2.0 893 -8.0
2008 Q3 115.0 -1.3 118.5 4.3 2.1 103.1 -1.1 -1.7 -0.6 -1.0 -3.0 892 -8.8 Q4 94.9 -22.4 107.3 -7.5 -0.3 102.4 -1.8 -2.2 -1.4 -3.1 -2.8 826 -18.52009 Q1 84.3 -31.7 95.1 -21.6 -2.6 101.8 -2.5 -3.6 -1.8 -0.2 -6.1 832 -12.6 Q2 . . . . -2.6 101.4 -2.0 -1.3 -2.4 . . 934 4.0
2009 Jan. 84.7 -34.5 96.1 -24.0 -1.3 102.0 -1.8 -2.5 -1.4 1.4 -5.5 781 -20.6 Feb. 84.0 -34.3 94.9 -25.2 -3.9 101.6 -3.7 -4.4 -3.1 -4.0 -6.5 853 -12.7 Mar. 84.0 -26.4 94.2 -15.8 -2.7 101.6 -2.1 -3.8 -0.9 1.3 -6.2 862 -5.8 Apr. 83.6 -35.1 93.9 -25.9 -1.8 101.8 -1.2 -0.8 -1.8 0.0 -5.4 895 -3.7 May 83.3 -30.1 94.3 -23.3 -3.6 101.3 -2.5 -2.0 -2.8 -4.5 -5.8 943 5.7 June . . . . -2.3 101.1 -2.2 -1.3 -2.5 . . 965 10.0
month-on-month percentage changes (s.a.)
2009 Feb. - -0.9 - -1.2 -0.6 - -0.4 -0.3 -0.6 -2.4 -0.9 - 9.2 Mar. - 0.0 - -0.8 0.0 - 0.0 -0.2 0.3 1.1 -0.4 - 1.1 Apr. - -0.5 - -0.3 0.1 - 0.2 1.1 -0.3 -0.7 0.1 - 3.9 May - -0.3 - 0.4 -0.6 - -0.5 -0.5 -0.5 -0.6 -0.5 - 5.3 June - . - . 0.1 - -0.2 -0.2 -0.2 . . - 2.4
Sources: Eurostat, except columns 12 and 13 in Table 4 in Section 5.2 (ECB calculations based on data from the ACEA, European Automobile Manufacturers’ Association).1) Data refer to Euro 16.2) In 2005.3) Includes manufacturing industries working mainly on the basis of orders, representing 61.2% of total manufacturing in 2005.4) Annual and quarterly figures are averages of monthly figures in the period concerned.

S 53ECB
Monthly Bulletin
August 2009
EURO AREASTATISTICS
Prices, output,
demand and
labour markets
5.2 Output and demand (percentage balances, 1) unless otherwise indicated; seasonally adjusted)
5. Business and Consumer Surveys
Economic Manufacturing industry Consumer confidence indicatorsentiment
indicator 2) Industrial confidence indicator Capacity Total 4) Financial Economic Unemployment Savings(long-term utilisation 3) situation situation situation over next
average Total 4) Order Stocks of Production (percentages) over next over next over next 12 months= 100) books finished expectations 12 months 12 months 12 months
products
1 2 3 4 5 6 7 8 9 10 112005 98.2 -7 -16 11 6 81.1 -14 -4 -15 28 -92006 106.9 2 0 6 13 83.1 -9 -3 -9 15 -92007 108.9 4 5 5 13 84.1 -5 -2 -4 5 -82008 91.1 -9 -15 11 -2 81.8 -18 -10 -25 23 -14
2008 Q2 97.7 -3 -6 9 7 83.3 -14 -10 -22 10 -14 Q3 89.9 -10 -15 12 -2 82.2 -19 -12 -28 23 -14 Q4 75.6 -25 -36 18 -22 78.1 -27 -11 -34 49 -142009 Q1 65.7 -36 -56 20 -31 72.5 -33 -11 -41 64 -14 Q2 70.2 -33 -62 18 -21 69.9 -28 -9 -34 59 -11
2009 Feb. 65.3 -36 -57 20 -32 - -33 -12 -41 64 -14 Mar. 64.6 -38 -61 21 -32 - -34 -11 -44 69 -13 Apr. 67.3 -35 -60 20 -25 70.3 -31 -10 -38 63 -11 May 70.2 -33 -61 18 -21 - -28 -9 -33 58 -13 June 73.2 -32 -63 16 -16 - -25 -7 -29 55 -9 July 76.0 -30 -61 14 -13 69.5 -23 -6 -23 53 -10
Construction confidence indicator Retail trade confidence indicator Services confidence indicator
Total 4) Order Employment Total 4) Present Volume of Expected Total 4) Business Demand in Demand inbooks expectations business stocks business climate recent the months
situation situation months ahead
12 13 14 15 16 17 18 19 20 21 222005 -7 -12 -2 -7 -12 13 4 11 5 10 182006 1 -4 6 1 3 14 13 18 13 18 242007 0 -8 7 1 4 15 12 19 16 19 232008 -14 -20 -7 -7 -6 16 1 2 -5 4 7
2008 Q2 -10 -17 -3 -3 -1 16 7 8 3 9 13 Q3 -14 -21 -7 -9 -9 17 -1 1 -7 3 6 Q4 -23 -31 -16 -15 -16 17 -13 -12 -20 -9 -62009 Q1 -31 -36 -26 -19 -21 15 -20 -24 -33 -21 -18 Q2 -34 -42 -25 -17 -23 9 -19 -22 -29 -23 -15
2009 Feb. -32 -37 -26 -19 -21 17 -20 -24 -33 -19 -19 Mar. -32 -37 -26 -17 -20 9 -22 -25 -34 -23 -19 Apr. -34 -41 -26 -20 -26 11 -22 -24 -32 -22 -19 May -34 -44 -23 -14 -18 8 -17 -23 -29 -25 -14 June -33 -42 -24 -17 -24 9 -17 -20 -26 -22 -11 July -33 -41 -25 -13 -16 10 -14 -18 -25 -19 -10
Source: European Commission (Economic and Financial Affairs DG).1) Difference between the percentages of respondents giving positive and negative replies.2) The economic sentiment indicator is composed of the industrial, services, consumer, construction and retail trade confidence indicators; the industrial confidence indicator has
a weight of 40%, the services confidence indicator a weight of 30%, the consumer confidence indicator a weight of 20% and the two other indicators a weight of 5% each.Values of the economic sentiment indicator above (below) 100 indicate above-average (below-average) economic sentiment, calculated for the period 1990 to 2008.
3) Data are collected in January, April, July and October each year. The quarterly figures shown are averages of two successive surveys. Annual data are derived from quarterly averages.
4) The confidence indicators are calculated as simple averages of the components shown; the assessments of stocks (columns 4 and 17) and unemployment (column 10) are used with inverted signs for the calculation of confidence indicators.

S 54ECB
Monthly Bulletin
August 2009
5.3 Labour markets 1) (annual percentage changes, unless otherwise indicated)
1. Employment
Whole economy By employment status By economic activity
Millions (s.a.) Employees Self- Agriculture, Mining, Construction Trade, repairs, Financial, real Publicemployed hunting, manufacturing hotels and estate, renting administration,
forestry and energy restaurants, and business education, healthand fishing transport and services and other services
communication
% of total 2) 100.0 100.0 85.2 14.8 3.8 17.0 7.5 25.6 16.0 30.0
1 2 3 4 5 6 7 8 9 102005 141.863 1.0 1.1 0.4 -0.7 -1.1 2.7 0.7 2.5 1.52006 144.185 1.6 1.8 0.7 -2.0 -0.3 2.7 1.7 3.9 1.82007 146.759 1.8 1.9 0.9 -1.4 0.3 4.0 1.9 4.0 1.32008 147.929 0.8 1.0 -0.2 -1.5 -0.2 -2.4 1.3 2.5 1.2
2008 Q1 148.118 1.5 1.6 0.8 -1.3 0.3 0.3 2.4 4.0 0.8 Q2 148.207 1.1 1.4 -0.1 -2.0 0.1 -1.6 1.6 3.0 1.4 Q3 147.960 0.6 0.9 -0.9 -1.8 -0.1 -2.9 0.9 2.2 1.1 Q4 147.430 0.0 0.1 -0.8 -1.0 -1.3 -5.3 0.3 0.9 1.42009 Q1 146.129 -1.3 -1.2 -2.2 -2.7 -3.0 -7.6 -1.4 -1.2 1.3
quarter-on-quarter percentage changes (s.a.)
2008 Q1 0.599 0.4 0.4 0.5 0.7 0.3 -0.4 0.7 1.2 0.0 Q2 0.090 0.1 0.1 -0.4 -1.4 -0.2 -1.2 0.1 0.2 0.6 Q3 -0.247 -0.2 -0.1 -0.4 -0.6 -0.4 -1.5 0.0 0.1 0.1 Q4 -0.531 -0.4 -0.3 -0.7 0.3 -1.0 -2.2 -0.4 -0.6 0.62009 Q1 -1.301 -0.9 -0.9 -1.0 -1.0 -1.4 -2.6 -1.0 -1.0 0.0
2. Unemployment(seasonally adjusted)
Total By age 3) By gender 4)
Millions % of labour Adult Youth Male Female
forceMillions % of labour Millions % of labour Millions % of labour Millions % of labour
force force force force
% of total 2) 100.0 77.9 22.1 50.4 49.6
1 2 3 4 5 6 7 8 9 102005 13.714 9.0 10.673 7.9 3.040 17.5 6.913 8.1 6.800 10.02006 12.877 8.3 10.053 7.3 2.824 16.4 6.386 7.5 6.490 9.42007 11.660 7.5 9.114 6.6 2.546 14.9 5.730 6.7 5.929 8.52008 11.897 7.6 9.270 6.6 2.627 15.4 6.001 6.9 5.896 8.3
2008 Q2 11.604 7.4 9.047 6.5 2.557 15.0 5.788 6.7 5.816 8.2 Q3 11.963 7.6 9.313 6.6 2.650 15.6 6.071 7.0 5.892 8.3 Q4 12.664 8.0 9.847 7.0 2.817 16.6 6.548 7.6 6.115 8.62009 Q1 13.872 8.8 10.774 7.6 3.097 18.3 7.338 8.5 6.534 9.2 Q2 14.729 9.3 11.464 8.1 3.265 19.4 7.883 9.1 6.846 9.6
2009 Jan. 13.483 8.5 10.475 7.4 3.009 17.8 7.084 8.2 6.400 9.0 Feb. 13.875 8.8 10.776 7.6 3.099 18.4 7.347 8.5 6.529 9.1 Mar. 14.257 9.0 11.072 7.8 3.185 18.8 7.584 8.8 6.673 9.3 Apr. 14.552 9.2 11.308 8.0 3.244 19.2 7.768 9.0 6.784 9.5 May 14.738 9.3 11.462 8.1 3.276 19.4 7.893 9.1 6.845 9.6 June 14.896 9.4 11.621 8.2 3.276 19.5 7.987 9.2 6.909 9.7
Source: Eurostat.1) Data refer to Euro 16. Data for employment refer to persons and are based on the ESA 95. Data for unemployment refer to persons and follow ILO recommendations.2) In 2008.3) Adult: 25 years of age and over; youth: below 25 years of age; rates are expressed as a percentage of the labour force for the relevant age group.4) Rates are expressed as a percentage of the labour force for the relevant gender.

S 55ECB
Monthly Bulletin
August 2009
6GOVERNMENT FINANCE
6.1 Revenue, expenditure and deficit/surplus 1) (as a percentage of GDP)
1. Euro area _ revenue
Total Current revenue Capital revenue Memo:
fiscalDirect Indirect Social Sales Capital burden 2)
taxes Households Corporations taxes Received by EU contributions Employers Employees taxesinstitutions
1 2 3 4 5 6 7 8 9 10 11 12 13 142000 46.5 46.2 12.6 9.6 3.0 13.9 0.6 15.8 8.2 4.8 2.2 0.3 0.3 42.62001 45.7 45.5 12.2 9.4 2.7 13.5 0.5 15.6 8.2 4.7 2.1 0.2 0.3 41.62002 45.1 44.8 11.8 9.2 2.5 13.5 0.4 15.6 8.2 4.6 2.1 0.3 0.3 41.22003 45.0 44.4 11.4 9.0 2.3 13.5 0.4 15.7 8.3 4.6 2.1 0.6 0.5 41.12004 44.5 44.1 11.3 8.7 2.5 13.5 0.3 15.5 8.2 4.5 2.1 0.5 0.4 40.82005 44.8 44.3 11.5 8.8 2.7 13.7 0.3 15.4 8.1 4.5 2.2 0.5 0.3 40.92006 45.4 45.0 12.1 8.9 3.0 13.9 0.3 15.3 8.1 4.5 2.1 0.3 0.3 41.52007 45.5 45.2 12.4 9.1 3.1 13.8 0.3 15.1 8.0 4.4 2.1 0.3 0.3 41.72008 44.8 44.6 12.2 9.3 2.7 13.3 0.3 15.3 8.1 4.4 2.1 0.2 0.3 41.0
2. Euro area _ expenditure
Total Current expenditure Capital expenditure Memo:
primaryTotal Compensation Intermediate Interest Current Investment Capital expenditure 3)
of consumption transfers Social Subsidies transfers Paid by EUemployees payments Paid by EU institutions
institutions1 2 3 4 5 6 7 8 9 10 11 12 13 14
2000 46.6 43.8 10.4 4.8 3.9 24.7 21.6 2.0 0.5 2.8 2.5 1.3 0.0 42.72001 47.6 43.7 10.3 4.8 3.8 24.8 21.7 1.9 0.5 3.9 2.5 1.4 0.0 43.82002 47.7 43.9 10.4 4.9 3.5 25.1 22.2 1.9 0.5 3.8 2.4 1.4 0.0 44.22003 48.1 44.1 10.5 5.0 3.3 25.4 22.5 1.9 0.5 3.9 2.5 1.4 0.1 44.82004 47.5 43.6 10.4 5.0 3.1 25.1 22.4 1.8 0.5 3.9 2.5 1.5 0.1 44.42005 47.3 43.4 10.4 5.0 3.0 25.0 22.3 1.7 0.5 3.9 2.5 1.4 0.0 44.32006 46.7 42.8 10.2 5.0 2.9 24.8 22.0 1.7 0.5 3.8 2.5 1.4 0.0 43.72007 46.1 42.3 10.0 5.0 3.0 24.4 21.6 1.6 0.4 3.9 2.5 1.3 0.0 43.12008 46.7 42.9 10.1 5.1 3.0 24.8 21.9 1.6 0.4 3.8 2.5 1.3 0.0 43.8
3. Euro area _ deficit/surplus, primary deficit/surplus and government consumption
Deficit (-)/surplus (+) Primary Government consumption 4)
deficit (-)/ Total Central State Local Social surplus (+) Total Collective Individual
gov. gov. gov. security Compensation Intermediate Transfers Consumption Sales consumption consumptionfunds of employees consumption in kind of fixed (minus)
via market capitalproducers
1 2 3 4 5 6 7 8 9 10 11 12 13 142000 -0.1 -0.5 -0.1 0.1 0.5 3.8 19.8 10.4 4.8 4.9 1.8 2.2 8.2 11.62001 -1.9 -1.7 -0.4 -0.1 0.3 1.9 19.9 10.3 4.8 5.0 1.8 2.1 8.2 11.72002 -2.6 -2.1 -0.5 -0.2 0.2 0.9 20.2 10.4 4.9 5.1 1.8 2.1 8.3 12.02003 -3.1 -2.4 -0.5 -0.2 0.0 0.2 20.5 10.5 5.0 5.2 1.9 2.1 8.3 12.22004 -3.0 -2.5 -0.4 -0.3 0.2 0.2 20.4 10.4 5.0 5.1 1.9 2.1 8.3 12.12005 -2.5 -2.2 -0.3 -0.2 0.2 0.4 20.4 10.4 5.0 5.1 1.9 2.2 8.2 12.32006 -1.3 -1.4 -0.1 -0.2 0.4 1.6 20.3 10.2 5.0 5.2 1.9 2.1 8.0 12.22007 -0.7 -1.2 0.0 0.0 0.5 2.3 20.0 10.0 5.0 5.2 1.9 2.1 7.9 12.12008 -1.9 -2.0 -0.2 -0.1 0.4 1.1 20.4 10.1 5.1 5.2 1.9 2.1 8.1 12.3
4. Euro area countries _ deficit (-)/surplus (+) 5)
BE DE IE GR ES FR IT CY LU MT NL AT PT SI SK FI1 2 3 4 5 6 7 8 9 10 11 12 13 14 15 16
2005 -2.7 -3.3 1.7 -5.1 1.0 -2.9 -4.3 -2.4 0.0 -2.9 -0.3 -1.6 -6.1 -1.4 -2.8 2.82006 0.3 -1.5 3.0 -2.8 2.0 -2.3 -3.3 -1.2 1.4 -2.6 0.6 -1.6 -3.9 -1.3 -3.5 4.02007 -0.2 -0.2 0.2 -3.6 2.2 -2.7 -1.5 3.4 3.6 -2.2 0.3 -0.5 -2.6 0.5 -1.9 5.22008 -1.2 -0.1 -7.1 -5.0 -3.8 -3.4 -2.7 0.9 2.6 -4.7 1.0 -0.4 -2.6 -0.9 -2.2 4.2
Sources: ECB for euro area aggregated data; European Commission for data relating to countries’ deficit/surplus.1) The data refer to the Euro 16. Revenue, expenditure and deficit/surplus are based on the ESA 95. Transactions involving the EU budget are included and consolidated.
Transactions among Member States’ governments are not consolidated.2) The fiscal burden comprises taxes and social contributions.3) Comprises total expenditure minus interest expenditure.4) Corresponds to final consumption expenditure (P.3) of general government in the ESA 95.5) Includes proceeds from the sale of UMTS licences and settlements under swaps and forward rate agreements.

S 56ECB
Monthly Bulletin
August 2009
6.2 Debt 1) (as a percentage of GDP)
1. Euro area _ by financial instrument and sector of the holder
Total Financial instruments Holders
Currency Loans Short-term Long-term Domestic creditors 2) Other
and securities securities creditors 3)
deposits Total MFIs Other Otherfinancial sectors
corporations
1 2 3 4 5 6 7 8 9 101999 71.9 2.9 14.4 4.3 50.4 48.7 25.4 13.7 9.7 23.22000 69.2 2.7 13.2 3.7 49.6 44.1 22.1 12.4 9.7 25.12001 68.2 2.8 12.4 4.0 49.0 42.0 20.6 11.1 10.3 26.22002 67.9 2.7 11.8 4.6 48.9 40.1 19.4 10.6 10.0 27.92003 69.1 2.1 12.4 5.0 49.6 39.4 19.6 11.1 8.7 29.72004 69.4 2.2 11.9 5.0 50.4 37.6 18.5 10.8 8.3 31.82005 70.0 2.4 11.8 4.7 51.1 35.5 17.2 11.2 7.1 34.52006 68.2 2.4 11.4 4.1 50.3 33.8 17.3 9.4 7.1 34.42007 66.0 2.2 10.8 4.2 48.8 32.1 16.6 8.6 6.9 33.92008 69.3 2.3 10.8 6.7 49.5 32.2 16.9 8.1 7.1 37.1
2. Euro area _ by issuer, maturity and currency denomination
Total Issued by 4) Original maturity Residual maturity Currencies
Central State Local Social Up to Over Up to Over 1 year Over Euro or Other
gov. gov. gov. security 1 year 1 year Variable 1 year and up to 5 5 years participating currenciesfunds interest rate years currencies 5)
1 2 3 4 5 6 7 8 9 10 11 12 131999 71.9 60.4 6.0 5.1 0.4 7.3 64.6 7.0 13.5 27.8 30.6 69.9 2.02000 69.2 58.1 5.8 4.9 0.4 6.5 62.7 6.3 13.4 27.8 28.0 67.4 1.82001 68.2 57.0 6.0 4.7 0.4 7.0 61.2 5.3 13.7 26.6 27.9 66.6 1.52002 67.9 56.6 6.2 4.7 0.4 7.6 60.3 5.2 15.5 25.3 27.2 66.7 1.32003 69.1 56.9 6.5 5.0 0.6 7.8 61.2 5.0 14.9 26.0 28.2 68.1 0.92004 69.4 57.3 6.6 5.1 0.4 7.8 61.6 4.7 14.8 26.2 28.5 68.6 0.92005 70.0 57.6 6.7 5.2 0.5 7.9 62.1 4.6 14.8 25.5 29.6 69.0 1.02006 68.2 55.8 6.5 5.4 0.5 7.4 60.8 4.3 14.4 24.0 29.8 67.6 0.62007 66.0 54.0 6.2 5.2 0.5 7.4 58.5 4.3 14.1 22.5 29.3 65.6 0.42008 69.3 57.2 6.6 5.2 0.4 10.2 59.2 4.5 17.5 22.1 29.7 68.8 0.5
3. Euro area countries
BE DE IE GR ES FR IT CY LU MT NL AT PT SI SK FI
1 2 3 4 5 6 7 8 9 10 11 12 13 14 15 162005 92.2 67.8 27.5 98.8 43.0 66.4 105.8 69.1 6.1 69.8 51.8 63.7 63.6 27.0 34.2 41.42006 87.9 67.6 24.9 95.9 39.6 63.7 106.5 64.6 6.7 63.7 47.4 62.0 64.7 26.7 30.4 39.22007 84.0 65.1 25.0 94.8 36.2 63.8 103.5 59.4 6.9 62.1 45.6 59.4 63.5 23.4 29.4 35.12008 89.6 65.9 43.2 97.6 39.5 68.0 105.8 49.1 14.7 64.1 58.2 62.5 66.4 22.8 27.6 33.4
Sources: ECB for euro area aggregated data; European Commission for data relating to countries’ debt.1) The data refer to the Euro 16. Gross general government debt at nominal value and consolidated between sub-sectors of government. Holdings by non-resident governments are
not consolidated. Data are partially estimated.2) Holders resident in the country whose government has issued the debt. 3) Includes residents of euro area countries other than the country whose government has issued the debt. 4) Excludes debt held by general government in the country whose government has issued it.5) Before 1999, this comprises debt in ECU, in domestic currency and in the currencies of other Member States which have adopted the euro.
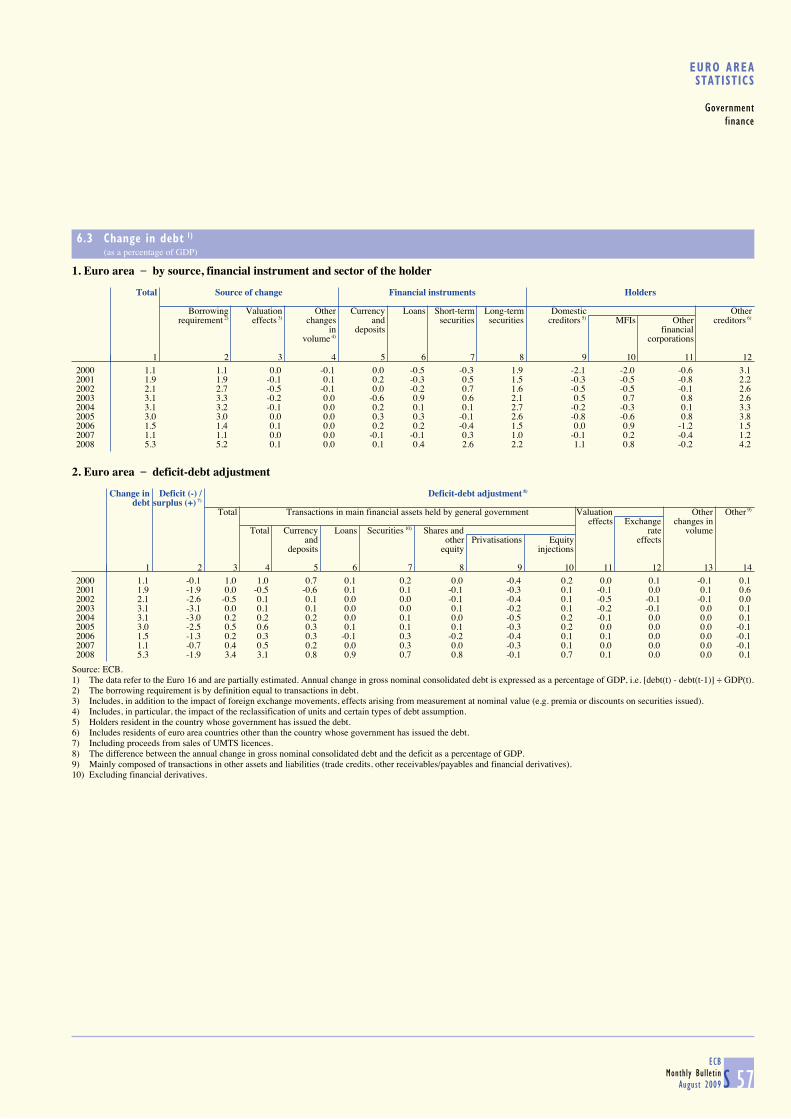
S 57ECB
Monthly Bulletin
August 2009
EURO AREASTATISTICS
Government
finance
6.3 Change in debt 1) (as a percentage of GDP)
1. Euro area _ by source, financial instrument and sector of the holder
Total Source of change Financial instruments Holders
Borrowing Valuation Other Currency Loans Short-term Long-term Domestic Other
requirement 2) effects 3) changes and securities securities creditors 5) MFIs Other creditors 6)
in deposits financialvolume 4) corporations
1 2 3 4 5 6 7 8 9 10 11 122000 1.1 1.1 0.0 -0.1 0.0 -0.5 -0.3 1.9 -2.1 -2.0 -0.6 3.12001 1.9 1.9 -0.1 0.1 0.2 -0.3 0.5 1.5 -0.3 -0.5 -0.8 2.22002 2.1 2.7 -0.5 -0.1 0.0 -0.2 0.7 1.6 -0.5 -0.5 -0.1 2.62003 3.1 3.3 -0.2 0.0 -0.6 0.9 0.6 2.1 0.5 0.7 0.8 2.62004 3.1 3.2 -0.1 0.0 0.2 0.1 0.1 2.7 -0.2 -0.3 0.1 3.32005 3.0 3.0 0.0 0.0 0.3 0.3 -0.1 2.6 -0.8 -0.6 0.8 3.82006 1.5 1.4 0.1 0.0 0.2 0.2 -0.4 1.5 0.0 0.9 -1.2 1.52007 1.1 1.1 0.0 0.0 -0.1 -0.1 0.3 1.0 -0.1 0.2 -0.4 1.22008 5.3 5.2 0.1 0.0 0.1 0.4 2.6 2.2 1.1 0.8 -0.2 4.2
2. Euro area _ deficit-debt adjustment
Change in Deficit (-) / Deficit-debt adjustment 8)
debt surplus (+) 7) Total Transactions in main financial assets held by general government Valuation Other Other 9)
effects Exchange changes inTotal Currency Loans Securities 10) Shares and rate volume
and other Privatisations Equity effectsdeposits equity injections
1 2 3 4 5 6 7 8 9 10 11 12 13 142000 1.1 -0.1 1.0 1.0 0.7 0.1 0.2 0.0 -0.4 0.2 0.0 0.1 -0.1 0.12001 1.9 -1.9 0.0 -0.5 -0.6 0.1 0.1 -0.1 -0.3 0.1 -0.1 0.0 0.1 0.62002 2.1 -2.6 -0.5 0.1 0.1 0.0 0.0 -0.1 -0.4 0.1 -0.5 -0.1 -0.1 0.02003 3.1 -3.1 0.0 0.1 0.1 0.0 0.0 0.1 -0.2 0.1 -0.2 -0.1 0.0 0.12004 3.1 -3.0 0.2 0.2 0.2 0.0 0.1 0.0 -0.5 0.2 -0.1 0.0 0.0 0.12005 3.0 -2.5 0.5 0.6 0.3 0.1 0.1 0.1 -0.3 0.2 0.0 0.0 0.0 -0.12006 1.5 -1.3 0.2 0.3 0.3 -0.1 0.3 -0.2 -0.4 0.1 0.1 0.0 0.0 -0.12007 1.1 -0.7 0.4 0.5 0.2 0.0 0.3 0.0 -0.3 0.1 0.0 0.0 0.0 -0.12008 5.3 -1.9 3.4 3.1 0.8 0.9 0.7 0.8 -0.1 0.7 0.1 0.0 0.0 0.1
Source: ECB.1) The data refer to the Euro 16 and are partially estimated. Annual change in gross nominal consolidated debt is expressed as a percentage of GDP, i.e. [debt(t) - debt(t-1)] ÷ GDP(t).2) The borrowing requirement is by definition equal to transactions in debt.3) Includes, in addition to the impact of foreign exchange movements, effects arising from measurement at nominal value (e.g. premia or discounts on securities issued).4) Includes, in particular, the impact of the reclassification of units and certain types of debt assumption.5) Holders resident in the country whose government has issued the debt. 6) Includes residents of euro area countries other than the country whose government has issued the debt. 7) Including proceeds from sales of UMTS licences.8) The difference between the annual change in gross nominal consolidated debt and the deficit as a percentage of GDP. 9) Mainly composed of transactions in other assets and liabilities (trade credits, other receivables/payables and financial derivatives).10) Excluding financial derivatives.
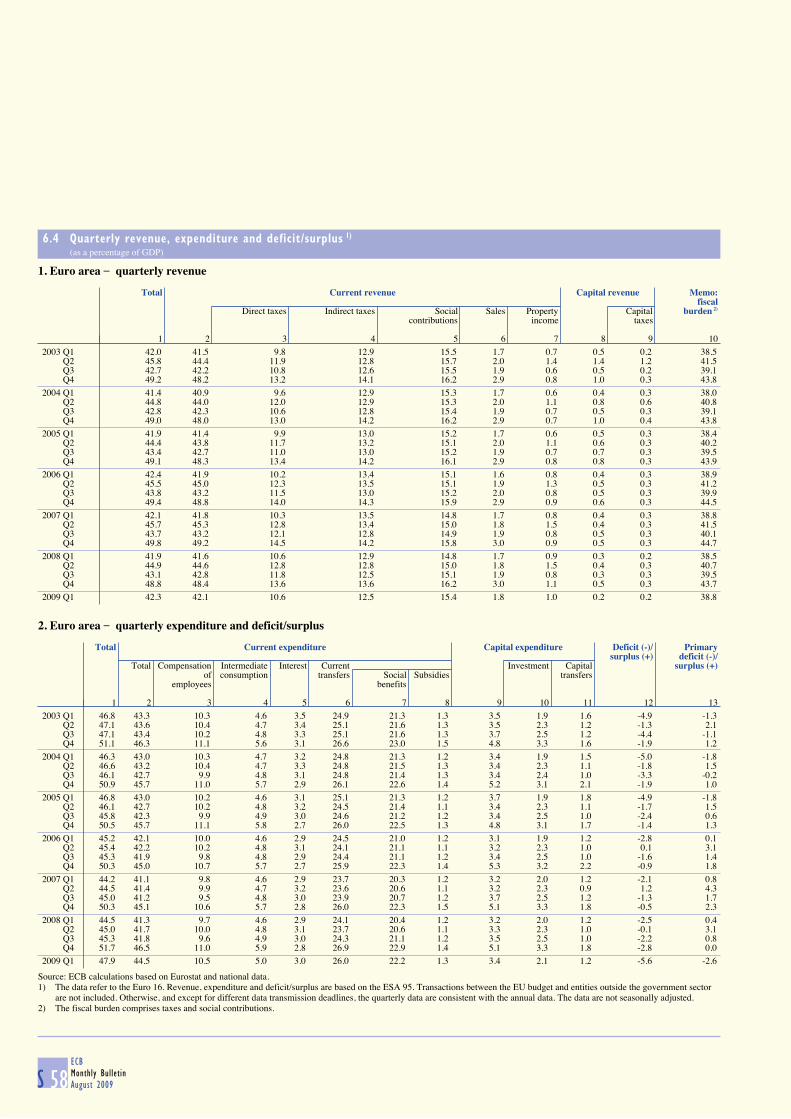
S 58ECB
Monthly Bulletin
August 2009
6.4 Quarterly revenue, expenditure and deficit/surplus 1) (as a percentage of GDP)
1. Euro area _ quarterly revenue
Total Current revenue Capital revenue Memo:
fiscalDirect taxes Indirect taxes Social Sales Property Capital burden 2)
contributions income taxes
1 2 3 4 5 6 7 8 9 102003 Q1 42.0 41.5 9.8 12.9 15.5 1.7 0.7 0.5 0.2 38.5 Q2 45.8 44.4 11.9 12.8 15.7 2.0 1.4 1.4 1.2 41.5 Q3 42.7 42.2 10.8 12.6 15.5 1.9 0.6 0.5 0.2 39.1 Q4 49.2 48.2 13.2 14.1 16.2 2.9 0.8 1.0 0.3 43.82004 Q1 41.4 40.9 9.6 12.9 15.3 1.7 0.6 0.4 0.3 38.0 Q2 44.8 44.0 12.0 12.9 15.3 2.0 1.1 0.8 0.6 40.8 Q3 42.8 42.3 10.6 12.8 15.4 1.9 0.7 0.5 0.3 39.1 Q4 49.0 48.0 13.0 14.2 16.2 2.9 0.7 1.0 0.4 43.82005 Q1 41.9 41.4 9.9 13.0 15.2 1.7 0.6 0.5 0.3 38.4 Q2 44.4 43.8 11.7 13.2 15.1 2.0 1.1 0.6 0.3 40.2 Q3 43.4 42.7 11.0 13.0 15.2 1.9 0.7 0.7 0.3 39.5 Q4 49.1 48.3 13.4 14.2 16.1 2.9 0.8 0.8 0.3 43.92006 Q1 42.4 41.9 10.2 13.4 15.1 1.6 0.8 0.4 0.3 38.9 Q2 45.5 45.0 12.3 13.5 15.1 1.9 1.3 0.5 0.3 41.2 Q3 43.8 43.2 11.5 13.0 15.2 2.0 0.8 0.5 0.3 39.9 Q4 49.4 48.8 14.0 14.3 15.9 2.9 0.9 0.6 0.3 44.52007 Q1 42.1 41.8 10.3 13.5 14.8 1.7 0.8 0.4 0.3 38.8 Q2 45.7 45.3 12.8 13.4 15.0 1.8 1.5 0.4 0.3 41.5 Q3 43.7 43.2 12.1 12.8 14.9 1.9 0.8 0.5 0.3 40.1 Q4 49.8 49.2 14.5 14.2 15.8 3.0 0.9 0.5 0.3 44.72008 Q1 41.9 41.6 10.6 12.9 14.8 1.7 0.9 0.3 0.2 38.5 Q2 44.9 44.6 12.8 12.8 15.0 1.8 1.5 0.4 0.3 40.7 Q3 43.1 42.8 11.8 12.5 15.1 1.9 0.8 0.3 0.3 39.5 Q4 48.8 48.4 13.6 13.6 16.2 3.0 1.1 0.5 0.3 43.72009 Q1 42.3 42.1 10.6 12.5 15.4 1.8 1.0 0.2 0.2 38.8
2. Euro area _ quarterly expenditure and deficit/surplus
Total Current expenditure Capital expenditure Deficit (-)/ Primary
surplus (+) deficit (-)/Total Compensation Intermediate Interest Current Investment Capital surplus (+)
of consumption transfers Social Subsidies transfersemployees benefits
1 2 3 4 5 6 7 8 9 10 11 12 132003 Q1 46.8 43.3 10.3 4.6 3.5 24.9 21.3 1.3 3.5 1.9 1.6 -4.9 -1.3 Q2 47.1 43.6 10.4 4.7 3.4 25.1 21.6 1.3 3.5 2.3 1.2 -1.3 2.1 Q3 47.1 43.4 10.2 4.8 3.3 25.1 21.6 1.3 3.7 2.5 1.2 -4.4 -1.1 Q4 51.1 46.3 11.1 5.6 3.1 26.6 23.0 1.5 4.8 3.3 1.6 -1.9 1.22004 Q1 46.3 43.0 10.3 4.7 3.2 24.8 21.3 1.2 3.4 1.9 1.5 -5.0 -1.8 Q2 46.6 43.2 10.4 4.7 3.3 24.8 21.5 1.3 3.4 2.3 1.1 -1.8 1.5 Q3 46.1 42.7 9.9 4.8 3.1 24.8 21.4 1.3 3.4 2.4 1.0 -3.3 -0.2 Q4 50.9 45.7 11.0 5.7 2.9 26.1 22.6 1.4 5.2 3.1 2.1 -1.9 1.02005 Q1 46.8 43.0 10.2 4.6 3.1 25.1 21.3 1.2 3.7 1.9 1.8 -4.9 -1.8 Q2 46.1 42.7 10.2 4.8 3.2 24.5 21.4 1.1 3.4 2.3 1.1 -1.7 1.5 Q3 45.8 42.3 9.9 4.9 3.0 24.6 21.2 1.2 3.4 2.5 1.0 -2.4 0.6 Q4 50.5 45.7 11.1 5.8 2.7 26.0 22.5 1.3 4.8 3.1 1.7 -1.4 1.32006 Q1 45.2 42.1 10.0 4.6 2.9 24.5 21.0 1.2 3.1 1.9 1.2 -2.8 0.1 Q2 45.4 42.2 10.2 4.8 3.1 24.1 21.1 1.1 3.2 2.3 1.0 0.1 3.1 Q3 45.3 41.9 9.8 4.8 2.9 24.4 21.1 1.2 3.4 2.5 1.0 -1.6 1.4 Q4 50.3 45.0 10.7 5.7 2.7 25.9 22.3 1.4 5.3 3.2 2.2 -0.9 1.82007 Q1 44.2 41.1 9.8 4.6 2.9 23.7 20.3 1.2 3.2 2.0 1.2 -2.1 0.8 Q2 44.5 41.4 9.9 4.7 3.2 23.6 20.6 1.1 3.2 2.3 0.9 1.2 4.3 Q3 45.0 41.2 9.5 4.8 3.0 23.9 20.7 1.2 3.7 2.5 1.2 -1.3 1.7 Q4 50.3 45.1 10.6 5.7 2.8 26.0 22.3 1.5 5.1 3.3 1.8 -0.5 2.32008 Q1 44.5 41.3 9.7 4.6 2.9 24.1 20.4 1.2 3.2 2.0 1.2 -2.5 0.4 Q2 45.0 41.7 10.0 4.8 3.1 23.7 20.6 1.1 3.3 2.3 1.0 -0.1 3.1 Q3 45.3 41.8 9.6 4.9 3.0 24.3 21.1 1.2 3.5 2.5 1.0 -2.2 0.8 Q4 51.7 46.5 11.0 5.9 2.8 26.9 22.9 1.4 5.1 3.3 1.8 -2.8 0.02009 Q1 47.9 44.5 10.5 5.0 3.0 26.0 22.2 1.3 3.4 2.1 1.2 -5.6 -2.6
Source: ECB calculations based on Eurostat and national data.1) The data refer to the Euro 16. Revenue, expenditure and deficit/surplus are based on the ESA 95. Transactions between the EU budget and entities outside the government sector
are not included. Otherwise, and except for different data transmission deadlines, the quarterly data are consistent with the annual data. The data are not seasonally adjusted.2) The fiscal burden comprises taxes and social contributions.
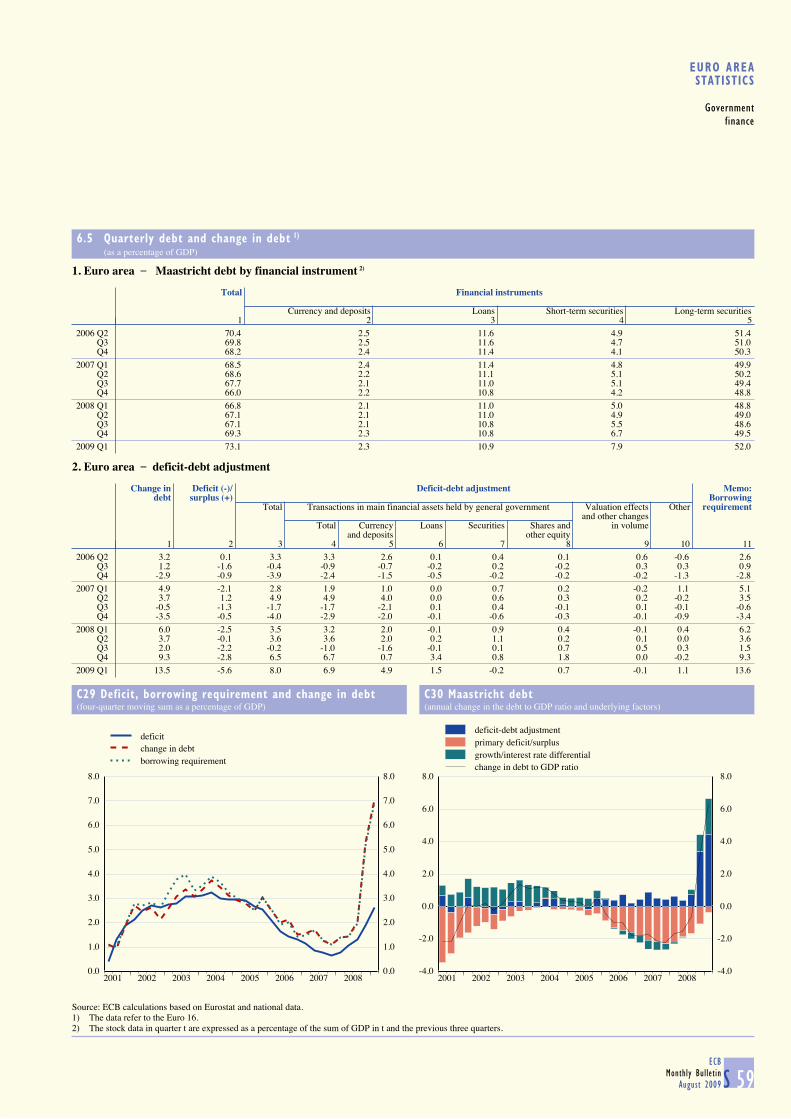
S 59ECB
Monthly Bulletin
August 2009
EURO AREASTATISTICS
Government
finance
6.5 Quarterly debt and change in debt 1) (as a percentage of GDP)
1. Euro area _ Maastricht debt by financial instrument 2)
Total Financial instruments
Currency and deposits Loans Short-term securities Long-term securities1 2 3 4 5
2006 Q2 70.4 2.5 11.6 4.9 51.4 Q3 69.8 2.5 11.6 4.7 51.0 Q4 68.2 2.4 11.4 4.1 50.32007 Q1 68.5 2.4 11.4 4.8 49.9 Q2 68.6 2.2 11.1 5.1 50.2 Q3 67.7 2.1 11.0 5.1 49.4 Q4 66.0 2.2 10.8 4.2 48.82008 Q1 66.8 2.1 11.0 5.0 48.8 Q2 67.1 2.1 11.0 4.9 49.0 Q3 67.1 2.1 10.8 5.5 48.6 Q4 69.3 2.3 10.8 6.7 49.52009 Q1 73.1 2.3 10.9 7.9 52.0
2. Euro area _ deficit-debt adjustment
Change in Deficit (-)/ Deficit-debt adjustment Memo:
debt surplus (+) BorrowingTotal Transactions in main financial assets held by general government Valuation effects Other requirement
and other changesTotal Currency Loans Securities Shares and in volume
and deposits other equity1 2 3 4 5 6 7 8 9 10 11
2006 Q2 3.2 0.1 3.3 3.3 2.6 0.1 0.4 0.1 0.6 -0.6 2.6 Q3 1.2 -1.6 -0.4 -0.9 -0.7 -0.2 0.2 -0.2 0.3 0.3 0.9 Q4 -2.9 -0.9 -3.9 -2.4 -1.5 -0.5 -0.2 -0.2 -0.2 -1.3 -2.82007 Q1 4.9 -2.1 2.8 1.9 1.0 0.0 0.7 0.2 -0.2 1.1 5.1 Q2 3.7 1.2 4.9 4.9 4.0 0.0 0.6 0.3 0.2 -0.2 3.5 Q3 -0.5 -1.3 -1.7 -1.7 -2.1 0.1 0.4 -0.1 0.1 -0.1 -0.6 Q4 -3.5 -0.5 -4.0 -2.9 -2.0 -0.1 -0.6 -0.3 -0.1 -0.9 -3.42008 Q1 6.0 -2.5 3.5 3.2 2.0 -0.1 0.9 0.4 -0.1 0.4 6.2 Q2 3.7 -0.1 3.6 3.6 2.0 0.2 1.1 0.2 0.1 0.0 3.6 Q3 2.0 -2.2 -0.2 -1.0 -1.6 -0.1 0.1 0.7 0.5 0.3 1.5 Q4 9.3 -2.8 6.5 6.7 0.7 3.4 0.8 1.8 0.0 -0.2 9.32009 Q1 13.5 -5.6 8.0 6.9 4.9 1.5 -0.2 0.7 -0.1 1.1 13.6
C29 Deficit, borrowing requirement and change in debt(four-quarter moving sum as a percentage of GDP)
C30 Maastricht debt(annual change in the debt to GDP ratio and underlying factors)
0.0
1.0
2.0
3.0
4.0
5.0
6.0
7.0
8.0
2001 2002 2003 2004 2005 2006 2007 20080.0
1.0
2.0
3.0
4.0
5.0
6.0
7.0
8.0
deficitchange in debtborrowing requirement
-4.0
-2.0
0.0
2.0
4.0
6.0
8.0
2001 2002 2003 2004 2005 2006 2007 2008-4.0
-2.0
0.0
2.0
4.0
6.0
8.0
deficit-debt adjustmentprimary deficit/surplusgrowth/interest rate differentialchange in debt to GDP ratio
Source: ECB calculations based on Eurostat and national data.1) The data refer to the Euro 16.2) The stock data in quarter t are expressed as a percentage of the sum of GDP in t and the previous three quarters.
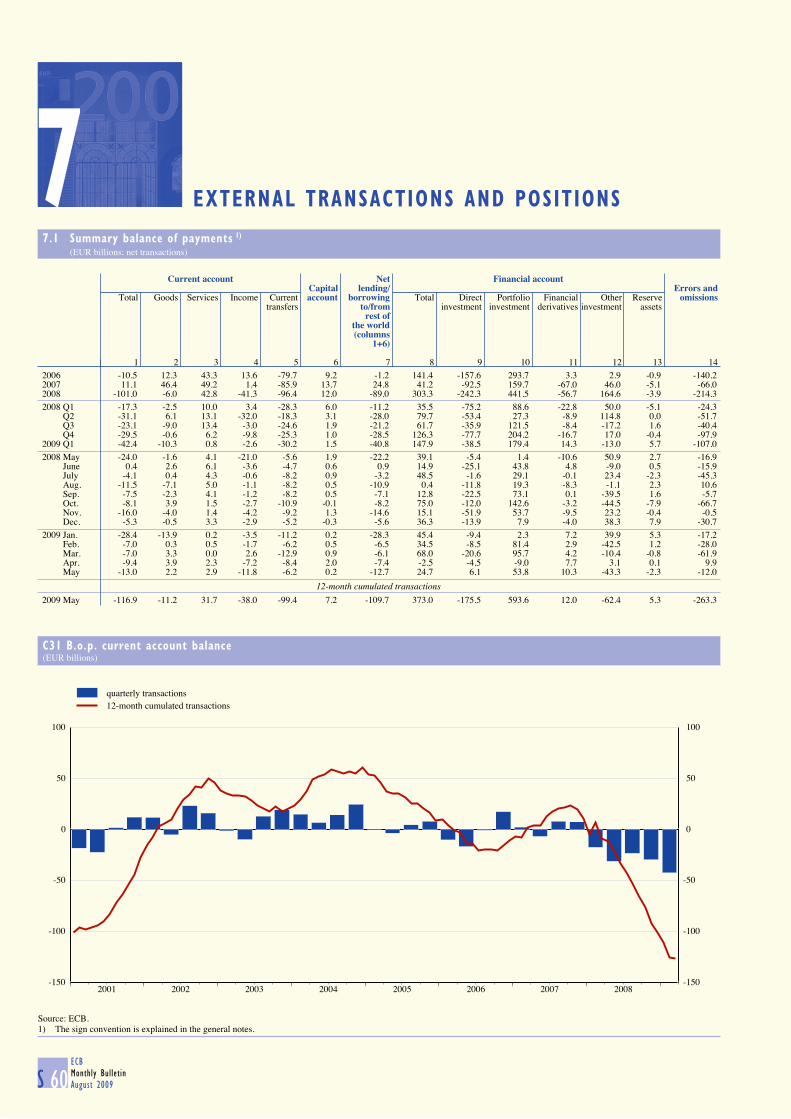
S 60ECB
Monthly Bulletin
August 2009
7 EXTERNAL TRANSACTIONS AND POSITIONS
7.1 Summary balance of payments 1) (EUR billions; net transactions)
Current account Net Financial account
Capital lending/ Errors andTotal Goods Services Income Current account borrowing Total Direct Portfolio Financial Other Reserve omissions
transfers to/from investment investment derivatives investment assetsrest of
the world(columns
1+6)
1 2 3 4 5 6 7 8 9 10 11 12 13 142006 -10.5 12.3 43.3 13.6 -79.7 9.2 -1.2 141.4 -157.6 293.7 3.3 2.9 -0.9 -140.22007 11.1 46.4 49.2 1.4 -85.9 13.7 24.8 41.2 -92.5 159.7 -67.0 46.0 -5.1 -66.02008 -101.0 -6.0 42.8 -41.3 -96.4 12.0 -89.0 303.3 -242.3 441.5 -56.7 164.6 -3.9 -214.32008 Q1 -17.3 -2.5 10.0 3.4 -28.3 6.0 -11.2 35.5 -75.2 88.6 -22.8 50.0 -5.1 -24.3 Q2 -31.1 6.1 13.1 -32.0 -18.3 3.1 -28.0 79.7 -53.4 27.3 -8.9 114.8 0.0 -51.7 Q3 -23.1 -9.0 13.4 -3.0 -24.6 1.9 -21.2 61.7 -35.9 121.5 -8.4 -17.2 1.6 -40.4 Q4 -29.5 -0.6 6.2 -9.8 -25.3 1.0 -28.5 126.3 -77.7 204.2 -16.7 17.0 -0.4 -97.92009 Q1 -42.4 -10.3 0.8 -2.6 -30.2 1.5 -40.8 147.9 -38.5 179.4 14.3 -13.0 5.7 -107.02008 May -24.0 -1.6 4.1 -21.0 -5.6 1.9 -22.2 39.1 -5.4 1.4 -10.6 50.9 2.7 -16.9 June 0.4 2.6 6.1 -3.6 -4.7 0.6 0.9 14.9 -25.1 43.8 4.8 -9.0 0.5 -15.9 July -4.1 0.4 4.3 -0.6 -8.2 0.9 -3.2 48.5 -1.6 29.1 -0.1 23.4 -2.3 -45.3 Aug. -11.5 -7.1 5.0 -1.1 -8.2 0.5 -10.9 0.4 -11.8 19.3 -8.3 -1.1 2.3 10.6 Sep. -7.5 -2.3 4.1 -1.2 -8.2 0.5 -7.1 12.8 -22.5 73.1 0.1 -39.5 1.6 -5.7 Oct. -8.1 3.9 1.5 -2.7 -10.9 -0.1 -8.2 75.0 -12.0 142.6 -3.2 -44.5 -7.9 -66.7 Nov. -16.0 -4.0 1.4 -4.2 -9.2 1.3 -14.6 15.1 -51.9 53.7 -9.5 23.2 -0.4 -0.5 Dec. -5.3 -0.5 3.3 -2.9 -5.2 -0.3 -5.6 36.3 -13.9 7.9 -4.0 38.3 7.9 -30.72009 Jan. -28.4 -13.9 0.2 -3.5 -11.2 0.2 -28.3 45.4 -9.4 2.3 7.2 39.9 5.3 -17.2 Feb. -7.0 0.3 0.5 -1.7 -6.2 0.5 -6.5 34.5 -8.5 81.4 2.9 -42.5 1.2 -28.0 Mar. -7.0 3.3 0.0 2.6 -12.9 0.9 -6.1 68.0 -20.6 95.7 4.2 -10.4 -0.8 -61.9 Apr. -9.4 3.9 2.3 -7.2 -8.4 2.0 -7.4 -2.5 -4.5 -9.0 7.7 3.1 0.1 9.9 May -13.0 2.2 2.9 -11.8 -6.2 0.2 -12.7 24.7 6.1 53.8 10.3 -43.3 -2.3 -12.0
12-month cumulated transactions 2009 May -116.9 -11.2 31.7 -38.0 -99.4 7.2 -109.7 373.0 -175.5 593.6 12.0 -62.4 5.3 -263.3
C31 B.o.p. current account balance(EUR billions)
-150
-100
-50
0
50
100
2001 2002 2003 2004 2005 2006 2007 2008-150
-100
-50
0
50
100
quarterly transactions12-month cumulated transactions
Source: ECB.1) The sign convention is explained in the general notes.

S 61ECB
Monthly Bulletin
August 2009
EURO AREASTATISTICS
External
transactions
and
positions
7.2 Current and capital accounts (EUR billions; transactions)
1. Summary current and capital accounts
Current account Capital account
Total Goods Services Income Current transfers
Credit Debit Net Credit Debit Credit Debit Credit Debit Credit Debit Credit Debit
Workers Workersremit- remit-tances tances
1 2 3 4 5 6 7 8 9 10 11 12 13 14 152006 2,423.8 2,434.3 -10.5 1,396.8 1,384.5 440.8 397.5 496.4 482.8 89.8 5.4 169.5 17.4 23.9 14.72007 2,686.1 2,675.0 11.1 1,513.7 1,467.3 490.3 441.1 592.3 591.0 89.8 6.4 175.7 20.5 25.9 12.22008 2,761.1 2,862.0 -101.0 1,579.5 1,585.5 506.5 463.8 586.0 627.3 89.0 6.7 185.5 21.3 25.7 13.72008 Q1 680.4 697.7 -17.3 390.3 392.7 116.9 106.9 147.1 143.7 26.1 1.6 54.3 5.1 8.9 2.9 Q2 709.2 740.4 -31.1 407.8 401.7 126.1 113.0 153.4 185.3 22.0 1.5 40.3 5.3 7.3 4.1 Q3 696.6 719.8 -23.1 403.1 412.1 136.2 122.8 143.8 146.7 13.5 1.8 38.1 5.4 4.8 2.9 Q4 674.8 704.2 -29.5 378.4 379.0 127.3 121.0 141.7 151.5 27.4 1.8 52.7 5.5 4.7 3.82009 Q1 560.0 602.4 -42.4 308.3 318.6 108.9 108.1 117.7 120.3 25.1 1.4 55.4 4.9 4.2 2.6
2009 Mar. 194.1 201.0 -7.0 110.9 107.6 37.1 37.1 41.6 39.0 4.4 . 17.3 . 1.9 1.1 Apr. 185.8 195.2 -9.4 104.1 100.2 36.7 34.3 39.6 46.8 5.4 . 13.8 . 2.7 0.7 May 183.7 196.6 -13.0 98.9 96.7 37.0 34.1 42.0 53.8 5.8 . 12.1 . 0.9 0.7
Seasonally adjusted
2008 Q1 701.6 718.3 -16.7 400.4 400.5 128.1 113.1 151.2 157.5 21.8 . 47.2 . . . Q2 702.1 718.9 -16.8 403.4 401.6 126.4 115.7 148.4 154.5 23.9 . 47.1 . . . Q3 696.4 719.9 -23.5 403.5 406.4 125.8 116.5 147.8 154.9 19.3 . 42.1 . . . Q4 653.8 697.1 -43.2 366.6 370.4 125.8 117.3 139.0 160.3 22.5 . 49.0 . . . 2009 Q1 581.4 625.7 -44.3 319.3 329.7 120.0 115.3 121.6 133.0 20.5 . 47.7 . . . 2008 Dec. 206.0 221.0 -15.0 114.8 117.7 40.4 36.2 43.0 50.5 7.7 . 16.5 . . . 2009 Jan. 197.1 218.8 -21.7 107.3 115.4 41.5 39.2 42.3 47.9 6.0 . 16.2 . . . Feb. 194.2 206.9 -12.7 106.9 108.0 39.4 37.8 40.0 45.9 7.9 . 15.1 . . . Mar. 190.1 200.1 -10.0 105.2 106.3 39.2 38.3 39.3 39.1 6.6 . 16.4 . . . Apr. 187.6 193.7 -6.1 104.1 101.7 38.7 35.7 38.6 41.5 6.2 . 14.8 . . . May 189.4 190.6 -1.2 103.1 100.2 38.3 36.0 41.6 40.0 6.4 . 14.4 . . .
C32 B.o.p. goods(EUR billions, seasonally adjusted; three-month moving average)
C33 B.o.p. services(EUR billions, seasonally adjusted; three-month moving average)
60
80
100
120
140
2000 2001 2002 2003 2004 2005 2006 2007 200860
80
100
120
140
exports (credit)imports (debit)
20
25
30
35
40
45
2000 2001 2002 2003 2004 2005 2006 2007 200820
25
30
35
40
45
exports (credit)imports (debit)
Source: ECB.
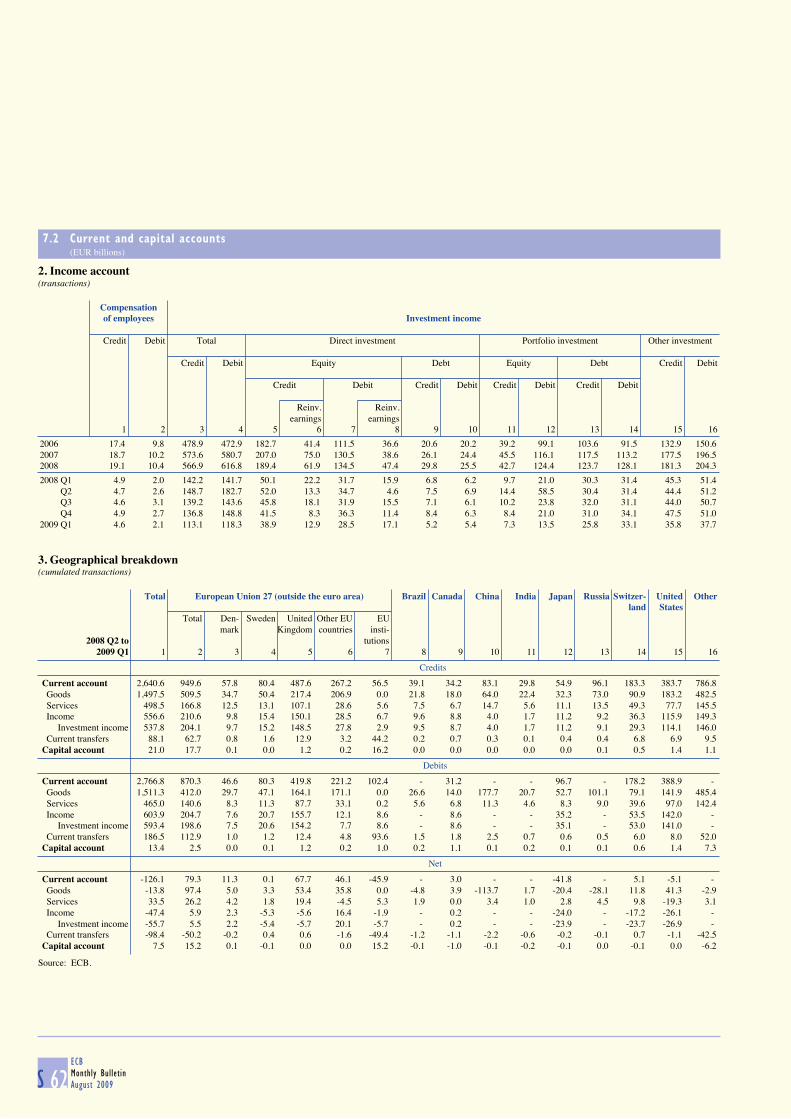
S 62ECB
Monthly Bulletin
August 2009
7.2 Current and capital accounts (EUR billions)
2. Income account(transactions)
Compensation of employees Investment income
Credit Debit Total Direct investment Portfolio investment Other investment
Credit Debit Equity Debt Equity Debt Credit Debit
Credit Debit Credit Debit Credit Debit Credit Debit
Reinv. Reinv.earnings earnings
1 2 3 4 5 6 7 8 9 10 11 12 13 14 15 16 2006 17.4 9.8 478.9 472.9 182.7 41.4 111.5 36.6 20.6 20.2 39.2 99.1 103.6 91.5 132.9 150.6 2007 18.7 10.2 573.6 580.7 207.0 75.0 130.5 38.6 26.1 24.4 45.5 116.1 117.5 113.2 177.5 196.5 2008 19.1 10.4 566.9 616.8 189.4 61.9 134.5 47.4 29.8 25.5 42.7 124.4 123.7 128.1 181.3 204.3 2008 Q1 4.9 2.0 142.2 141.7 50.1 22.2 31.7 15.9 6.8 6.2 9.7 21.0 30.3 31.4 45.3 51.4 Q2 4.7 2.6 148.7 182.7 52.0 13.3 34.7 4.6 7.5 6.9 14.4 58.5 30.4 31.4 44.4 51.2 Q3 4.6 3.1 139.2 143.6 45.8 18.1 31.9 15.5 7.1 6.1 10.2 23.8 32.0 31.1 44.0 50.7 Q4 4.9 2.7 136.8 148.8 41.5 8.3 36.3 11.4 8.4 6.3 8.4 21.0 31.0 34.1 47.5 51.0 2009 Q1 4.6 2.1 113.1 118.3 38.9 12.9 28.5 17.1 5.2 5.4 7.3 13.5 25.8 33.1 35.8 37.7
3. Geographical breakdown(cumulated transactions)
Total European Union 27 (outside the euro area) Brazil Canada China India Japan Russia Switzer- United Other
land StatesTotal Den- Sweden United Other EU EU
mark Kingdom countries insti-2008 Q2 to tutions
2009 Q1 1 2 3 4 5 6 7 8 9 10 11 12 13 14 15 16
Credits
Current account 2,640.6 949.6 57.8 80.4 487.6 267.2 56.5 39.1 34.2 83.1 29.8 54.9 96.1 183.3 383.7 786.8 Goods 1,497.5 509.5 34.7 50.4 217.4 206.9 0.0 21.8 18.0 64.0 22.4 32.3 73.0 90.9 183.2 482.5 Services 498.5 166.8 12.5 13.1 107.1 28.6 5.6 7.5 6.7 14.7 5.6 11.1 13.5 49.3 77.7 145.5 Income 556.6 210.6 9.8 15.4 150.1 28.5 6.7 9.6 8.8 4.0 1.7 11.2 9.2 36.3 115.9 149.3 Investment income 537.8 204.1 9.7 15.2 148.5 27.8 2.9 9.5 8.7 4.0 1.7 11.2 9.1 29.3 114.1 146.0 Current transfers 88.1 62.7 0.8 1.6 12.9 3.2 44.2 0.2 0.7 0.3 0.1 0.4 0.4 6.8 6.9 9.5 Capital account 21.0 17.7 0.1 0.0 1.2 0.2 16.2 0.0 0.0 0.0 0.0 0.0 0.1 0.5 1.4 1.1
Debits
Current account 2,766.8 870.3 46.6 80.3 419.8 221.2 102.4 - 31.2 - - 96.7 - 178.2 388.9 - Goods 1,511.3 412.0 29.7 47.1 164.1 171.1 0.0 26.6 14.0 177.7 20.7 52.7 101.1 79.1 141.9 485.4 Services 465.0 140.6 8.3 11.3 87.7 33.1 0.2 5.6 6.8 11.3 4.6 8.3 9.0 39.6 97.0 142.4 Income 603.9 204.7 7.6 20.7 155.7 12.1 8.6 - 8.6 - - 35.2 - 53.5 142.0 - Investment income 593.4 198.6 7.5 20.6 154.2 7.7 8.6 - 8.6 - - 35.1 - 53.0 141.0 - Current transfers 186.5 112.9 1.0 1.2 12.4 4.8 93.6 1.5 1.8 2.5 0.7 0.6 0.5 6.0 8.0 52.0 Capital account 13.4 2.5 0.0 0.1 1.2 0.2 1.0 0.2 1.1 0.1 0.2 0.1 0.1 0.6 1.4 7.3
Net
Current account -126.1 79.3 11.3 0.1 67.7 46.1 -45.9 - 3.0 - - -41.8 - 5.1 -5.1 - Goods -13.8 97.4 5.0 3.3 53.4 35.8 0.0 -4.8 3.9 -113.7 1.7 -20.4 -28.1 11.8 41.3 -2.9 Services 33.5 26.2 4.2 1.8 19.4 -4.5 5.3 1.9 0.0 3.4 1.0 2.8 4.5 9.8 -19.3 3.1 Income -47.4 5.9 2.3 -5.3 -5.6 16.4 -1.9 - 0.2 - - -24.0 - -17.2 -26.1 - Investment income -55.7 5.5 2.2 -5.4 -5.7 20.1 -5.7 - 0.2 - - -23.9 - -23.7 -26.9 - Current transfers -98.4 -50.2 -0.2 0.4 0.6 -1.6 -49.4 -1.2 -1.1 -2.2 -0.6 -0.2 -0.1 0.7 -1.1 -42.5 Capital account 7.5 15.2 0.1 -0.1 0.0 0.0 15.2 -0.1 -1.0 -0.1 -0.2 -0.1 0.0 -0.1 0.0 -6.2
Source: ECB.

S 63ECB
Monthly Bulletin
August 2009
EURO AREASTATISTICS
External
transactions
and
positions
7.3 Financial account (EUR billions and annual growth rates; outstanding amounts and growth rates at end of period, transactions and other changes during period)
1. Summary financial account
Outstanding amounts (international investment position)
Total 1) Total Direct Portfolio Net Other Reserve
as a % of GDP investment investment financial investment assetsderivatives
Assets Liabilities Net Assets Liabilities Net Assets Liabilities Assets Liabilities Assets Liabilities
1 2 3 4 5 6 7 8 9 10 11 12 13 14
2004 8,602.5 9,518.4 -915.9 109.5 121.2 -11.7 2,268.7 2,235.4 3,045.0 4,080.2 -37.4 3,045.2 3,202.9 281.02005 10,785.2 11,605.3 -820.2 132.3 142.4 -10.1 2,790.8 2,444.3 3,887.5 5,109.1 -21.4 3,805.8 4,052.0 322.52006 12,258.8 13,306.1 -1,047.3 143.3 155.6 -12.2 3,131.7 2,728.7 4,371.5 5,866.5 -20.8 4,448.7 4,711.0 327.72007 13,750.6 14,915.4 -1,164.9 152.9 165.8 -13.0 3,526.1 3,091.6 4,653.8 6,340.0 -10.2 5,233.5 5,483.9 347.4
2008 Q4 13,069.7 14,873.5 -1,803.9 141.0 160.4 -19.5 3,742.5 3,223.1 3,723.6 5,985.8 1.2 5,228.2 5,664.6 374.22009 Q1 12,776.8 14,762.3 -1,985.5 138.9 160.5 -21.6 3,771.7 3,229.1 3,609.5 6,029.9 -44.8 5,044.7 5,503.3 395.7
Changes to outstanding amounts
2004 740.8 888.6 -147.8 9.4 11.3 -1.9 99.2 151.2 389.4 494.0 -17.3 295.4 243.4 -25.72005 2,182.7 2,086.9 95.7 26.8 25.6 1.2 522.1 209.0 842.5 1,028.9 16.0 760.6 849.1 41.52006 1,473.6 1,700.8 -227.1 17.2 19.9 -2.7 340.9 284.3 484.0 757.4 0.6 642.9 659.0 5.22007 1,491.8 1,609.3 -117.5 16.6 17.9 -1.3 394.4 362.9 282.3 473.5 10.6 784.7 772.9 19.7
2008 Q4 -859.4 -311.8 -547.6 -36.4 -13.2 -23.2 -34.9 24.4 -557.5 -43.2 -22.0 -248.3 -292.9 3.32009 Q1 -292.8 -111.2 -181.6 -13.3 -5.1 -8.3 29.2 6.0 -114.0 44.0 -46.0 -183.6 -161.3 21.6
Transactions
2005 1,329.2 1,339.4 -10.2 16.3 16.4 -0.1 358.4 152.4 416.2 543.3 17.3 554.9 643.7 -17.72006 1,680.0 1,821.4 -141.4 19.6 21.3 -1.7 417.4 259.8 527.6 821.4 -3.3 737.4 740.3 0.92007 1,896.7 1,937.9 -41.2 21.1 21.5 -0.5 474.2 381.7 439.5 599.3 67.0 910.9 956.9 5.12008 395.2 698.5 -303.3 4.3 7.5 -3.3 348.1 105.8 -20.2 421.4 56.7 6.7 171.4 3.9
2008 Q3 135.6 197.3 -61.7 5.9 8.6 -2.7 88.7 52.8 -60.9 60.7 8.4 101.0 83.8 -1.6 Q4 -373.1 -246.8 -126.3 -15.8 -10.4 -5.3 47.6 -30.1 -160.7 43.4 16.7 -277.1 -260.1 0.42009 Q1 -246.1 -98.2 -147.9 -11.2 -4.5 -6.7 79.3 40.8 -72.2 107.2 -14.3 -233.2 -246.2 -5.7
2009 Jan. 8.8 54.2 -45.4 . . . 24.9 15.5 31.7 34.1 -7.2 -35.2 4.6 -5.3 Feb. -132.4 -97.9 -34.5 . . . 21.0 12.5 -40.9 40.5 -2.9 -108.4 -150.9 -1.2 Mar. -122.5 -54.6 -68.0 . . . 33.4 12.8 -63.1 32.6 -4.2 -89.6 -100.0 0.8 Apr. 78.7 76.2 2.5 . . . 59.2 54.7 -0.6 -9.6 -7.7 28.0 31.1 -0.1 May -140.2 -115.5 -24.7 . . . 11.9 18.0 10.3 64.0 -10.3 -154.2 -197.5 2.3
Other changes
2004 -76.9 97.0 -173.9 -1.0 1.2 -2.2 -69.8 61.8 43.6 76.2 -25.8 -11.7 -41.0 -13.32005 853.5 747.5 105.9 10.5 9.2 1.3 163.7 56.5 426.3 485.6 -1.4 205.7 205.4 59.22006 -206.4 -120.6 -85.7 -2.4 -1.4 -1.0 -76.5 24.5 -43.6 -63.9 3.9 -94.4 -81.3 4.32007 -404.9 -328.5 -76.3 -4.5 -3.7 -0.8 -79.7 -18.8 -157.2 -125.8 -56.4 -126.1 -184.0 14.6
Other changes due to exchange rate changes
2004 -168.8 -96.4 -72.4 -2.1 -1.2 -0.9 -36.0 7.4 -62.3 -50.2 . -61.2 -53.5 -9.42005 369.3 214.4 154.9 4.5 2.6 1.9 86.9 -18.2 136.8 118.1 . 126.9 114.5 18.72006 -321.7 -207.9 -113.8 -3.8 -2.4 -1.3 -70.7 11.7 -131.1 -118.0 . -104.6 -101.5 -15.32007 -501.6 -244.1 -257.5 -5.6 -2.7 -2.9 -110.0 27.1 -194.5 -124.1 . -182.2 -147.1 -14.9
Other changes due to price changes
2004 102.1 218.6 -116.5 1.3 2.8 -1.5 30.7 25.0 100.3 193.6 -25.8 . . -3.12005 288.1 327.5 -39.4 3.5 4.0 -0.5 60.7 48.6 186.6 278.9 -1.4 . . 42.12006 297.0 309.5 -12.5 3.5 3.6 -0.1 61.2 39.4 215.7 270.1 3.9 . . 16.32007 156.6 -63.8 220.3 1.7 -0.7 2.4 29.6 12.3 151.7 -76.1 -56.4 . . 31.6
Other changes due to other adjustments
2004 -10.3 -25.2 15.0 -0.1 -0.3 0.2 -64.5 29.4 5.6 -67.2 . 49.5 12.5 -0.82005 195.5 205.6 -10.2 2.4 2.5 -0.1 16.0 26.1 102.9 88.6 . 78.8 90.9 -2.22006 -181.4 -222.3 40.9 -2.1 -2.6 0.5 -67.0 -26.6 -128.2 -216.0 . 10.2 20.3 3.72007 -59.5 -20.7 -38.9 -0.7 -0.2 -0.4 0.6 -58.2 -114.3 74.4 . 56.0 -36.8 -1.9
Growth rates of outstanding amounts
2004 10.3 9.1 - . . . 7.8 4.2 12.8 11.5 . 11.1 9.5 -4.12005 14.9 13.7 - . . . 15.2 6.8 13.1 12.8 . 17.6 19.5 -5.82006 15.7 15.8 - . . . 15.0 10.6 13.8 16.3 . 19.5 18.4 0.22007 15.5 14.5 - . . . 15.2 14.0 10.0 10.1 . 20.5 20.4 1.6
2008 Q3 8.2 8.1 - . . . 12.2 8.9 5.3 6.6 . 7.4 9.6 -0.4 Q4 2.8 4.7 - . . . 10.0 3.4 -0.7 7.0 . 0.1 3.2 1.12009 Q1 -3.0 0.1 - . . . 7.2 1.7 -4.0 6.3 . -9.5 -7.1 -1.9
Source: ECB.1) Net financial derivatives are included in assets.
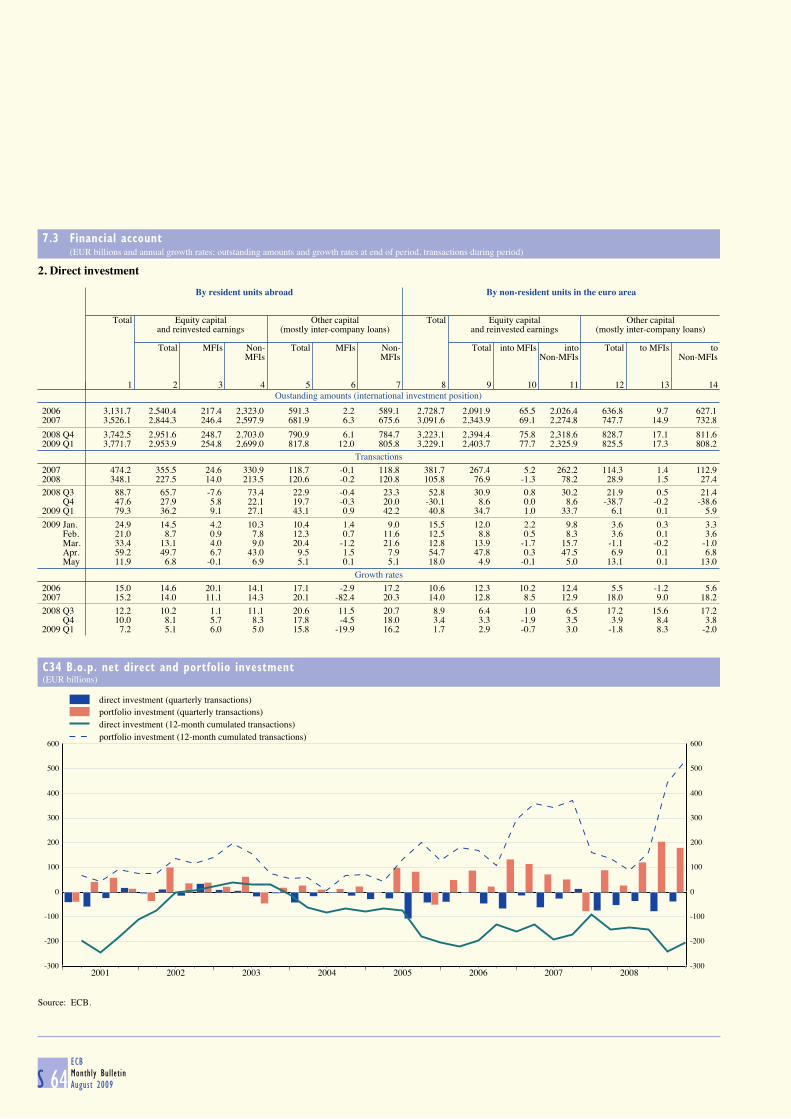
S 64ECB
Monthly Bulletin
August 2009
7.3 Financial account (EUR billions and annual growth rates; outstanding amounts and growth rates at end of period, transactions during period)
2. Direct investment
Oustanding amounts (international investment position)
By resident units abroad By non-resident units in the euro area
Total Equity capital Other capital Total Equity capital Other capital and reinvested earnings (mostly inter-company loans) and reinvested earnings (mostly inter-company loans)
Total MFIs Non- Total MFIs Non- Total into MFIs into Total to MFIs toMFIs MFIs Non-MFIs Non-MFIs
1 2 3 4 5 6 7 8 9 10 11 12 13 14
2006 3,131.7 2,540.4 217.4 2,323.0 591.3 2.2 589.1 2,728.7 2,091.9 65.5 2,026.4 636.8 9.7 627.12007 3,526.1 2,844.3 246.4 2,597.9 681.9 6.3 675.6 3,091.6 2,343.9 69.1 2,274.8 747.7 14.9 732.8
2008 Q4 3,742.5 2,951.6 248.7 2,703.0 790.9 6.1 784.7 3,223.1 2,394.4 75.8 2,318.6 828.7 17.1 811.62009 Q1 3,771.7 2,953.9 254.8 2,699.0 817.8 12.0 805.8 3,229.1 2,403.7 77.7 2,325.9 825.5 17.3 808.2
Transactions
2007 474.2 355.5 24.6 330.9 118.7 -0.1 118.8 381.7 267.4 5.2 262.2 114.3 1.4 112.92008 348.1 227.5 14.0 213.5 120.6 -0.2 120.8 105.8 76.9 -1.3 78.2 28.9 1.5 27.42008 Q3 88.7 65.7 -7.6 73.4 22.9 -0.4 23.3 52.8 30.9 0.8 30.2 21.9 0.5 21.4 Q4 47.6 27.9 5.8 22.1 19.7 -0.3 20.0 -30.1 8.6 0.0 8.6 -38.7 -0.2 -38.62009 Q1 79.3 36.2 9.1 27.1 43.1 0.9 42.2 40.8 34.7 1.0 33.7 6.1 0.1 5.9
2009 Jan. 24.9 14.5 4.2 10.3 10.4 1.4 9.0 15.5 12.0 2.2 9.8 3.6 0.3 3.3 Feb. 21.0 8.7 0.9 7.8 12.3 0.7 11.6 12.5 8.8 0.5 8.3 3.6 0.1 3.6 Mar. 33.4 13.1 4.0 9.0 20.4 -1.2 21.6 12.8 13.9 -1.7 15.7 -1.1 -0.2 -1.0 Apr. 59.2 49.7 6.7 43.0 9.5 1.5 7.9 54.7 47.8 0.3 47.5 6.9 0.1 6.8 May 11.9 6.8 -0.1 6.9 5.1 0.1 5.1 18.0 4.9 -0.1 5.0 13.1 0.1 13.0
Growth rates
2006 15.0 14.6 20.1 14.1 17.1 -2.9 17.2 10.6 12.3 10.2 12.4 5.5 -1.2 5.62007 15.2 14.0 11.1 14.3 20.1 -82.4 20.3 14.0 12.8 8.5 12.9 18.0 9.0 18.2
2008 Q3 12.2 10.2 1.1 11.1 20.6 11.5 20.7 8.9 6.4 1.0 6.5 17.2 15.6 17.2 Q4 10.0 8.1 5.7 8.3 17.8 -4.5 18.0 3.4 3.3 -1.9 3.5 3.9 8.4 3.82009 Q1 7.2 5.1 6.0 5.0 15.8 -19.9 16.2 1.7 2.9 -0.7 3.0 -1.8 8.3 -2.0
C34 B.o.p. net direct and portfolio investment(EUR billions)
-300
-200
-100
0
100
200
300
400
500
600
2001 2002 2003 2004 2005 2006 2007 2008-300
-200
-100
0
100
200
300
400
500
600
direct investment (quarterly transactions)portfolio investment (quarterly transactions)direct investment (12-month cumulated transactions)portfolio investment (12-month cumulated transactions)
Source: ECB.

S 65ECB
Monthly Bulletin
August 2009
EURO AREASTATISTICS
External
transactions
and
positions
7.3 Financial account (EUR billions and annual growth rates; outstanding amounts and growth rates at end of period, transactions during period)
3. Portfolio investment assets
Outstanding amounts (international investment position)
Total Equity Debt instruments
Bonds and notes Money market instruments
Total MFIs Non-MFIs Total MFIs Non-MFIs Total MFIs Non-MFIs
Euro- General Euro- General Euro- Generalsystem government system government system government
1 2 3 4 5 6 7 8 9 10 11 12 13 14 15 16
2006 4,371.5 1,936.2 127.8 2.8 1,808.4 37.0 2,056.0 875.0 13.0 1,181.0 14.1 379.3 311.6 11.1 67.7 0.22007 4,653.8 1,984.7 145.2 2.4 1,839.5 44.6 2,231.5 937.4 15.5 1,294.0 16.9 437.7 350.6 33.9 87.1 0.5
2008 Q4 3,723.6 1,144.8 70.6 3.0 1,074.1 28.0 2,134.3 955.1 19.9 1,179.2 17.0 444.5 376.9 61.6 67.6 1.22009 Q1 3,609.5 1,053.7 62.2 2.9 991.4 27.9 2,089.4 913.5 17.1 1,175.9 16.1 466.5 389.1 58.9 77.4 1.7
Transactions
2007 439.5 79.5 36.0 -0.4 43.6 5.5 282.5 153.6 3.8 128.9 2.0 77.5 68.5 25.0 9.0 0.32008 -20.2 -113.2 -55.4 0.6 -57.8 -0.5 88.6 48.2 10.3 40.4 2.4 4.4 21.8 21.2 -17.4 0.32008 Q3 -60.9 -51.3 -4.4 0.1 -46.9 0.6 19.9 -0.8 -0.2 20.6 1.1 -29.4 -33.0 -1.2 3.6 -0.2 Q4 -160.7 -49.9 -4.0 0.4 -45.8 -1.3 -62.1 -16.7 -1.1 -45.4 -0.5 -48.8 -22.1 -5.1 -26.7 0.22009 Q1 -72.2 -34.4 -7.9 0.0 -26.6 0.2 -57.4 -40.5 -2.4 -16.9 -1.2 19.7 13.4 -0.5 6.3 0.4
2009 Jan. 31.7 12.9 2.8 0.0 10.1 . -2.3 -2.4 -1.1 0.1 . 21.2 17.5 -0.3 3.7 . Feb. -40.9 -28.9 -5.4 0.0 -23.5 . -16.2 -5.3 0.1 -10.9 . 4.2 2.6 0.0 1.6 . Mar. -63.1 -18.4 -5.3 0.0 -13.2 . -38.9 -32.8 -1.4 -6.1 . -5.7 -6.6 -0.1 0.9 . Apr. -0.6 -2.5 0.1 -0.1 -2.6 . 6.9 -6.6 0.6 13.5 . -5.1 0.3 1.3 -5.4 . May 10.3 3.0 1.2 0.0 1.9 . 1.2 -9.8 -0.2 11.1 . 6.0 2.1 -1.9 3.8 .
Growth rates
2006 13.8 9.0 17.5 0.9 8.4 22.1 17.1 24.1 15.8 12.5 9.0 21.3 22.2 220.7 20.4 -27.32007 10.0 4.0 29.0 -13.1 2.3 14.4 13.8 17.8 30.1 10.8 14.0 20.8 22.5 225.0 13.0 173.4
2008 Q3 5.3 -2.4 -26.2 6.6 -0.6 4.4 9.8 10.3 65.0 9.4 19.3 16.9 22.7 146.4 -5.8 -94.1 Q4 -0.7 -6.6 -37.8 26.0 -3.9 -1.3 4.0 5.1 48.9 3.2 14.6 0.7 6.1 82.5 -22.2 52.82009 Q1 -4.0 -7.3 -23.2 19.1 -6.1 0.8 -0.4 -2.3 7.9 1.1 4.3 -10.1 -5.9 51.3 -27.8 74.6
4. Portfolio investment liabilities
Outstanding amounts (international investment position)
Total Equity Debt instruments
Bonds and notes Money market instruments
Total MFIs Non-MFIs Total MFIs Non-MFIs Total MFIs Non-MFIs
General Generalgovernment government
1 2 3 4 5 6 7 8 9 10 11 12
2006 5,866.5 2,910.8 657.6 2,253.2 2,656.9 953.8 1,705.5 1,019.2 298.8 125.7 173.2 138.02007 6,340.0 3,103.1 754.7 2,348.3 2,917.3 1,128.0 1,789.3 1,113.4 319.6 153.4 166.1 142.5
2008 Q4 5,985.8 2,135.2 574.2 1,561.0 3,255.2 1,148.8 2,106.4 1,374.1 595.4 172.4 423.0 355.92009 Q1 6,029.9 2,065.0 593.5 1,471.5 3,337.3 1,139.0 2,198.3 1,437.6 627.6 169.8 457.9 405.3
Transactions
2007 599.3 127.6 76.7 50.6 433.0 229.7 203.4 148.6 38.6 41.1 -2.6 8.12008 421.4 -73.5 94.8 -168.6 274.7 42.3 232.6 205.5 220.2 -6.3 226.4 199.22008 Q3 60.7 -73.6 -14.9 -58.8 63.9 10.3 53.7 54.8 70.4 -4.2 74.7 52.3 Q4 43.4 -42.4 19.2 -61.9 -20.0 -44.8 24.7 40.8 105.8 -10.5 116.3 109.12009 Q1 107.2 -10.9 4.3 -15.3 82.1 -13.7 95.8 65.4 36.0 1.2 34.8 51.1
2009 Jan. 34.1 -32.1 . . 27.4 . . . 38.8 . . . Feb. 40.5 -3.2 . . 39.6 . . . 4.1 . . . Mar. 32.6 24.3 . . 15.2 . . . -6.9 . . . Apr. -9.6 -21.9 . . -15.4 . . . 27.7 . . . May 64.0 11.0 . . 53.5 . . . -0.5 . . .
Growth rates
2006 16.3 12.1 17.5 10.6 22.9 25.9 21.2 15.2 1.5 21.5 -10.0 -11.22007 10.1 4.4 11.4 2.3 16.3 24.3 11.9 14.6 12.7 33.7 -0.2 6.6
2008 Q3 6.6 -2.4 5.6 -5.1 13.0 10.9 14.3 17.8 26.0 19.1 34.3 27.6 Q4 7.0 -3.2 13.0 -8.7 9.6 3.8 13.1 18.9 65.6 -3.5 135.5 144.62009 Q1 6.3 -5.6 3.8 -9.1 9.6 0.9 14.6 17.6 65.3 -5.9 133.9 135.0
Source: ECB.

S 66ECB
Monthly Bulletin
August 2009
7.3 Financial account (EUR billions and annual growth rates; outstanding amounts and growth rates at end of period, transactions during period)
5. Other investment assets
Outstanding amounts (international investment position)
Total Eurosystem MFIs General Other sectors
(excluding Eurosystem) government
Total Loans/ Other Total Loans/ Other Trade Loans/currency Trade Loans/currencycurrency assets currency assets credits and deposits credits and deposits
and anddeposits deposits Currency Currency
and anddeposits deposits
1 2 3 4 5 6 7 8 9 10 11 12 13 14 15
2006 4,448.7 14.1 12.7 1.4 2,937.6 2,874.9 62.8 120.0 14.2 58.2 15.4 1,377.1 187.9 1,062.1 395.62007 5,233.5 39.1 37.7 1.4 3,342.5 3,271.4 71.1 107.1 12.7 48.1 13.5 1,744.8 191.1 1,387.7 441.7
2008 Q4 5,228.2 28.8 27.7 1.0 3,273.9 3,214.9 59.0 101.2 12.0 41.2 7.2 1,824.3 189.2 1,409.7 443.72009 Q1 5,044.7 21.7 21.4 0.3 3,093.8 3,037.2 56.6 106.7 12.0 45.4 14.5 1,822.5 176.9 1,416.2 446.2
Transactions
2007 910.9 22.0 22.0 0.0 548.3 541.0 7.3 -7.6 -1.4 -7.2 -2.0 348.3 13.7 292.7 38.72008 6.7 -9.0 -9.0 0.0 -44.7 -60.0 15.3 -6.6 -1.1 -6.7 -5.9 67.0 9.3 -1.2 -44.82008 Q3 101.0 -1.9 -1.9 0.0 81.3 81.3 0.0 -8.0 -0.1 -8.8 -8.3 29.6 2.7 6.8 -1.5 Q4 -277.1 -6.9 -7.0 0.0 -240.9 -250.8 10.0 0.0 -0.3 1.0 -1.9 -29.3 -9.5 -19.0 -3.72009 Q1 -233.2 -8.2 -8.2 0.0 -222.1 -220.3 -1.8 6.5 0.0 5.8 9.1 -9.4 -8.6 -1.1 -1.7
2009 Jan. -35.2 -2.3 . . -39.6 . . 13.5 . . 12.7 -6.8 . . 4.2 Feb. -108.4 -3.6 . . -92.5 . . -7.8 . . -4.5 -4.4 . . -9.8 Mar. -89.6 -2.2 . . -90.0 . . 0.8 . . 0.8 1.9 . . 4.0 Apr. 28.0 1.6 . . 39.6 . . -9.9 . . -10.2 -3.4 . . -7.3 May -154.2 0.0 . . -65.2 . . 3.8 . . 3.7 -92.8 . . -21.4
Growth rates
2006 19.5 -37.6 -40.0 1.6 21.1 21.3 10.7 -5.5 -26.1 -4.3 24.5 20.0 3.4 24.5 8.52007 20.5 157.3 173.8 -1.7 18.8 18.9 11.5 -6.4 -9.7 -12.4 -13.1 25.2 7.4 27.3 9.8
2008 Q3 7.4 2.0 2.3 0.3 7.6 7.5 10.5 -5.1 -8.9 -13.2 -31.4 7.9 12.5 3.7 -12.5 Q4 0.1 -26.4 -27.1 5.0 -1.3 -1.8 21.7 -6.2 -8.6 -14.1 -45.7 3.8 4.8 -0.1 -10.62009 Q1 -9.5 -57.3 -58.7 6.0 -13.6 -14.1 11.2 4.6 -6.4 9.0 35.9 -0.9 -2.9 -3.1 -14.2
6. Other investment liabilities
Outstanding amounts (international investment position)
Total Eurosystem MFIs General Other sectors
(excluding Eurosystem) government
Total Loans/ Other Total Loans/ Other Total Trade Loans Other Total Trade Loans Othercurrency liabilities currency liabilities credits liabilities credits liabilities
and anddeposits deposits
1 2 3 4 5 6 7 8 9 10 11 12 13 14 15
2006 4,711.0 116.3 116.1 0.2 3,484.8 3,430.4 54.5 51.6 0.0 47.5 4.1 1,058.2 146.8 819.6 91.72007 5,483.9 201.7 201.4 0.2 3,938.7 3,871.7 67.0 51.8 0.0 46.6 5.2 1,291.7 158.4 1,024.1 109.3
2008 Q4 5,664.6 481.5 481.2 0.3 3,762.9 3,704.2 58.6 61.7 0.0 57.7 3.9 1,358.6 166.4 1,076.7 115.52009 Q1 5,503.3 404.0 400.9 3.2 3,708.6 3,650.0 58.6 58.6 0.0 55.2 3.4 1,332.1 161.0 1,057.1 114.0
Transactions
2007 956.9 91.4 91.4 0.0 635.2 630.4 4.8 -0.9 0.0 -1.8 0.9 231.3 9.9 224.4 -3.02008 171.4 280.0 280.0 0.1 -181.4 -192.3 10.9 9.5 0.0 10.9 -1.4 63.2 6.3 57.5 -0.52008 Q3 83.8 107.8 107.7 0.1 -26.9 -30.9 4.0 2.2 0.0 2.4 -0.1 0.7 1.5 2.8 -3.7 Q4 -260.1 110.6 110.7 -0.1 -411.7 -418.0 6.3 9.0 0.0 8.6 0.4 32.0 -3.9 29.0 6.82009 Q1 -246.2 -81.5 -84.4 2.9 -112.1 -110.8 -1.3 -2.1 0.0 -0.9 -1.2 -50.5 -8.8 -37.1 -4.7
2009 Jan. 4.6 -59.1 . . 107.8 . . 2.0 . . . -46.1 . . . Feb. -150.9 -28.1 . . -105.7 . . -5.2 . . . -11.9 . . . Mar. -100.0 5.6 . . -114.2 . . 1.1 . . . 7.5 . . . Apr. 31.1 -28.9 . . 37.8 . . -0.6 . . . 22.8 . . . May -197.5 -20.2 . . -67.3 . . 0.1 . . . -110.2 . . .
Growth rates
2006 18.4 22.4 22.4 5.7 16.1 16.1 13.3 3.6 -24.1 4.2 -3.2 27.3 9.8 31.9 17.62007 20.4 79.2 79.4 -6.9 18.3 18.5 8.8 -1.6 29.1 -3.6 18.0 21.4 6.7 27.4 -1.5
2008 Q3 9.6 126.0 126.3 10.3 7.1 7.1 7.2 -9.6 54.1 -6.0 -42.4 3.0 9.2 4.0 -13.5 Q4 3.2 140.9 141.1 20.8 -4.6 -4.9 16.1 18.3 -4.8 23.5 -28.3 4.9 4.0 5.6 -0.82009 Q1 -7.1 82.4 81.3 709.6 -13.6 -14.0 9.2 15.5 0.9 17.9 -19.4 -2.3 -3.5 -1.6 -7.5
Source: ECB.
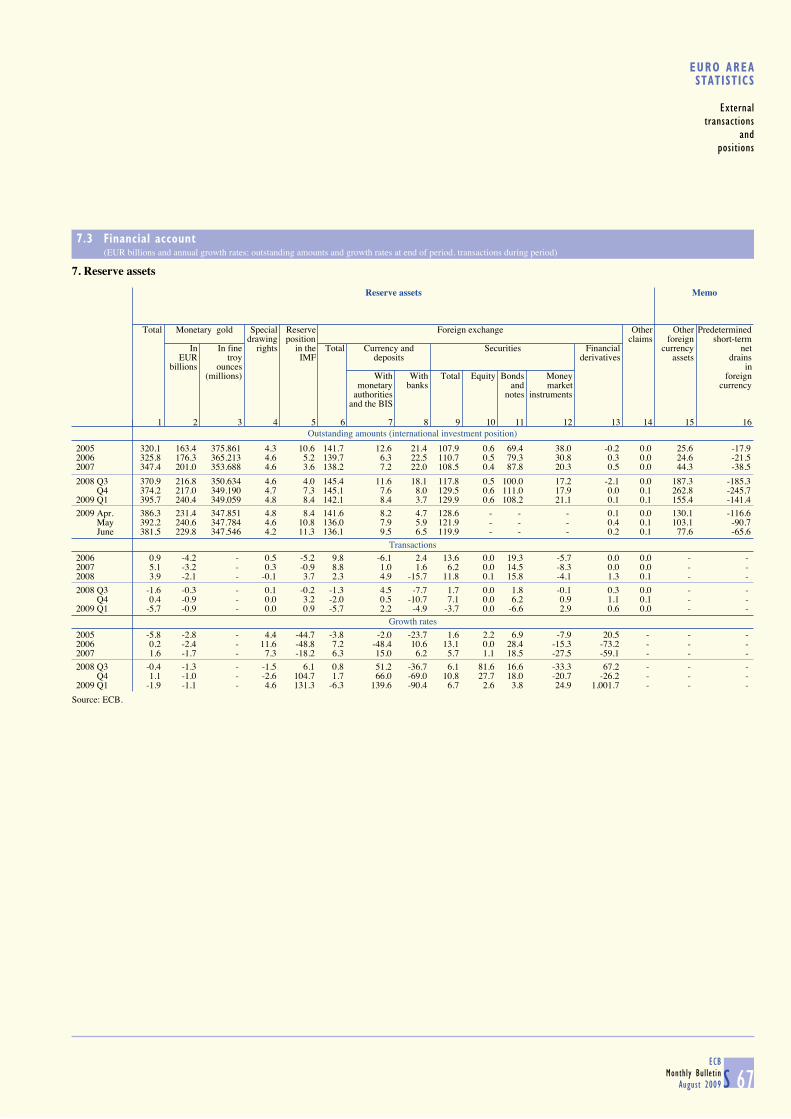
S 67ECB
Monthly Bulletin
August 2009
EURO AREASTATISTICS
External
transactions
and
positions
7.3 Financial account (EUR billions and annual growth rates; outstanding amounts and growth rates at end of period, transactions during period)
7. Reserve assets
Outstanding amounts (international investment position)
Reserve assets Memo
Total Monetary gold Special Reserve Foreign exchange Other Other Predetermined
drawing position claims foreign short-termIn In fine rights in the Total Currency and Securities Financial currency net
EUR troy IMF deposits derivatives assets drainsbillions ounces in
(millions) With With Total Equity Bonds Money foreignmonetary banks and market currency
authorities notes instrumentsand the BIS
1 2 3 4 5 6 7 8 9 10 11 12 13 14 15 16
2005 320.1 163.4 375.861 4.3 10.6 141.7 12.6 21.4 107.9 0.6 69.4 38.0 -0.2 0.0 25.6 -17.92006 325.8 176.3 365.213 4.6 5.2 139.7 6.3 22.5 110.7 0.5 79.3 30.8 0.3 0.0 24.6 -21.52007 347.4 201.0 353.688 4.6 3.6 138.2 7.2 22.0 108.5 0.4 87.8 20.3 0.5 0.0 44.3 -38.5
2008 Q3 370.9 216.8 350.634 4.6 4.0 145.4 11.6 18.1 117.8 0.5 100.0 17.2 -2.1 0.0 187.3 -185.3 Q4 374.2 217.0 349.190 4.7 7.3 145.1 7.6 8.0 129.5 0.6 111.0 17.9 0.0 0.1 262.8 -245.72009 Q1 395.7 240.4 349.059 4.8 8.4 142.1 8.4 3.7 129.9 0.6 108.2 21.1 0.1 0.1 155.4 -141.4
2009 Apr. 386.3 231.4 347.851 4.8 8.4 141.6 8.2 4.7 128.6 - - - 0.1 0.0 130.1 -116.6 May 392.2 240.6 347.784 4.6 10.8 136.0 7.9 5.9 121.9 - - - 0.4 0.1 103.1 -90.7 June 381.5 229.8 347.546 4.2 11.3 136.1 9.5 6.5 119.9 - - - 0.2 0.1 77.6 -65.6
Transactions
2006 0.9 -4.2 - 0.5 -5.2 9.8 -6.1 2.4 13.6 0.0 19.3 -5.7 0.0 0.0 - - 2007 5.1 -3.2 - 0.3 -0.9 8.8 1.0 1.6 6.2 0.0 14.5 -8.3 0.0 0.0 - - 2008 3.9 -2.1 - -0.1 3.7 2.3 4.9 -15.7 11.8 0.1 15.8 -4.1 1.3 0.1 - -
2008 Q3 -1.6 -0.3 - 0.1 -0.2 -1.3 4.5 -7.7 1.7 0.0 1.8 -0.1 0.3 0.0 - - Q4 0.4 -0.9 - 0.0 3.2 -2.0 0.5 -10.7 7.1 0.0 6.2 0.9 1.1 0.1 - - 2009 Q1 -5.7 -0.9 - 0.0 0.9 -5.7 2.2 -4.9 -3.7 0.0 -6.6 2.9 0.6 0.0 - -
Growth rates
2005 -5.8 -2.8 - 4.4 -44.7 -3.8 -2.0 -23.7 1.6 2.2 6.9 -7.9 20.5 - - - 2006 0.2 -2.4 - 11.6 -48.8 7.2 -48.4 10.6 13.1 0.0 28.4 -15.3 -73.2 - - - 2007 1.6 -1.7 - 7.3 -18.2 6.3 15.0 6.2 5.7 1.1 18.5 -27.5 -59.1 - - -
2008 Q3 -0.4 -1.3 - -1.5 6.1 0.8 51.2 -36.7 6.1 81.6 16.6 -33.3 67.2 - - - Q4 1.1 -1.0 - -2.6 104.7 1.7 66.0 -69.0 10.8 27.7 18.0 -20.7 -26.2 - - - 2009 Q1 -1.9 -1.1 - 4.6 131.3 -6.3 139.6 -90.4 6.7 2.6 3.8 24.9 1,001.7 - - -
Source: ECB.
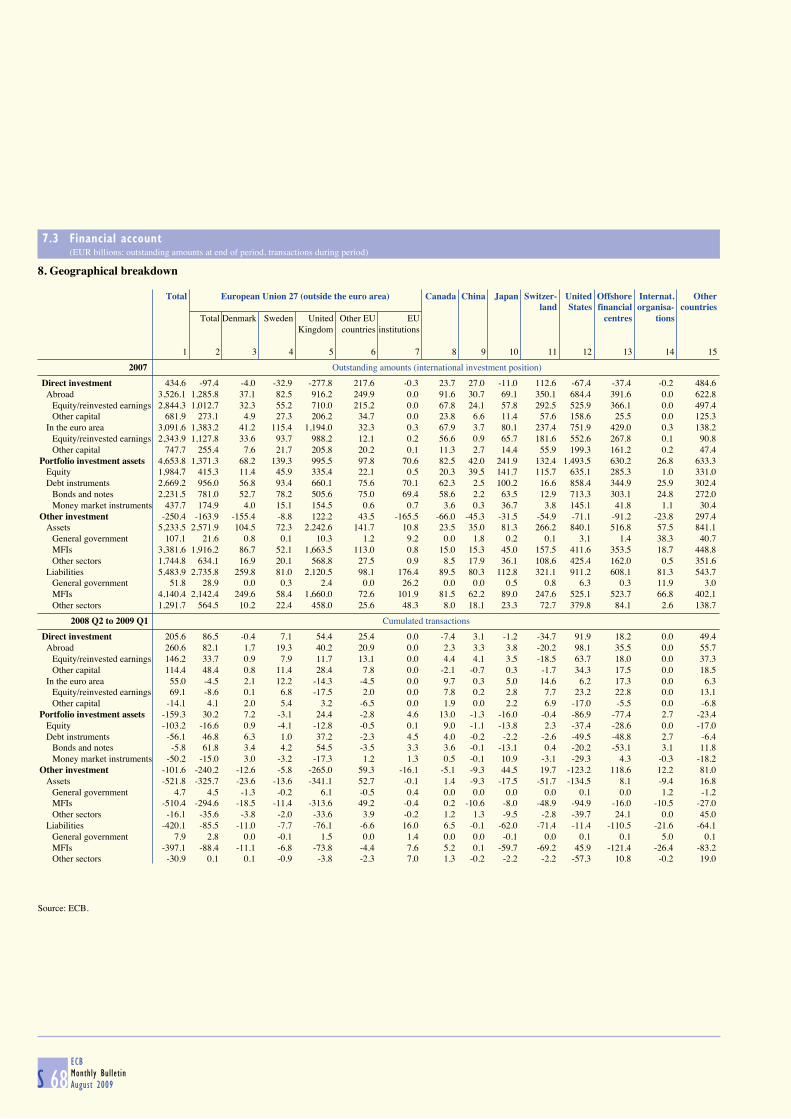
S 68ECB
Monthly Bulletin
August 2009
7.3 Financial account (EUR billions; outstanding amounts at end of period, transactions during period)
8. Geographical breakdown
Total European Union 27 (outside the euro area) Canada China Japan Switzer- United Offshore Internat. Otherland States financial organisa- countries
Total Denmark Sweden United Other EU EU centres tionsKingdom countries institutions
1 2 3 4 5 6 7 8 9 10 11 12 13 14 15
2007 Outstanding amounts (international investment position)
Direct investment 434.6 -97.4 -4.0 -32.9 -277.8 217.6 -0.3 23.7 27.0 -11.0 112.6 -67.4 -37.4 -0.2 484.6 Abroad 3,526.1 1,285.8 37.1 82.5 916.2 249.9 0.0 91.6 30.7 69.1 350.1 684.4 391.6 0.0 622.8
Equity/reinvested earnings 2,844.3 1,012.7 32.3 55.2 710.0 215.2 0.0 67.8 24.1 57.8 292.5 525.9 366.1 0.0 497.4 Other capital 681.9 273.1 4.9 27.3 206.2 34.7 0.0 23.8 6.6 11.4 57.6 158.6 25.5 0.0 125.3
In the euro area 3,091.6 1,383.2 41.2 115.4 1,194.0 32.3 0.3 67.9 3.7 80.1 237.4 751.9 429.0 0.3 138.2 Equity/reinvested earnings 2,343.9 1,127.8 33.6 93.7 988.2 12.1 0.2 56.6 0.9 65.7 181.6 552.6 267.8 0.1 90.8 Other capital 747.7 255.4 7.6 21.7 205.8 20.2 0.1 11.3 2.7 14.4 55.9 199.3 161.2 0.2 47.4
Portfolio investment assets 4,653.8 1,371.3 68.2 139.3 995.5 97.8 70.6 82.5 42.0 241.9 132.4 1,493.5 630.2 26.8 633.3 Equity 1,984.7 415.3 11.4 45.9 335.4 22.1 0.5 20.3 39.5 141.7 115.7 635.1 285.3 1.0 331.0 Debt instruments 2,669.2 956.0 56.8 93.4 660.1 75.6 70.1 62.3 2.5 100.2 16.6 858.4 344.9 25.9 302.4
Bonds and notes 2,231.5 781.0 52.7 78.2 505.6 75.0 69.4 58.6 2.2 63.5 12.9 713.3 303.1 24.8 272.0 Money market instruments 437.7 174.9 4.0 15.1 154.5 0.6 0.7 3.6 0.3 36.7 3.8 145.1 41.8 1.1 30.4
Other investment -250.4 -163.9 -155.4 -8.8 122.2 43.5 -165.5 -66.0 -45.3 -31.5 -54.9 -71.1 -91.2 -23.8 297.4 Assets 5,233.5 2,571.9 104.5 72.3 2,242.6 141.7 10.8 23.5 35.0 81.3 266.2 840.1 516.8 57.5 841.1
General government 107.1 21.6 0.8 0.1 10.3 1.2 9.2 0.0 1.8 0.2 0.1 3.1 1.4 38.3 40.7 MFIs 3,381.6 1,916.2 86.7 52.1 1,663.5 113.0 0.8 15.0 15.3 45.0 157.5 411.6 353.5 18.7 448.8 Other sectors 1,744.8 634.1 16.9 20.1 568.8 27.5 0.9 8.5 17.9 36.1 108.6 425.4 162.0 0.5 351.6
Liabilities 5,483.9 2,735.8 259.8 81.0 2,120.5 98.1 176.4 89.5 80.3 112.8 321.1 911.2 608.1 81.3 543.7 General government 51.8 28.9 0.0 0.3 2.4 0.0 26.2 0.0 0.0 0.5 0.8 6.3 0.3 11.9 3.0 MFIs 4,140.4 2,142.4 249.6 58.4 1,660.0 72.6 101.9 81.5 62.2 89.0 247.6 525.1 523.7 66.8 402.1 Other sectors 1,291.7 564.5 10.2 22.4 458.0 25.6 48.3 8.0 18.1 23.3 72.7 379.8 84.1 2.6 138.7
2008 Q2 to 2009 Q1 Cumulated transactions
Direct investment 205.6 86.5 -0.4 7.1 54.4 25.4 0.0 -7.4 3.1 -1.2 -34.7 91.9 18.2 0.0 49.4 Abroad 260.6 82.1 1.7 19.3 40.2 20.9 0.0 2.3 3.3 3.8 -20.2 98.1 35.5 0.0 55.7
Equity/reinvested earnings 146.2 33.7 0.9 7.9 11.7 13.1 0.0 4.4 4.1 3.5 -18.5 63.7 18.0 0.0 37.3 Other capital 114.4 48.4 0.8 11.4 28.4 7.8 0.0 -2.1 -0.7 0.3 -1.7 34.3 17.5 0.0 18.5
In the euro area 55.0 -4.5 2.1 12.2 -14.3 -4.5 0.0 9.7 0.3 5.0 14.6 6.2 17.3 0.0 6.3 Equity/reinvested earnings 69.1 -8.6 0.1 6.8 -17.5 2.0 0.0 7.8 0.2 2.8 7.7 23.2 22.8 0.0 13.1 Other capital -14.1 4.1 2.0 5.4 3.2 -6.5 0.0 1.9 0.0 2.2 6.9 -17.0 -5.5 0.0 -6.8
Portfolio investment assets -159.3 30.2 7.2 -3.1 24.4 -2.8 4.6 13.0 -1.3 -16.0 -0.4 -86.9 -77.4 2.7 -23.4 Equity -103.2 -16.6 0.9 -4.1 -12.8 -0.5 0.1 9.0 -1.1 -13.8 2.3 -37.4 -28.6 0.0 -17.0 Debt instruments -56.1 46.8 6.3 1.0 37.2 -2.3 4.5 4.0 -0.2 -2.2 -2.6 -49.5 -48.8 2.7 -6.4
Bonds and notes -5.8 61.8 3.4 4.2 54.5 -3.5 3.3 3.6 -0.1 -13.1 0.4 -20.2 -53.1 3.1 11.8 Money market instruments -50.2 -15.0 3.0 -3.2 -17.3 1.2 1.3 0.5 -0.1 10.9 -3.1 -29.3 4.3 -0.3 -18.2
Other investment -101.6 -240.2 -12.6 -5.8 -265.0 59.3 -16.1 -5.1 -9.3 44.5 19.7 -123.2 118.6 12.2 81.0 Assets -521.8 -325.7 -23.6 -13.6 -341.1 52.7 -0.1 1.4 -9.3 -17.5 -51.7 -134.5 8.1 -9.4 16.8
General government 4.7 4.5 -1.3 -0.2 6.1 -0.5 0.4 0.0 0.0 0.0 0.0 0.1 0.0 1.2 -1.2 MFIs -510.4 -294.6 -18.5 -11.4 -313.6 49.2 -0.4 0.2 -10.6 -8.0 -48.9 -94.9 -16.0 -10.5 -27.0 Other sectors -16.1 -35.6 -3.8 -2.0 -33.6 3.9 -0.2 1.2 1.3 -9.5 -2.8 -39.7 24.1 0.0 45.0
Liabilities -420.1 -85.5 -11.0 -7.7 -76.1 -6.6 16.0 6.5 -0.1 -62.0 -71.4 -11.4 -110.5 -21.6 -64.1 General government 7.9 2.8 0.0 -0.1 1.5 0.0 1.4 0.0 0.0 -0.1 0.0 0.1 0.1 5.0 0.1 MFIs -397.1 -88.4 -11.1 -6.8 -73.8 -4.4 7.6 5.2 0.1 -59.7 -69.2 45.9 -121.4 -26.4 -83.2 Other sectors -30.9 0.1 0.1 -0.9 -3.8 -2.3 7.0 1.3 -0.2 -2.2 -2.2 -57.3 10.8 -0.2 19.0
Source: ECB.
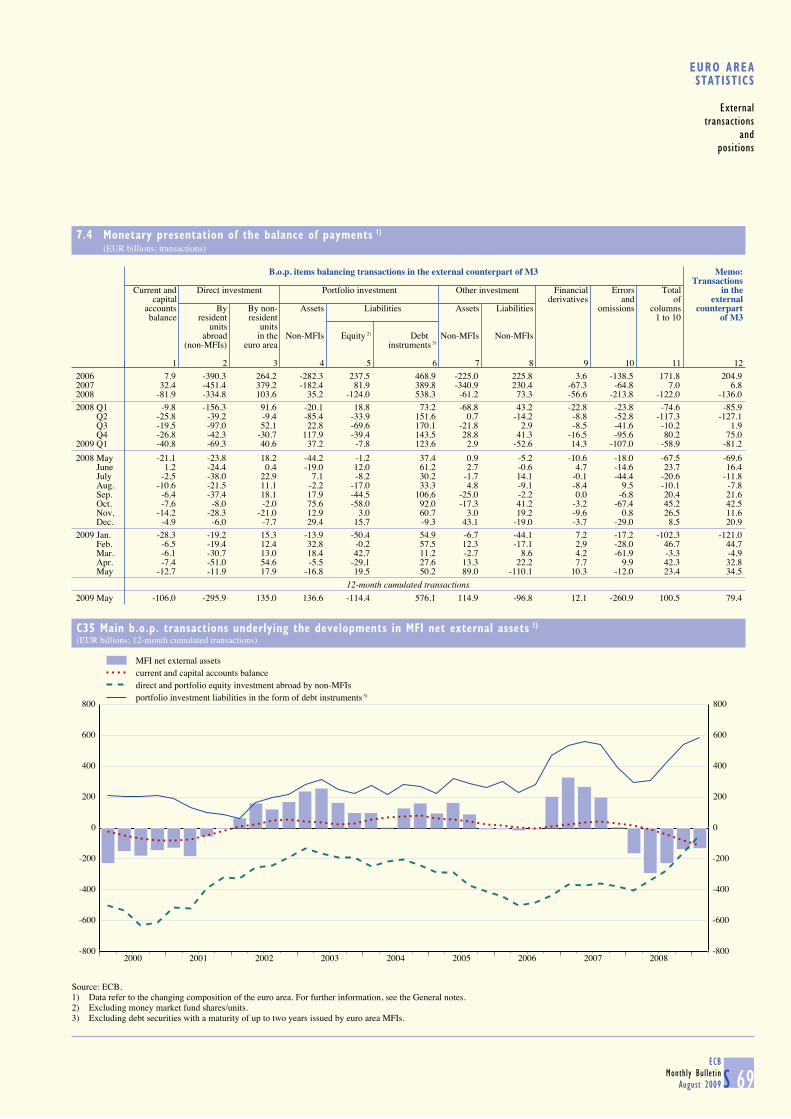
S 69ECB
Monthly Bulletin
August 2009
EURO AREASTATISTICS
External
transactions
and
positions
7.4 Monetary presentation of the balance of payments 1) (EUR billions; transactions)
B.o.p. items balancing transactions in the external counterpart of M3 Memo:
TransactionsCurrent and Direct investment Portfolio investment Other investment Financial Errors Total in the
capital derivatives and of externalaccounts By By non- Assets Liabilities Assets Liabilities omissions columns counterpartbalance resident resident 1 to 10 of M3
units unitsabroad in the Non-MFIs Equity 2) Debt Non-MFIs Non-MFIs
(non-MFIs) euro area instruments 3)
1 2 3 4 5 6 7 8 9 10 11 122006 7.9 -390.3 264.2 -282.3 237.5 468.9 -225.0 225.8 3.6 -138.5 171.8 204.92007 32.4 -451.4 379.2 -182.4 81.9 389.8 -340.9 230.4 -67.3 -64.8 7.0 6.82008 -81.9 -334.8 103.6 35.2 -124.0 538.3 -61.2 73.3 -56.6 -213.8 -122.0 -136.02008 Q1 -9.8 -156.3 91.6 -20.1 18.8 73.2 -68.8 43.2 -22.8 -23.8 -74.6 -85.9 Q2 -25.8 -39.2 -9.4 -85.4 -33.9 151.6 0.7 -14.2 -8.8 -52.8 -117.3 -127.1 Q3 -19.5 -97.0 52.1 22.8 -69.6 170.1 -21.8 2.9 -8.5 -41.6 -10.2 1.9 Q4 -26.8 -42.3 -30.7 117.9 -39.4 143.5 28.8 41.3 -16.5 -95.6 80.2 75.02009 Q1 -40.8 -69.3 40.6 37.2 -7.8 123.6 2.9 -52.6 14.3 -107.0 -58.9 -81.2
2008 May -21.1 -23.8 18.2 -44.2 -1.2 37.4 0.9 -5.2 -10.6 -18.0 -67.5 -69.6 June 1.2 -24.4 0.4 -19.0 12.0 61.2 2.7 -0.6 4.7 -14.6 23.7 16.4 July -2.5 -38.0 22.9 7.1 -8.2 30.2 -1.7 14.1 -0.1 -44.4 -20.6 -11.8 Aug. -10.6 -21.5 11.1 -2.2 -17.0 33.3 4.8 -9.1 -8.4 9.5 -10.1 -7.8 Sep. -6.4 -37.4 18.1 17.9 -44.5 106.6 -25.0 -2.2 0.0 -6.8 20.4 21.6 Oct. -7.6 -8.0 -2.0 75.6 -58.0 92.0 -17.3 41.2 -3.2 -67.4 45.2 42.5 Nov. -14.2 -28.3 -21.0 12.9 3.0 60.7 3.0 19.2 -9.6 0.8 26.5 11.6 Dec. -4.9 -6.0 -7.7 29.4 15.7 -9.3 43.1 -19.0 -3.7 -29.0 8.5 20.92009 Jan. -28.3 -19.2 15.3 -13.9 -50.4 54.9 -6.7 -44.1 7.2 -17.2 -102.3 -121.0 Feb. -6.5 -19.4 12.4 32.8 -0.2 57.5 12.3 -17.1 2.9 -28.0 46.7 44.7 Mar. -6.1 -30.7 13.0 18.4 42.7 11.2 -2.7 8.6 4.2 -61.9 -3.3 -4.9 Apr. -7.4 -51.0 54.6 -5.5 -29.1 27.6 13.3 22.2 7.7 9.9 42.3 32.8 May -12.7 -11.9 17.9 -16.8 19.5 50.2 89.0 -110.1 10.3 -12.0 23.4 34.5
12-month cumulated transactions 2009 May -106.0 -295.9 135.0 136.6 -114.4 576.1 114.9 -96.8 12.1 -260.9 100.5 79.4
C35 Main b.o.p. transactions underlying the developments in MFI net external assets 1) (EUR billions; 12-month cumulated transactions)
-800
-600
-400
-200
0
200
400
600
800
2000 2001 2002 2003 2004 2005 2006 2007 2008-800
-600
-400
-200
0
200
400
600
800
MFI net external assetscurrent and capital accounts balancedirect and portfolio equity investment abroad by non-MFIsportfolio investment liabilities in the form of debt instruments
Source: ECB.1) Data refer to the changing composition of the euro area. For further information, see the General notes.2) Excluding money market fund shares/units.3) Excluding debt securities with a maturity of up to two years issued by euro area MFIs.
3)
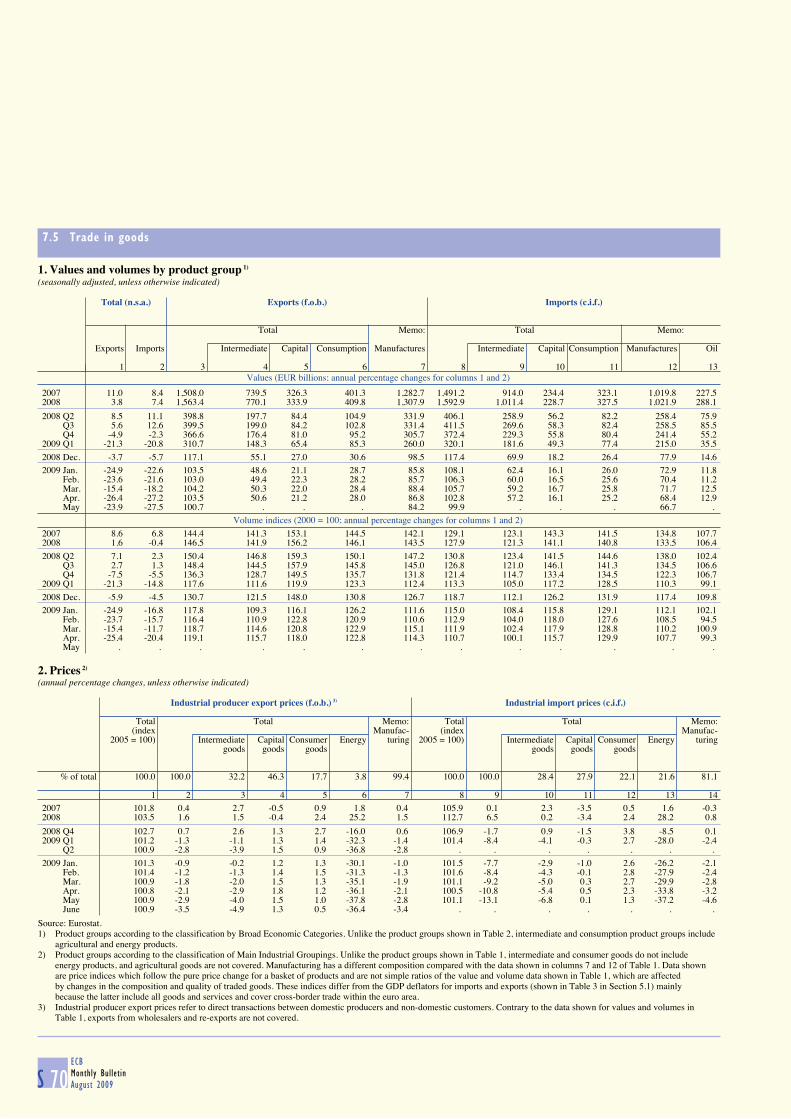
S 70ECB
Monthly Bulletin
August 2009
7.5 Trade in goods
1. Values and volumes by product group 1) (seasonally adjusted, unless otherwise indicated)
Values (EUR billions; annual percentage changes for columns 1 and 2)
Total (n.s.a.) Exports (f.o.b.) Imports (c.i.f.)
Total Memo: Total Memo:
Exports Imports Intermediate Capital Consumption Manufactures Intermediate Capital Consumption Manufactures Oil
1 2 3 4 5 6 7 8 9 10 11 12 13
2007 11.0 8.4 1,508.0 739.5 326.3 401.3 1,282.7 1,491.2 914.0 234.4 323.1 1,019.8 227.52008 3.8 7.4 1,563.4 770.1 333.9 409.8 1,307.9 1,592.9 1,011.4 228.7 327.5 1,021.9 288.1
2008 Q2 8.5 11.1 398.8 197.7 84.4 104.9 331.9 406.1 258.9 56.2 82.2 258.4 75.9 Q3 5.6 12.6 399.5 199.0 84.2 102.8 331.4 411.5 269.6 58.3 82.4 258.5 85.5 Q4 -4.9 -2.3 366.6 176.4 81.0 95.2 305.7 372.4 229.3 55.8 80.4 241.4 55.22009 Q1 -21.3 -20.8 310.7 148.3 65.4 85.3 260.0 320.1 181.6 49.3 77.4 215.0 35.5
2008 Dec. -3.7 -5.7 117.1 55.1 27.0 30.6 98.5 117.4 69.9 18.2 26.4 77.9 14.62009 Jan. -24.9 -22.6 103.5 48.6 21.1 28.7 85.8 108.1 62.4 16.1 26.0 72.9 11.8 Feb. -23.6 -21.6 103.0 49.4 22.3 28.2 85.7 106.3 60.0 16.5 25.6 70.4 11.2 Mar. -15.4 -18.2 104.2 50.3 22.0 28.4 88.4 105.7 59.2 16.7 25.8 71.7 12.5 Apr. -26.4 -27.2 103.5 50.6 21.2 28.0 86.8 102.8 57.2 16.1 25.2 68.4 12.9 May -23.9 -27.5 100.7 . . . 84.2 99.9 . . . 66.7 .
Volume indices (2000 = 100; annual percentage changes for columns 1 and 2)
2007 8.6 6.8 144.4 141.3 153.1 144.5 142.1 129.1 123.1 143.3 141.5 134.8 107.72008 1.6 -0.4 146.5 141.9 156.2 146.1 143.5 127.9 121.3 141.1 140.8 133.5 106.4
2008 Q2 7.1 2.3 150.4 146.8 159.3 150.1 147.2 130.8 123.4 141.5 144.6 138.0 102.4 Q3 2.7 1.3 148.4 144.5 157.9 145.8 145.0 126.8 121.0 146.1 141.3 134.5 106.6 Q4 -7.5 -5.5 136.3 128.7 149.5 135.7 131.8 121.4 114.7 133.4 134.5 122.3 106.72009 Q1 -21.3 -14.8 117.6 111.6 119.9 123.3 112.4 113.3 105.0 117.2 128.5 110.3 99.1
2008 Dec. -5.9 -4.5 130.7 121.5 148.0 130.8 126.7 118.7 112.1 126.2 131.9 117.4 109.82009 Jan. -24.9 -16.8 117.8 109.3 116.1 126.2 111.6 115.0 108.4 115.8 129.1 112.1 102.1 Feb. -23.7 -15.7 116.4 110.9 122.8 120.9 110.6 112.9 104.0 118.0 127.6 108.5 94.5 Mar. -15.4 -11.7 118.7 114.6 120.8 122.9 115.1 111.9 102.4 117.9 128.8 110.2 100.9 Apr. -25.4 -20.4 119.1 115.7 118.0 122.8 114.3 110.7 100.1 115.7 129.9 107.7 99.3 May . . . . . . . . . . . . .
2. Prices 2) (annual percentage changes, unless otherwise indicated)
Industrial producer export prices (f.o.b.) 3) Industrial import prices (c.i.f.)
Total Total Memo: Total Total Memo:
(index Manufac- (index Manufac-2005 = 100) Intermediate Capital Consumer Energy turing 2005 = 100) Intermediate Capital Consumer Energy turing
goods goods goods goods goods goods
% of total 100.0 100.0 32.2 46.3 17.7 3.8 99.4 100.0 100.0 28.4 27.9 22.1 21.6 81.1
1 2 3 4 5 6 7 8 9 10 11 12 13 142007 101.8 0.4 2.7 -0.5 0.9 1.8 0.4 105.9 0.1 2.3 -3.5 0.5 1.6 -0.32008 103.5 1.6 1.5 -0.4 2.4 25.2 1.5 112.7 6.5 0.2 -3.4 2.4 28.2 0.8
2008 Q4 102.7 0.7 2.6 1.3 2.7 -16.0 0.6 106.9 -1.7 0.9 -1.5 3.8 -8.5 0.12009 Q1 101.2 -1.3 -1.1 1.3 1.4 -32.3 -1.4 101.4 -8.4 -4.1 -0.3 2.7 -28.0 -2.4 Q2 100.9 -2.8 -3.9 1.5 0.9 -36.8 -2.8 . . . . . . .
2009 Jan. 101.3 -0.9 -0.2 1.2 1.3 -30.1 -1.0 101.5 -7.7 -2.9 -1.0 2.6 -26.2 -2.1 Feb. 101.4 -1.2 -1.3 1.4 1.5 -31.3 -1.3 101.6 -8.4 -4.3 -0.1 2.8 -27.9 -2.4 Mar. 100.9 -1.8 -2.0 1.5 1.3 -35.1 -1.9 101.1 -9.2 -5.0 0.3 2.7 -29.9 -2.8 Apr. 100.8 -2.1 -2.9 1.8 1.2 -36.1 -2.1 100.5 -10.8 -5.4 0.5 2.3 -33.8 -3.2 May 100.9 -2.9 -4.0 1.5 1.0 -37.8 -2.8 101.1 -13.1 -6.8 0.1 1.3 -37.2 -4.6 June 100.9 -3.5 -4.9 1.3 0.5 -36.4 -3.4 . . . . . . .
Source: Eurostat.1) Product groups according to the classification by Broad Economic Categories. Unlike the product groups shown in Table 2, intermediate and consumption product groups include
agricultural and energy products.2) Product groups according to the classification of Main Industrial Groupings. Unlike the product groups shown in Table 1, intermediate and consumer goods do not include
energy products, and agricultural goods are not covered. Manufacturing has a different composition compared with the data shown in columns 7 and 12 of Table 1. Data shownare price indices which follow the pure price change for a basket of products and are not simple ratios of the value and volume data shown in Table 1, which are affectedby changes in the composition and quality of traded goods. These indices differ from the GDP deflators for imports and exports (shown in Table 3 in Section 5.1) mainlybecause the latter include all goods and services and cover cross-border trade within the euro area.
3) Industrial producer export prices refer to direct transactions between domestic producers and non-domestic customers. Contrary to the data shown for values and volumes in Table 1, exports from wholesalers and re-exports are not covered.
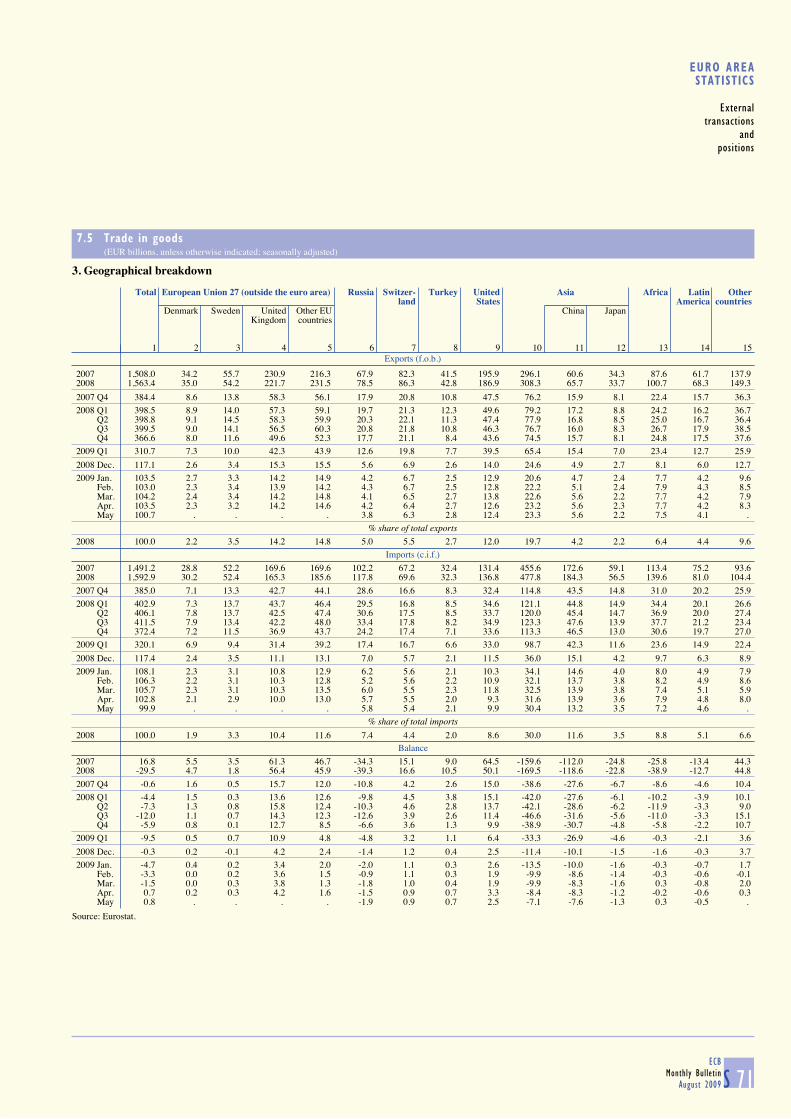
S 71ECB
Monthly Bulletin
August 2009
EURO AREASTATISTICS
External
transactions
and
positions
7.5 Trade in goods (EUR billions, unless otherwise indicated; seasonally adjusted)
3. Geographical breakdown
Exports (f.o.b.)
Total European Union 27 (outside the euro area) Russia Switzer- Turkey United Asia Africa Latin Other
land States America countriesDenmark Sweden United Other EU China Japan
Kingdom countries
1 2 3 4 5 6 7 8 9 10 11 12 13 14 15
2007 1,508.0 34.2 55.7 230.9 216.3 67.9 82.3 41.5 195.9 296.1 60.6 34.3 87.6 61.7 137.92008 1,563.4 35.0 54.2 221.7 231.5 78.5 86.3 42.8 186.9 308.3 65.7 33.7 100.7 68.3 149.3
2007 Q4 384.4 8.6 13.8 58.3 56.1 17.9 20.8 10.8 47.5 76.2 15.9 8.1 22.4 15.7 36.32008 Q1 398.5 8.9 14.0 57.3 59.1 19.7 21.3 12.3 49.6 79.2 17.2 8.8 24.2 16.2 36.7 Q2 398.8 9.1 14.5 58.3 59.9 20.3 22.1 11.3 47.4 77.9 16.8 8.5 25.0 16.7 36.4 Q3 399.5 9.0 14.1 56.5 60.3 20.8 21.8 10.8 46.3 76.7 16.0 8.3 26.7 17.9 38.5 Q4 366.6 8.0 11.6 49.6 52.3 17.7 21.1 8.4 43.6 74.5 15.7 8.1 24.8 17.5 37.62009 Q1 310.7 7.3 10.0 42.3 43.9 12.6 19.8 7.7 39.5 65.4 15.4 7.0 23.4 12.7 25.9
2008 Dec. 117.1 2.6 3.4 15.3 15.5 5.6 6.9 2.6 14.0 24.6 4.9 2.7 8.1 6.0 12.72009 Jan. 103.5 2.7 3.3 14.2 14.9 4.2 6.7 2.5 12.9 20.6 4.7 2.4 7.7 4.2 9.6 Feb. 103.0 2.3 3.4 13.9 14.2 4.3 6.7 2.5 12.8 22.2 5.1 2.4 7.9 4.3 8.5 Mar. 104.2 2.4 3.4 14.2 14.8 4.1 6.5 2.7 13.8 22.6 5.6 2.2 7.7 4.2 7.9 Apr. 103.5 2.3 3.2 14.2 14.6 4.2 6.4 2.7 12.6 23.2 5.6 2.3 7.7 4.2 8.3 May 100.7 . . . . 3.8 6.3 2.8 12.4 23.3 5.6 2.2 7.5 4.1 .
% share of total exports 2008 100.0 2.2 3.5 14.2 14.8 5.0 5.5 2.7 12.0 19.7 4.2 2.2 6.4 4.4 9.6
Imports (c.i.f.)
2007 1,491.2 28.8 52.2 169.6 169.6 102.2 67.2 32.4 131.4 455.6 172.6 59.1 113.4 75.2 93.62008 1,592.9 30.2 52.4 165.3 185.6 117.8 69.6 32.3 136.8 477.8 184.3 56.5 139.6 81.0 104.4
2007 Q4 385.0 7.1 13.3 42.7 44.1 28.6 16.6 8.3 32.4 114.8 43.5 14.8 31.0 20.2 25.92008 Q1 402.9 7.3 13.7 43.7 46.4 29.5 16.8 8.5 34.6 121.1 44.8 14.9 34.4 20.1 26.6 Q2 406.1 7.8 13.7 42.5 47.4 30.6 17.5 8.5 33.7 120.0 45.4 14.7 36.9 20.0 27.4 Q3 411.5 7.9 13.4 42.2 48.0 33.4 17.8 8.2 34.9 123.3 47.6 13.9 37.7 21.2 23.4 Q4 372.4 7.2 11.5 36.9 43.7 24.2 17.4 7.1 33.6 113.3 46.5 13.0 30.6 19.7 27.02009 Q1 320.1 6.9 9.4 31.4 39.2 17.4 16.7 6.6 33.0 98.7 42.3 11.6 23.6 14.9 22.4
2008 Dec. 117.4 2.4 3.5 11.1 13.1 7.0 5.7 2.1 11.5 36.0 15.1 4.2 9.7 6.3 8.92009 Jan. 108.1 2.3 3.1 10.8 12.9 6.2 5.6 2.1 10.3 34.1 14.6 4.0 8.0 4.9 7.9 Feb. 106.3 2.2 3.1 10.3 12.8 5.2 5.6 2.2 10.9 32.1 13.7 3.8 8.2 4.9 8.6 Mar. 105.7 2.3 3.1 10.3 13.5 6.0 5.5 2.3 11.8 32.5 13.9 3.8 7.4 5.1 5.9 Apr. 102.8 2.1 2.9 10.0 13.0 5.7 5.5 2.0 9.3 31.6 13.9 3.6 7.9 4.8 8.0 May 99.9 . . . . 5.8 5.4 2.1 9.9 30.4 13.2 3.5 7.2 4.6 .
% share of total imports 2008 100.0 1.9 3.3 10.4 11.6 7.4 4.4 2.0 8.6 30.0 11.6 3.5 8.8 5.1 6.6
Balance
2007 16.8 5.5 3.5 61.3 46.7 -34.3 15.1 9.0 64.5 -159.6 -112.0 -24.8 -25.8 -13.4 44.32008 -29.5 4.7 1.8 56.4 45.9 -39.3 16.6 10.5 50.1 -169.5 -118.6 -22.8 -38.9 -12.7 44.8
2007 Q4 -0.6 1.6 0.5 15.7 12.0 -10.8 4.2 2.6 15.0 -38.6 -27.6 -6.7 -8.6 -4.6 10.42008 Q1 -4.4 1.5 0.3 13.6 12.6 -9.8 4.5 3.8 15.1 -42.0 -27.6 -6.1 -10.2 -3.9 10.1 Q2 -7.3 1.3 0.8 15.8 12.4 -10.3 4.6 2.8 13.7 -42.1 -28.6 -6.2 -11.9 -3.3 9.0 Q3 -12.0 1.1 0.7 14.3 12.3 -12.6 3.9 2.6 11.4 -46.6 -31.6 -5.6 -11.0 -3.3 15.1 Q4 -5.9 0.8 0.1 12.7 8.5 -6.6 3.6 1.3 9.9 -38.9 -30.7 -4.8 -5.8 -2.2 10.72009 Q1 -9.5 0.5 0.7 10.9 4.8 -4.8 3.2 1.1 6.4 -33.3 -26.9 -4.6 -0.3 -2.1 3.6
2008 Dec. -0.3 0.2 -0.1 4.2 2.4 -1.4 1.2 0.4 2.5 -11.4 -10.1 -1.5 -1.6 -0.3 3.72009 Jan. -4.7 0.4 0.2 3.4 2.0 -2.0 1.1 0.3 2.6 -13.5 -10.0 -1.6 -0.3 -0.7 1.7 Feb. -3.3 0.0 0.2 3.6 1.5 -0.9 1.1 0.3 1.9 -9.9 -8.6 -1.4 -0.3 -0.6 -0.1 Mar. -1.5 0.0 0.3 3.8 1.3 -1.8 1.0 0.4 1.9 -9.9 -8.3 -1.6 0.3 -0.8 2.0 Apr. 0.7 0.2 0.3 4.2 1.6 -1.5 0.9 0.7 3.3 -8.4 -8.3 -1.2 -0.2 -0.6 0.3 May 0.8 . . . . -1.9 0.9 0.7 2.5 -7.1 -7.6 -1.3 0.3 -0.5 .
Source: Eurostat.
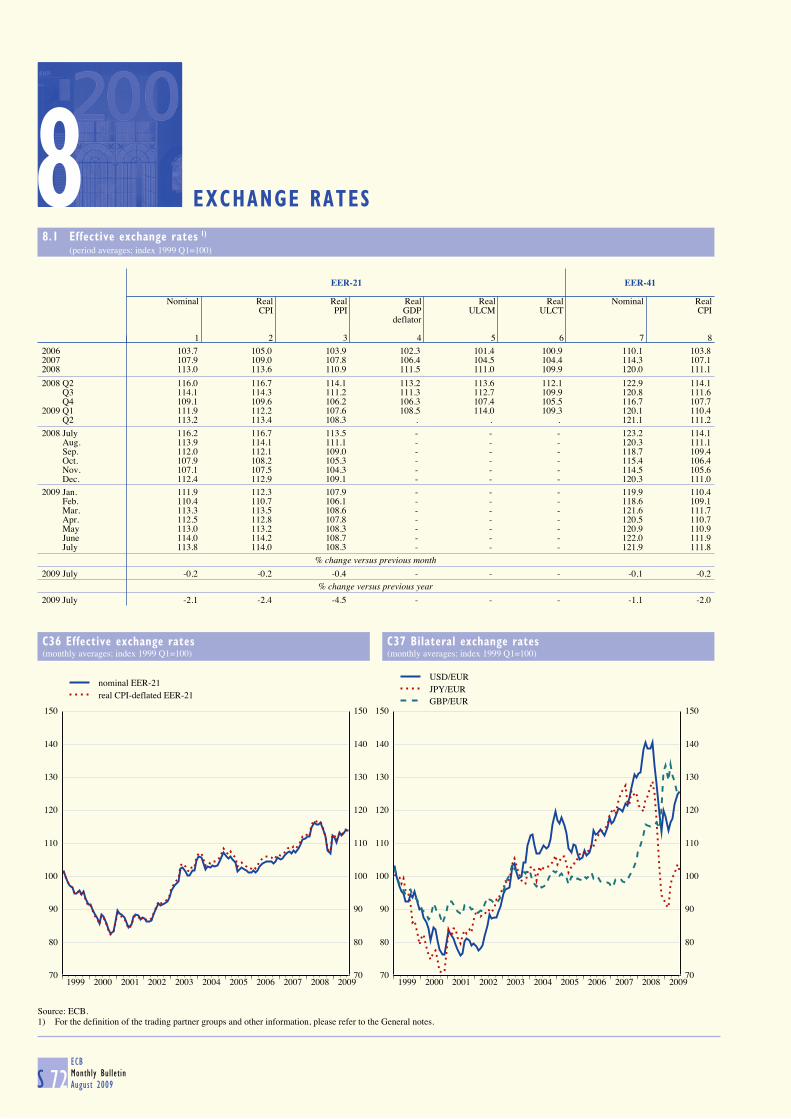
S 72ECB
Monthly Bulletin
August 2009
8 EXCHANGE RATES
8.1 Effective exchange rates 1) (period averages; index 1999 Q1=100)
EER-21 EER-41
Nominal Real Real Real Real Real Nominal RealCPI PPI GDP ULCM ULCT CPI
deflator
1 2 3 4 5 6 7 82006 103.7 105.0 103.9 102.3 101.4 100.9 110.1 103.82007 107.9 109.0 107.8 106.4 104.5 104.4 114.3 107.12008 113.0 113.6 110.9 111.5 111.0 109.9 120.0 111.1
2008 Q2 116.0 116.7 114.1 113.2 113.6 112.1 122.9 114.1 Q3 114.1 114.3 111.2 111.3 112.7 109.9 120.8 111.6 Q4 109.1 109.6 106.2 106.3 107.4 105.5 116.7 107.72009 Q1 111.9 112.2 107.6 108.5 114.0 109.3 120.1 110.4 Q2 113.2 113.4 108.3 . . . 121.1 111.2
2008 July 116.2 116.7 113.5 - - - 123.2 114.1 Aug. 113.9 114.1 111.1 - - - 120.3 111.1 Sep. 112.0 112.1 109.0 - - - 118.7 109.4 Oct. 107.9 108.2 105.3 - - - 115.4 106.4 Nov. 107.1 107.5 104.3 - - - 114.5 105.6 Dec. 112.4 112.9 109.1 - - - 120.3 111.02009 Jan. 111.9 112.3 107.9 - - - 119.9 110.4 Feb. 110.4 110.7 106.1 - - - 118.6 109.1 Mar. 113.3 113.5 108.6 - - - 121.6 111.7 Apr. 112.5 112.8 107.8 - - - 120.5 110.7 May 113.0 113.2 108.3 - - - 120.9 110.9 June 114.0 114.2 108.7 - - - 122.0 111.9 July 113.8 114.0 108.3 - - - 121.9 111.8
% change versus previous month 2009 July -0.2 -0.2 -0.4 - - - -0.1 -0.2
% change versus previous year 2009 July -2.1 -2.4 -4.5 - - - -1.1 -2.0
C36 Effective exchange rates(monthly averages; index 1999 Q1=100)
C37 Bilateral exchange rates(monthly averages; index 1999 Q1=100)
70
80
90
100
110
120
130
140
150
1999 2000 2001 2002 2003 2004 2005 2006 2007 2008 200970
80
90
100
110
120
130
140
150
nominal EER-21real CPI-deflated EER-21
70
80
90
100
110
120
130
140
150
1999 2000 2001 2002 2003 2004 2005 2006 2007 2008 200970
80
90
100
110
120
130
140
150
USD/EURJPY/EURGBP/EUR
Source: ECB.1) For the definition of the trading partner groups and other information, please refer to the General notes.

S 73ECB
Monthly Bulletin
August 2009
EURO AREASTATISTICS
Exchange
rates
8.2 Bilateral exchange rates (period averages; units of national currency per euro)
Danish Swedish Pound US Japanese Swiss South Korean Hong Kong Singapore Canadian Norwegian Australiankrone krona sterling dollar yen franc won dollar dollar dollar krone dollar
1 2 3 4 5 6 7 8 9 10 11 122006 7.4591 9.2544 0.68173 1.2556 146.02 1.5729 1,198.58 9.7545 1.9941 1.4237 8.0472 1.66682007 7.4506 9.2501 0.68434 1.3705 161.25 1.6427 1,272.99 10.6912 2.0636 1.4678 8.0165 1.63482008 7.4560 9.6152 0.79628 1.4708 152.45 1.5874 1,606.09 11.4541 2.0762 1.5594 8.2237 1.7416
2008 Q4 7.4512 10.2335 0.83907 1.3180 126.71 1.5249 1,796.44 10.2191 1.9588 1.5916 8.9328 1.96062009 Q1 7.4514 10.9410 0.90878 1.3029 122.04 1.4977 1,847.59 10.1016 1.9709 1.6223 8.9472 1.9648 Q2 7.4471 10.7806 0.87883 1.3632 132.59 1.5138 1,747.10 10.5657 2.0050 1.5883 8.8431 1.7917
2009 Jan. 7.4519 10.7264 0.91819 1.3239 119.73 1.4935 1,801.97 10.2687 1.9742 1.6233 9.2164 1.9633 Feb. 7.4514 10.9069 0.88691 1.2785 118.30 1.4904 1,843.90 9.9128 1.9411 1.5940 8.7838 1.9723 Mar. 7.4509 11.1767 0.91966 1.3050 127.65 1.5083 1,894.48 10.1138 1.9949 1.6470 8.8388 1.9594 Apr. 7.4491 10.8796 0.89756 1.3190 130.25 1.5147 1,760.14 10.2229 1.9823 1.6188 8.7867 1.8504 May 7.4468 10.5820 0.88445 1.3650 131.85 1.5118 1,710.18 10.5807 1.9939 1.5712 8.7943 1.7831 June 7.4457 10.8713 0.85670 1.4016 135.39 1.5148 1,768.80 10.8638 2.0357 1.5761 8.9388 1.7463 July 7.4458 10.8262 0.86092 1.4088 133.09 1.5202 1,778.43 10.9182 2.0421 1.5824 8.9494 1.7504
% change versus previous month 2009 July 0.0 -0.4 0.5 0.5 -1.7 0.4 0.5 0.5 0.3 0.4 0.1 0.2
% change versus previous year 2009 July -0.2 14.5 8.6 -10.7 -21.0 -6.1 10.8 -11.2 -4.7 -0.9 11.2 6.8
Czech Estonian Latvian Lithuanian Hungarian Polish Bulgarian New Roma- Croatian New Turkishkoruna kroon lats litas forint zloty lev nian leu kuna lira
13 14 15 16 17 18 19 20 21 222006 28.342 15.6466 0.6962 3.4528 264.26 3.8959 1.9558 3.5258 7.3247 1.80902007 27.766 15.6466 0.7001 3.4528 251.35 3.7837 1.9558 3.3353 7.3376 1.78652008 24.946 15.6466 0.7027 3.4528 251.51 3.5121 1.9558 3.6826 7.2239 1.9064
2008 Q4 25.344 15.6466 0.7090 3.4528 263.36 3.7658 1.9558 3.8165 7.1752 2.02612009 Q1 27.601 15.6466 0.7061 3.4528 294.19 4.4988 1.9558 4.2682 7.4116 2.1635 Q2 26.679 15.6466 0.7065 3.4528 285.71 4.4523 1.9558 4.1963 7.3528 2.1410
2009 Jan. 27.169 15.6466 0.7043 3.4528 279.86 4.2300 1.9558 4.2354 7.3603 2.1233 Feb. 28.461 15.6466 0.7056 3.4528 298.30 4.6467 1.9558 4.2864 7.4309 2.1280 Mar. 27.231 15.6466 0.7083 3.4528 304.14 4.6210 1.9558 4.2828 7.4430 2.2340 Apr. 26.774 15.6466 0.7093 3.4528 295.26 4.4326 1.9558 4.2041 7.4172 2.1277 May 26.731 15.6466 0.7092 3.4528 281.93 4.4103 1.9558 4.1700 7.3515 2.1251 June 26.545 15.6466 0.7015 3.4528 280.46 4.5084 1.9558 4.2131 7.2954 2.1675 July 25.793 15.6466 0.7006 3.4528 272.06 4.2965 1.9558 4.2184 7.3307 2.1378
% change versus previous month 2009 July -2.8 0.0 -0.1 0.0 -3.0 -4.7 0.0 0.1 0.5 -1.4
% change versus previous year 2009 July 9.6 0.0 -0.4 0.0 17.4 31.8 0.0 18.0 1.4 11.8
Brazilian Chinese Icelandic Indian Indonesian Malaysian Mexican New Zealand Philippine Russian South African Thaireal 1) yuan renminbi krona 2) rupee 3) rupiah ringgit peso 1) dollar peso rouble rand baht
23 24 25 26 27 28 29 30 31 32 33 342006 2.7333 10.0096 87.76 56.844 11,512.37 4.6044 13.6936 1.9373 64.379 34.1117 8.5312 47.5942007 2.6594 10.4178 87.63 56.419 12,528.33 4.7076 14.9743 1.8627 63.026 35.0183 9.6596 44.2142008 2.6737 10.2236 143.83 63.614 14,165.16 4.8893 16.2911 2.0770 65.172 36.4207 12.0590 48.475
2008 Q4 3.0102 9.0155 261.87 64.007 14,469.21 4.6798 17.1856 2.2829 63.653 35.9649 13.0786 45.9042009 Q1 3.0168 8.9066 - 64.795 15,174.96 4.7259 18.7267 2.4498 62.133 44.4165 12.9740 46.038 Q2 2.8245 9.3107 - 66.398 14,334.53 4.8340 18.1648 2.2565 65.097 43.7716 11.5242 47.294
2009 Jan. 3.0596 9.0496 - 64.510 14,802.07 4.7291 18.3762 2.4132 62.354 42.3282 13.1255 46.218 Feb. 2.9685 8.7406 - 62.885 15,233.33 4.6466 18.6536 2.4851 60.832 45.8079 12.8005 45.156 Mar. 3.0198 8.9210 - 66.803 15,477.84 4.7949 19.1278 2.4527 63.105 45.1451 12.9870 46.667 Apr. 2.9197 9.0110 - 66.047 14,552.65 4.7562 17.7645 2.3123 63.462 44.2135 11.8784 46.741 May 2.8232 9.3157 - 66.176 14,137.45 4.8057 17.9969 2.2663 64.600 43.5678 11.4475 47.241 June 2.7391 9.5786 - 66.919 14,315.40 4.9305 18.6813 2.1967 67.036 43.5553 11.2718 47.844 July 2.7221 9.6246 - 68.233 14,241.51 4.9963 18.8143 2.1873 67.724 44.3881 11.2007 47.969
% change versus previous month 2009 July -0.6 0.5 - 2.0 -0.5 1.3 0.7 -0.4 1.0 1.9 -0.6 0.3
% change versus previous year 2009 July 8.5 -10.7 - 1.1 -1.4 -2.5 16.8 4.7 -4.2 20.5 -6.9 -9.2
Source: ECB.1) For these currencies the ECB computes and publishes euro reference exchange rates as from 1 January 2008. Previous data are indicative.2) The most recent rate for the Icelandic krona refers to 3 December 2008.3) For this currency the ECB computes and publishes euro reference exchange rates as from 1 January 2009. Previous data are indicative.

S 74ECB
Monthly Bulletin
August 2009
9 DEVELOPMENTS OUTSIDE THE EURO AREA
9.1 In other EU Member States (annual percentage changes, unless otherwise indicated)
1. Economic and financial developments
HICP
Bulgaria Czech Denmark Estonia Latvia Lithuania Hungary Poland Romania Sweden UnitedRepublic Kingdom
1 2 3 4 5 6 7 8 9 10 11
2007 7.6 3.0 1.7 6.7 10.1 5.8 7.9 2.6 4.9 1.7 2.32008 12.0 6.3 3.6 10.6 15.3 11.1 6.0 4.2 7.9 3.3 3.6
2008 Q4 9.0 4.4 3.0 8.7 11.9 9.4 4.2 3.6 6.9 2.7 3.92009 Q1 5.1 1.5 1.7 3.7 9.0 8.4 2.7 3.6 6.8 2.1 3.0 Q2 3.1 1.0 1.1 0.2 4.4 4.9 3.6 4.3 6.1 1.7 2.1
2009 Feb. 5.4 1.3 1.7 3.9 9.4 8.5 2.9 3.6 6.9 2.2 3.2 Mar. 4.0 1.7 1.6 2.5 7.9 7.4 2.8 4.0 6.7 1.9 2.9 Apr. 3.8 1.3 1.1 0.9 5.9 5.9 3.2 4.3 6.5 1.8 2.3 May 3.0 0.9 1.1 0.3 4.4 4.9 3.8 4.2 5.9 1.7 2.2 June 2.6 0.8 0.9 -0.5 3.1 3.9 3.7 4.2 5.9 1.6 1.8
General government deficit (-)/surplus (+) as a % of GDP
2006 3.0 -2.6 5.2 2.9 -0.5 -0.4 -9.2 -3.9 -2.2 2.5 -2.72007 0.1 -0.6 4.5 2.7 -0.4 -1.0 -4.9 -1.9 -2.5 3.8 -2.72008 1.5 -1.5 3.6 -3.0 -4.0 -3.2 -3.4 -3.9 -5.4 2.5 -5.5
General government gross debt as a % of GDP
2006 22.7 29.6 31.3 4.3 10.7 18.0 65.6 47.7 12.4 45.9 43.42007 18.2 28.9 26.8 3.5 9.0 17.0 65.8 44.9 12.7 40.5 44.22008 14.1 29.8 33.3 4.8 19.5 15.6 73.0 47.1 13.6 38.0 52.0
Long-term government bond yield as a % per annum, period average
2009 Jan. 7.14 4.21 3.44 - 10.64 13.95 8.76 5.46 9.23 2.80 3.17 Feb. 7.09 4.74 3.55 - 11.50 14.50 10.65 5.97 8.42 2.93 3.23 Mar. 7.73 5.16 3.44 - 11.32 14.50 11.65 6.22 9.38 2.94 3.00 Apr. 7.24 5.25 3.50 - 11.15 14.50 10.63 6.19 9.77 3.18 3.16 May 7.08 5.06 3.62 - 11.09 14.50 10.01 6.31 8.32 3.57 3.41 June 7.30 5.45 3.76 - 12.75 14.50 10.15 6.34 11.26 3.62 3.53
3-month interest rate as a % per annum, period average
2009 Jan. 7.03 3.14 4.44 7.28 11.86 8.67 9.80 5.49 14.48 2.23 2.32 Feb. 6.61 2.50 3.86 6.90 10.65 7.19 - 4.69 14.61 1.52 2.09 Mar. 6.58 2.49 3.28 7.11 12.08 7.11 - 4.30 14.49 1.16 1.83 Apr. 6.05 2.50 2.94 6.51 12.43 6.94 9.56 4.20 13.61 1.00 1.53 May 5.98 2.30 2.67 6.27 13.41 6.81 11.30 4.52 11.23 0.95 1.36 June 5.94 2.17 2.35 6.20 21.25 8.14 - 4.60 10.22 0.97 1.24
Real GDP
2007 6.2 6.1 1.6 6.3 10.0 8.9 1.2 6.8 6.2 2.6 2.62008 6.0 3.0 -1.2 -3.6 -4.6 3.0 0.6 4.9 7.1 -0.2 0.7
2008 Q4 3.5 -0.1 -3.7 -9.7 -10.7 -1.3 -2.2 2.6 2.9 -5.1 -1.82009 Q1 -3.5 -3.4 -4.3 -15.1 -18.6 -11.6 -5.4 1.9 -6.2 -6.3 -4.9 Q2 . . . . . -22.6 . . . -6.3 -5.6
Current and capital accounts balance as a % of GDP
2007 -27.2 -2.6 0.7 -16.9 -20.6 -12.8 -5.3 -3.6 -12.9 8.5 -2.52008 -24.5 -2.2 2.3 -7.7 -11.2 -9.7 -7.6 -4.4 -11.8 7.6 -1.5
2008 Q3 -14.2 -3.0 4.3 -6.5 -11.0 -8.4 -9.5 -4.2 -10.9 9.1 -2.1 Q4 -28.7 -5.2 2.6 -3.4 -7.0 -2.9 -10.0 -4.9 -8.3 5.5 -2.02009 Q1 -15.3 4.6 -0.1 1.2 4.1 4.6 1.1 3.2 -3.4 7.3 -2.4
Unit labour costs
2007 14.2 2.9 4.2 19.7 27.3 10.3 5.2 2.6 . 4.7 3.02008 16.2 6.1 7.1 16.7 23.0 10.6 . 6.5 . 2.6 2.3
2008 Q3 13.0 4.1 7.9 19.6 24.5 12.0 - 4.8 - 2.0 1.7 Q4 17.5 7.9 9.1 13.8 18.5 9.3 - 12.2 - 6.0 1.62009 Q1 16.1 4.4 7.2 9.9 3.6 10.0 - 3.9 - 8.2 3.1
Standardised unemployment rate as a % of labour force (s.a.)
2007 6.9 5.3 3.8 4.6 6.0 4.3 7.4 9.6 6.4 6.1 5.32008 5.6 4.4 3.4 5.6 7.5 5.9 7.8 7.2 5.8 6.2 5.6
2008 Q4 5.2 4.5 3.8 7.7 10.3 8.1 8.1 6.9 5.9 6.9 6.32009 Q1 6.0 5.5 4.8 11.0 13.2 11.1 9.3 7.7 6.2 7.6 7.0 Q2 6.6 6.1 5.9 15.6 16.3 14.5 10.2 8.2 . 8.7 .
2009 Feb. 6.0 5.5 4.7 11.0 13.1 11.2 9.3 7.8 6.2 7.6 7.1 Mar. 6.4 5.8 5.2 12.3 14.1 12.1 9.7 8.0 6.2 8.0 7.2 Apr. 6.5 6.0 5.7 14.0 15.3 13.1 10.0 8.1 . 8.4 7.5 May 6.6 6.1 5.9 15.7 16.4 14.5 10.2 8.2 . 8.8 . June 6.8 6.3 6.2 17.0 17.2 15.8 10.3 8.2 . 9.0 .
Sources: European Commission (Economic and Financial Affairs DG and Eurostat), national data, Reuters and ECB calculations.

S 75ECB
Monthly Bulletin
August 2009
EURO AREASTATISTICS
Developments
outside the
euro area
9.2 In the United States and Japan (annual percentage changes, unless otherwise indicated)
1. Economic and financial developments
United States
Consumer Unit labour Real GDP Industrial Unemployment Broad 3-month 10-year Exchange Fiscal Grossprice index costs 1) production rate money 2) interbank zero coupon rate 4) deficit (-)/ public
index as a % of deposit government as national surplus (+) debt 5)
(manufacturing) labour force rate 3) bond yield 3) currency as a % of as a % of(s.a.) end-of- per euro GDP GDP
period
1 2 3 4 5 6 7 8 9 10 11
2005 3.4 2.2 3.1 4.2 5.1 4.2 3.57 4.84 1.2441 -3.3 49.12006 3.2 2.8 2.7 2.7 4.6 5.0 5.20 5.41 1.2556 -2.2 48.52007 2.9 2.7 2.1 1.6 4.6 5.8 5.30 5.35 1.3705 -2.9 49.32008 3.8 0.9 0.4 -3.1 5.8 6.9 2.93 4.39 1.4708 -5.9 56.8
2008 Q2 4.4 0.2 1.6 -0.9 5.4 6.5 2.75 4.66 1.5622 -5.7 49.6 Q3 5.3 1.7 0.0 -3.9 6.1 6.1 2.91 4.69 1.5050 -5.9 52.8 Q4 1.6 1.6 -1.9 -8.7 6.9 8.3 2.77 3.71 1.3180 -8.0 56.82009 Q1 0.0 2.2 -3.3 -14.0 8.1 9.5 1.24 3.03 1.3029 . . Q2 -1.2 . -3.9 -15.0 9.3 8.7 0.84 3.63 1.3632 . .
2009 Mar. -0.4 - - -14.7 8.5 9.3 1.27 3.15 1.3050 - - Apr. -0.7 - - -14.4 8.9 8.3 1.11 3.17 1.3190 - - May -1.3 - - -15.3 9.4 8.8 0.82 3.54 1.3650 - - June -1.4 - - -15.4 9.5 9.0 0.62 4.17 1.4016 - - July . - - . . . 0.52 3.92 1.4088 - -
Japan
2005 -0.3 -2.1 1.9 1.4 4.4 1.8 0.06 1.49 136.85 -6.7 163.22006 0.2 -0.5 2.0 4.5 4.1 1.0 0.30 1.98 146.02 -1.6 160.02007 0.1 -1.1 2.3 2.8 3.8 1.6 0.79 1.89 161.25 -2.5 156.12008 1.4 1.7 -0.7 -3.4 4.0 2.1 0.93 1.67 152.45 . .
2008 Q2 1.4 0.6 0.6 0.8 4.0 2.0 0.92 1.85 163.35 . . Q3 2.2 1.3 -0.3 -1.4 4.0 2.2 0.90 1.75 161.83 . . Q4 1.0 4.4 -4.4 -14.6 4.0 1.8 0.96 1.46 126.71 . . 2009 Q1 -0.1 . -8.4 -34.6 4.5 2.1 0.67 1.24 122.04 . . Q2 -1.0 . . -27.9 . 2.6 0.53 1.41 132.59 . .
2009 Mar. -0.3 - - -34.2 4.8 2.2 0.62 1.26 127.65 - - Apr. -0.1 - - -30.7 5.0 2.7 0.57 1.41 130.25 - - May -1.1 - - -29.6 5.2 2.7 0.53 1.38 131.85 - - June -1.8 - - -23.4 . 2.5 0.49 1.43 135.39 - - July . - - . . . 0.43 1.39 133.09 - -
C38 Real gross domestic product(annual percentage changes; quarterly)
C39 Consumer price indices(annual percentage changes; monthly)
-10
-8
-6
-4
-2
0
2
4
6
1999 2000 2001 2002 2003 2004 2005 2006 2007 2008-10
-8
-6
-4
-2
0
2
4
6
euro areaUnited StatesJapan
-2
-1
0
1
2
3
4
5
6
1999 2000 2001 2002 2003 2004 2005 2006 2007 2008 2009-2
-1
0
1
2
3
4
5
6
euro areaUnited StatesJapan
Sources: National data (columns 1, 2 (United States), 3, 4, 5 (United States), 6, 9 and 10); OECD (column 2 (Japan)); Eurostat (column 5 (Japan), euro area chart data); Reuters(columns 7 and 8); ECB calculations (column 11).1) Seasonally adjusted. The data for the United States refer to the private non-agricultural business sector.2) Average-of-period values; M2 for US, M2+CDs for Japan.3) Percentages per annum. For further information on 3-month interbank deposit rate, see Section 4.6.4) For more information, see Section 8.2.5) Gross consolidated general government debt (end of period).6) Data refer to the changing composition of the euro area. For further information, see the General notes.
6)

S 76ECB
Monthly Bulletin
August 2009
LIST OF CHARTS
C1 Monetary aggregates S12
C2 Counterparts S12
C3 Components of monetary aggregates S13
C4 Components of longer-term fi nancial liabilities S13
C5 Loans to other fi nancial intermediaries and non-fi nancial corporations S14
C6 Loans to households S14
C7 Loans to government S16
C8 Loans to non-euro area residents S16
C9 Total deposits by sector (fi nancial intermediaries) S17
C10 Total deposits and deposits included in M3 by sector (fi nancial intermediaries) S17
C11 Total deposits by sector (non-fi nancial corporations and households) S18
C12 Total deposits and deposits included in M3 by sector (non-fi nancial corporations and households) S18
C13 Deposits by government and non-euro area residents S19
C14 MFI holdings of securities S20
C15 Total assets of investment funds S24
C16 Total outstanding amounts and gross issues of securities, other than shares, issued by euro area residents S35
C17 Net issues of securities, other than shares, seasonally adjusted and non-seasonally adjusted S37
C18 Annual growth rates of long-term debt securities, by sector of the issuer, in all currencies combined S38
C19 Annual growth rates of short-term debt securities, by sector of the issuer, in all currencies combined S39
C20 Annual growth rates for quoted shares issued by euro area residents S40
C21 Gross issues of quoted shares by sector of the issuer S41
C22 New deposits with agreed maturity S43
C23 New loans at fl oating rate and up to 1 year initial rate fi xation S43
C24 Euro area money market rates S44
C25 3-month money market rates S44
C26 Euro area spot yield curves S45
C27 Euro area spot rates and spreads S45
C28 Dow Jones EURO STOXX Broad, Standard & Poor’s 500 and Nikkei 225 S46
C29 Defi cit, borrowing requirement and change in debt S59
C30 Maastricht debt S59
C31 B.o.p. current account balance S60
C32 B.o.p. goods S61
C33 B.o.p. services S61
C34 B.o.p. net direct and portfolio investment S64
C35 Main b.o.p. transactions underlying the developments in MFI net external assets S69
C36 Effective exchange rates S72
C37 Bilateral exchange rates S72
C38 Real gross domestic product S75
C39 Consumer price indices S75

ECB
Monthly Bulletin
August 2009 S 77
TECHNICAL NOTES
RELATING TO THE EURO AREA OVERVIEW
CALCULATION OF GROWTH RATES FOR MONETARY
DEVELOPMENTS
The average growth rate for the quarter ending
in month t is calculated as:
a)
where It is the index of adjusted outstanding
amounts as at month t (see also below).
Likewise, for the year ending in month t, the
average growth rate is calculated as:
b)
RELATING TO SECTIONS 2.1 TO 2.6
CALCULATION OF TRANSACTIONS
Monthly transactions are calculated from monthly
differences in outstanding amounts adjusted for
reclassifi cations, other revaluations, exchange
rate variations and any other changes which do
not arise from transactions.
If Lt represents the outstanding amount at
the end of month t, C t
M the reclassifi cation
adjustment in month t, E t
M the exchange rate
adjustment and V t
M the other revaluation
adjustments, the transactions F t
M in month t are
defi ned as:
c)
Similarly, the quarterly transactions Ft
Q for the
quarter ending in month t are defi ned as:
d)
where Lt-3
is the amount outstanding at the end
of month t-3 (the end of the previous quarter)
and, for example, C t
Q is the reclassifi cation
adjustment in the quarter ending in month t.
For those quarterly series for which monthly
observations are now available (see below), the
quarterly transactions can be derived as the sum
of the three monthly transactions in the quarter.
CALCULATION OF GROWTH RATES FOR MONTHLY
SERIES
Growth rates may be calculated from
transactions or from the index of adjusted
outstanding amounts. If F t
M and Lt are defi ned
as above, the index It of adjusted outstanding
amounts in month t is defi ned as:
e)
The base of the index (of the non-seasonally
adjusted series) is currently set as December
2006 = 100. Time series of the index of adjusted
outstanding amounts are available on the
ECB’s website (www.ecb.europa.eu) under the
“Money, banking and fi nancial markets” sub-
section of the “Statistics” section.
The annual growth rate at for month t – i.e.
the change in the 12 months ending in
month t – may be calculated using either of the
following two formulae:
f)
g)
Unless otherwise indicated, the annual growth
rates refer to the end of the indicated period.
For example, the annual percentage change for
the year 2002 is calculated in g) by dividing
the index of December 2002 by the index of
December 2001.
−1
⎞
⎠
⎟⎟⎟⎟
⎞
⎠
⎟⎟⎟⎟
×100
0.5It−12
+ ∑ It−i−12 + 0.5I
t−15
2
i=1
0.5It + ∑ It−i
+ 0.5It−3
2
i=1
⎞
⎠
⎟⎟⎟⎟
⎞
⎠
⎟⎟⎟⎟
−1 ×1000.5I
t + ∑ I
t−i + 0.5I
t−12
11
i=1
0.5It−12
+ ∑ It−i−12
+ 0.5It−24
11
i=1
Ft = (L
t – L
t–1) – C
t – E
t – V
tM M M M
Ft = (L
t – L
t–3) – C
t – E
t – V
tQ Q Q Q
It = I
t−1 ×
Ft
Lt−1
M⎛
⎝⎜
⎞
⎠⎟1+
at = F
t−iL
t−1−i
M
i=0
⎛
⎝⎜
⎞
⎠⎟
⎡
⎣⎢
⎤
⎦⎥×100∏ 1 + −1
11
at = I
tI
t−12
⎛⎝⎜
⎞⎠⎟× 100−1
ECB
Monthly Bulletin
August 2009S 78
Growth rates for intra-annual periods may be
derived by adapting formula g). For example,
the month-on-month growth rate aM
t may be
calculated as:
h)
Finally, the three-month moving average
(centred) for the annual growth rate of M3 is
obtained as (at+1
+ at + a
t-1)/3, where a
t is defi ned
as in f) or g) above.
CALCULATION OF GROWTH RATES FOR
QUARTERLY SERIES
If F t
Q and Lt-3
are defi ned as above, the index It
of adjusted outstanding amounts for the quarter
ending in month t is defi ned as:
i)
The annual growth rate in the four quarters
ending in month t, i.e. at, may be calculated
using formula g).
SEASONAL ADJUSTMENT OF THE EURO AREA
MONETARY STATISTICS 1
The approach used relies on a multiplicative
decomposition through X-12-ARIMA.2 The
seasonal adjustment may include a day-of-the-
week adjustment, and for some series is carried
out indirectly by means of a linear combination
of components. In particular, this is the case
for M3, derived by aggregating the seasonally
adjusted series for M1, M2 less M1, and M3
less M2.
The seasonal adjustment procedures are fi rst
applied to the index of adjusted outstanding
amounts.3 The resulting estimates of the seasonal
factors are then applied to the levels and to the
adjustments arising from reclassifi cations and
revaluations, in turn yielding seasonally adjusted
transactions. Seasonal (and trading day) factors
are revised at annual intervals or as required.
RELATING TO SECTIONS 3.1 TO 3.5
EQUALITY OF USES AND RESOURCES
In Table 3.1 the data conform to a basic
accounting identity. As regards non-fi nancial
transactions, total uses equal total resources
for each transaction category. Likewise in the
fi nancial account, this accounting identity is
also refl ected, i.e. for each fi nancial instrument
category, total transactions in fi nancial assets
equal total transactions in liabilities. In the
other changes in assets account and the fi nancial
balance sheets, total fi nancial assets equal total
liabilities for each fi nancial instrument category,
with the exception of monetary gold and special
drawing rights, which are by defi nition not a
liability of any sector.
CALCULATION OF BALANCING ITEMS
The balancing items at the end of each
account in Tables 3.1 and 3.2 are computed as
follows:
The trade balance equals imports minus exports
of goods and services vis-à-vis the euro area rest
of the world.
It
It−1
at
=M −1⎛
⎝⎜
⎞
⎠⎟ ×100
It = I
t−3 ×⎛
⎝⎜
⎞
⎠⎟
Lt−3
FtQ
1+
For details, see “Seasonal adjustment of monetary aggregates 1
and HICP for the euro area”, ECB (August 2000) and the
“Statistics” section of the ECB’s website (www.ecb.europa. eu),
under the “Money, banking and fi nancial markets” sub-section.
For details, see Findley, D., Monsell, B., Bell, W., Otto, M., 2
and Chen, B. C. (1998), “New Capabilities and Methods of
the X-12-ARIMA Seasonal Adjustment Program”, Journal
of Business and Economic Statistics, 16, 2, pp.127-152,
or “X-12-ARIMA Reference Manual”, Time Series Staff,
Bureau of the Census, Washington, D.C.
For internal purposes, the model-based approach of TRAMO-
SEATS is also used. For details on TRAMO-SEATS, see
Gomez, V. and Maravall, A. (1996), “Programs TRAMO
and SEATS: Instructions for the User”, Banco de España,
Working Paper No. 9628, Madrid.
It follows that for the seasonally adjusted series, the level of the 3
index for the base period, i.e. December 2001, generally differs
from 100, refl ecting the seasonality of that month.

ECB
Monthly Bulletin
August 2009 S 79
EURO AREASTATISTICS
Technical notes
Net operating surplus and mixed income
is defi ned for resident sectors only and is
calculated as gross value added (gross domestic
product at market prices for the euro area) minus
compensation of employees (uses) minus other
taxes less subsidies on production (uses) minus
consumption of fi xed capital (uses).
Net national income is defi ned for resident
sectors only and is computed as net operating
surplus and mixed income plus compensation of
employees (resources) plus taxes less subsidies
on production (resources) plus net property
income (resources minus uses).
Net disposable income is also only defi ned
for resident sectors and equals net national
income plus net current taxes on income and
wealth (resources minus uses) plus net social
contributions (resources minus uses) plus net
social benefi ts other than social transfers in kind
(resources minus uses) plus net other current
transfers (resources minus uses).
Net saving is defi ned for resident sectors
and is calculated as net disposable income
plus the net adjustment for the change in net
equity of households in pension funds reserves
(resources minus uses) minus fi nal consumption
expenditure (uses). For the rest of the world,
current external account is compiled as the trade
balance plus all net income (resources minus
uses).
Net lending/net borrowing is computed from
the capital account as net saving plus net capital
transfers (resources minus uses) minus gross
capital formation (uses) minus acquisitions
less disposals of non-produced non-fi nancial
assets (uses) plus consumption of fi xed capital
(resources). It can also be calculated in the
fi nancial account as total transactions in fi nancial
assets minus total transactions in liabilities
(also known as changes in netfi nancial worth
(wealth) due to transactions). For the household
and non-fi nancial corporation sectors, there is a
statistical discrepancy between these balancing
items computed from the capital account and
the fi nancial account, respectively.
Changes in net worth (wealth) are calculated
as changes in net worth (wealth) due to savings
and capital transfers plus other changes in net
fi nancial worth (wealth). It currently excludes
other changes in non-fi nancial assets due to
unavailability of data.
Net fi nancial worth (wealth) is calculated as
total fi nancial assets minus total liabilities,
whereas changes in net fi nancial worth (wealth)
are equal to the sum of changes in net fi nancial
worth (wealth) due to transactions (lending/ net
borrowing from the fi nancial account) and other
changes in net fi nancial worth (wealth).
Finally, changes in net fi nancial worth (wealth)
due to transactions are computed as total
transactions in fi nancial assets minus total
transactions in liabilities and other changes in
net fi nancial worth (wealth) are calculated as
total other changes in fi nancial assets minus
total other changes in liabilities.
RELATING TO SECTION 4.3 AND 4.4
CALCULATION OF GROWTH RATES FOR DEBT
SECURITIES AND QUOTED SHARES
Growth rates are calculated on the basis of
fi nancial transactions and therefore exclude
reclassifi cations, revaluations, exchange rate
variations and any other changes which do not
arise from transactions. They may be calculated
from transactions or from the index of notional
stocks. If N t
M represents the transactions (net
issues) in month t and Lt the level outstanding
at the end of the month t, the index It of notional
stocks in month t is defi ned as:
j)
As a base, the index is set equal to 100 on
December 2001. The growth rate at for month
t corresponding to the change in the 12 months
ending in month t, may be calculated using
either of the following two formulae:
It = I
t−1 ×
Nt
Lt−1
⎛
⎝⎜
⎞
⎠⎟1+

ECB
Monthly Bulletin
August 2009S 80
k)
l)
The method used to calculate the growth rates
for securities other than shares is the same as
that used for the monetary aggregates, the only
difference being that an “N” is used rather than
an “F”. The reason for this is to distinguish
between the different ways of obtaining “net
issues” for securities issues statistics and the
equivalent “transactions” calculated used for the
monetary aggregates.
The average growth rate for the quarter ending
in month t is calculated as:
m)
where It is the index of notional stocks as at
month t. Likewise, for the year ending in month
t, the average growth rate is calculated as:
n)
The calculation formula used for Section 4.3 is
also used for Section 4.4 and is likewise based on
that used for the monetary aggregates. Section 4.4
is based on market values and the basis for the
calculation are fi nancial transactions, which
exclude reclassifi cations, revaluations or any
other changes that do not arise from transactions.
Exchange rate variations are not included as all
quoted shares covered are denominated in euro.
SEASONAL ADJUSTMENT OF SECURITIES ISSUES
STATISTICS 4
The approach used relies on a multiplicative
decomposition through X-12-ARIMA. The
seasonal adjustment for the securities issues
total is carried out indirectly by means of a linear
combination of sector and maturity component
breakdowns.
The seasonal adjustment procedures are applied
to the index of notional stocks. The resulting
estimates of the seasonal factors are then
applied to the outstanding amounts, from which
seasonally adjusted net issues are derived.
Seasonal factors are revised at annual intervals
or as required.
Similar as depicted in formula l) and m), the
growth rate at for month t corresponding to the
change in the 6 months ending in month t, may
be calculated using either of the following two
formulae:
o)
p)
RELATING TO TABLE 1 IN SECTION 5.1
SEASONAL ADJUSTMENT OF THE HICP 4
The approach used relies on multiplicative
decomposition through X-12-ARIMA (see
footnote 2 on page S78). The seasonal
adjustment of the overall HICP for the euro
area is carried out indirectly by aggregating
the seasonally adjusted euro area series for
processed food, unprocessed food, industrial
goods excluding energy, and services. Energy
is added without adjustment since there is no
statistical evidence of seasonality. Seasonal
factors are revised at annual intervals or as
required.
at = N
t−iL
t−1−i
M
i=0
⎛
⎝⎜
⎞
⎠⎟
⎡
⎣⎢
⎤
⎦⎥×100∏ 1 + −1
11
at = I
tI
t−12
⎛⎝⎜
⎞⎠⎟×100−1
−1
⎞
⎠
⎟⎟⎟⎟
⎞
⎠
⎟⎟⎟⎟
×100
0.5It−12
+ ∑ It−i−12 + 0.5I
t−15
2
i=1
0.5It + ∑ It−i
+ 0.5It−3
2
i=1
1 1000.5I
tI
t i 0.5I
t 12
11
i 1
0.5It 12
It i 12
0.5It 24
11
i 1
at = N
t−iLt−1−i
M
i=0
⎛
⎝⎜
⎞
⎠⎟
⎡
⎣⎢
⎤
⎦⎥×100∏ 1 + −1
5
at = I
tIt−6
⎛⎝⎜
⎞⎠⎟×100−1
For details, see “Seasonal adjustment of monetary aggregates and 4
HICP for the euro area”, ECB (August 2000) and the “Statistics”
section of the ECB’s website (www.ecb.europa.eu), under the
“Money, banking and fi nancial markets” sub-section.
ECB
Monthly Bulletin
August 2009 S 81
EURO AREASTATISTICS
Technical notes
RELATING TO TABLE 2 IN SECTION 7.1
SEASONAL ADJUSTMENT OF THE BALANCE OF
PAYMENTS CURRENT ACCOUNT
The approach relies on multiplicative
decomposition through X-12-ARIMA (see
footnote 2 on page S78). The raw data for
goods, services and income are pre-adjusted
to take a working-day effect into account. The
working-day adjustment in goods and services
is corrected for national public holidays. The
seasonal adjustment for these items is carried
out using these pre-adjusted series. The seasonal
adjustment of the total current account is carried
out by aggregating the seasonally adjusted euro
area series for goods, services, income and
current transfers. Seasonal (and trading day)
factors are revised at semi-annual intervals or as
required.
RELATING TO SECTION 7.3
CALCULATION OF GROWTH RATES FOR THE
QUARTERLY AND ANNUAL SERIES
The annual growth rate for quarter t is calculated
on the basis of quarterly transactions (Ft) and
positions (Lt), as follows:
The growth rate for the annual series is equal to
the growth rate in the last quarter of the year.
at
t
100i t-3
1Fi
Li-l
— 1

ECB
Monthly Bulletin
August 2009 S 83
The “Euro area statistics” section of the Monthly
Bulletin focuses on statistics for the euro area as
a whole. More detailed and longer runs of data,
with further explanatory notes, are available in
the “Statistics” section of the ECB’s website
(www.ecb.europa.eu). This allows user-friendly
access to data via the ECB’s Statistical Data
Warehouse (http://sdw.ecb.europa.eu/), which
includes search and download facilities. Further
services available under the “Data services”
sub-section include the subscription to different
datasets and a repository of compressed Comma
Separated Value (CSV) fi les. For further
information, please contact us at: statistics@
ecb.europa.eu.
In general, the cut-off date for the statistics
included in the Monthly Bulletin is the day
preceding the fi rst meeting in the month of the
ECB’s Governing Council. For this issue, the
cut-off date was 5 August 2009.
Unless otherwise indicated, all data series covering
observations for 2009 relate to the Euro 16 (the
euro area including Slovakia) for the whole time
series. For interest rates, monetary statistics
and the HICP (and, for consistency reasons, the
components and counterparts of M3 and the
components of the HICP), the statistical series refer
to the changing composition of the euro area. Where
applicable, this is indicated in the tables by means
of a footnote. In such cases, where underlying data
are available, absolute and percentage changes
for the respective year of entry into the euro area
of Greece (2001), Slovenia (2007), Cyprus (2008),
Malta (2008) and Slovakia (2009), calculated
from bases covering the year prior to the year of
entry, use a series in which the impact of these
countries’ joining the euro area is taken into
account. Historical data referring to the euro area
before the entry of Slovakia are available on the
ECB’s website at http://www.ecb.europa.eu/stats/
services/downloads/html/index.en.html.
The statistical series referring to the changing
composition of the euro area are based on the
euro area composition at the time to which the
statistics relate. Thus, data prior to 2001 refer to
the Euro 11, i.e. the following 11 EU Member
States: Belgium, Germany, Ireland, Spain, France,
Italy, Luxembourg, the Netherlands, Austria,
Portugal and Finland. Data from 2001 to 2006
refer to the Euro 12, i.e. the Euro 11 plus Greece.
Data for 2007 refer to the Euro 13, i.e. the Euro 12
plus Slovenia. Data for 2008 refer to the Euro 15,
i.e. the Euro 13 plus Cyprus and Malta, and data
as of 2009 refer to the Euro 16, i.e. the Euro 15
plus Slovakia.
Given that the composition of the European
currency unit (ECU) does not coincide with
the former currencies of the countries that have
adopted the single currency, pre-1999 amounts
originally expressed in the participating
currencies and converted into ECU at current
ECU exchange rates are affected by movements
in the currencies of EU Member States that
have not adopted the euro. To avoid this effect
on the monetary statistics, the pre-1999 data
in Sections 2.1 to 2.8 are expressed in units
converted from national currencies at the
irrevocable euro exchange rates established on
31 December 1998. Unless otherwise indicated,
price and cost statistics before 1999 are based
on data expressed in national currency terms.
Methods of aggregation and/or consolidation
(including cross-country consolidation) have
been used where appropriate.
Recent data are often provisional and may be
revised. Discrepancies between totals and their
components may arise from rounding.
The group “Other EU Member States” comprises
Bulgaria, the Czech Republic, Denmark, Estonia,
Latvia, Lithuania, Hungary, Poland, Romania,
Sweden and the United Kingdom.
In most cases, the terminology used within the
tables follows international standards, such
as those contained in the European System of
Accounts 1995 (ESA 95) and the IMF Balance of
Payments Manual. Transactions refer to voluntary
exchanges (measured directly or derived), while
fl ows also encompass changes in outstanding
amounts owing to price and exchange rate
changes, write-offs, and other changes.
GENERAL NOTES

ECB
Monthly Bulletin
August 2009S 84
In the tables, the term “up to (x) years” means
“up to and including (x) years”.
OVERVIEW
Developments in key indicators for the euro area
are summarised in an overview table.
MONETARY POLICY STATISTICS
Section 1.4 shows statistics on minimum
reserve and liquidity factors. Maintenance
periods for minimum reserve requirements
start every month on the settlement day of the
main refi nancing operation (MRO) following
the Governing Council meeting at which the
monthly assessment of the monetary policy
stance is scheduled, and end on the day
preceding the corresponding settlement day
in the following month. Annual and quarterly
observations refer to averages of the last reserve
maintenance period of the year/quarter.
Table 1 in Section 1.4 shows the components
of the reserve base of credit institutions subject
to reserve requirements. The liabilities vis-
à-vis other credit institutions subject to the
ESCB’s minimum reserve system, the ECB and
participating national central banks (NCBs) are
excluded from the reserve base. When a credit
institution cannot provide evidence of the amount
of its issues of debt securities with a maturity of
up to two years held by the institutions mentioned
above, it may deduct a certain percentage of these
liabilities from its reserve base. The percentage
for calculating the reserve base was 10% until
November 1999 and 30% thereafter.
Table 2 in Section 1.4 contains average data for
completed maintenance periods. The amount
of the reserve requirement of each individual
credit institution is fi rst calculated by applying
the reserve ratio for the corresponding categories
of liabilities to the eligible liabilities, using the
balance sheet data from the end of each calendar
month. Subsequently, each credit institution
deducts from this fi gure a lump-sum allowance
of €100,000. The resulting required reserves are
then aggregated at the euro area level (column 1).
The current account holdings (column 2) are the
aggregate average daily current account holdings
of credit institutions, including those that serve
the fulfi lment of reserve requirements. The excess
reserves (column 3) are the average current account
holdings over the maintenance period in excess of
the required reserves. The defi ciencies (column 4)
are defi ned as the average shortfalls of current
account holdings from required reserves over the
maintenance period, computed on the basis of
those credit institutions that have not fulfi lled their
reserve requirement. The interest rate on minimum
reserves (column 5) is equal to the average, over the
maintenance period, of the ECB’s rate (weighted
according to the number of calendar days) on the
Eurosystem’s MROs (see Section 1.3).
Table 3 in Section 1.4 shows the banking
system’s liquidity position, which is defi ned
as the current account holdings in euro of
credit institutions in the euro area with the
Eurosystem. All amounts are derived from
the consolidated fi nancial statement of the
Eurosystem. The other liquidity-absorbing
operations (column 7) exclude the issuance
of debt certifi cates initiated by NCBs in Stage
Two of EMU. The net other factors (column
10) represent the netted remaining items in
the consolidated fi nancial statement of the
Eurosystem. The credit institutions’ current
accounts (column 11) are equal to the difference
between the sum of liquidity-providing factors
(columns 1 to 5) and the sum of liquidity-
absorbing factors (columns 6 to 10). The base
money (column 12) is calculated as the sum of
the deposit facility (column 6), the banknotes in
circulation (column 8) and the credit institutions’
current account holdings (column 11).
MONEY, BANKING AND INVESTMENT FUNDS
Section 2.1 shows the aggregated balance sheet
of the monetary fi nancial institution (MFI)
sector, i.e. the sum of the harmonised balance
sheets of all MFIs resident in the euro area.
MFIs are central banks, credit institutions as
ECB
Monthly Bulletin
August 2009 S 85
EURO AREASTATISTICS
General notes
defi ned under Community law, money market
funds and other institutions whose business it is
to receive deposits and/or close substitutes for
deposits from entities other than MFIs and, for
their own account (at least in economic terms),
to grant credits and/or make investments in
securities. A complete list of MFIs is published
on the ECB’s website.
Section 2.2 shows the consolidated balance
sheet of the MFI sector, which is obtained by
netting the aggregated balance sheet positions
between MFIs in the euro area. Due to limited
heterogeneity in recording practices, the sum of
the inter-MFI positions is not necessarily zero; the
balance is shown in column 10 of the liabilities
side of Section 2.2. Section 2.3 sets out the euro
area monetary aggregates and counterparts.
These are derived from the consolidated MFI
balance sheet, and include positions of non-
MFIs resident in the euro area held with MFIs
resident in the euro area; they also take account
of some monetary assets/liabilities of central
government. Statistics on monetary aggregates
and counterparts are adjusted for seasonal and
trading-day effects. The external liabilities item
of Sections 2.1 and 2.2 shows the holdings by
non-euro area residents of (i) shares/units issued
by money market funds located in the euro area
and (ii) debt securities issued with a maturity
of up to two years by MFIs located in the euro
area. In Section 2.3, however, these holdings
are excluded from the monetary aggregates and
contribute to the item “net external assets”.
Section 2.4 provides an analysis by sector,
type and original maturity of loans granted by
MFIs other than the Eurosystem (the banking
system) resident in the euro area. Section 2.5
shows an analysis, by sector and instrument, of
deposits held with the euro area banking system.
Section 2.6 shows the securities held by the euro
area banking system, by type of issuer.
Sections 2.2 to 2.6 include transactions, which
are derived as differences in outstanding amounts
adjusted for reclassifi cations, revaluations,
exchange rate variations and any other changes
that do not arise from transactions. Section 2.7
shows selected revaluations that are used in the
derivation of transactions. Sections 2.2 to 2.6
also provide growth rates in terms of annual
percentage changes based on the transactions.
Section 2.8 shows a quarterly currency
breakdown of selected MFI balance sheet items.
Details of the sector defi nitions are set out in the
“Monetary Financial Institutions and Markets
Statistics Sector Manual – Guidance for the
statistical classifi cation of customers. Third
Edition” (ECB, March 2007). The “Guidance
Notes to the Regulation ECB/2001/13 on the
MFI Balance Sheet Statistics” (ECB,
November 2002) explains practices that NCBs
are recommended to follow. Since
1 January 1999, the statistical information has
been collected and compiled on the basis of
Regulation ECB/1998/16 of 1 December 1998
concerning the consolidated balance sheet of the
Monetary Financial Institutions sector 1, as last
amended by Regulation ECB/2003/10 2.
In line with this Regulation, the balance sheet
item “money market paper” has been merged
with the item “debt securities” on both the assets
and liabilities side of the MFI balance sheet.
Section 2.9 shows end-of-quarter outstanding
amounts for the balance sheet of the euro area
investment funds (other than money market
funds). The balance sheet is aggregated and
therefore includes, among the liabilities,
holdings by investment funds of shares/units
issued by other investment funds. Total assets/
liabilities are also broken down by investment
policy (equity funds, bond funds, mixed funds,
real estate funds and other funds) and by type
of investor (general public funds and special
investors’ funds). Section 2.10 shows the
aggregated balance sheet for each investment
fund sector, as identifi ed by investment policy
and type of investor.
OJ L 356, 30.12.1998, p. 7.1
OJ L 250, 2.10.2003, p. 19.2

ECB
Monthly Bulletin
August 2009S 86
EURO AREA ACCOUNTS
Section 3.1 shows quarterly integrated euro area
accounts data, which provide comprehensive
information on the economic activities of
households (including non-profi t institutions
serving households), non-fi nancial corporations,
fi nancial corporations and general government,
as well as on the interaction between these
sectors and both the euro area and the rest of
the world. The non-seasonally adjusted data on
current prices are displayed for the last available
quarter, following a simplifi ed sequence of
accounts in accordance with the methodological
framework of the European System of
Accounts 1995 (ESA 95).
In short, the sequence of accounts (transactions)
comprises: (1) the generation of income
account, which shows how the production
activity translates into various categories
of income; (2) the allocation of primary
income account, which records receipts and
expenses relating to various forms of property
income (for the economy as a whole, the
balancing item of the primary income account
is the national income); (3) the secondary
distribution of income account, which shows
how the national income of an institutional
sector changes because of current transfers;
(4) the use of income account, which shows how
disposable income is spent on consumption or
saved; (5) the capital account, which shows how
savings and net capital transfers are spent in the
acquisition of non-fi nancial assets (the balancing
item of the capital account is net lending/
net borrowing); and (6) the fi nancial account,
which records the net acquisitions of fi nancial
assets and the net incurrence of liabilities. As
each non-fi nancial transaction is mirrored by a
fi nancial transaction, the balancing item of the
fi nancial account conceptually also equals net
lending/net borrowing as calculated from the
capital account.
In addition, opening and closing fi nancial
balance sheets are presented, which provide a
picture of the fi nancial wealth of each individual
sector at a given point in time. Finally, other
changes in fi nancial assets and liabilities
(e.g. those resulting from the impact of changes
in asset prices) are also shown.
The sector coverage of the fi nancial account
and of the fi nancial balance sheets is more
detailed for the fi nancial corporations sector,
showing a breakdown into MFIs, other fi nancial
intermediaries (including fi nancial auxiliaries),
and insurance corporations and pension funds.
Section 3.2 shows four-quarter cumulated fl ows
(transactions) for the so-called non-fi nancial
accounts of the euro area (i.e. accounts (1) to (5)
above) also following the simplifi ed sequence
of accounts.
Section 3.3 shows four-quarter cumulated fl ows
(transactions and other changes) for households’
income, expenditure and accumulation
accounts, and outstanding amounts for the
fi nancial balance sheet accounts, following a
more analytical presentation. Sector-specifi c
transactions and balancing items are arranged
so as to more easily depict fi nancing and
investment decisions of households, whilst
respecting the account identities as presented in
Sections 3.1 and 3.2.
Section 3.4 displays four-quarter cumulated fl ows
(transactions) for non-fi nancial corporations’
income and accumulation accounts, and
outstanding amounts for the fi nancial balance
sheet accounts, following a more analytical
presentation.
Section 3.5 shows four-quarter cumulated
fi nancial fl ows (transactions and other changes)
and outstanding amounts for the fi nancial
balance sheets of insurance corporations and
pension funds.
FINANCIAL MARKETS
The series on fi nancial market statistics for the
euro area cover the EU Member States that
had adopted the euro at the time to which the
statistics relate (changing composition), with
ECB
Monthly Bulletin
August 2009 S 87
EURO AREASTATISTICS
General notes
the exception of statistics on securities issues
(Tables 4.1 to 4.4), which relate to the Euro 16
(i.e. the Euro 15 plus Slovakia) for the whole
time series (fi xed composition).
Statistics on securities other than shares and
quoted shares (Sections 4.1 to 4.4) are produced
by the ECB using data from the ESCB and the
BIS. Section 4.5 presents MFI interest rates on
euro-denominated deposits and loans by euro
area residents. Statistics on money market
interest rates, long-term government bond
yields and stock market indices (Sections 4.6
to 4.8) are produced by the ECB using data
from wire services.
Statistics on securities issues cover securities
other than shares (debt securities), which
are presented in Sections 4.1, 4.2 and 4.3,
and quoted shares, which are presented in
Section 4.4. Debt securities are broken down
into short-term and long-term securities.
“Short-term” means securities with an original
maturity of one year or less (in exceptional
cases two years or less). Securities with a longer
maturity, or with optional maturity dates, the
latest of which is more than one year away, or
with indefi nite maturity dates, are classifi ed as
“long-term”. Long-term debt securities issued
by euro area residents are broken down further
into fi xed and variable rate issues. Fixed rate
issues consist of issues where the coupon rate
does not change during the life of the issues.
Variable rate issues include all issues where
the coupon is periodically re-fi xed by reference
to an independent interest rate or index. The
statistics on debt securities are estimated to
cover approximately 95% of total issues by euro
area residents. The euro-denominated securities
indicated in Sections 4.1, 4.2 and 4.3 also include
items expressed in national denominations of
the euro.
Section 4.1 shows securities other than shares,
by original maturity, residency of the issuer
and currency. The section presents outstanding
amounts, gross issues and net issues of
securities other than shares denominated in euro
and securities other than shares issued by euro
area residents in euro and in all currencies for
total and long-term debt securities. Net issues
differ from the changes in outstanding amounts
owing to valuation changes, reclassifi cations
and other adjustments. This section also
presents seasonally adjusted statistics, including
annualised six-month seasonally adjusted
growth rates for total and long-term debt
securities. The latter are calculated from the
seasonally adjusted index of notional stocks,
from which the seasonal effects have been
removed. See the Technical notes for details.
Section 4.2 contains a sectoral breakdown
of outstanding amounts, gross issues and net
issues for issuers resident in the euro area in line
with the ESA 95. The ECB is included in the
Eurosystem.
The total outstanding amounts for total and
long-term debt securities in column 1 of
Table 1 in Section 4.2 corresponds to the data
on outstanding amounts for total and long-term
debt securities issued by euro area residents
in column 7 of Section 4.1. The outstanding
amounts for total and long-term debt securities
issued by MFIs in column 2 of Table 1 in
Section 4.2 are broadly comparable with data for
debt securities issued, as shown on the liabilities
side of the aggregated MFI balance sheet in
column 8 of Table 2 in Section 2.1. The total
net issues for total debt securities in column 1
of Table 2 in Section 4.2 correspond to the data
on total net issues by euro area residents in
column 9 of Section 4.1. The residual difference
between long-term debt securities and total
fi xed and variable rate long-term debt securities
in Table 1 in Section 4.2 consists of zero coupon
bonds and revaluation effects.
Section 4.3 shows non-seasonally and seasonally
adjusted growth rates for debt securities
issued by euro area residents (broken down by
maturity, type of instrument, sector of the issuer
and currency), which are based on fi nancial
transactions that occur when an institutional unit
incurs or redeems liabilities. The growth rates
therefore exclude reclassifi cations, revaluations,
exchange rate variations and any other changes

ECB
Monthly Bulletin
August 2009S 88
that do not arise from transactions. The
seasonally adjusted growth rates have been
annualised for presentational purposes. See the
Technical notes for details.
Section 4.4, columns 1, 4, 6 and 8, show the
outstanding amounts of quoted shares issued
by euro area residents broken down by issuing
sector. The monthly data for quoted shares
issued by non-fi nancial corporations correspond
to the quarterly series shown in Section 3.4
(fi nancial balance sheet, quoted shares).
Section 4.4, columns 3, 5, 7 and 9, show annual
growth rates for quoted shares issued by euro
area residents (broken down by the sector
of the issuer), which are based on fi nancial
transactions that occur when an issuer issues or
redeems shares for cash excluding investments
in the issuers’ own shares. The calculation of
annual growth rates excludes reclassifi cations,
revaluations and any other changes that do not
arise from transactions.
Section 4.5 presents statistics on all the interest
rates that MFIs resident in the euro area apply to
euro-denominated deposits and loans vis-à-vis
households and non-fi nancial corporations
resident in the euro area. Euro area MFI interest
rates are calculated as a weighted average (by
corresponding business volume) of the euro area
countries’ interest rates for each category.
MFI interest rate statistics are broken down by
type of business coverage, sector, instrument
category and maturity, period of notice or initial
period of interest rate fi xation. The new MFI
interest rate statistics replace the ten transitional
statistical series on euro area retail interest rates
that have been published in the Monthly Bulletin
since January 1999.
Section 4.6 presents money market interest rates
for the euro area, the United States and Japan.
For the euro area, a broad spectrum of money
market interest rates is covered, ranging from
interest rates on overnight deposits to those on
twelve-month deposits. Before January 1999,
synthetic euro area interest rates were calculated
on the basis of national rates weighted by GDP.
With the exception of the overnight rate to
December 1998, monthly, quarterly and yearly
values are period averages. Overnight deposits
are represented by interbank deposit bid rates
up to December 1998. From January 1999,
column 1 of Section 4.6 shows the euro overnight
index average (EONIA). These are end-of-period
rates up to December 1998 and period averages
thereafter. From January 1999, interest rates on
one-, three-, six- and twelve-month deposits are
euro interbank offered rates (EURIBOR); until
December 1998, London interbank offered rates
(LIBOR) where available. For the United States
and Japan, interest rates on three-month deposits
are represented by LIBOR.
Table 4.7 shows end-of-period rates estimated
from nominal spot yield curves based on AAA-
rated euro-denominated bonds issued by euro
area central governments. The yield curves are
estimated using the Svensson model 3. Spreads
between the ten-year rates and the three-month
and two-year rates are also released. Additional
yield curves (daily releases, including charts and
tables) and the corresponding methodological
information are available at http://www.ecb.
europa.eu/stats/money/yc/html/index.en.html.
Daily data may also be downloaded.
Section 4.8 shows stock market indices for the
euro area, the United States and Japan.
PRICES, OUTPUT, DEMAND AND LABOUR MARKETS
Most of the data described in this section are
produced by the European Commission (mainly
Eurostat) and national statistical authorities. Euro
area results are obtained by aggregating data
for individual countries. As far as possible, the
data are harmonised and comparable. Statistics
on hourly labour costs, GDP and expenditure
components, value added by economic activity,
industrial production, retail sales and passenger
Svensson, L. E., “Estimating and Interpreting Forward Interest 3
Rates: Sweden 1992-1994”, Centre for Economic Policy
Research, Discussion Paper No 1051, 1994.

ECB
Monthly Bulletin
August 2009 S 89
EURO AREASTATISTICS
General notes
car registrations are adjusted for the variations
in the number of working days.
The Harmonised Index of Consumer Prices
(HICP) for the euro area (Table 1 in Section 5.1)
is available from 1995 onwards. It is based
on national HICPs, which follow the same
methodology in all euro area countries. The
breakdown by goods and services components
is derived from the classifi cation of individual
consumption by purpose (Coicop/HICP).
The HICP covers monetary expenditure by
households on fi nal consumption in the economic
territory of the euro area. The table includes
seasonally adjusted HICP data and experimental
HICP-based estimates of administered prices,
which are compiled by the ECB.
Industrial producer prices (Table 2 in
Section 5.1), industrial production, industrial
new orders, industrial turnover and retail sales
(Section 5.2) are covered by Council Regulation
(EC) No 1165/98 of 19 May 1998 concerning
short-term statistics.4 Since January 2009 the
revised classifi cation of economic activities
(NACE Revision 2), as covered by Regulation
(EC) No 1893/2006 of the European Parliament
and of the Council of 20 December 2006
establishing the statistical classifi cation
of economic activities NACE Revision 2
and amending Council Regulation (EEC)
No 3037/90, as well as certain EC Regulations
on specifi c statistical domains,5 has been applied
in the production of short-term statistics. The
breakdown by end-use of products for industrial
producer prices and industrial production is the
harmonised sub-division of industry excluding
construction (NACE Revision 2 sections B to E)
into main industrial groupings (MIGs), as defi ned
by Commission Regulation (EC) No 656/2007 of
14 June 2007 6.Industrial producer prices refl ect
the ex-factory gate prices of producers. They
include indirect taxes except VAT and other
deductible taxes. Industrial production refl ects
the value added of the industries concerned.
The two non-energy commodity price indices
shown in Table 3 in Section 5.1 are compiled
with the same commodity coverage but using
two different weighting schemes: one based on
the respective commodity imports of the euro
area (columns 2-4), and the other (columns 5-7)
based on estimated euro area domestic demand, or
“use”, taking into account information on imports,
exports and the domestic production of each
commodity (ignoring for simplicity inventories,
which are assumed to be relatively stable over the
observed period). The import-weighted commodity
price index is appropriate for analysing external
developments, while the use-weighted index is
suitable for the specifi c purpose of analysing
international commodity price pressures on euro
area infl ation. The use-weighted commodity price
indices are experimental data. For more details on
compilation of the ECB commodity price indices,
refer to Box 1 in the December 2008 issue of the
Monthly Bulletin.
The labour cost indices (Table 5 in Section 5.1)
measure the changes in labour costs per hour
worked in industry (including construction) and
market services. Their methodology is laid down
in Regulation (EC) No 450/2003 of the European
Parliament and of the Council of 27 February
2003 concerning the labour cost index7 and in
the implementing Commission Regulation (EC)
No 1216/2003 of 7 July 2003.8 A breakdown of
hourly labour costs for the euro area is available
by labour cost component (wages and salaries,
and employers’ social contributions plus
employment-related taxes paid by the employer
less subsidies received by the employer) and by
economic activity. The ECB calculates the
indicator of negotiated wages (memo item in
Table 3 of Section 5.1) on the basis of non-
harmonised, national-defi nition data.
Unit labour cost components (Table 4 in
Section 5.1), GDP and its components (Tables 1
and 2 in Section 5.2), GDP defl ators (Table 3 in
Section 5.1) and employment statistics (Table 1
in Section 5.3) are results of the ESA 95
quarterly national accounts.
OJ L 162, 5.6.1998, p. 1.4
OJL L 393, 30.12.2006, p. 1 5
OJ L 155, 15.6.2007, p. 3.6
OJ L 69, 13.3.2003, p. 1.7
OJ L 169, 8.7.2003, p. 37.8

ECB
Monthly Bulletin
August 2009S 90
Industrial new orders (Table 4 in Section 5.2)
measure the orders received during the reference
period and cover industries working mainly on
the basis of orders – in particular the textile, pulp
and paper, chemical, metal, capital goods and
durable consumer goods industries. The data are
calculated on the basis of current prices.
Indices for turnover in industry and for the
retail trade (Table 4 in Section 5.2) measure
the turnover, including all duties and taxes
with the exception of VAT, invoiced during the
reference period. Retail trade turnover covers all
retail trade (excluding sales of motor vehicles
and motorcycles), except automotive fuel. New
passenger car registrations cover registrations
of both private and commercial passenger cars.
The series for the euro area excludes Cyprus
and Malta.
Qualitative business and consumer survey data
(Table 5 in Section 5.2) draw on the European
Commission Business and Consumer Surveys.
Unemployment rates (Table 2 in Section 5.3)
conform to International Labour Organization
(ILO) guidelines. They refer to persons actively
seeking work as a share of the labour force, using
harmonised criteria and defi nitions. The labour
force estimates underlying the unemployment rate
are different from the sum of the employment and
unemployment levels published in Section 5.3.
GOVERNMENT FINANCE
Sections 6.1 to 6.5 show the general government
fi scal position in the euro area. The data are
mainly consolidated and are based on the ESA 95
methodology. The annual euro area aggregates
in Sections 6.1 to 6.3 are compiled by the ECB
on the basis of harmonised data provided by the
NCBs, which are regularly updated. The defi cit
and debt data for the euro area countries may
therefore differ from those used by the European
Commission within the excessive defi cit
procedure. The quarterly euro area aggregates in
Sections 6.4 and 6.5 are compiled by the ECB on
the basis of Eurostat and national data.
Section 6.1 presents annual fi gures on general
government revenue and expenditure on the basis
of defi nitions laid down in Commission Regulation
(EC) No 1500/2000 of 10 July 2000 9 amending
the ESA 95. Section 6.2 shows details of general
government gross consolidated debt at nominal
value in line with the Treaty provisions on the
excessive defi cit procedure. Sections 6.1 and 6.2
include summary data for the individual euro area
countries owing to their importance in the
framework of the Stability and Growth Pact. The
defi cits/surpluses presented for the individual euro
area countries correspond to excessive defi cit
procedure B.9, as defi ned by Commission
Regulation (EC) No 351/2002 of 25 February 2002
amending Council Regulation (EC) No 3605/93
as regards references to the ESA 95. Section 6.3
presents changes in general government debt. The
difference between the change in the government
debt and the government defi cit – the defi cit-debt
adjustment – is mainly explained by government
transactions in fi nancial assets and by foreign
exchange valuation effects. Section 6.4 presents
quarterly fi gures on general government revenue
and expenditure on the basis of defi nitions laid
down in Regulation (EC) No 1221/2002 of the
European Parliament and of the Council of
10 June 2002 on quarterly non-fi nancial accounts
for general government 10. Section 6.5 presents
quarterly fi gures on gross consolidated government
debt, the defi cit-debt adjustment and the
government borrowing requirement. These fi gures
are compiled using data provided by the Member
States under Regulations (EC) No 501/2004 and
No 222/2004 and data provided by the NCBs.
EXTERNAL TRANSACTIONS AND POSITIONS
The concepts and defi nitions used in balance of
payments (b.o.p.) and international investment
position (i.i.p.) statistics (Sections 7.1 to 7.4) are
generally in line with the IMF Balance of
Payments Manual (fi fth edition, October 1993),
the ECB Guideline of 16 July 2004 on the
statistical reporting requirements of the ECB
OJ L 172, 12.7.2000, p. 3. 9
OJ L 179, 9.7.2002, p. 1.10

ECB
Monthly Bulletin
August 2009 S 91
EURO AREASTAT IST ICS
General notes
(ECB/2004/15)11 and the amending ECB
Guideline of 31 May 2007 (ECB/2007/3)12.
Additional references about the methodologies
and sources used in the euro area b.o.p. and i.i.p.
statistics can be found in the ECB publication
entitled “European Union balance of payments/
international investment position statistical
methods” (May 2007), and in the following
Task Force reports: “Portfolio investment
collection systems” (June 2002), “Portfolio
investment income” (August 2003) and “Foreign
direct investment” (March 2004), all of which
can be downloaded from the ECB’s website. In
addition, the report by the ECB/European
Commission (Eurostat) Task Force on Quality
of balance of payments and international
investment position statistics (June 2004) is
available on the website of the Committee on
Monetary, Financial and Balance of Payments
Statistics (www.cmfb.org). The annual quality
report on the euro area b.o.p./i.i.p., which is
based on the Task Force’s recommendations, is
available on the ECB’s website.
The tables in Sections 7.1 and 7.4 follow the
sign convention in the IMF Balance of Payments
Manual, i.e. surpluses in the current account and
in the capital account have a plus sign, while
in the fi nancial account a plus sign denotes an
increase in liabilities or a decrease in assets. In
the tables in Section 7.2, both credit and debit
transactions are presented with a plus sign.
Furthermore, starting with the February 2008
issue of the Monthly Bulletin, the tables in
Section 7.3 have been restructured in order
to allow the data on balance of payments, the
international investment position and related
growth rates to be presented together; in the new
tables, transactions in assets and liabilities that
correspond to increases in positions are shown
with a plus sign.
The euro area b.o.p. is compiled by the ECB.
Recent monthly fi gures should be regarded as
provisional. Data are revised when fi gures for
the following month and/or the detailed quarterly
b.o.p. are published. Earlier data are revised
periodically, or as a result of methodological
changes in the compilation of the source data.
In Section 7.2, Table 1 also contains seasonally
adjusted data for the current account. Where
appropriate, the adjustment also covers
working-day, leap-year and/or Easter effects.
Table 3 in Section 7.2 and Table 8 in Section 7.3
present a breakdown of the euro area b.o.p. and
i.i.p. vis-à-vis main partner countries individually
or as a group, distinguishing between EU Member
States outside the euro area and countries
or areas outside the European Union. The
breakdown also shows transactions and positions
vis-à-vis EU institutions (which, apart from the
ECB, are treated statistically as outside the euro
area, regardless of their physical location) and,
for some purposes, also offshore centres and
international organisations. The breakdown does
not cover transactions or positions in portfolio
investment liabilities, fi nancial derivatives and
international reserves. In addition, separate data
are not provided for investment income payable
to Brazil, mainland China, India and Russia.
The geographical breakdown is described in the
article entitled “Euro area balance of payments
and international investment position vis-à-vis
main counterparts” in the February 2005 issue of
the Monthly Bulletin.
The data on the euro area b.o.p. fi nancial
account and i.i.p. in Section 7.3 are based on
transactions and positions vis-à-vis non-residents
of the euro area, considering the euro area as a
single economic entity (see also Box 9 in the
December 2002 issue of the Monthly Bulletin,
Box 5 in the January 2007 issue of the Monthly
Bulletin and Box 6 in the January 2008 issue
of the Monthly Bulletin). The i.i.p. is valued
at current market prices, with the exception of
direct investment, where book values are used for
unquoted shares, and other investments (e.g. loans
and deposits). The quarterly i.i.p. is compiled on
the basis of the same methodological framework
as the annual i.i.p. As some data sources are not
available on a quarterly basis (or are available
with a delay), the quarterly i.i.p. is partly
estimated on the basis of fi nancial transactions,
asset prices and foreign exchange developments.
OJ L 354, 30.11.2004, p. 34.11
OJ L 159, 20.6.2007, p. 48.12
ECB
Monthly Bulletin
August 2009S 92
Table 1 in Section 7.3 summarises the i.i.p. and
fi nancial transactions in the euro area b.o.p. The
breakdown of the change in the annual i.i.p.
is obtained by applying a statistical model to
the i.i.p. changes other than transactions with
information from the geographical breakdown
and currency composition of assets and
liabilities, as well as price indices for different
fi nancial assets. In this table, Columns 5 and
6 refer to direct investment by resident units
abroad and direct investment by non-resident
units in the euro area.
In Table 5 in Section 7.3, the breakdown into
“loans” and “currency and deposits” is based
on the sector of the non-resident counterpart,
i.e. assets vis-à-vis non-resident banks are
classifi ed as deposits, whereas assets vis-à-vis
other non-resident sectors are classifi ed as loans.
This breakdown follows the distinction made in
other statistics, such as the MFI consolidated
balance sheet, and conforms to the IMF Balance
of Payments Manual.
The outstanding amounts of the Eurosystem’s
international reserves and related assets and
liabilities are shown in Section 7.3, Table 7. These
fi gures are not fully comparable with those of the
Eurosystem’s weekly fi nancial statement owing
to differences in coverage and valuation. The data
in Table 7 are in line with the recommendations
for the template on international reserves and
foreign currency liquidity. Changes in the gold
holdings of the Eurosystem (column 3) are due to
transactions in gold within the terms of the Central
Bank Gold Agreement of 26 September 1999,
which was updated on 8 March 2004. More
information on the statistical treatment of the
Eurosystem’s international reserves can be found
in a publication entitled “Statistical treatment
of the Eurosystem’s international reserves”
(October 2000), which can be downloaded from
the ECB’s website. The website also contains
more comprehensive data in accordance with the
template on international reserves and foreign
currency liquidity.
Section 7.4 contains a monetary presentation
of the euro area balance of payments, in which
the balance of payments transactions mirror the
transactions in the external counterpart to M3. In
portfolio investment liabilities (Columns 5 and 6),
the transactions include sales and purchases of
equity and debt securities issued by MFIs in the
euro area, excluding shares of money market
funds and debt securities with a maturity of
up to two years. A methodological note on the
monetary presentation of the euro area balance
of payments is available in the “Statistics”
section of the ECB’s website. See also Box 1 in
the June 2003 issue of the Monthly Bulletin.
Section 7.5 shows data on euro area external
trade in goods. The source is Eurostat. Value
data and volume indices are seasonally and
working day-adjusted. The breakdown by
product group in columns 4 to 6 and 9 to 11
of Table 1 in Section 7.5 is in line with the
classifi cation by Broad Economic Categories
and corresponds to the basic classes of goods in
the System of National Accounts. Manufactured
goods (columns 7 and 12) and oil (column 13)
are in line with the SITC Rev. 4 defi nition. The
geographical breakdown (Table 3 in Section 7.5)
shows main trading partners individually or in
regional groups. China excludes Hong Kong.
On account of differences in defi nitions,
classifi cation, coverage and time of recording,
external trade data, in particular for imports,
are not fully comparable with the goods item in
the b.o.p. statistics (Sections 7.1 and 7.2). Part
of the difference arises from the inclusion of
insurance and freight services in the recording
of goods imported in external trade data.
Industrial import prices and industrial producer
export prices (or industrial output prices for
the non-domestic market) shown in Table 2
in Section 7.5 were introduced by Regulation
(EC) No 1158/2005 of the European Parliament
and of the Council of 6 July 2005 amending
Council Regulation (EC) No 1165/98, which is
the principal legal basis for short-term statistics.
The industrial import price index covers
industrial products imported from outside the
euro area under sections B to E of the Statistical
Classifi cation of Products by Activity in the
European Economic Community (CPA) and

ECB
Monthly Bulletin
August 2009 S 93
EURO AREASTATISTICS
General notes
all institutional sectors of the importers except
households, governments and non-profi t
institutions. It refl ects the cost, insurance and
freight (c.i.f.) price excluding import duties
and taxes, and refers to the actual transactions
in euro recorded at the point when ownership
of the goods is being transferred. The industrial
producer export prices cover all industrial
products exported directly by euro area
producers to the extra-euro area market under
sections B to E of NACE Revision 2. Exports
from wholesalers and re-exports are not covered.
The indices refl ect the free on board (f.o.b.) price
expressed in euro and calculated at the euro area
frontiers, including any indirect taxes except
VAT and other deductible taxes. Industrial import
prices and industrial producer export prices are
available by Main Industrial Groupings (MIGs)
as defi ned by Commission Regulation (EC)
No 656/2007 of 14 June 2007. For more details,
refer to Box 11 in the December 2008 issue of
the Monthly Bulletin.
EXCHANGE RATES
Section 8.1 shows nominal and real effective
exchange rate (EER) indices for the euro,
calculated by the ECB on the basis of weighted
averages of bilateral exchange rates of the
euro against the currencies of the euro area’s
trading partners. A positive change denotes an
appreciation of the euro. Weights are based on
trade in manufactured goods with the trading
partners in the periods 1995-1997 and 1999-
2001, and are calculated to account for third-
market effects. The EER indices result from the
linking at the beginning of 1999 of the indices
based on 1995-1997 weights to those based
on 1999-2001 weights. The EER-21 group of
trading partners is composed of the 11 non-
euro area EU Member States plus Australia,
Canada, China, Hong Kong, Japan, Norway,
Singapore, South Korea, Switzerland and the
United States. The EER-41 group includes the
EER-21 and the following countries: Algeria,
Argentina, Brazil, Chile, Croatia, Iceland,
India, Indonesia, Israel, Malaysia, Mexico,
Morocco, New Zealand, the Philippines,
Russia, South Africa, Taiwan, Thailand, Turkey
and Venezuela. Real EERs are calculated using
consumer price indices, producer price indices,
gross domestic product defl ators, unit labour
costs in manufacturing and unit labour costs in
the total economy.
For more detailed information on the
calculation of the EERs, see Box 8 entitled “The
effective exchange rates of the euro following
the recent euro area and EU enlargements”
in the March 2007 issue of the Monthly
Bulletin and the ECB’s Occasional Paper No 2
(“The effective exchange rates of the euro”
by Luca Buldorini, Stelios Makrydakis and
Christian Thimann, February 2002), which can
be downloaded from the ECB’s website.
The bilateral rates shown in Section 8.2 are
monthly averages of those published daily as
reference rates for these currencies. The reference
rate of the Indian rupee vis-à-vis the euro has
been inserted for the fi rst time in column 26.
However data prior to 1 January 2009 are to be
considered as indicative rates
DEVELOPMENTS OUTSIDE THE EURO AREA
Statistics on other EU Member States (Section 9.1)
follow the same principles as those for data relating
to the euro area. The data for the United States and
Japan contained in Section 9.2 are obtained from
national sources.

ECB
Monthly Bulletin
August 2009
11 JANUARY AND 8 FEBRUARY 2007
The Governing Council of the ECB decides
that the minimum bid rate on the main
refi nancing operations and the interest rates on
the marginal lending facility and the deposit
facility will remain unchanged at 3.50%,
4.50% and 2.50% respectively.
8 MARCH 2007
The Governing Council of the ECB decides
to increase the minimum bid rate on the main
refi nancing operations by 25 basis points to
3.75%, starting from the operation to be settled
on 14 March 2007. In addition, it decides to
increase the interest rates on both the marginal
lending facility and the deposit facility by
25 basis points, to 4.75% and 2.75%, both with
effect from 14 March 2007.
12 APRIL AND 10 MAY 2007
The Governing Council of the ECB decides
that the minimum bid rate on the main
refi nancing operations and the interest rates on
the marginal lending facility and the deposit
facility will remain unchanged at 3.75%, 4.75%
and 2.75% respectively.
6 JUNE 2007
The Governing Council of the ECB decides
to increase the minimum bid rate on the main
refi nancing operations by 25 basis points to
4%, starting from the operation to be settled on
13 June 2007. In addition, it decides to increase
by 25 basis points the interest rates on both
the marginal lending facility and the deposit
facility, to 5% and 3% respectively, with effect
from 13 June 2007.
5 JULY, 2 AUGUST, 6 SEPTEMBER, 4 OCTOBER,
8 NOVEMBER AND 6 DECEMBER 2007, AND
10 JANUARY, 7 FEBRUARY, 6 MARCH, 10 APRIL,
8 MAY AND 5 JUNE 2008
The Governing Council of the ECB decides that
the minimum bid rate on the main refi nancing
operations and the interest rates on the marginal
lending facility and the deposit facility will
remain unchanged at 4.00%, 5.00% and 3.00%
respectively.
3 JULY 2008
The Governing Council of the ECB decides
to increase the minimum bid rate on the main
refi nancing operations by 25 basis points
to 4.25%, starting from the operation to be
settled on 9 July 2008. In addition, it decides
to increase by 25 basis points the interest
rates on both the marginal lending facility
and the deposit facility, to 5.25% and 3.25%
respectively, with effect from 9 July 2008.
7 AUGUST, 4 SEPTEMBER AND
2 OCTOBER 2008
The Governing Council of the ECB decides that
the minimum bid rate on the main refi nancing
operations and the interest rates on the marginal
lending facility and the deposit facility will
remain unchanged at 4.25%, 5.25% and 3.25%
respectively.
8 OCTOBER 2008
The Governing Council of the ECB decides
to decrease the minimum bid rate on the main
refi nancing operations by 50 basis points to
3.75%, starting from the operations to be settled
on 15 October 2008. In addition, it decides to
decrease by 50 basis points the interest rates on
I
ANNEXES
CHRONOLOGY OF MONETARY POLICY MEASURES OF THE EUROSYSTEM1
The chronology of monetary policy measures taken by the 1
Eurosystem between 1999 and 2006 can be found in the ECB’s
Annual Report for the respective years.
ECB
Monthly Bulletin
August 2009II
both the marginal lending facility and the deposit
facility, to 4.75% and 2.75% respectively, with
immediate effect. Moreover, the Governing
Council decides that, as from the operation settled
on 15 October, the weekly main refi nancing
operations will be carried out through a fi xed-
rate tender procedure with full allotment at the
interest rate on the main refi nancing operation.
Furthermore, as of 9 October, the ECB will
reduce the corridor of standing facilities from
200 basis points to 100 basis points around the
interest rate on the main refi nancing operation.
The two measures will remain in place for as
long as needed, and at least until the end of the
fi rst maintenance period of 2009, on 20 January.
15 OCTOBER 2008
The Governing Council of the ECB decides to
further expand the collateral framework and
enhance the provision of liquidity. To do so, the
Governing Council decides: (i) to expand the
list of assets eligible as collateral in Eurosystem
credit operations, with this expansion remaining
in force until the end of 2009, (ii) to enhance
the provision of longer-term refi nancing, with
effect from 30 October 2008 and until the end of
the fi rst quarter of 2009, and (iii) to provide US
dollar liquidity through foreign exchange swaps.
6 NOVEMBER 2008
The Governing Council of the ECB decides
to decrease the interest rate on the main
refi nancing operations by 50 basis points to
3.25%, starting from the operations to be settled
on 12 November 2008. In addition, it decides to
decrease by 50 basis points the interest rates on
both the marginal lending facility and the deposit
facility, to 3.75% and 2.75% respectively, with
effect from 12 November 2008.
4 DECEMBER 2008
The Governing Council of the ECB decides to
decrease the interest rate on the main refi nancing
operations of the Eurosystem by 75 basis points
to 2.50%, starting from the operations to be
settled on 10 December 2008. In addition,
it decides to decrease by 75 basis points the
interest rates on both the marginal lending
and the deposit facility to 3.00% and 2.00%
respectively, with effect from 10 December
2008.
18 DECEMBER 2008
The Governing Council of the ECB decides
that the main refi nancing operations will
continue to be carried out through a fi xed rate
tender procedure with full allotment beyond the
maintenance period ending on 20 January 2009.
This measure will be in place for as long as
needed, and at least until the last allotment of the
third maintenance period in 2009 on 31 March.
Moreover, as of 21 January 2009, the corridor of
standing facility rates, which on 9 October 2008
was reduced to 100 basis points around the
prevailing interest rate of the main refi nancing
operation, will be be re-widened symmetrically
to 200 basis points.
15 JANUARY 2009
The Governing Council of the ECB decides
to decrease the interest rate on the main
refi nancing operations by 50 basis points to
2.00%, starting from the operations to be settled
on 21 January 2009. In addition, it decides that
the interest rates on the marginal lending and
the deposit facility will be 3.00% and 1.00%
respectively, with effect from 21 January 2009,
in line with the decision of 18 December 2008.
5 FEBRUARY 2009
The Governing Council of the ECB decides
that the interest rate on the main refi nancing
operations and the interest rates on the marginal
lending facility and the deposit facility will
remain unchanged at 2.00%, 3.00% and 1.00%
respectively.
ECB
Monthly Bulletin
August 2009
CHRONOLOGY
III
5 MARCH 2009
The Governing Council of the ECB decides
to decrease the interest rate on the main
refi nancing operations by 50 basis points to
1.50%, starting from the operations to be settled
on 11 March 2009. In addition, it decides that
the interest rates on the marginal lending and
the deposit facility will be 2.50% and 0.50%
respectively, with effect from 11 March 2009.
Moreover, the Governing Council decides
to continue the fi xed rate tender procedure
with full allotment for all main refi nancing
operations, special-term refi nancing operations
and supplementary and regular longer-term
refi nancing operations for as long as needed,
and in any case beyond the end of 2009. In
addition, the Governing Council decides
to continue with the current frequency and
maturity profi le of supplementary longer-
term refi nancing operations and special-term
refi nancing operations for as long as needed,
and in any case beyond the end of 2009.
2 APRIL 2009
The Governing Council of the ECB decides
to decrease the interest rate on the main
refi nancing operations by 25 basis points to
1.25%, starting from the operations to be settled
on 8 April 2009. In addition, it decides that
the interest rates on the marginal lending and
the deposit facility will be 2.25% and 0.25%
respectively, with effect from 8 April 2009.
7 MAY 2009
The Governing Council of the ECB decides to
decrease the interest rate on the main refi nancing
operations by 25 basis points to 1.00%, starting
from the operation to be settled on 13 May
2009. In addition, it decides to decrease the
interest rate on the marginal lending facility
by 50 basis points to 1.75% with effect from
13 May 2009, and to leave the interest rate
on the deposit facility unchanged at 0.25%.
In addition, the Governing Council of the ECB
decides to proceed with its enhanced credit
support approach. In particular, it decides that
the Eurosystem will conduct liquidity-providing
longer-term refi nancing operations with a
maturity of one year as fi xed rate tender
procedure with full allotment. In addition, it
decides in principle that the Eurosystem will
purchase euro-denominated covered bonds
issued in the euro area.
4 JUNE 2009
The Governing Council of the ECB decides
that the interest rate on the main refi nancing
operations and the interest rates on the marginal
lending facility and the deposit facility will
remain unchanged at 1.00%, 1.75% and 0.25%
respectively. In addition, the Governing Council
of the ECB decides upon the technical modalities
related to the purchase of euro-denominated
covered bonds issued in the euro area decided
on 7 May 2009.
2 JULY AND 6 AUGUST 2009
The Governing Council of the ECB decides
that the interest rate on the main refi nancing
operations and the interest rates on the marginal
lending facility and the deposit facility will
remain unchanged at 1.00%, 1.75% and 0.25%
respectively.

ECB
Monthly Bulletin
August 2009 V
DOCUMENTS PUBLISHED BY THE EUROPEAN CENTRAL BANK SINCE 2008
This list is designed to inform readers about selected documents published by the European Central
Bank since January 2008. For Working Papers, which as of January 2009 (from Working Paper
No 989 onwards) are available online only, the list only refers to publications released between
May and July 2009. Unless otherwise indicated, hard copies can be obtained or subscribed to free
of charge, stock permitting, by contacting [email protected].
For a complete list of documents published by the European Central Bank and by the European
Monetary Institute, please visit the ECB’s website (http://www.ecb.europa.eu).
ANNUAL REPORT
“Annual Report 2007”, April 2008.
“Annual Report 2008”, April 2009.
CONVERGENCE REPORT
“Convergence Report May 2008”.
MONTHLY BULLETIN SPECIAL EDITION
“10th anniversary of the ECB 1998-2008”, May 2008.
MONTHLY BULLETIN ARTICLES
“Productivity developments and monetary policy”, January 2008.
“Globalisation, trade and the euro area macroeconomy”, January 2008.
“The Eurosystem’s experience with forecasting autonomous factors and excess reserves”,
January 2008.
“The analysis of the euro money market from a monetary policy perspective”, February 2008.
“Securitisation in the euro area”, February 2008.
“The new euro area yield curves”, February 2008.
“Business investment in the euro area and the role of fi rms’ fi nancial positions”, April 2008.
“Short-term forecasts of economic activity in the euro area”, April 2008.
“Developments in the EU arrangements for fi nancial stability”, April 2008.
“Price stability and growth”, May 2008.
“The Eurosystem’s open market operations during the recent period of fi nancial market volatility”,
May 2008.
“One monetary policy and many fi scal policies: ensuring a smooth functioning of EMU”,
July 2008.
“Euro area trade in services: some key stylised facts”, July 2008.
“The Eurosystem as a provider of technical assistance to EU neighbouring regions”, July 2008.
“The external dimension of monetary analysis”, August 2008.
“The role of banks in the monetary policy transmission mechanism”, August 2008.
“Ten years of the Stability and Growth Pact”, October 2008.
“Cross-border bank mergers & acquisitions and institutional investors”, October 2008.
“Monitoring labour cost developments across euro area countries”, November 2008.
“Valuing stock markets and the equity risk premium”, November 2008.
“Ten years of TARGET and the launch of TARGET2”, November 2008.
“Housing wealth and private consumption in the euro area”, January 2009.
“Foreign asset accumulation by authorities in emerging markets”, January 2009.
“New survey evidence on wage setting in Europe”, February 2009.

ECB
Monthly Bulletin
August 2009VI
“Assessing global trends in protectionism”, February 2009.
“The external fi nancing of households and non-fi nancial corporations: a comparison of the euro
area and the United States”, April 2009.
“Revisions to GDP estimates in the euro area”, April 2009.
“The functional composition of government spending in the European Union”, April 2009.
“Expectations and the conduct of monetary policy”, May 2009.
“Five years of EU membership”, May 2009.
“Credit rating agencies: developments and policy issues”, May 2009.
“The impact of government support to the banking sector on euro area public fi nances”, July 2009.
“The implementation of monetary policy since August 2007”, July 2009.
“Rotation of voting rights in the Governing Council of the ECB”, July 2009.
“Housing fi nance in the euro area”, August 2009.
“Recent developments in the retail bank interest rate pass-through in the euro area”, August 2009.
STATISTICS POCKET BOOK
Available monthly since August 2003.
LEGAL WORKING PAPER SERIES
6 “The legal implications of the prudential supervisory assessment of bank mergers and
acquisitions under EU law” by S. Kerjean, June 2008.
7 “Electronic money institutions: current trends, regulatory issues and future prospects”
by P. Athanassiou and N. Mas-Guix, July 2008.
8 “National rescue measures in response to the current fi nancial crisis” by A. Petrovic and
R. Tutsch, July 2009.
OCCASIONAL PAPER SERIES
78 “A framework for assessing global imbalances” by T. Bracke, M. Bussière, M. Fidora and
R. Straub, January 2008.
79 “The workings of the Eurosystem: monetary policy preparations and decision-making –
selected issues” by P. Moutot, A. Jung and F. P. Mongelli, January 2008.
80 “China’s and India’s roles in global trade and fi nance: twin titans for the new millennium?”
by M. Bussière and A. Mehl, January 2008.
81 “Measuring fi nancial integration in new EU Member States” by M. Baltzer, L. Cappiello,
R. A. De Santis and S. Manganelli, March 2008.
82 “The sustainability of China’s exchange rate policy and capital account liberalisation”
by L. Cappiello and G. Ferrucci, March 2008.
83 “The predictability of monetary policy” by T. Blattner, M. Catenaro, M. Ehrmann,
R. Strauch and J. Turunen, March 2008.
84 “Short-term forecasting of GDP using large monthly datasets: a pseudo real-time forecast
evaluation exercise” by G. Rünstler, K. Barhoumi, R. Cristadoro, A. Den Reijer,
A. Jakaitiene, P. Jelonek, A. Rua, K. Ruth, S. Benk and C. Van Nieuwenhuyze, May 2008.
85 “Benchmarking the Lisbon strategy” by D. Ioannou, M. Ferdinandusse, M. Lo Duca
and W. Coussens, June 2008.
86 “Real convergence and the determinants of growth in EU candidate and potential candidate
countries: a panel data approach” by M. M. Borys, É. K. Polgár and A. Zlate, June 2008.
ECB
Monthly Bulletin
August 2009
DOCUMENTSPUBLISHED
VII
87 “Labour supply and employment in the euro area countries: developments and challenges”,
by a Task Force of the Monetary Policy Committee of the European System of Central
Banks, June 2008.
88 “Real convergence, fi nancial markets, and the current account – emerging Europe versus
emerging Asia” by S. Herrmann and A. Winkler, June 2008.
89 “An analysis of youth unemployment in the euro area” by R. Gomez-Salvador and
N. Leiner-Killinger, June 2008.
90 “Wage growth dispersion across the euro area countries: some stylised facts”
by M. Andersson, A. Gieseck, B. Pierluigi and N. Vidalis, July 2008.
91 “The impact of sovereign wealth funds on global fi nancial markets” by R. Beck and
M. Fidora, July 2008.
92 “The Gulf Cooperation Council countries: economic structures, recent developments and
role in the global economy” by M. Sturm, J. Strasky, P. Adolf and D. Peschel, July 2008.
93 “Russia, EU enlargement and the euro” by Z. Polański and A. Winkler, August 2008.
94 “The changing role of the exchange rate in a globalised economy” by F. di Mauro, R. Rüffer
and I. Bunda, September 2008.
95 “Financial stability challenges in candidate countries managing the transition to deeper and
more market-oriented fi nancial systems” by the International Relations Committee expert
group on fi nancial stability challenges in candidate countries, September 2008.
96 “The monetary presentation of the euro area balance of payments” by L. Bê Duc,
F. Mayerlen and P. Sola, September 2008.
97 “Globalisation and the competitiveness of the euro area” by F. di Mauro and K. Forster,
September 2008.
98 “Will oil prices decline over the long run?” by R. Kaufmann, P. Karadeloglou and
F. di Mauro, October 2008.
99 “The ECB and IMF indicators for the macro-prudential analysis of the banking sector: a
comparison of the two approaches” by A. M. Agresti, P. Baudino and P. Poloni, November
2008.
100 “Survey data on household fi nance and consumption: research summary and policy use” by the
Eurosystem Household Finance and Consumption Network, January 2009.
101 “Housing fi nance in the euro area” by the Task Force of the Monetary Policy Committee of
the European System of Central Banks, March 2009.
102 “Domestic fi nancial development in emerging economies: evidence and implications”
by E. Dorrucci, A. Meyer-Cirkel and D. Santabárbara, April 2009.
103 “Transnational governance in global fi nance: the principles for stable capital fl ows and fair
debt restructuring in emerging markets” by R. Ritter, April 2009.
104 “Fiscal policy challenges in oil-exporting countries: a review of key issues” by M. Sturm,
F. Gurtner and J. González Alegre, June 2009.
RESEARCH BULLETIN
“Research Bulletin”, No 7, June 2008.
“Research Bulletin”, No 8, March 2009.
WORKING PAPER SERIES
1049 “Labour force participation in the euro area: a cohort-based analysis” by A. Balleer,
R. Gómez-Salvador and J. Turunen, May 2009.
1050 “Wealth effects on consumption: evidence from the euro area” by R. M. Sousa, May 2009.
ECB
Monthly Bulletin
August 2009
1051 “Are more data always better for factor analysis? Results for the euro area, the six largest
euro area countries and the United Kingdom” by G. Caggiano, G. Kapetanios and
V. Labhard, May 2009.
1052 “Bidding behaviour in the ECB’s main refi nancing operations during the fi nancial crisis”
by J. Eisenschmidt, A. Hirsch and T. Linzert, May 2009.
1053 “Infl ation dynamics with labour market matching: assessing alternative specifi cations”
by K. Christoffel, J. Costain, G. de Walque, K. Kuester, T. Linzert, S. Millard and
O. Pierrard, May 2009.
1054 “Fiscal behaviour in the European Union: rules, fi scal decentralisation and government
indebtedness” by A. Afonso and S. Hauptmeier, May 2009.
1055 “The impact of extreme weather events on budget balances and implications for fi scal
policy” by E. M. Lis and C. Nickel, May 2009.
1056 “The pricing of sub-prime mortgage risk in good times and bad: evidence from the ABX.HE
indices” by I. Fender and M. Scheicher, May 2009.
1057 “Euro area private consumption: is there a role for housing wealth effects?” by F. Skudelny,
May 2009.
1058 “National prices and wage-setting in a currency union” by M. Sánchez, May 2009.
1059 “Forecasting the world economy in the short term” by A. Jakaitiene and S. Dées, June 2009.
1060 “What explains global exchange rate movements during the fi nancial crisis?” by M.
Fratzscher, June 2009.
1061 “The distribution of households’ consumption-expenditure budget shares” by M. Barigozzi,
L. Alessi, M. Capasso and G. Fagiolo, June 2009.
1062 “External shocks and international infl ation linkages: a global VAR analysis” by A. Galesi
and M. J. Lombardi, June 2009.
1063 “Does private equity investment spur innovation? Evidence from Europe” by A. Popov and
P. Roosenboom, June 2009.
1064 “Does it pay to have the euro? Italy’s politics and fi nancial markets under the lira and the
euro” by M. Fratzscher and L. Stracca, June 2009.
1065 “Monetary policy and infl ationary shocks under imperfect credibility” by M. D. Pariès and
S. Moyen, June 2009.
1066 “Universal banks and corporate control: evidence from the global syndicated loan market”
by M. A. Ferreira and P. Matos, July 2009.
1067 “The dynamic effects of shocks to wages and prices in the United States and the euro area”
by R. Duarte and C. R. Marques, July 2009.
1068 “Asset price misalignments and the role of money and credit” by D. Gerdesmeier,
H.-E. Reimers and B. Roffi a, July 2009.
1069 “Housing fi nance and monetary policy” by A. Calza, T. Monacelli and L. Stracca, July 2009.
1070 “Monetary policy committees: meetings and outcomes” by J. M. Berk and B. K. Bierut,
July 2009.
1071 “Booms and busts in housing markets: determinants and implications” by L. Agnello and
L. Schuknecht, July 2009.
1072 “How important are common factors in driving non-fuel commodity prices? A dynamic
factor analysis” by I. Vansteenkiste, July 2009.
1073 “Can non-linear real shocks explain the persistence of PPP exchange rate disequilibria?”
by T. Peltonen, M. Sager and A. Popescu, July 2009.
1074 “Wages are fl exible, aren’t they? Evidence from monthly micro wage data” by P. Lünnemann
and L. Wintr, July 2009.
1075 “Bank risk and monetary policy” by Y. Altunbas, L. Gambacorta and D. Marqués-Ibáñez,
July 2009.
VIII
ECB
Monthly Bulletin
August 2009
DOCUMENTSPUBLISHED
IX
1076 “Optimal monetary policy in a new Keynesian model with habits in consumption”
by C. Leith, I. Moldovan and R. Rossi, July 2009.
OTHER PUBLICATIONS
“Bond markets and long-term interest rates in non-euro area Member States of the European
Union”, January 2008 (online only).
“Oversight framework for card payment schemes – standards”, January 2008 (online only).
“The role of money – money and monetary policy in the twenty-fi rst century – proceedings of the
Fourth ECB Central Banking Conference 2006”, February 2008.
“Euro area balance of payments and international investment position statistics – Annual quality
report”, March 2008 (online only).
“ECB statistics quality framework (SQF)”, April 2008 (online only).
“Quality assurance procedures within the ECB statistical function”, April 2008 (online only).
“ECB statistics – an overview”, April 2008 (online only).
“TARGET Annual Report 2007”, April 2008 (online only).
“Financial integration in Europe”, April 2008.
“Financial Stability Review”, June 2008.
“Labour supply and employment in the euro area countries: developments and challenges”,
June 2008.
“The international role of the euro”, July 2008 (online only).
“Payment systems and market infrastructure oversight report”, July 2008 (online only).
“Letter from the ECB President to Mr Dimitrios Papadimoulis, Member of the European
Parliament”, July 2008 (online only).
“Letter from the ECB President to Mr Ashley Mote, Member of the European Parliament”,
July 2008 (online only).
“Legal framework of the Eurosystem and the ESCB. ECB legal acts and instruments”, July 2008.
“CCBM2 User Requirements 4.1”, July 2008 (online only).
“Simulating fi nancial instability – conference on stress testing and fi nancial crisis simulation
exercises, 12-13 July 2007”, September 2008.
“New procedure for constructing ECB staff projection ranges”, September 2008 (online only).
“Commission’s draft directive/regulation on credit rating agencies – Eurosystem contribution to
the public consultation”, September 2008 (online only).
“Euro money market survey”, September 2008 (online only).
“EU banking structures”, October 2008 (online only).
“Letter from the ECB President to Mr Mario Borghezio, Member of the European Parliament”,
October 2008 (online only).
“Letter from the ECB President to Mr Ashley Mote, Member of the European Parliament”,
October 2008 (online only).
“A strategic vision for statistics: challenges for the next 10 years – Fourth ECB Conference on
Statistics, 24 and 25 April 2008”, November 2008.
“The implementation of monetary policy in the euro area: General documentation on Eurosystem
monetary policy instruments and procedures”, November 2008.
“The Eurosystem policy principles on the location and operation of infrastructures settling
euro-denominated payment transactions: specifi cation of ‘legally and operationally located in the
euro area’ ”, November 2008 (online only).
“Single Euro Payments Area – sixth progress report”, November 2008 (online only).
“EU banks’ liquidity stress-testing and contingency funding plans”, November 2008 (online only).
“Government fi nance statistics guide”, December 2008 (online only).
ECB
Monthly Bulletin
August 2009
“Financial Stability Review”, December 2008.
“Covered bonds in the EU fi nancial system”, December 2008 (online only).
“The incentive structure of the ‘originate and distribute’ model”, December 2008 (online only).
“Recommendations of the Governing Council of the European Central Bank on the pricing
of recapitalisations”, December 2008 (online only).
“Recommendations of the Governing Council of the European Central Bank on government
guarantees for bank debt”, December 2008 (online only).
“Commercial property markets – fi nancial stability risks, recent developments and EU banks’
exposures”, December 2008 (online only).
“Correspondent central banking model (CCBM) – procedures for Eurosystem counterparties”,
December 2008 (online only).
“Letter from the ECB President to Mr Robert Sturdy, Member of the European Parliament”,
January 2009 (online only).
“Euro money market study 2008”, February 2009 (online only).
“Eurosystem oversight policy framework”, February 2009 (online only).
“Harmonised oversight approach and oversight standards for payment instruments”, February 2009
(online only).
“European Commission’s consultation on hedge funds – Eurosystem contribution”, February 2009
(online only).
“Guiding principles for bank asset support schemes”, March 2009 (online only).
“Letter from the ECB President to Mr José Ribeiro e Castro, Member of the European
Parliament”, March 2009 (online only).
“Letter from the ECB President to Mr Dimitrios Papadimoulis, Member of the European
Parliament”, March 2009 (online only).
“Letter from the ECB President to Mr Manolis Mavrommatis, Member of the European
Parliament, regarding the issuance of low denomination euro banknotes”, March 2009
(online only).
“Letter from the ECB President to Mr Eoin Ryan, Member of the European Parliament, concerning
the recent widening of spreads between euro area government bond yields”, March 2009
(online only).
“Eurosystem’s SEPA expectations”, March 2009 (online only).
“Housing fi nance in the euro area”, March 2009 (online only).
“Euro area monetary and fi nancial statistics: 2008 quality report”, March 2009 (online only).
“Euro area balance of payments and international investment position statistics: 2008 quality
report”, March 2009 (online only).
“Manual on investment fund statistics”, May 2009 (online only).
“EU banks’ funding structures and policies”, May 2009 (online only).
“Letter from the ECB President to Mr Ashley Mote, Member of the European Parliament”,
May 2009 (online only).
“TARGET2 oversight assessment report”, May 2009 (online only).
“TARGET Annual Report”, May 2009 (online only).
“The ECB’s advisory role – overview of opinions (1994-2008)”, May 2009.
“Financial Stability Review”, June 2009.
“Recommendations for securities settlement systems and recommendations for central
counterparties in the European Union – European Central Bank (ECB) and the Committee of
European Securities Regulators (CESR)”, June 2009 (online only).
“The international role of the euro”, July 2009.
X

ECB
Monthly Bulletin
August 2009
DOCUMENTSPUBLISHED
XI
INFORMATION BROCHURES
“The European Central Bank, the Eurosystem, the European System of Central Banks”,
April 2008.
“Price stability – why is it important for you?”, June 2008.
“A single currency – an integrated market infrastructure”, September 2008.
“The European Central Bank, the Eurosystem, the European System of Central Banks”,
April 2009.
“Price stability – why is it important for you?”, April 2009.
“The Single Euro Payments Area (SEPA): an integrated retail payments market”, July 2009.


ECB
Monthly Bulletin
August 2009 XIII
GLOSSARY
This glossary contains selected items that are frequently used in the Monthly Bulletin.
A more comprehensive and detailed glossary can be found on the ECB’s website
(www.ecb.europa.eu/home/glossary/html/index.en.html).
Autonomous liquidity factors: liquidity factors that do not normally stem from the use of
monetary policy instruments. Such factors are, for example, banknotes in circulation, government
deposits with the central bank and the net foreign assets of the central bank.
Balance of payments (b.o.p.): a statistical statement that summarises, for a specifi c period of
time, the economic transactions of an economy with the rest of the world.
Bank lending survey (BLS): a quarterly survey on lending policies that has been conducted by
the Eurosystem since January 2003. It addresses qualitative questions on developments in credit
standards, terms and conditions of loans and loan demand for both enterprises and households to a
predefi ned sample group of banks in the euro area.
Borrowing requirement (general government): net incurrence of debt by the general government.
Capital account: a b.o.p. account that covers all capital transfers and acquisitions/disposals of non-
produced, non-fi nancial assets between residents and non-residents.
Capital accounts: part of the system of national (or euro area) accounts consisting of the change in
net worth that is due to net saving, net capital transfers and net acquisitions of non-fi nancial assets.
Central parity (or central rate): the exchange rate of each ERM II member currency vis-à-vis the
euro, around which the ERM II fl uctuation margins are defi ned.
Compensation per employee or per hour worked: the total remuneration, in cash or in kind, that
is payable by employers to employees, i.e. gross wages and salaries, as well as bonuses, overtime
payments and employers’ social security contributions, divided by the total number of employees
or by the total number of employees’ hours worked.
Consolidated balance sheet of the MFI sector: a balance sheet obtained by netting out
inter-MFI positions (e.g. inter-MFI loans and deposits) in the aggregated MFI balance sheet. It
provides statistical information on the MFI sector’s assets and liabilities vis-à-vis residents of the
euro area not belonging to this sector (i.e. the general government and other euro area residents)
and vis-à-vis non-euro area residents. It is the main statistical source for the calculation of monetary
aggregates, and it provides the basis for the regular analysis of the counterparts of M3.
Current account: a b.o.p. account that covers all transactions in goods and services, income and
current transfers between residents and non-residents.
Debt (financial accounts): loans, deposit liabilities, debt securities issued and pension fund
reserves of non-fi nancial corporations (resulting from employers’ direct pension commitments on
behalf of their employees), valued at market value at the end of the period.
Debt (general government): the gross debt (deposits, loans and debt securities excluding fi nancial
derivatives) at nominal value outstanding at the end of the year and consolidated between and
within the sectors of general government.

ECB
Monthly Bulletin
August 2009XIV
Debt security: a promise on the part of the issuer (i.e. the borrower) to make one or more
payment(s) to the holder (the lender) on a specifi ed future date or dates. Such securities usually
carry a specifi c rate of interest (the coupon) and/or are sold at a discount to the amount that will
be repaid at maturity. Debt securities issued with an original maturity of more than one year are
classifi ed as long-term.
Debt-to-GDP ratio (general government): the ratio of general government debt to GDP at
current market prices. It is the subject of one of the fi scal criteria laid down in Article 104(2) of the
Treaty establishing the European Community to defi ne the existence of an excessive defi cit.
Deficit (general government): the general government’s net borrowing, i.e. the difference between
total government revenue and total government expenditure.
Deficit-debt adjustment (general government): the difference between the general government
defi cit and the change in general government debt.
Deficit ratio (general government): the ratio of the general government defi cit to GDP at current
market prices. It is the subject of one of the fi scal criteria laid down in Article 104(2) of the Treaty
establishing the European Community to defi ne the existence of an excessive defi cit. It is also
referred to as the budget defi cit ratio or the fi scal defi cit ratio.
Deflation: a decline in the general price level, e.g. in the consumer price index.
Deposit facility: a standing facility of the Eurosystem which counterparties may use to make
overnight deposits, remunerated at a pre-specifi ed interest rate, at an NCB.
Direct investment: cross-border investment for the purpose of obtaining a lasting interest in an
enterprise resident in another economy (assumed, in practice, for ownership of at least 10% of the
ordinary shares or voting power). Included are equity capital, reinvested earnings and other capital
associated with inter-company operations. The direct investment account records net transactions/
positions in assets abroad by euro area residents (as “direct investment abroad”) and net transactions/
positions in euro area assets by non-residents (as “direct investment in the euro area”).
Effective exchange rates (EERs) of the euro (nominal/real): weighted averages of bilateral euro
exchange rates against the currencies of the euro area’s main trading partners. The nominal EER
indices for the euro are calculated against two groups of trading partners: the EER-21 (comprising
the 11 non-euro area EU Member States and 10 trading partners outside the EU) and the EER-41
(composed of the EER-21 and 20 additional countries). The weights used refl ect the share of each
partner country in euro area trade and account for competition in third markets. Real EERs are
nominal EERs defl ated by a weighted average of foreign, relative to domestic, prices or costs. They
are thus measures of price and cost competitiveness.
EONIA (euro overnight index average): a measure of the effective interest rate prevailing in the
euro interbank overnight market. It is calculated as a weighted average of the interest rates on unsecured
overnight lending transactions denominated in euro, as reported by a panel of contributing banks.
Equities: securities representing ownership of a stake in a corporation. They comprise shares traded
on stock exchanges (quoted shares), unquoted shares and other forms of equity. Equities usually
produce income in the form of dividends.

ECB
Monthly Bulletin
August 2009
GLOSSARY
XV
ERM II (exchange rate mechanism II): the exchange rate arrangement that provides the
framework for exchange rate policy cooperation between the euro area countries and the
EU Member States not participating in Stage Three of EMU.
EURIBOR (euro interbank offered rate): the rate at which a prime bank is willing to lend funds
in euro to another prime bank, computed daily for interbank deposits with different maturities of up
to 12 months.
Euro area: the area formed by those EU Member States in which the euro has been adopted as the
single currency in accordance with the Treaty establishing the European Community.
European Commission surveys: harmonised surveys of business and/or consumer sentiment
conducted on behalf of the European Commission in each of the EU Member States. Such
questionnaire-based surveys are addressed to managers in the manufacturing, construction, retail
and services industries, as well as to consumers. From each monthly survey, composite indicators
are calculated that summarise the replies to a number of different questions in a single indicator
(confi dence indicators).
Eurosystem: the central banking system made up of the ECB and the NCBs of those EU Member
States that have already adopted the euro.
Eurozone Purchasing Managers’ Surveys: surveys of business conditions in manufacturing and
in services industries conducted for a number of countries in the euro area and used to compile
indices. The Eurozone Manufacturing Purchasing Managers’ Index (PMI) is a weighted indicator
calculated from indices of output, new orders, employment, suppliers’ delivery times and stocks
of purchases. The services sector survey asks questions on business activity, expectations of future
business activity, the amount of business outstanding, incoming new business, employment, input
prices and prices charged. The Eurozone Composite Index is calculated by combining the results
from the manufacturing and services sector surveys.
External trade in goods: exports and imports of goods with countries outside the euro area,
measured in terms of value and as indices of volume and unit value. External trade statistics are
not comparable with the exports and imports recorded in the national accounts, as the latter include
both intra-euro area and extra-euro area transactions, and also combine goods and services. Nor are
they fully comparable with the goods item in b.o.p. statistics. Besides methodological adjustments,
the main difference is that imports in external trade statistics are recorded including insurance and
freight services, whereas they are recorded free on board in the goods item in the b.o.p. statistics.
Financial account: a b.o.p. account that covers transactions between residents and non-residents in
direct investment, portfolio investment, other investment, fi nancial derivatives and reserve assets.
Financial accounts: part of the system of national (or euro area) accounts showing the fi nancial
positions (stocks or balance sheets), fi nancial transactions and other changes of the different
institutional sectors of an economy by type of fi nancial asset.
Fixed rate tender: a tender procedure in which the interest rate is specifi ed in advance by the
central bank and in which participating counterparties bid the amount of money they wish to
transact at the fi xed interest rate.

ECB
Monthly Bulletin
August 2009
General government: a sector defi ned in the ESA 95 as comprising resident entities that are
engaged primarily in the production of non-market goods and services intended for individual and
collective consumption and/or in the redistribution of national income and wealth. Included are
central, regional and local government authorities as well as social security funds. Excluded are
government-owned entities that conduct commercial operations, such as public enterprises.
Gross domestic product (GDP): the value of an economy’s total output of goods and services less
intermediate consumption, plus net taxes on products and imports. GDP can be broken down by
output, expenditure or income components. The main expenditure aggregates that make up GDP are
household fi nal consumption, government fi nal consumption, gross fi xed capital formation, changes
in inventories, and imports and exports of goods and services (including intra-euro area trade).
Harmonised Index of Consumer Prices ( HICP): a measure of the development of consumer
prices that is compiled by Eurostat and harmonised for all EU Member States.
Hourly labour cost index: a measure of labour costs, including gross wages and salaries (in
cash and in kind, including bonuses) and other labour costs (employers’ social contributions plus
employment-related taxes paid by the employer minus subsidies received by the employer), per
hour actually worked (including overtime).
Implied volatility: the expected volatility (i.e. standard deviation) in the rates of change of the
price of an asset (e.g. a share or a bond). It can be derived from the asset’s price, maturity date and
exercise price of its options, as well as from a riskless rate of return, using an option pricing model
such as the Black-Scholes model.
Index of negotiated wages: a measure of the direct outcome of collective bargaining in terms of
basic pay (i.e. excluding bonuses) at the euro area level. It refers to the implied average change in
monthly wages and salaries.
Industrial producer prices: factory-gate prices (transportation costs are not included) of all
products sold by industry excluding construction on the domestic markets of the euro area countries,
excluding imports.
Industrial production: the gross value added created by industry at constant prices.
Inflation: an increase in the general price level, e.g. in the consumer price index.
Inflation-indexed government bonds: debt securities issued by the general government, the
coupon payments and principal of which are linked to a specifi c consumer price index.
International investment position (i.i.p.): the value and composition of an economy’s outstanding
net fi nancial claims on (or fi nancial liabilities to) the rest of the world.
International reserves: external assets readily available to and controlled by monetary authorities
for directly fi nancing or regulating the magnitude of payments imbalances through intervention
in exchange markets. The international reserves of the euro area comprise non-euro denominated
claims on non-euro area residents, gold, special drawing rights (SDRs) and the reserve positions in
the IMF which are held by the Eurosystem.
XVI
ECB
Monthly Bulletin
August 2009
GLOSSARY
XVII
Investment funds (except money market funds): fi nancial institutions that pool capital raised
from the public and invest it in fi nancial and non-fi nancial assets. See also MFIs.
Job vacancies: a collective term covering newly created jobs, unoccupied jobs or jobs about to
become vacant in the near future, for which the employer has recently taken active steps to fi nd a
suitable candidate.
Key ECB interest rates: the interest rates, set by the Governing Council, which refl ect the
monetary policy stance of the ECB. They are the rates at the main refi nancing operations, on the
marginal lending facility and on the deposit facility.
Labour force: the sum total of persons in employment and the number of unemployed.
Labour productivity: the output that can be produced with a given input of labour. It can be
measured in several ways, but is commonly measured as GDP (volume) divided by either total
employment or total hours worked.
Longer-term refinancing operation: a regular open market operation executed by the Eurosystem
in the form of reverse transactions. Such operations are carried out through a monthly standard
tender and normally have a maturity of three months.
M1: a narrow monetary aggregate that comprises currency in circulation plus overnight deposits
held with MFIs and central government (e.g. at the post offi ce or treasury).
M2: an intermediate monetary aggregate that comprises M1 plus deposits redeemable at a period
of notice of up to and including three months (i.e. short-term savings deposits) and deposits with an
agreed maturity of up to and including two years (i.e. short-term time deposits) held with MFIs and
central government.
M3: a broad monetary aggregate that comprises M2 plus marketable instruments, in particular
repurchase agreements, money market fund shares and units, and debt securities with a maturity of
up to and including two years issued by MFIs.
Main refinancing operation: a regular open market operation executed by the Eurosystem in the
form of reverse transactions. Such operations are carried out through a weekly standard tender and
normally have a maturity of one week.
Marginal lending facility: a standing facility of the Eurosystem which counterparties may use to
receive overnight credit from an NCB at a pre-specifi ed interest rate against eligible assets.
MFI credit to euro area residents: MFI loans granted to non-MFI euro area residents (including
general government and the private sector) and MFI holdings of securities (shares, other equity and
debt securities) issued by non-MFI euro area residents.
MFI interest rates: the interest rates that are applied by resident credit institutions and other MFIs,
excluding central banks and money market funds, to euro-denominated deposits and loans vis-à-vis
households and non-fi nancial corporations resident in the euro area.
ECB
Monthly Bulletin
August 2009XVIII
MFI longer-term financial liabilities: deposits with an agreed maturity of over two years,
deposits redeemable at a period of notice of over three months, debt securities issued by euro area
MFIs with an original maturity of more than two years and the capital and reserves of the euro area
MFI sector.
MFI net external assets: the external assets of the euro area MFI sector (such as gold, foreign
currency banknotes and coins, securities issued by non-euro area residents and loans granted to
non-euro area residents) minus the external liabilities of the euro area MFI sector (such as non-euro
area residents’ deposits and repurchase agreements, as well as their holdings of money market fund
shares/units and debt securities issued by MFIs with a maturity of up to and including two years).
MFIs (monetary financial institutions): fi nancial institutions which together form the money-
issuing sector of the euro area. These include the Eurosystem, resident credit institutions (as defi ned
in Community law) and all other resident fi nancial institutions whose business is to receive deposits
and/or close substitutes for deposits from entities other than MFIs and, for their own account
(at least in economic terms), to grant credit and/or invest in securities. The latter group consists
predominantly of money market funds, i.e. funds that invest in short-term and low-risk instruments
usually with a maturity of one year or less.
Minimum bid rate: the lower limit to the interest rates at which counterparties may submit bids in
the variable tenders.
Other investment: an item in the b.o.p. and the i.i.p. that covers the fi nancial transactions/positions
with non-residents in trade credits, deposits and loans, and other accounts receivable and payable.
Portfolio investment: euro area residents’ net transactions and/or positions in securities issued
by non-residents of the euro area (“assets”) and non-residents’ net transactions and/or positions
in securities issued by euro area residents (“liabilities”). Included are equity securities and debt
securities (bonds and notes, and money market instruments). Transactions are recorded at the
effective price paid or received, less commissions and expenses. To be regarded as a portfolio asset,
ownership in an enterprise must be equivalent to less than 10% of the ordinary shares or voting
power.
Price stability: the maintenance of price stability is the primary objective of the Eurosystem. The
Governing Council defi nes price stability as a year-on-year increase in the HICP for the euro area
of below 2%. The Governing Council has also made it clear that, in the pursuit of price stability, it
aims to maintain infl ation rates below, but close to, 2% over the medium term.
Purchasing power parity (PPP): the rate at which one currency is converted into another so as
to equalise the purchasing power of the two currencies by eliminating the differences in the price
levels prevailing in the countries concerned. In their simplest form, PPPs show the ratio of the
prices in national currency of the same good or service in different countries.
Reference value for M3 growth: the annual growth rate of M3 over the medium term that is
consistent with the maintenance of price stability. At present, the reference value for annual M3
growth is 4½%.
Reserve requirement: the minimum amount of reserves a credit institution is required to hold
with the Eurosystem over a predefi ned maintenance period. Compliance with the requirement

ECB
Monthly Bulletin
August 2009
GLOSSARY
XIX
is determined on the basis of the average of the daily balances in the reserve accounts over the
maintenance period.
Survey of Professional Forecasters (SPF): a quarterly survey that has been conducted by the
ECB since 1999 to collect macroeconomic forecasts on euro area infl ation, real GDP growth and
unemployment from a panel of experts affi liated to fi nancial and non-fi nancial organisations based
in the EU.
Unit labour costs: a measure of total labour costs per unit of output calculated for the euro area as
the ratio of total compensation per employee to labour productivity (defi ned as GDP (volume) per
person employed).
Variable rate tender: a tender procedure where the counterparties bid both the amount of money
they wish to transact with the central bank and the interest rate at which they wish to enter into the
transaction.
Write-down: a downward adjustment to the value of loans recorded in the balance sheets of MFIs
when it is recognised that the loans have become partly unrecoverable.
Write-off: the removal of the value of loans from the balance sheets of MFIs when the loans are
considered to be totally unrecoverable.
Yield curve: a graphical representation of the relationship between the interest rate or yield and the
residual maturity at a given point in time for suffi ciently homogenous debt securities with different
maturity dates. The slope of the yield curve can be measured as the difference between the interest
rates or yield at two selected maturities.