Embed Size (px)
Citation preview
ELIAS MOTSOALEDI LOCAL MUNCIPALITY
MONTHLY BUDGET STATEMENT REPORT
MAY 2018
May 2018 Budget Performance – Elias Motsoaledi Local Municipality Page 1
PART 1: IN - YEAR REPORT
PURPOSE
To report to the Council and submit to National and Provincial Treasury on the monthly financial
performance of the Municipality as required by Section 71 of the Municipal Finance Management
Act.
EXECUTIVE SUMMARY
Section 71 of the Municipal Finance Management Act deals with requirements for in-year
reporting and further state that the Accounting Officer of the Municipality must by no later than 10
working days after end of each month submit to the Mayor and relevant Provincial Treasury, the
monthly budget statement in the prescribed format on the state of the municipality’s financial
results.
IN YEAR BUDGET STATEMENT TABLES

May 2018 Budget Performance – Elias Motsoaledi Local Municipality Page 2
Table C1 – Budget Statement Summary

May 2018 Budget Performance – Elias Motsoaledi Local Municipality Page 3
The above C1 Sum table summarizes the following activities:-
Revenue:
The actual year to date operational revenue as at end of May is R350, 701 million and the year
to date budget of R419, 820 million and this reflects a negative variance of R61, 119 million that
can be attributed to property rates, service charges electricity and refuse removal that have
negative variance. The following are the secondary revenue item categories reflecting a negative
and positive material variance:
Interest earned – outstanding Debtors 30% unfavorable variance,
Rental on Facilities and Equipment: 35% unfavorable variance,
Transfer and Subsidies: 6% unfavorable variance
License and Permits: 10% favorable variance
Fines: 84% unfavorable variance
Other revenue: 26% unfavorable variance
Operating Expenditure
The year to date operational expenditure as at end of May amounts to R320, 328 million and the
year to date budget is R329, 095 million and this reflects an underspending variance of R8, 767
million that translates to 3% negative variance. The variance is attributed to non-incorporation of
depreciation and debt impairment amount. The municipality is however, in a process of linking
the Asset Management system with core financial system so that the depreciation calculated on
the initial system can be interfaced to the financial system and this will assist in doing away with
the practice of calculating depreciation only at year end.
All other expenditure line items are performing almost in line with the year to date budget since
the variance thereof is less than 10% except for the following:
Finance Charges: 85% under performance variance
Transfers and subsidies: 22% under performance variance
Other Material: 27% under performance variance
Other expenditure: 11% under performance variance
Capital Expenditure
The year to date actual capital expenditure as at end of May amounts to R96, 550 million and the
year to date budget amounts to R99, 453 million and this gives rise to R2, 903 million under
performance variance.

May 2018 Budget Performance – Elias Motsoaledi Local Municipality Page 4
Surplus/Deficit
Taking the above into consideration, the net operating surplus/deficit for the month of May is R32,
773 million
Debtors
Outstanding debtors’ is comprised of consumer and sundry debtors. The total outstanding debtors
as at end of May amounts to R60, 177 million and this shows an increase of R11, 996 million as
compared to R48, 181 million as at end of 2016/17 financial year.
Consumer debtors is made up of service charges and property rates that amount to R45, 800
million and other debtors amounting to R14, 377 million.
Creditors
All creditors are paid within 30 days of receipt of invoice as required by MFMA and as a result,
our creditor’s age analysis does not have figures.

May 2018 Budget Performance – Elias Motsoaledi Local Municipality Page 5
Table C2 – Financial Performance (Standard Classification)

May 2018 Budget Performance – Elias Motsoaledi Local Municipality Page 6
Table C3 – Financial Performance (Revenue and Expenditure by vote)
Table C2 and C3 measure the monthly actuals and year to date actuals against the year to date
budget. The aforementioned budget tables are presented by standard classification and vote
respectively for both revenue and expenditure. The variances are all reflected in the year-to-date
variance column.
The financial results portrayed in the two tables are the same as those in other tables (i.e. it is
only the description or basis of reporting that is based on financial or budget performance by vote
or department, and National Treasury’s standard classification.

May 2018 Budget Performance – Elias Motsoaledi Local Municipality Page 7
Table C4: Financial Performance by Revenue Source and Expenditure Type

May 2018 Budget Performance – Elias Motsoaledi Local Municipality Page 8
Table C4 provides budget performance details for revenue by source and expenditure by type.
For revenue, the main deviations from budget projections are on Service charged, Fines, Licenses
and permits, Rental of facilities, and outstanding debtors and other revenue. In the case of
expenditure, the following line items reflect material variance; Finance charges, Other material,
transfer and subsidies and Other expenditure.
Reasons for deviations will only be provided for material variances and a variance is deemed to
be material if it is 10% and more.
Table C5 Capex: Monthly Capital Expenditure by Standard Classification and Funding
May 2018 Budget Performance – Elias Motsoaledi Local Municipality Page 9
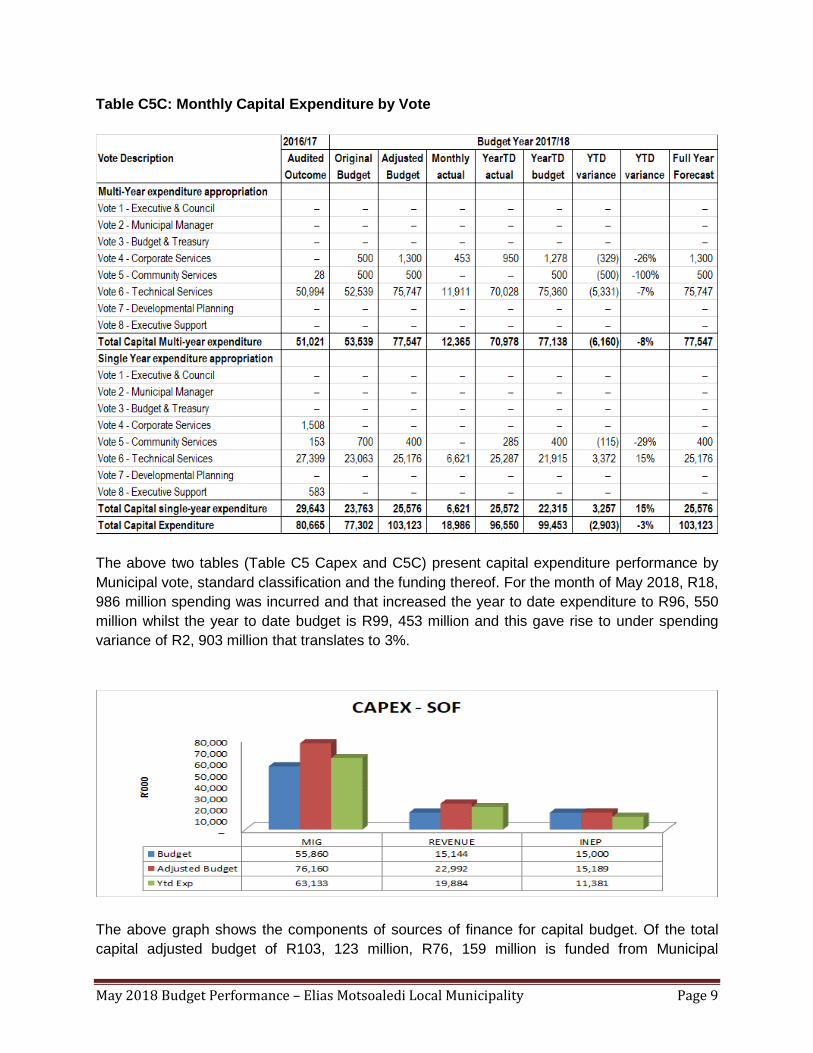
Table C5C: Monthly Capital Expenditure by Vote
The above two tables (Table C5 Capex and C5C) present capital expenditure performance by
Municipal vote, standard classification and the funding thereof. For the month of May 2018, R18,
986 million spending was incurred and that increased the year to date expenditure to R96, 550
million whilst the year to date budget is R99, 453 million and this gave rise to under spending
variance of R2, 903 million that translates to 3%.
The above graph shows the components of sources of finance for capital budget. Of the total
capital adjusted budget of R103, 123 million, R76, 159 million is funded from Municipal

May 2018 Budget Performance – Elias Motsoaledi Local Municipality Page 10
Infrastructure grant, R15, 189 million from INEP and R 22, 992 million from own revenue and the
spending per source of finance is presented in the above graph.
The above graph compares the 2016/17 and 2017/18 monthly capital expenditure performance.
The graph shows performance and/or spending improvement pattern in all the months except for
October and November, when comparing the 2017/18 and 2016/17 results.
May 2018 Budget Performance – Elias Motsoaledi Local Municipality Page 11
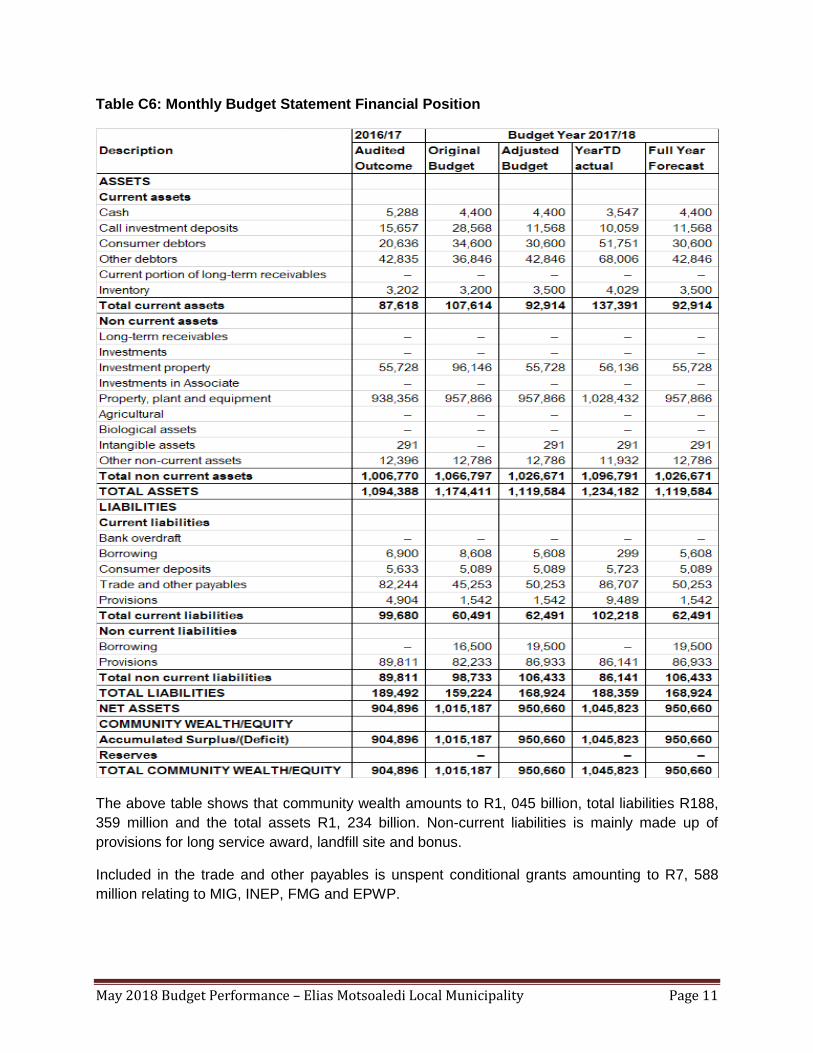
Table C6: Monthly Budget Statement Financial Position
The above table shows that community wealth amounts to R1, 045 billion, total liabilities R188,
359 million and the total assets R1, 234 billion. Non-current liabilities is mainly made up of
provisions for long service award, landfill site and bonus.
Included in the trade and other payables is unspent conditional grants amounting to R7, 588
million relating to MIG, INEP, FMG and EPWP.
May 2018 Budget Performance – Elias Motsoaledi Local Municipality Page 12
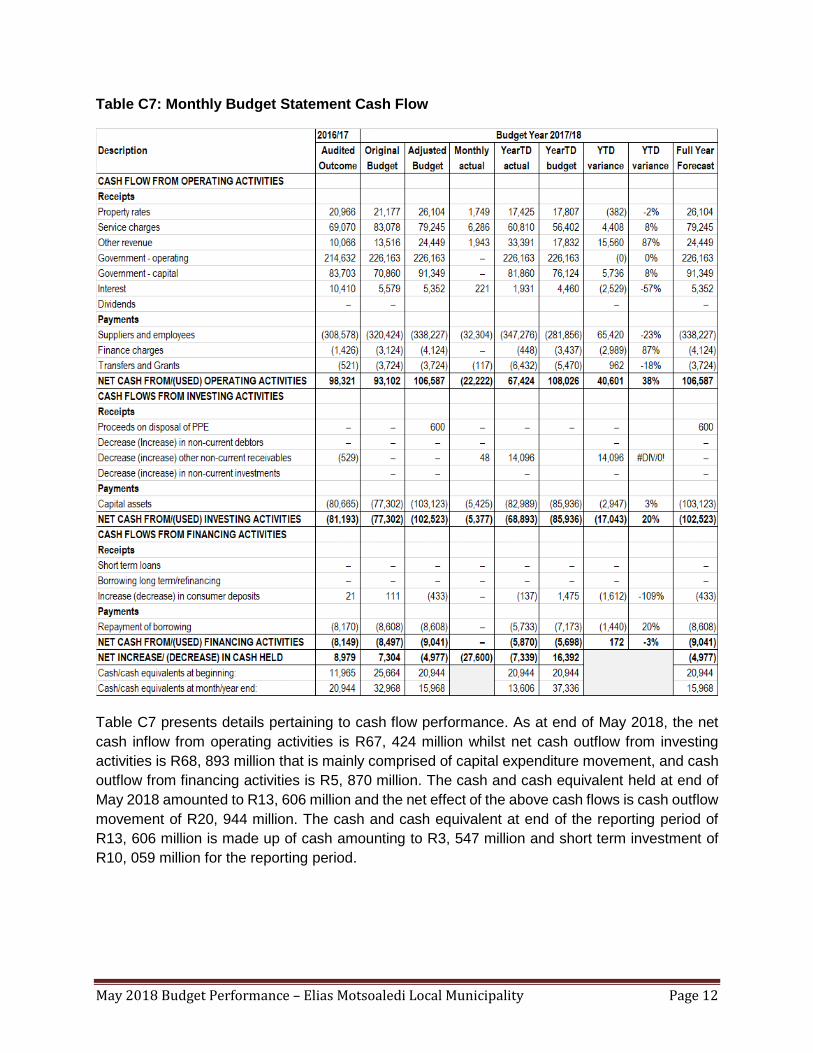
Table C7: Monthly Budget Statement Cash Flow
Table C7 presents details pertaining to cash flow performance. As at end of May 2018, the net
cash inflow from operating activities is R67, 424 million whilst net cash outflow from investing
activities is R68, 893 million that is mainly comprised of capital expenditure movement, and cash
outflow from financing activities is R5, 870 million. The cash and cash equivalent held at end of
May 2018 amounted to R13, 606 million and the net effect of the above cash flows is cash outflow
movement of R20, 944 million. The cash and cash equivalent at end of the reporting period of
R13, 606 million is made up of cash amounting to R3, 547 million and short term investment of
R10, 059 million for the reporting period.

May 2018 Budget Performance – Elias Motsoaledi Local Municipality Page 13
PART 2: SUPPORTING TABLES
Supporting Table: SC 3 - Debtors Age Analysis

May 2018 Budget Performance – Elias Motsoaledi Local Municipality Page 14
Supporting table SC3 provides a breakdown of the debtors. The outstanding debtors as at end of
May amount to R60, 177 million. The debtors’ book is made up as follows:
Rates 44%
Electricity 20%
Rental 2%
Refuse removal 10%
Interest on Debtors 27%
Other -3%
The debtors’ age analysis is graphically presented below.
May 2018 Budget Performance – Elias Motsoaledi Local Municipality Page 15
The initial graph compares debtors’ age analysis for 2016/17 financial year and 2017/18 (as at
end of May 2018) whilst the latter shows monthly movement of debtors for both the current
financial year and the 2016/17 financial year.
The debtors book is materially less than the 2016/17 monthly figures and this is attributed to
debtors write off done at end of 2016/17 financial year. The debtor’s amount increased
significantly from January to May and started increasing slightly going forward.
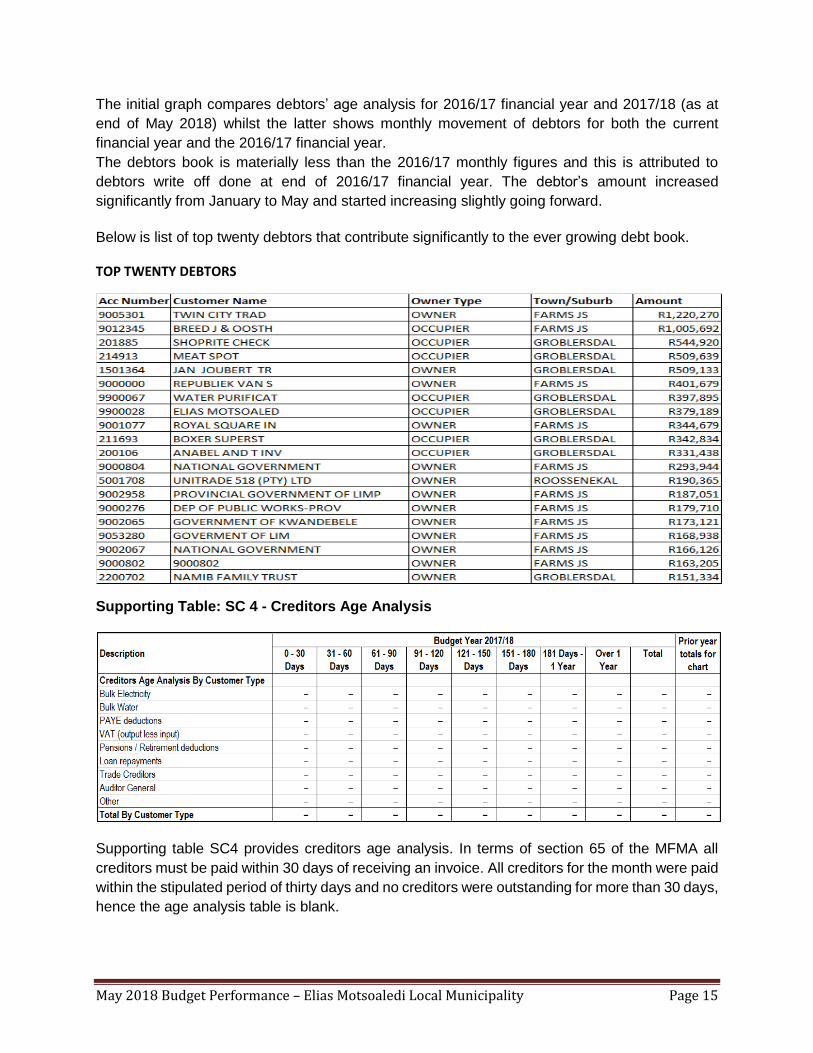
Below is list of top twenty debtors that contribute significantly to the ever growing debt book.
TOP TWENTY DEBTORS
Supporting Table: SC 4 - Creditors Age Analysis
Supporting table SC4 provides creditors age analysis. In terms of section 65 of the MFMA all
creditors must be paid within 30 days of receiving an invoice. All creditors for the month were paid
within the stipulated period of thirty days and no creditors were outstanding for more than 30 days,
hence the age analysis table is blank.
May 2018 Budget Performance – Elias Motsoaledi Local Municipality Page 16
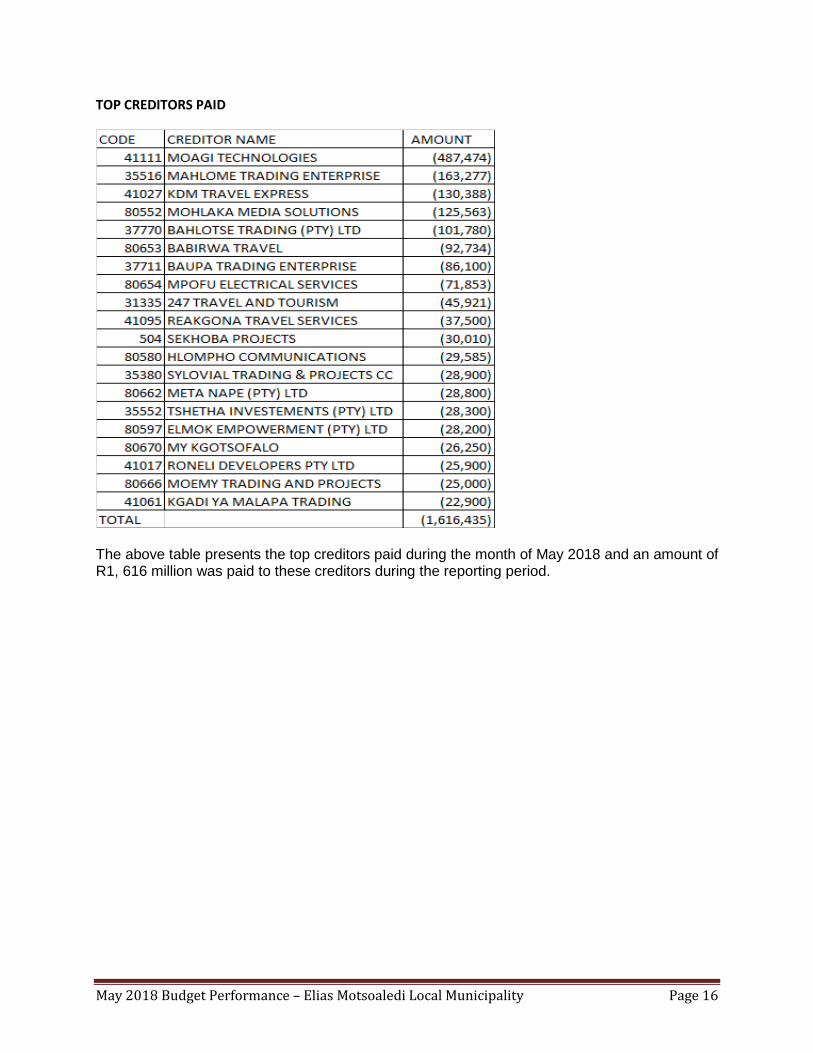
TOP CREDITORS PAID
The above table presents the top creditors paid during the month of May 2018 and an amount of R1, 616 million was paid to these creditors during the reporting period.
May 2018 Budget Performance – Elias Motsoaledi Local Municipality Page 17
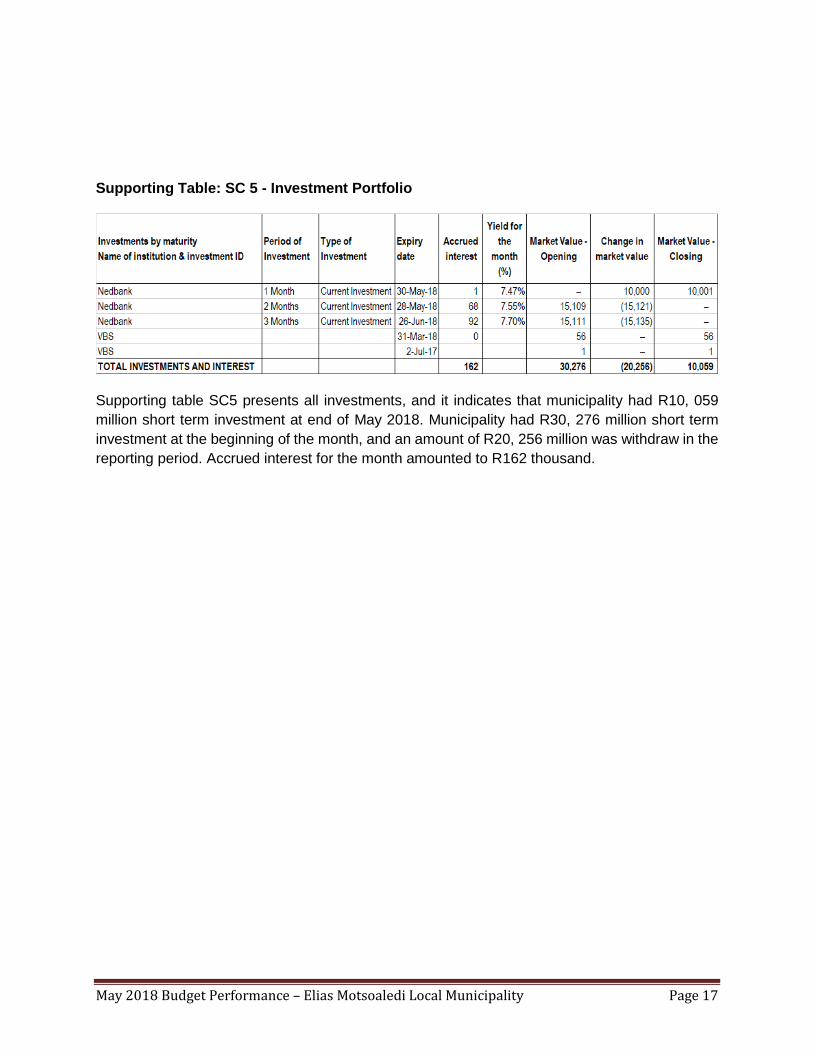
Supporting Table: SC 5 - Investment Portfolio
Supporting table SC5 presents all investments, and it indicates that municipality had R10, 059
million short term investment at end of May 2018. Municipality had R30, 276 million short term
investment at the beginning of the month, and an amount of R20, 256 million was withdraw in the
reporting period. Accrued interest for the month amounted to R162 thousand.
May 2018 Budget Performance – Elias Motsoaledi Local Municipality Page 18
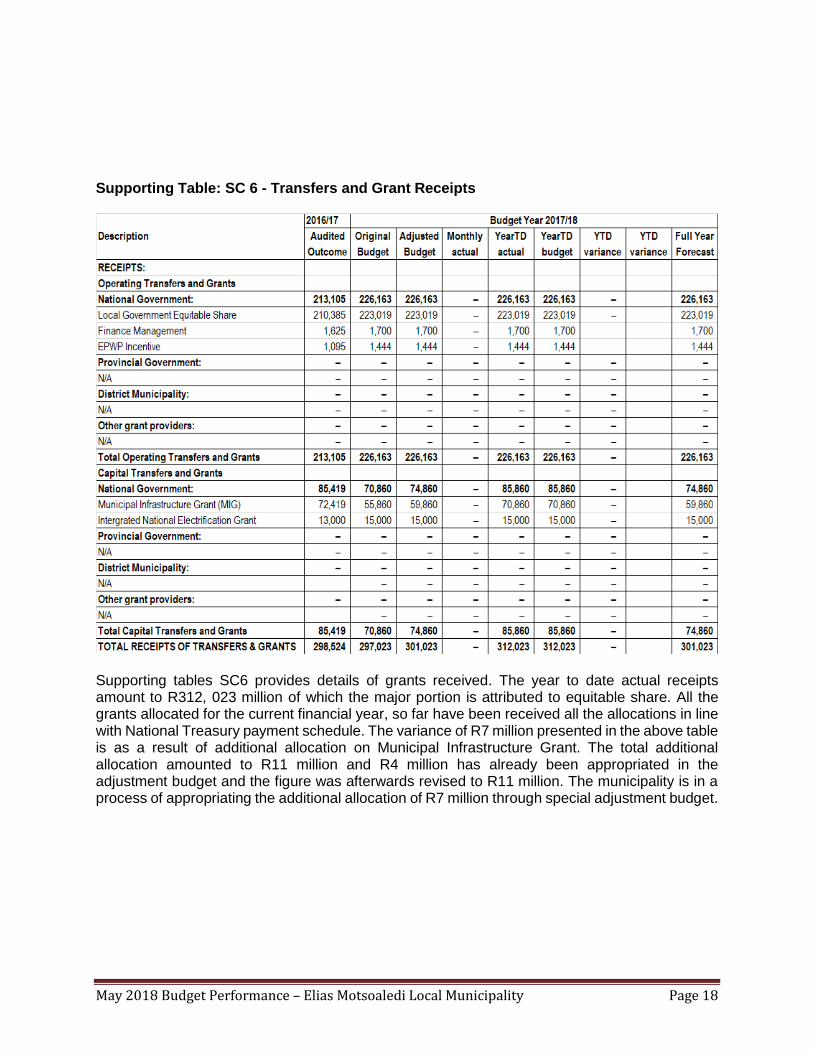
Supporting Table: SC 6 - Transfers and Grant Receipts
Supporting tables SC6 provides details of grants received. The year to date actual receipts amount to R312, 023 million of which the major portion is attributed to equitable share. All the grants allocated for the current financial year, so far have been received all the allocations in line with National Treasury payment schedule. The variance of R7 million presented in the above table is as a result of additional allocation on Municipal Infrastructure Grant. The total additional allocation amounted to R11 million and R4 million has already been appropriated in the adjustment budget and the figure was afterwards revised to R11 million. The municipality is in a process of appropriating the additional allocation of R7 million through special adjustment budget.
May 2018 Budget Performance – Elias Motsoaledi Local Municipality Page 19
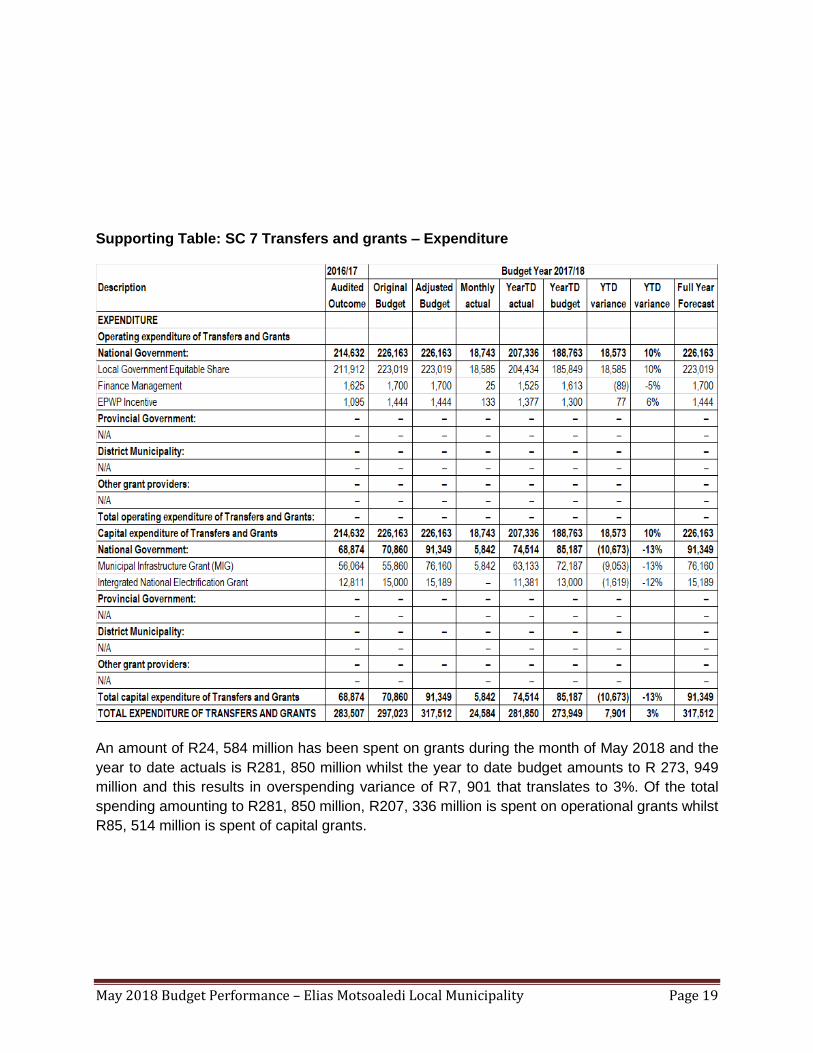
Supporting Table: SC 7 Transfers and grants – Expenditure
An amount of R24, 584 million has been spent on grants during the month of May 2018 and the
year to date actuals is R281, 850 million whilst the year to date budget amounts to R 273, 949
million and this results in overspending variance of R7, 901 that translates to 3%. Of the total
spending amounting to R281, 850 million, R207, 336 million is spent on operational grants whilst
R85, 514 million is spent of capital grants.
May 2018 Budget Performance – Elias Motsoaledi Local Municipality Page 20
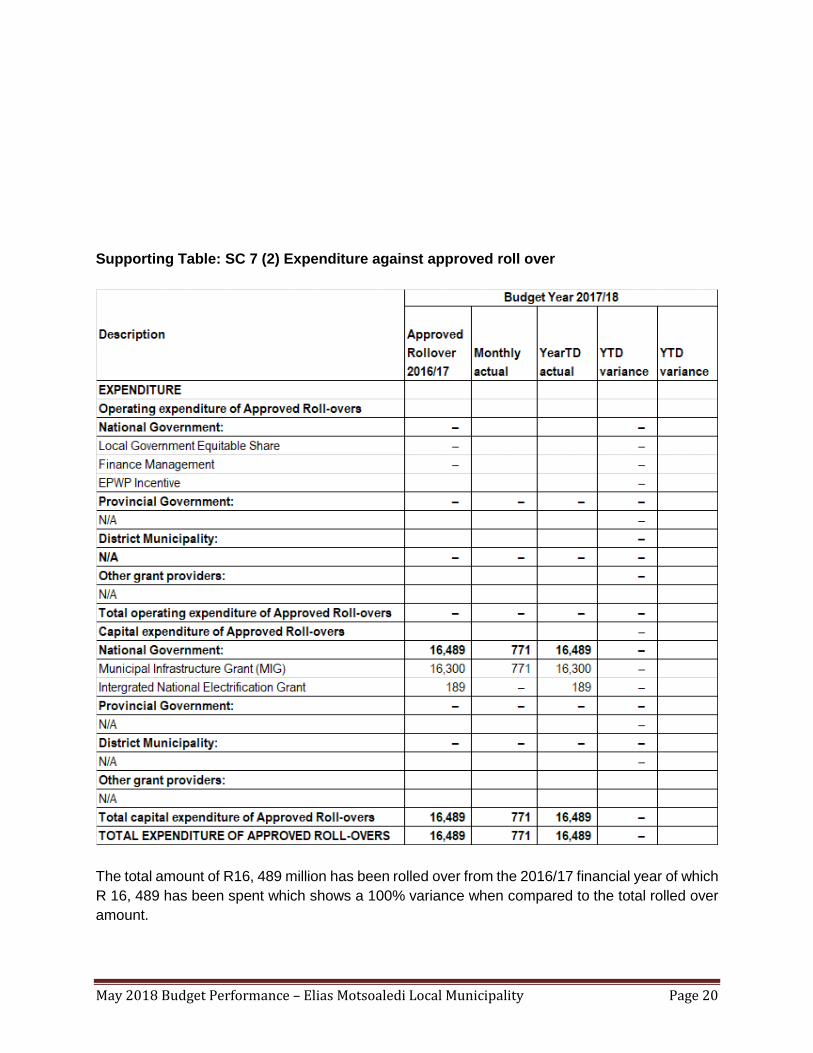
Supporting Table: SC 7 (2) Expenditure against approved roll over
The total amount of R16, 489 million has been rolled over from the 2016/17 financial year of which
R 16, 489 has been spent which shows a 100% variance when compared to the total rolled over
amount.

May 2018 Budget Performance – Elias Motsoaledi Local Municipality Page 21
The above graph depicts the gazetted and budgeted amounts for all the grants and the
expenditure thereof as at end of May 2018. The grants expenditure is shown below in
percentages:
Financial Management Grant 89, 69%
Expanded Public Work Programme 95, 37%
Equitable Share 91, 65%
Municipal Infrastructure Grant 82, 90%
Integrated National Electrification Grant 74, 93%
May 2018 Budget Performance – Elias Motsoaledi Local Municipality Page 22
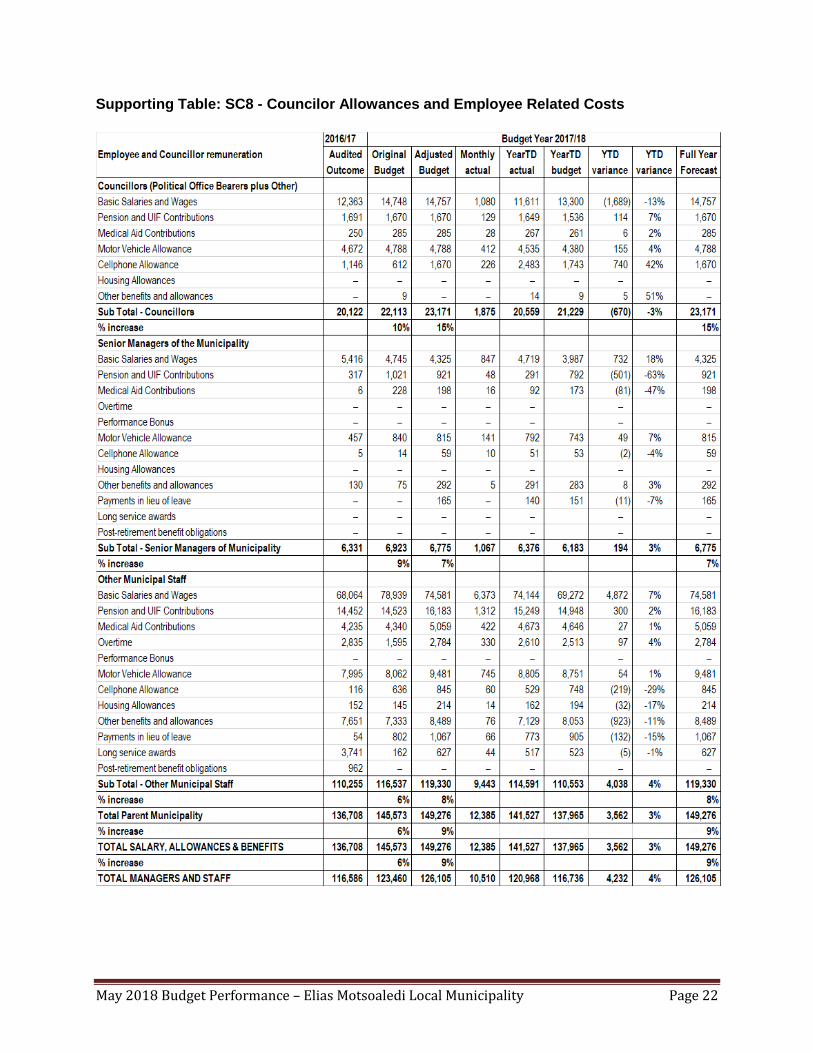
Supporting Table: SC8 - Councilor Allowances and Employee Related Costs

May 2018 Budget Performance – Elias Motsoaledi Local Municipality Page 23
Table SC8 provides details for Remuneration of Councilors and Employee related cost. The total
salaries, allowances and benefits paid as at end of May 2018 amounts to R141, 527 million and
the year to date budget is R137, 965 million and the expenditure for remuneration of councilors
amounts to R20, 559 million while the year to date budget is R21, 229 million. The year to date
actuals for senior managers is R3, 376 million and the year to date budget thereof is R6, 183
million and the year to date actuals for other municipal staff is R114, 591 million and the year to
date budget is R110, 553 million. The remuneration of councilors and senior have under spending
variance while senior manager and other municipal staff has over spending variance.
May 2018 Budget Performance – Elias Motsoaledi Local Municipality Page 21
Supporting Table SC9 Monthly Budget Statement - actuals and revised targets for cash receipts

May 2018 Budget Performance – Elias Motsoaledi Local Municipality Page 22
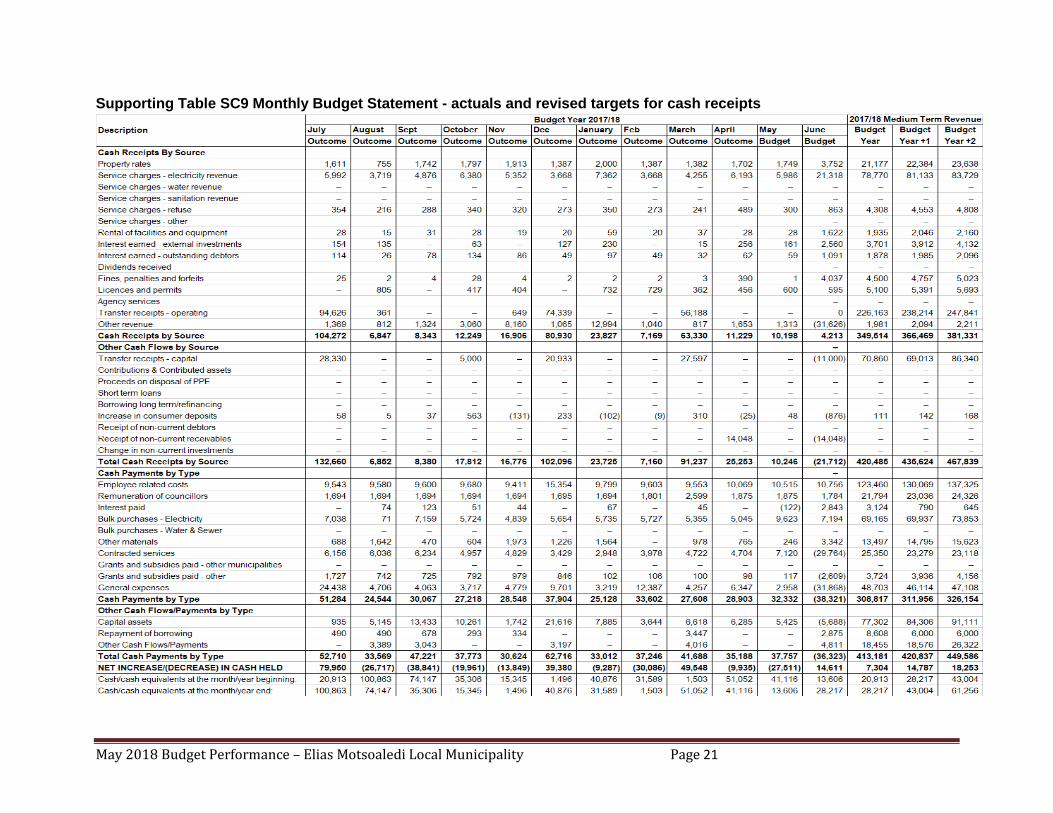
Supporting table SC9 provides detailed monthly cash flow statement that spells out the receipts
by source and payments by type. The monthly cash receipts reflect an amount of R10, 246 million
and the total cash payment for the month were R37, 757 million and this resulted in net decrease
in cash held amounting to R27, 511 million and with cash and cash equivalent of R41, 116 million
at the beginning of the reporting period, the municipality closed off the month with cash and cash
equivalent amounting to R13, 606 million. This is a supporting table for table C7 – Cash Flow
Statement.
Supporting Table: SC 12 Capital Expenditure Trend
Supporting table SC12 provides information on the monthly trends for capital expenditure. In
terms of this table the capital expenditure for the month of May amounts to R18, 986 million. The
year to date actuals amount to R89, 688 million whilst the year to date budget is R92, 896 million
and this gives rise to under spending variance of R3, 208 million or 3,4%.

May 2018 Budget Performance – Elias Motsoaledi Local Municipality Page 23
Supporting Table: SC 13(a) Capital Expenditure on New Assets

May 2018 Budget Performance – Elias Motsoaledi Local Municipality Page 24
Supporting Table: SC 13(b) Capital Expenditure on Renewal of Existing Assets
May 2018 Budget Performance – Elias Motsoaledi Local Municipality Page 25
Supporting Table: SC 13(c) Repairs and Maintenance Expenditure

May 2018 Budget Performance – Elias Motsoaledi Local Municipality Page 26
Supporting Table: SC 13(d) Depreciation and asset impairment

May 2018 Budget Performance – Elias Motsoaledi Local Municipality Page 27
Supporting Table: SC 13(e) Capital Expenditure on upgrading of Existing Assets
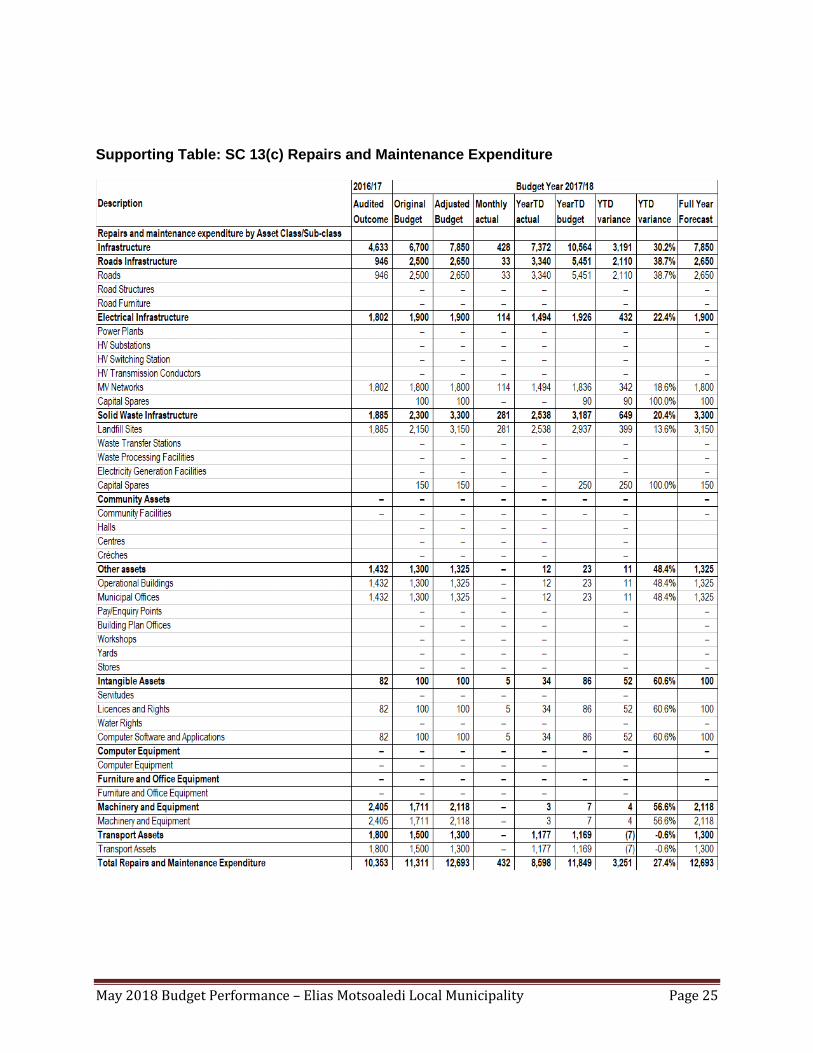
Supporting table SC13a, SC13b and SC13e provide details of capital expenditure in terms of
asset classification based on new assets and renewal of existing assets; while table SC13c
provide details of expenditure performance on repairs and maintenance by asset classification
and Table SC13d presents expenditure on depreciation and asset impairment. These tables
present the capital programme, and assets management and performance of the Municipality.
May 2018 Budget Performance – Elias Motsoaledi Local Municipality Page 28
The total expenditure for new capital projects amounts to R47, 860 million and the year to date
budget is R49, 639 million which reflects under spending variance of R1, 779 million that
translates to 4% variance. The year to date actuals on renewal of existing assets amounts R40,
281 million and with the year to date budget of R40, 298 million and this reflects under spending
variance of R17 thousand that translates to 0% variance. The year to date actual expenditure on
repairs and maintenance is R8, 598 million and the year to date budget is R11, 849 million,
reflecting under spending variance of R3, 251 million that translates to 27%.
The year to date actual expenditure on upgrading of existing assets is R8, 409 million and the
year to date budget is R9, 515 million, reflecting under spending variance of R1, 107 million that
translates to 23%.
The depreciation and asset impairment will only have actuals once the integration between Asset
management system and core financial system is done and this is one of the requirements for
implementation of mSCOA. This is basically mean that the municipality is not complying with
some of mSCOA requirements.
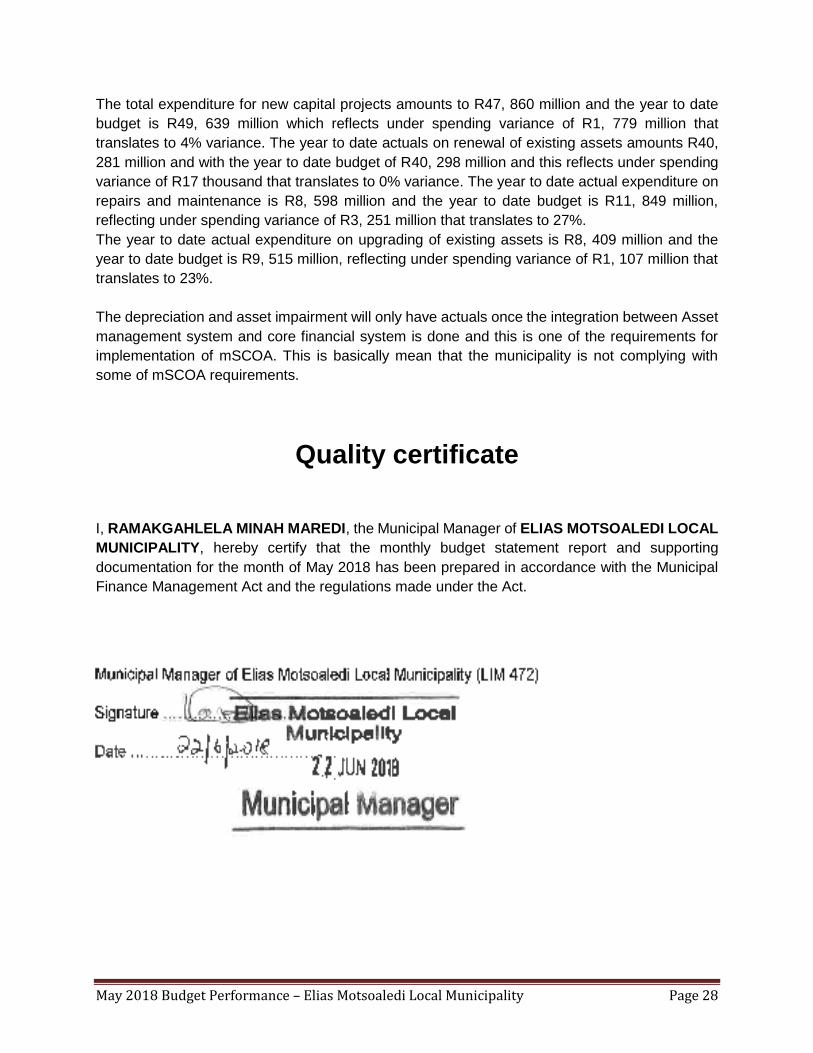
Quality certificate
I, RAMAKGAHLELA MINAH MAREDI, the Municipal Manager of ELIAS MOTSOALEDI LOCAL
MUNICIPALITY, hereby certify that the monthly budget statement report and supporting
documentation for the month of May 2018 has been prepared in accordance with the Municipal
Finance Management Act and the regulations made under the Act.


![Popple5 c7[2]](https://img.pdfslide.us/doc/110x75/5550bed1b4c905fa618b50ea/popple5-c72.jpg)


![C7 graham session c7 mon1530_v6[2]](https://img.pdfslide.us/doc/110x75/58ed94c51a28ab717c8b475d/c7-graham-session-c7-mon1530v62.jpg)