Embed Size (px)
Citation preview
I~
219
Monthly Anchoveta Consumption ofGuano Birds, 1953 to 1982*
P. MUCKGerTT/LlnAgency for Technical
Cooperation (GTZ) clo PROCOPAP.O. Box 22, Callao, Peru
D. PAULYInternational Center for Living Aquatic
Resources Manageml!nt (ICLARM)MC P.O. Box 1501
Makati, Metro Manila
Philippines
MUCK. P. and D. PAULY. 1987. Monthly anchoveu consumption of guano birds. 1953 to 1982, p. 219-233. In D. Pauly and I. Tsukayama
(eds.) The Peruvian anchovet2 and its upwelling ecosystem: three decades of change. ICLARM Smdies and Reviews 15.351 p.Instituto del Mar del Peru (IMARP1:.1. Callao Peru; Deutsche Gesellschaft fiir Technische Zus:unrnenarbeit (GTZ), GmbH, Eschbom,Federal Republic of Germany; and International Center for Living Aquatic Resources Management (ICLAR.\1), Manila, Philippines.
Abstract
~.,,.
Anchoveta consumption by Peruvian guano birds (Phalacrocorax bougainvil/ii, SuIa variegata. Pelecanus tr.agus) was estimated for theperiod 1953 to 1982 for the area 4-140S latitude using an analytical consumption model and monthly seabird population estimates based on fieldcounts. Highest estimates were obtained for 1955-1956 with about 2 million metric tannes (t) per year of anchovCla being consumed by the gumobirds. Due to the continuous decline of the guano bird populations, their anchovCla consumption dropped to values c.f less than 20.000 t at thebeginning of the 19705 and an average of arolU1d 30,000 t between 1970 and 1982.
Population decline of guano birds is most probably caused by reduced anchoVy availability, a consequence of the combined effects of theheavy anchovy fishery and B Ntiio-rebted periods of low food vulnerability.
Introduction
In the Peruvian upwelling ecosystem guano birds are probably the species most dependenton anchoveta (Engraulis ringens) as a food resource arid the most conspicuous competitors for
'the anchoveta fishery. , . .: -,'
" Thiscompetitionis particularlyvisiblewhenonecomparestherangeof anchovetasizes.consumed by cormorants and boobies with the size distribution of the Peruvian purse seine'fis~ery (see Figs. 1 and 2). That this size overlap is neither confmed to Peru, nor to these two'guanobird species is illustrated by Fig. 3, showing an even more pronounced ov~rlapbetweenthe anchovy (E. mordax) size distribution in the California purse seine fishery and ini:egurgigatedfood bolus of the brown pelican '(Pelecanusoccidentalis californicus), a close~~ative of the pelican occurring off Peru (earl~ertaxonomies in fact saw P. thagus as aSubspeciesof P. occidentalis, just as P. occidentalis californicus is).
, Periods of high anchoveta biomass have thus usually also been periods of high abundance of~o~orants (Phalacrocorax bougainvilliL),gannets (Sula variegata) and pelicans (Pelecanus-thtigus)which are the principal species of so-called guano birds (see Tovar et aI., this voL).
Their excrements (Spanish guano) are of economical importance as fertilizer '¥1d,in the~past,for gunpowder production. Following the 1972 anchoveta collapse due to overexploitation'andunfavorable oceanographic conditions, the guano birds became reduced to around 20% of:theirformer population size (of 24 million in 1954-1955).
.. ICLARM Contribution No. 378; PROCOPA Contribution No. 37.
- -- -
5 10 15
Anchoveto body length(TL,cm)
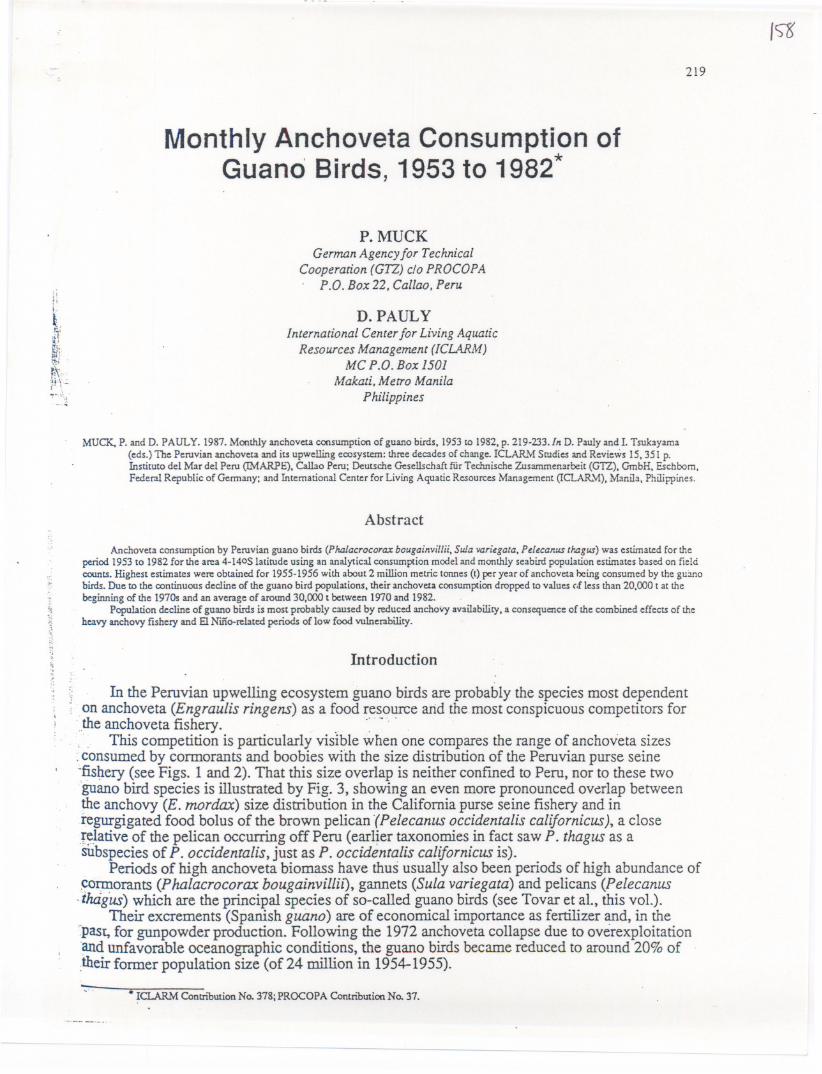
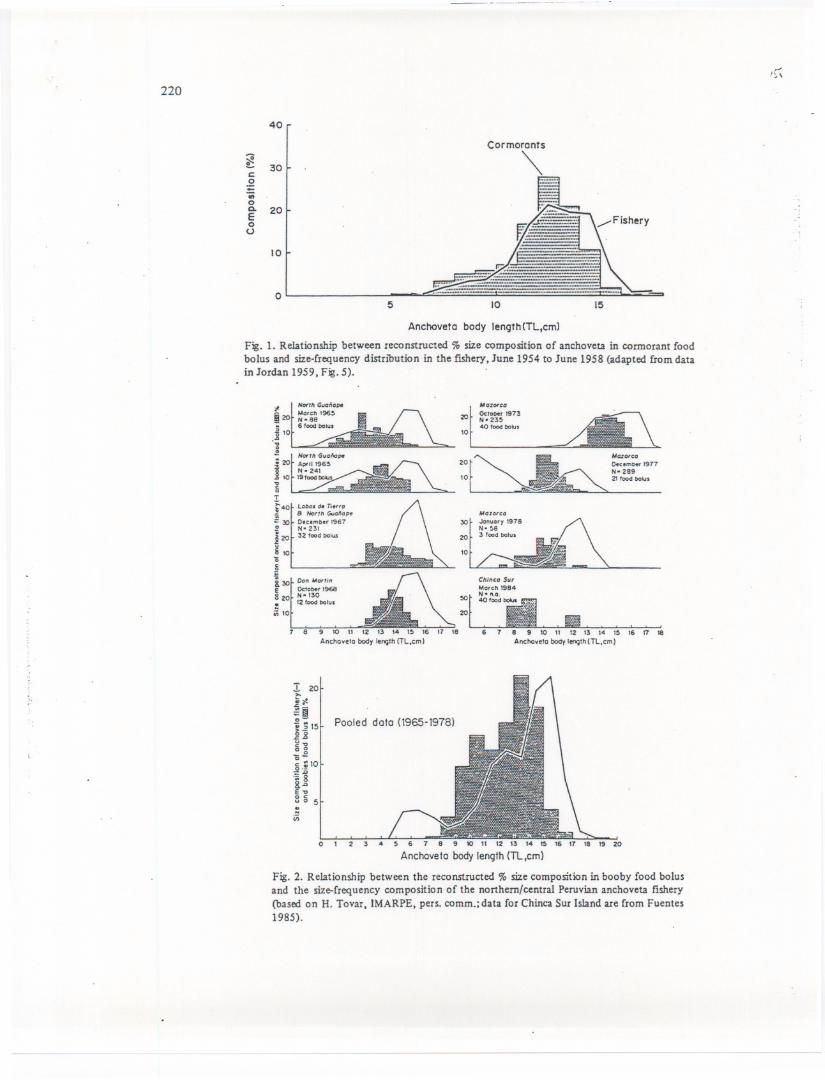
Fig. 1. Relationship between reconstructed % size composition of anchoveta in cormorant foodbolus and size-frequency distribution in the fIShery, June 1954 to June 1958 (adapted from datain Jordan 1959, Fig. 5).
>,
Pooled dolo (1965-1978)
o , 2 3 4
Fig. 2. Relationship between the reconstructed % size composition in booby food bolusand the size-frequency composition of the northern/central Peruvian anchoveta fishery(based on H. Tovar, IMARPE, pelS. comm.;data for Chinca Sur Island are from Fuentes1985).
220
40
i! 30c:.g..0a. 20E00
\0
0
t Non>_M"
"ozewco
g20 . '96 20 Oc.ooo. 1973N.23_ 6 foodbolus 40 food botu.
.!'O . ...
'0
0.!
j 20t A.-111m
20N.24'
to 19foodtlO-..s . . '010T";..0!
\;; :!OfDoc...... '967 ..I.
30! "-231I 20 32 foodDolus 20
'0 '0'Ii
i-e Octol>ef'1968
20 .o bolu..fA. \'O 20
8 9 10 \I '2 13 14 I '6 17 '8 6 7 8 9 JO " 12 '3 14 I 16 17 18

221
- Son Pedro fishing catch_ Pelican food samples
30April 1980
~~c: 20.g.;;;oQ.E 10oU
Santo Barbaro Island (n-1I3)
n=494
o
30June 1980
n=644
~~c:.2 20-VioQ.Eo 10U
Anapaca Island (n-172)
Fig. 3. Relationship between reconstructed % size composition of northernanchovy in pelican food bolus and size.-frequencydistribution in the Californiapurse seine fishery(adapted from Sunadaet aI. 1981).
Furness (1982) using data of Schaefer (1970) suggests that, betWeen 196~and 1965,guano.birdswereconsumingannually17%.ofthe totalPeruviananchoveu biomass.Jordan(1967)'estimated that the annual anchoveta consumption betWeen1961 and 1963 was around 45% of the.~otalannual anchoveta catch; similar figures are given in Murphy (1972).
. . . It is theaim of this paperto presentmonthlyestimatesof anchovetaconsumptionbyguanoI' ~irdsfor the period 1953to 1982andtorelatethisconsumption~pthefisheryandenvironmental
!':conditions suchas El Ninoevents. .' '
I '. .
- -Materials and Methods
..<. Anchoveta consumption was calculated using (i) monthly biomass data for the three guano.~irdspecies (based on the'abundance data for juveniles and adults given inTovar et.al., this:-V91.),(ii) "possible" consumption rates (based on the guano birds' body weights and on~etabolic considerations) and (iii) anchoveta availability to guano birds. .
. ~f':<.Abundance data were converted to biomass by multiplying with the birds' average body~~lght, given in Table 1. '.'_.>;;A -largebody of literature on daily consumptionrates based on metabolic equations, stomach.~ntents'analysis, feeding experiments and guano production exists for guano birds (fable 2).
ilb:~se data, plotted against body weight, suggest that specific differences can be neglected, andI
I
.~at tI;1edaily food consumption is a logarithmic function of body \\--eightand of the analyticJP.~thOd(see Fig. 4). .
, :J;--.)'he metabolic equations'-which result in notable lower values -were used to calculate .
l'~~.umption rates corresponding t~ the daily energy expenditures (DEE, see Wiens and Scott
-
02 4 6 8 10 12 14
Standard length (cm)--N , I I , I , I ,
2 4 6. 8 10 12 14 16
Anchovy body length (TL,cm)
222
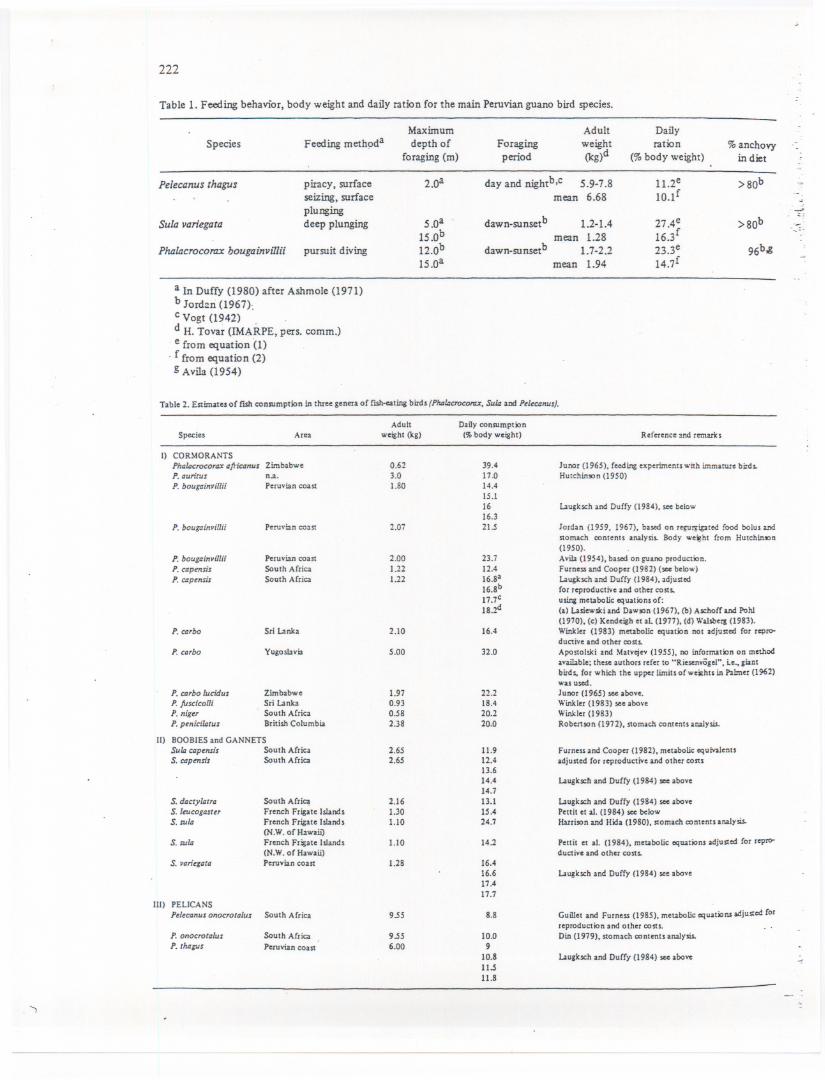
Table 1. Feeding behavior, body weight and daily ration for the main Peruvian guano bird species.
SpeciesMaximumdepth of
foraging (m)
Sula variegata
piracy, surfaceseizing, surfaceplungingdeep plunging
2.oaPelecanus thagus
Phalacrocorax hougainviIlii pursuit diving
5.0a15.0b12.0b15.0a
a In Duffy (1980) after Ashrnole (1971)b Jord~n (1967):c Vogt (1942) .d H. Tovar (lMARPE, pers. comm.)e from equation '(1)
. f from equation (2)g Avila (1954)
,
Adult DailyForaging weight ration % anchovyperiod (kg)d (% body weight) in diet
day and nightb,C 5.9-7.8 11.2e >80bmean 6.68 10.lf
dawn-sunset b-
1.2-1.4 27 Ae >80b ....=.mean 1.28 16.3f
dawn-sunsetb 1.7-2.2 23.3e 96b,gmean 1.94 14.7f
Table 2. Estimate! of f"lshconsumption In threeseneta of rub-eatlns binb (PJuzIDcrocoru. SuI4 and PeleCIJnus).
Adult Daay consumptionSpecies Area woisht (l<S) ($ body weisht) R.(erence1J1d rernarle.
I) CORMORANTSPhGIDcIOCOTtS:tGftiClJnus Zimbabwe 0.62 39.4 Junor (1965). (eeding experiments with immarure birdP. GUritus n.a. 3.0 17.0 Hutchln",n (1950)P. bougGinvil/ii Peruvian coast 1.80 14.4
15.116 1.augksch and Duffy (1984),"" below16.3
P. bougGinvillii Peruvbn C03st 2.07 21.5 Jordan (1959. 1967), based on regu..ipred (ood bolus 1J1dSlomach conlents analysi Body weiJhl (rom Hutchin!On(1950).
P. bougGinvil/ii Peruvian coast 2.00 23.7 Avila (1954), based on suano production.P. cspmsis South Africa 1.22 12.4 Furness and Cooper (1982) (.... below)P. ClJpenm South Africa 1.22 16.8a 1.augksch and Du((y (1984), adjuSled
16.8b (or reproductive and other COSlS,17.7c using metabolic equations 0(:18 (a) 1.asi_ski and Daw",n (1967), (b) Aschoff and Pahl
(1970), (c) Kendeish et a1. (1977), (d) Walsber& (1983).P. t/1,bo Sri 1.anka 2.10 16.4 Winkler (1983) metabolic equation not adjuSled (or repro-
ductive and other costP. CG'bo Yusosloyia 5.00 32.0 Apostolski and Matyejey (1955). no Information on method
ayailable; the.e authors refer to "Riesenv08e1". i.e siantbird.. for which the upper limits ofwoahu in Pahner (1962)"'as used.
P. ar,bo lucidus Zimbabwe 1.97 22.2 Junor (1965) .... aboye.P. fuselcoUI Sri 1.anka 0.93 18.4 Winkler (1983) see aboyeP. nige, South Africa 0.58 20.2 Winkler (1983)P. penidIDtus British Columbia 2.38 20.0 Robenson (1972). stomach conlents analysis.
11) BOOBIES and GANNETSSuID ClJpensis South Africa 2.6S 11.9 Furness and Cooper (1982). metabolic equivalenuS. arpmsis South Africa 2.65 12.4 adjusted (or reproductive and other COStS
13.614.4 1.augkscll and Duffy (1984) .... aboye14.7
S. dGctyIDtTG South Afri 2.16 13.1 1.au8ksch and Du(fy (1984) .... aboyeS. lcucag.ste, French Frisate Islands 1.30 15.4 Pettilet aI. (1984).... belowS. su/G French Frigate Island. 1.10 24.7 Hatri",n and 'Hida (1980). Slomach contents analysis.
<N.W. of Hawaii)S. suID French Frigate Islands 1.10 14.2 PeUit et a1. (1984), metabolic equations adjusted for repro-
<N.W. o( Hawaii) ductive and other COSl
S. VGrier;GtG Peruvian coast 1.28 16.416.6 1.augksch and Duffy (1984) see aboye17.417.7
111) PELICANSp.lecanus onocratG/us South Africa 9.5S 8.8 Guillet and Furness (198S), metabolic equations adjusted (or
r.production and other costP. onocra/Glus South A(rica 9.5S 10.0 Din (1979), stomach contmlsanalysis.P. /Juzps Peruvian coast 6.00 9
10.8 1.augksch and Du(fy (1984) see above11.511.8
-.
10
-
...
0,- Cormorantse,_ Boobies
... Pelicans
/Metabolicstudies
4 6
Body weight (kg)
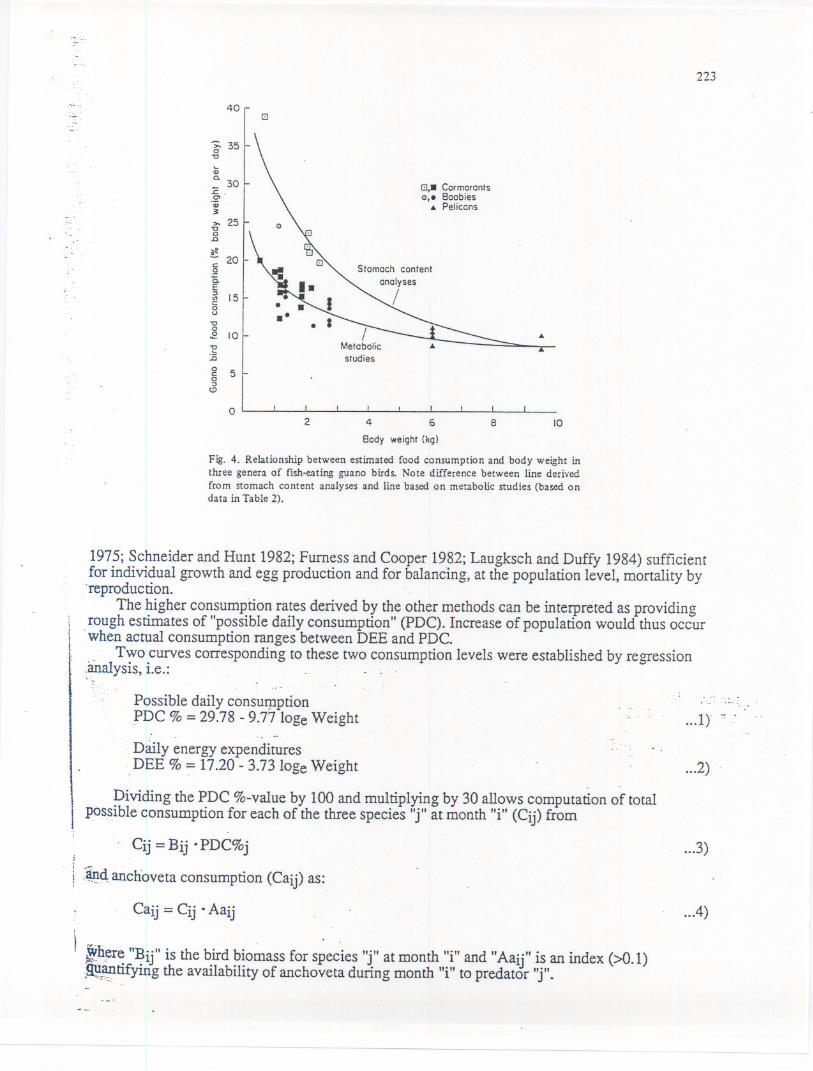
Fig. 4. Relationship between estimated food consumption and body weight inthree genera of fish-eating guano birds. Note difference between line derivedfrom stomach content analyses and line based on metabolic studies (based ondata in Table 2).
8
223
1975; Schneider and Hunt 1982;Furness and Cooper 1982;Laugksch and Duffy 1984) sufficientfor individual growth and egg production and for balancing, at the population level, mortality by'reproduction. . .
. The higher consumption rates derived by the other methods can be interpreted as providingrough estimates of "possible daily consumption" (PDC). Increase of population would thus occur.when actual consumption ranges between DEE and PDC.
. Two curves corresponding to these two consumption levels were established by regression~~alysis, Le.: . .
Possible daily consUlpptionPDC % =29.78 - 9.77 loge Weight
D81lyenergy expenditures. DEE % =17.20 - 3.73 loge Weight
Dividing the PDC %-value by 100 and multiplying by 30 allows computation of totalp'os~ibieconsumption for each of the three species "j" at month "i" (Cij) from
. Cij =Bij .PDC%j
:~d, anchoveta consumption (Caij) as:
Caij =Cij .Aaij
~~~e "Bij" is the bird biomass for species "j" at month "i" and "Aaij" is an index (>0.1)m!.3}1tifyingthe availability of anchoveta during month "i" to predator "j".t '_"_0."
- - ---
...1). .
...2)
...3)
...4)
40 I
a
\>. 350"0
CD
Q. 30.c.O'
.0;3>. 25
"8.Q"e
20c:.9C.E:>
15'"c:0u"00
10.E
'E:E0
5c:0:>
C)
02
-.. -.. -.. -- ... --.. -- - ----- -_._n_.. - -- - -
224
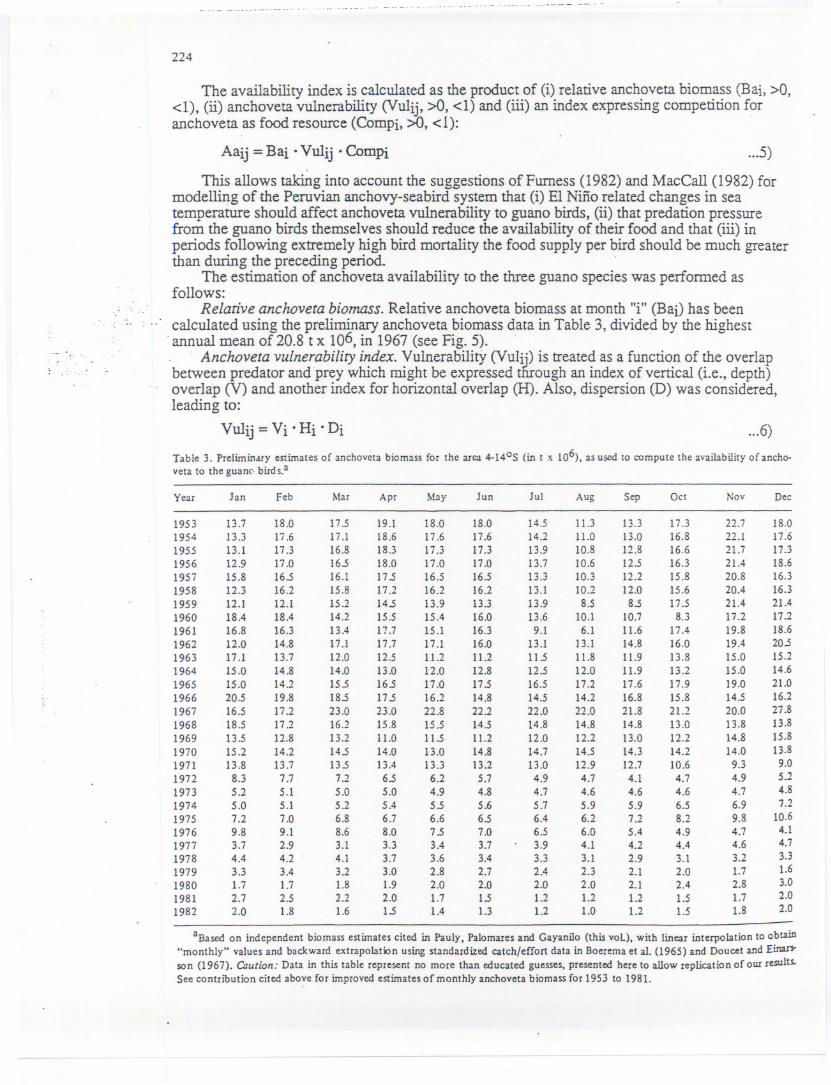
aBased on independent biomass estimates cited in Pauly. Palomares and Gayanilo (this voL), with linear interpolation to obtain"monthly" values and backward extrapolation using standardized catch/effort data in Boerema et aI. (1965) and Doucet and Einan"son (1967). Caution: Data in this table represent no more than educated guesses, presented here to allow replication of our results.See contribution cited above for improved estimates of monthly anchoveta biomass for 1953 to 1981.
The availability index is calculated as the product of (i) relative anchoveta biomass (Bai, >0,<1), (ii) anchoveta vulnerability (Vulij, >0, <1) and (ill) an index expressing competition foranchovetaas foodresource(Compi,>0, <1): .
Aaij =Bai .Vulij .ComPi ...5)
This allows taking into account the suggestions of Fumess (1982) and MacCall (1982) formodelling of the Peruvian anchovy-seabird system that (i) EI Niiio related changes in seatemperature should affect anchoveta vulnerability to guano birds, (ii) that predation pressurefrom the guano birds themselves should reduce the availability of their food and that (ill) inperiods following extremely high bird mortality the food supply per bird should be much greaterthan during the preceding period.
The estimation of anchoveta availability to the three guano species was performed asfollows:
Relative anchoveta biomass. Relative anchoveta biomass at month "i" (Baj) has been..
..' calculated using the preliminary anchoveta biomass data in Table 3, divided by the highest. annualmeanof 20.8 t x 106,in 1967(seeFig.5). . .
. . Anchovetavulnerabiliryindex.VulnerabilitY(VUI is treatedas a functionof the overlapbetween predator and 'prey which might be expressed tough an index of vertical (Le., depth)overlap (V) and another index for horizontal overlap (H). Also, dispersion (D) was considered,leading to:
VuIij = Vi .Hi .Di ...6)
Table 3. Preliminary estimatesof anchoyctabiomass for the area 4-1405 (in t x 106), as used to compute the availabilityof ancho-veta to the guanc. bird s.a
Year Jan Feb Mar Apr May Jun Jul Aug Sep Oct Noy Dee
1953 13.7 18.0 17.5 19.1 18.0 18.0 14.5 11.3 13.3 17.3 22.7 18.01954 13.3 Ii .6 17.1 18.6 17.6 17.6 14.2 11.0 13.0 16.8 22.1 17.61955 13.1 17.3 16.8 18.3 17.3 17.3 13.9 10.8 12.8 16.6 21.7 17.31956 12.9 17.0 16.5 18.0 17.0 17.0 13.7 10.6 12.5 16.3 21.4 18.61957 15.8 16.5 16.1 17.5 16.5 16.5 13.3 10.3 12.2 15.8 20.8 16.31958 12.3 16.2 15.8 17.2 16.2 16.2 13.1 10.2 12.0 15.6 20.4 16.31959 12.1 12.1 15.2 14.5 13.9 13.3 13.9 8.5 8.5 17.5 21.4 21.41960 18.4 18.4 14.2 15.5 15.4 16.0 13.6 10.1 10.7 8.3 17.2 17.21961 16.8 16.3 13.4 17.7 15.1 16.3 9.1 6.1 11.6 17.4 19.8 18.61962 12.0 14.8 17.1 17.7 17.1 16.0 13.1 13.1 14.8 16.0 19.4 20.51963 17.1 13.7 12.0 12.5 11.2 11.2 11.5 11.8 11.9 13.8 15.0 15.21964 15.0 14.8 14.0 13.0 12.0 12.8 12.5 12.0 11.9 13.2 15.0 14.61965 15.0 14.2 15.5 16.5 17.0 17.5 16.5 17.2 17.6 17.9 19.0 21.01966 20.5 19.8 18.5 17.5 16.2 14.8 14.5 14.2 16.8 15.8 14.5 16.21967 16.5 17.2 23.0 23.0 22.8 22.2 22.0 22.0 21.8 21.2 20.0 27.81968 18.5 17.2 16.2 15.8 15.5 14.5 14.8 14.8 14.8 13.0 13.8 13.81969 13.5 12.8 13.2 11.0 11.5 11.2 12.0 12.2 13.0 12.2 14.8 15.81970 15.2 14.2 14.5 14.0 13.0 14.8 14.7 14.5 14.3 14.2 14.0 13.81971 13.8 13.7 13.5 13.4 13.3 13.2 13.0 12.9 12.7 10.6 9.3 9.01972 8.3 7.7 7.2 6.5 6.2 5.7 4.9 4.7 4.1 4.7 4.9 5.21973 5.2 5.1 5.0 5.0 4.9 4.8 4.7 4.6 4.6 4.6 4.7 4.81974 5.0 5.1 5.2 5.4 5.5 5.6 5.7 5.9 5.9 6.5 6.9 7.21975 7.2 7.0 6.8 6.7 6.6 6.5 6.4 6.2 7.2 8.2 9.8 10.61976 9.8 9.1 8.6 8.0 7.5 7.0 6.5 6.0 5.4 4.9 4.7 4.11977 3.7 2.9 3.1 3.3 3.4 3.7 3.9 4.1 4.2 4.4 4.6 4.71978 4.4 4.2 4.1 3.7 3.6 3.4 3.3 3.1 2.9 3.1 3.2 3.31979 3.3 3.4 3.2 3.0 2.8 2.7 2.4 2.3 2.1 2.0 1.7 1.61980 1.7 1.7 1.8 1.9 2.0 2.0 2.0 2.0 2.1 2.4 2.8 3.0
1981 2.7 2.5 2.2 2.0 1.7 1.5 1.2 1.2 1.2 1.5 1.7 2.01982 2.0 1.8 1.6 1.5 1.4 1.3 1.2 1.0 1.2 1.5 1.8 2.0
225
I,I,I ,,--/ \
" \'I ''-~
,.!...
~ 1.0.!I_D
-:::-..=.....D..0..~~ 0.5H
I,I ," I ',I ',,.,, ,'
o
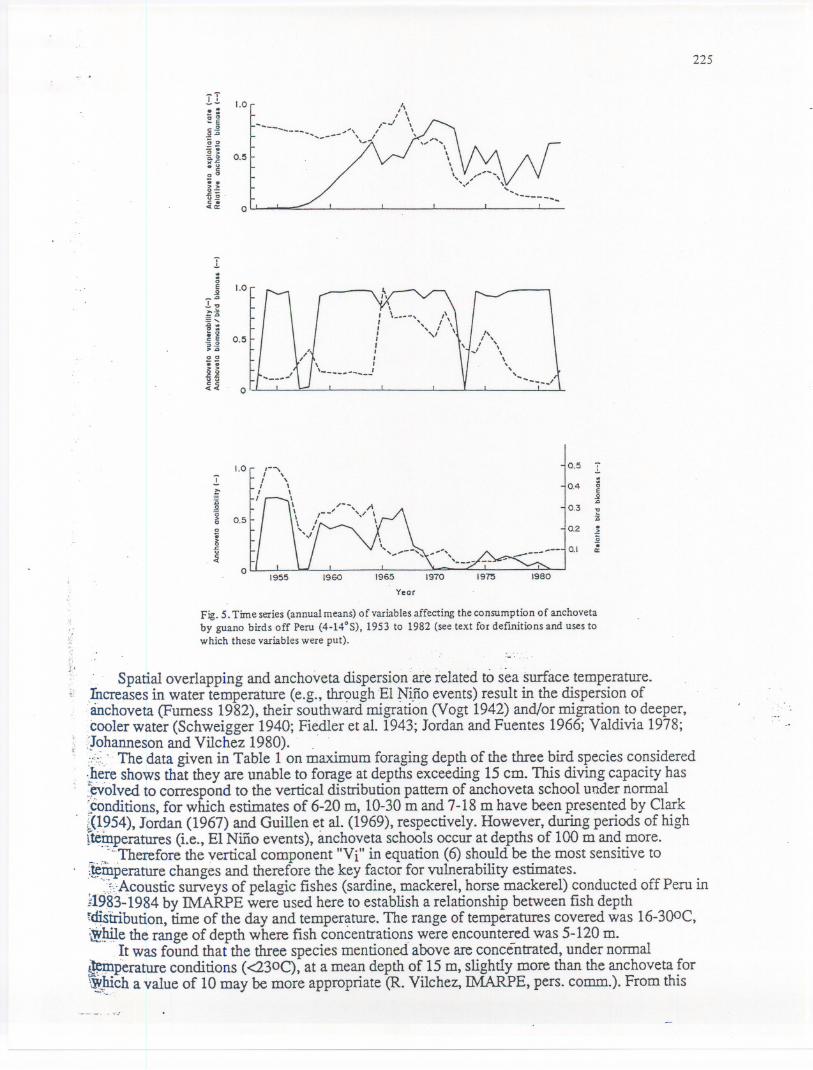
Fig. 5. Time series (annual means) of variables affecting the consumption of anchovetaby guano birds off Peru (4-14°S), 1953 to 1982 (see text for defmitions and uses towhich these variables were put).
. Spatial overlapping and anchoveta dispersion are related to sea surface temperature.)?creases in water temperature (e.g., thr~>ugh.EI~i.fioevents) result in the dispersion of.anchoveta (Furness 1982), their southward migration (Vogt 1942) and/or migration to deeper,cooler water (Schweigger 1940; Fiedler et al. 1943; Jordan and Fuentes 1966; Valdivia 1978;:]ohanneson and ViIchez 1980).. ...,.".::.'.The data given in Table 1 on maximum foraging depth of the three bird species considered:..~e!eshows that they are unable to forage at depths exceeding 15 cm. This diving capacity has~olved to correspond to the vertical distribution pattern of anchoveta school under normal~nditions, for which estimates of 6-20 m, 10-30 m and 7-18 m have been presented by Clark~(~~54),Jordan (1967) and Guillen e~al. (1969), respectively. However, during periods of hightte9.1peratures(Le., EI Niiio events), anchoveta schools occur at depths of 100 m and more._ ,..~i...Thereforethe vertical component "Vi" in equation (6) should be the most sensitive to1~:mperaturechanges and therefore the key factor for vulnerability estimates., . ::J-::AcousticsUlVeys of pelagic fishes (sardine, mackerel, horse mackerel) conducted off Peru in;1~?~-1984by IMARPE were used here to establish a relationship between fish depthf~tribution, time of the day and temperature. The range of temperatures covered was 16-300C,~~e the range of depth where fish concentrations were encountered was 5-120 m.
~twas found that the three species mentioned above are concentrated, under normal~perature conditions (<230C), at a mean depth of 15 m, slightly more than the anchoveta for~~~ch a value of 10 may be more appropriate (R. ViIchez, IMARPE, pers. comm.). From this
"-.-._..~'..
1.0 ,-" O.SI I , -
I , ....- I \ 0.4 0I \ j
II:ii
\ -- A..
.!I 0.3\ ,--' ",I \
0.5 \ I \ :ii0\. I ..
E 0.2." \
>;;
". ..s: '. -- --- OJ II:
019::>::> 1960 1':1":)
Year
226
information, we have derived an empirical equation relating the depth of main anchovetabiomass (DMBi) to sea surface temperature, i.e.,
DMB1 = 15 + (107/(1 + e32.4-1.19TD) ...7)
which provides estimates ofDMBi pertaining to the period from 6 a.m. to 10 p.m., i.e., duringthe main period of cormorant foraging activity (Jordan 1959).
The vertical overlapping index (Vi) for guano birds to anchoveta schools was calculated asdependent on the birds' maximum foraging depth (MFD) and DMB-values using the sigmoidfunction:
'.
Vi =l/(l+eP + qjMFD ·DMBD ...8)
For all three guano bird species, the same maximum foraging depth of 15m has been used,ignoring the 2 m value reported for pelicans (Table 1) because one important foraging mode of
.'pelican is piracy on the other two species (Duffy 1980) which enables pelicans to "extend" theirlow foraging ~epth by indirectly using the diving capacity of cormorants and boobies.
, Using-18.5for the constant"p"and 14.1for "q"in .equation(8),we obtainedvaluesof Viclose to 1 for a depth of 15 m and a rapid decline to zero for depths near and beyond 30 m.
The latter depth value was chosen because the average total extension (in the vertical plane)of pelagic schools is around 30 m, representing an approximately normal distribution with thedensity maximum in the center.
.Thus,when themainconcentrationpassesthe 15m threshold,a "tail"of around15m stillremains within the birds' diving range, at least until the density maximum exceeds the 30 mdepth.
With respect to temperature-related horizontal displacement (offshore and/or southwardmigration) and fish dispersion, a quantification is difficult because reliable data are not yetavailable.
In agreement with the literature cited above we assume that Hi and Di of equation (6)decrease with increasing temperature. As a first attempt we set Hi x Di =Vi resulting in:
Vulij =ViP ...9)
.- and using the same maximum foraging depth of 15 m for all the three seabird species:
Vuli =Vi2 ...10)
Thus for example, an increase of surface temperature from 18 to 240C causes a change ofthe preferred depth of anchoveta from 15 to 17.3 m which results in a decrease of Vi from 1 to0.9 and, finally in a change of anchoveta vulnerability for guano birds from 1 to 0.8.
The use of mean monthly temperatures (see Table 2 in Pauly and Tsukayama, this vol.) isproblematic because of the lack of information on within-month variability. This becomesimportant for the vulnerability estimates because a small change of 2 or 3 degrees centigradecauses drastic changes in the results.
Therefore, we have chosen to use two temperature values for each month, expressing thetemperature range .withinmonth "i", for the vulnerability estimates.
Using an average within-month temperature deviation of + 15% we thus re-expressed, forexample a mean value of 220C as a range of 18.7-25.30Cand a mean of 210C as a range of17.9-24.20C. Table 4 shows that vulnerability estimates differ considerably depending uponwhether a single mean temperature or a temperature range is used.
All the vulnerability estimates cited have been calculated using the vulnerability means ofthe monthly temperature ranges.
Competition for anchoveta. Competition (Compi) is split into an intraspecific (IcompDand afishery-related component (Fcompi):
Compi =~compi .Fcompi ...11)
- - - -
227
Table 4. Relationships between sea surface temperature, depth of main anchoveta biomass(DMB),vertical overlap index between anchoveta and birds (V) and anchoveta vulnerability to the birds(Vul).a
Vulnerabilityof anchoveta
(Vul)
Midrange of
vulnerab ilityestimates
0.981.00
}0.00 0.50
1~01~0
}0.52 036
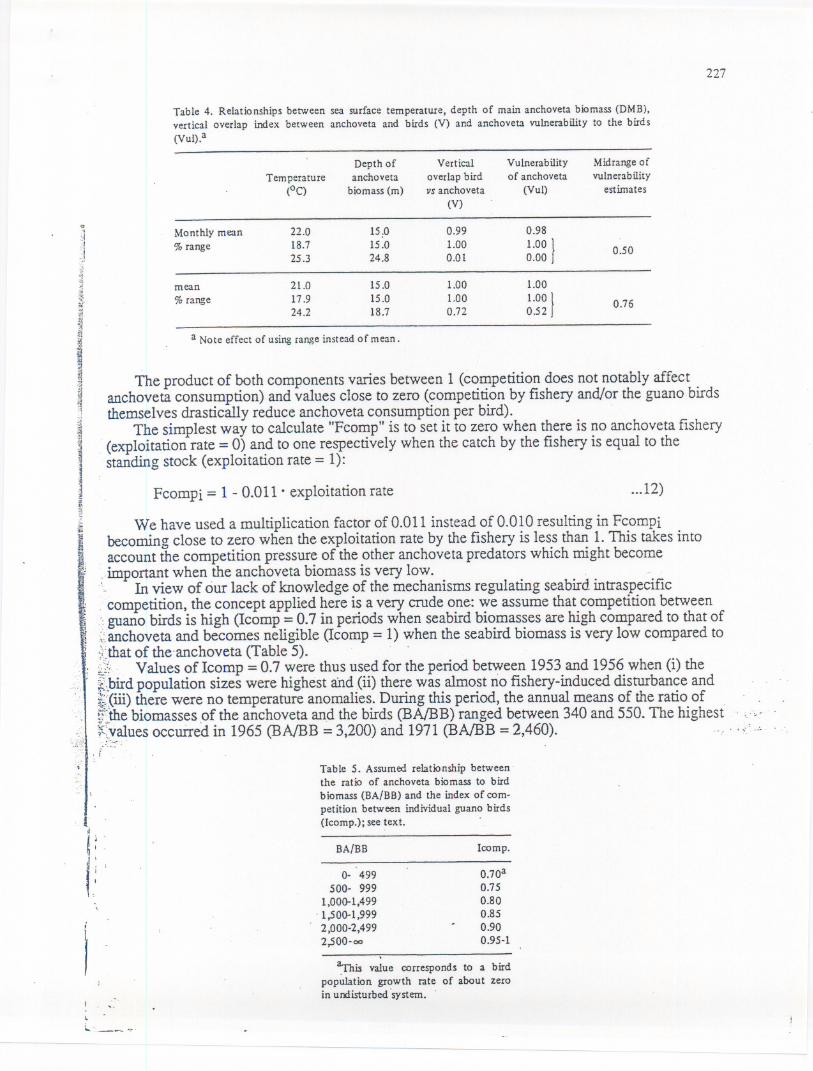
The product of both components varies between 1 (competition does not notably affectanchoveta consumption) and values close to zero (competition by fishery and/or the guano birdsthemselves drastically reduce anchoveta consumption per bird).
The simplest way to calculate "Fcomp" is to set it to zero when there is no anchoveta fishery(exploitation rate =0) and to one respectively when the catch by the fishery is equal to thestanding stock (exploitation rate = 1):
Fcompi = 1 - 0.011 .exploitation rate ...12)
We have used a multiplication factor of 0.011 instead of 0.010 resulting in Fcompibecoming close to zero when the exploitation rate by the fishery is less than 1.This takes intoaccount the competition pressure of the other anchoveta predators which might become
. important when the anchoveta biomass is very low. .
.. In view of our lack of knowledge of the mechanisms regulating seabird intraspecific. competition, the concept applied here is a very crude one: we assume that competition between.":guano birds is high (!comp =0.7 in periods when seabird biomasses are high compared to that of~:.anchovetaand becomes neligible (Icomp =1) when the seabird biomass is very low compared to~bhatof the'anchoveta(Table5). .'oJ . Values of Icomp =0.7 were thus used for the period between 1953 and 1956when (i) thef.bird population sizes were highest ahd (ii) there was almost no fishery-induced disturbance and~'Jiii)there were no temperature anomalies. During this period, the annual means of the ratio off.~thebiomasses .ofthe anchoveta and the birds (BAlBB) ranged between 340 and 550. The highest¥-~valuesoccurred in 1965 (BAIBB = 3,200)and 1971(BAIBB= 2,460)...' .;---.J' ... .
, I
..
Table 5. Assumed relationship betweenthe ratio of anchoveta biomass to birdbiomass (BA/BB) and the index of com-petition between individual guano birds(Icomp.); see text.
BA/BB lcomp.
0- 499500- 999
1,000-1,499. 1,500-1,999
. 2,000-2,4992,500-00
0.70a0.750.800.850.900.95-1
~is value corresponds to a birdpopulation growth rate of about zeroin undisturbed.systern. .
L1.__"------
Depth of Vert ical
TemperatUre anchoveta overlap bird(oC) biomass (m) vs anchoveta
(V)-Monthly mean 22.0 15,0 0.99% range 18.7 15.0 1.00
25.3 24.8 0.01
mean 21.0 15.0 1.00% range 17.9 15.0 1.00
24.2 18.7 0.72
a Note effect of usingrangeinsteadof mean.
..
228
A minimum value of Icomp =0.7 was chosen because this corresponds to approximatelyzero population growth in an undisturbed system. Equation (2) gives the total consumptionnecessary for an approximately zero population growth. For the period 1954, 1955, 1956 thecalculated annual means are: 2.5,2.5 and 2.1 t x 106. For the same period (using: !comp =0.7)anchoveta consumption values of 2.1, 2.0 and 1.7 t x 106 were calculated. According to Jordan(1967) the non-anchoveta food in total seabird diet in 1955ranged from 5 to 20%. Thus, addinga value of 20% to the annual anchoveta consumption we calculate for 1954, 1955, 1956 an .annual total consumption of 2.5, 2.4 and 2.0 t x 106 and this is almost identical to the amountsneededfor zeropopulationgrowth. .
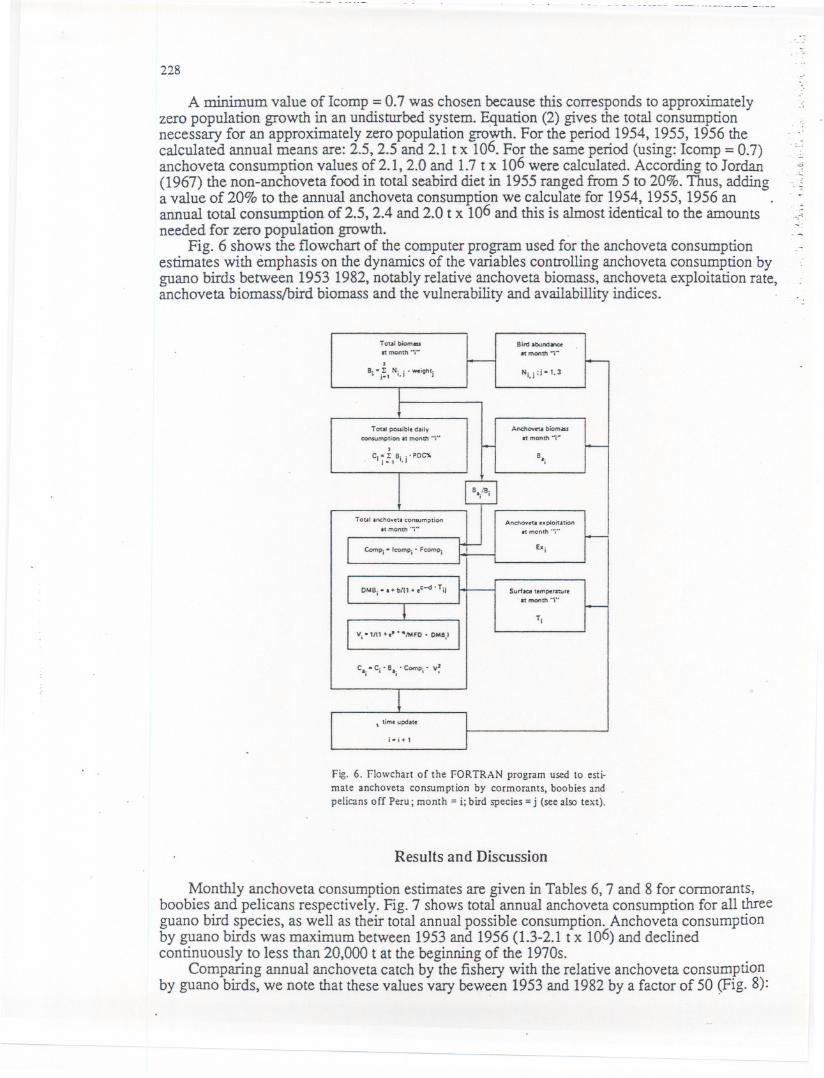
Fig. 6 shows the flowchart of the computer program used for the anchoveta consumptionestimates with emphasis on the dynamics of the variables controlling anchoveta consumption byguano birds betWeen 1953 1982,notably relative anchoveta biomass, anchoveta exploitation rate,anchoveta biomasslbird biomass and the vulnerability and availabillity indices.
..
....
. -
--.:~
--
-
Total bOom..It month ..,-
,Bj"j:, Ni.i ._;gtI~
Ii'" abundlnClat:mon1h-.-
T oul pouibl. dailyconsumption atmon1h -."
.
C1i :,Bi.j .'O~
Anchovtu biomas
It month -.-
TotlllnchovetJ consumption81month'".
AnchOVI1' ..pfoiutionIt month '."
Surlac::e temperftUrtat month 'I"
Fig. 6. Flowchart of the FORTRAN program used to esti-mate anchoveta consumption by cormorants, boobies andpelicans off Peru; month =i; bird species =j (see also text).
Results and Discussion
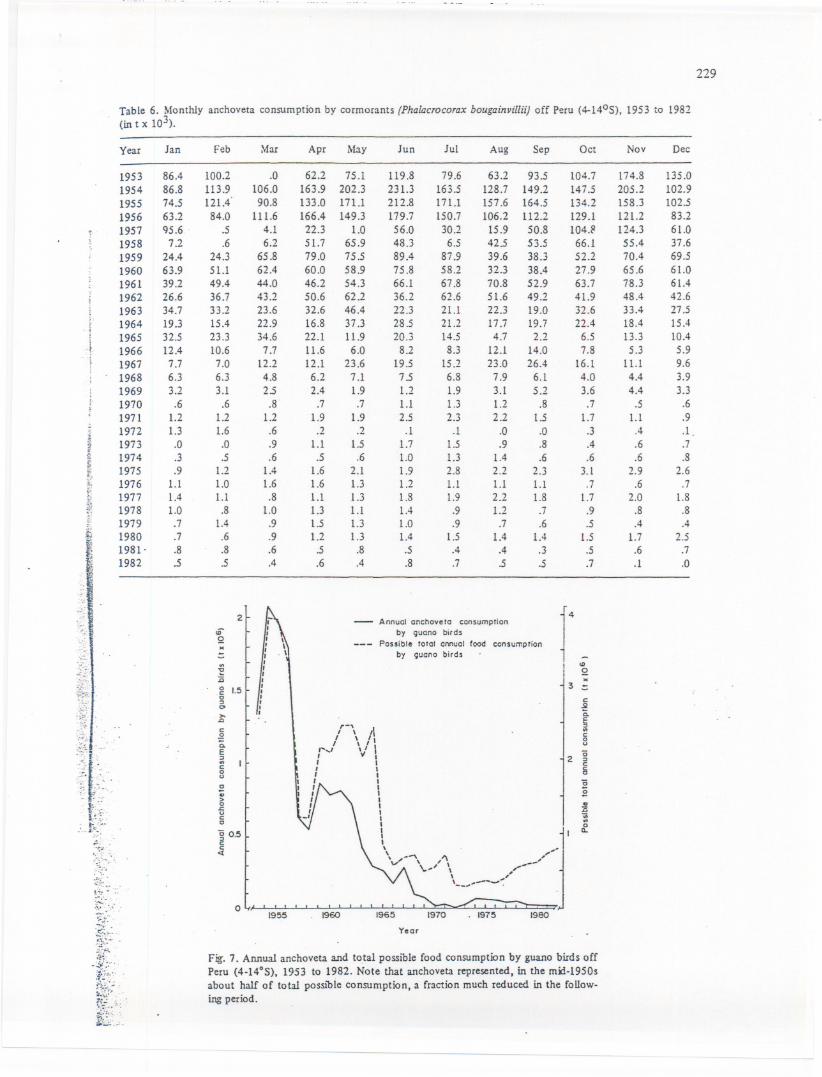
Monthly anchoveta consumption estimates are given in Tables 6, 7 and 8 for cormorants,boobies and pelicans respectively. Fig. 7 shows total annual anchovetaconsumption for all threeguano bird species, as well as their total annual possible consumption.Anchoveta consumptionby guano birds was maximum between 1953 and 1956 (1.3-2.1 t x 106)and declinedcontinuously to less than 20,000 t at the beginning of the 1970s.
Comparing annual anchoveta catch by the fishery with the relative anchoveta consumptionby guano birds, we note that these values vary beween 1953 and 1982by a factor of 50 (Fig. 8):
....
-.:-ff~:..
229
Table 6. Monthly anchoveta consumption by cormorants (Phalacrocorax bougainvilIii) off Peru (4-1405), 1953 to 1982(in t x 103).
Year
19531954195519561957195819591960196119621963196419651966196719681969197019711972197319741975197619771978197919801981.1982
,.t;
o'
Ian
86.486.874.563.295.6
7.224.463.939.226.634.719.332.512.47.76.33.2.6
1.21.3.0.3.9
1.11.41.0.7.7.8.5
100.2113.9121.484.0
.5
.624.351.149.436.733.215.423.310.67.06.33.1.6
1.21.6.0.5
1.21.01.1.8
1.4.6.8.5
Feb
.0106.090.8
111.64.16.2
65.862.444.043.223.622.934.67.7
12.24.82.5.8'
1.2.6.9.6
1.41.6.8
1.0.9.9.6.4
2
.;;Q..
"\
. \
Mar
62.2163.9133.0166.422.351.779.060.046.250.632.616.822.111.612.16.22.4
.71.9.2
1.1.5
1.61.61.11.31.51.2.5.6
Apr May
75.1202.3171.1149.3
1.065.975.558.954.362.246.437.311.96.0
23.67.11.9.7
1.9.2
1.5.6
2.11.31.31.11.31.3.8.4
119.8231.3212.8179.756.048.389.475.866.136.222.328.520.38.2
19.57.51.21.12.5.1
1.71.01.91.21.81.41.01.4.5.8
Iun
79.6163.5171.1150.730.26.5
87.958.267.862.621.121.214.58.3
15.26.81.91.32.3.1
1.51.32.81.11.9.9.9
1.5.4.7
Jul
63.2128.7157.6106.2
15.942.539.632.370.851.622.317.74.7
12.123.07.93.11.22.2
.0
.91.42.21.12.21.2.7
1.4.4.5
Aug
93.5149.2164.5112.250.853.538.338.452.949.219.019.72.2
14.026.46.15.2
.81.5.0.8.6
2.31.11.8.7.6
1.4.3.5
- AMUol anchovela consumplion
by 9uano birds
Possible 10lal aMual food consumprionby 9uono birds
r-', "I ,,'I " I""..1 V II II II II I
hI II II II II I-, I
I
I\ /\.V"..-\ ,'\ __-,'
~ ' \ ,'-\ "\ ~ .
19~~ 1960 196~ 1970
Year
197~
Sep
104.7147.5134.2129.1104.P66.152.227.963.741.932.622.46.57.8
16.14.03.6.7
1.7.3.4.6
3.1.7
1.7.9.5
1.5.5.7
LQ..
3
c.51Q.§..cou'0
2 i!15
1960
Fig. 7. AMual anchoveta and to.tal possible food consumption by guano birds offPeru (4-14°5), 1953 to 1982. Note that anchoveta represented, in the mn-1950sabout half of total possible consumption, a Craction much reduced in the Callow-ing period.
..'E:;;g I.~o:>'"'".0C.!!0.E:>..couo'0>o.cuco'0 o.~~<I:
o
Oct
174.8205.2158.3121.2124.355.470.465.678.348.433.418.413.35.3
11.14.44.4
.51.1.4.6.6
2.9.6
2.0.8.4
1.7.6.1
.:is=oII.
Nov Dec
135.0102.9102.583.261.037.669.561.061.442.627.515.410.45.99.63.93.3
.6
.9
.1.
.7
.82.6
.71.8.8.4
2.5.7.0
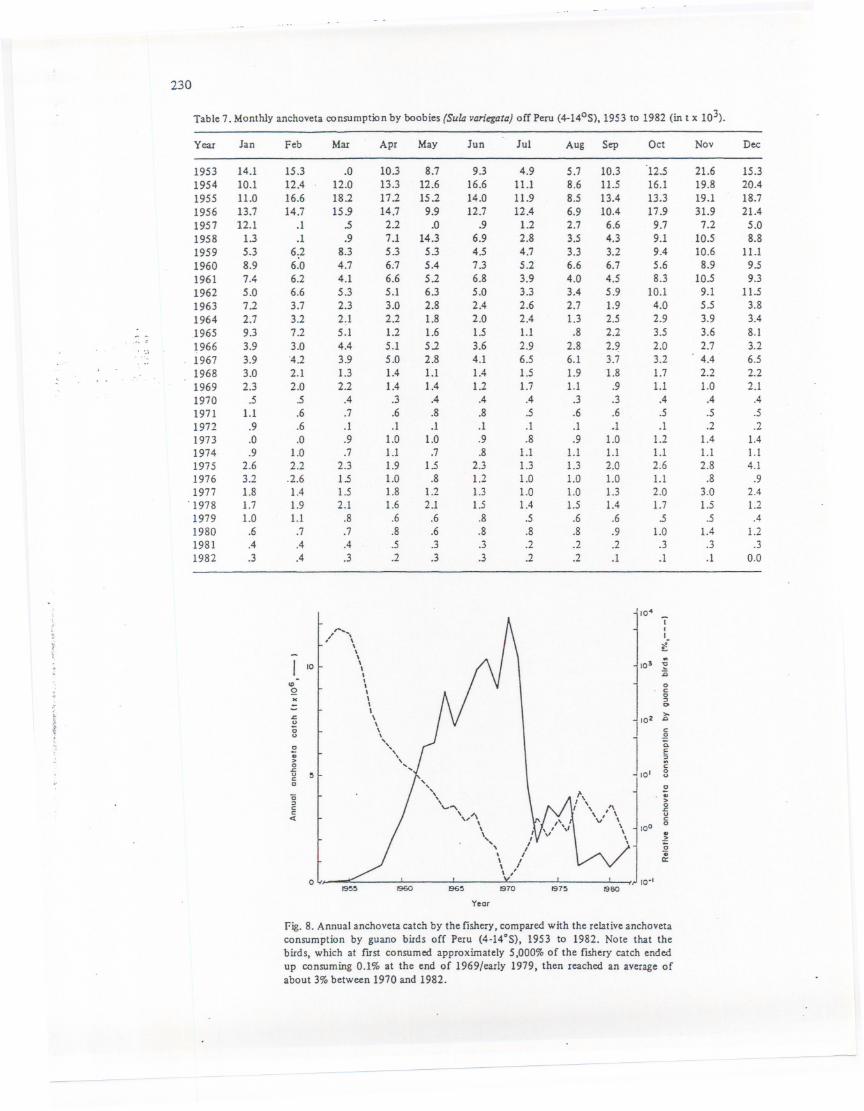
Fig. 8. Annual anchoveta catch by the fishery, compared with the relative anchovetaconsumption by guano birds off Peru (4-14°S), 1953 to 1982. Note that thebirds, which at fust consumed approximately 5,000% of the fishery catch endedup consuming 0.1% at the end of 1969/early 1979, then reached an average ofabout 3% between 1970 and 1982.
230
Table 7. Monthly anchovetaconsumptionby boobies (Sulavariegata)off Peru (4-140S),1953 to 1982 (in t x 103).
Year Jan Feb Mar Apr May Jun Jul Aug Sep Oct Nov Dee
1953 14.1 15.3 .0 10.3 8.7 9.3 4.9 5.7 10.3 12.5 21.6 15.31954 10.1 12.4 12.0 13.3 12.6 16.6 11.1 8.6 11.5 16.1 19.8 20.41955 11.0 16.6 18.2 17.2 15.2 14.0 11.9 8.5 13.4 13.3 19.1 18.71956 13.7 14.7 15.9 14.7 9.9 12.7 12.4 6.9 10.4 17.9 31.9 21.41957 12.1 .1 .5 2.2 .0 !J 1.2 2.7 6.6 9.7 7.2 5.01958 1.3 .1 .9 7.1 14.3 6.9 2.8 3.5 4.3 9.1 10.5 8.81959 5.3 6:2 8.3 5.3 5.3 4.5 4.7 3.3 3.2 9.4 10.6 11.11960 8.9 6.0 4.7 6;7 5.4 7.3 5.2 6.6 6.7 5.6 8.9 9.51961 7.4 6.2 4.1 6.6 5.2 6.8 3.9 4.0 4.5 8.3 10.5 9.31962 5.0 6.6 5.3 5.1 6.3 5.0 3.3 3.4 5.9 10.1 9.1 11.51963 7.2 3.7 2.3 3.0 2.8 2.4 2.6 2.7 1.9 4.0 5.5 3.81964 2.7 3.2 2.1 2.2 1.8 2.0 2.4 1.3 2.5 2.9 3.9 3.41965 9.3 7.2 5.1 1.2 1.6 1.5 1.1 .8 2.2 3.5 3.6 8.1
, ".i 966 3.9 3.0 4.4 5.1 5.2 3.6 2.9 2.8 2. 2.0 2.7 3.2..- 1967 3.9 '4.2 3.9 5.0 2.8 4.1 6.5 6.1 3.7 3.2 4.4 6.5. .,
1968 3.0 2.1 1.3 1.4 1.1 1.4 1.5 1.9 1.8 1.7 2.2 2.21969 2.3 2.0 2.2 1.4 1.4 1.2 1.7 1.1 .9 1.1 1.0 2.11970 .5 .5 .4 .3 .4 .4 .4 .3 .3 .4 .4 .41971 1.1 .6 .7 .6 .8 .8 .5 .6 .6 .5 .5 .51972 .9 .6 .1 .1 .1 .1 .1 .1 .1 .1 .2 .21973 .0 .0 .9 1.0 1.0 .9 .8 .9 1.0 1.2 1.4 1.41974 .9 1.0 .7 1.1 .7 .8 1.1 1.1 1.1 1.1 1.1 1.11975 2.6 2.2 2.3 1.9 1.5 2.3 1.3 1.3 2.0 2.6 2.8 4.11976 3.2 .2.6 1.5 1.0 .8 1.2 1.0 1.0 1.0 1.1 .8 .91977 1.8 1.4 1.5 1.8 1.2 1.3 1.0 1.0 1.3 2.0 3.0 2.4
. 1978 1.7 1.9 2.1 1.6 2.1 1.5 1.4 1.5 1.4 1.7 1.5 1.21979 1.0 1.1 .8 .6 .6 .8 .5 .6 .6 .s .5 .41980 .6 .7 .7 .8 .6 .8 .8 .8 .9 1.0 1.4 1.21981 .4 .4 .4 .5 .3 .3 .2 .2 .2 .3 .3 .31982 .3 .4 .3 .2 .3 .3 .2 .2 .1 .1 .1 0.0
104"j
1'1"0.....,tI
, \ -\\ t;\ ..
10 f-\ 105 :?,, j5
co , 0\0 , c:-g.. \
= , 0,. .: \ 102>-
> &>
{u \0 \
§u ,
10'
..." a.0-;; , E, ;:> ,0 ...... c:.: 0u 5 uc: ...0 ... 0
"0"
", ;" , I , >
0c: ""I '",'\
.c:c:\,,\
u< " \ c:\ 100
0\ I \ .\
...... , \, , 0, ,/'"\/, , 0;
\/
II::\\ , ,
0.... I I V I I,,.I 10"
1960 1965 1970 1975 1960
Yeor
231
Table 8. Monthly anchoveta consumption by pelicans (Pelcanus thagus) off Peru (4-140S), 1953 to 1982 (b;: J: 103).
Year Jan Feb Mar Apr May Jun Jul Aug Sep Ocr X'I Dec
1953 4,.1 8.1 .0 1.9 1.9 1.5 1.1 .7 .8 5.1 ::.+ 9.01954 5.7 9.1 8.3 6.1 5.7 4.6 3.0 2.5 2.0 3.3 .: 7.11955 4.7 8.2 15.8 9.0 2.2 1.0 1.0 1.0 3.5 4.3 ., 8.0--1956 7.1 14.3 8.2 3.5 6.7 4.4 1.2 .8 .6 1.5 :..J 5.01957 3.6 .0 .1 .1 .0 .9 .4 .2 1.4 1.9 :...3 2.61958 .5 .0 .2 3.2 3.3 3.0 2.0 1.3 3.2 2.5 2.41959 2.2 4.4 3.2 7.6 6.4 3.4 1.1 2.1 1.8 3A . . 6.81960 4.4 2.8 1.0 3.0 3.1 3.3 4.1 2.9 2.6 1.8 ;'3 2.21961 1.9 1.9 1.4 1.7 3.3 3.1 .7 .6 1.5 3.3 :.1 3.11962 2.1 2.1 1.7 1.1 1.4 .6 .5 .6 1.3 ' . =_..:. 2.8_..J1963 1.8 2.1 2.0 3.2 1.8 .8 .6 .5 .3 .. ..3 .81964 .5 .8 1.0 .3 .6 .1 .3 .2 .3 .. .'. 1.91965 5.0 2.6 3.4 3.5 3.6 1.5 .7 .5 .4 .S .- 1.51966 2.1 .7 1.1 1.1 1.6 1.1 .9 .8 1.5 2.0 . - 1.9.,; .-1967 3.6 3.2 3.8 3.5 5.3 1.2 1.3 2.7 6.4 2.0 . -
104..-1968 2.0 104 1.6 .8 .9 .5 .6 .9 1.0 .. j .91969 . .6 .5 .6 .4 .2 .3 .2 .4 .3 " - .51970 .1 .1 .1 .2 .1 .1 .1 .1 .1 , '. .11971 .1 .1 .1 .2 .2 .3 .7 .2 .1 , . .1.,;.1972 .2 .2 .1 .1 .1 .1 .1 .1 .1 .1 .1 .11973 .0 .0 A 1.0 .3 .3 .5 .3 .3 . .,. .51974 A A .5 .2 .3 .1 .1 .1 A - .2.. -1975 .3 .7 .4 A .3 .1 .2 .1 .3 .2 '.4-1976 .2 .4 A .6 .2 .2 .1 .1 .1 .1 , .1.1977 .2 .3 .2 .2 .2 .1 .1 .3 .2 .3 - .81978 .5 .4 .9 .7 .5 A .2 .2 .3 .3 .31979 .3 A .2 .2 .2 .2 .1 .2 .2 , - .1-1980 .1 .1 .2 .2 .3 .2 .1 .1 .2 . .4.- -1981 .1 .1 .0 .1 .1 .1 .0 .0 .0 .1 .1 .11982 .1 .0 .0 .0 .1 .1 .0 .0 .0 .1 .) .0
i'"t..
i
90
80
I ;§70
I...'E:;:;0c 60
,.0
'. :>0
i! >-If S> o£- c..' .2
J.:"0.E 40
r,.;:
c t0 '-/'" . - tUt:"' t'I.', 0 30
t: . ;;
Boobies---r'\ l,.'>0
l:''" t '"uc 1\ '0 20 , , .....'
f'"t. ;; ,,... ,10 '" ,, " '-.,-.......-..._-
,.',
2............. ,1
-
i.'.;' . o 1.:/ I I , , I:'1 ,'.: I 1960 196!5 1970 19n1 1960
, Year
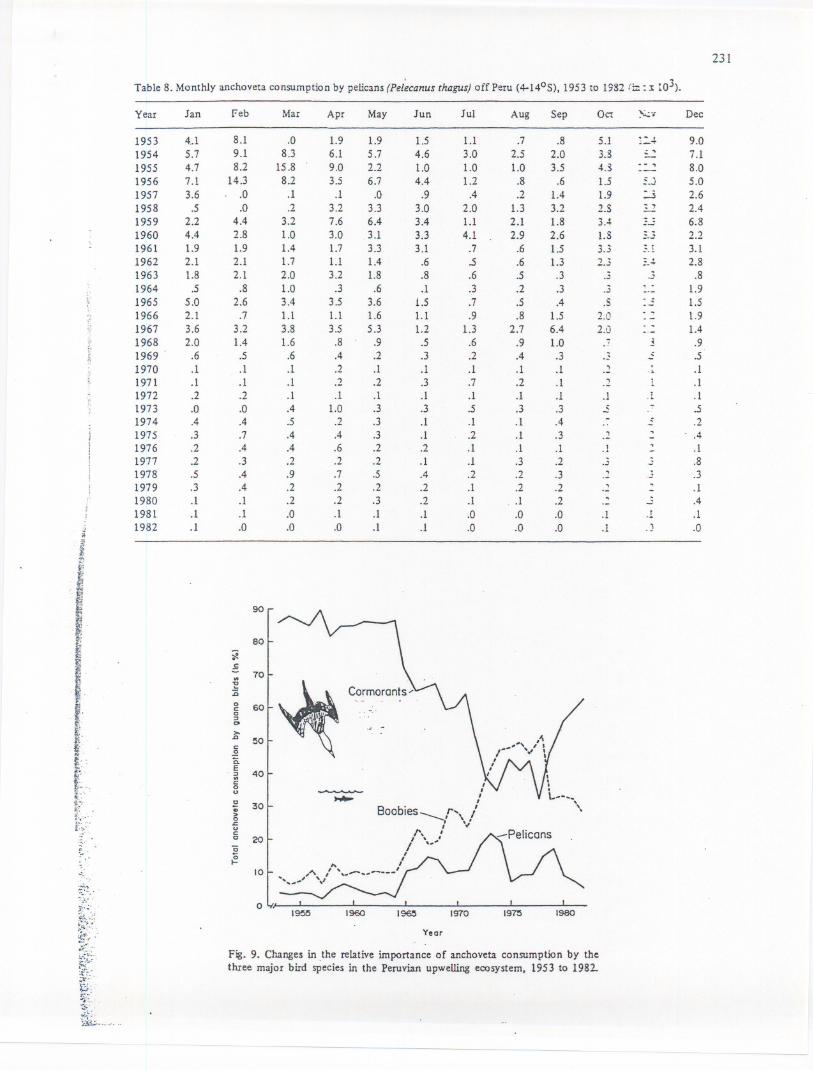
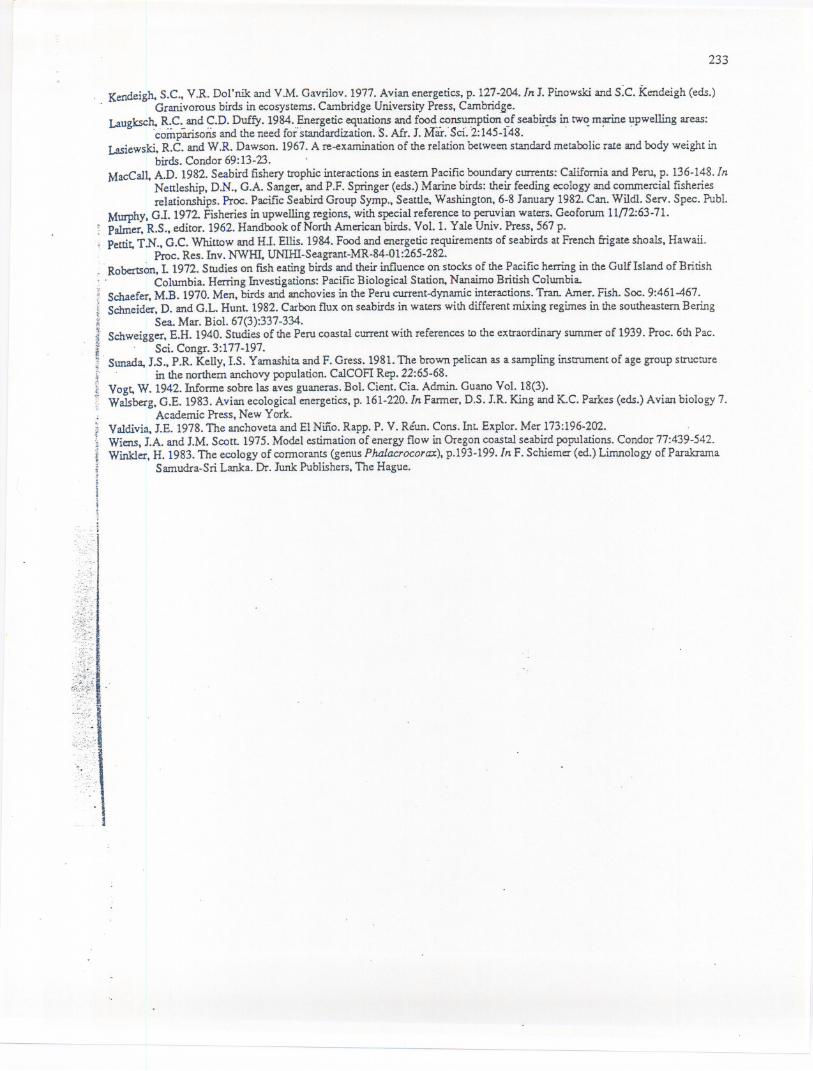
;f.....Fig. 9. Changes in ,the relative importance of anchoveta consumption by the;5;,:;-
. three major bird species in the Peruvian upwelling ecosystem, 1953 to 1982-;):.
:-=-
,...--.,
--------
- - - --. --- ------..--.-----
232
before 1960 the annual guano consumption declined from 5,000% to 45% of the annualanchoveta catch. Between 1960 and 1970 the percentage dropped to 0.1% then reached anaverageof around3% between1970and 1982(Fig.8). .
The dynamics of seabird biomass between 1953 and 1964correspond widely to theanchoveta availability curve (Fig. 5) and suggests a direct dependency.
The sudden population breakdown in 1957-1958and the following recovery is accompaniedby similar changes in anchoveta availability caused by extremely low anchoveta vulnerabilityduring the 1956-1957 EI Nino (Fig. 5), while between 1965 and 1967 and from 1977 to 1982 thetrends of bird biomass and anchoveta availability were opposite.
Comparing species specific seabird consumption to total anchoveta consumption between1953 and 1983 the following dynamics are established (Fig. 8): between 1953 and 1972 the.dominant species are cormorants (Phalacrocoraxbougainvilli), with between 50 and 90% of thetotal anchoveta consumption, while boobies (Sula variegata) consumed 10 to 40% and pelicans(Pelecanus ocddentalis) 5 to 20%. .
Be~een. 1972 and 1979 a shift in dominance occurred from cormorants to boobies: during~i~ p~rip.4ar~und half of the total ~choveta c~:msumption~as .takenby boobies, around 40% bycormorants and around 10% by pehcans. As nnght be seen In FIg. 9, from 1979 on, the
. -domInancepattern prevailing before 1972was re-established, with cormorants taking 65%,boobies 30% and pelicans 5% of all anchoveta eaten by guano birds.
References
Apostolski. K. and S. MatVejev. 1955. Fischfang in Umza\D1ungenmit Hilfe Vogeln am Dojran-See. Inst. PiscoR.P.Macedoine.l(3):29-89.
Aschoff, I. and H. Pobl. 1970. Der Ruheumsatz von Vogeln als Funktion der Tageszeit und der Korpergrosse. I. Om. Lpz.111(1):38-47.
Ashmole, N.P.1971. Seabird ecology and the marine environment. Avian BioI. 1:223-287.Avila, E. 1954. Potencia deyectiva del guanay (Pha/m:rocoraxbougainvilIii). Bol. Cient. Cia. Admin. Guano 1 (2):21-49.Boerema, L.K., G. Saetersdal, I. Tsukayama, J.E. Valdivia and B. Alegre. 1965. Report on the effects of fishing on the Peruvian
stock of anchovy. FAO Fish. Tech. Pap. 55. Rome. 44 p.Clark, F.N. 1954. Biologia de la anchoveta. Bol. Cient. Cia. Admin. Guano 1:98-132.Din. N.A. 1979. Ecology of pelicans in the Rwenzorie National Park, Uganda. University of Arizona, Tucson. Ph.D. thesis.Doucet, W.F. and H. Einarsson: 1967. A brief description of Peruvian fISheries.CalCOFl Rep. 11:82-87.Duffy, C.D. 1980. Patterns of piracy by Peruvian seabirds: a depth hypothesis. Brit. Ornitol. Union 122(4):521-525.Fiedler, R.H., N.D. Jarvis and MJ. Lobell. 1943. La pesca y las industrias pesqueras en el Peru. Lima.Fuentes, H. 1985. Las aves marinas en la zona sur del Peru, en Marzo de 1984,p. 75-77./n A.E.T. Aguilar (ed.) Anales 1
Congreso NacionaI de Biologia Pesquera. Colegio de Biologos Regional del Norte. Trujillo, Peru.Furness, R.W. 1982. Competition beween fisheries and seabird communities. Adv. Mar. BioI. 20:225-307.Furness, R.W. and J. Cooper. 1982. Interactions between breeding seabirds and pelagic flShpopulations in the southern Benguela
Region. Mar. Ecol. Progr. Ser. 8(3):243-250.Guillen. 0., R. Calienes, R.L. de Rondan. 1969. Contribu\..ional estudio del ambiente de la anchoveta (Engraulis ringens). Bol.
Inst. Mar. Pero-Callao 2:49-76. .Guillet, A. and R.W. Furness. 1985. Energy requirements of a great white pelican (PelecarutSonocrotalus) population and its
impact on fIShstocks. J. Zool. 205(4):573-583.Harrison. C.S. and T.S. Hida. 1980. The status of seabird research in the northwestern HawaiianIslands, p. 17-31./n R.W. Grigg
and R.T. Pfund (eds.) Proceedings of the Symposium on Status of Resource Investigation in the NorthwesternHawaiian Islands. University of Hawaii/Sea Grant Program. 333 p.
Hutchinson. G.E. 1950. Survey of existing knowledge on biogeochemistry. 3: The biogeochemistryof vertebrate excretion. Bull.Amer. Mus. Nat. Hist. 96. 554 p. .
Johannesson, K. and R. Vilchez. 1980:Note on hydroacoustic observations of changes in distribution and abundance of somecommon pelagic fIShspecies in the coastal waters of Peru, with special emphasison anchoveta.loe Workshop ReportNo. 28:287-323.
Jordan, R. 1959. El fenomeno de las regurgitaciones en el guanay (Phalacrocorax bougainvillii)y un metodo para estimar laingestion diaria. Bol. Cient Cia. Admin. Guano 25(4):23-40.
Jordan, R. 1967. The predation of guano birds on the Peruvian anchoveta (Engraulis ringens Jenyns). CalCOFl Rep. 11:105-109.Jordan R. and H. Fuentes. 1966. Las poblaciones de aves guaneras y su situacion actual. Worme Inst. Mar Pero-Callao 10:1-31.Junor, F.R.I. 1965. Fish research: Lake Kyle. Department of National Park and Wildlife Management, Zimbabwe,
Mimeographed Report. 25 p.
233
Kendeigh. S.C., V.R. Dol'niJcand VM. Gavrilov. 1977. Avian energetics, p. 127-204.In 1.Pinowski and S:C. Kendeigh (eds.). Granivorous birds in ecosystems. Cambridge University Press, CambridEe.
Laugksc~~:C:. and ~.D. Duffy. 1984.}~nery:eticequations and foo~ ~ns1lJ!lption ~f seab~ps ~tw~ m~e ':1pwellingareas:comparisons and the need for standardization. S. Afr. J. Mar. Sci. 2:145-148.
Lasiewski, R.C. and W.R. Dawson. 1967. A re-examination of the relation between standard metabolic rate and body weight inbirds. Condor 69:13-23.
MacCall, A.D. 1982. Seabird fishery trophic interactions in eastern Pacific boundary currents: California and Peru, p. 136-148.InNettleship, D.N., G.A. Sanger, and P.P.Springer (eds.) Marine birds: their feeding ecology and commercial fisheriesrelationships. Proc. Pacific Seabird Group Symp., Seattle, Washington, 6-8 January 1982. Can. Wildl. ServoSpec. Publ.
Murphy, Gl. 1972. Fisheries in upwelling regions, with special reference to peruvian waters. Geoforum 11172:63-71.palmer, R.S., editor. 1962. Handbook of North American birds. Vol. 1. Yale Univ. Press, 567 p.Pettit,T.N., G.C. Whittow and Hl. Ellis. 1984. Food and energetic requirements of seabirds at French frigate shoals, Hawaii.
Proc. Res. Inv. NWHI. UNIHI-Seagrant-MR-84-01:265-282... RobertsOn. L 1972. Studies on fish eating birds and their influence on stocks of the Pacific helTing in the Gulf Island of British
Colwnbia. Herring Investigations: Pacific Biological Station, Nanairno British Columbia.. Schaefer, M.B. 1970. Men, birds and anchovies in the Peru current-dynamic interactions. Tran. Amer. Fish. Soc. 9:461-467.~ Schneider,D. and G.L. Hunt. 1982. Carbon flux on seabirds in waters with different mixing regimes in the southeastern Bering~ Sea. Mar. BioI. 67(3):337-334.
i Schweigger, .E.H. 1940. Studies of the Peru coastal current with references to the extraordinary summer of 1939. Proc. 6th Pac.t.. SCI.Congr. 3:177-197.: Sunada, 1.S.. P.R. Kelly, 1.S. Yamashita and F. Gress. 1981.The brown pelican as a sampling instrument of age group structuret. in the northern anchovy population. CalCOFI Rep. 22:65-68.~ Vogt,W. 1942.Informesobrelas avesguaneras.Bol.Cient.Cia.Admin.GuanoVol.18(3)." Walsberg, G.E. 1983. Avian ecological energetics, p. 161-220. In Farmer, D.S. 1.R. King and K.C. Parkes (eds.) Avian biology 7.
Academic Press, New York.Valdivia. I.E. 1978. The anchoveta and EINifio. Rapp. P. V. Reun. Cons. Int. Explor. Mer 173:196-202. .Wiens, 1.A. and 1.M. Scott. 1975. Model estimation of energy flow in Oregon coastal seabird populations. Condor 77:439-542.Winkler, H. 1983. The ecology of cormorants (genus PhaIacrocorax), p.l93-199. In F. Schiemer (00.) Limnology of Parakrama
Samudra-Sri Lanka. Dr. Junk Publishers, The Hague.
-