Embed Size (px)
Citation preview
Malaysian Journal of Analytical Sciences, Vol 20 No 5 (2016): 1159 - 1170
DOI: http://dx.doi.org/10.17576/mjas-2016-2005-23
1159
MALAYSIAN JOURNAL OF ANALYTICAL SCIENCES
Published by The Malaysian Analytical Sciences Society
MONTHLY ANALYSIS OF PM10 IN AMBIENT AIR OF KLANG VALLEY,
MALAYSIA
(Analisis PM10 Bulanan di dalam Udara di Lembah Klang, Malaysia)
Mohd Asrul Jamalani1, Ahmad Makmom Abdullah
1,2*, Azman Azid
3,4, Mohammad Firuz Ramli
2,
Mohd Rafee Baharudin5, Mahmud Mohammed Bose
1, Rashieda Elawad Elhadi
1,
Khaleed Ali Ahmed Ben Youssef1, Azadeh Gnadimzadeh
1, Danladi Yusuf Gumel
1
1Air Quality and Ecophysiology Laboratory, Faculty of Environmental Studies
2Department of Environmental Sciences, Faculty of Environmental Studies
Universiti Putra Malaysia, 43400 UPM Serdang, Selangor, Malaysia 3UniSZA Science and Medicine Foundation Centre,
Universiti Sultan Zainal Abidin, Gong Badak Campus, 21300 Kuala Nerus, Terengganu, Malaysia 4Faculty Bioresources and Food Industry,
Universiti Sultan Zainal Abidin, Tembila Campus, 22200 Besut, Terengganu, Malaysia 5Department of Community Health, Faculty of Medicine and Health Sciences,
Universiti Putra Malaysia, 43400 UPM Serdang, Selangor, Malaysia
*Corresponding author: [email protected]
Received: 14 April 2015; Accepted: 3 August 2016
Abstract
The urbanization in Klang Valley, Peninsular Malaysia over the last decades has induce the atmospheric pollution’s
risk resulted to negative impact on the environment. The aims of this paper are to identify the spatial-temporal
relationship of particulate matter (PM10), to determine the characteristic of each location and to classify hierarchical
of the location in relation to their impact on PM10 concentration in Klang Valley. The Spearman correlation test
indicate that there was strong significant relationship between all the locations (> 0.7; p < 0.001) and moderate
relationship between Petaling Jaya-Kajang and Kajang-Shah Alam (< 0.7; p < 0.001). The principal component
analysis (PCA) identifies all four locations have been affected by PM10 which were determined as one of the
pollutant that deteriorated the air quality. Cluster analysis (CA) has classified the PM10 pattern into three (3)
different classes; Class 1 (Klang), Class 2 (Petaling Jaya and Kajang) and Class 3 (Shah Alam) based on location.
Further analysis of CA would be able to classify the PM10 classes into groups depending on their dissimilarities
characteristic. Thus, possible period of extreme air quality degradation could be identified. Therefore, statistical and
envirometric techniques have proved the impact of the various location on increasing concentration of PM10.
Keywords: particulate matter, Spearman correlation test, principal component analysis, cluster analysis
Abstrak
Proses pembandaran di Lembah Klang, Semenanjung Malaysia sedekad lalu telah mendorong kepada risiko
pencemaran atmosfera yang memberi impak negatif kepada alam sekitar. Kajian ini dilakukan bertujuan untuk
mengenalpasti hubungkait antara ruang dan tempoh bagi partikel terampai (PM10), menentukan ciri – ciri setiap
lokasi dan menentukan pengkelasan hirarki lokasi berhubungan dengan impak kepekatan PM10 di Lembah Klang.
Ujian korelasi Spearman menunjukkan hubungkait yang kuat antara semua lokasi (> 0.7; p < 0.001) dan hubungan
ISSN
1394 - 2506
Mohd Asrul et al: MONTHLY ANALYSIS OF PM10 IN AMBIENT AIR OF KLANG VALLEY, MALAYSIA
1160
yang sederhana antara Petaling Jaya-Kajang dan Kajang-Shah Alam (< 0.7; p < 0.001). Analisis komponen utama
(PCA) menentukan semua empat lokasi yang telah terjejas dengan PM10 iaitu antara bahan pencemar yang
menjejaskan kualiti udara. Analisis kluster (CA) mengelaskan pola PM10 kepada tiga (3) kelas berlainan; Kelas 1
(Klang), Kelas 2 (Petaling Jaya dan Kajang) serta Kelas 3 (Shah Alam) berdasarkan lokasi. Analisis lanjutan CA
membolehkan pengkelasan kelas PM10 kepada kumpulan bergantung kepada ketidaksamaan ciri. Justeru,
kemungkinan tempoh kemerosotan kualiti udara yang melampau dapat dikenalpasti. Oleh itu, teknik statistik dan
envirometrik telah membuktikan impak pelbagai lokasi terhadap peningkatan kepekatan PM10.
Kata kunci: partikel terampai, ujian korelasi Spearman, analisis komponen utama, analisis kluster
Introduction
Particulate matter is one of the aerosol particles in the atmosphere [1, 2] which has an aerodynamic diameter of less
than 10 µm and well known as PM10. PM10 has been discovered as major air pollutant in Southeast Asia including
Klang Valley, Malaysia [3, 4, 5]. A long term study over 5 decades regarding to air pollution brings up an
implication not only to human health but also to the environment [6, 7]. Particulate matter specifically PM10 affects
human health via inhalation due to its smaller in size and the ability to reach and settle in human respiratory tract
which could induce chronic pulmonary disease and asthma [8, 9].
Asia region encounter a major problem due to air particulate matter pollution with the annual average value of total
suspended particulate (TSP) which exceeding 300 μgm-3
[10]. In Malaysia without the haze issue, the level of PM10
is mostly influence by the vehicular and industrial emission [4]. Therefore, this study will define the PM10 level in
Klang Valley region under normal condition without severe haze issue as the main focus.
Multivariate analysis has been chosen as the final statistical method to analyze, classify and interpret huge number
of datasets and has become the most applicable in various field of study recently [11 - 19]. These types of analysis
include the application of Principal Component Analysis (PCA) and Hierarchical Agglomerative Cluster Analysis
(HACA). The PCA was applying to identify the most significant parameter which relates to spatial and temporal
variation [11 - 17, 20, 21, 22]. Meanwhile, HACA was applying to group large data into cluster with differing
characteristic between the groups but similar characteristic within the group [23]. Therefore, the aim of this study is
to identify the spatial-temporal relationship of PM10, to determine the characteristic of each station and to classify hierarchical of the station that give an impact to PM10 concentration in Klang Valley.
Materials and Methods
Background of sampling location
Klang Valley region involves several districts in Selangor and is located in central part of west coast Peninsular
Malaysia by the Strait of Malacca to west [24, 25]. Alam Sekitar Malaysia Sdn. Bhd. (ASMA) was appointed by
Malaysian Department of Environment (DOE) in establishing, operating and maintaining the continuous air quality
monitoring stations. All the stations (S1, S3 and S4) were located within residential area except for Petaling Jaya
(S2) which located within industrial area. All the stations within Klang Valley region were affected by heavy traffic
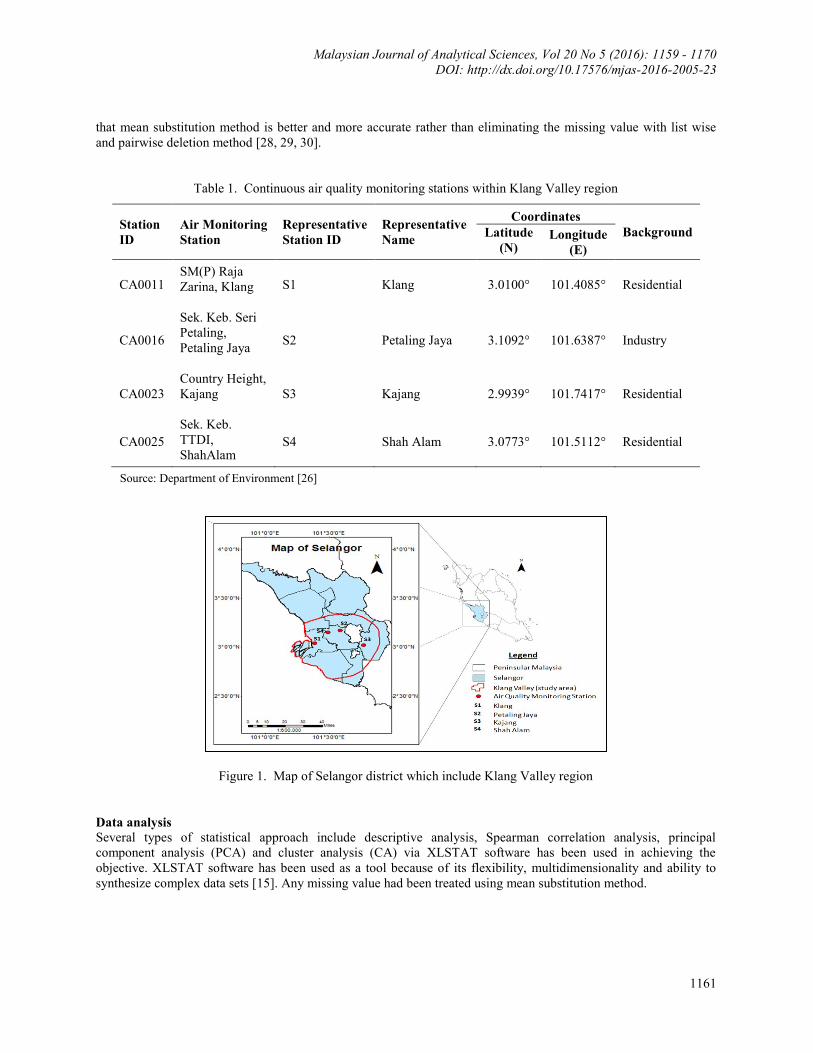
which consequently affected by vehicles emissions and the details were shown in the Table 1. The Klang Valley
Region which is situated in the central part of Selangor state is illustrated in Figure 1.
The air quality data
The daily-recorded air quality data of PM10 at the selected stations within the year of 2000 – 2009 were obtained
from Malaysian Department of Environment (DOE). A total of 480 observation data of PM10 (12 observations x 4
stations x 10 years) were involved in this study.
Data cleaning
Data treatment technique has been used to treat the missing data in order to obtain a better continuous air quality
monitoring data. The missing data in this study has been treated with the method of mean substitution. All the
missing data are replacing with the value of mean available neighboring data [27]. Furthermore, other studies stated
Malaysian Journal of Analytical Sciences, Vol 20 No 5 (2016): 1159 - 1170
DOI: http://dx.doi.org/10.17576/mjas-2016-2005-23
1161
that mean substitution method is better and more accurate rather than eliminating the missing value with list wise
and pairwise deletion method [28, 29, 30].
Table 1. Continuous air quality monitoring stations within Klang Valley region
Station
ID
Air Monitoring
Station
Representative
Station ID
Representative
Name
Coordinates
Background Latitude
(N) Longitude
(E)
CA0011 SM(P) Raja
Zarina, Klang
S1 Klang 3.0100° 101.4085° Residential
CA0016
Sek. Keb. Seri
Petaling,
Petaling Jaya
S2 Petaling Jaya 3.1092° 101.6387° Industry
CA0023
Country Height,
Kajang
S3 Kajang 2.9939° 101.7417° Residential
CA0025
Sek. Keb.
TTDI,
ShahAlam S4 Shah Alam 3.0773° 101.5112° Residential
Source: Department of Environment [26]
Figure 1. Map of Selangor district which include Klang Valley region
Data analysis
Several types of statistical approach include descriptive analysis, Spearman correlation analysis, principal
component analysis (PCA) and cluster analysis (CA) via XLSTAT software has been used in achieving the
objective. XLSTAT software has been used as a tool because of its flexibility, multidimensionality and ability to
synthesize complex data sets [15]. Any missing value had been treated using mean substitution method.
Mohd Asrul et al: MONTHLY ANALYSIS OF PM10 IN AMBIENT AIR OF KLANG VALLEY, MALAYSIA
1162
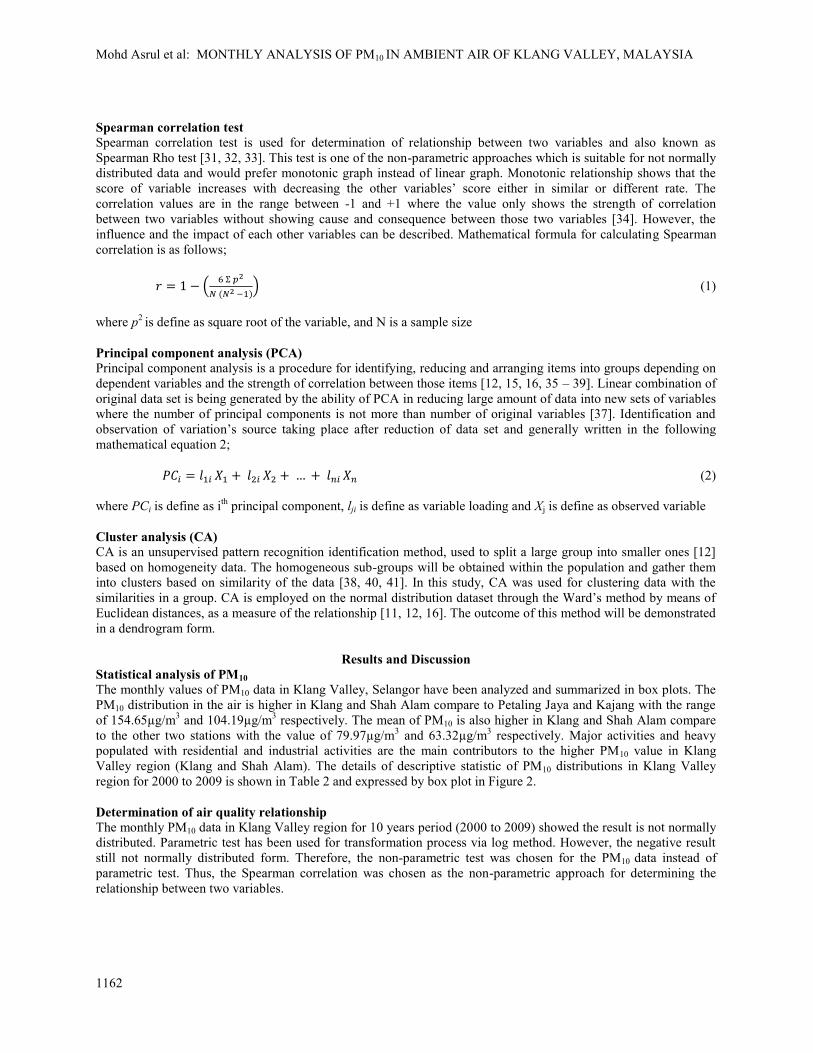
Spearman correlation test
Spearman correlation test is used for determination of relationship between two variables and also known as
Spearman Rho test [31, 32, 33]. This test is one of the non-parametric approaches which is suitable for not normally
distributed data and would prefer monotonic graph instead of linear graph. Monotonic relationship shows that the
score of variable increases with decreasing the other variables’ score either in similar or different rate. The
correlation values are in the range between -1 and +1 where the value only shows the strength of correlation
between two variables without showing cause and consequence between those two variables [34]. However, the
influence and the impact of each other variables can be described. Mathematical formula for calculating Spearman
correlation is as follows;
𝑟 = 1 − (6 Ʃ 𝑝2
𝑁 (𝑁2 −1)) (1)
where p2 is define as square root of the variable, and N is a sample size
Principal component analysis (PCA)
Principal component analysis is a procedure for identifying, reducing and arranging items into groups depending on
dependent variables and the strength of correlation between those items [12, 15, 16, 35 – 39]. Linear combination of
original data set is being generated by the ability of PCA in reducing large amount of data into new sets of variables
where the number of principal components is not more than number of original variables [37]. Identification and
observation of variation’s source taking place after reduction of data set and generally written in the following
mathematical equation 2;
𝑃𝐶𝑖 = 𝑙1𝑖 𝑋1 + 𝑙2𝑖 𝑋2 + … + 𝑙𝑛𝑖 𝑋𝑛 (2)
where PCi is define as ith
principal component, lji is define as variable loading and Xj is define as observed variable
Cluster analysis (CA)
CA is an unsupervised pattern recognition identification method, used to split a large group into smaller ones [12]
based on homogeneity data. The homogeneous sub-groups will be obtained within the population and gather them
into clusters based on similarity of the data [38, 40, 41]. In this study, CA was used for clustering data with the
similarities in a group. CA is employed on the normal distribution dataset through the Ward’s method by means of
Euclidean distances, as a measure of the relationship [11, 12, 16]. The outcome of this method will be demonstrated
in a dendrogram form.
Results and Discussion
Statistical analysis of PM10
The monthly values of PM10 data in Klang Valley, Selangor have been analyzed and summarized in box plots. The
PM10 distribution in the air is higher in Klang and Shah Alam compare to Petaling Jaya and Kajang with the range
of 154.65µg/m3 and 104.19µg/m
3 respectively. The mean of PM10 is also higher in Klang and Shah Alam compare
to the other two stations with the value of 79.97µg/m3 and 63.32µg/m
3 respectively. Major activities and heavy
populated with residential and industrial activities are the main contributors to the higher PM10 value in Klang
Valley region (Klang and Shah Alam). The details of descriptive statistic of PM10 distributions in Klang Valley
region for 2000 to 2009 is shown in Table 2 and expressed by box plot in Figure 2.
Determination of air quality relationship
The monthly PM10 data in Klang Valley region for 10 years period (2000 to 2009) showed the result is not normally
distributed. Parametric test has been used for transformation process via log method. However, the negative result
still not normally distributed form. Therefore, the non-parametric test was chosen for the PM10 data instead of
parametric test. Thus, the Spearman correlation was chosen as the non-parametric approach for determining the
relationship between two variables.
Malaysian Journal of Analytical Sciences, Vol 20 No 5 (2016): 1159 - 1170
DOI: http://dx.doi.org/10.17576/mjas-2016-2005-23
1163
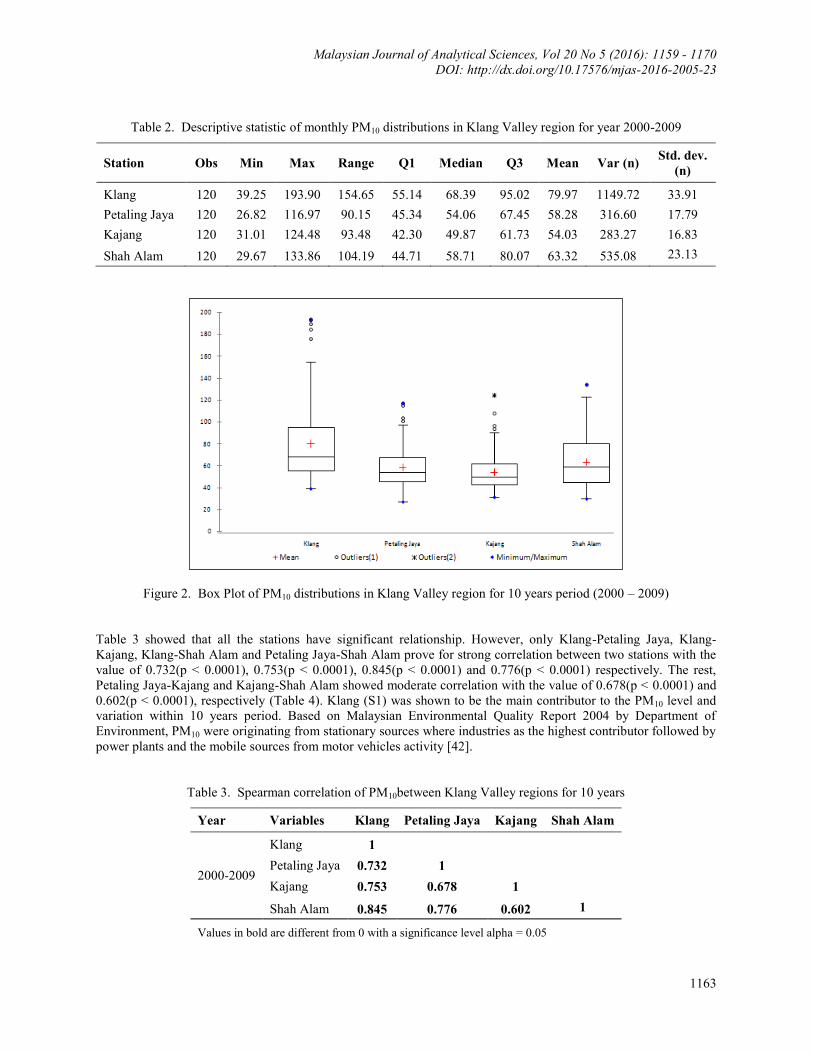
Table 2. Descriptive statistic of monthly PM10 distributions in Klang Valley region for year 2000-2009
Station Obs Min Max Range Q1 Median Q3 Mean Var (n) Std. dev.
(n)
Klang 120 39.25 193.90 154.65 55.14 68.39 95.02 79.97 1149.72 33.91
Petaling Jaya 120 26.82 116.97 90.15 45.34 54.06 67.45 58.28 316.60 17.79
Kajang 120 31.01 124.48 93.48 42.30 49.87 61.73 54.03 283.27 16.83
Shah Alam 120 29.67 133.86 104.19 44.71 58.71 80.07 63.32 535.08 23.13
Figure 2. Box Plot of PM10 distributions in Klang Valley region for 10 years period (2000 – 2009)
Table 3 showed that all the stations have significant relationship. However, only Klang-Petaling Jaya, Klang-
Kajang, Klang-Shah Alam and Petaling Jaya-Shah Alam prove for strong correlation between two stations with the
value of 0.732(p < 0.0001), 0.753(p < 0.0001), 0.845(p < 0.0001) and 0.776(p < 0.0001) respectively. The rest,
Petaling Jaya-Kajang and Kajang-Shah Alam showed moderate correlation with the value of 0.678(p < 0.0001) and
0.602(p < 0.0001), respectively (Table 4). Klang (S1) was shown to be the main contributor to the PM10 level and
variation within 10 years period. Based on Malaysian Environmental Quality Report 2004 by Department of
Environment, PM10 were originating from stationary sources where industries as the highest contributor followed by
power plants and the mobile sources from motor vehicles activity [42].
Table 3. Spearman correlation of PM10between Klang Valley regions for 10 years
Year Variables Klang Petaling Jaya Kajang Shah Alam
2000-2009
Klang 1
Petaling Jaya 0.732 1
Kajang 0.753 0.678 1
Shah Alam 0.845 0.776 0.602 1
Values in bold are different from 0 with a significance level alpha = 0.05
Mohd Asrul et al: MONTHLY ANALYSIS OF PM10 IN AMBIENT AIR OF KLANG VALLEY, MALAYSIA
1164
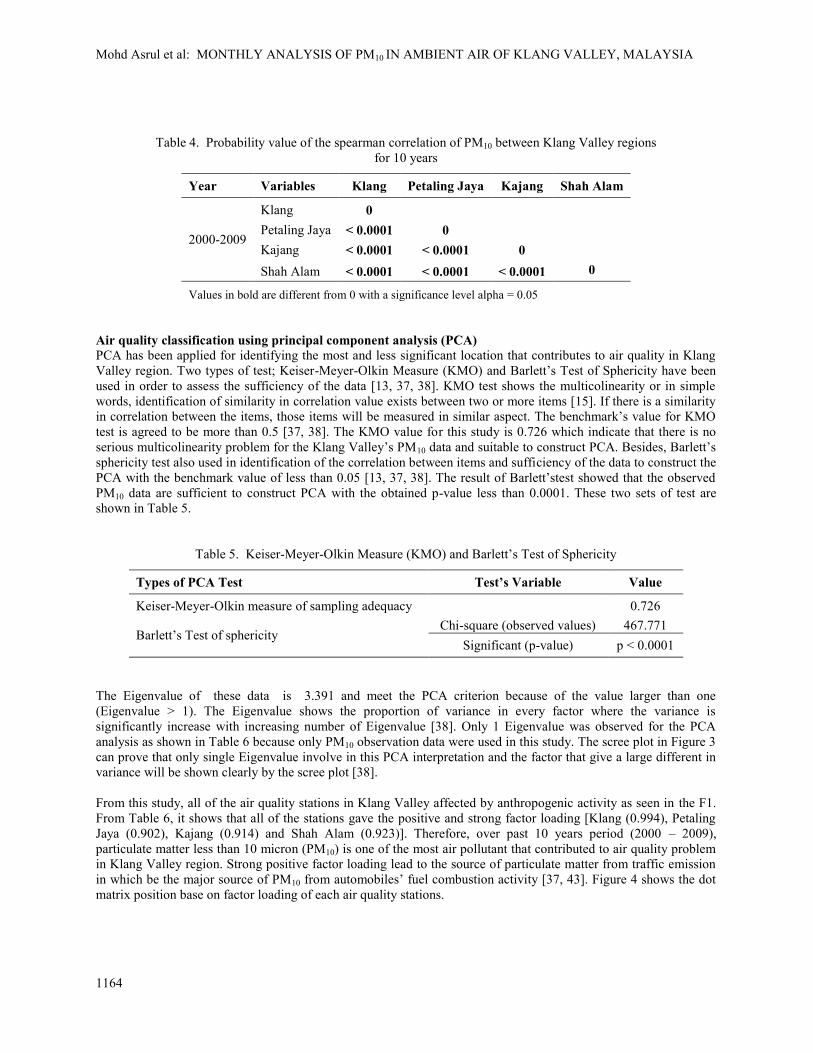
Table 4. Probability value of the spearman correlation of PM10 between Klang Valley regions
for 10 years
Year Variables Klang Petaling Jaya Kajang Shah Alam
2000-2009
Klang 0
Petaling Jaya < 0.0001 0
Kajang < 0.0001 < 0.0001 0
Shah Alam < 0.0001 < 0.0001 < 0.0001 0
Values in bold are different from 0 with a significance level alpha = 0.05
Air quality classification using principal component analysis (PCA)
PCA has been applied for identifying the most and less significant location that contributes to air quality in Klang
Valley region. Two types of test; Keiser-Meyer-Olkin Measure (KMO) and Barlett’s Test of Sphericity have been
used in order to assess the sufficiency of the data [13, 37, 38]. KMO test shows the multicolinearity or in simple
words, identification of similarity in correlation value exists between two or more items [15]. If there is a similarity
in correlation between the items, those items will be measured in similar aspect. The benchmark’s value for KMO
test is agreed to be more than 0.5 [37, 38]. The KMO value for this study is 0.726 which indicate that there is no
serious multicolinearity problem for the Klang Valley’s PM10 data and suitable to construct PCA. Besides, Barlett’s
sphericity test also used in identification of the correlation between items and sufficiency of the data to construct the
PCA with the benchmark value of less than 0.05 [13, 37, 38]. The result of Barlett’stest showed that the observed
PM10 data are sufficient to construct PCA with the obtained p-value less than 0.0001. These two sets of test are
shown in Table 5.
Table 5. Keiser-Meyer-Olkin Measure (KMO) and Barlett’s Test of Sphericity
Types of PCA Test Test’s Variable Value
Keiser-Meyer-Olkin measure of sampling adequacy 0.726
Barlett’s Test of sphericity Chi-square (observed values) 467.771
Significant (p-value) p < 0.0001
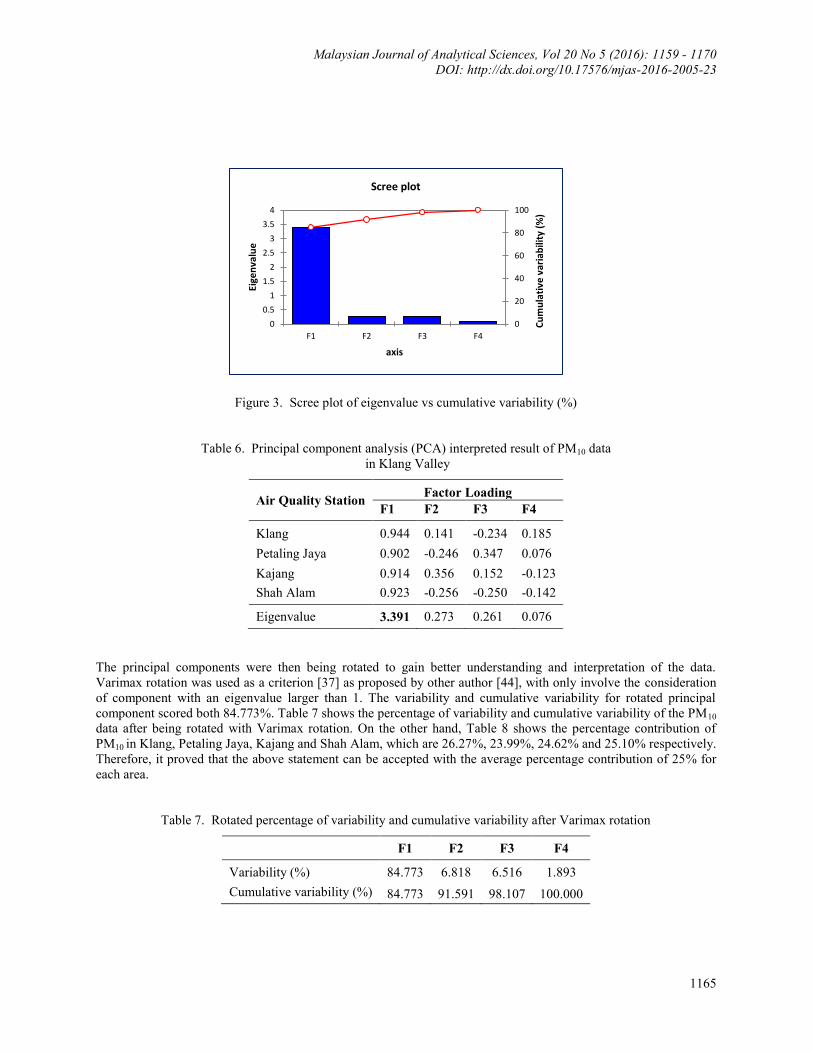
The Eigenvalue of these data is 3.391 and meet the PCA criterion because of the value larger than one
(Eigenvalue > 1). The Eigenvalue shows the proportion of variance in every factor where the variance is
significantly increase with increasing number of Eigenvalue [38]. Only 1 Eigenvalue was observed for the PCA
analysis as shown in Table 6 because only PM10 observation data were used in this study. The scree plot in Figure 3
can prove that only single Eigenvalue involve in this PCA interpretation and the factor that give a large different in
variance will be shown clearly by the scree plot [38].
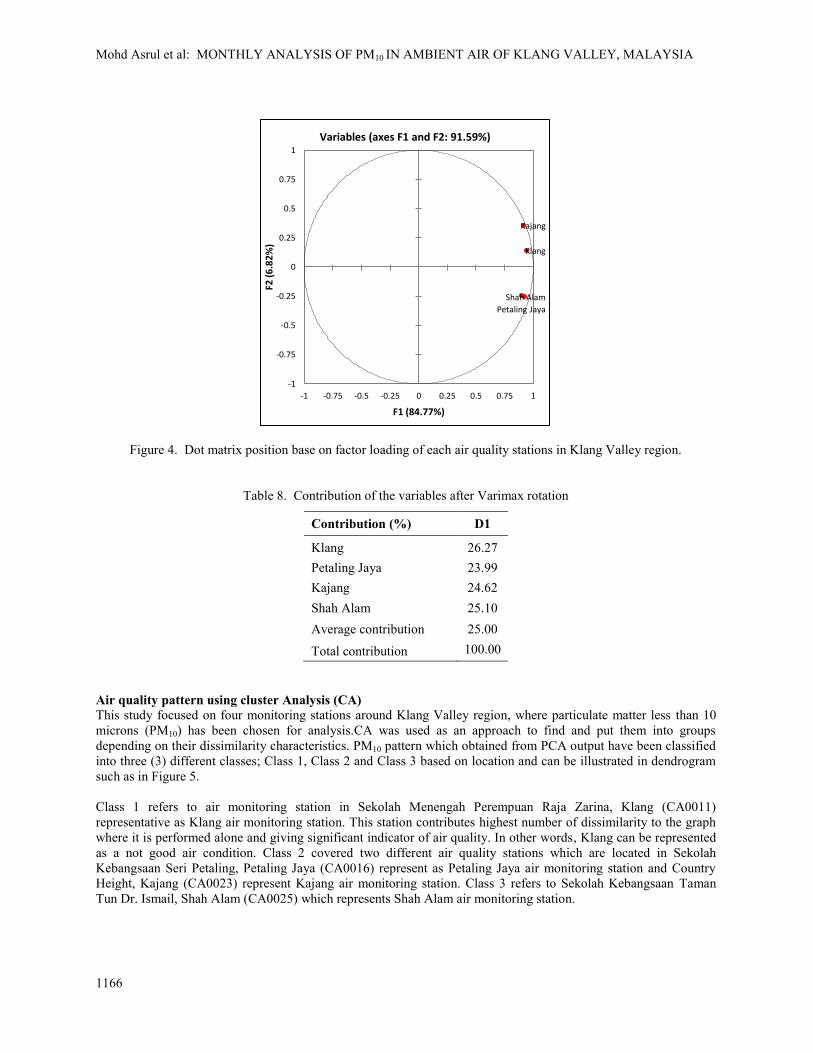
From this study, all of the air quality stations in Klang Valley affected by anthropogenic activity as seen in the F1.
From Table 6, it shows that all of the stations gave the positive and strong factor loading [Klang (0.994), Petaling
Jaya (0.902), Kajang (0.914) and Shah Alam (0.923)]. Therefore, over past 10 years period (2000 – 2009),
particulate matter less than 10 micron (PM10) is one of the most air pollutant that contributed to air quality problem
in Klang Valley region. Strong positive factor loading lead to the source of particulate matter from traffic emission
in which be the major source of PM10 from automobiles’ fuel combustion activity [37, 43]. Figure 4 shows the dot
matrix position base on factor loading of each air quality stations.
Malaysian Journal of Analytical Sciences, Vol 20 No 5 (2016): 1159 - 1170
DOI: http://dx.doi.org/10.17576/mjas-2016-2005-23
1165
Figure 3. Scree plot of eigenvalue vs cumulative variability (%)
Table 6. Principal component analysis (PCA) interpreted result of PM10 data
in Klang Valley
Air Quality Station Factor Loading
F1 F2 F3 F4
Klang 0.944 0.141 -0.234 0.185
Petaling Jaya 0.902 -0.246 0.347 0.076
Kajang 0.914 0.356 0.152 -0.123
Shah Alam 0.923 -0.256 -0.250 -0.142
Eigenvalue 3.391 0.273 0.261 0.076
The principal components were then being rotated to gain better understanding and interpretation of the data.
Varimax rotation was used as a criterion [37] as proposed by other author [44], with only involve the consideration
of component with an eigenvalue larger than 1. The variability and cumulative variability for rotated principal
component scored both 84.773%. Table 7 shows the percentage of variability and cumulative variability of the PM10
data after being rotated with Varimax rotation. On the other hand, Table 8 shows the percentage contribution of
PM10 in Klang, Petaling Jaya, Kajang and Shah Alam, which are 26.27%, 23.99%, 24.62% and 25.10% respectively.
Therefore, it proved that the above statement can be accepted with the average percentage contribution of 25% for
each area.
Table 7. Rotated percentage of variability and cumulative variability after Varimax rotation
F1 F2 F3 F4
Variability (%) 84.773 6.818 6.516 1.893
Cumulative variability (%) 84.773 91.591 98.107 100.000
0
20
40
60
80
100
0
0.5
1
1.5
2
2.5
3
3.5
4
F1 F2 F3 F4
Cu
mu
lati
ve v
aria
bili
ty (
%)
Eige
nva
lue
axis
Scree plot
Mohd Asrul et al: MONTHLY ANALYSIS OF PM10 IN AMBIENT AIR OF KLANG VALLEY, MALAYSIA
1166
Figure 4. Dot matrix position base on factor loading of each air quality stations in Klang Valley region.
Table 8. Contribution of the variables after Varimax rotation
Contribution (%) D1
Klang 26.27
Petaling Jaya 23.99
Kajang 24.62
Shah Alam 25.10
Average contribution 25.00
Total contribution 100.00
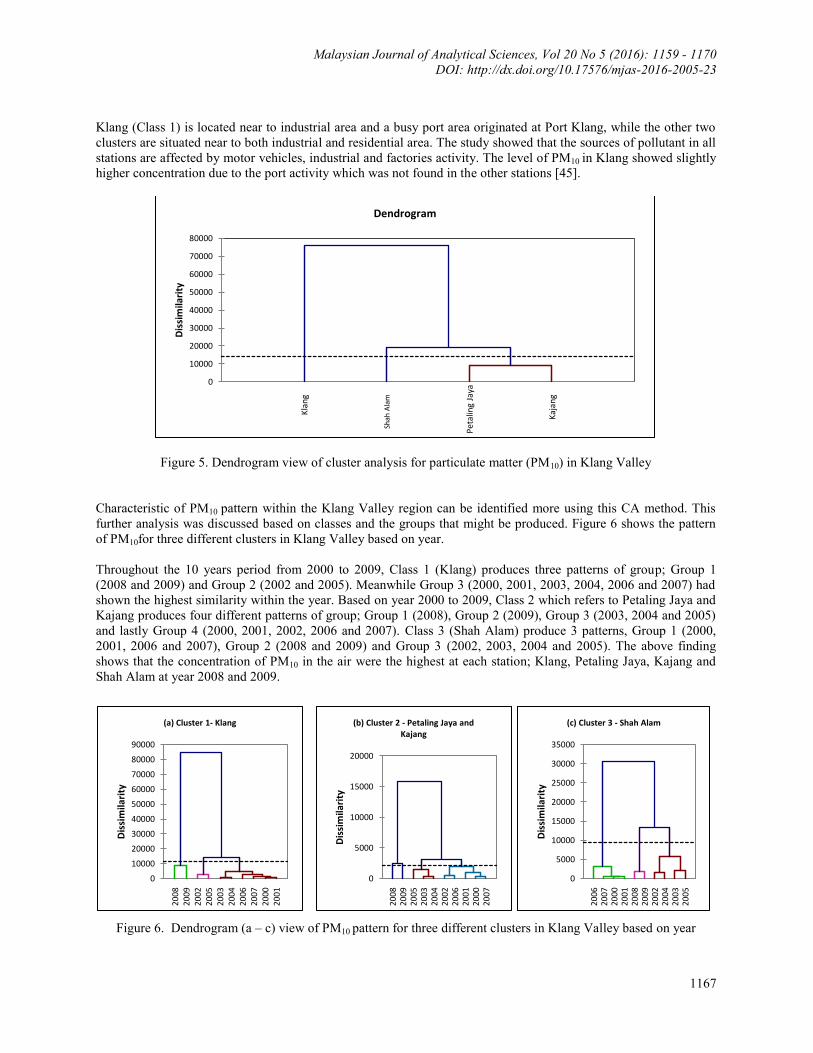
Air quality pattern using cluster Analysis (CA)
This study focused on four monitoring stations around Klang Valley region, where particulate matter less than 10
microns (PM10) has been chosen for analysis.CA was used as an approach to find and put them into groups
depending on their dissimilarity characteristics. PM10 pattern which obtained from PCA output have been classified
into three (3) different classes; Class 1, Class 2 and Class 3 based on location and can be illustrated in dendrogram
such as in Figure 5.
Class 1 refers to air monitoring station in Sekolah Menengah Perempuan Raja Zarina, Klang (CA0011)
representative as Klang air monitoring station. This station contributes highest number of dissimilarity to the graph
where it is performed alone and giving significant indicator of air quality. In other words, Klang can be represented
as a not good air condition. Class 2 covered two different air quality stations which are located in Sekolah
Kebangsaan Seri Petaling, Petaling Jaya (CA0016) represent as Petaling Jaya air monitoring station and Country
Height, Kajang (CA0023) represent Kajang air monitoring station. Class 3 refers to Sekolah Kebangsaan Taman
Tun Dr. Ismail, Shah Alam (CA0025) which represents Shah Alam air monitoring station.
Klang
Petaling Jaya
Kajang
Shah Alam
-1
-0.75
-0.5
-0.25
0
0.25
0.5
0.75
1
-1 -0.75 -0.5 -0.25 0 0.25 0.5 0.75 1
F2 (
6.8
2%
)
F1 (84.77%)
Variables (axes F1 and F2: 91.59%)
Malaysian Journal of Analytical Sciences, Vol 20 No 5 (2016): 1159 - 1170
DOI: http://dx.doi.org/10.17576/mjas-2016-2005-23
1167
Klang (Class 1) is located near to industrial area and a busy port area originated at Port Klang, while the other two
clusters are situated near to both industrial and residential area. The study showed that the sources of pollutant in all
stations are affected by motor vehicles, industrial and factories activity. The level of PM10 in Klang showed slightly
higher concentration due to the port activity which was not found in the other stations [45].
Figure 5. Dendrogram view of cluster analysis for particulate matter (PM10) in Klang Valley
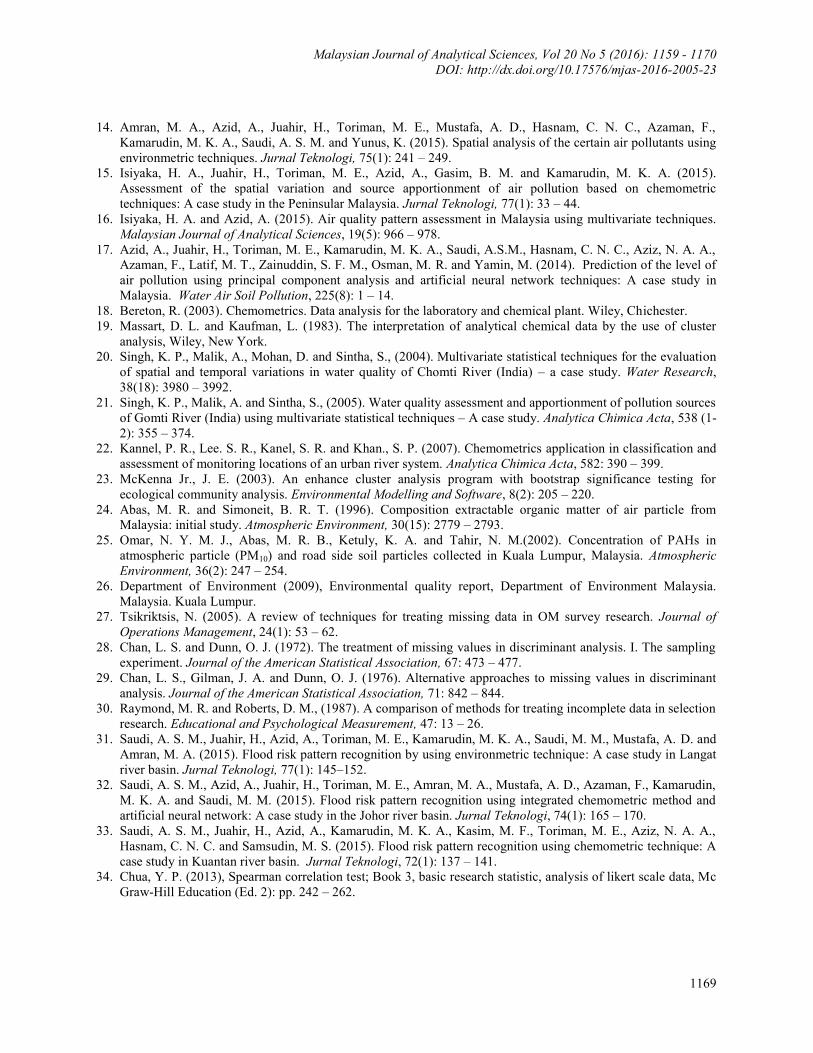
Characteristic of PM10 pattern within the Klang Valley region can be identified more using this CA method. This
further analysis was discussed based on classes and the groups that might be produced. Figure 6 shows the pattern
of PM10for three different clusters in Klang Valley based on year.
Throughout the 10 years period from 2000 to 2009, Class 1 (Klang) produces three patterns of group; Group 1
(2008 and 2009) and Group 2 (2002 and 2005). Meanwhile Group 3 (2000, 2001, 2003, 2004, 2006 and 2007) had
shown the highest similarity within the year. Based on year 2000 to 2009, Class 2 which refers to Petaling Jaya and
Kajang produces four different patterns of group; Group 1 (2008), Group 2 (2009), Group 3 (2003, 2004 and 2005)
and lastly Group 4 (2000, 2001, 2002, 2006 and 2007). Class 3 (Shah Alam) produce 3 patterns, Group 1 (2000,
2001, 2006 and 2007), Group 2 (2008 and 2009) and Group 3 (2002, 2003, 2004 and 2005). The above finding
shows that the concentration of PM10 in the air were the highest at each station; Klang, Petaling Jaya, Kajang and
Shah Alam at year 2008 and 2009.
Figure 6. Dendrogram (a – c) view of PM10 pattern for three different clusters in Klang Valley based on year
Kla
ng
Shah
Ala
m
Pet
alin
g Ja
ya
Kaj
ang
0
10000
20000
30000
40000
50000
60000
70000
80000
Dis
sim
ilari
ty
Dendrogram
200
8 20
09
200
2 20
05
200
3 20
04
200
6 20
07
200
0 20
01
0
10000
20000
30000
40000
50000
60000
70000
80000
90000
Dis
sim
ilari
ty
(a) Cluster 1- Klang
200
8 20
09
200
5 20
03
200
4 20
02
200
6 20
01
200
0 20
07
0
5000
10000
15000
20000
Dis
sim
ilari
ty
(b) Cluster 2 - Petaling Jaya and Kajang
200
6 20
07
200
0 20
01
200
8 20
09
200
2 20
04
200
3 20
05
0
5000
10000
15000
20000
25000
30000
35000
Dis
sim
ilari
ty
(c) Cluster 3 - Shah Alam
Mohd Asrul et al: MONTHLY ANALYSIS OF PM10 IN AMBIENT AIR OF KLANG VALLEY, MALAYSIA
1168
Conclusion
Based on the result, significant relationship of particulate matter (PM10) in Klang Valley, Malaysia and its pattern
can be identified using statistical and envirometric technique. The relation between two variables can be determined
by using Spearman Correlation Test. Strong correlations (> 0.7 with the p-value < 0.001) were obtained for all
stations in determination of significant relationship between 2 stations except for Petaling Jaya-Kajang and Kajang-
Shah Alam which recorded moderate correlation value 0.678(p < 0.001) and 0.602 (p < 0.001) respectively.
Principal component analysis (PCA) was able to identify the most and less significant location which contributing
to the level of PM10. The study found that all four location have been affected by PM10 which was determined as one
of the air pollutant that contributes to the deterioration of air quality in Klang Valley. On other hand, Cluster
analysis (CA) on the other hand was able to classify the PM10 into three groups depending on their dissimilarities
characteristic. PM10 pattern which obtained from PCA output have been classified into three (3) different classes,
Class 1 (Klang), Class 2 (Petaling Jaya and Kajang) and Class 3 (Shah Alam) based on location and possible period
of extreme air quality degradation could be identified. These statistical and envirometric techniques have proved the
impact of the various location on increased concentration of PM10.
Acknowledgement
Gratitude and appreciation to Malaysian Department of Environment (DOE) for their provision of air quality data,
and also to supervisor, committee members and colleagues for their efforts in assisting and completing this article.
References
1. Schwartz, J., Dockery, D. W., Neas, L. M., (1996). Is daily mortality associated specifically with fine
particles.Journal of the Air and Waste Management Association 46(10): 927–939.
2. Shao, Y. P., (2000). Physics and modelling of wind erosion. Atmospheric and oceanographic sciences library,
Sydney.
3. Abas, M. R. B., Oros, D. R. and Simoneit, B. R. T. (2004). Biomass burning as the main source of organic
aerosol particulate matter in Malaysia during haze episodes. Chemosphere, 55: 1089 – 1095.
4. Afroz, R., Hassan, M. N. and Ibrahim, N. A. (2003). Review of air pollution and health impacts in Malaysia.
Environmental Research. 92: 71 – 77.
5. Azmi, S. Z., Latif, M. T., Ismail, A. S., Juneng, L., Jemain, A. A. (2010). Trend and status of air quality at three
different monitoring stations in the Klang Valley, Malaysia. Air Quality, Atmosphere and Health, 3: 53 – 64.
6. Gurjar, B. R., Butler, T. M., Lawrence, M. G. and Lelieveld, J. (2008). Evaluation of emissions and air quality
in megacities. Atmospheric Environment, 42: 1593 – 1606.
7. Ozden, O., Dogeroglu, T. and Kara, S., (2008). Assessment of ambient air quality in Eskisehir, Turkey.
Environment International, 34: 678 – 687.
8. Nawrot, T. S., Torfs, R., Fierens, F., De Henauw, S., Hoet, P. H. and Van Kersschaever, G. (2007). Stronger
associations between daily mortality and fine particulate air pollution in summer than in winter: Evidence from
a heavily polluted region in Western Europe. Epidemiology and Community Health, 61:146 – 149.
9. Mott, J. A., Mannino, D. M., Alverson, C. J., Kiyu, A., Hashim, J., Lee, Tee., Falter, K., Redd, S. C. (2005).
Cardiorespiratory hospitalizations associated with smoke exposure during the 1997 Southeast Asia forest fires,
International journal of Hygiene and Environmental Health, 2008: 75 – 85.
10. Baldasano, J. M., Valera, E., Jiménez, P. (2003). Air quality data from large cities. The Science of The Total
Environment, 307: 141 – 165.
11. Azid, A., Juahir, H., Amran, M. A., Suhaili, Z., Osman, M. R., Muhamad, A., Abidin, I. Z., Sulaiman, N. H.,
Saudi, A. S. M. (2015). Spatial air quality modelling using chemometrics techniques: a case study in
Peninsular Malaysia. Malaysian Journal of Analytical Sciences. 19(6): 1415 – 1430.
12. Azid, A., Juahir, H., Ezani, E., Toriman, M. E., Endut, A., Rahman, M. N. A., Yunus, K., Kamarudin, M. K. A,
Hasnam, C. N. C., Saudi, A. S. M. and Umar, R. (2015b). Identification source of variation on regional impact
of air quality pattern using chemometric. Aerosol and Air Quality Research, 15: 1545 –1558.
13. Azid, A., Juahir, H., Toriman, M. E., Endut, A., Kamarudin, M. K. A., Rahman, M. N. A., Hasnam, C. N. C.,
Saudi, A. S. M., Yunus, K. (2015). Source apportionment of air pollution: A case study in Malaysia. Jurnal
Teknologi, 72(1): 83 – 88.
Malaysian Journal of Analytical Sciences, Vol 20 No 5 (2016): 1159 - 1170
DOI: http://dx.doi.org/10.17576/mjas-2016-2005-23
1169
14. Amran, M. A., Azid, A., Juahir, H., Toriman, M. E., Mustafa, A. D., Hasnam, C. N. C., Azaman, F.,
Kamarudin, M. K. A., Saudi, A. S. M. and Yunus, K. (2015). Spatial analysis of the certain air pollutants using
environmetric techniques. Jurnal Teknologi, 75(1): 241 – 249.
15. Isiyaka, H. A., Juahir, H., Toriman, M. E., Azid, A., Gasim, B. M. and Kamarudin, M. K. A. (2015).
Assessment of the spatial variation and source apportionment of air pollution based on chemometric
techniques: A case study in the Peninsular Malaysia. Jurnal Teknologi, 77(1): 33 – 44.
16. Isiyaka, H. A. and Azid, A. (2015). Air quality pattern assessment in Malaysia using multivariate techniques.
Malaysian Journal of Analytical Sciences, 19(5): 966 – 978.
17. Azid, A., Juahir, H., Toriman, M. E., Kamarudin, M. K. A., Saudi, A.S.M., Hasnam, C. N. C., Aziz, N. A. A.,
Azaman, F., Latif, M. T., Zainuddin, S. F. M., Osman, M. R. and Yamin, M. (2014). Prediction of the level of
air pollution using principal component analysis and artificial neural network techniques: A case study in
Malaysia. Water Air Soil Pollution, 225(8): 1 – 14.
18. Bereton, R. (2003). Chemometrics. Data analysis for the laboratory and chemical plant. Wiley, Chichester.
19. Massart, D. L. and Kaufman, L. (1983). The interpretation of analytical chemical data by the use of cluster
analysis, Wiley, New York.
20. Singh, K. P., Malik, A., Mohan, D. and Sintha, S., (2004). Multivariate statistical techniques for the evaluation
of spatial and temporal variations in water quality of Chomti River (India) – a case study. Water Research,
38(18): 3980 – 3992.
21. Singh, K. P., Malik, A. and Sintha, S., (2005). Water quality assessment and apportionment of pollution sources
of Gomti River (India) using multivariate statistical techniques – A case study. Analytica Chimica Acta, 538 (1-
2): 355 – 374.
22. Kannel, P. R., Lee. S. R., Kanel, S. R. and Khan., S. P. (2007). Chemometrics application in classification and
assessment of monitoring locations of an urban river system. Analytica Chimica Acta, 582: 390 – 399.
23. McKenna Jr., J. E. (2003). An enhance cluster analysis program with bootstrap significance testing for
ecological community analysis. Environmental Modelling and Software, 8(2): 205 – 220.
24. Abas, M. R. and Simoneit, B. R. T. (1996). Composition extractable organic matter of air particle from
Malaysia: initial study. Atmospheric Environment, 30(15): 2779 – 2793.
25. Omar, N. Y. M. J., Abas, M. R. B., Ketuly, K. A. and Tahir, N. M.(2002). Concentration of PAHs in
atmospheric particle (PM10) and road side soil particles collected in Kuala Lumpur, Malaysia. Atmospheric
Environment, 36(2): 247 – 254.
26. Department of Environment (2009), Environmental quality report, Department of Environment Malaysia.
Malaysia. Kuala Lumpur.
27. Tsikriktsis, N. (2005). A review of techniques for treating missing data in OM survey research. Journal of
Operations Management, 24(1): 53 – 62.
28. Chan, L. S. and Dunn, O. J. (1972). The treatment of missing values in discriminant analysis. I. The sampling
experiment. Journal of the American Statistical Association, 67: 473 – 477.
29. Chan, L. S., Gilman, J. A. and Dunn, O. J. (1976). Alternative approaches to missing values in discriminant
analysis. Journal of the American Statistical Association, 71: 842 – 844.
30. Raymond, M. R. and Roberts, D. M., (1987). A comparison of methods for treating incomplete data in selection
research. Educational and Psychological Measurement, 47: 13 – 26.
31. Saudi, A. S. M., Juahir, H., Azid, A., Toriman, M. E., Kamarudin, M. K. A., Saudi, M. M., Mustafa, A. D. and
Amran, M. A. (2015). Flood risk pattern recognition by using environmetric technique: A case study in Langat
river basin. Jurnal Teknologi, 77(1): 145–152.
32. Saudi, A. S. M., Azid, A., Juahir, H., Toriman, M. E., Amran, M. A., Mustafa, A. D., Azaman, F., Kamarudin,
M. K. A. and Saudi, M. M. (2015). Flood risk pattern recognition using integrated chemometric method and
artificial neural network: A case study in the Johor river basin. Jurnal Teknologi, 74(1): 165 – 170.
33. Saudi, A. S. M., Juahir, H., Azid, A., Kamarudin, M. K. A., Kasim, M. F., Toriman, M. E., Aziz, N. A. A.,
Hasnam, C. N. C. and Samsudin, M. S. (2015). Flood risk pattern recognition using chemometric technique: A
case study in Kuantan river basin. Jurnal Teknologi, 72(1): 137 – 141.
34. Chua, Y. P. (2013), Spearman correlation test; Book 3, basic research statistic, analysis of likert scale data, Mc
Graw-Hill Education (Ed. 2): pp. 242 – 262.
Mohd Asrul et al: MONTHLY ANALYSIS OF PM10 IN AMBIENT AIR OF KLANG VALLEY, MALAYSIA
1170
35. Kamaruddin, A. F., Toriman, M. E., Juahir, H., Zain, S. M., Rahman, M. N. A., Kamarudin, M. K. A., and
Azid, A. (2015). Spatial characterization and identification sources of pollution using multivariate analysis at
Terengganu river basin, Malaysia. Jurnal Teknologi, 77(1): 269 – 273.
36. Mutalib, S. N. S. A., Juahir, H., Azid, A., Sharif, S. M., Latif, M. T., Aris, A. Z., Zain, S. M. and Dominick, D.
(2013). Spatial and temporal air quality pattern recognition using environmetric techniques: A case study in
Malaysia. Environmental Science: Processes Impacts, 15: 1717 – 1728.
37. Ul-Saufie, A. Z., Yahya, A. S., Ramli, N. A., Rosaida, N., and Hamid, H. A., (2013). Future daily PM10
concentration prediction by combining regression models and feedwork backpropagation models with principal
component analysis (PCA). Atmospheric Environment, 77: 621 – 637.
38. Chua, Y. P. (2009), Factor analysis and cluster analysis; Book 5, regression test, factor analysis and SEM
analysis, Mc Graw-Hill Education: pp. 170 – 299
39. Abdul-Wahab, S. A., Bakheit, C.S. and Al-Alawi, S. M. (2005). Principal component and multiple regression
analysis in modelling of ground-level ozone and factors affecting its concentrations. Environmental Modelling
Software, 20: 1263 – 1271.
40. Markou, M. and Kassomenos, P. (2010). Cluster analysis of five years of back trajectories arriving in Athens,
Greece. Atmospheric Research, 98: 438 – 457.
41. Masiol, M., Rampazzo, G., Ceccato, D., Squizzato, s., and Pavoni, B. (2010). Characterization of PM10 sources
in coastal area near Venice (Italy): An application of factor-cluster analysis. Chemosphere, 80: 771 – 778.
42. Department of Environment (2011). Environmental Quality Report, Department of Environment Malaysia.
Malaysia. Kuala Lumpur.
43. Ghazali, N. A., Ramli, N. A. and Yahya, A. S. (2009). A study to investigate and model the transformation of
nitrogen dioxide into ozone using time series plot. European Journal of Scientific Research 37(2): 192 – 205.
44. Kaiser, H. F. (1958). The varimax criterion for analytic rotation in factor analysis. Psycometrika, 23: 187 – 200.
45. Dominick, D., Juahir, H., Latif, M. T., M. Zain, S. and Aris, A. Z. (2012). Spatial assessment of air quality
patterns in Malaysia using multivariate analysis. Atmospheric Environment, 60: 172 – 181.