Embed Size (px)
Citation preview
A0-A084 379 NAVAL POSTGRADUATE SCHOOL MONTEREY CA F/S 11/6
THE EFFECT OF MULTIPLE WELD REPAIRS ON THE FATIGUE RESISTANCE 0--ETC(U)7 UNCLASIFIEDDEC 79 J R PANICO N
NAVAL POSTGRADUATE SCHOOLMonterey, California
THE ISMAY 2 0 1980Oj
THESIS A I
The Effect Of Multinle Weld Repairs
On The Fatigue Resistance Of
Welded Aluminum Alloy 5083-0
by
John R. Panico
December 1979
Thesis Advisor T.R. McNelley
Approved For Public Release; Distribution Unlimited
S80 520 082
ei
UNCLASSIFIEDSECUNIIT, CLASSIFICATION OF TWs 04GE rowa Dae enter")
REPORT DOCUMENTATION PAGE ___A_ _ msT__u___r__sREPORT UMBER l 3111 COPLaINTG FrORM
The Effect Of M.'ultiple Wel 1e91irs1to
Aluminu Alloy V83-6 6. *0mPuo"o 0G. REPORT NuER
7. AU T"Oa~fo) 4. CONTRACT On GRANT NUmSe(J)
10] John R./Panico• D 5 INw ORANIZATION NAME AN ACORS tO. 10PROGRAU ELEENT. PROJ9CT. TAI
gl4avai Postgraduate School A1A6WR aMonterey, California 93940
I I CONTROLLING OFFICE NAME AND ADDRESS Is. REPORT
Naval Postgraduate SchoolMonterey, California 93940 Is. NuUOM6ofPAGES 58
14. MONITORING AGENCY %I &AIt A ADODESS(fI dilfIne 1m Contplistej Off$e) IS. SECURITY CLASS. (of ml. iPorl)
IGO. efCLASSIPrICATtON/OOWNGapaDiNG
Is. DISTRIBIUTION 97A I i t+
...
Approved for public release; distribution unlimited.
17. DISRIIUTION STATEMENT (Of the .A-ferct ,.mE00t In eoh 30, II diflema - Re pe)
II. SUPPLEMENTARY NOTES
IW KEKY WONS (Contonmae vwee ole CI O 8e*s i nd t l~tf by week rnm.le)
Precipitate AgglomerationAluminum-Magnesium Alloy 5083-0Fatigue ResistanceLiquified Natural Gas ApplicationsWeld Cycle Effects
30, ABSTRACT (CeRIWAP,= 0 old* II node.6*MP ft10 t dllt r o*& minmk.)
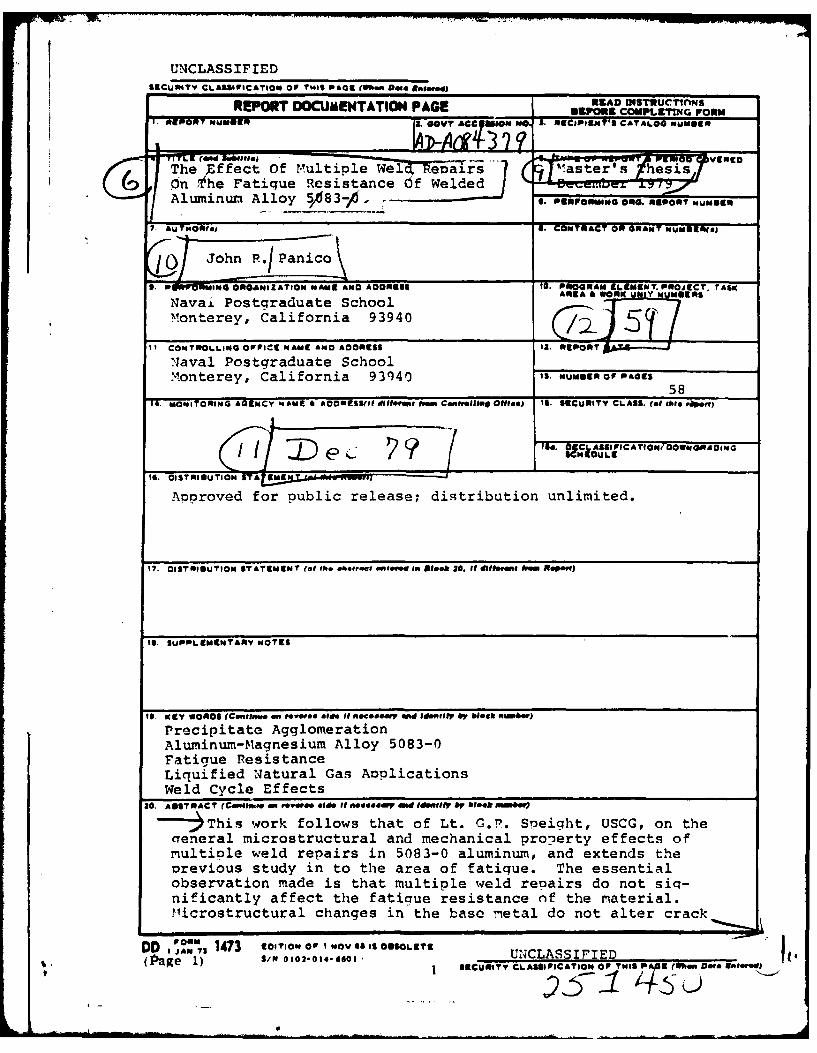
-- This work follows that of Lt. G.P. Speight, USCG, on theaeneral microstructural and mechanical pronerty effects ofmultiple weld repairs in 5083-0 aluminum, and extends theprevious study in to the area of fatigue. The essentialobservation made is that multiple weld reuairs do not sic-nificantly affect the fatigue resistance of the material.ilicrostructural changes in the base metal do not alter crack
DD , , 1473 ONCLASSIFIED(Page 1) S/,l 0102-014-6601 * N * A" --
SCURITY CLASSIFICATION OF THIS a

(: ICLASSIFIED
initiation and propagation characteristics, failure beinqconfined to the weld filler material. I
DD ForrU 1473 UNCLASS IFIEDS/ I0t2?fl14-66o1I 2 68cust~v cLAIcAYIOW OF wSPO~m e.leeE
Approved For Public Release; Distribution Unlimited
The Effect Of Multiple Weld Repairs
On The Fatigue Resistance Of
Welded Aluminum Alloy 5083-0
by
John R. PanicoLieutenant Commander, United States NavyB.S., United States Naval Academy, 1970
Submitted In Partial Fulfillment OfThe Requirements For The Degree Of
MASTER OF SCIENCE IN MECHANICAL ENGINEERING
from the
NAVAL POSTGRADUATE SCHOOLDecember 1979
Author '" o'- , / ._ "
Approved by ....________________________Thesis Advisor
econd Reader
Chairman, D artment-Of-Mechanical Engineerina
Dean Of Science And Enqineering
3
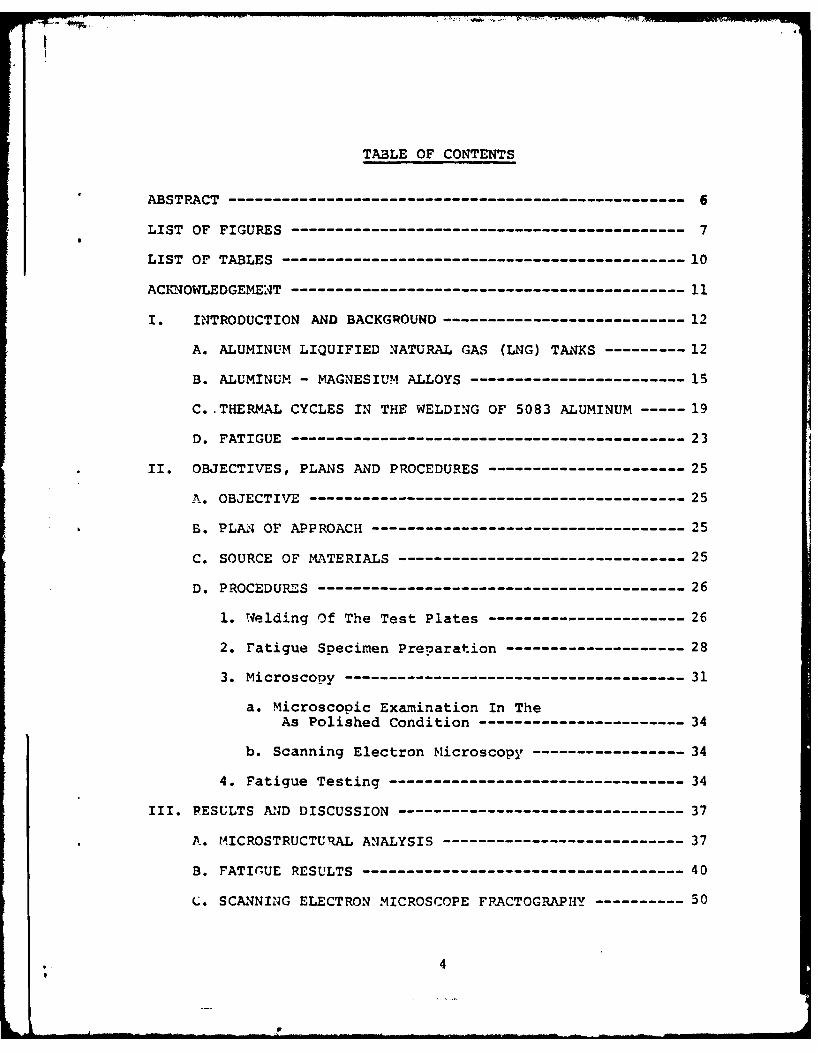
TABLE OF CONTENTS
ABSTRACT - --------------------------------------------------- 6
LIST OF FIGURES 7--------------------------------------------7
LIST OF TABLES ---------------------------------------------- 10
ACICIOWLEDGEMEIT -------------------------------------------- 11
I. INTRODUCTION AND BACKGROUND --------------------------- 12
A. ALUMINUM LIQUIFIED NATURAL GAS (LNG) TANKS --------- 12
B. ALUMINUM - MAGNESIUM ALLOYS ------------------------ 15
C. THERMAL CYCLES IN THE WELDING OF 5083 ALUMINUM ----- 19
D, FATIGUE---------------------------------------------- 23
II. OBJECTIVES, PLANS AND PROCEDURES ---------------------- 25
A. OBJECTIVE ------------------------------------------ 25
B. PLAN OF APPROACH 5------------------------------------5
C. SOURCE OF MATERIALS -------------------------------- 25
D. PROCEDUR--S ----------------------------------------- 26
1. Welding Of The Test Plates ---------------------- 26
2. ratigue Specimen Preparation -------------------- 28
3. Microscopy -------------------------------------- 31
a. Microscopic Examination In TheAs Polished Condition ----------------------- 34
b. Scanning Electron Microscopy ----------------- 34
4. Fatigue Testing --------------------------------- 34
III. RESULTS AND DISCUSSION -------------------------------- 37
A. MICROSTRUCTURAL ANALYSIS --------------------------- 37
B. rATIrUE RESULTS ------------------------------------ 40
C. SCANNING ELECTRON MICROSCOPE FRACTOGRAPHY ---------- 50
4
ALU
IV. CONCLUSIONS 56
LIST OF REFERENCES ------------------------------------------- 57
INITINL DISTRIBUTION LIST ------------------------------------ 58
5
ABSTRACT
This work follows that of Lt. G.P,. Speight, USCG, on the
general microstructural and mechanical property effects of
multiple weld repairs in 5083-0 aluminum, and extends the pre-
vious study into the area of fatigue. The essential observation
made is that multiple weld repairs do not significantly affect
the fatigue resistance of the material. Microstructural
changes in the base metal do not alter crack initiation and
propagation characteristics, failure being confined to the weld
filler material.
6
LIST OF fIGURES
1. Photograph of a Conch design "self-supporting" Liqui-fied Natural Gas tank being loaded aboard ship atthe Kaiser Fabricators Facility, Mobile, Alabama.The tank, one of five to be placed in the ship, isof all-welded, 5083-0 aluminum construction. (Photo-graph comoliments of Kaiser Aluminum Chemical &Sales Inc.).
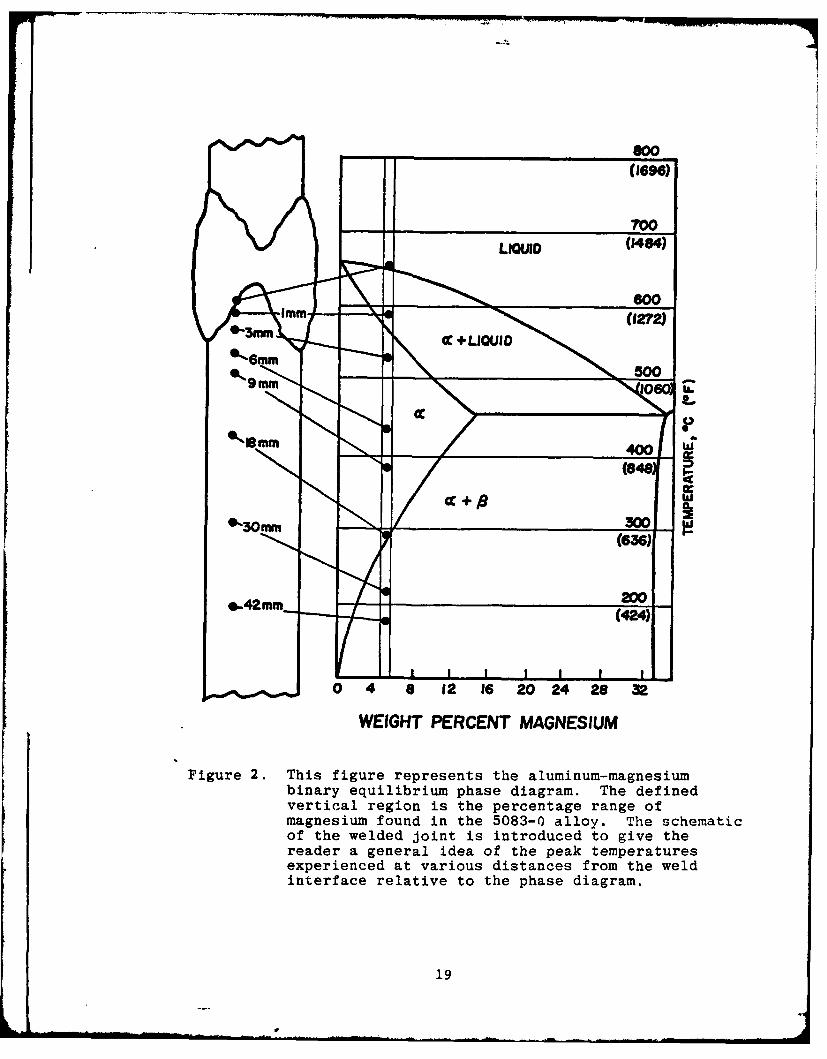
2. This figure represents the aluminum-magnesium binaryphase diagram. The defined vertical region is thepercentage range of magnesium found in the 5083-nalloy. The schematic of the welded joint is intro-duced to give the reader a general idea of the peaktemperatures experienced at various distances fromthe weld interface relative to the phase diagram.
3. This figure shows curves which represent typicalheating and cooling rates of a plate as a functionof varying distances from the weld arc. The numbered
curves corresnond to the nuxbered locations shownon the schematic of the welded joint.
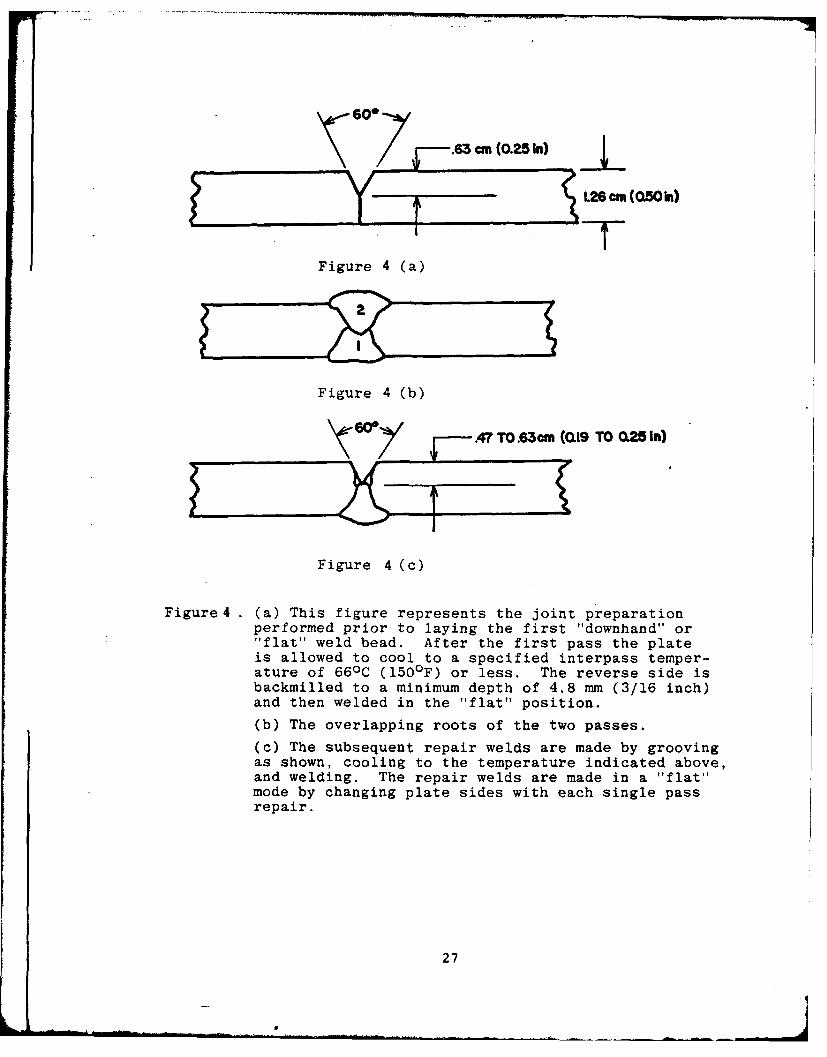
4. (a) This figure represents the joint preoaration per-formed prior to laying the first "downhand" or"flat" weld bead. After the first pass the plate isallowed to cool to a specified interpass temperatureof 660C (1500F) or less. The reverse side is back-milled to a minimum depth of 4.8 mm (3/16 inch) andthen welded in the flat position.
(b) The overlapping roots of the two passes.
(c) The subsequent repair welds are made by groovingas shown, cooling to the temperature indicatedabove, and welding. The repair welds are made in a"flat" mode by changing plate sides with each singlepass repair.
5. Schematic representing the orientation of the samplein the welded plate. Both the weld metal and heataffected zone are included in the test section ofthe soecimen.
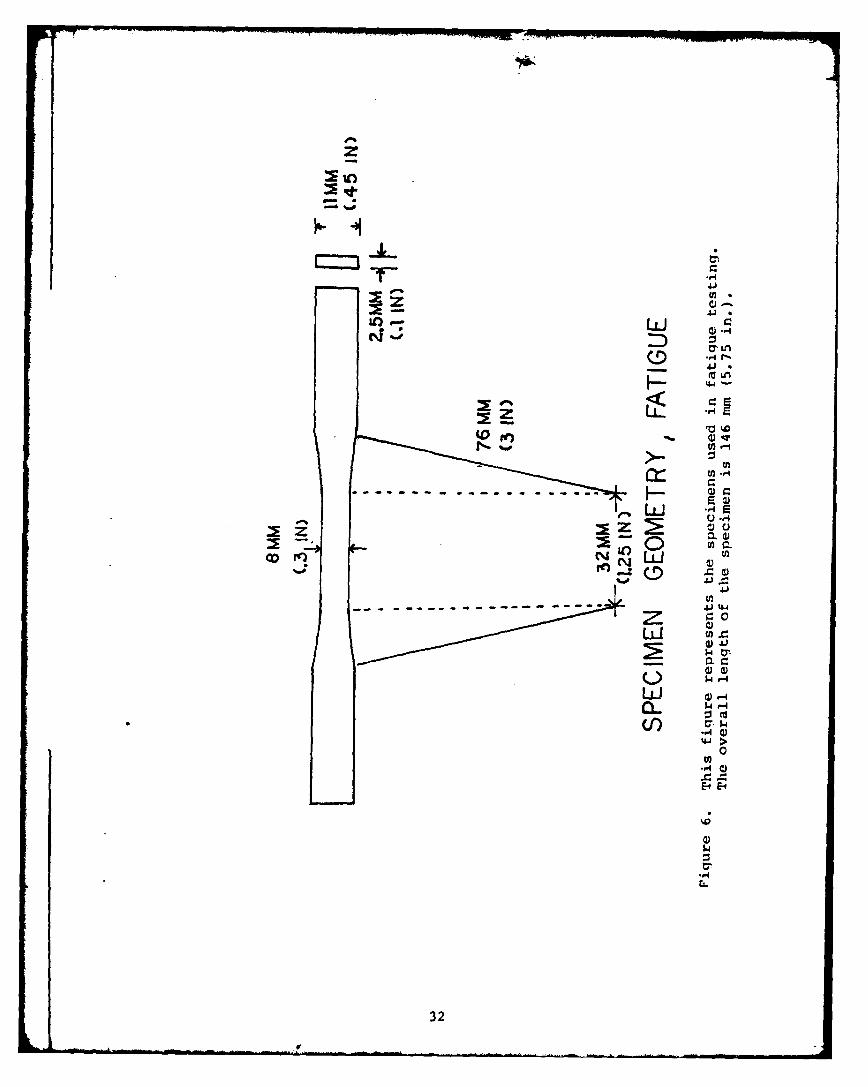
6. This figure represents the specimens used in fatiguetesting. The overall length of the specimen is146 mm (5.75 in.).
7
ILe
7. The metallography specimen showing general dimen-sions. The indicated location array is shown togive the reader a general idea of the areas repre-sented by micrographs.
8. Haversine Fatigue Test. Specimen loading as a func-tion of time. A frequency of 10 hertz was used forall tests.
9. Photomicrographs taken of the as-polished specimensubjected to the original two-pass weld only. Thelocations represented are the interface (a), ap-proximately 6 mm (b), 13 mm (c), and 27 mm (d) fromthe interface. (10OX).
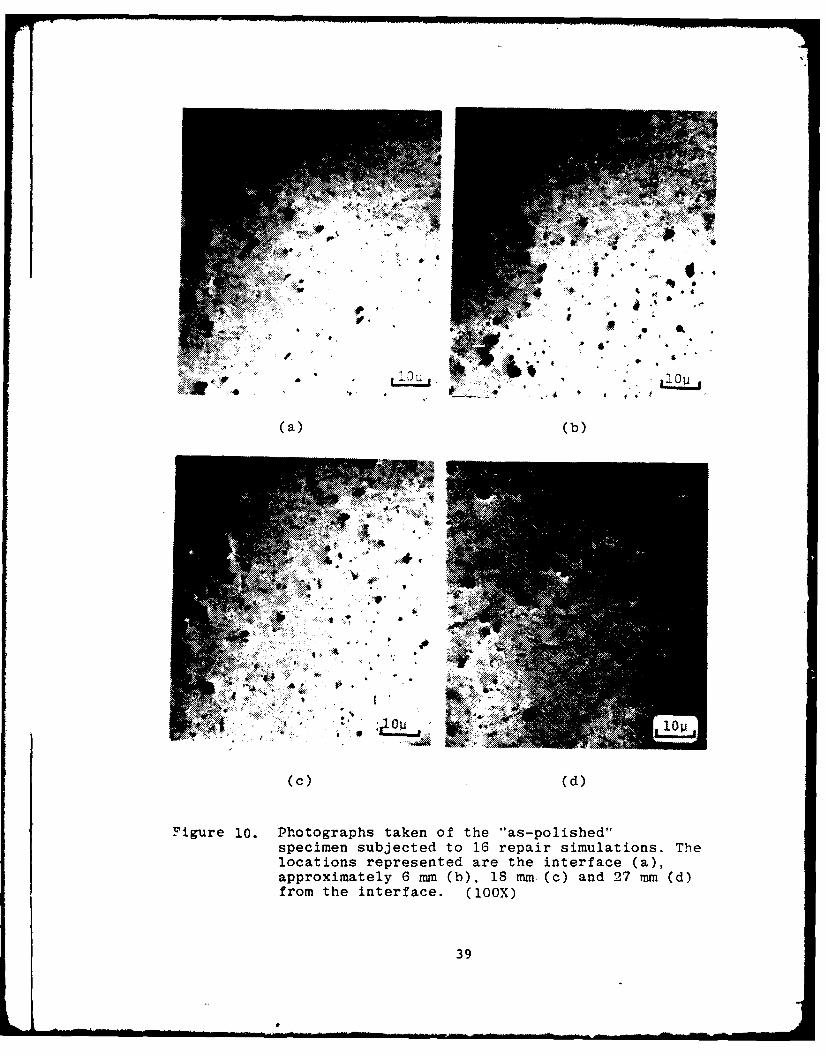
10. Photographs taken of the as-polished specimen sub-jected to 16 repair simulations. The locationsrepresented are the interface (a), approximately6 mm (b), 18 mm (c), and 27 mm (d) from the inter-face. (10OX).
11. (a) Twice weld repaired specimen in the as-polishedcondition. Photograph taken on SEM. (2500X).
(b) Fourteen weld repaired specimen in the as-polishedcondition. Photograph taken on the SEM. (2500X). Itcan be seen that the inclusions are coarsening andbreaking up.
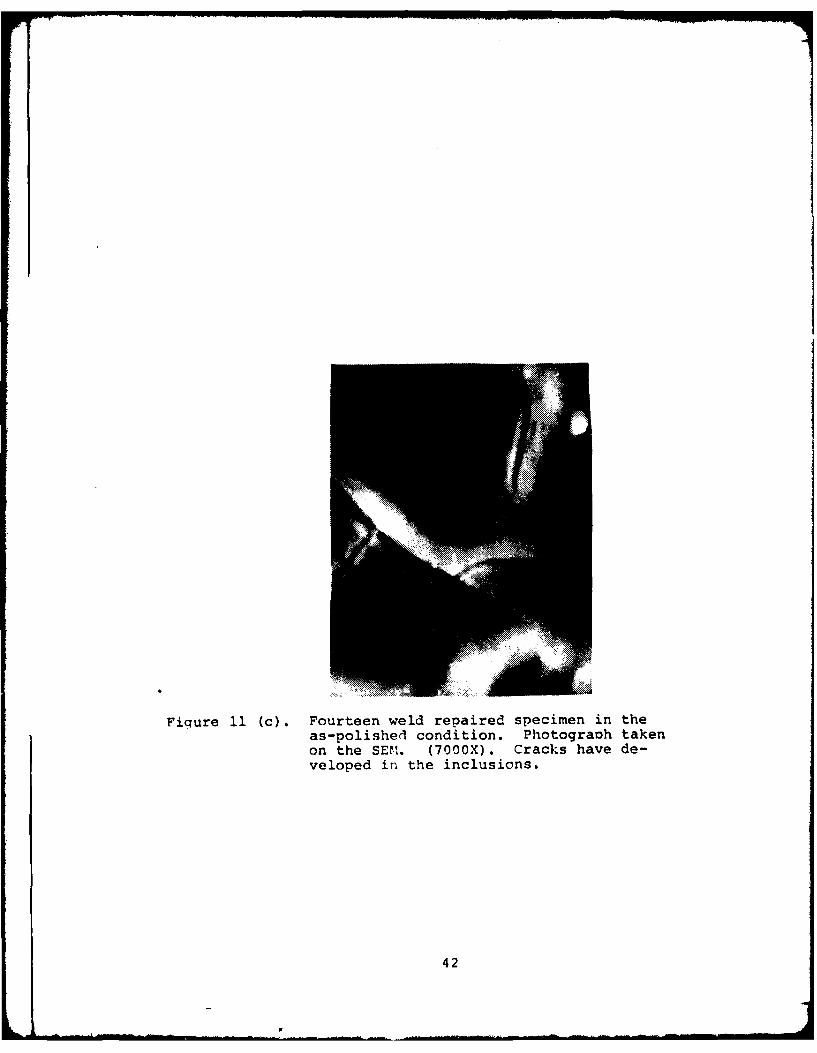
(c) Fourteen weld repaired specimen in the as-polishedcondition. Photograph taken on the SEM. (7000X).Cracks have developed in the inclusions.
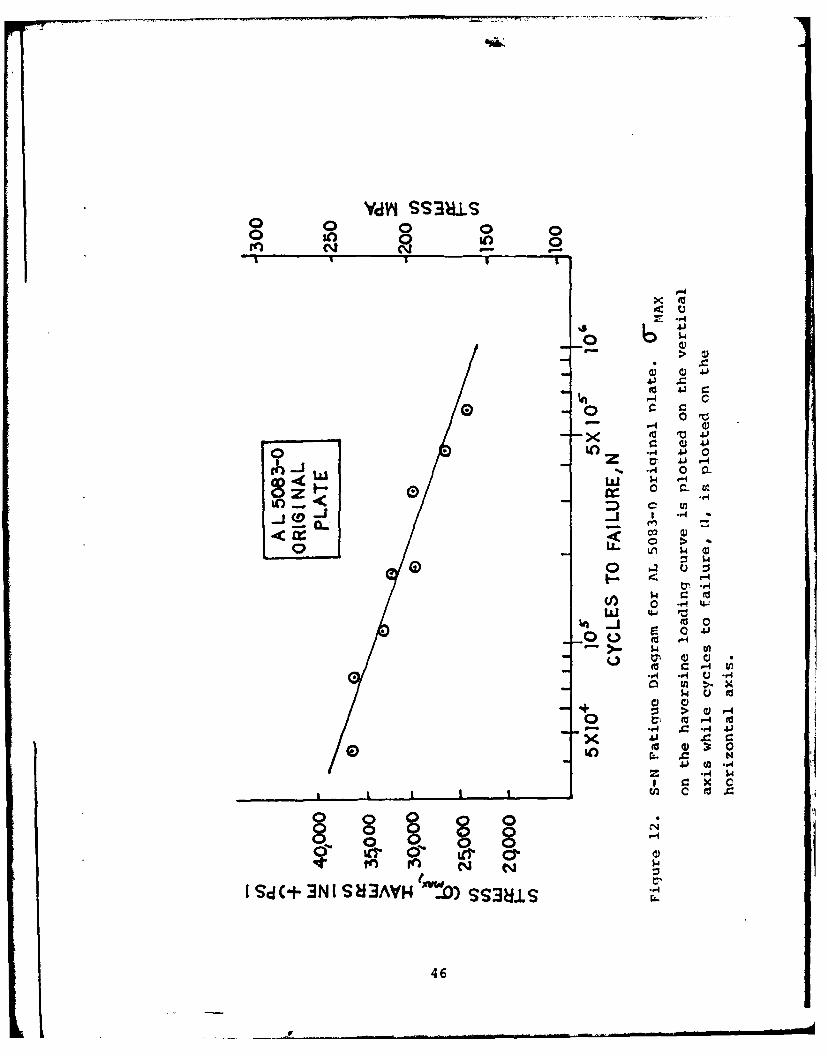
12. S-N Fatigue Diagram for AL 5083-0 original plate.)1AX on the haversine loading curve is plotted
on the vertical axis while cycles to failure, N,is plotted on the horizontal axis.
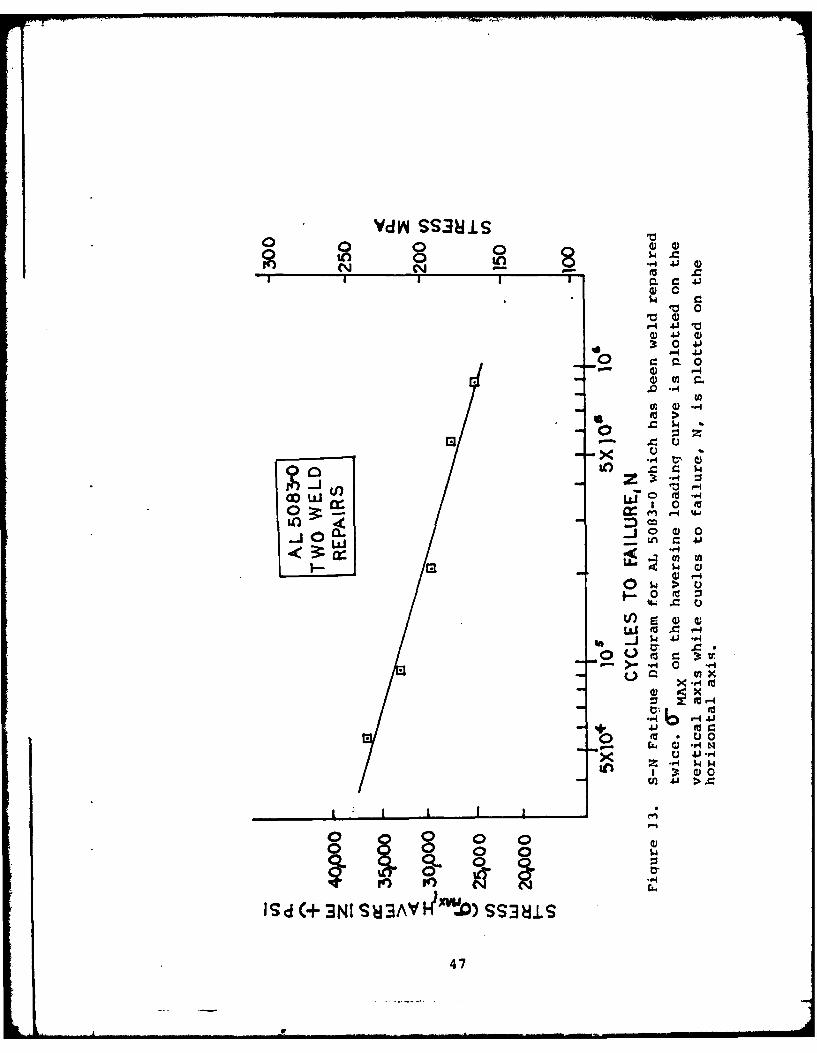
13. S-N Fatigue Diagram for AL 5083-0 which has beenweld repaired twice. 0--,A X on the haversine loading
curve is plotted on the vertical axis while cyclesto failure, N, is plotted on the horizontal axis.
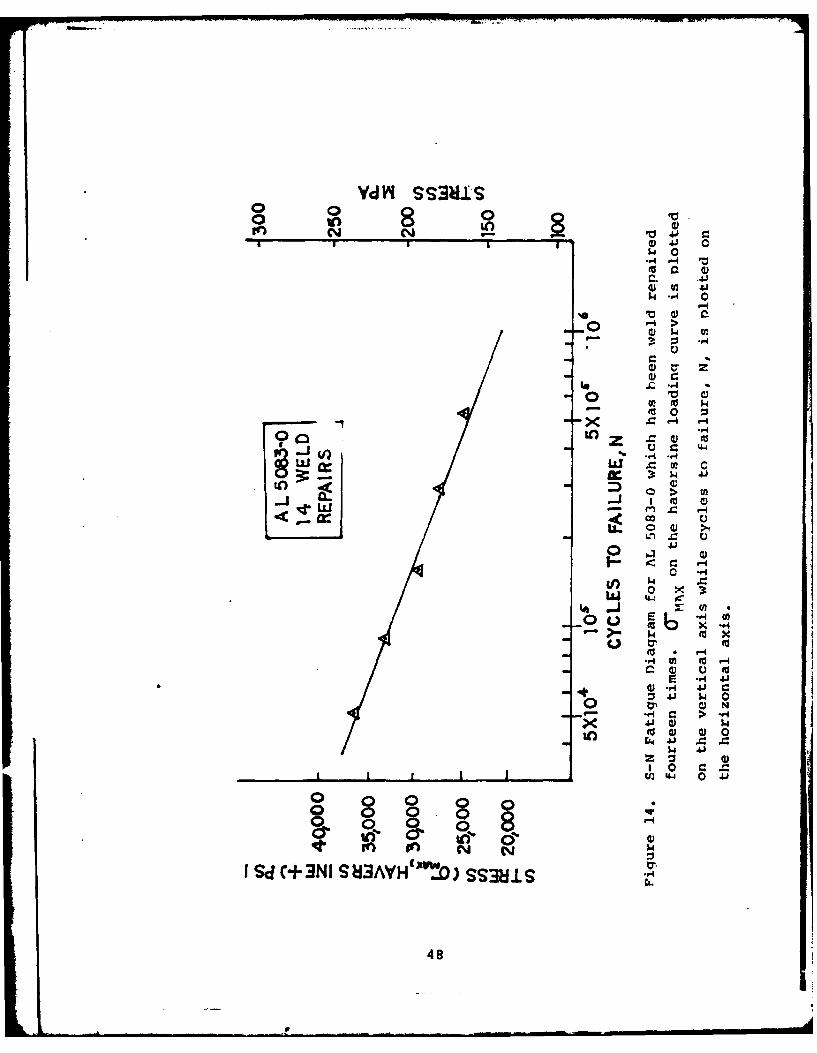
14. S-N Fatigue Diagram for AL 5083-0 which has beenweld repaired fourteen times. TY on the haversine
M1AXloading curve is plotted on the vertical axis whilecycles to failure, N, is plotted on the horizontalaxis.
8
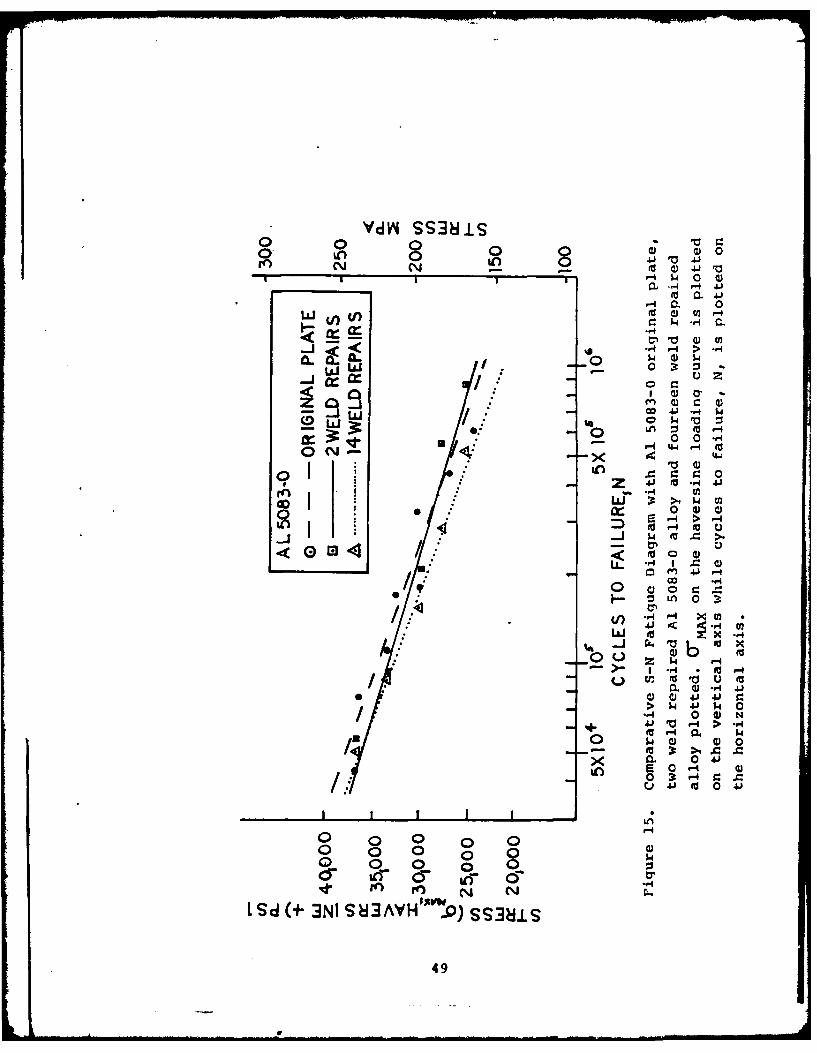
15. Comparative S-N Fatigue Diagram with Al 5083-0original plate, two weld repaired Al 5083-0alloy and fourteen weld repaired Al 5083-0 alloyplotted. T-MAX on the haversine loading curve is
olotted on the vertical axis while cycles tofailure, N, is plotted on the horizontal axis.
16. Observation of the fracture surface of a twiceweld repaired specimen. (240X). The fractureappears to have initiated at porosity near thesurface. Radial fatigue striations mark theprogress of the fatigue crack growth.
17. Observation of the fracture surface of a four-teen weld repaired samnle. (620X). Porosityin the ductile overload zone is shown.
18. Observation of the fracture surface of a samplefrom the unwelded original Plate. (25X). Thefatigue crack seems to have begun at the freesurface of the material and propagated inward.
19. The fatigue zone of Figure 18 at a magnificationof 51 diameters.
20. Observation of transverse section of the fracturesurface. (10OX). The specimen is from an originalplate. Note the absence of Porosity.
21. Observation of transverse section of the fracturesurface of a fourteen weld reoaired samole. (10OX).Note the porosity at or near the fracture surface.This observation along with that in Figure 12 indi-cate that the fatigue fracture in all weldedsamiles was probably initiated at porosity locatedin the weld filler metal.
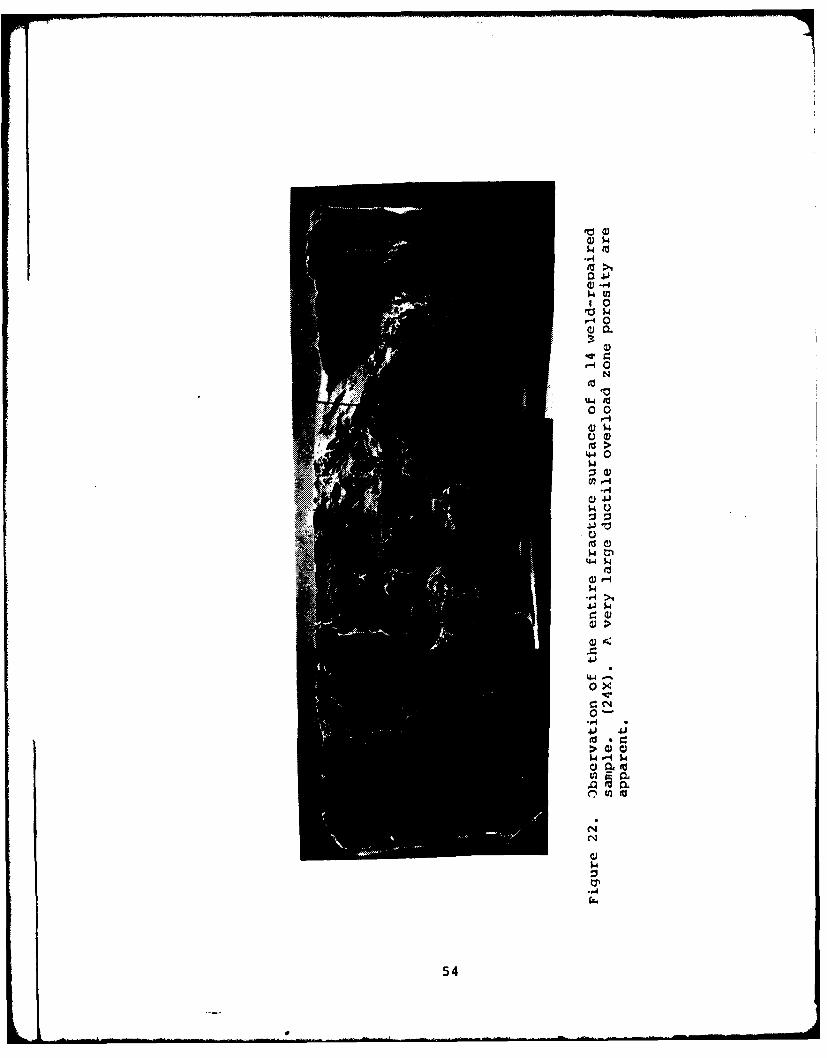
22. Observation of the entire fracture surface of afourteen weld-repaired sample. (24X). A verylarge ductile overload zone and porosity areapparent.
9
LAU
LIST OF TABLES
Table I.* ALLOY CHEMISTRY AND MECHANICAL PROPERTIESOF AL 5083-0-------------------------------------- 17
Table II. WELDING PARAMETERS USED IN FABRICATION OFTEST PLATES--------------------------------------- 29
Table III. FATIGUE TEST DATA-AL 5083-0 ORIGINAL PLATE------------------------- 43AL 5083-0 TWO WELD REPAIRS----------------------- 43AL 5083-0 FOURTEEN WELD REPAIRS------------------ 44
10
ACKNOWLEDGEMENT
The author wishes to exvress his thanks to Professor
Terry McNelley for his enthusiastic assistance and guidance
throughout the course of this study. Numerous consultations
with Mr. Tom Kellog, Mechanical Engineering Department Tech-
nician, were of invaluable assistance in solvinq problems
encountered in specimen oreparation and ohotography. The
author extends soecial thanks to his wife, Judy, and dauahter,
Kristen, for their patience and understanding during the com-
pletion of this manuscript. Professor Kenneth Challenger's
timely assistance was also greatly aooreciated.
11
I .... . .. r
I. INTRODUCTION AMD BACKGROUND
A. ALUMINUM LIQUIFIED NATURAL GAS (LNG) TANKS
The aluminum alloy 5083-0 is extensively used in marine
applications. Its corrosion resistance, strength and weld-
ability make it an excellent material for these applications.
This alloy is used in two of the three major designs for LNG
tankships. The material's light weight and resistance to
fracture at low temperature are the primary material proper-
ties which make it especially suitable for LNG use. Further,
it is non-sparking, an extremely desirable characteristic
in marine transport of flammable material.
The three major designs are /-i7: (1) the TECHNIGAZ
membrane containment system, utilizing a stainless steel
primary barrier, (2) the rMoss-Rossenburg design spherical
containment system, and (3) the Conch design prismatic con-
tainment system. The latter two systems utilize 5083-0
aluminum as the primary barrier. Since the purpose of this
thesis is to determine the effects of multiple weld repairs on
aluminum welded joints, discussion will be limited to designs
(2) and (3). An LNG tanker of 125,000 m3 capacity contains
five separate tanks. When utilizing a self-supporting con-
tainment system, the tanks are fabricated independently of the
vessel's hull and are not inserted into the hull until both
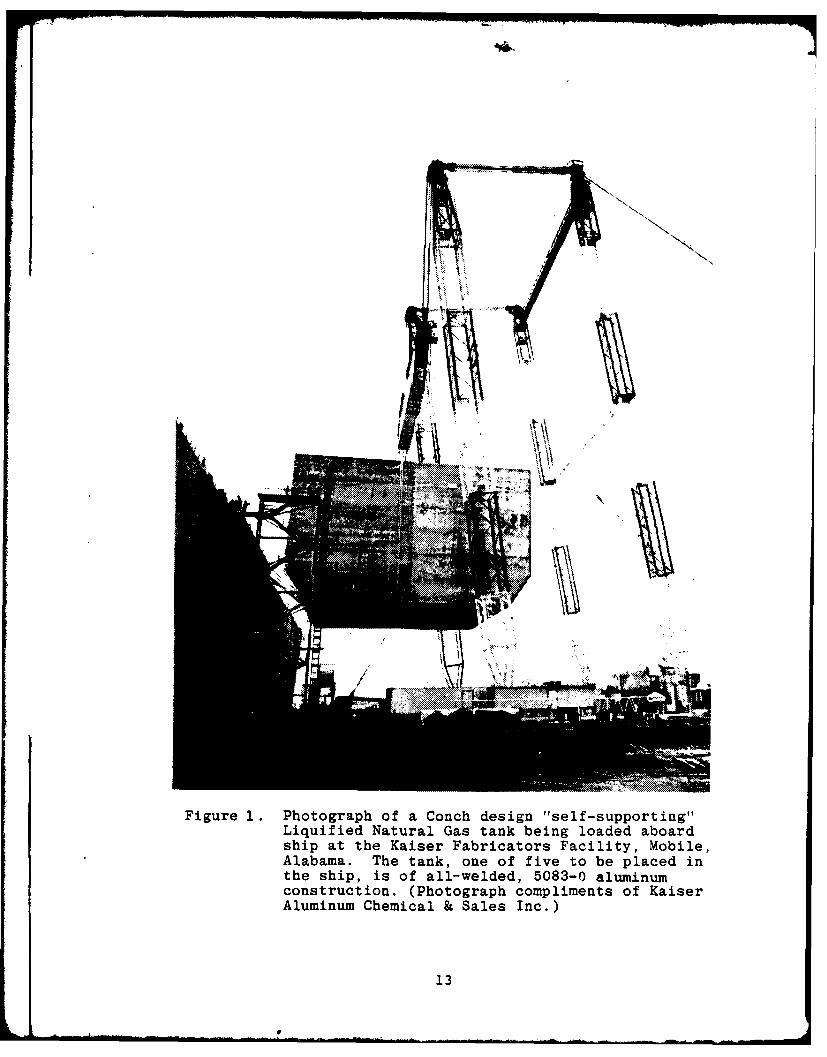
the hull and tanks are complete (Figure 1). An important
advantage of the self-supporting class system is that tank
12
t"N
Figure 1. Photograph of a Conch design "self-supporting"Liquified Natural Gas tank being loaded aboardship at the Kaiser Fabricators Facility, Mobile,Alabama. The tank, one of five to be placed inthe ship, is of all-welded, 5083-0 aluminumconstruction. (Photograph compliments of KaiserAluminum Chemical & Sales Inc.)
13
V
construction may proceed independently of hull construction.
This allows the tanks to be fabricated in controlled environ-
ments more advantageous for their specific fabrication re-
quirements. A disadvantage in this design is the requirement
for heavy lift caoabilities to move and insert the tanks into
the hulls. Here, aluminum's light weight becomes especially
important.
In order to transport natural gas economically it must be
liquified. The liquid natural gas is loaded aboard ship at a
temperature of -165 0 C. This cryogenic temperature dictates
that the containment vessel be constructed of material with
sufficient low temperature toughness. Aluminum does not exhibit
.a ductile to brittle transition at low temperatures whereas
ferritic and martensitic steels do. In fact, the strenath of
aluminum actually is higher at low temperatures and there is
little loss in ductility in comparison to room temperature.
Because of the hazardous nature of this cargo, the Coast Guard
has imposed stringent code standards for weld quality. if a
weldment in a LNG tank is determined to be defective by X-ray
inspection it must be repaired. This weld repair consists of
grinding out the old weld and rewelding the defective section.
Frequently, multiple weld reoairs are required in certain areas
of a tank. It became apparent to the Coast Guard that their
insistence on weld quality and the resultant weld repairing
was subjecting the base retal in the tanks to severe temper-
ature cycles due to the repeated application of the heat of
weldinq. This problem then became the imnetus for research
in this area.
14
In the fall of 1978, Lt. George R. Speight Jr., USCG,
conducted research in the areas of microstructural and mechan-
ical properties of welded aluminum alloy 5803-0. He investi-
gated the effect of multiple weld repairs on strength, hardness
and stress corrosion cracking susceptibility. His results are
summarized in Ref. 2. In general, his conclusions were that
there is no oronounced effect on those properties, but a slight
tendency toward degradation in these properties was observed.
In narticular, Speight noted rather pronounced microstructural
effects in the heat affected zone of the base metal. Insoluble
inclusions of (Fe.Mn) 3 SiAl1 2 , and Mg 2Si (Ref. 3) appeared to
coarsen with increasing numbers of weld repairs. In the present
research, it was further noted that these coarsened inclusions
also became internally fractured. The effect of this inclusion
growth and fracturing on the fatigue resistance of weld reoaired
aluminum alloy 5083-0 was the subject of this thesis.
B. ALUMINtUM-MACNESIUM ALLOYS
The 5000 series aluminum-magnesium alloys are moderate in
strength, allowing fabrication into large structures without
excessive plate thickness and the attendant weight penalty.
Further, the density of the aluminum-magnesium alloys such as
5083-0 is only one-third that of stainless steel. Since the
strength of this alloy is aporoximately two-thirds that of
stainless steel a substantial weight savings is obtained.
Thus, aluminum alloys are prime candidates for lare
structures which require lifting such as "self-supoorting"
15
LNG containment systems. In addition, aluminum is relatively
low in cost and readily available.
The aluminum-magnesium alloys are non-heat treatable,
solid-solution type alloys known as the 5000 series. Magnes-
ium, whose atoms exist as substitutional solutes in the alumi-
num matrix, provides strengthening in this series.
The magnesium content in the 5000 series varies from 0.5
to 5.0 weight percent depending on the specific alloy. Alum-
inum alloy 5083-0 studied in this research, contains 4.0% to
4.9% magnesium as the primary alloy addition. Detailed alloy
chemistry and mechanical property data are given in Table I.
In the unwelded annealed condition, this alloy exhibits a
minimum yield strength of 18,000 PSI, a minimum ultimate tensile
strength of 40,000 PSI and 16% elongation in two inches. Maq-
nesium is an effective strengthening agent when used by itself
or in the presence of manganese. One may ask why not increase
the amount of magnesium present to further increase the strength?
'!any of the 5000 series alloys were developed for marine apoli-
cations which expose the material to rather severe corrosive
environments. Because of such apolications, care must be taken
to formulate alloys for corrosion and stress corrosion resist-
ance as well as strength.
Figure 2 illustrates the equilibrium binary phase diagram
for the aluminum-rich range of the aluminum-maqnesium system.
The actual phase diagrams for specific alloys are quite com-
olicated due to the oresence of numerous other elements added
to strengthen and stabilize the alloy. For the nurnose of this
16
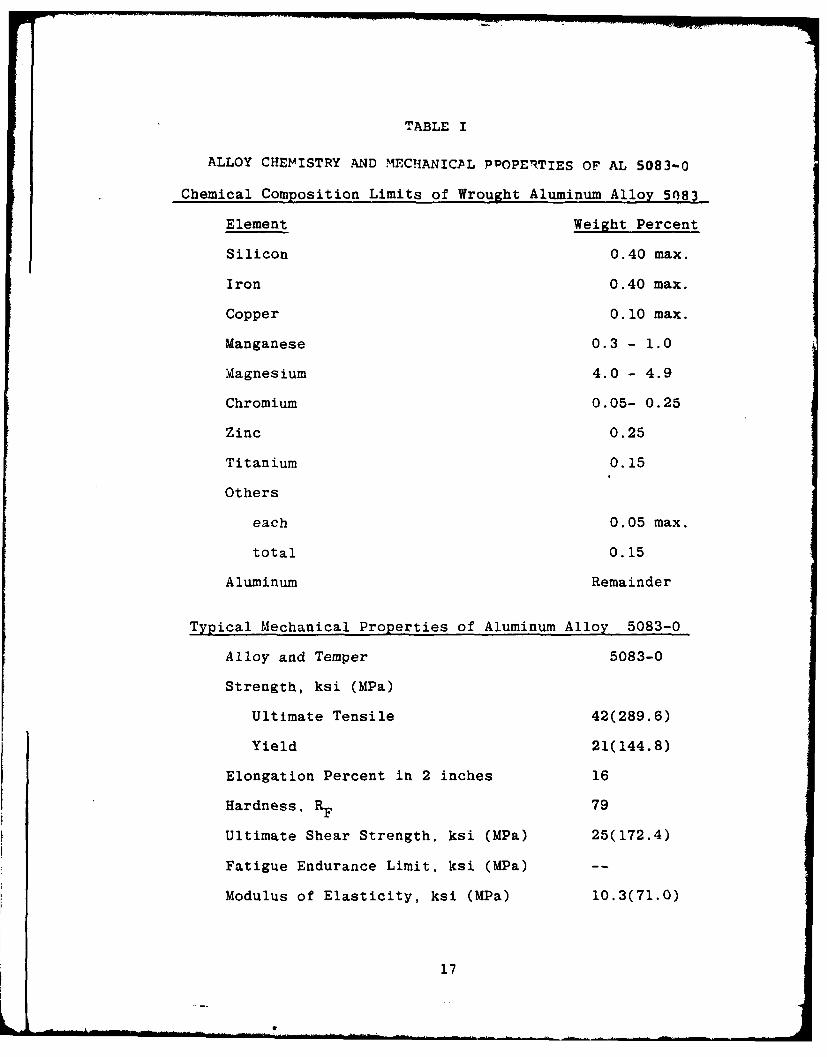
TABLE I
ALLOY CHEMISTRY AND MECHANICAL PPOPE7TIES OF AL 5083-0
Chemical Composition Limits of Wrought Aluminum Alloy 5083
Element Weight Percent
Silicon 0.40 max.
Iron 0.40 max.
Copper 0.10 max.
Manganese 0.3 - 1.0
Magnesium 4.0 - 4.9
Chromium 0.05- 0.25
Zinc 0.25
Titanium 0.15
Others
each 0.05 max.
total 0.15
Aluminum Remainder
Typical Mechanical Properties of Aluminum Alloy 5083-0
Alloy and Temper 5083-0
Strength, ksi (MPa)
Ultimate Tensile 42(289.6)
Yield 21(144.8)
Elongation Percent in 2 inches 16
Hardness, RF 79
Ultimate Shear Strength, ksi (MPa) 25(172.4)
Fatigue Endurance Limit, ksi (MPa) --
Modulus of Elasticity, ksi (MPa) 10.3(71.0)
17
discussion, however, the binary phase diagram will suffice.
Also shown in the same figure is a schematic representation
of a welded joint, showing peak temperatures experienced during
welding relative to the phase diagram. It is apparent from the
phase diagram that an alloy with 4.5% magnesium solid solution
is metastable at room temperature. Higher magnesium alloys be-
come more susceptible to uncontrolled orecipitation of the inter-
metallic #phase (Al3Mg2 ) during welding thermal cycles and
hence become sensitized to stress-corrosion. For this reason,
the magnesium content is restricted.
C. THERMAL CYCLES IN THE WELDING OF 5083 ALUMINUM
5083-0 aluminum is readily welded by any number of processes
-4_7. As witi any material however, a knowledge of metallur-
gical response of the material to repeated thermal cycles is
necessary to guarantee the integrity of the welded joint.
The aluminum LNG containment systems are fabricated utilizing
the gas-metal arc welding process, metal-inert gas techniaue
(MIG), as the primary joining method. During the welding process
the material is subjected to peak temperatures ranging up to the
liquidus (6600 C); the exact temperature depending on distance
from the weld /757. Figure 2 shows the temperature attained
at various positions in the base metal and the associated location
in the phase diagram. As is evident from this figure, areas of
the welded plate experience temperatures representing each of the
equilibrium phase regions for this alloy.
18
(1696)
700
LIU (8484)
4001 W0-30mm(636)
(424)
0 4 8 12 16 20 24 28 32
WEIGHT PERCENT MAGNESIUM
Figure 2. This figure represents the aluminum-magnesiumbinary equilibrium phase diagram. The definedvertical region is the percentage range ofmagnesium found in the 5083-0 alloy. The schematicof the welded joint is introduced to give thereader a general idea of the peak temperaturesexperienced at various distances from the weldinterface relative to the phase diagram.
19
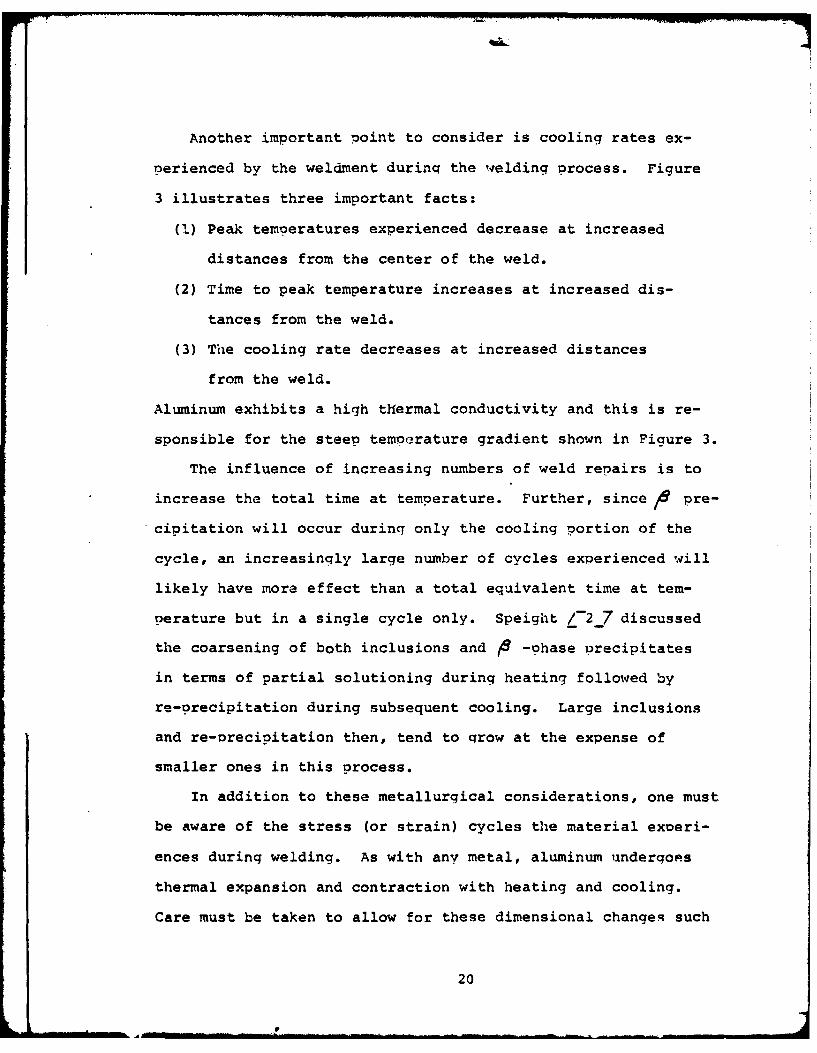
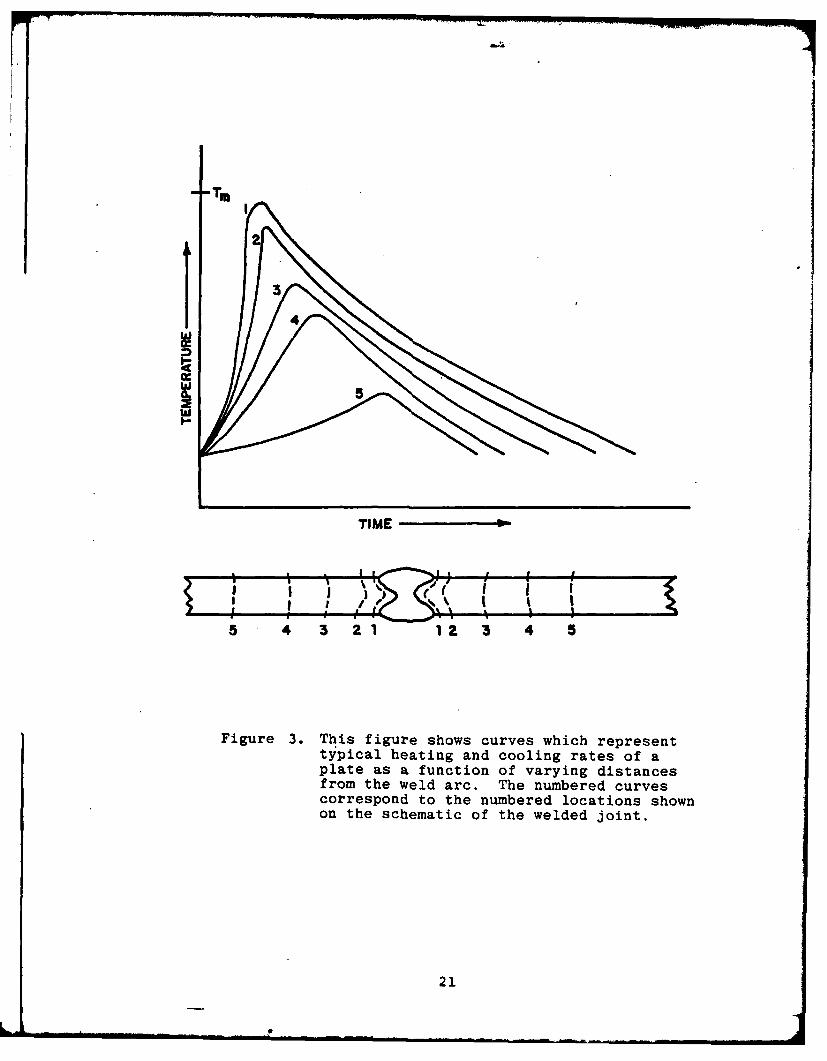
Another important point to consider is cooling rates ex-
perienced by the weldment durinq the welding process. Figure
3 illustrates three important facts:
(1) Peak temperatures experienced decrease at increased
distances from the center of the weld.
(2) Time to peak temperature increases at increased dis-
tances from the weld.
(3) The cooling rate decreases at increased distances
from the weld.
Aluminum exhibits a high thermal conductivity and this is re-
sponsible for the steep temperature gradient shown in Figure 3.
The influence of increasing numbers of weld repairs is to
increase the total time at temperature. Further, since pre-
cipitation will occur during only the cooling portion of the
cycle, an increasingly large number of cycles experienced will
likely have more effect than a total equivalent time at tem-
perature but in a single cycle only. Speight /-2-7 discussed
the coarsening of both inclusions and 1 -phase precipitates
in terms of partial solutioning during heating followed by
re-precipitation during subsequent cooling. Large inclusions
and re-orecinitation then, tend to grow at the expense of
smaller ones in this process.
In addition to these metallurgical considerations, one must
be aware of the stress (or strain) cycles the material experi-
ences during welding. As with any metal, aluminum undergoes
thermal expansion and contraction with heating and cooling.
Care must be taken to allow for these dimensional changes such
20
if
44
TIME
5 4 3 2 1 1 a 3 4 5
Figure 3. This figure shows curves which representtypical heating and cooling rates of aplate as a function of varying distancesfrom the weld arc. The numbered curvescorrespond to the numbered locations shownon the schematic of the welded joint.
21
that the material is not overly constrained. Excessive me-
chanical constraint may lead to large amounts of Plastic de-
formation and even fracture of the weld metal.
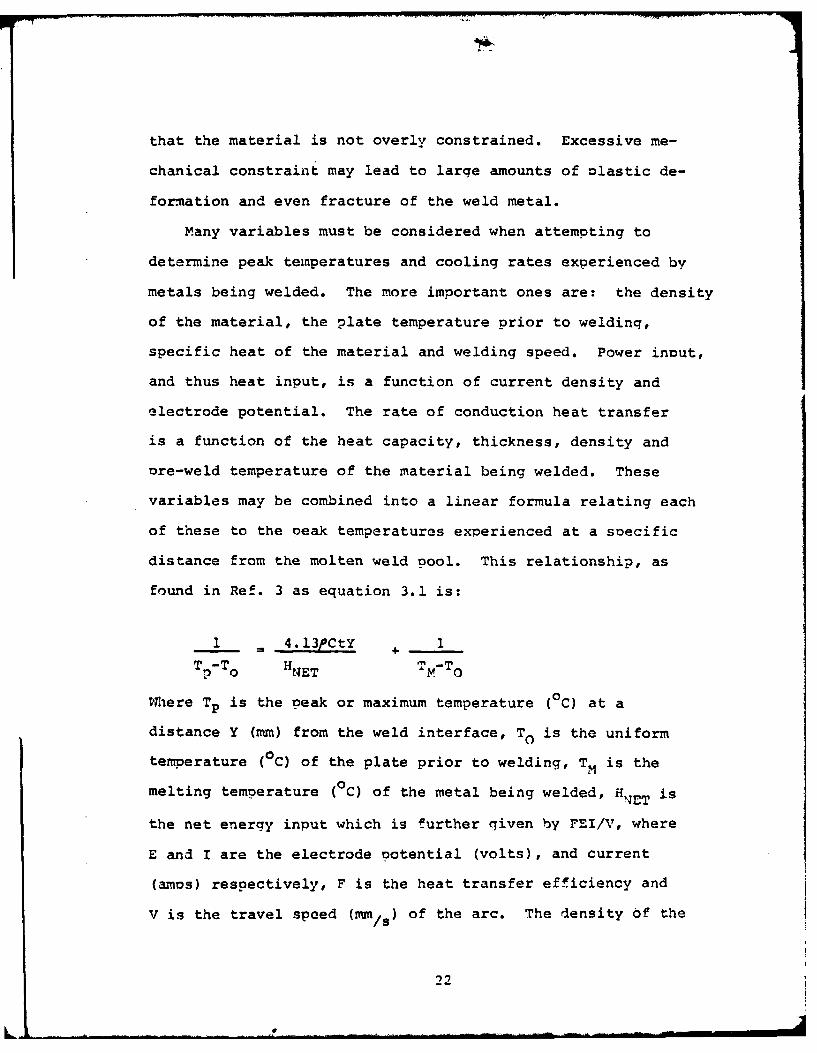
Many variables must be considered when attempting to
determine peak temperatures and cooling rates experienced by
metals being welded. The more important ones are: the density
of the material, the plate temperature prior to welding,
specific heat of the material and welding speed. Power input,
and thus heat input, is a function of current density and
electrode potential. The rate of conduction heat transfer
is a function of the heat capacity, thickness, density and
ore-weld temperature of the material being welded. These
variables may be combined into a linear formula relating each
of these to the Peak temperatures experienced at a soecific
distance from the molten weld pool. This relationship, as
found in Ref. 3 as equation 3.1 is:
1 = 4.13PCtY + 1T -T H -T
P ~ NET M' 0
Where Tp is the peak or maximum temperature (0C) at a
distance Y (mm) from the weld interface, T0 is the uniform
temperature (0C) of the plate prior to welding, TM is the
melting temperature ( C) of the metal being welded, H ET is
the net energy input which is further given by FEI/V, where
E and I are the electrode Potential (volts), and current
(azms) respectively, F is the heat transfer efficiency and
V is the travel speed (mm/s) of the arc. The density of the
22
L.
material being welded (g/ mm3) is P , C is the specific heat
of the solid metal being welded (J/ o ), and t is the thick-
ness of the plate being welded (mm).
D. FATIGUE
Fatigue is a fracture mechanism where failure doesn't
occur when the component is initially loaded; instead failure
occurs after a number of load fluctuations have been experi-
enced. Normally, failure begins with initiation of a small
microcrack at the surface which then grows across a section,
by incrementally increasing in length with each loading cycle,
eventually leading to final fracture.
A macroscopic examination of fatigue fracture surface gen-
erally reveals a flat fracture surface. This indicates an
absence of any appreciable amount of gross (macroscopic) plastic
deformation during fatigue /-6-7. Often, when failure occurs
over a lonq period of time, the fracture surface contains "beach
markings". These lines can be attributed to different periods
of crack extension.
In testing for fatigue, scatter in test results is common.
There are numerous reasons for this scatter /87. They in-
clude variations in testing environment, preparation on speci-
men surfaces, alignment of the test machine and a number of
metallurgical variables. All data from this study was analyzed
by regression analysis.
The fatigue behavior of nonferrous alloys is characterized
by the lack of a "fatigue limit". A fatigue limit is the stress
23
0
value on an S-N diagram below which failure does not occur.
The S-N diagram is a plot of fatigue stress plotted versus
number of cycles to failure. Therefore, the "fatigue limit"
for aluminum alloys has to be arbitrarily defined as some spe-
cific cyclic life usually ten million cycles.
Fatigue behavior is sensitive to alloy chemistry. Large
inclusions can serve as potential crack nucleation sites and
are therefore undesirable. Fatigue crack nucleation models
generally describe the process as follows: /-7-7
(1) As a result of plastic straining, slip is produced.
(2) Slip bands of highly localized deformation are generated.
(3) At the surface, extrusions appear which penetrate along
the length of the slip band and become sharp fissures.
(4) The fissure breaks through the matrix and a crack is
formed.
In general fatigue can commonly be divided into the crack
initiation period and the crack growth period. The concern of
this research was to determine if the large, cracked inclusions
developed in the HAZ of the base metal due to multiple weld re-
pairs, would provide the crack initiation site. If this were
the case, the crack initiation phase would have been skipped.
24
II. OBJECTIVES, PLAN4S AND PROCEDUPS
A. OBJECTIVE
Multiple weld repairs are often required in certain areas
of LNG tanks during their construction. The objective of this
research was to simulate and then characterize the effect of
multiple weld repairs on welded joints made in 5083-0 aluminum.
In particular, this thesis studies the effect of these weld re-
pairs on the fatigue resistance of the welded alloy 5083-0.
B. PLAN OF APPROACH
To meet the objectives outlined above, this research was
conducted in three parts:
(1) Effects of multiDle weld repairs on microstructure.
(2) Effect of multiple weld repairs on fatigue resistance.
(3) Fractography of failed samples.
The procedures followed, results and conclusions derived
in each of these parts will be discussed in the remainder of
this thesis.
C. SOURCE OF MATERIALS
Although this information is contained in Lt. G.R. Speight's
work /_2_7 it is added here to enhance the reader's understand-
ing of the experiment. The weldments used in this investigation
were obtained from the Kaiser Aluminum And Chemicals Inc.,
Center For Technology, Pleasonton, California. The simulation
of multiple weld reoairs was performed under laboratory con-
ditions to oreclude the introduction of additional variables.
25
kv
So that a proner correlation could be made between these tests
and actual structures it was, however, desirable to duplicate
industrial welding practice and materials as closely as nossible.
Thus it was necessary to acquire raterial of the proper alloy
and temper. Due to cost constraints and material availability,
5093 aluminum alloy in the H-321 temper (cold worked rather than
annealed) was purchased. This material was then annealed to
oroduce to "0" temper; this anneal consisted of a controlled
heating to 454 0 C, followed by a two hour soak at temperature
and a controlled furnace cool-down cycle. The welding, or filler,
wire used in fabrication of the test plates was of 5183 type,
identical to that used in the fabrication of the LNG tanks.
D. PROCEDURES
The various procedures used in this study approximate stand-
ard industrial practices and tests as closely as possible. De-
tails regarding specimen preparation and the individual tests
are discussed in the following sections.
1. Welding Of The Test Plates
The plates to be welded were all cut from the same
rolled plate. Each plate was cut so that its greatest dimension
was oriented in the direction of rolling. The plates to be
welded measured approximately 254 x 610 x 12.7 millimeters (10 x
24 x 0.5 inches). The plates were then annealed as described
above to the "0" temper. All plates were then degreased with
acetone. A 30° bevel weld preparation was machined on one side
of each plate as shown in Figure 4(a). After the plates were
welded on one side in the flat (down-hand) position they were
26
.6 In (0.25 in)
YLScm (5 n
Figure 4 (a)
Figure 4 (b)
.47 TO.63cm (.19 TO 0.25 In)
Figure 4 (c)
Figure 4 . (a) This figure represents the joint preparationperformed prior to laying the first "downhand" or"flat" weld bead. After the first pass the plateis allowed to cool to a specified interpass temper-ature of 660 C (150 0 F) or less. The reverse side isbackmilled to a minimum depth of 4.8 mm (3/16 inch)and then welded in the "flat" position.
(b) The overlapping roots of the two passes.
(c) The subsequent repair welds are made by groovingas shown, cooling to the temperature indicated above,and welding. The repair welds are made in a "flat"mode by changing plate sides with each single passrepair.
27
turned over, backmilled (included angle of 600) and again
welded in the flat position, Pigure 4(b). A total of nine
plates were welded in this fashion. One of the nine plates was
set aside as a control sample, i.e., no weld repair. The re-
maining eight plates were subjected to weld repair simulations.
Each repair simulation was performed by welding after remachin-
inq as shown in Figure 4(c). The first of the remaining eight
plates was subjected to this repair simulation twice, first on
one side then on the other with each weld being oerformed in
the flat position. The second plate underwent four repair
simulations (two repairs on each side). Plates three through
eight underwent a progression of six through sixteen repair
simulations, respectively, with an erual number of weld reoairs
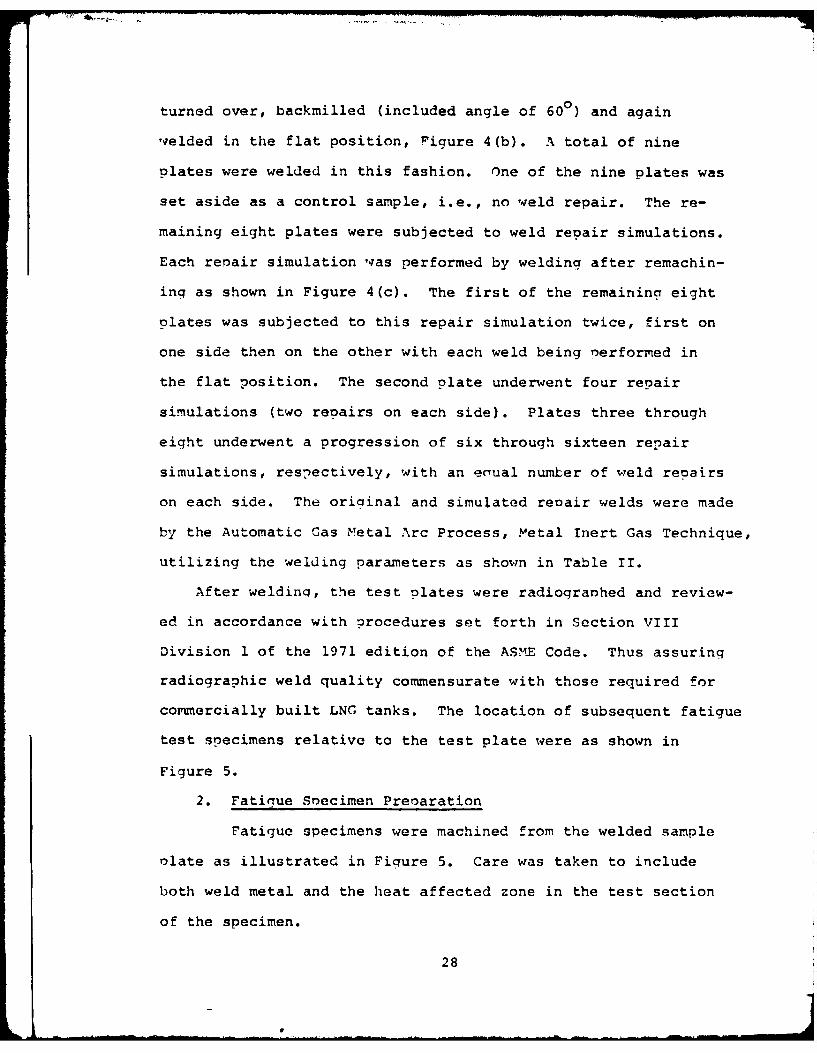
on each side. The oriainal and simulated reoair welds were made
by the Automatic Gas Metal Arc Process, Metal Inert Gas Technique,
utilizing the welding parameters as shown in Table II.
After welding, the test plates were radiogranhed and review-
ed in accordance with procedures set forth in Section VIII
Division 1 of the 1971 edition of the ASME Code. Thus assuring
radiographic weld quality commensurate with those required for
commercially built LNG tanks. The location of subsequent fatigue
test specimens relative to the test plate were as shown in
Figure 5.
2. Fatimue Soecimen Prenaration
Fatigue specimens were machined from the welded sample
olate as illustrated in Figure 5. Care was taken to include
both weld metal and the heat affected zone in the test section
of the specimen.
28
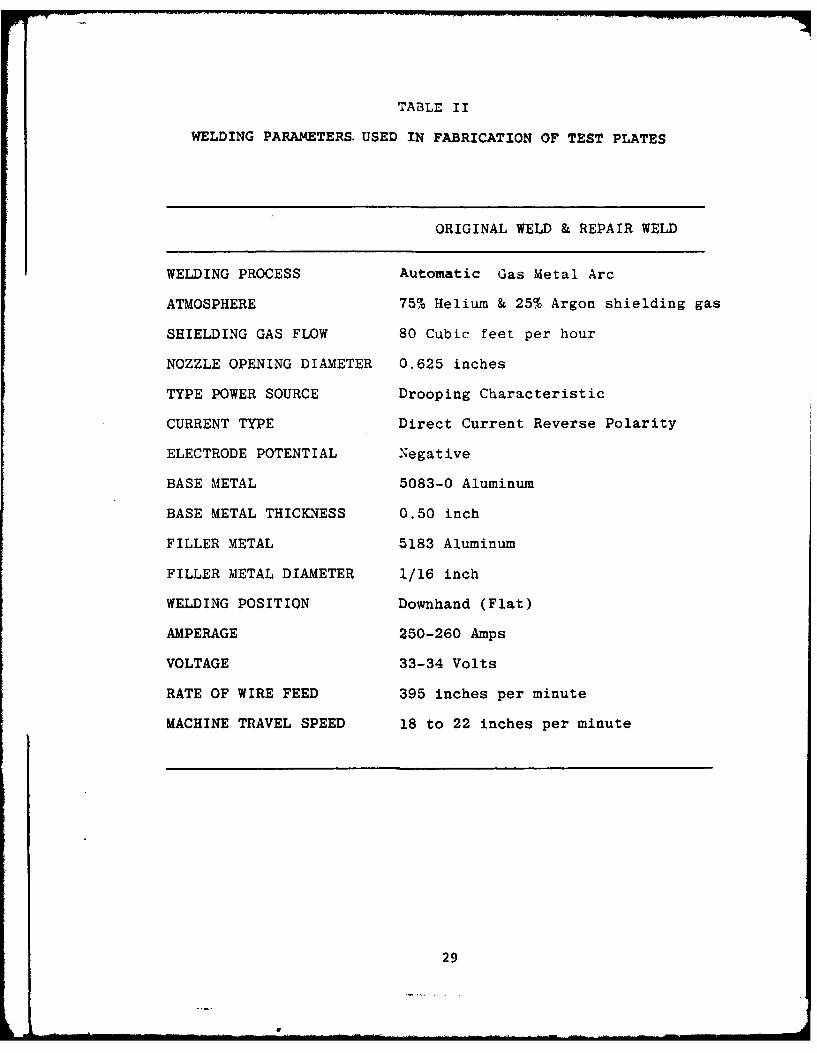
TABLE II
WELDING PARAMETERS. USED IN FABRICATION OF TEST PLATES
ORIGINAL WELD & REPAIR WELD
WELDING PROCESS Automatic Gas Metal Arc
ATMOSPHERE 75% Helium & 25% Argon shielding gas
SHIELDING GAS FLOW 80 Cubic feet per hour
NOZZLE OPENING DIAMETER 0.625 inches
TYPE POWER SOURCE Drooping Characteristic
CURRENT TYPE Direct Current Reverse Polarity
ELECTRODE POTENTIAL Negative
BASE METAL 5083-0 Aluminum
BASE METAL THICKNESS 0.50 inch
FILLER METAL 5183 Aluminum
FILLER METAL DIAMETER 1/16 inch
WELDING POSITION Downhand (Flat)
AMPERAGE 250-260 Amps
VOLTAGE 33-34 Volts
RATE OF WIRE FEED 395 inches per minute
MACHINE TRAVEL SPEED 18 to 22 inches per minute
29
WELD
SPECIMEN ORIENTATIONricqure 5. Schematic representingr the orientation of the
sample in the welded Plate. Roth the weldmetal and heat affected zone are included inthe test section of the snecirnen.
30
.. L.
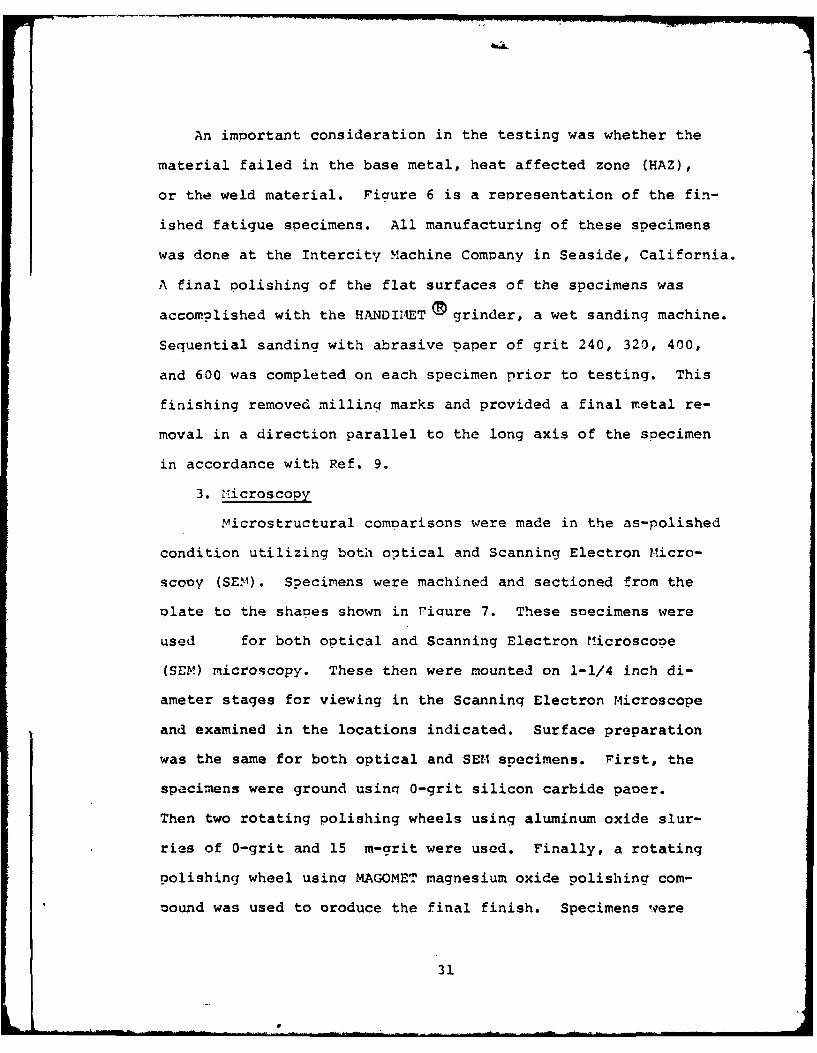
An important consideration in the testing was whether the
material failed in the base metal, heat affected zone (HAZ),
or the weld material. Fiaure 6 is a representation of the fin-
ished fatigue specimens. All manufacturing of these specimens
was done at the Intercity Machine Company in Seaside, California.
A final polishing of the flat surfaces of the specimens was
accomplished with the HANDIMETO grinder, a wet sanding machine.
Sequential sanding with abrasive paper of grit 240, 320, 400,
and 600 was completed on each specimen prior to testing. This
finishing removed milling marks and provided a final metal re-
moval in a direction parallel to the long axis of the specimen
in accordance with Ref. 9.
3. Microscopy
Microstructural comparisons were made in the as-polished
condition utilizing both optical and Scanning Electron Micro-
scony (SEk). Specimens were machined and sectioned from the
plate to the shapes shown in Piqure 7. These soecimens were
used for both optical and Scanning Electron Microscope
(SEM) microscopy. These then were mounted on 1-1/4 inch di-
ameter stages for viewing in the Scanninq Electron Microscope
and examined in the locations indicated. Surface preparation
was the same for both optical and SEM specimens. rirst, the
specimens were ground usinq 0-grit silicon carbide paper.
Then two rotating polishing wheels using aluminum oxide slur-
ries of 0-grit and 15 m-grit were used. Finally, a rotating
polishing wheel using MAGOMET magnesium oxide polishing com-
oound was used to oroduce the final finish. Specimens were
31
L •
'-4j
4-)
4-).
IL
co NU)
oa)ei"' U) C)
4J
uLJ
L-4 0)
(f1 >. -
0
323
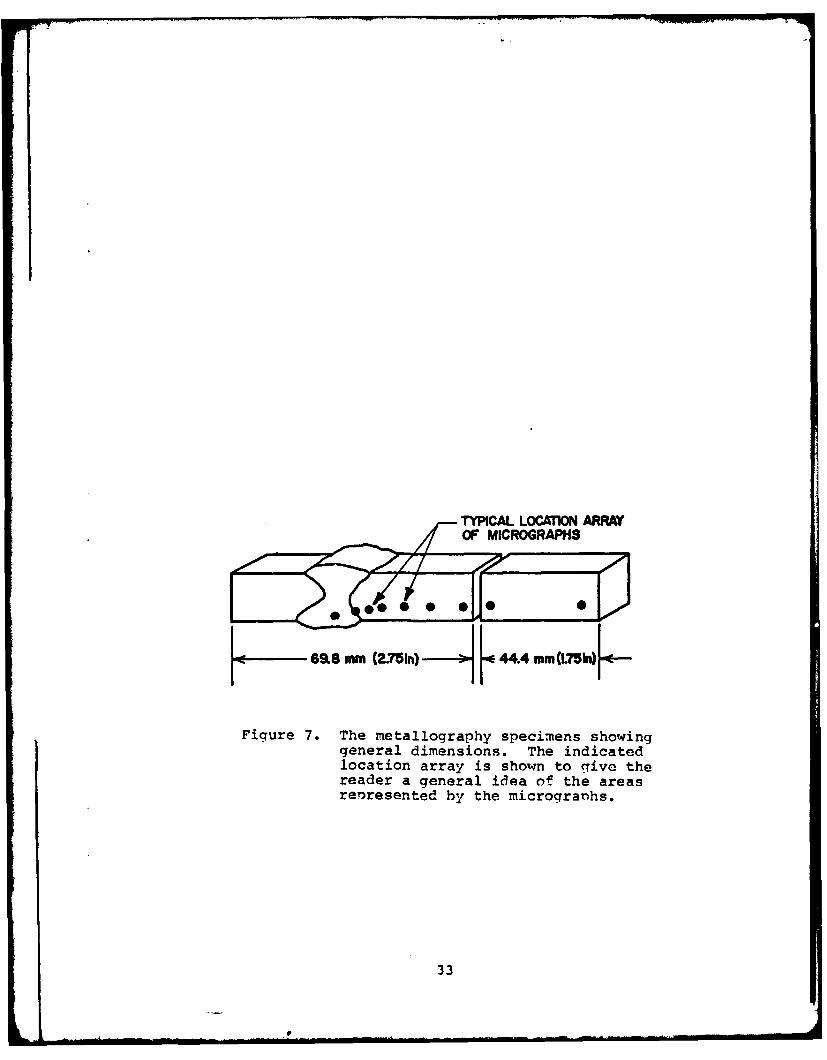
618 mm C2.TS1n) [44.4 mm(L75t)-
Figure 7. The metallography specimens showinggeneral dimensions. The indicatedlocation array is shown to grive thereader a general idea of the areasrenresented by the microgranhs.
33
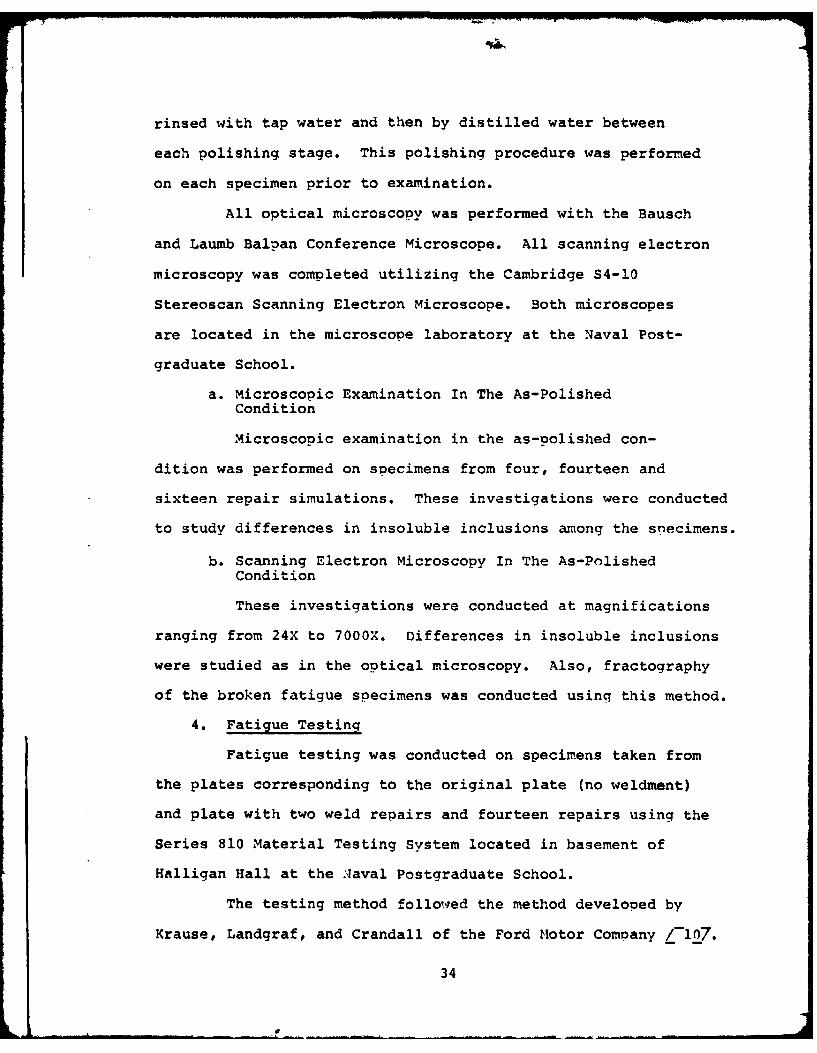
rinsed with tap water and then by distilled water between
each polishing stage. This polishing procedure was performed
on each specimen prior to examination.
All optical microscopy was performed with the Bausch
and Laumb Balnan Conference Microscope. All scanning electron
microscopy was completed utilizing the Cambridge S4-10
Stereoscan Scanning Electron Microscope. Both microscopes
are located in the microscope laboratory at the Naval Post-
graduate School.
a. Microscopic Examination In The As-PolishedCondition
Microscopic examination in the as-polished con-
dition was performed on specimens from four, fourteen and
sixteen repair simulations. These investigations were conducted
to study differences in insoluble inclusions among the specimens.
b. Scanning Electron Microscopy In The As-PolishedCondition
These investigations were conducted at magnifications
ranging from 24X to 7000X. Differences in insoluble inclusions
were studied as in the optical microscopy. Also, fractography
of the broken fatigue specimens was conducted using this method.
4. Fatigue Testing
Fatigue testing was conducted on specimens taken from
the plates corresponding to the original plate (no weldment)
and plate with two weld repairs and fourteen repairs using the
Series 810 Material Testing System located in basement of
Halligan Hall at the Aaval Postgraduate School.
The testing method followed the method developed by
Krause, Landgraf, and Crandall of the Ford Motor Company /-0l7.
34
In general it is a method to test thin guage soecimens in
fatigue. Because of the danger of buckling with fully re-
versible loading, a haversine tension-tension loading was em-
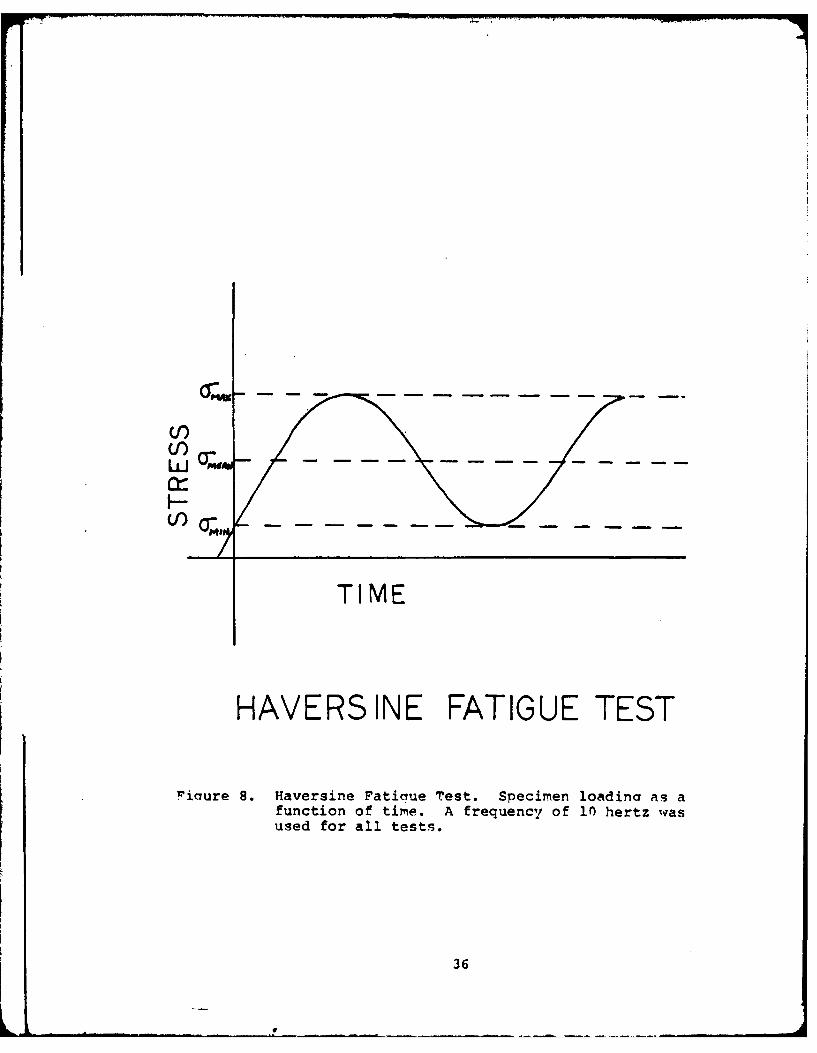
ployed. Figure 8 is a representation of the loading curve
used in this thesis. A frequency of ten Hz was used for all
tests.
The stress ratio, R, is the algebraic ratio of the
minimum stress to the maximum stress. For comparability of
results the stress ratio was maintained at P = .11 for all
testz3 /-117.
35
TI ME
HAVERS INE FATIGUE TEST
r'iaure 8. Haversine Fatique Test. Specim~en loadina as afunction of tim'e. A frequency of inl hertz wasused for all tests.
36
-L.
III RESULTS AND DISCUSSION
Lt. G.R. Speight's research in this area disclosed that
the insoluble inclusions (Fen)3 SiAl1 2 and M1g 2Si grew and
coarsened with increasing numbers of weld repairs /_2 7.
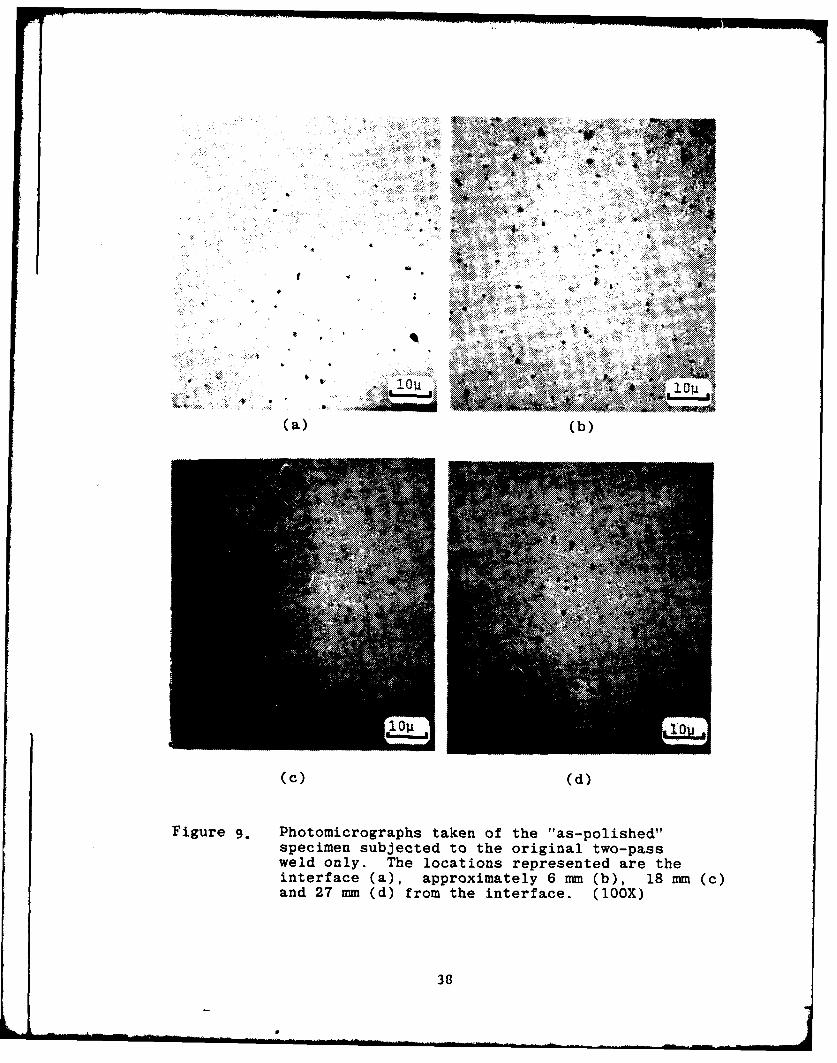
Figures 9 and 10 illustrate this coarsening. Figure 9 shows
micrographs of an as-polished specimen subjected to the origi-
nal two-pass weld only. Figure 10 shows micrographs of an
as-polished specimen subjected to sixteen repair simulations.
This coarsening had little apparent effect on tensile strength,
stress corrosion cracking susceptibility and hardness, although,
as noted previously, there was a slight tendency toward de-
gradation in these properties.
The concern then focused on the effect of this coarsening
and growth of the inclusions on the fatigue life of the welded
and weld repaired alloy aluminum 5083-0. In 5083 aluminum weld-
ments fatigue failure normally occurs in the weld filler
material due to the presence of porosity and inclusions as a
result of welding.
A. MICROSTRUCTURAL ANALYSIS
Microstructural examination was performed in the as-
polished condition. Specific metallogranhic procedures were
discussed in Section II.D. The results of such examination
are given in the following paragraphs.
37
i '. K ::; :i;i ' ;
4 ".*4 :
,t... .. ... ..
Ca) (b)
(c) (d)
Figure 9. Photomicrographs taken of the "as-polished"specimen subjected to the original two-passweld only. The locations represented are theinterface (a), approximately 6 mm (b), 18 mm (c)and 2.7 mm (d) from the interface. (lOOX)
38
4 IC
. * : .. . .
(a) (b)
(c (d)
Figure 10. Photographs taken of the "as-polished"specimen subjected to 16 repair simulations. Thelocations represented are the interface (a),approximately 6 mm (b), 18 mm (c) and 27 mm (d)from the interface. (lOOX)
39
(1) Optical Microscopic Examination In The As-PolishedCondition.
Summarized in Section II above. Figures 9 and 10illustrate the microstructure.
(2) SEM Examination In The As-Polished Condition.
Closer examination was necessary to determine the effects
of increasing numbers of weld repairs on the inclusions.
Figure 11(a) shows a twice weld repaired specimen. Fig-
ure 11(b) was taken of a fourteen weld repaired sample.
Note how the inclusions have broken up and although not
evident in this figure, generally the included oarti-
cles coarsened. Figure 11(c) is a photograph of an in-
clusion in a fourteen weld repaired sample at a mag-
nification of 7000X. Note that cracks are clearly
evident in the inclusion. This then was the question:
Given the coarsening and cracking of insoluble inclusions
in the HAZ, would these inclusions serve as crack
initiation sites and l3ad to a change in the fracture
location from the weld metal to the HAZ, resulting in
a reduction of fatigue life.
B. FATIGUE PESULTS
Fatigue testing was performed to determine fatigue strength
as a function of number of weld repair simulations. Graphical
representation of fatigue data are shown in Figures 12 through
15. Also, the fatigue data are tabulated in Table II. The
results of the fatigue tests are discussed below.
Fatigue testing was performed on snecimens from the oricinal
plate, a twice weld repaired plate and a fourteen weld repaired
40
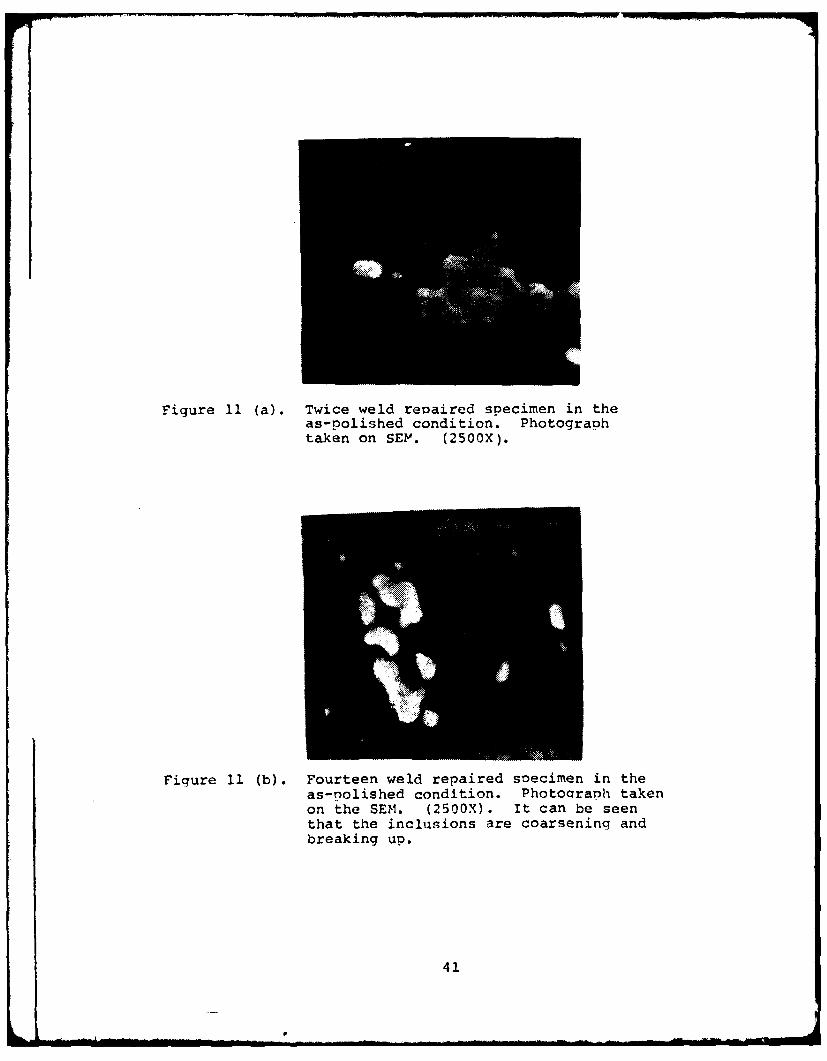
Figure 11 (a). Twice weld repaired specimen in theas-polished condition. Photographtaken on SEY. (2500X).
Figure 11 (b). Fourteen weld repaired soecimen in theas-nolished condition. Photooranh takenon the SEM. (2500X). It can be seenthat the inclusions are coarsening andbreaking up.
41
Fiqure 11 (c). Fourteen weld repaired specimen in theas-polished condition. Photograoh takenon the SEM. (7000X). Cracks have de-veloped in the inclusions.
42
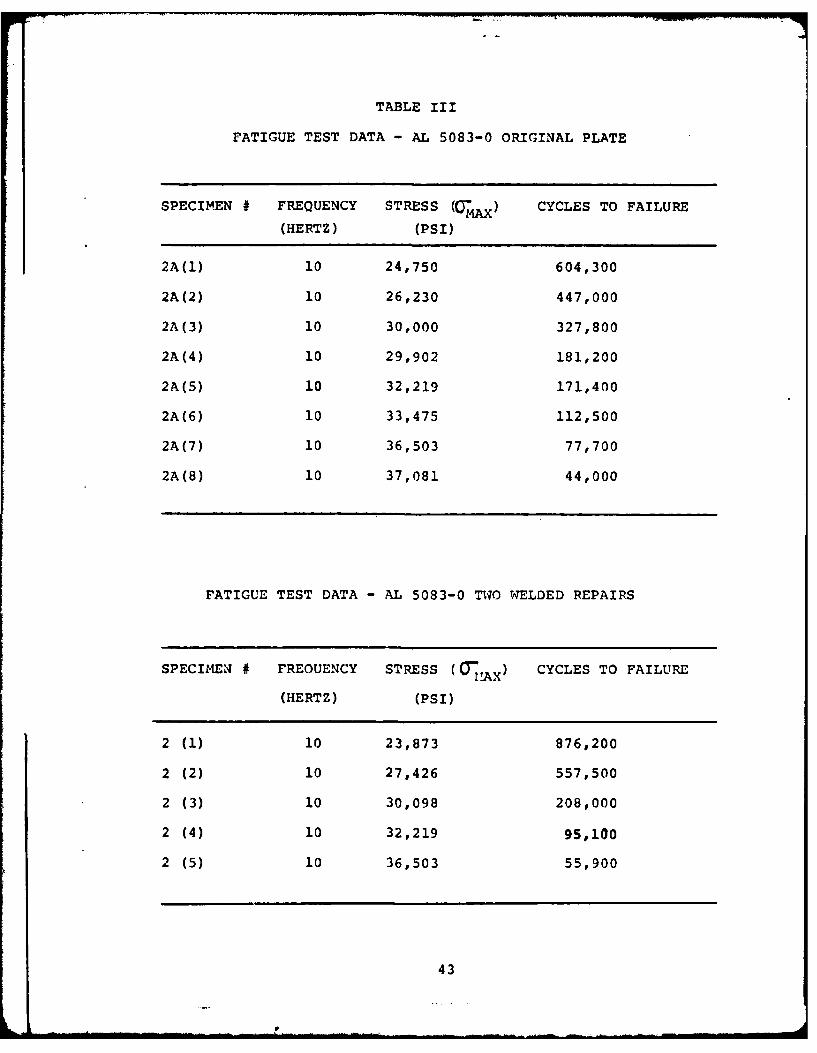
TABLE III
FATIGUE TEST DATA - AL 5083-0 ORIGINAL PLATE
SPECIMEN # FREQUENCY STRESS (0MA) CYCLES TO FAILURE
(HERTZ) (PSI)
2A(1) 10 24,750 604,300
2A(2) 10 26,230 447,000
2A(3) 10 30,000 327,800
2A(4) 10 29,902 181,200
2A(5) 10 32,219 171,400
2A(6) 10 33,475 112,500
2A(7) 10 36,503 77,700
2A(8) 10 37,081 44,000
FATIGUE TEST DATA - AL 5083-0 TWO WELDED REPAIRS
SPECIMEN # FREOUENCY STRESS (0r ) CYCLES TO FAILUREIL!AX
(HERTZ) (PSI)
2 (1) 10 23,873 876,200
2 (2) 10 27,426 557,500
2 (3) 10 30,098 208,000
2 (4) 10 32,219 95,100
2 (5) 10 36,503 55,900
43
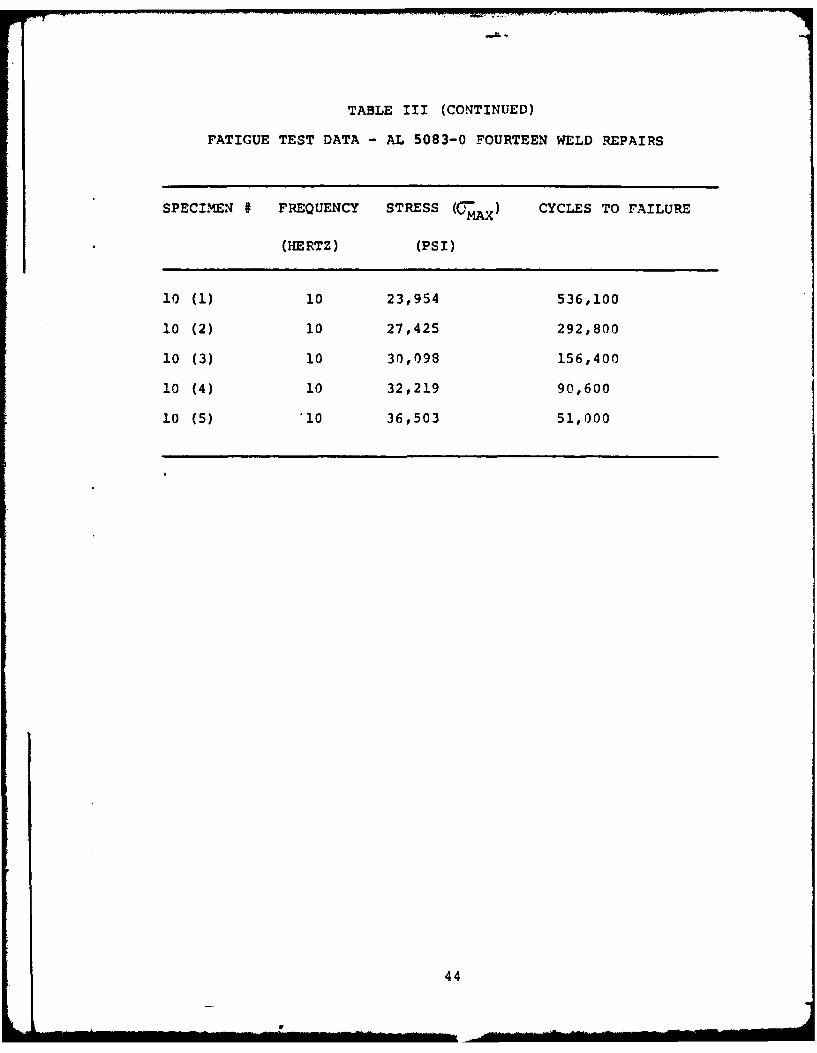
TABLE III (CONTINUED)
FATIGUE TEST DATA - AL 5083-0 FOURTEEN WELD REPAIRS
SPECIMEN # FREQUENCY STRESS (CMAX) CYCLES TO FAILURE
(HERTZ) (PSI)
10 (1) 10 23,954 536,100
10 (2) 10 27,425 292,800
10 (3) 10 30,098 156,400
10 (4) 10 32,219 90,600
10 (5) 10 36,503 51,000
44
Plate. In Figures 12 through 15 a least squared regression
analysis was used to produce the straiaht lines through the
data points.
Figure 15 is a comparative graph which shows the relation
of the three fatigue curves (original olate, two repairs,
fourteen repairs). There is only a slight difference between
the results of these tests, however there appears to be a
slight decrease in the fatigue resistance of the fourteen weld
repaired sample as compared to the original plate and the
twice-repaired plate. It should also be noted that for maxi-
mum stresses above about 27000 PSI (186 MPA) the twice weld-
repaired specimen appears to be stronger than the original
olate, possibly due to scatter in the data.
It is most significant that all the weld-repaired samples
failed in the weld area. This answers the question posed in
Section III above. The fatigue crack initiation remained in
the weld area. It did not shift into the HAZ as a result of
coarsening and cracking of inclusions, induced by increasina
numbers of weld repairs. This also explains the similarity
between the S-N curves in Figure 15. Since the failure occurs
in the weld it makes little if any difference how many times
the material is weld repaired. Additionally, the similarity
in the properties of the filler metal to that of the original
Plate explains the close correlation of the original olate
fatique data to the welded plate data for the conditions tested.
45
UA
Ydi SSU~ISo 0 0OI') N WO9
a- - z - 41
- C0 0
9- 9 ( 0
4
to 0g
0 Ii
0) 0 0~~ Cr 412
o m>~xkC) t
0 4 .4 4
.) CA .0 'a 0~
04 o141
fn rn'--
I SciC+ 3NI SH3AVH .D) S8±S
46
VdvI SS3NIS
0)
P-4 4 J 10
P0
.0 -.4
U,
o .~-4 Z. 0 C.)
X 1 0 14
I oe
0~~J aiL 0)r.4
0 it 0
14 C -4
-.- 0 P4
'a .0 i
x
41 t
tv U 0I i 1.L4 -4 NJ~
474
3tw
o~ 0oV
o to
-J % p.4 -1
D 0 > 0h
a U2 J4j
0 to X -,
to "4>rz -A 4
0 V~ V )
H-c > -ri
1S)-q) -'4 -4
z0_ 0> r.
0 0 00C0
0~L 0 08 r-4
4
In In N 0 ~c. x- 0
l~dC+3NlSU3A0 * "4S3J
48 S "
Yd~V4 SS381JS 0
0 0 i
CM C%40 4r-4 0. 0
p- 00
< -r4 r4 > -4
0 I 0 0
Ul~~ 0 14 00 ~0 LA z 0 .- I
0 0 -
0~ 4-1
0J a.4 0~
q~~ Z 1 - 41-OD; 0 0
* ~- LL 0 3
00 ~ 000 0~ 0 ~L
4j 0 -. I43
S i b44 00 4 003 No
14 0101 9
.. 043
IV E 04 w
0 $4 o) 00~~~ 0 10
0 v-
0 0 0 0 0.0 0 0~.
L Sd (+ N! S)J3AYH'xv!0) s s
49
C. SCANNING ELECTRON MICROSCOPE FRACTOGRAPHY
Scanning electron microscopy was used to study the fatigue
fractures. Figure 16 is fractograph of the fracture surface
of a twice weld-repaired specimen. The fatigue failure seems
to proceed outward from porosity. This porosity is then the
failure initiation site. Figure 17 illustrates the ductile
nature of the overlaod; a classic dimple pattern is apparent
on the surface.
Figures 18 and 19 illustrate a fatigue failure in an un-
welded specimen. The fatigue crack aparently initiated in
the upper right hand corner of the sample and oroceeded in-
ward rapidly. Fatigue beach marks are clearly evident running
from the upper left to the lower right hand corner of the photo-
graohs.
Figure 20 illustrates the transverse section of the frac-
ture surface on an unwelded sample. Figure 21, on the other
hand, shows a similar transverse section of a fourteen weld
repaired sample. Note that porosity is evident near the
fracture surface in the weld-repaired sample. It appears
that final fracture links several Pores in the weld filler
material. (Figure 20).
Figure 22 is the entire fracture surface of a fourteen
weld-repaired sample. A large ductile overload zone and
norosity on this surface are evident.
The fatigue test results and 'ractoqraphy reported here
represent testing conducted under high-stress conditions.
Extension of this data to lower stresses (and longer life-
times) was not conducted due to time constraints. There still
50
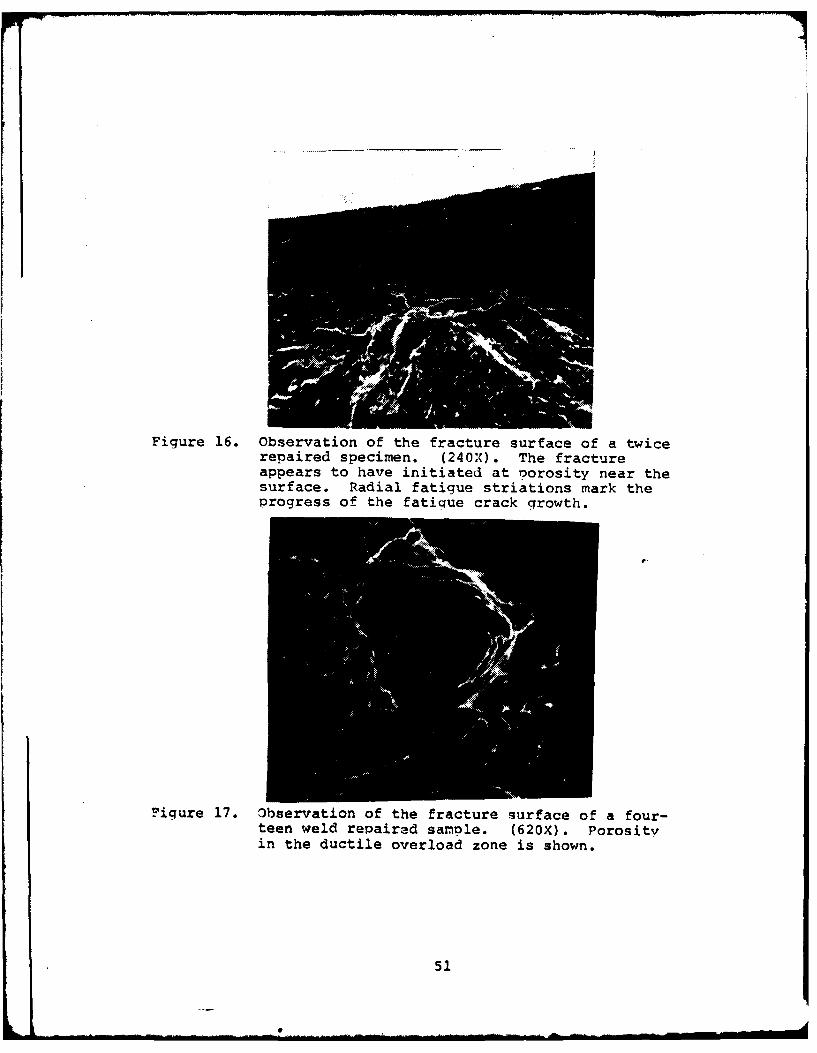
Figure 16. Observation of the fracture surface of a twicerepaired specimen. (240X). The fractureappears to have initiated at norosity near thesurface. Radial fatigue striations mark theprogress of the fatigue crack growth.
Figure 17. Observation of the fracture surface of a four-teen weld repaired samDle. (620X). Porosityin the ductile overload zone is shown.
51
l . ..... . . . f a M I
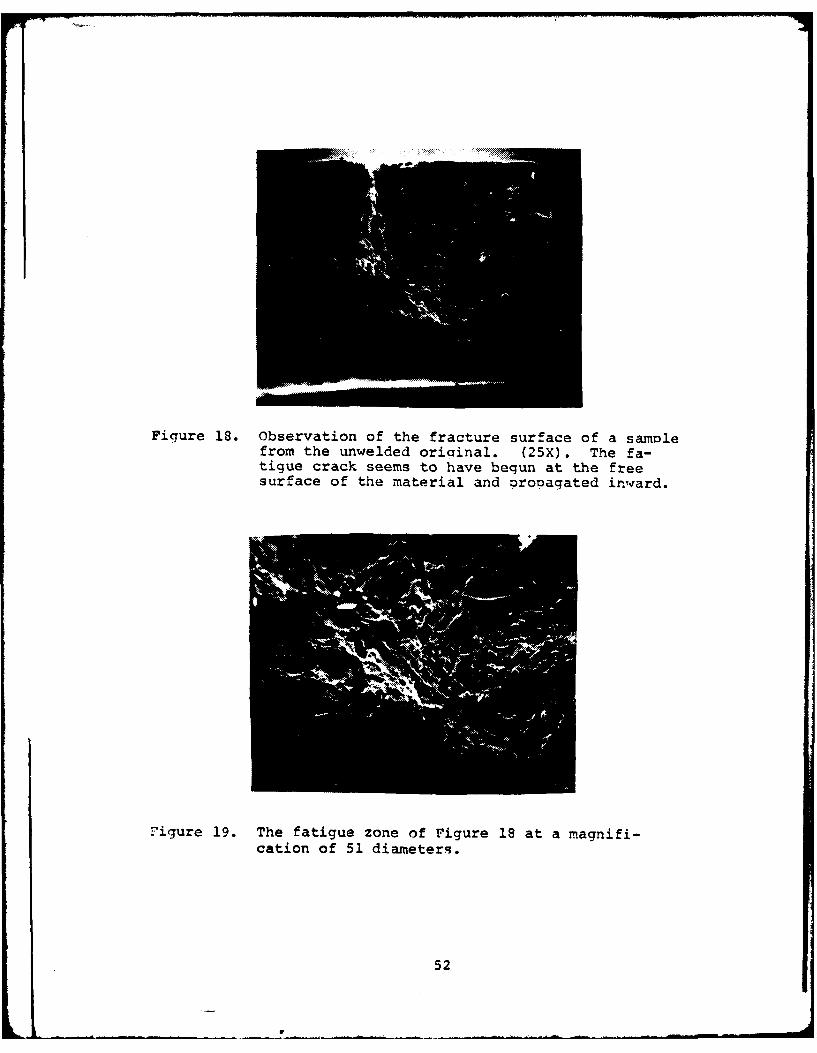
Figure 18. Observation of the fracture surface of a samolefrom the unwelded oriainal. (25X). The fa-tigue crack seems to have begun at the freesurface of the material and propagated inward.
Figure 19. The fatigue zone of Figure 18 at a magnifi-cation of 51 diameters.
52
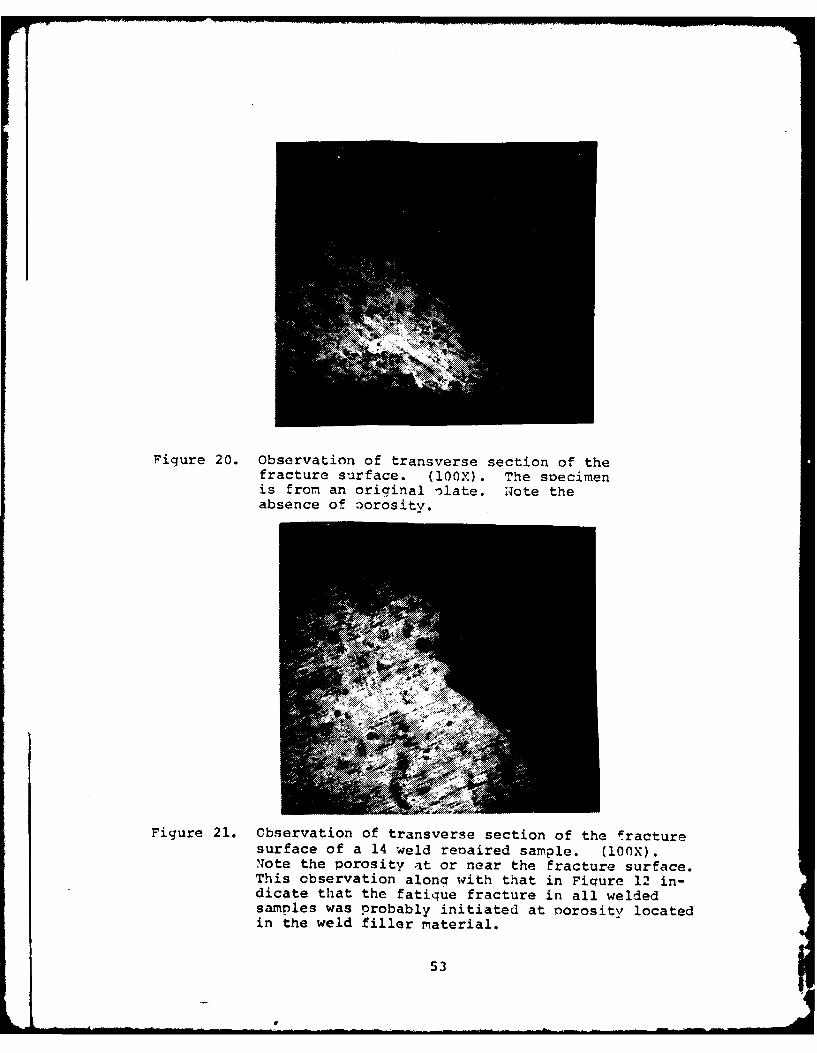
Figure 20. Observation of transverse section of thefracture surface. (100X). The soecimenis from an original "1ate. Note theabsence of porosity.
Figure 21. Observation of transverse section of the fracturesurface of a 14 weld renaired sample. (10OX).Note the porosity at or near the fracture surface.This observation along with that in Figure 12 in-dicate that the fatigue fracture in all weldedsamples was probably initiated at norosity locatedin the weld filler material.
53
10
rI 0
r-4 0
44 00 0
'-I
44 0
4 J
.44
0 x
~0C
C."
C4
54
remains the possibility that under low stresses the coarsened
and cracked inclusions will become fatigue crack initiation
sites; indeed, it is at such low stress where fatigue life in
generally dominated by the crack initiation stage. It should
be noted, however, that the S-N curves for twice and fourteen
times repaired materials are essentially parallel betweeen
5 x 10⁴ and 106 cycles to failure. Therefore, an extrapolation
of these curves to higher cycles may again yield similar results.
55
LF
IV. CONCLUSION
The fatigue strengths of the original AL 5083-0 plate
specimen, a twice weld repaired sample and a fourteen weld
repaired sample are very similar. Significantly, in the weld
repaired samples failure always occurred in the weld metal.
This result coupled with with similarity between the properties
of the weld filler material and the original plate seem to
confirm that there is little if any difference between the
fatigue resistance of the three types of samples (within the
inherent scatter of the fatiaue testinc).
Scanning electron microscopy of the fracture surfaces also
verifies this result. Fatigue cracks appear to begin associ-
ated with porosity contained in the weld. Since the proper-
ties of the weld metal should remain the same despite the
number of repairs, and the failure occurs in the weld, the
number of weld repairs does not affect fatigue resistance.
Lt. G.R. Speight came to a similar conclusion regarding
strength, hardness and stress corrosion cracking susceptibility.
There was a very slight tendency toward degradation. Coupling
Lt. Sneight's results with those obtained in this thesis, it is
nossible to answer the question which was proposed in the intro-
duction of this thesis. Multiple weld repairs do not signifi-
cantly affect welded aluminum 5083-0 material properties.
56
ILi
LIST OF REFERENCES
1. Connors, T. G. , "Update: Domestic LNG Vessel Construction,"Marine Technoloqy, V. 15, Number 1, p. 1-13, January197 8.
2. Speight, G. R. , Jr., The Effects Of Multiple Weld RepairsOn The Aluminum Alloy 5083-0, MSE Thesis, Naval Post-Graduate School, Monterey, 1978.
3. Metals Handbook, 8th ed., V. 7, p. 244, American Society
For Metals, 1973.
4. Xaiser Aluminum And Chemical Sales Inc., Welding, 1967.
5. WELDING HANDBOOK, 7th ed., V. l,.p. 35-99, AmericanWelding Society, 1976.
6. Forsyth, P. J. , The Physical Basis Of Metal Fatigue, p. 61-65, American Elsevier Publishing Company, Inc., 1969.
7. Hertzberg, R. W., Deformaticn And Fracture Mechanics OfEngineering Materials, p. 421-460, John Wiley and Sons,1976.
8. Little, R. E. and Jeve, E. H., Statistical Desin OfFatigue Experiments, 1st ed., John Wiley and Sons, 1975.
9. 1978 Annual Book Of ASTM Standards, Part 10, p. 546-551,American Society For Testing And Materials, 1978.
10. Society Of Automotive Engineers, Inc., Report 790461,Fatigue Properties Of Cold-Rolled Sheet Steel, byA. R. Krause, R. W. Landgraf, and B. T. Crandall,p. 1-10, 2 March 1979.
11. Handbook Of Fatigue Testing, 1st ed., p. 19-27, AmericanSociety For Testing And Materials, 1974.
57
INITIAL DISTRIBUTION LIST
No. Cooies
1. Defense Technical Information Center 2Cameron StationAlexandria, Va. 22314
2. Library, Code 0142 2Naval Postgraduate SchoolMonterey, California 93940
3. Deoartment Chairman, Code 69Mx 1Department of Mechanical EngineeringNaval Postgraduate SchoolMonterey, California 93940
4. Assaciate Professor T.R. Mc'lelley, Code 69r'c 5Deoartment of Mechanical EngineeringNaval Postgraduate SchoolMonterey, California 93940
5. LT. George R. Speight, Jr., U.S.C.G. 3Commander (mmt)Eighth Coast Guard DistrictNew Orleans, La. 70130
6. Commandant (G-PTE-l/72) 2United States Coast GuardWashington, D.C. 20590
7. CAPT W. D. Markle, U. S. C. G. 1Commandant (G-M/S2)United States Coast Guard3ashington, D.C. 20590
8. LCDR Paul Pluta, U. S. C. G. 1Commandant (G-!-1T-2/82)United States Coast GuardWashington, D.C. 20590
9. CAPT R. A. Janeck, U. S. C. G. 1Commandant (G-WLE/73)United States Coast GuardWashington, D.C. 20590
10. LCDR John . Panico 314 Pichmond PlaceCommack, :.Y. 11725
58