Embed Size (px)
Citation preview
GEF/UNDP PIMS 5024: National Biodiversity Planning to Support the Implementation of the CBD 2011-2020 Strategic Plan in Montenegro
Montenegro: the economic value of biodiversity and ecosystem services
Technical Report
Lucy Emerton September 2013

Table of Contents
1 INTRODUCTION: scope and content of the report ......................................................................... 1
Background to the assignment ..................................................................................................................................... 1
Aims and scope of the report ........................................................................................................................................ 1
2 BACKGROUND & CONTEXT: economic valuation and biodiversity planning .................................. 2
Valuation and the CBD .................................................................................................................................................. 2
The status of biodiversity valuation in Montenegro ..................................................................................................... 3
3 IDENTIFYING & ASSESSING ECONOMIC LINKAGES: how economic activities depend and impact on biodiversity and ecosystem services .......................................................................................... 4
Categorising and describing ecosystem services ........................................................................................................... 4
Economic linkages and indicators ................................................................................................................................. 5
Key economic sectors and stakeholders that benefit from ecosystem services .......................................................... 10
Ecosystem service providers and cost-bearers ............................................................................................................ 12
Economic trade-offs in managing and using ecosystem services................................................................................ 12
4 ESTIMATING & DEMONSTRATING BENEFITS AND COSTS: the economic value of biodiversity and ecosystem services ........................................................................................................................ 14
Framing the economic model ...................................................................................................................................... 14
Assumptions and data sources .................................................................................................................................... 16
The baseline economic value of biodiversity and ecosystem services ......................................................................... 19
Economic benefits and costs avoided over the NBSAP period 2011-20 ...................................................................... 19
5 APPLYING BIODIVERSITY VALUATION: potential targets and actions in the revised NBSAP ........ 21
How valuation can assist in meeting the CBD Strategic Goals and Aichi Biodiversity Targets ................................... 21
Economic assessment of biodiversity values (in support of Aichi Targets 1 and 19) ................................................... 22
Formulation of methods and procedures for integrating biodiversity economic values into development planning and appraisal (in support of Aichi Targets 2, 3, 4 and 19) .......................................................................................... 22
Ecosystem capital accounting (in support of Aichi Target 2 and 19) .......................................................................... 23
Strategic communication of biodiversity economic benefits and costs (in support of Aichi Targets 1 and 19, cross-cutting other Targets) ................................................................................................................................................. 23
REFERENCES ....................................................................................................................................... 24
List of Figures
Figure 1: Common International Classification of Ecosystem Services ............................................................. 4
Figure 2: Ecosystem services and economic indicators for Montenegro .......................................................... 6
Figure 3: Ecosystem services which have been valued ................................................................................... 14
Figure 4: Land cover and land use 2006 .......................................................................................................... 15
Figure 5: Contribution of different ecosystem services to 2011 baseline value ............................................ 19
Figure 6: Contribution of different ecosystem services to 2011-2020 value ................................................. 19
Figure 7: Annual values added and costs avoided from NBSAP 2011-2020 (€ million) ................................. 20
Figure 8: Cumulative gains over the baseline to 2020 (€ million) ................................................................... 20
List of Tables
Table 1: Economic linkages and values for key ecosystem services, sectors and stakeholders ..................... 11
Table 2: Assumptions and data sources used in the economic model ........................................................... 16
Table 3: Baseline 2011 economic value of biodiversity and ecosystem services (€ million) ......................... 19
Table 4: Net present value of biodiversity and ecosystem services 2011-2020 (€ million) ........................... 19
List of Acronyms
CBD Convention on Biological Diversity
CICES Common International Classification of Ecosystem Services
COP Conference of the Parties
EPA Environmental Protection Agency
EU European Union
GEF Global Environment Facility
MONSTAT Statistical Office of Montenegro
NBSAP National Biodiversity Strategy and Action Plan
PES Payments for ecosystem services
TEEB The Economics of Ecosystems and Biodiversity
UNDP United Nations Development Programme
1
1 INTRODUCTION: scope and content of the report
Background to the assignment
The UNDP/GEF/Government of Montenegro project “National Biodiversity Planning to Support the
implementation of the CBD 2011-2020 Strategic Plan in Montenegro’’ aims to integrate the country’s
obligations under the Convention on Biological Diversity (CBD) into its national development and sectoral
planning frameworks through a renewed and participative biodiversity planning and strategizing process, in
a manner that is in line with the global guidance contained in the CBD’s Strategic Plan for 2011-2020.
The current assignment is being carried out over a period of 25 days between June and October 2013. It
seeks to identify and recommend appropriate economic information, approaches and tools to strengthen
biodiversity planning, implementation and the achievement of national and global targets. In particular, it is
envisaged to contribute to the following project outcome:
Montenegro’s National Biodiversity Strategy and Action Plan (NBSAP) is revised/updated and it
fully integrates new aspects of the CBD strategic plan, such as mainstreaming and anchoring
the implementation of the plan into national development frameworks, valuing ecosystem
services and promoting ecosystem-based adaptation and resilience.
As laid out in the terms of reference, the assignment focuses on three aspects of the economics of
biodiversity:
Assessing and integrating ecosystem services through economic valuation;
Defining mechanisms to mainstream biodiversity into economic growth and development; and
Developing detailed guidance for the implementation of Payments for Ecosystem Services (PES).
Aims and scope of the report
This report deals with the first of the topics listed above: the economic valuation of biodiversity and
ecosystem services. According to the workplan and following the terms of reference for the assignment,
the current document is intended to provide a “technical report on the economic value of biodiversity and
ecosystem services”. Its aim is to identify, describe and assess the economic value of ecosystem services in
Montenegro. The report is one of three being delivered under the assignment. The other two comprise: an
inception report detailing the agreed workplan and reviewing initial findings on biodiversity economics in
Montenegro; and recommendations on economic and financial mechanisms for biodiversity conservation
and mainstreaming, including payments for ecosystem services.
The report contains five chapters:
Chapter 2 describes the role of economic valuation in biodiversity planning, including the current
status of biodiversity valuation in Montenegro;
Chapter 3 identifies and assesses the key economic sectors and stakeholders that depend and
impact on biodiversity and ecosystem services;
Chapter 4 presents a rough estimate of the economic value of biodiversity and ecosystem services;
and
Chapter 5 identifies needs and niches to incorporate economic valuation into the revised NBSAP.
2
2 BACKGROUND & CONTEXT: economic valuation and biodiversity planning
Valuation and the CBD
Although not explicitly mentioned in the text of the Convention on Biological Diversity (CBD), the
importance of economic valuation to biodiversity planning has been repeatedly underlined by the
Conference of the Parties (COP) and is reflected in many CBD processes and programmes of work.
A note on the economic valuation of biodiversity was prepared by the Secretariat to the CBD as early as
1996, following up on decisions made at COP2 the previous year. It was subsequently included as an
activity in the Convention's programme of work on incentive measures. In 2000, Decision V/15 on incentive
measures called for the assessment of biodiversity values so as to enable them to be better internalised in
public policy initiatives and private sector decisions.
By the time the “first round” of Biodiversity Country Studies and National Biodiversity Strategies and Action
Plans were formulated in the late 1990s and early 2000s, economic valuation had come to be seen as a key
step in biodiversity planning and implementation (Emerton 2001). Many countries conducted assessments
of the economic value of biodiversity as part of NBSAP preparation, mainly as a means of helping to justify
the importance of conservation, assisting in the development of financing strategies, and as a step in the
process of designing incentives and other policy measures to support implementation.
Since then, valuation has been continued to be emphasised in CBD processes. In 2004, COP7 called for the
exploration and compilation of existing methodologies for valuation. In 2008, the Conference of the Parties
decided to put more emphasis on valuation as an important basis for public-awareness campaigns and
policy action; this was reflected in Decision IX/11, which encouraged Parties and relevant organizations to
intensify valuation efforts. Around this time, a number of documents were developed to provide further
guidance on biodiversity valuation techniques (see, for example, SCBD 2007) and a database of case studies
on valuation and incentive measures was compiled (see http://www.cbd.int/programmes/socio-
eco/incentives/case-studies.aspx).
Consideration of biodiversity values is integral to the vision, mission and goals of the CBD Strategic Plan for
Biodiversity 2011-2020 and the Aichi Biodiversity Targets. Goal A of the Strategic Plan and Aichi Targets 1
and 2 explicitly address the need to improve awareness of biodiversity values, to integrate them into
national and local development and poverty reduction strategies and planning processes, and to
incorporate them into national accounting and reporting systems.
Guidance prepared by the CBD in support of these targets underlines the need for countries to
“appropriately value biodiversity” (SCBD 2012a,b). Further direction on the use of economic (sometimes
also referred to as “monetary”) valuation has been provided in relation to the Aichi targets (Rode et al
2012), and in support of NBSAP preparation (UNEP-WCMC and IEEP 2012). The latter poses economic
valuation as one of the “supporting approaches” for incorporating biodiversity and ecosystem service
values into NBSAPs: as a key part of gathering information, identifying strategies and actions, and
developing implementation and resource mobilisation plans. Economic valuation, it is suggested, can
provide a means of helping to build the evidence base, strengthen political will, facilitate biodiversity
mainstreaming and prepare the ground for sectoral implementation.
3
The status of biodiversity valuation in Montenegro
The NBSAP for 2010-15 highlights that there is a critical shortage of information on national biodiversity
values. It notes that “to date, there has not been any significant research of ecosystem services in
Montenegro, of the relation between biodiversity and ecosystem services … or any kind of integrated
approach for determining their values (monetary/economic or non-economic) …” and that the
“contribution of biodiversity to the national economy has never been researched, and the basic
information is either lacking or not publicly available”. The inception report prepared under this assignment
has already reviewed the current national planning and policy context to biodiversity economics tools and
approaches in Montenegro (Emerton 2013). It concludes that little or no information is currently available
on the economic value of biodiversity and ecosystem services or the economic costs of their degradation
and loss in Montenegro. Clearly, the information gap identified in the 2010 NBSAP are yet to be filled.
The inception report finds that economic contribution of biodiversity and ecosystem services and/or the
risks that environmental degradation poses to economic growth and development is mentioned in almost
all of Montenegro’s current national and sectoral development policies, strategies and plans. For example,
the general principles of the National Forest and Forest Land Administration Policy of 2008 include the
“value of resources”: while recognising the complexity of monetary valuation, the policy explicitly
underlines its key role in priority setting, investment planning and benefit-sharing. The Energy Law of 2010
requires the consideration of environmental costs as a component of pricing, as reflected in the principles
laid out in Article 18 for the determination of tariffs. There is also some recognition of the need to factor
these costs and benefits into the calculations that are used to inform policy, planning and reporting. The
2012 document “Ecological State Montenegro +20” mentions a range of “policy and measures to create a
favourable framework”, including the integration of ecosystem values into development policies and
national accounts.
Yet, despite repeated references to the economic value of biodiversity and ecosystem services in
government strategic documents and frameworks for growth, consideration remains largely qualitative. No
sector or agency is engaged in generating quantitative measures or monetary estimates of the economic
contribution of biodiversity to development and poverty reduction outcomes. As yet, neither
environmental nor biodiversity valuation principles and approaches have been operationalized in the
context of national, local or sectoral planning and reporting. The processes and guidelines laid out for
investment appraisal, cost-benefit analysis, environmental impact assessment and strategic environmental
assessment do not require the inclusion of environmental, biodiversity or ecosystem benefits and costs. As
yet there is no regular collection of data, collation of statistics or reporting on biodiversity values, within or
outside the system of national accounts.
Only three documents have been identified which make any attempt to value Montenegro’s biodiversity
and ecosystem services in economic or monetary terms: a study carried out by WWF in 2005 on the value
of the Tara River (Mrdak 2005), a review undertaken by Arcadis Ecolas and IEEP in 2007 on the benefits of
compliance with the EU environmental acquis (Ten Brink et al 2007), and work conducted by UNDP/ISSP in
2011 on the value of protected areas (Emerton et al 2011). One workshop presentation was also located,
titled “putting a price tag on the Multi-Functional Use of Eco-System Services: The case of Morača River and
Skadar Lake in Montenegro” (Arends 2011), but does not appear to have been written up.
The current document makes a first, illustrative, attempt to assess the national value of Montenegro’s
biodiversity and ecosystem services.
4
3 IDENTIFYING & ASSESSING ECONOMIC LINKAGES: how economic activities depend and impact on biodiversity and ecosystem services
Categorising and describing ecosystem services
In order to be able to identify and describe the links between biodiversity, ecosystems and the economy, it
is first of all necessary to have a clear idea of the types and levels of ecosystems and ecosystem services
that exist. Unfortunately, no mapping of ecosystem services has been carried out in Montenegro. It has
therefore been necessary to assess ecosystem services as part of the current assignment. It should however
be emphasised that this can only be a very rough and preliminary scoping, based on limited and incomplete
data. It is to be hoped that a more comprehensive and better-informed ecosystem mapping and
assessment exercise will be included as a key action in the NBSAP that is currently under development.
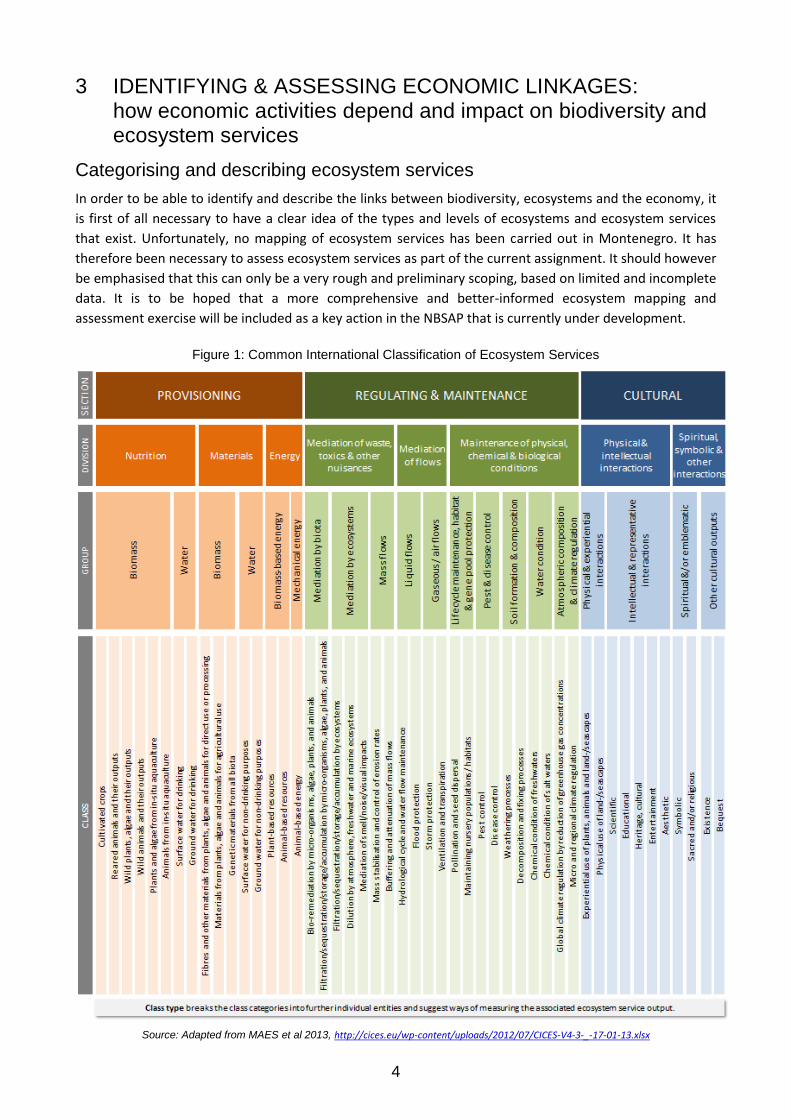
Figure 1: Common International Classification of Ecosystem Services
Source: Adapted from MAES et al 2013, http://cices.eu/wp-content/uploads/2012/07/CICES-V4-3-_-17-01-13.xlsx
5
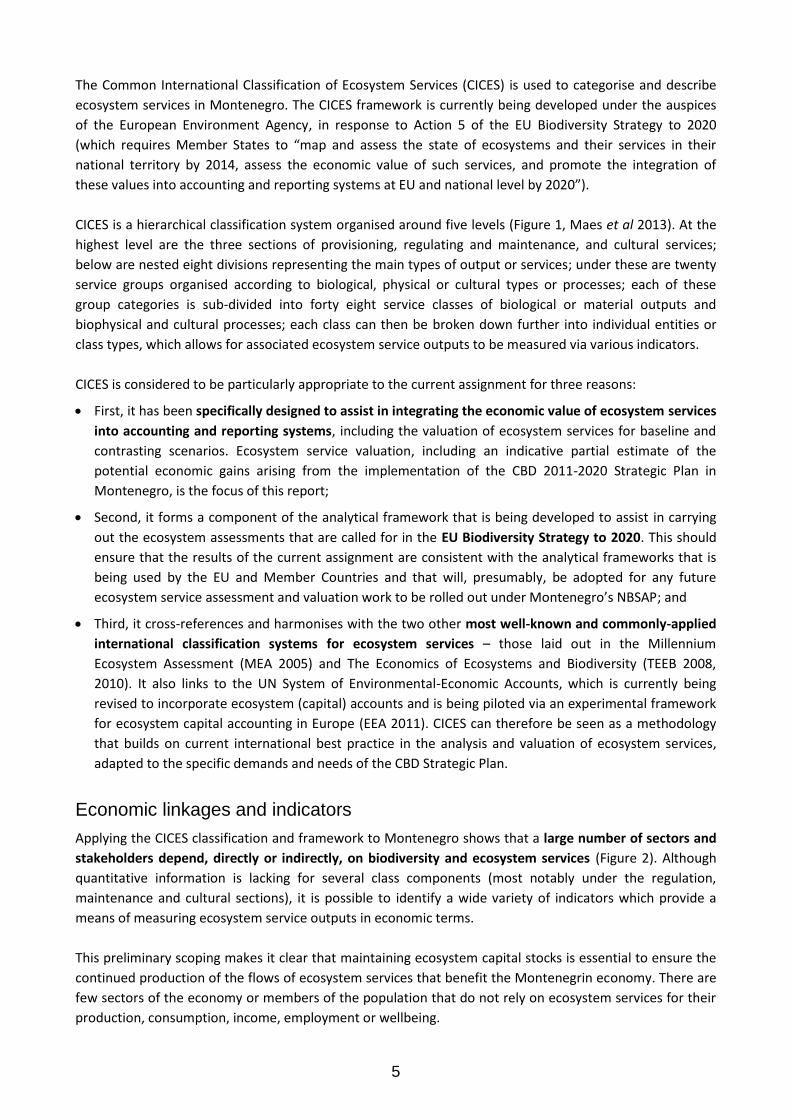
The Common International Classification of Ecosystem Services (CICES) is used to categorise and describe
ecosystem services in Montenegro. The CICES framework is currently being developed under the auspices
of the European Environment Agency, in response to Action 5 of the EU Biodiversity Strategy to 2020
(which requires Member States to “map and assess the state of ecosystems and their services in their
national territory by 2014, assess the economic value of such services, and promote the integration of
these values into accounting and reporting systems at EU and national level by 2020”).
CICES is a hierarchical classification system organised around five levels (Figure 1, Maes et al 2013). At the
highest level are the three sections of provisioning, regulating and maintenance, and cultural services;
below are nested eight divisions representing the main types of output or services; under these are twenty
service groups organised according to biological, physical or cultural types or processes; each of these
group categories is sub-divided into forty eight service classes of biological or material outputs and
biophysical and cultural processes; each class can then be broken down further into individual entities or
class types, which allows for associated ecosystem service outputs to be measured via various indicators.
CICES is considered to be particularly appropriate to the current assignment for three reasons:
First, it has been specifically designed to assist in integrating the economic value of ecosystem services
into accounting and reporting systems, including the valuation of ecosystem services for baseline and
contrasting scenarios. Ecosystem service valuation, including an indicative partial estimate of the
potential economic gains arising from the implementation of the CBD 2011-2020 Strategic Plan in
Montenegro, is the focus of this report;
Second, it forms a component of the analytical framework that is being developed to assist in carrying
out the ecosystem assessments that are called for in the EU Biodiversity Strategy to 2020. This should
ensure that the results of the current assignment are consistent with the analytical frameworks that is
being used by the EU and Member Countries and that will, presumably, be adopted for any future
ecosystem service assessment and valuation work to be rolled out under Montenegro’s NBSAP; and
Third, it cross-references and harmonises with the two other most well-known and commonly-applied
international classification systems for ecosystem services – those laid out in the Millennium
Ecosystem Assessment (MEA 2005) and The Economics of Ecosystems and Biodiversity (TEEB 2008,
2010). It also links to the UN System of Environmental-Economic Accounts, which is currently being
revised to incorporate ecosystem (capital) accounts and is being piloted via an experimental framework
for ecosystem capital accounting in Europe (EEA 2011). CICES can therefore be seen as a methodology
that builds on current international best practice in the analysis and valuation of ecosystem services,
adapted to the specific demands and needs of the CBD Strategic Plan.
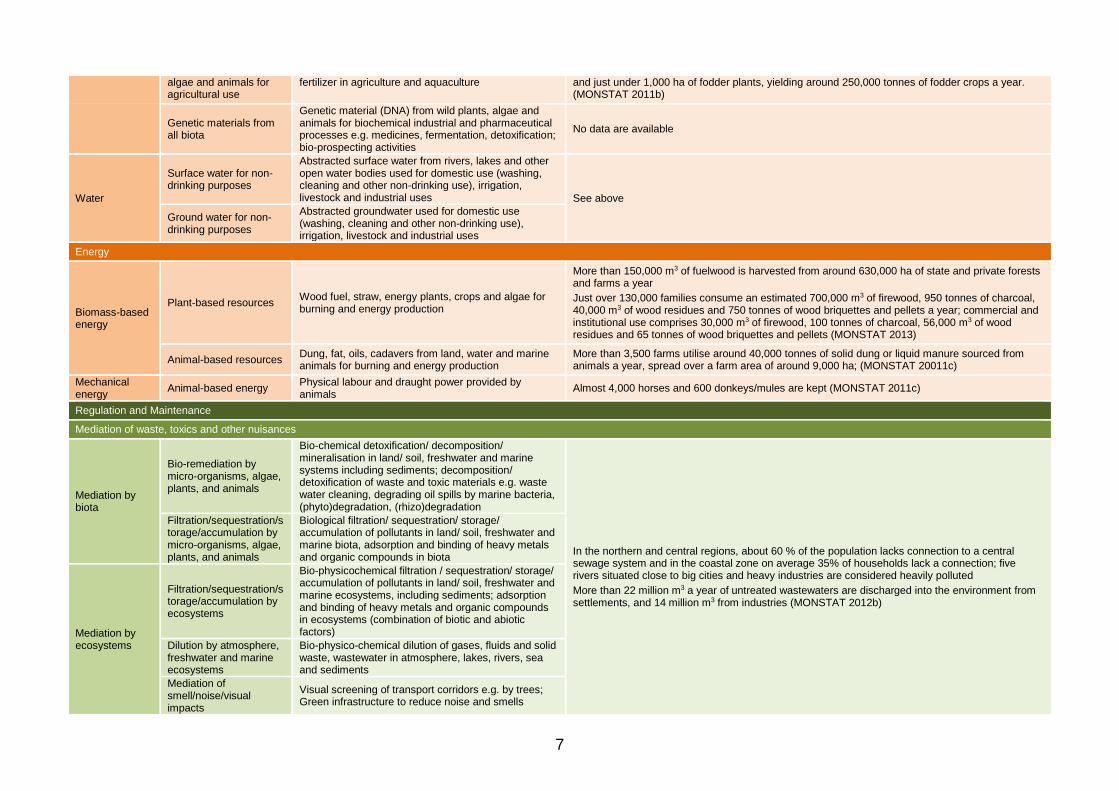
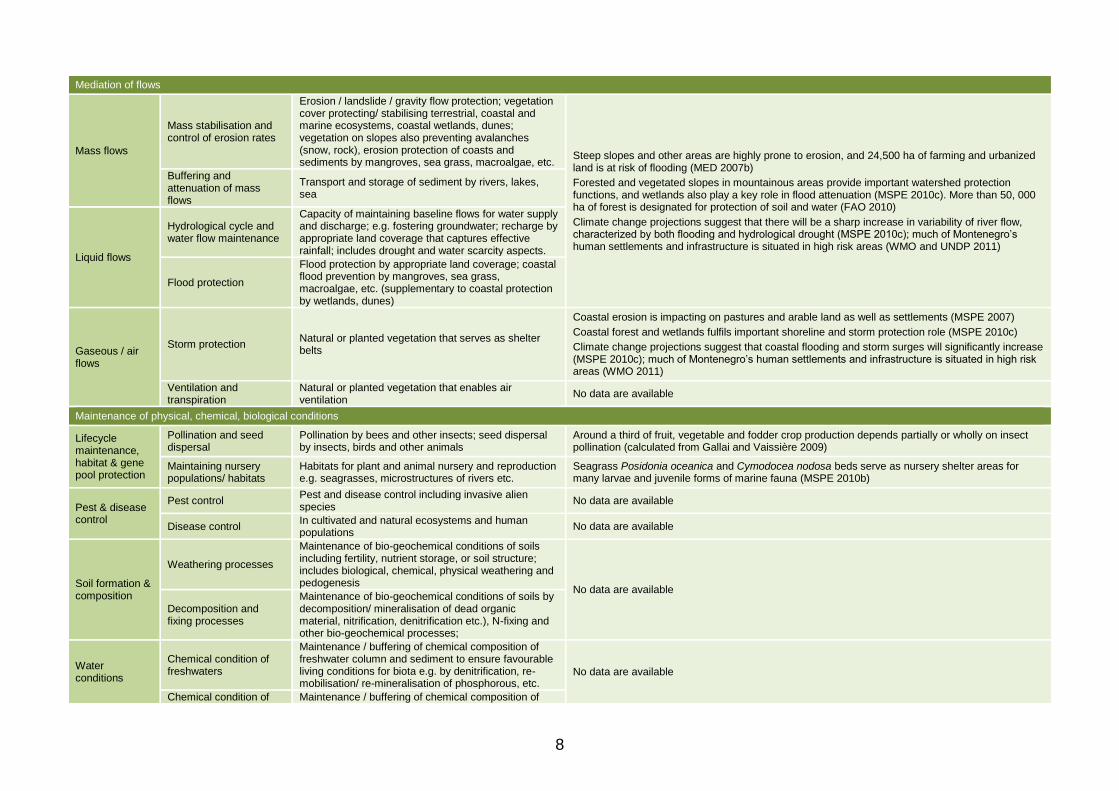
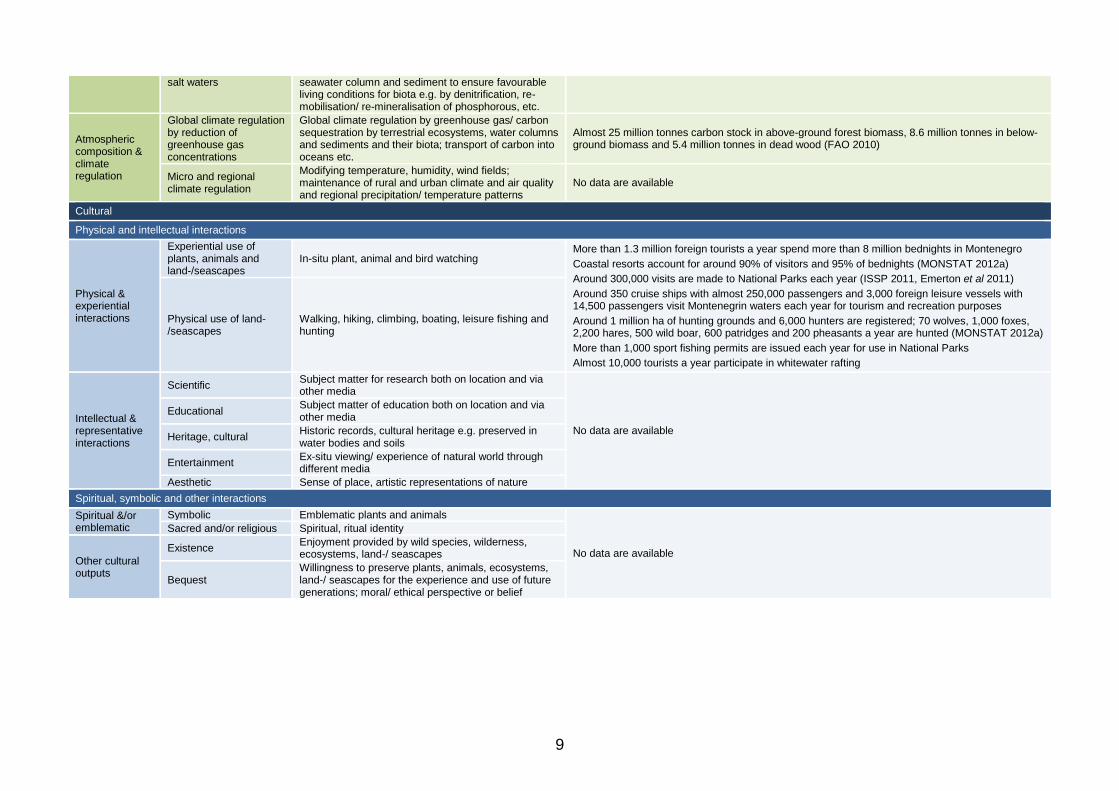
Economic linkages and indicators
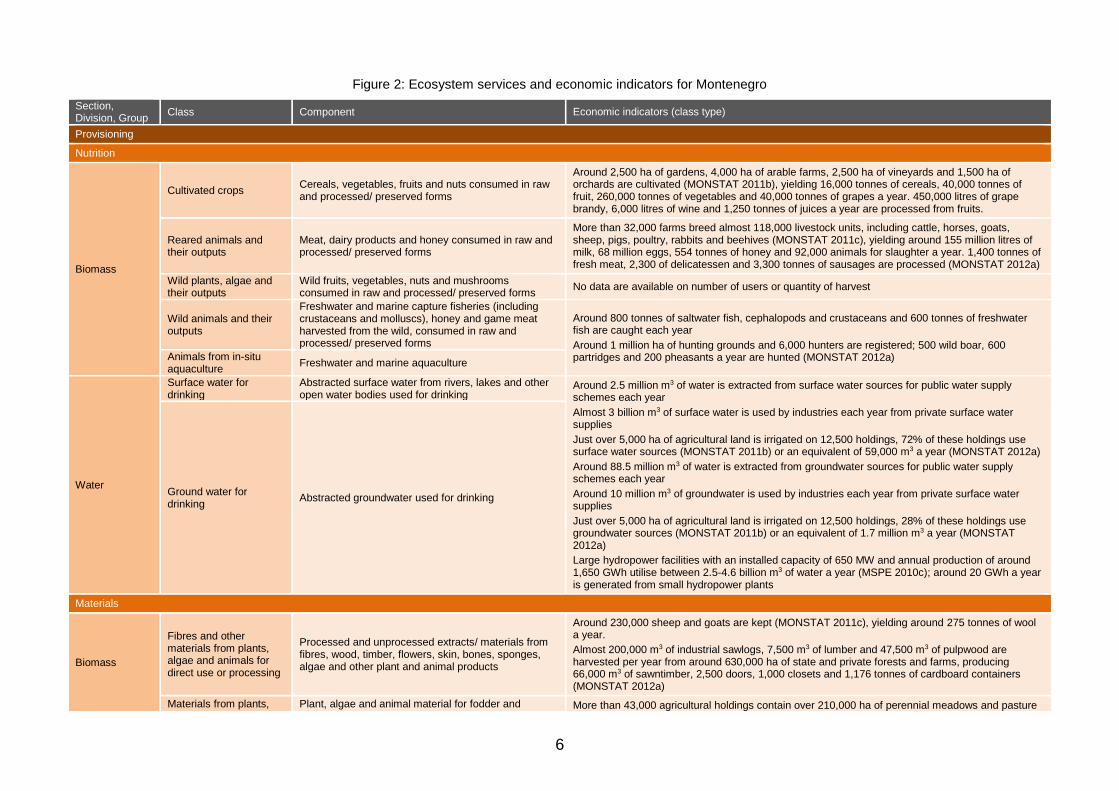
Applying the CICES classification and framework to Montenegro shows that a large number of sectors and
stakeholders depend, directly or indirectly, on biodiversity and ecosystem services (Figure 2). Although
quantitative information is lacking for several class components (most notably under the regulation,
maintenance and cultural sections), it is possible to identify a wide variety of indicators which provide a
means of measuring ecosystem service outputs in economic terms.
This preliminary scoping makes it clear that maintaining ecosystem capital stocks is essential to ensure the
continued production of the flows of ecosystem services that benefit the Montenegrin economy. There are
few sectors of the economy or members of the population that do not rely on ecosystem services for their
production, consumption, income, employment or wellbeing.
6
Figure 2: Ecosystem services and economic indicators for Montenegro
Section, Division, Group
Class Component Economic indicators (class type)
Provisioning
Nutrition
Biomass
Cultivated crops Cereals, vegetables, fruits and nuts consumed in raw and processed/ preserved forms
Around 2,500 ha of gardens, 4,000 ha of arable farms, 2,500 ha of vineyards and 1,500 ha of orchards are cultivated (MONSTAT 2011b), yielding 16,000 tonnes of cereals, 40,000 tonnes of fruit, 260,000 tonnes of vegetables and 40,000 tonnes of grapes a year. 450,000 litres of grape brandy, 6,000 litres of wine and 1,250 tonnes of juices a year are processed from fruits.
Reared animals and their outputs
Meat, dairy products and honey consumed in raw and processed/ preserved forms
More than 32,000 farms breed almost 118,000 livestock units, including cattle, horses, goats, sheep, pigs, poultry, rabbits and beehives (MONSTAT 2011c), yielding around 155 million litres of milk, 68 million eggs, 554 tonnes of honey and 92,000 animals for slaughter a year. 1,400 tonnes of fresh meat, 2,300 of delicatessen and 3,300 tonnes of sausages are processed (MONSTAT 2012a)
Wild plants, algae and their outputs
Wild fruits, vegetables, nuts and mushrooms consumed in raw and processed/ preserved forms
No data are available on number of users or quantity of harvest
Wild animals and their outputs
Freshwater and marine capture fisheries (including crustaceans and molluscs), honey and game meat harvested from the wild, consumed in raw and processed/ preserved forms
Around 800 tonnes of saltwater fish, cephalopods and crustaceans and 600 tonnes of freshwater fish are caught each year
Around 1 million ha of hunting grounds and 6,000 hunters are registered; 500 wild boar, 600 partridges and 200 pheasants a year are hunted (MONSTAT 2012a) Animals from in-situ
aquaculture Freshwater and marine aquaculture
Water
Surface water for drinking
Abstracted surface water from rivers, lakes and other open water bodies used for drinking
Around 2.5 million m3 of water is extracted from surface water sources for public water supply schemes each year
Almost 3 billion m3 of surface water is used by industries each year from private surface water supplies
Just over 5,000 ha of agricultural land is irrigated on 12,500 holdings, 72% of these holdings use surface water sources (MONSTAT 2011b) or an equivalent of 59,000 m3 a year (MONSTAT 2012a)
Around 88.5 million m3 of water is extracted from groundwater sources for public water supply schemes each year
Around 10 million m3 of groundwater is used by industries each year from private surface water supplies
Just over 5,000 ha of agricultural land is irrigated on 12,500 holdings, 28% of these holdings use groundwater sources (MONSTAT 2011b) or an equivalent of 1.7 million m3 a year (MONSTAT 2012a)
Large hydropower facilities with an installed capacity of 650 MW and annual production of around 1,650 GWh utilise between 2.5-4.6 billion m3 of water a year (MSPE 2010c); around 20 GWh a year is generated from small hydropower plants
Ground water for drinking
Abstracted groundwater used for drinking
Materials
Biomass
Fibres and other materials from plants, algae and animals for direct use or processing
Processed and unprocessed extracts/ materials from fibres, wood, timber, flowers, skin, bones, sponges, algae and other plant and animal products
Around 230,000 sheep and goats are kept (MONSTAT 2011c), yielding around 275 tonnes of wool a year.
Almost 200,000 m3 of industrial sawlogs, 7,500 m3 of lumber and 47,500 m3 of pulpwood are harvested per year from around 630,000 ha of state and private forests and farms, producing 66,000 m3 of sawntimber, 2,500 doors, 1,000 closets and 1,176 tonnes of cardboard containers (MONSTAT 2012a)
Materials from plants, Plant, algae and animal material for fodder and More than 43,000 agricultural holdings contain over 210,000 ha of perennial meadows and pasture
7
algae and animals for agricultural use
fertilizer in agriculture and aquaculture and just under 1,000 ha of fodder plants, yielding around 250,000 tonnes of fodder crops a year. (MONSTAT 2011b)
Genetic materials from all biota
Genetic material (DNA) from wild plants, algae and animals for biochemical industrial and pharmaceutical processes e.g. medicines, fermentation, detoxification; bio-prospecting activities
No data are available
Water
Surface water for non-drinking purposes
Abstracted surface water from rivers, lakes and other open water bodies used for domestic use (washing, cleaning and other non-drinking use), irrigation, livestock and industrial uses See above
Ground water for non-drinking purposes
Abstracted groundwater used for domestic use (washing, cleaning and other non-drinking use), irrigation, livestock and industrial uses
Energy
Biomass-based energy
Plant-based resources Wood fuel, straw, energy plants, crops and algae for burning and energy production
More than 150,000 m3 of fuelwood is harvested from around 630,000 ha of state and private forests and farms a year
Just over 130,000 families consume an estimated 700,000 m3 of firewood, 950 tonnes of charcoal, 40,000 m3 of wood residues and 750 tonnes of wood briquettes and pellets a year; commercial and institutional use comprises 30,000 m3 of firewood, 100 tonnes of charcoal, 56,000 m3 of wood residues and 65 tonnes of wood briquettes and pellets (MONSTAT 2013)
Animal-based resources Dung, fat, oils, cadavers from land, water and marine animals for burning and energy production
More than 3,500 farms utilise around 40,000 tonnes of solid dung or liquid manure sourced from animals a year, spread over a farm area of around 9,000 ha; (MONSTAT 20011c)
Mechanical energy
Animal-based energy Physical labour and draught power provided by animals
Almost 4,000 horses and 600 donkeys/mules are kept (MONSTAT 2011c)
Regulation and Maintenance
Mediation of waste, toxics and other nuisances
Mediation by biota
Bio-remediation by micro-organisms, algae, plants, and animals
Bio-chemical detoxification/ decomposition/ mineralisation in land/ soil, freshwater and marine systems including sediments; decomposition/ detoxification of waste and toxic materials e.g. waste water cleaning, degrading oil spills by marine bacteria, (phyto)degradation, (rhizo)degradation
In the northern and central regions, about 60 % of the population lacks connection to a central sewage system and in the coastal zone on average 35% of households lack a connection; five rivers situated close to big cities and heavy industries are considered heavily polluted
More than 22 million m3 a year of untreated wastewaters are discharged into the environment from settlements, and 14 million m3 from industries (MONSTAT 2012b)
Filtration/sequestration/storage/accumulation by micro-organisms, algae, plants, and animals
Biological filtration/ sequestration/ storage/ accumulation of pollutants in land/ soil, freshwater and marine biota, adsorption and binding of heavy metals and organic compounds in biota
Mediation by ecosystems
Filtration/sequestration/storage/accumulation by ecosystems
Bio-physicochemical filtration / sequestration/ storage/ accumulation of pollutants in land/ soil, freshwater and marine ecosystems, including sediments; adsorption and binding of heavy metals and organic compounds in ecosystems (combination of biotic and abiotic factors)
Dilution by atmosphere, freshwater and marine ecosystems
Bio-physico-chemical dilution of gases, fluids and solid waste, wastewater in atmosphere, lakes, rivers, sea and sediments
Mediation of smell/noise/visual impacts
Visual screening of transport corridors e.g. by trees; Green infrastructure to reduce noise and smells
8
Mediation of flows
Mass flows
Mass stabilisation and control of erosion rates
Erosion / landslide / gravity flow protection; vegetation cover protecting/ stabilising terrestrial, coastal and marine ecosystems, coastal wetlands, dunes; vegetation on slopes also preventing avalanches (snow, rock), erosion protection of coasts and sediments by mangroves, sea grass, macroalgae, etc.
Steep slopes and other areas are highly prone to erosion, and 24,500 ha of farming and urbanized land is at risk of flooding (MED 2007b)
Forested and vegetated slopes in mountainous areas provide important watershed protection functions, and wetlands also play a key role in flood attenuation (MSPE 2010c). More than 50, 000 ha of forest is designated for protection of soil and water (FAO 2010)
Climate change projections suggest that there will be a sharp increase in variability of river flow, characterized by both flooding and hydrological drought (MSPE 2010c); much of Montenegro’s human settlements and infrastructure is situated in high risk areas (WMO and UNDP 2011)
Buffering and attenuation of mass flows
Transport and storage of sediment by rivers, lakes, sea
Liquid flows
Hydrological cycle and water flow maintenance
Capacity of maintaining baseline flows for water supply and discharge; e.g. fostering groundwater; recharge by appropriate land coverage that captures effective rainfall; includes drought and water scarcity aspects.
Flood protection
Flood protection by appropriate land coverage; coastal flood prevention by mangroves, sea grass, macroalgae, etc. (supplementary to coastal protection by wetlands, dunes)
Gaseous / air flows
Storm protection Natural or planted vegetation that serves as shelter belts
Coastal erosion is impacting on pastures and arable land as well as settlements (MSPE 2007)
Coastal forest and wetlands fulfils important shoreline and storm protection role (MSPE 2010c)
Climate change projections suggest that coastal flooding and storm surges will significantly increase (MSPE 2010c); much of Montenegro’s human settlements and infrastructure is situated in high risk areas (WMO 2011)
Ventilation and transpiration
Natural or planted vegetation that enables air ventilation
No data are available
Maintenance of physical, chemical, biological conditions
Lifecycle maintenance, habitat & gene pool protection
Pollination and seed dispersal
Pollination by bees and other insects; seed dispersal by insects, birds and other animals
Around a third of fruit, vegetable and fodder crop production depends partially or wholly on insect pollination (calculated from Gallai and Vaissière 2009)
Maintaining nursery populations/ habitats
Habitats for plant and animal nursery and reproduction e.g. seagrasses, microstructures of rivers etc.
Seagrass Posidonia oceanica and Cymodocea nodosa beds serve as nursery shelter areas for many larvae and juvenile forms of marine fauna (MSPE 2010b)
Pest & disease control
Pest control Pest and disease control including invasive alien species
No data are available
Disease control In cultivated and natural ecosystems and human populations
No data are available
Soil formation & composition
Weathering processes
Maintenance of bio-geochemical conditions of soils including fertility, nutrient storage, or soil structure; includes biological, chemical, physical weathering and pedogenesis
No data are available
Decomposition and fixing processes
Maintenance of bio-geochemical conditions of soils by decomposition/ mineralisation of dead organic material, nitrification, denitrification etc.), N-fixing and other bio-geochemical processes;
Water conditions
Chemical condition of freshwaters
Maintenance / buffering of chemical composition of freshwater column and sediment to ensure favourable living conditions for biota e.g. by denitrification, re-mobilisation/ re-mineralisation of phosphorous, etc.
No data are available
Chemical condition of Maintenance / buffering of chemical composition of
9
salt waters seawater column and sediment to ensure favourable living conditions for biota e.g. by denitrification, re-mobilisation/ re-mineralisation of phosphorous, etc.
Atmospheric composition & climate regulation
Global climate regulation by reduction of greenhouse gas concentrations
Global climate regulation by greenhouse gas/ carbon sequestration by terrestrial ecosystems, water columns and sediments and their biota; transport of carbon into oceans etc.
Almost 25 million tonnes carbon stock in above-ground forest biomass, 8.6 million tonnes in below-ground biomass and 5.4 million tonnes in dead wood (FAO 2010)
Micro and regional climate regulation
Modifying temperature, humidity, wind fields; maintenance of rural and urban climate and air quality and regional precipitation/ temperature patterns
No data are available
Cultural
Physical and intellectual interactions
Physical & experiential interactions
Experiential use of plants, animals and land-/seascapes
In-situ plant, animal and bird watching More than 1.3 million foreign tourists a year spend more than 8 million bednights in Montenegro
Coastal resorts account for around 90% of visitors and 95% of bednights (MONSTAT 2012a)
Around 300,000 visits are made to National Parks each year (ISSP 2011, Emerton et al 2011)
Around 350 cruise ships with almost 250,000 passengers and 3,000 foreign leisure vessels with 14,500 passengers visit Montenegrin waters each year for tourism and recreation purposes
Around 1 million ha of hunting grounds and 6,000 hunters are registered; 70 wolves, 1,000 foxes, 2,200 hares, 500 wild boar, 600 patridges and 200 pheasants a year are hunted (MONSTAT 2012a)
More than 1,000 sport fishing permits are issued each year for use in National Parks
Almost 10,000 tourists a year participate in whitewater rafting
Physical use of land-/seascapes
Walking, hiking, climbing, boating, leisure fishing and hunting
Intellectual & representative interactions
Scientific Subject matter for research both on location and via other media
No data are available
Educational Subject matter of education both on location and via other media
Heritage, cultural Historic records, cultural heritage e.g. preserved in water bodies and soils
Entertainment Ex-situ viewing/ experience of natural world through different media
Aesthetic Sense of place, artistic representations of nature
Spiritual, symbolic and other interactions
Spiritual &/or emblematic
Symbolic Emblematic plants and animals
No data are available
Sacred and/or religious Spiritual, ritual identity
Other cultural outputs
Existence Enjoyment provided by wild species, wilderness, ecosystems, land-/ seascapes
Bequest Willingness to preserve plants, animals, ecosystems, land-/ seascapes for the experience and use of future generations; moral/ ethical perspective or belief
10
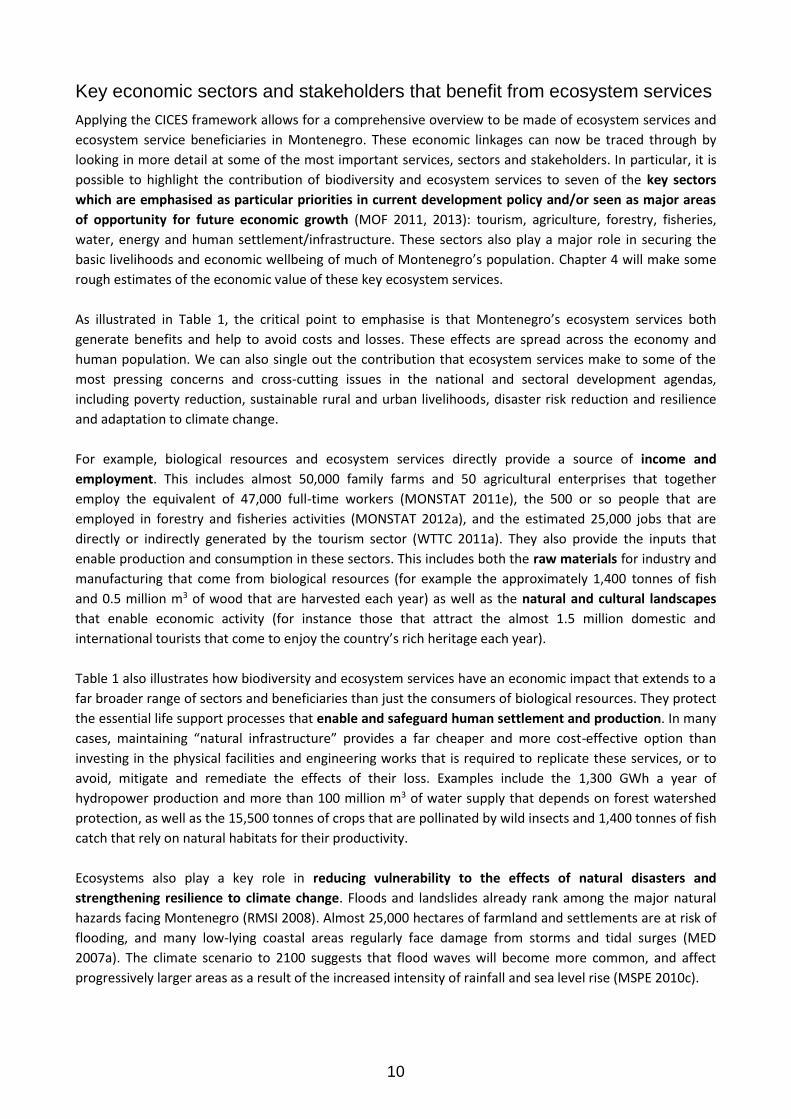
Key economic sectors and stakeholders that benefit from ecosystem services
Applying the CICES framework allows for a comprehensive overview to be made of ecosystem services and
ecosystem service beneficiaries in Montenegro. These economic linkages can now be traced through by
looking in more detail at some of the most important services, sectors and stakeholders. In particular, it is
possible to highlight the contribution of biodiversity and ecosystem services to seven of the key sectors
which are emphasised as particular priorities in current development policy and/or seen as major areas
of opportunity for future economic growth (MOF 2011, 2013): tourism, agriculture, forestry, fisheries,
water, energy and human settlement/infrastructure. These sectors also play a major role in securing the
basic livelihoods and economic wellbeing of much of Montenegro’s population. Chapter 4 will make some
rough estimates of the economic value of these key ecosystem services.
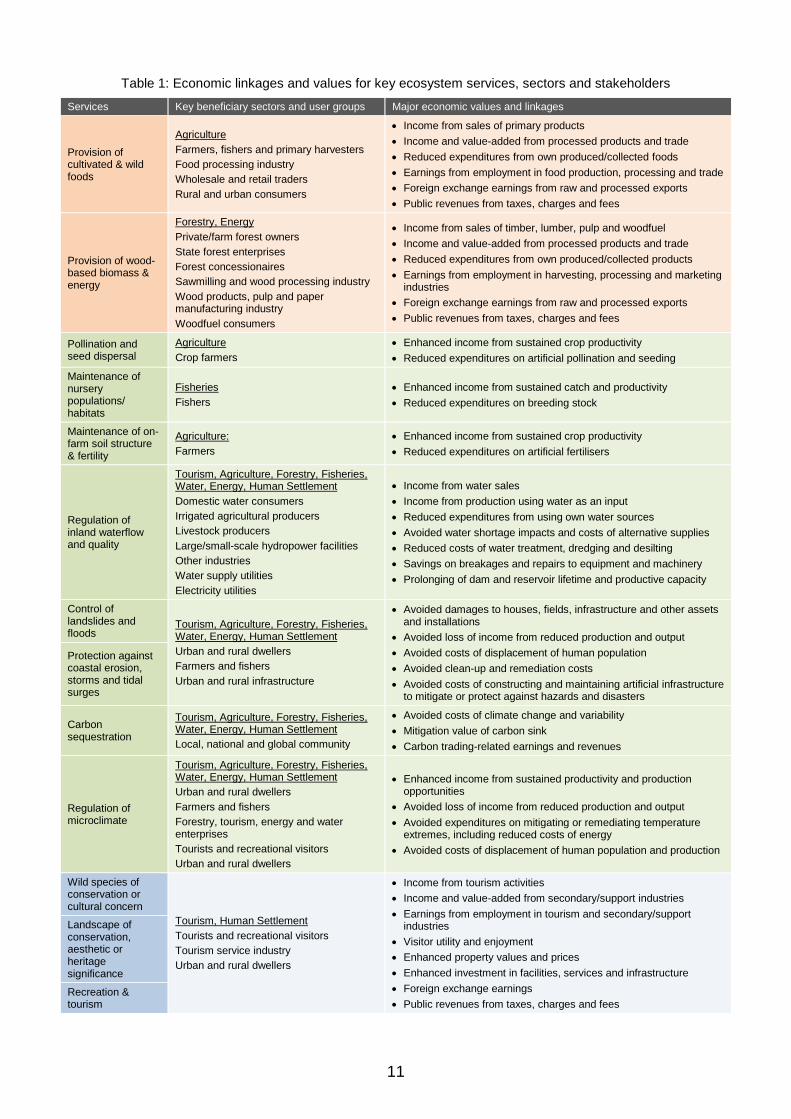
As illustrated in Table 1, the critical point to emphasise is that Montenegro’s ecosystem services both
generate benefits and help to avoid costs and losses. These effects are spread across the economy and
human population. We can also single out the contribution that ecosystem services make to some of the
most pressing concerns and cross-cutting issues in the national and sectoral development agendas,
including poverty reduction, sustainable rural and urban livelihoods, disaster risk reduction and resilience
and adaptation to climate change.
For example, biological resources and ecosystem services directly provide a source of income and
employment. This includes almost 50,000 family farms and 50 agricultural enterprises that together
employ the equivalent of 47,000 full-time workers (MONSTAT 2011e), the 500 or so people that are
employed in forestry and fisheries activities (MONSTAT 2012a), and the estimated 25,000 jobs that are
directly or indirectly generated by the tourism sector (WTTC 2011a). They also provide the inputs that
enable production and consumption in these sectors. This includes both the raw materials for industry and
manufacturing that come from biological resources (for example the approximately 1,400 tonnes of fish
and 0.5 million m3 of wood that are harvested each year) as well as the natural and cultural landscapes
that enable economic activity (for instance those that attract the almost 1.5 million domestic and
international tourists that come to enjoy the country’s rich heritage each year).
Table 1 also illustrates how biodiversity and ecosystem services have an economic impact that extends to a
far broader range of sectors and beneficiaries than just the consumers of biological resources. They protect
the essential life support processes that enable and safeguard human settlement and production. In many
cases, maintaining “natural infrastructure” provides a far cheaper and more cost-effective option than
investing in the physical facilities and engineering works that is required to replicate these services, or to
avoid, mitigate and remediate the effects of their loss. Examples include the 1,300 GWh a year of
hydropower production and more than 100 million m3 of water supply that depends on forest watershed
protection, as well as the 15,500 tonnes of crops that are pollinated by wild insects and 1,400 tonnes of fish
catch that rely on natural habitats for their productivity.
Ecosystems also play a key role in reducing vulnerability to the effects of natural disasters and
strengthening resilience to climate change. Floods and landslides already rank among the major natural
hazards facing Montenegro (RMSI 2008). Almost 25,000 hectares of farmland and settlements are at risk of
flooding, and many low-lying coastal areas regularly face damage from storms and tidal surges (MED
2007a). The climate scenario to 2100 suggests that flood waves will become more common, and affect
progressively larger areas as a result of the increased intensity of rainfall and sea level rise (MSPE 2010c).
11
Table 1: Economic linkages and values for key ecosystem services, sectors and stakeholders
Services Key beneficiary sectors and user groups Major economic values and linkages
Provision of cultivated & wild foods
Agriculture
Farmers, fishers and primary harvesters
Food processing industry
Wholesale and retail traders
Rural and urban consumers
Income from sales of primary products
Income and value-added from processed products and trade
Reduced expenditures from own produced/collected foods
Earnings from employment in food production, processing and trade
Foreign exchange earnings from raw and processed exports
Public revenues from taxes, charges and fees
Provision of wood-based biomass & energy
Forestry, Energy
Private/farm forest owners
State forest enterprises
Forest concessionaires
Sawmilling and wood processing industry
Wood products, pulp and paper manufacturing industry
Woodfuel consumers
Income from sales of timber, lumber, pulp and woodfuel
Income and value-added from processed products and trade
Reduced expenditures from own produced/collected products
Earnings from employment in harvesting, processing and marketing industries
Foreign exchange earnings from raw and processed exports
Public revenues from taxes, charges and fees
Pollination and seed dispersal
Agriculture
Crop farmers
Enhanced income from sustained crop productivity
Reduced expenditures on artificial pollination and seeding
Maintenance of nursery populations/ habitats
Fisheries
Fishers
Enhanced income from sustained catch and productivity
Reduced expenditures on breeding stock
Maintenance of on-farm soil structure & fertility
Agriculture:
Farmers
Enhanced income from sustained crop productivity
Reduced expenditures on artificial fertilisers
Regulation of inland waterflow and quality
Tourism, Agriculture, Forestry, Fisheries, Water, Energy, Human Settlement
Domestic water consumers
Irrigated agricultural producers
Livestock producers
Large/small-scale hydropower facilities
Other industries
Water supply utilities
Electricity utilities
Income from water sales
Income from production using water as an input
Reduced expenditures from using own water sources
Avoided water shortage impacts and costs of alternative supplies
Reduced costs of water treatment, dredging and desilting
Savings on breakages and repairs to equipment and machinery
Prolonging of dam and reservoir lifetime and productive capacity
Control of landslides and floods
Tourism, Agriculture, Forestry, Fisheries, Water, Energy, Human Settlement
Urban and rural dwellers
Farmers and fishers
Urban and rural infrastructure
Avoided damages to houses, fields, infrastructure and other assets and installations
Avoided loss of income from reduced production and output
Avoided costs of displacement of human population
Avoided clean-up and remediation costs
Avoided costs of constructing and maintaining artificial infrastructure to mitigate or protect against hazards and disasters
Protection against coastal erosion, storms and tidal surges
Carbon sequestration
Tourism, Agriculture, Forestry, Fisheries, Water, Energy, Human Settlement
Local, national and global community
Avoided costs of climate change and variability
Mitigation value of carbon sink
Carbon trading-related earnings and revenues
Regulation of microclimate
Tourism, Agriculture, Forestry, Fisheries, Water, Energy, Human Settlement
Urban and rural dwellers
Farmers and fishers
Forestry, tourism, energy and water enterprises
Tourists and recreational visitors
Urban and rural dwellers
Enhanced income from sustained productivity and production opportunities
Avoided loss of income from reduced production and output
Avoided expenditures on mitigating or remediating temperature extremes, including reduced costs of energy
Avoided costs of displacement of human population and production
Wild species of conservation or cultural concern
Tourism, Human Settlement
Tourists and recreational visitors
Tourism service industry
Urban and rural dwellers
Income from tourism activities
Income and value-added from secondary/support industries
Earnings from employment in tourism and secondary/support industries
Visitor utility and enjoyment
Enhanced property values and prices
Enhanced investment in facilities, services and infrastructure
Foreign exchange earnings
Public revenues from taxes, charges and fees
Landscape of conservation, aesthetic or heritage significance
Recreation & tourism
12
Ecosystem service providers and cost-bearers
The provision of ecosystem services is not cost-free. Obviously, various groups incur direct expenditures to
manage and conserve biodiversity and ecosystems. These encompass the staffing, equipment and other
physical expenditures that are needed to undertake on-the-ground conservation activities, and to maintain
the institutional structures that are required to coordinate biodiversity management, policy formulation,
law development and enforcement.
The main direct cost-bearers are the government agencies and public enterprises that are charged with
environmental protection and conservation in Montenegro: most notably the Ministry of Sustainable
Development and Tourism, Public Enterprise National Parks of Montenegro, Nature Protection Institute
and Environmental Protection Agency. Some allocations for biodiversity and ecosystem conservation are
also incorporated into the budgets of other public sector agencies, for example the Ministry of Agriculture
and Rural Development and local government authorities. The main sources of funding are the public
budget and self-generated revenues, with limited contributions being made by overseas donors, non-
governmental organisations, the private sector and the general public. A recent report for example found
annual investments in Protected Areas to be approximately €2 million a year, or an average of €1,800/km2;
just under half of this comes from the central budget, with the balance funded through reinvested
revenues (ISSP 2011, Emerton et al 2011).
There are also opportunity costs implied by the maintenance of natural ecosystems to generate services.
Opportunity costs comprise the income, production and other outputs from alternative activities that are
diminished or foregone by choosing to protect and sustainably utilise biodiversity and ecosystems (rather
than to develop, convert or manage them for other purposes). This includes the opportunity costs that are
incurred when achieving trade-offs between different ecosystem services: for example choosing between
food production, timber harvesting, recreation, biodiversity conservation and carbon sequestration.
Although some preliminary efforts have been made to calculate the monetary value of the opportunity
costs that are implied by different ecosystem service trade-offs in other Central and Eastern European
countries (see Ruijs et al 2013), no estimate is available of the opportunity costs of biodiversity
conservation in Montenegro. While, at a macro-level, the government and overall Montenegrin economy
bears the main opportunity costs of development activities foregone, the bulk of the day-to-day costs
associated with choosing between different ecosystem management and service provision options are
incurred to private land and resource users.
Economic trade-offs in managing and using ecosystem services
The key point to note is that costs and benefits of biodiversity conservation and ecosystem service
generation are not distributed equally between different groups and sectors in the Montenegrin economy.
Those that depend and impact most on biodiversity and ecosystem services do not always share in or
contribute towards conservation and management expenditures, and those that bear the direct and
opportunity costs often receive a disproportionately small share of the economic benefits and values
generated.
Many of the economic values associated with Montenegro’s biodiversity and ecosystem services currently
remain “uncaptured”: no mechanisms exist for charging the sectors and stakeholders that benefit from
them, or for ensuring that users share in the costs of their provision. One example is the watershed
protection services generated by natural forests: while these generate considerable economic value-added
and cost savings to domestic and industrial consumers, hydropower facilities and water utility companies,
13
they are effectively provided free to beneficiaries and users. Similar conclusions can be drawn in relation to
the dependence of the tourism sector on natural landscapes and protected areas, or the costs avoided to
urban populations and infrastructure as a result of the flood and landslide protection functions provided by
forests and wetlands.
The net result is that many of the costs of biodiversity and ecosystem conservation continue to be
uncompensated or remain unmet. Both finance and incentives for conservation are weak. The institutions
that are responsible for meeting the direct costs of conservation face critical funding gaps and budget
shortfalls. For example, the income earned from Montenegro’s Protected Areas is equivalent to only
around 15% of projected funding needs, and current budgets are estimated to be less than half of what is
required for effective conservation management (Emerton et al 2011, ISSP 2011). At the same time, the
provision of economically valuable ecosystem services goes largely unrewarded, meaning that land and
resource users have few incentives for biodiversity conservation and sustainable use. While it is possible to
earn considerable income from activities which involve converting, degrading or over-exploiting natural
resources and habitats, there remain few market or business opportunities associated with ecosystem
conservation or sustainable use. This is even though the concepts of “user pays” and “polluter pays” are
both well-established in Montenegro’s national and sectoral development policies, strategies and plans.
This is neither equitable nor efficient. The fundamental need is to look to mechanisms which can better
capture ecosystem values, compensate conservation costs and reward conservation actions. The third
report to be produced under this assignment will review some of the mechanisms and policy instruments
that can be used to address these market and price failures, and can be included in the NBSAP.
14
4 ESTIMATING & DEMONSTRATING BENEFITS AND COSTS: the economic value of biodiversity and ecosystem services
Framing the economic model
It is possible to make some estimate of value some of the key ecosystem services, sectors and stakeholders
that have been identified in Chapter 3. It must however be emphasised that the figures presented below
are based on extremely rough and ready calculations and on very limited data.
There remains a critical lack of ecological, biological and other biophysical information, as well as economic
and price data, relating to biodiversity and ecosystem services in Montenegro. Many of these figures have
had to be approximated based on partial data from existing reports, which are often inconsistent between
different sources, and are sometimes of questionable quality. As already mentioned above, no basic
national assessment or mapping of ecosystem services has been carried out. No current or historical data
are available on land use and land cover except at a very aggregated level. Neither has any systematic
definition of future outlooks or scenarios for biodiversity and ecosystem services been developed.
Therefore the figures below, and the assumptions and projections upon which they are based, should be
treated with caution. They must be seen as a broad estimate of the likely magnitude and trends in
ecosystem values. It is to be hoped that a more comprehensive and better-informed programme of
valuation will be included as a key action in the NBSAP that is currently under development. This chapter
provides some preliminary estimates of what can be fleshed out properly once proper ecosystem
assessments are undertaken and outlook scenarios developed.
The valuation exercise focuses on the
economic benefits generated and costs
avoided associated with developing and
implementing the NBSAP, in line with the
CBD Strategic Plan and Aichi Biodiversity
Targets.
In other words, it looks at the value-added
by the revised NBSAP to the Montenegrin
economy to the year 2020, as compared to
a 2011 baseline. This also represents the
economic value that would be foregone by
failing to implement the revised NBSAP.
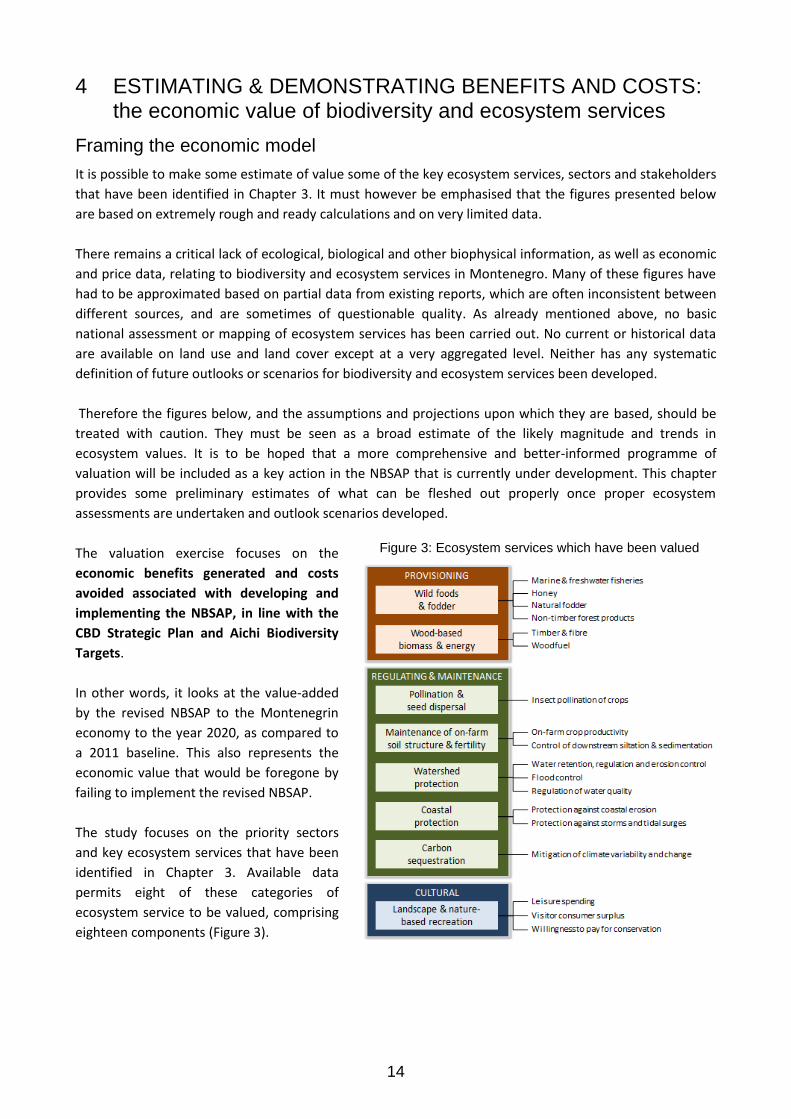
The study focuses on the priority sectors
and key ecosystem services that have been
identified in Chapter 3. Available data
permits eight of these categories of
ecosystem service to be valued, comprising
eighteen components (Figure 3).
Figure 3: Ecosystem services which have been valued
15
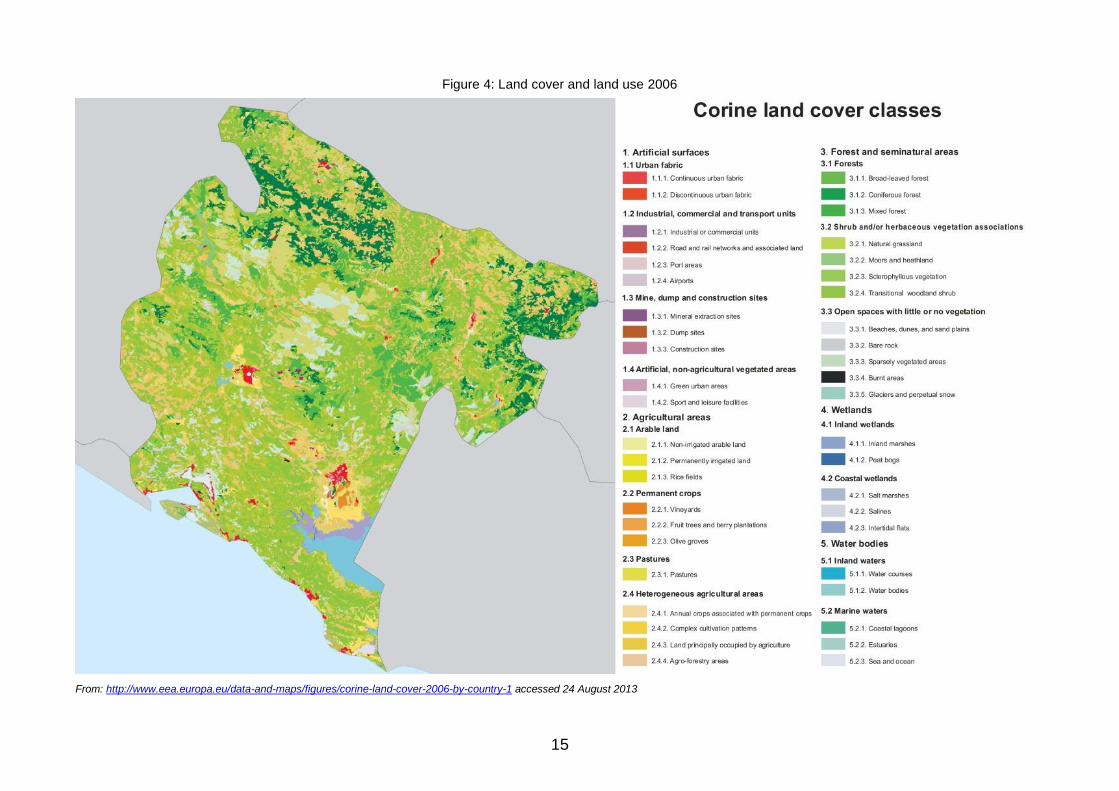
Figure 4: Land cover and land use 2006
From: http://www.eea.europa.eu/data-and-maps/figures/corine-land-cover-2006-by-country-1 accessed 24 August 2013
16
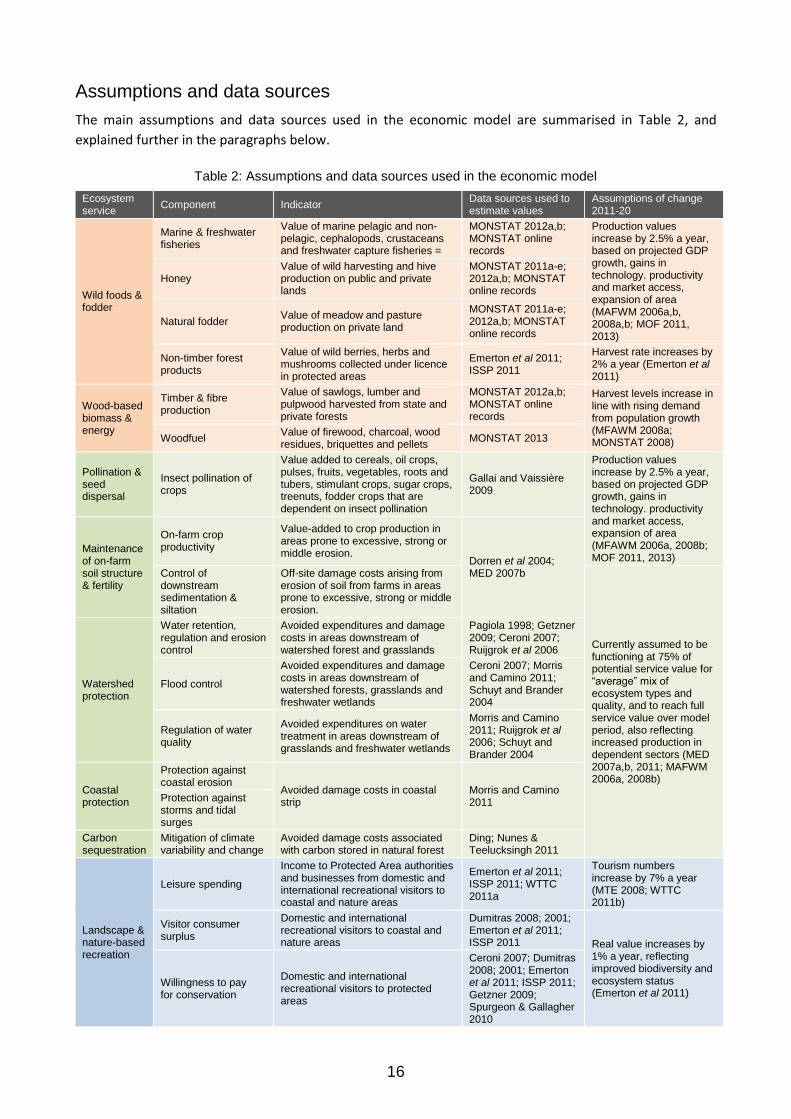
Assumptions and data sources
The main assumptions and data sources used in the economic model are summarised in Table 2, and
explained further in the paragraphs below.
Table 2: Assumptions and data sources used in the economic model
Ecosystem service
Component Indicator Data sources used to estimate values
Assumptions of change 2011-20
Wild foods & fodder
Marine & freshwater fisheries
Value of marine pelagic and non-pelagic, cephalopods, crustaceans and freshwater capture fisheries =
MONSTAT 2012a,b; MONSTAT online records
Production values increase by 2.5% a year, based on projected GDP growth, gains in technology. productivity and market access, expansion of area (MAFWM 2006a,b, 2008a,b; MOF 2011, 2013)
Honey Value of wild harvesting and hive production on public and private lands
MONSTAT 2011a-e; 2012a,b; MONSTAT online records
Natural fodder Value of meadow and pasture production on private land
MONSTAT 2011a-e; 2012a,b; MONSTAT online records
Non-timber forest products
Value of wild berries, herbs and mushrooms collected under licence in protected areas
Emerton et al 2011; ISSP 2011
Harvest rate increases by 2% a year (Emerton et al 2011)
Wood-based biomass & energy
Timber & fibre production
Value of sawlogs, lumber and pulpwood harvested from state and private forests
MONSTAT 2012a,b; MONSTAT online records
Harvest levels increase in line with rising demand from population growth (MFAWM 2008a; MONSTAT 2008) Woodfuel
Value of firewood, charcoal, wood residues, briquettes and pellets
MONSTAT 2013
Pollination & seed dispersal
Insect pollination of crops
Value added to cereals, oil crops, pulses, fruits, vegetables, roots and tubers, stimulant crops, sugar crops, treenuts, fodder crops that are dependent on insect pollination
Gallai and Vaissière 2009
Production values increase by 2.5% a year, based on projected GDP growth, gains in technology. productivity and market access, expansion of area (MFAWM 2006a, 2008b; MOF 2011, 2013)
Maintenance of on-farm soil structure & fertility
On-farm crop productivity
Value-added to crop production in areas prone to excessive, strong or middle erosion.
Dorren et al 2004; MED 2007b Control of
downstream sedimentation & siltation
Off-site damage costs arising from erosion of soil from farms in areas prone to excessive, strong or middle erosion.
Currently assumed to be functioning at 75% of potential service value for “average” mix of ecosystem types and quality, and to reach full service value over model period, also reflecting increased production in dependent sectors (MED 2007a,b, 2011; MAFWM 2006a, 2008b)
Watershed protection
Water retention, regulation and erosion control
Avoided expenditures and damage costs in areas downstream of watershed forest and grasslands
Pagiola 1998; Getzner 2009; Ceroni 2007; Ruijgrok et al 2006
Flood control
Avoided expenditures and damage costs in areas downstream of watershed forests, grasslands and freshwater wetlands
Ceroni 2007; Morris and Camino 2011; Schuyt and Brander 2004
Regulation of water quality
Avoided expenditures on water treatment in areas downstream of grasslands and freshwater wetlands
Morris and Camino 2011; Ruijgrok et al 2006; Schuyt and Brander 2004
Coastal protection
Protection against coastal erosion
Avoided damage costs in coastal strip
Morris and Camino 2011 Protection against
storms and tidal surges
Carbon sequestration
Mitigation of climate variability and change
Avoided damage costs associated with carbon stored in natural forest
Ding; Nunes & Teelucksingh 2011
Landscape & nature-based recreation
Leisure spending
Income to Protected Area authorities and businesses from domestic and international recreational visitors to coastal and nature areas
Emerton et al 2011; ISSP 2011; WTTC 2011a
Tourism numbers increase by 7% a year (MTE 2008; WTTC 2011b)
Visitor consumer surplus
Domestic and international recreational visitors to coastal and nature areas
Dumitras 2008; 2001; Emerton et al 2011; ISSP 2011 Real value increases by
1% a year, reflecting improved biodiversity and ecosystem status (Emerton et al 2011)
Willingness to pay for conservation
Domestic and international recreational visitors to protected areas
Ceroni 2007; Dumitras 2008; 2001; Emerton et al 2011; ISSP 2011; Getzner 2009; Spurgeon & Gallagher 2010
17
The valuation exercise focuses on the services provided by natural ecosystems and indigenous biodiversity
only. It does not, for example, include the provisioning services associated with cultivated crops and
domesticated livestock or with water use (although counts the contribution of ecosystem regulating and
supporting services to these sectors). Future projections of value under the revised NBSAP include only
those land and resource uses which are believed to be sustainable in ecological terms.
Costs and benefits reflect the gross value of production, and relate to the value of biological resources as
raw materials (for example roundlogs and whole fish). The study thus focuses on primary producers and
consumers, not on value-added through processing and the market chain. It is concerned with direct
impacts. Economy-wide multipliers and indirect production, income and employment effects are not
included. Input costs and intermediary consumption have not been netted out of the value estimates, and
figures are not adjusted for the impacts of subsidies and other price distortions.
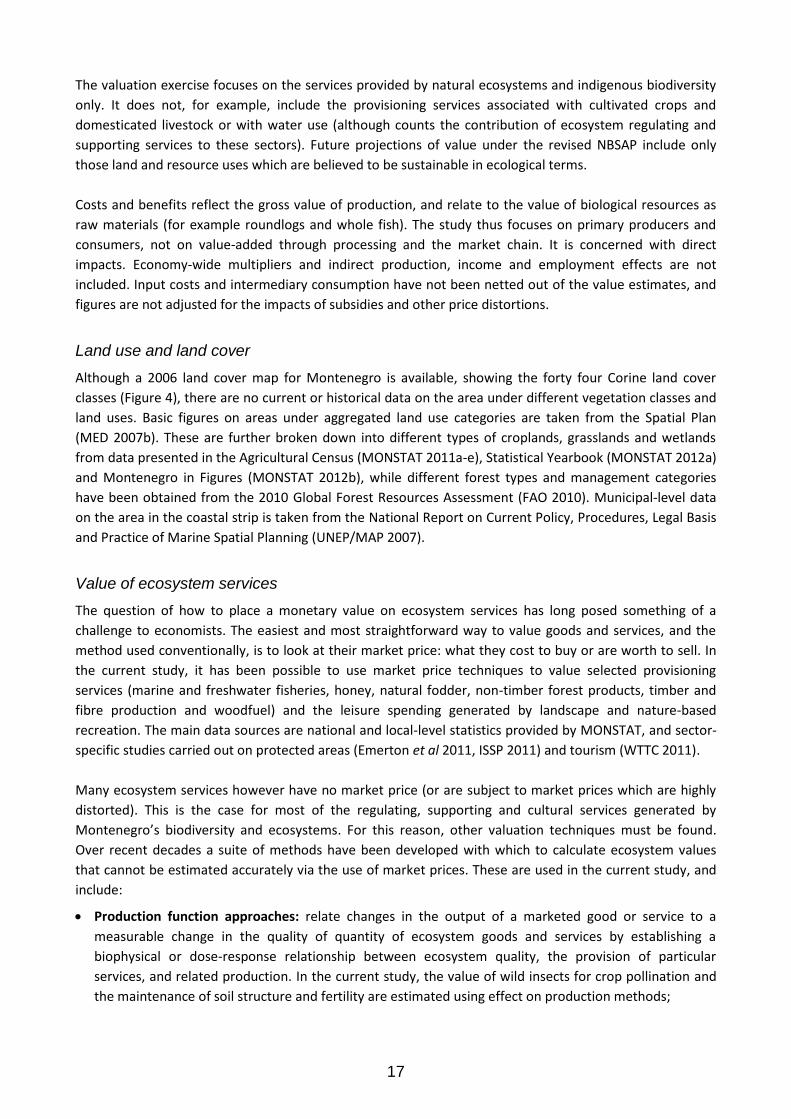
Land use and land cover
Although a 2006 land cover map for Montenegro is available, showing the forty four Corine land cover
classes (Figure 4), there are no current or historical data on the area under different vegetation classes and
land uses. Basic figures on areas under aggregated land use categories are taken from the Spatial Plan
(MED 2007b). These are further broken down into different types of croplands, grasslands and wetlands
from data presented in the Agricultural Census (MONSTAT 2011a-e), Statistical Yearbook (MONSTAT 2012a)
and Montenegro in Figures (MONSTAT 2012b), while different forest types and management categories
have been obtained from the 2010 Global Forest Resources Assessment (FAO 2010). Municipal-level data
on the area in the coastal strip is taken from the National Report on Current Policy, Procedures, Legal Basis
and Practice of Marine Spatial Planning (UNEP/MAP 2007).
Value of ecosystem services
The question of how to place a monetary value on ecosystem services has long posed something of a
challenge to economists. The easiest and most straightforward way to value goods and services, and the
method used conventionally, is to look at their market price: what they cost to buy or are worth to sell. In
the current study, it has been possible to use market price techniques to value selected provisioning
services (marine and freshwater fisheries, honey, natural fodder, non-timber forest products, timber and
fibre production and woodfuel) and the leisure spending generated by landscape and nature-based
recreation. The main data sources are national and local-level statistics provided by MONSTAT, and sector-
specific studies carried out on protected areas (Emerton et al 2011, ISSP 2011) and tourism (WTTC 2011).
Many ecosystem services however have no market price (or are subject to market prices which are highly
distorted). This is the case for most of the regulating, supporting and cultural services generated by
Montenegro’s biodiversity and ecosystems. For this reason, other valuation techniques must be found.
Over recent decades a suite of methods have been developed with which to calculate ecosystem values
that cannot be estimated accurately via the use of market prices. These are used in the current study, and
include:
Production function approaches: relate changes in the output of a marketed good or service to a
measurable change in the quality of quantity of ecosystem goods and services by establishing a
biophysical or dose-response relationship between ecosystem quality, the provision of particular
services, and related production. In the current study, the value of wild insects for crop pollination and
the maintenance of soil structure and fertility are estimated using effect on production methods;
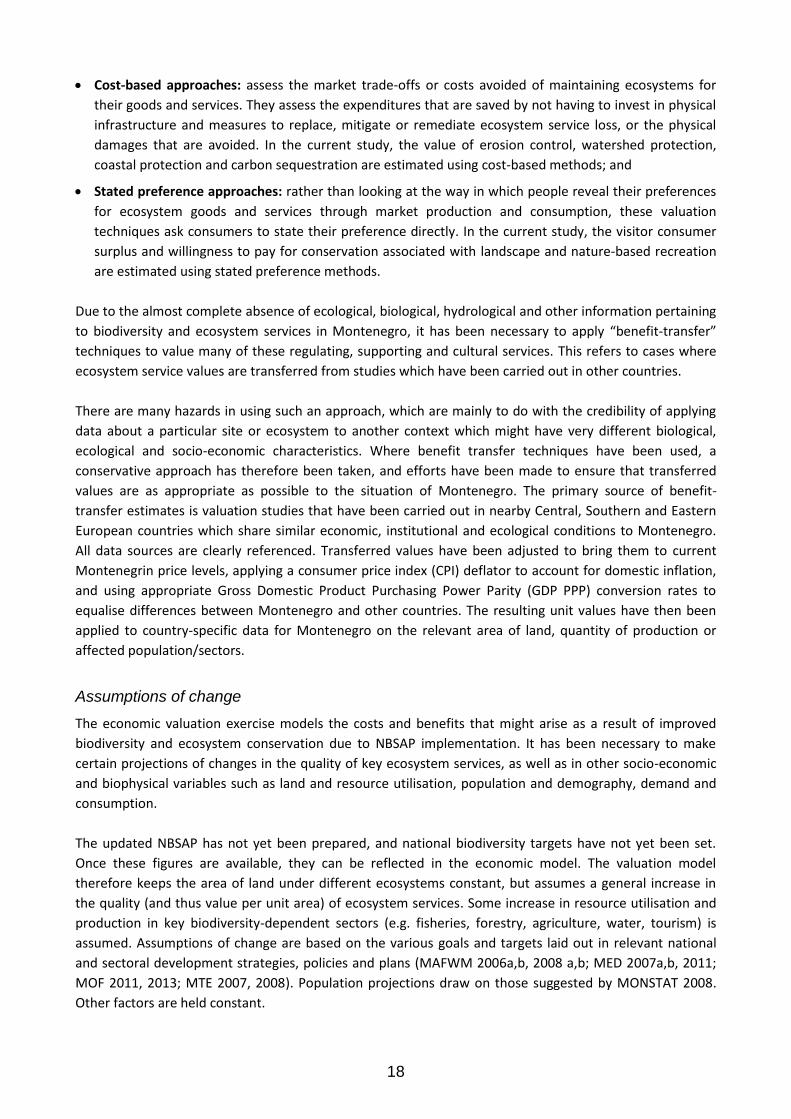
18
Cost-based approaches: assess the market trade-offs or costs avoided of maintaining ecosystems for
their goods and services. They assess the expenditures that are saved by not having to invest in physical
infrastructure and measures to replace, mitigate or remediate ecosystem service loss, or the physical
damages that are avoided. In the current study, the value of erosion control, watershed protection,
coastal protection and carbon sequestration are estimated using cost-based methods; and
Stated preference approaches: rather than looking at the way in which people reveal their preferences
for ecosystem goods and services through market production and consumption, these valuation
techniques ask consumers to state their preference directly. In the current study, the visitor consumer
surplus and willingness to pay for conservation associated with landscape and nature-based recreation
are estimated using stated preference methods.
Due to the almost complete absence of ecological, biological, hydrological and other information pertaining
to biodiversity and ecosystem services in Montenegro, it has been necessary to apply “benefit-transfer”
techniques to value many of these regulating, supporting and cultural services. This refers to cases where
ecosystem service values are transferred from studies which have been carried out in other countries.
There are many hazards in using such an approach, which are mainly to do with the credibility of applying
data about a particular site or ecosystem to another context which might have very different biological,
ecological and socio-economic characteristics. Where benefit transfer techniques have been used, a
conservative approach has therefore been taken, and efforts have been made to ensure that transferred
values are as appropriate as possible to the situation of Montenegro. The primary source of benefit-
transfer estimates is valuation studies that have been carried out in nearby Central, Southern and Eastern
European countries which share similar economic, institutional and ecological conditions to Montenegro.
All data sources are clearly referenced. Transferred values have been adjusted to bring them to current
Montenegrin price levels, applying a consumer price index (CPI) deflator to account for domestic inflation,
and using appropriate Gross Domestic Product Purchasing Power Parity (GDP PPP) conversion rates to
equalise differences between Montenegro and other countries. The resulting unit values have then been
applied to country-specific data for Montenegro on the relevant area of land, quantity of production or
affected population/sectors.
Assumptions of change
The economic valuation exercise models the costs and benefits that might arise as a result of improved
biodiversity and ecosystem conservation due to NBSAP implementation. It has been necessary to make
certain projections of changes in the quality of key ecosystem services, as well as in other socio-economic
and biophysical variables such as land and resource utilisation, population and demography, demand and
consumption.
The updated NBSAP has not yet been prepared, and national biodiversity targets have not yet been set.
Once these figures are available, they can be reflected in the economic model. The valuation model
therefore keeps the area of land under different ecosystems constant, but assumes a general increase in
the quality (and thus value per unit area) of ecosystem services. Some increase in resource utilisation and
production in key biodiversity-dependent sectors (e.g. fisheries, forestry, agriculture, water, tourism) is
assumed. Assumptions of change are based on the various goals and targets laid out in relevant national
and sectoral development strategies, policies and plans (MAFWM 2006a,b, 2008 a,b; MED 2007a,b, 2011;
MOF 2011, 2013; MTE 2007, 2008). Population projections draw on those suggested by MONSTAT 2008.
Other factors are held constant.
19
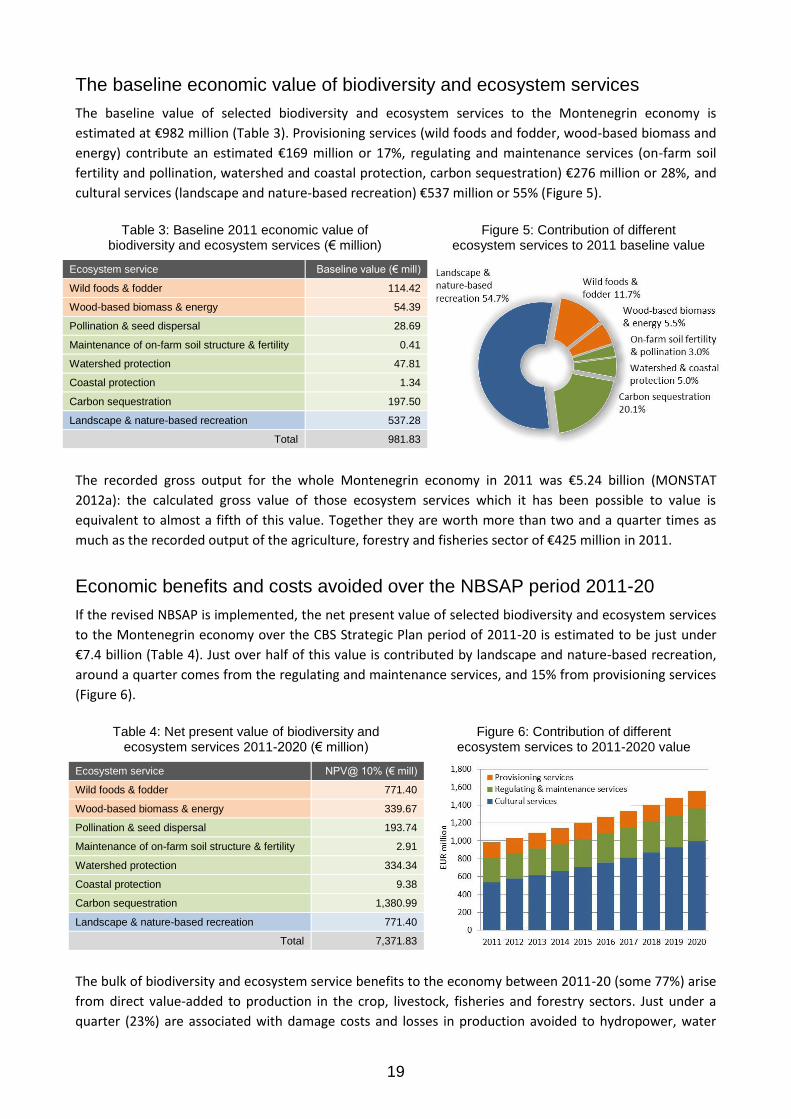
The baseline economic value of biodiversity and ecosystem services
The baseline value of selected biodiversity and ecosystem services to the Montenegrin economy is
estimated at €982 million (Table 3). Provisioning services (wild foods and fodder, wood-based biomass and
energy) contribute an estimated €169 million or 17%, regulating and maintenance services (on-farm soil
fertility and pollination, watershed and coastal protection, carbon sequestration) €276 million or 28%, and
cultural services (landscape and nature-based recreation) €537 million or 55% (Figure 5).
Table 3: Baseline 2011 economic value of
biodiversity and ecosystem services (€ million)
Figure 5: Contribution of different ecosystem services to 2011 baseline value
Ecosystem service Baseline value (€ mill)
Wild foods & fodder 114.42
Wood-based biomass & energy 54.39
Pollination & seed dispersal 28.69
Maintenance of on-farm soil structure & fertility 0.41
Watershed protection 47.81
Coastal protection 1.34
Carbon sequestration 197.50
Landscape & nature-based recreation 537.28
Total 981.83
The recorded gross output for the whole Montenegrin economy in 2011 was €5.24 billion (MONSTAT
2012a): the calculated gross value of those ecosystem services which it has been possible to value is
equivalent to almost a fifth of this value. Together they are worth more than two and a quarter times as
much as the recorded output of the agriculture, forestry and fisheries sector of €425 million in 2011.
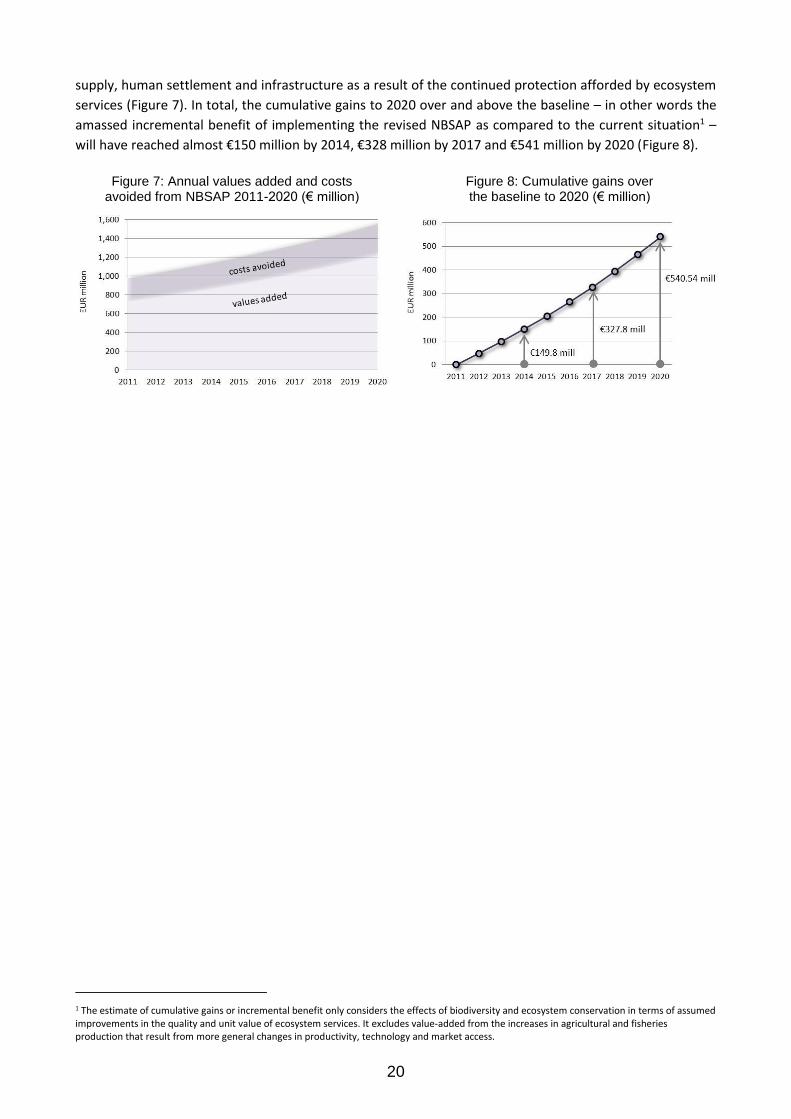
Economic benefits and costs avoided over the NBSAP period 2011-20
If the revised NBSAP is implemented, the net present value of selected biodiversity and ecosystem services
to the Montenegrin economy over the CBS Strategic Plan period of 2011-20 is estimated to be just under
€7.4 billion (Table 4). Just over half of this value is contributed by landscape and nature-based recreation,
around a quarter comes from the regulating and maintenance services, and 15% from provisioning services
(Figure 6).
Table 4: Net present value of biodiversity and
ecosystem services 2011-2020 (€ million) Figure 6: Contribution of different
ecosystem services to 2011-2020 value
Ecosystem service NPV@ 10% (€ mill)
Wild foods & fodder 771.40
Wood-based biomass & energy 339.67
Pollination & seed dispersal 193.74
Maintenance of on-farm soil structure & fertility 2.91
Watershed protection 334.34
Coastal protection 9.38
Carbon sequestration 1,380.99
Landscape & nature-based recreation 771.40
Total 7,371.83
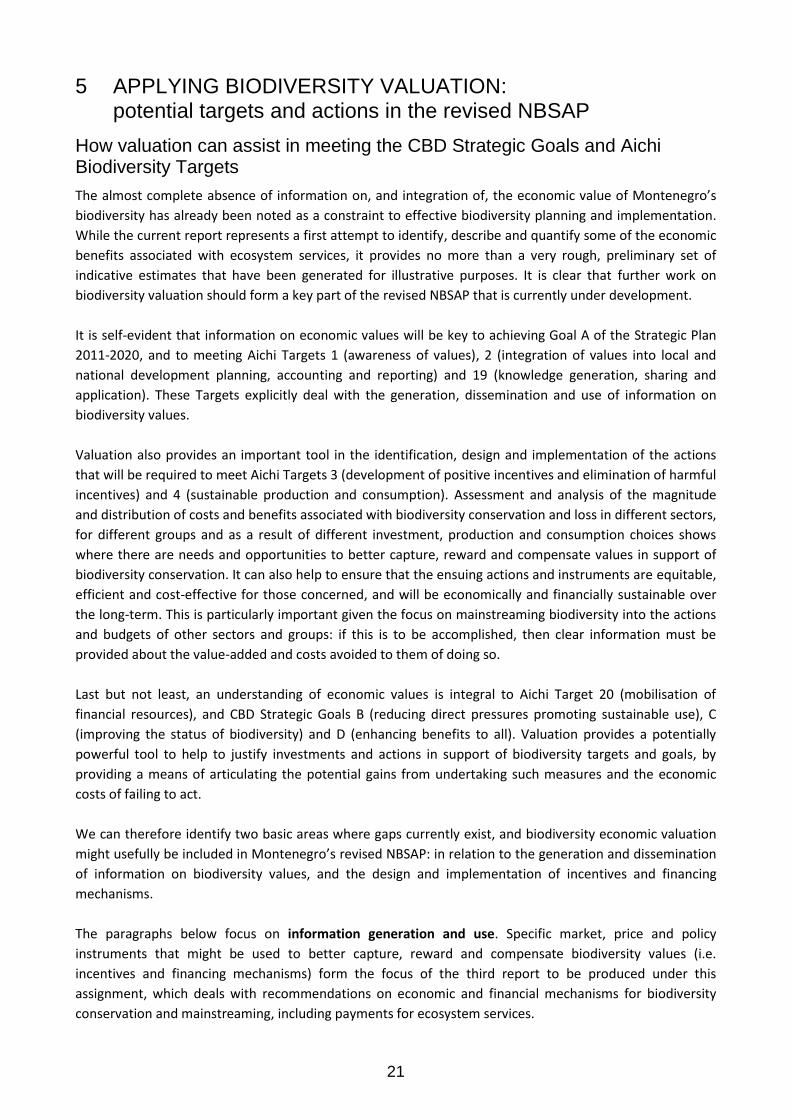
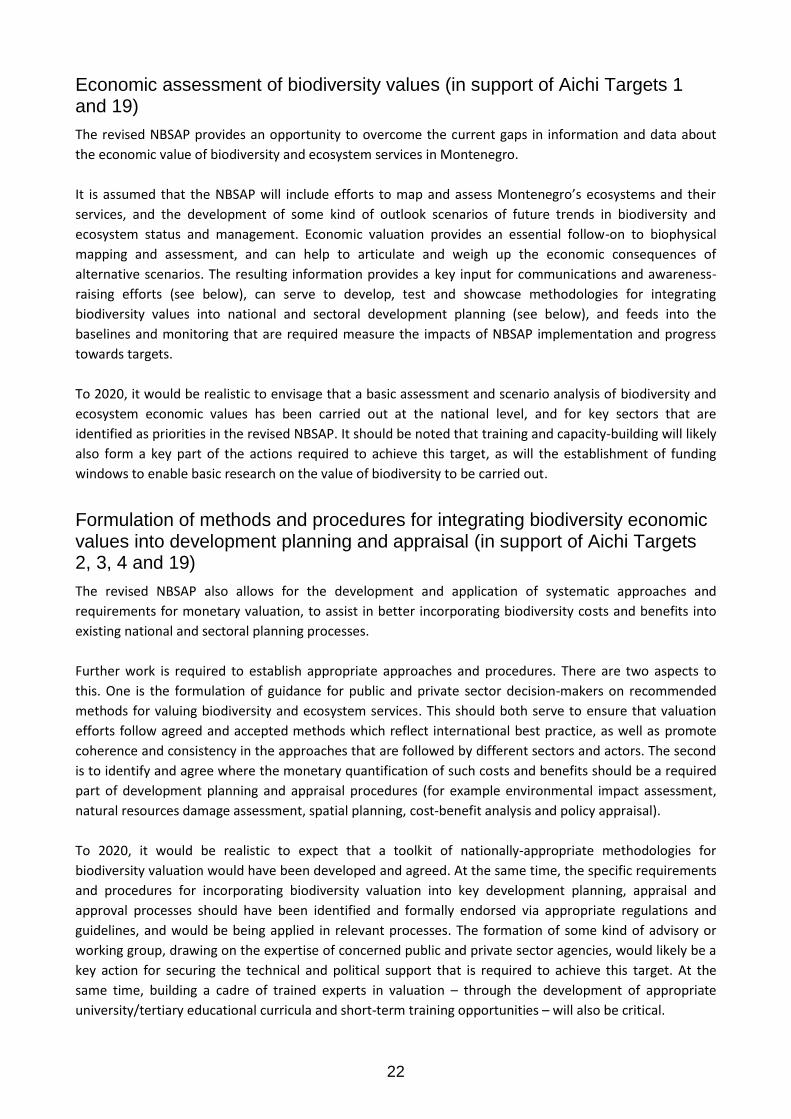
The bulk of biodiversity and ecosystem service benefits to the economy between 2011-20 (some 77%) arise
from direct value-added to production in the crop, livestock, fisheries and forestry sectors. Just under a
quarter (23%) are associated with damage costs and losses in production avoided to hydropower, water
20
supply, human settlement and infrastructure as a result of the continued protection afforded by ecosystem
services (Figure 7). In total, the cumulative gains to 2020 over and above the baseline – in other words the
amassed incremental benefit of implementing the revised NBSAP as compared to the current situation1 –
will have reached almost €150 million by 2014, €328 million by 2017 and €541 million by 2020 (Figure 8).
Figure 7: Annual values added and costs
avoided from NBSAP 2011-2020 (€ million) Figure 8: Cumulative gains over the baseline to 2020 (€ million)
1 The estimate of cumulative gains or incremental benefit only considers the effects of biodiversity and ecosystem conservation in terms of assumed improvements in the quality and unit value of ecosystem services. It excludes value-added from the increases in agricultural and fisheries production that result from more general changes in productivity, technology and market access.
21
5 APPLYING BIODIVERSITY VALUATION: potential targets and actions in the revised NBSAP
How valuation can assist in meeting the CBD Strategic Goals and Aichi Biodiversity Targets
The almost complete absence of information on, and integration of, the economic value of Montenegro’s
biodiversity has already been noted as a constraint to effective biodiversity planning and implementation.
While the current report represents a first attempt to identify, describe and quantify some of the economic
benefits associated with ecosystem services, it provides no more than a very rough, preliminary set of
indicative estimates that have been generated for illustrative purposes. It is clear that further work on
biodiversity valuation should form a key part of the revised NBSAP that is currently under development.
It is self-evident that information on economic values will be key to achieving Goal A of the Strategic Plan
2011-2020, and to meeting Aichi Targets 1 (awareness of values), 2 (integration of values into local and
national development planning, accounting and reporting) and 19 (knowledge generation, sharing and
application). These Targets explicitly deal with the generation, dissemination and use of information on
biodiversity values.
Valuation also provides an important tool in the identification, design and implementation of the actions
that will be required to meet Aichi Targets 3 (development of positive incentives and elimination of harmful
incentives) and 4 (sustainable production and consumption). Assessment and analysis of the magnitude
and distribution of costs and benefits associated with biodiversity conservation and loss in different sectors,
for different groups and as a result of different investment, production and consumption choices shows
where there are needs and opportunities to better capture, reward and compensate values in support of
biodiversity conservation. It can also help to ensure that the ensuing actions and instruments are equitable,
efficient and cost-effective for those concerned, and will be economically and financially sustainable over
the long-term. This is particularly important given the focus on mainstreaming biodiversity into the actions
and budgets of other sectors and groups: if this is to be accomplished, then clear information must be
provided about the value-added and costs avoided to them of doing so.
Last but not least, an understanding of economic values is integral to Aichi Target 20 (mobilisation of
financial resources), and CBD Strategic Goals B (reducing direct pressures promoting sustainable use), C
(improving the status of biodiversity) and D (enhancing benefits to all). Valuation provides a potentially
powerful tool to help to justify investments and actions in support of biodiversity targets and goals, by
providing a means of articulating the potential gains from undertaking such measures and the economic
costs of failing to act.
We can therefore identify two basic areas where gaps currently exist, and biodiversity economic valuation
might usefully be included in Montenegro’s revised NBSAP: in relation to the generation and dissemination
of information on biodiversity values, and the design and implementation of incentives and financing
mechanisms.
The paragraphs below focus on information generation and use. Specific market, price and policy
instruments that might be used to better capture, reward and compensate biodiversity values (i.e.
incentives and financing mechanisms) form the focus of the third report to be produced under this
assignment, which deals with recommendations on economic and financial mechanisms for biodiversity
conservation and mainstreaming, including payments for ecosystem services.
22
Economic assessment of biodiversity values (in support of Aichi Targets 1 and 19)
The revised NBSAP provides an opportunity to overcome the current gaps in information and data about
the economic value of biodiversity and ecosystem services in Montenegro.
It is assumed that the NBSAP will include efforts to map and assess Montenegro’s ecosystems and their
services, and the development of some kind of outlook scenarios of future trends in biodiversity and
ecosystem status and management. Economic valuation provides an essential follow-on to biophysical
mapping and assessment, and can help to articulate and weigh up the economic consequences of
alternative scenarios. The resulting information provides a key input for communications and awareness-
raising efforts (see below), can serve to develop, test and showcase methodologies for integrating
biodiversity values into national and sectoral development planning (see below), and feeds into the
baselines and monitoring that are required measure the impacts of NBSAP implementation and progress
towards targets.
To 2020, it would be realistic to envisage that a basic assessment and scenario analysis of biodiversity and
ecosystem economic values has been carried out at the national level, and for key sectors that are
identified as priorities in the revised NBSAP. It should be noted that training and capacity-building will likely
also form a key part of the actions required to achieve this target, as will the establishment of funding
windows to enable basic research on the value of biodiversity to be carried out.
Formulation of methods and procedures for integrating biodiversity economic values into development planning and appraisal (in support of Aichi Targets 2, 3, 4 and 19)
The revised NBSAP also allows for the development and application of systematic approaches and
requirements for monetary valuation, to assist in better incorporating biodiversity costs and benefits into
existing national and sectoral planning processes.
Further work is required to establish appropriate approaches and procedures. There are two aspects to
this. One is the formulation of guidance for public and private sector decision-makers on recommended
methods for valuing biodiversity and ecosystem services. This should both serve to ensure that valuation
efforts follow agreed and accepted methods which reflect international best practice, as well as promote
coherence and consistency in the approaches that are followed by different sectors and actors. The second
is to identify and agree where the monetary quantification of such costs and benefits should be a required
part of development planning and appraisal procedures (for example environmental impact assessment,
natural resources damage assessment, spatial planning, cost-benefit analysis and policy appraisal).
To 2020, it would be realistic to expect that a toolkit of nationally-appropriate methodologies for
biodiversity valuation would have been developed and agreed. At the same time, the specific requirements
and procedures for incorporating biodiversity valuation into key development planning, appraisal and
approval processes should have been identified and formally endorsed via appropriate regulations and
guidelines, and would be being applied in relevant processes. The formation of some kind of advisory or
working group, drawing on the expertise of concerned public and private sector agencies, would likely be a
key action for securing the technical and political support that is required to achieve this target. At the
same time, building a cadre of trained experts in valuation – through the development of appropriate
university/tertiary educational curricula and short-term training opportunities – will also be critical.
23
Ecosystem capital accounting (in support of Aichi Target 2 and 19)
The inclusion of ecosystem capital accounting into the revised NBSAP provides an appropriate means of
moving towards the incorporation of biodiversity values into national accounting and reporting systems.
Standards for ecosystem capital accounting are under development by the UN Statistics Division, and are
already being piloted on an experimental basis in the EU. These offer a potentially useful mechanism for
including ecosystem capital in Montenegro’s national accounts alongside GDP. The aim is to account for
and report on the economic value of ecosystems as a key component of natural capital and economic
assets and to incorporate the costs and benefits of changes in ecosystem status and ecosystem service
provision in measures of economic performance, reflecting both physical and monetary units of
measurement.
To 2020, it would be realistic to anticipate that methods, indicators and aggregates which could be
delivered and integrated into enlarged national accounts would have been identified, adopted and rolled
out, and that at least a preliminary version of national-level (and possibly sectoral and/or local-level)
ecosystem capital accounts has been developed and reported for Montenegro. The establishment of a
high-level working group or committee to consider and advise on data needs, sources, accounting and
reporting procedures would likely be an initial action to contribute towards this target. The Ministry of
Finance and Ministry of Economy would likely be lead agencies in undertaking the actions that are required
to achieve this target.
Strategic communication of biodiversity economic benefits and costs (in support of Aichi Targets 1 and 19, cross-cutting other Targets)
The strategic communication of biodiversity economic benefits and costs forms a key part of the
information, communication and awareness efforts that will serve as cross-cutting activities in the revised
NBSAP.
The national/ sectoral assessment(s), methodologies and approaches, valuation aspects of development
planning and appraisal processes and ecosystem capital accounting will all generate new and important
information on biodiversity costs and benefits in Montenegro. A key question is how to share and
communicate these findings and evidence effectively, especially in relation to those values and impacts
which are currently poorly recognised and understood. Making such information accessible, practical and
relevant to priority groups and stakeholders is a fundamental concern. The processes and steps outlined in
The Economics of Ecosystems and Biodiversity (TEEB) initiative, in particular, provide a particularly useful
set of experiences and lessons learned for the strategic communication of biodiversity values via targeted
campaigns for the general public, local and national policy-makers, sectoral planners, business, financial
and economic decision-makers.
To 2020, it would be realistic to expect to have developed and implemented a strategic communications
campaign on biodiversity economic values, targeted at the general public as well as decision-makers in key
public and private biodiversity-dependent and biodiversity-impacting sectors. A national, and possibly
sectoral and business, TEEB study/ies for Montenegro should also be envisaged as a means of contributing
towards generating evidence and communications materials and engaging key decision-makers and opinion
formers from both the public and private sectors.
24
REFERENCES
Arends, L. 2011. Putting a price tag on the Multi-Functional Use of Eco-System Services: The case of Morača
River and Skadar Lake in Montenegro. Paper presented at 4th ESP Conference on Ecosystem Services:
integrating Science and Practice, Wageningen.
Ceroni, M. 2007. Ecosystem services and the local economy in Maramures Mountains Natural Park,
Romania. Report submitted to United Nations Development Programme (UNDP), Bucharest.
Ceroni, M. and M. Dragoi. 2008. Assessing and capturing ecosystem benefits in Macin Mountains National
Park, Romania. Report submitted to United Nations Development Programme (UNDP), Bucharest.
Ding, H., Nunes, P. and S. Teelucksingh. 2011. European Forests and Carbon Sequestration Services: An
Economic Assessment of Climate Change Impacts. Ecosystem Services Economics (ESE) Working Paper
Series Paper No. 9, Division of Environmental Policy Implementation, United Nations Environment
Programme (UNEP), Nairobi.
Dorren, L., Bazzoffi, P., Sánchez Diaz, J., Arnoldussen, A., Barberis, R., Berényi Üveges, J., Böken, H., Castillo,
V., Düwel, O., Imeson, A., Mollenhauser, K., de la Rosa, D., Prasuhn, V., and S. Theocharopoulos. 2004.
Working Group on Soil Erosion: Task Group III on Impacts of soil erosion. Multi-stakeholder Working
Group Reports, Soil Thematic Strategy, DG Environment, European Commission, Brussels.
Dumitras, D. 2008 Comparing welfare estimates from travel cost and contingent valuation - application to
the recreation value of Romanian parks. Lucrari Stiintifice, Seria I, 10(4).
Dumitras, D., Arion, F. and E. Merce. 2011. A Brief Economic Assessment on the Valuation of National and
Natural Parks: the Case of Romania. Not. Bot. Hort. Agrobot. Cluj 39(1): 134-138.
EEA. 2011. An experimental framework for ecosystem capital accounting in Europe. EEA Technical Report
No 13/2011, European Environment Agency, Copenhagen.
Emerton, L. 2001. The Use of Economic Measures in National Biodiversity Strategies and Action Plans: A
Review of Experiences, Lessons Learned and Ways Forward. Report prepared for UNDP/UNEP/GEF
Biodiversity Planning Support Programme Sub-Project “Use of Economic Incentives in National
Biodiversity Strategies and Action Plans” GF 1200-99-70 by IUCN Regional Environmental Economics
Programme for Asia, Karachi.
Emerton, L. 2013. Environmental Economics, Finance and Biodiversity Mainstreaming Support to National
Biodiversity Planning: Inception Report. Prepared for GEF/UNDP PIMS 5024: National Biodiversity
Planning to Support the Implementation of the CBD 2011-2020 Strategic Plan in Montenegro, United
Nations Development Programme (UNDP), Podgorica.
Emerton, L., Kaludjerovic, J. and I. Jovetic. 2011. The Economic Value of Protected Areas in Montenegro.
Institute for Strategic Studies and Programmes (ISSP) and United Nations Development Programme
(UNDP), Podgorica.
FAO. 2010. Global Forest Resources Assessment 2010. Country Reports: Montenegro. FRA2010/137,
Forestry Department, Food and Agriculture Organization of the United Nations (FAO), Rome.
Gallai, N. and B. Vaissière. 2009. Guidelines for the economic valuation of pollination services at a national
scale. Food and Agriculture Organization of the United Nations (FAO), Rome.
Getzner, M. 2009. Economic and cultural values related to Protected Areas Part A: Valuation of Ecosystem
Services in Tatra (PL) and Slovensky Raj (SK) national parks. WWF World Wide Funds for Nature Danube
Carpathian Programme (DCP), Vienna.
25
ISSP. 2011. Economic Valuation of Montenegro’s Protected Area System. Report prepared for “GEF/UNDP
PIMS 4279: Catalyzing Financial Sustainability of the PA System” project, Institute for Strategic Studies
and Prognoses (ISSP), Podgorica.
Maes J., Teller A., Erhard M., Liquete C., Braat L., Berry P., Egoh B., Puydarrieux P., Fiorina C., Santos F.,
Paracchini M., Keune H., Wittmer H., Hauck J., Fiala I., Verburg P., Condé S., Schägner J., San Miguel J.,
Estreguil C., Ostermann O., Barredo J., Pereira HM., Stott A., Laporte V., Meiner A., Olah B., Royo
Gelabert E., Spyropoulou R., Petersen J., Maguire C., Zal N., Achilleos E., Rubin A., Ledoux L., Brown C.,
Raes C., Jacobs S., Vandewalle M., Connor D., and G. Bidoglio. 2013. Mapping and Assessment of
Ecosystems and their Services. An analytical framework for ecosystem assessments under action 5 of
the EU biodiversity strategy to 2020. Publications office of the European Union, Luxembourg.
MAFWM. 2006a. Agriculture and Rural Development Strategy. Ministry of Agriculture, Forestry and Water
Management, Podgorica.
MAFWM. 2006b. Fisheries Development Strategy and Capacity Building for Implementation of the EU
Common Fisheries Policy. Ministry of Agriculture, Forestry and Water Management, Podgorica.
MAFWM. 2008a. Forests for the Future of Montenegro: National Forest and Forest Land Administration
Policy. Ministry of Agriculture, Forestry and Water Management, Podgorica.
MAFWM. 2008b. National Programme for Food Production and Rural Development 2009–2013. Ministry of
Agriculture, Forestry and Water Management, Podgorica.
MEA. 2005. Millennium Ecosystem Assessment. Ecosystems and Human Well-being: Synthesis, Island Press,
Washington DC.
MED. 2007a. Energy Development Strategy of Montenegro by 2025. Ministry of Economic Development,
Podgorica.
MED. 2007b. Spatial Plan of Montenegro Until 2020. Ministry of Economic Development, Podgorica.
MED. 2011. Energy Policy of Montenegro Until 2030. Ministry of Economic Development, Podgorica.
MOF. 2011. Montenegro Economic and Fiscal Programme 2010 – 2013. Ministry of Finance, Podgorica.
MOF. 2013. Montenegro Development Directions 2013-2016. Ministry of Finance, Podgorica.
MONSTAT. 2008. Demografski trendovi u Crnoj Gori od sredine 20. Vijeka i perspektive do 2050. Godine.
Statistical Office of Montenegro, Podgorica.
MONSTAT. 2011a. Agricultural Census 2010 Book I: Structure of Agricultural Holdings – Key Variables, Land
and Livestock Resources. Statistical Office of Montenegro, Podgorica.
MONSTAT. 2011b. Agricultural Census 2010 Book II: Structure of Agricultural Holdings – Utilised Land.
Statistical Office of Montenegro, Podgorica.
MONSTAT. 2011c. Agricultural Census 2010 Book III: Structure of Agricultural Holdings – Livestock
Resources. Statistical Office of Montenegro, Podgorica.
MONSTAT. 2011d. Agricultural Census 2010 Book IV: Structure of Agricultural Holdings - Topics of Special
Interest. Statistical Office of Montenegro, Podgorica.
MONSTAT. 2011e. Agricultural Census 2010 Book V: Structure of Agricultural Holdings - Typology of
Agricultural Holdings . Statistical Office of Montenegro, Podgorica.
MONSTAT. 2012a. Statistical Yearbook 2012. Statistical Office of Montenegro, Podgorica.
MONSTAT. 2012b. Montenegro in Figures 2012. Statistical Office of Montenegro, Podgorica.
26
MONSTAT. 2013. Woodfuel consumption in 2011 in Montenegro: New Energy Balances for Woodfuel.
Statistical Office of Montenegro, Podgorica.
Mrdak, D. 2005. Economic valuation of Tara river (Montenegro). Annex 2 in WWF. The Northern
Montenegro Green Belt: Biodiversity Assessment Study on Durmitor-Tara-Prokletije Landscape.
WorldWide Fund for Nature Mediterranean Programme, Rome.
Morris, J. and M. Camino. 2011. Econmic Assessment of Freshwater , Wetland and Floodplain (FWF)
Ecosystem Services, Working Paper prepared for the UK National Ecosystem Assessment, Cranfield
University, Bedford.
MSPE. 2010a. National Biodiversity Strategy with the Action Plan for the period 2010 – 2015. Ministry for
Spatial Planning and Environment, Podgorica.
MSPE. 2010b. Fourth National Report of Montenegro to the Convention on Biological Diversity. Ministry for
Spatial Planning and Environment, Podgorica.
MSPE. 2010c. Initial National Communication on Climate Change of Montenegro to the United Nations
Framework Convention on Climate Change (UNFCCC). Ministry for Spatial Planning and Environment,
Podgorica.
MTE. 2007. National Strategy of Sustainable Development of Montenegro. Ministry of Tourism and
Environment, Podgorica.
MTE. 2008. Tourist Development Strategy to 2020. Ministry of Tourism and Environment, Podgorica.
Pagiola, S. 1996. Republic of Croatia Coastal Forest Reconstruction and Protection Project: Annex J.
Economic Analysis. Staff Appraisal Report: Report: Republic of Croatia Coastal Forest Reconstruction and
Protection Project, World Bank, Washington DC.
RMSI. 2008. Risk Assessment for South Eastern Europe: Desk Study Review. South Eastern Europe Disaster
Risk Mitigation and Adaptation Initiative. Report prepared by RMSI for the Global Facility for Disaster
Reduction and Recovery (GFDRR), UN International Strategy for Disaster Risk Reduction (UN/ISDR),
Geneva.
Rode, J., Wittmer, H. and G. Watfe. 2012, Implementation Guide for Aichi Target 2 – A TEEB perspective.
German Federal Agency for Nature Conservation (BfN), Bonn.
Ruijs, A., Wossink, A., Kortelainen, M., Alkemade, R. and C. Schulp. 2013. Trade-off analysis of ecosystem
services in Eastern Europe. Ecosystem Services 4: 82-94.
SCBD. 2007. An Exploration of Tools and Methodologies for Valuation of Biodiversity and Biodiversity
Resources and Functions. CBD Technical Series No. 28, Secretariat of the Convention on Biological
Diversity. Montreal.
SCBD. 2012a. Quick Guide to Target 1 of the Aichi Biodiversity Targets. Secretariat to the Convention on
Biological Diversity, Montreal.
SCBD. 2012b. Quick Guide to Target 2 of the Aichi Biodiversity Targets. Secretariat to the Convention on
Biological Diversity, Montreal.
Schuyt, K. and L. Brander. 2004. The Economic Values of the World’s Wetlands. WWF international, Gland.
Spurgeon, J. and D. Gallagher. 2010. Valuation of Tourism Benefits for Croatia’s Protected Areas. Report
prepared by Environmental Resources Management Ltd. for the Program on Forests (PROFOR), World
Bank, Washington DC.
TEEB. 2008. The Economics of Ecosystems and Biodiversity: An interim report. European Communities,
Brussels.
27
TEEB. 2010. The Economics of Ecosystems and Biodiversity: Mainstreaming the Economics of Nature: A
synthesis of the approach, conclusions and recommendations of TEEB.
Ten Brink, P., Avramovski, L., Vermoote, S., Bassi, S., Callebaut, K., Lust, A. and A. Hunt. 2007. Benefits for
fYRoM and other countries of SEE of compliance with the environmental acquis Final Report– Part II:
Country-specific report Montenegro. Report prepared for the European Commission – DG Environment
under Contract N° 07010406/2006/441662/MAR/E3, Arcadis Ecolas N.V., Berchem and Institute for
European Environmental Policy, Brussels.
UNEP/MAP. 2007. National Report on Current Policy, Procedures, Legal Basis and Practice of Marine Spatial
Planning in Montenegro. Priority Actions Programme Regional Activity Centre of the Mediterranean
Action Plan, United Nations Environment Programme, Athens.
UNEP-WCMC and IEEP. 2012. Incorporating Biodiversity and Ecosystem Service Values into NBSAPs:
Guidance to Support NBSAP Practitioners. United Nations Environment Programme World Conservation
Monitoring Centre, Cambridge, and Institute of European Environmental Policy, Brussels.
WMO and UNDP. 2011. IPA Beneficiary Country Needs Assessment: Montenegro. World Meteorological
Organisation (WMO) and United Nations Development Programme (UNDP), Podgorica.
WTTC. 2011a. Travel and Tourism Impact 2011: Montenegro. World Travel & Tourism Council, London.
WTTC. 2011b. Travel and Tourism: Trends and Prospects Montenegro. World Travel & Tourism Council,
London.


![[Spycob] Montenegro](https://img.pdfslide.us/doc/110x75/55d59e79bb61eb85778b4618/spycob-montenegro.jpg)