Embed Size (px)
Citation preview

ARTICLE IN PRESS
0969-8043/$ - se
doi:10.1016/j.ap
�CorrespondE-mail addr
Applied Radiation and Isotopes 66 (2008) 1146–1150
www.elsevier.com/locate/apradiso
Monte Carlo simulations of the SNM spectrafor CZT and NaI spectrometers
Liang Chen�, Yi-Xiang Wei
Department of Engineering Physics, Tsinghua University, Beijing 100084, China
Received 11 May 2007; received in revised form 9 January 2008; accepted 9 January 2008
Abstract
The detector characteristics of CZT and NaI spectrometers that affect the choice of the nuclide analysis algorithm were analyzed with
a general purpose Monte Carlo code to simulate the SNM spectra. The physical and geometric conditions strictly adhered to the IAEA
series test requirements for a portable radionuclide identification device. The Hecht equation was used to describe the incompletion
charge collection effect for the CZT detector, and a comparison calibration to determine the CZT spectrometer equivalent noise charge.
The NaI spectrometer was calibrated by experiments. The calculated results agreed well with experiments.
r 2008 Elsevier Ltd. All rights reserved.
Keywords: Monte Carlo simulation; Geant4; CZT detector; NaI detector; Nuclide analysis
1. Introduction
The International Atomic Energy Agency (IAEA) has aseries of technical requirements for SNM (Special NuclearMaterials) detection and identification (Technical andFunctional specification for border monitoring equipment,1999). This research focuses on the development ofportable radionuclide identification devices (RID) thatmeet these requirements. The RID has to identify 27 kindsof radionuclides, with a gamma energy range of30–3000 keV. The CZT detector has good energy resolu-tion, so it is a promising detector for room temperatureuse. However, the efficiency at high energies of the CZTdetector is so poor that it is impossible to use it to satisfythe energy range requirement. The NaI detector has muchbetter efficiency but worse resolution. Therefore, both CZTand NaI detectors will be used in our RID.
Several previous studies investigated the characteristics ofCZT and NaI detectors (Eisen and Shor, 1998; Rasolonja-tovo et al., 2001; Ghanem, 2000). Here, the spectra of theSNM of both CZT and NaI spectrometers were simulated
e front matter r 2008 Elsevier Ltd. All rights reserved.
radiso.2008.01.008
ing author. Tel.: +8610 62784 529.
ess: [email protected] (L. Chen).
for the conditions required by the IAEA using a generalpurpose Mont Carlo program, Geant4 version 4.8.1.p02 toconfirm that they satisfy the IAEA requirements and tochoose algorithms to analyze the spectra.Geant4 was developed at CERN for high-energy physics
experiments and is now used widely in high energy, nuclearand accelerator physics, as well as studies in medical andspace sciences (Geant4 Home Page, 2000). Geant4 uses theC++ object-oriented computer language. Users canimplement the description of the geometry and thematerials of the detector, particle transport and the physicsprocesses of interaction with materials and a particlegenerator with flexible visualization of geometries, tracksand interactions.Geant4 was used to model a simple detector geometry
consisting of a 5mm� 5mm (diameter� length) cylindricalCZT detector and a 40mm� 40mm cylindrical NaIdetector. Other conditions, such as the source strength,shield thickness and distance between the source and thedetector, were modeled strictly according to the IAEA’srequirement. To verify the calculated results, and deter-mine the resolution function and the pulse height vs. energyscale function, a CZT and a NaI detector with the samesize were used to get experiment data.

ARTICLE IN PRESSL. Chen, Y.-X. Wei / Applied Radiation and Isotopes 66 (2008) 1146–1150 1147
2. Simulation model
The IAEA publication gives a detailed test method forRIDs Technical and Functional specification for bordermonitoring equipment. Besides geometric and shieldconditions, the ambient dose equivalent rate is specifiedas 0.5 mSv/h above background where mSv/h is a doseequivalent rate unit. For the simulations, the doseequivalent rate is converted to activity. The relationshipbetween the dose equivalent rate and the source activity isgiven by
A ¼r2X
G¼
r2Da
33:85G, (1)
where A is the source activity, r is the distance between thesource and detector, X is the exposure rate, G is theexposure rate constant (The common used data of nuclearradiation dose, 1987) and Da is the absorption doseequivalent rate in air. Da is specified as 0.5 mSv/h accordingto the IAEA and r should be as small as possible to reducethe number of events and the calculational time. R was10mm for the CZT detector and 50mm for the NaIdetector. The total number of events is the product of thesource activity from Eq. (1) and the measurement timespecified by IAEA. Other conditions such as steel shieldingmaterial and thickness are strictly specified by the IAEA.The geometric model is shown in Fig. 1.
The crystal was 5mm� 5mm (diameter� length) for theCZT detector and 40mm� 40mm for the NaI detector.The front and back of the detector were covered byplatinum electrodes with the whole system enveloped in a1.143-mm aluminum shell. A 0.6-mm-thick aluminumwindow is placed in front of the cathode. The steel shieldplaced between the source and the detector is either 0- or 5-mm-thick based on the source type Technical andFunctional specification for border monitoring equipment.
3. Detector energy response simulation
The CZT and NaI detector responses were simulatedusing Geant4. The electromagnetic physics included theCompton scattering, photoelectric effect, Rayleigh effect,electron pair production, Bremsstrahlung and ionization.
Fig. 1. Detector geometry.
Low-energy processes were used so that the simulationswould be more accurate. The sources we used are from theGeant4 database. The input defined a generic ion as thesource with its atomic number and mass number, anddefined the radioactive decay physics processes. The sourcedecays and emits particles according to the nuclide decaytype. It can also define all the gamma rays according totheir branching ratio data as the source. The simulationthen tracks the gamma rays and calculates the energydeposition in the detector based on the specified electro-magnetic interactions. The program can also record thetime, position and other information of the interaction ifnecessary.
3.1. CZT energy response
In the CZT detector, the mobility–lifetime product of theholes is very small, so the analysis must consider the effectof incomplete charge collection. Once the deposited energyis known, the induced charge, which is proportional to thepulse height, can be given as a function of the interactiondepth by four models (Rasolonjatovo et al., 2001; Liuet al., 2000). The Hecht model and the sample drift lengthmodel are the most precise models according to experimentdata. The Hecht model was used since it applies over awider energy range. The Hecht equation is given by
QðzÞ ¼E
we
led
� �ð1� e�ðd�zÞ=le Þ þ
lhd
� �ð1� e�z=lhÞ, (2)
where Q(z) is the induced charge, E the deposited energy, w
the average ionization energy which is about 4.6 eV forCZT, e ¼ 6� 10�19 C, d the crystal thickness, z the depthinto the crystal from the cathode front surface, and le andlh are the mean free paths of electrons and holes,respectively. le and lh are given by
le ¼ meteE; lh ¼ mhthE, (3)
where mete and mhth is the mobility–life product of theelectrons and holes in CZT with units of cm2/V and E is theelectric field strength. In the experiments, the high voltagewas 650V, so E ¼ U/d ¼ 1300V/cm. mete and mhth are setto 5� 10�3 and 1� 10�4 cm2/V by comparison withexperimental data.The energy deposition spectra are broadened by
statistical fluctuations and electrical noise. The totaldeviation is given by
s2 ¼ fN þ s2enc, (4)
where f is the Fano factor, N the number of electron–holepairs and senc is the equivalent noise charge. The Fanofactor was set to 0.14 (Liu et al., 2000) and senc wasdetermined by comparison of the simulation results withexperimental data, as shown in Fig. 2. A least-squares fit ofthe data gave senc ¼ 0.0011E2
�1.2163E+366.5495. Thespectra were obtained by sampling from a Gaussiandistribution, using N as the average and s2 as the squaredeviation.
ARTICLE IN PRESS
Fig. 2. Calibration curve of equivalent noise charge.
Fig. 3. Calculated and experimental CZT spectra: top, Am241; middle,
Co57; bottom, Cs137.
Fig. 4. Resolution calibration curve for NaI spectrometer.
Fig. 5. Calculated and experimental NaI spectra: top, Am241; middle,
Cs137; bottom, Co60.
L. Chen, Y.-X. Wei / Applied Radiation and Isotopes 66 (2008) 1146–11501148
Some of the calculated spectra of CZT spectrometer arecompared with experimental data in Fig. 3.
The measured Co57 spectra included low energy X-raysfrom Pb used to shield the source around the spectrometer.In the Cs137 simulation, the detection efficiency for 662-keV peak was too low, so gamma rays above 662 keV wereneglected to save calculational time. The spectra werenormalized to unity at their main peaks.
The results in Fig. 3 show that the calculated spectraagree well with measured spectra at low energies. Butat high-energy side, the measured spectra peaks havehigh-energy tails due to the pileup effect, so the calculatedspectra disagree at high-energy side. Besides that, thecalculated spectra neglected the back scattering peak ofCs137.
ARTICLE IN PRESS
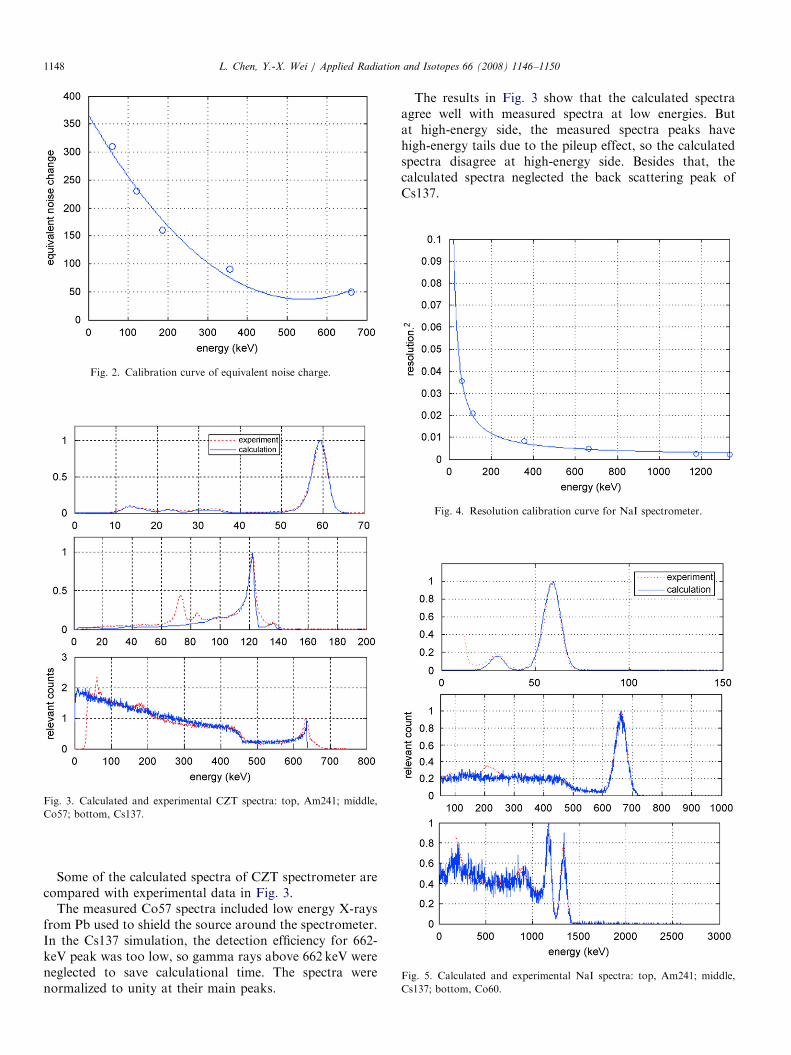
Fig. 6. Monte Carlo calculation results for NaI and CZT spectra.
L. Chen, Y.-X. Wei / Applied Radiation and Isotopes 66 (2008) 1146–1150 1149
3.2. NaI energy response
The NaI detector energy response is easier to simulatethan the CZT detector. The same program was used bychanging the detector material to NaI and changing thegeometry. The incomplete charge collection effect can beneglected for NaI. The resolution function was calibratedexperimentally as s2 ¼ 0.00156+2.0674/E, with the cali-bration curve shown in Fig. 4.
The relationship between the FWHM and standarddeviation is s ¼ FWHM/2.355. The NaI response spectrawere obtained by sampling from a Gaussian distribu-tion using the energy deposition as the average and s2
as the square deviation. Some of the calculated NaIdetector spectra are compared with measured spectra inFig. 5.
The measured Am241 spectra were influenced byelectrical noise at low energies and the back-scatter peakof Cs137 at about 200 keV is disagreed. Otherwise, thecalculated full energy peaks and Compton edges in thespectra coincide very well. With the low level radioactivity
required by the IAEA specifications, the total events are sofew for some of the spectra that some of the statisticalfluctuations are bad.
4. Results
The actual geometries of the detector and physicalmodels were used to calculate the spectra of all the SNMsources in the IAEA specifications. Some typical results areshown in Figs. 3, 5 and 6. In Fig. 6, the dose rate of eachsource is 0.5 mSv/h. The equivalent measurement time forthe NaI spectra of Cs137+HEU (90% U235, 10% U238)is 10 s and of Pu239 is 10min. The equivalent measurementtime for the CZT spectra of HEU is 20min and of Pu239 is5min.The source is shielded by a 5-mm steel sheet. The
CZT efficiency is so low that the simulation mustinclude 20min of counts for HEU and 5min for Pu239.The main features of the spectra coincide very wellwith experimental data (GR-135 Tests with SNM sources

ARTICLE IN PRESSL. Chen, Y.-X. Wei / Applied Radiation and Isotopes 66 (2008) 1146–11501150
at IAEA, 2004), so the calculated spectra can be used asreference data.
5. Conclusions
There is no single model to describe both the CZT andNaI detector characteristics over a wide energy range.Twenty-seven radionuclide spectra were simulated with thecalculated spectra agreeing well with measured spectra sothe results are valuable as a reference for the detectorcharacteristics and development of nuclide analysis algo-rithms. The results are especially accurate for the NaIdetector. For low activity level gamma ray detection, theNaI detector satisfies the energy range requirement.However, for U and Pu, the character peaks overlapwith the NaI detector and are difficult to separate in theenergy range of 100–300 keV, so the better resolution of theCZT detector plays an important role in this energy range.Some of the spectra analysis modules have been tested
using the calculated data and these will be published innear future.
References
Eisen, Y., Shor, A., 1998. Cryst. Growth 184/185, 1302–1312.
Geant4 Home Page, 2000. /http://geant4.web.cern.ch/geant4/S.
Ghanem, S.A., 2000. Appl. Radiat. Isot. 53, 877–880.
GR-135 Tests with SNM sources at IAEA, 2004. Vienna/Seibersdorf,
22–26 March.
Liu, J.C., Nelson, W.R., Seefred, R., 2000. In: Proceedings of the Second
International Workshop on EGS, 8–12 August, Tsukuba, Japan, KEK
Proceedings 200-20, pp. 135–143.
Rasolonjatovo, D.A.H., Shiomi, T., Nakamura, T., Nishizawa, H.,
Tsudaka, Y., Fujiwara, H., Araki, Matsuo, K., 2001. IEEE Trans.
Nucl. Sci. 48 (4).
Technical and Functional specification for border monitoring equipment.
Technical Guidance, IAEA Nuclear Series No. 1, 1999.
The common used data of nuclear radiation dose, 1987. China Dose
Publication, Beijing.