Embed Size (px)
Citation preview
Applied Catalysis A: General 187 (1999) 61–71
Monte Carlo simulation of oscillations in the NO–H2
reaction on Pt(1 0 0)q
V.P. Zhdanova,b,∗, B. Kasemoaa Department of Applied Physics, Chalmers University of Technology, S-412 96, Goteborg, Sweden
b Boreskov Institute of Catalysis, Russian Academy of Sciences, Novosibirsk 630090, Russia
Abstract
We present Monte Carlo simulations of phase separation during kinetic oscillations in catalytic reactions accompanied byadsorbate-induced surface restructuring. As an example, we analyze the NO–H2 reaction on Pt(1 0 0). The lattice-gas modelemployed to describe surface restructuring and the reaction steps takes into account substrate–substrate, substrate–adsorbateand adsorbate–adsorbate lateral interactions. Using a reduced generic mechanism of the reaction, we show the type ofspatio-temporal patterns which might be observed on the nm scale. ©1999 Elsevier Science B.V. All rights reserved.
Keywords:Computer simulations; Models of surface chemical reactions; Kinetic oscillations; Surface reconstruction
1. Introduction
This issue of Applied Catalysis is focused on gen-eral aspects offastcatalytic reactions. Such words as‘fast’ and ‘slow’ are always relative. In particular, themeaning of these words in combination with ‘reaction’(i.e., ‘fast reaction’ and ‘slow reaction’) is slightly dif-ferent in UHV surface-science studies, aimed at under-standing of fundamental principles of heterogeneouschemistry, and in atmospheric-pressure studies moreoriented to practical catalysis. In the former case, cat-alytic reactions are often considered to be fast if therate constants of the Langmuir–Hinshelwood steps areso large that the reaction rate is limited by adsorp-tion (with no gradients in the gas phase due to mole-cular flow conditions). In the latter case, especially in
q Contribution to a special issue of Applied Catalysis A: Generalon fast and ultrafast reactions.
∗ Corresponding author. Fax: +46-31-7723134, +7-3832-344687E-mail address:[email protected] (V.P. Zhdanov)
chemical engineering, catalytic reactions are usuallyassumed to be fast if the reaction rate is limited bygas-phase diffusion (e.g., by diffusion in pores for re-actions occuring in porous pellets). The common de-nominator between these two cases is that ‘fast’ meansso fast on the surface that reactant supply from thegas phase is the limiting factor. Both these definitionsare of course conventional, and in specific subfields ofheterogeneous catalysis one can find other meaningsof the words ‘fast reaction’ and ‘slow reaction’.
Below, we consider the former case when therate is limited by adsorption. The most importantfeature of such reactions is that they often occurfar from the adsorption–desorption equilibrium andare accompanied by kinetic phase transitions [1,2],oscillations and chaos [3–6]. Conversely, slow reac-tions are usually characterized as being close to theadsorption–desorption equilibrium.
Often, kinetic oscillations arise when a rapidbistable catalytic cycle is combined with a slow sideprocess. Examples of physically sound side processes
0926-860X/99/$ – see front matter ©1999 Elsevier Science B.V. All rights reserved.PII: S0926-860X(99)00183-0
62 V.P. Zhdanov, B. Kasemo / Applied Catalysis A: General 187 (1999) 61–71
include adsorbate-induced surface restructuring [3,4],formation of surface oxide [7] or carbon deposits[8], and diffusion limitations in the gas phase [9].Despite long standing interest, the understanding ofoscillatory kinetics is far from complete, because ex-perimental in situ data clarifying details of adsorbatebehaviour during oscillations are still limited (for arecent review, see [4,10]). Simulations of oscillationsare numerous [6,11–15], but the assumptions em-ployed in calculations are often very simplified andnot always realistic.
At UHV conditions, kinetic oscillations are oftenconnected with adsorbate-induced surface restructur-ing [3,4]. A classical example is CO oxidation onPt(1 0 0) [16]. In this case, the(1× 1) arrangement ofmetal atoms on the clean surface is metastable com-pared to a close packed quasi-hexagonal (‘hex’) ar-rangement. CO adsorption may, however, stabilize the(1×1) phase. The latter provides a feedback betweenCO and oxygen adsorption because the rate of oxy-gen adsorption on the(1× 1) patches is much higherthan on the ‘hex’ patches. This mechanism of oscil-lations proposed by Ertl and co-workers on the basisof their pioneering experiments [16] is now generallyaccepted. Ertl and co-workers were also the first todemonstrate [17] that oscillations in the rate of CO2production on Pt(1 0 0) are often accompanied on the0.1-mm scale by beautiful spatio-temporal patterns(for a review, see [10]). Later on, surface restructuringwas found to play a key role in oscillatory and chaotickinetics of other catalytic reactions as well. Examplesinclude such reactions as CO+ NO, NO+ H2, andNO + NH3 on Pt(1 0 0) [3,4].
The theoretical studies of kinetic oscillations ac-companied by surface restructuring have primarilybeen aimed at CO oxidation on Pt. The treatmentsemploying the mean-field (MF) kinetic equations[3,4,11,12] and Monte Carlo (MC) technique [13–15]were quite successful in reproducing the evolutionof reactant coverages and reaction rate observed dur-ing oscillations. The MF models (see e.g., [11,12])takes into account phase separation but, nevertheless,cannot be used to analyze spatio-temporal distribu-tion of adsorbed reactants on the nm scale becausethey operate only with average coverages for eachof the phases. In MC simulations, the distributionof adsorbed species can be calculated, but there isanother shortcoming connected with describing the
adsorbate-induced changes in the surface. In all theavailable MC models [13–15], the purely mathemat-ical rules employed to realize the steps related tosurface restructuring are far from those prescribed bystatistical mechanics. For example, surface diffusionof CO molecules is neglected or considered to beindependent of the state of metal atoms. Surface re-structuring is assumed to occur in the regions wherelocal CO or oxygen coverages are high. With suchprescriptions, well-developed phases with atomicallysharp phase boundaries, that are possible, are lacking,e.g., CO molecules are not able to induce the forma-tion of (1 × 1) islands at relatively low coverages,because there is no driving force for phase separation.In contrast, experiments indicate that such islands areformed on Pt(1 0 0) already atθCO ' 0.08± 0.05 MLfor T ' 500 K [18] or even atθCO ' 0.01 ML forT ' 400 K [19]. There are also direct observationsof phase separation on the nm scale during kineticoscillations in such reactions, e.g., as H2 and COoxidation occuring on a Pt(1 0 0) tip of a field ionmicroscope [20,21]. All these findings mean that theadsorbate-induced restructuring of the (1 0 0) face ofPt in a more complete treatment than hitherto, shouldbe described in terms of the theory of first-order phasetransitions. This is the problem we address here. Itshould be noted that the mathematical rules used inMC simulations so far have nothing in common withthe theory of first-order phase transitions.
An accurate description of adsorbate-induced sur-face restructuring on the basis of statistical theory ofphase transitions is rather difficult because the under-standing of microscopic details of this phenomenonis far from complete. As a starting point, it thereforeseems reasonable to formulate a simple well-definedlattice-gas model treating surface restructuring as afirst-order phase transition and to employ this modelfor analyzing oscillatory kinetics. This approach waspartly realized in our recent paper [22] where we pro-posed such a model and used it to analyze the influ-ence of adsorbate-induced surface changes on thermaldesorption spectra and propagation of chemical wavesin bistable reactions. In the present work, the samemodel is employed to treat kinetic oscillations in theNO–H2 reaction on Pt(1 0 0). Our main goals are (i) todemonstrate how the principles of statistical physicscan be incorporated into the kinetic model and (ii)show the type of spatio-temporal patterns which might
V.P. Zhdanov, B. Kasemo / Applied Catalysis A: General 187 (1999) 61–71 63
be observed on the nm scale. Focusing our presenta-tion on these aspects, we deliberately simplify the re-action scheme and omit many details which may beimportant in a full treatment (and may be incorporatedinto the model) but are not necessary to illustrate themain points. The generic reaction scheme used in ourstudy is therefore simpler compared to that employedto describe the CO–O2/Pt(1 0 0) system.
2. Specifics of the NO–H2 reaction on Pt(1 0 0)
Kinetic oscillations in the NO–H2 reaction onPt(1 0 0) were first observed by Nieuwenhuys et al.[23,24] at PNO = 3 × 10⁻⁹ bar, PH2 = 3–10×10−9 bar, andT = 420–520 K. Later on, this phe-nomena was studied by Ertl et al. [25,26] atPNO =1.1 × 10⁻⁹ bar, PH2 = 3–10× 10−9 bar, andT =430–455 K. The latter group combined kinetic datawith work-function and LEED measurements. Thetemperature region in which oscillations were ob-served was found to coincide with the lifting of the‘hex’ reconstruction. The latter seems to indicate thatthe (1 × 1)-‘hex’ phase transition plays a role in themechanism of oscillations. To determine if this wasthe case, in situ LEED experiments were conducted.In none of these experiments were the oscillations ac-companied by periodic variation of the(1 × 1)-‘hex’intensities. However, a number of observations havedemonstrated that the reaction system is sensitive tothe electron beam and it is still an open question ifthis affected the observations. Moreover, the LEEDmeasurements might miss the structural oscillationsdue to too small domains.
MF simulations of kinetic oscillations in the NO–H2reaction on Pt(1 0 0) were performed by Lombardo etal. [27], Gruyters et al. [28], and more recently byMakeev and Nieuwenhuys [29,30]. In the two for-mer studies, surface restructuring was assumed to playa key role in oscillations. In contrast, Makeev andNieuwenhuys [29,30] are of the opinion that the os-cillations result from the steps which are not directlyconnected with surface restructuring. First [29], theysimply ignored the adsorbate-induced phase transition.Later on [30], surface reconstruction has been takeninto account, and for the chosen set of model parame-ters it was found that the time dependence of the frac-tion of the surface in the(1× 1) state is nearly negli-
gible. From our point of view, the question about sig-nificance of adsorbate-induced changes in the surfacefor oscillations in the reaction under consideration isstill open for discussions. In this field, one first needsto understand in more detail the physics behind theoscillations and analyze the mechanism of the oscilla-tions from this perspective. It is not enough to find themathematical scheme that reproduces the oscillationsand chaos observed experimentally (because the sce-nario of the transition from oscillations to chaos is of-ten universal [31], and quite different kinetic schemescan easily result in apparently similar kinetics). Specif-ically, we need to scrutinize the possible implicationof the fact that adsorbate-induced surface restructuringresults in phase separation, since the kinetic equationsdescribing explicitly chemical reactions on islands inthe two-phase system are quite different compared tothose used in the MF approximation.
The conventional mechanism of the NO–H2 reac-tion on Pt(1 0 0) is as follows
(H2)gas 2Hads, (1)
NOgas NOads, (2)
NOads→ Nads+ Oads, (3)
2Nads→ (N2)gas, (4)
2Hads+ Oads→ (H2O)gas, (5)
3Hads+ Nads→ (NH3)gas, (6)
NOads+ Nads→ (N2O)gas. (7)
Here, steps (5) and (6) are not elementary (e.g., theNH3 formation (6) is usually assumed to occur viasequential addition of Hads to Nads).
In general, one needs to take into account all thesteps above. Practically, however, the reaction schemecan be reduced for the following reasons. (i) Our at-tention will be focused on the reaction behaviour atrelatively high temperatures (T ' 460 K) where onecan observe the transition from oscillations to chaos[24]. In this case, the rate of N2O formation is rela-tively low [24] and accordingly step (7) can as a firstapproximation be omitted. (ii) Step (6) can be omittedas well because the rate of NH3 formation is lowerthan that of N2 desorption [24] provided that the H2pressure is not too high (in principle, the NH or NH2coverages might be appreciable, but such a scenario
64 V.P. Zhdanov, B. Kasemo / Applied Catalysis A: General 187 (1999) 61–71
is not supported by the earlier simulations [27–30]).(iii) The steps resulting in H2O formation are knownto be very fast [32]. N2 desorption is rather fast aswell (the activation energy for this process is about20 kcal/mol [27]). This means that the products of theNO decomposition (step (3)) can in simulations besimply removed from the surface just after successfuldecomposition trials. (iv) The main role of H2 adsorp-tion is to provide H atoms for step (5) (the effect ofadsorbed hydrogen on surface restructuring is minorbecause the H coverage is low). But, removing Oadjust after NO decomposition, we do not need to ana-lyze in detail step (5). In other words, we do not needto include H2 adsorption explicitly.
In summary, our reduced scheme of the NO–H2 re-action on Pt(1 0 0) contains only two steps, namely,reversible NO adsorption (2) and decomposition (3).The decomposition products are removed from the sur-face immediately. Thus, we have only one adsorbedspecies, NO. If one ignores NO-induced surface re-structuring and assumes that all the adsorption sitesare active in NO decomposition, the reduced schemeof course does not yield oscillations. But in combina-tion with surface restructuring, it predicts fairly inter-esting kinetics. One could argue that this is a too sim-plified scheme. However, in our view, it rather focuseson a central point, namely that NO-induced surface re-structuring alone, in a treatment including phase sepa-ration on the surface, is enough to produce oscillatorykinetics.
3. Model
Adsorbate-induced surface restructuring resultsfrom lateral interactions between adsorbed particles,A (A ≡ NO), and metal atoms,M. On Pt(1 0 0),the surface densities ofM atoms in the stable andmetastable structures are slightly different and theadsorbate-induced phase transition is then accompa-nied by ‘forcing up’ some of theM atoms (the terms‘stable’ and ‘metastable’ will hereafter always referto the states which are stable and metastable on theclean surface). Full-scale simulations of the latterphenomenon are hardly possible at present. In ouranalysis, this complicating factor is ignored, i.e., thedensities ofM atoms in the stable and metastablestructures are considered to be equal. In this case, the
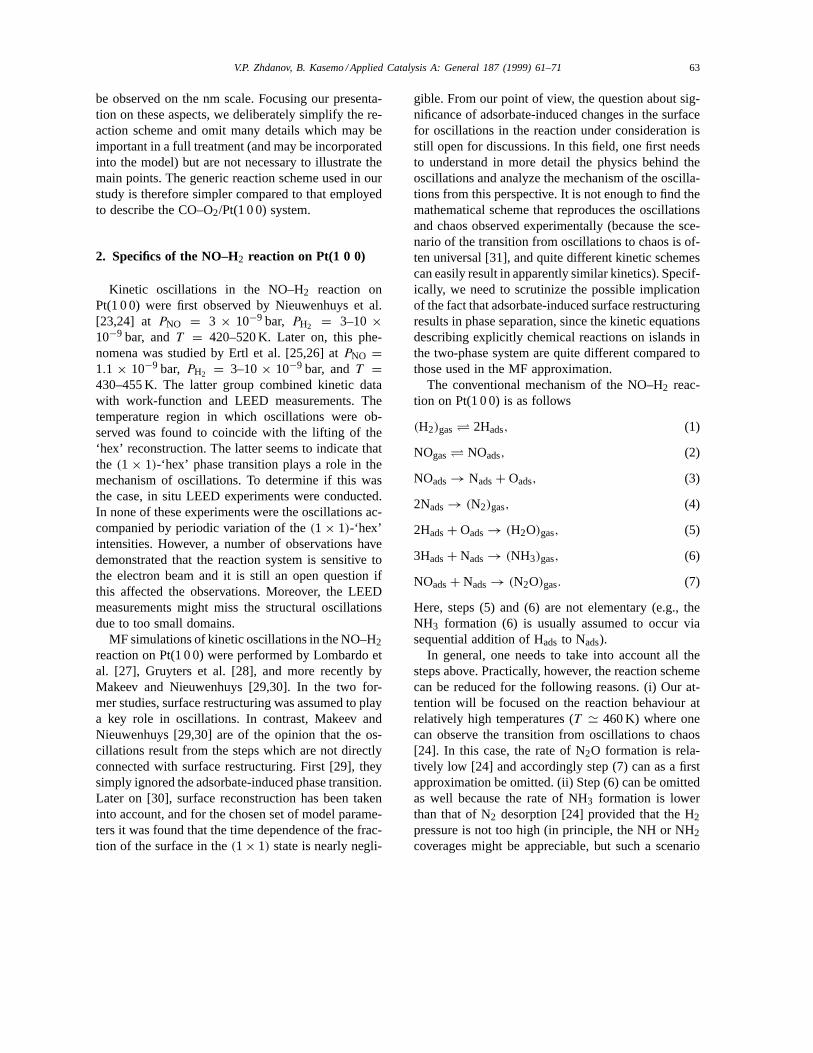
Fig. 1. Schematic arrangement of particles on the surface. Filledcircles and pluses exhibit adsorbed particles and substrate atoms inthe metastable state, respectively. Metal atoms in the stable stateare not shown.
adsorbate-induced surface restructuring can be de-scribed by employing the lattice-gas model as shownin Fig. 1. The main ingredients of this model are asfollows [22]:1. M atoms form a square lattice. EveryM atom
may be in the stable or metastable states. Theenergy difference of these states is1E. Thenearest-neighbour (nn)M–M interaction is con-sidered to be attractive,−εMM (εMM > 0), ifthe atoms are in the same states, and repulsive,εMM , if the states are different (really, the totalnn M–M interactions are of course attractive;the interactions−εMM and +εMM introduceddescribe the deviation from the average value).The next-nearest-neighbour (nnn) interactions areignored. With this choice of theM–M interac-tions, the model describes the tendency of sub-strate atoms to be either all in the stable or all inthe metastable state.
2. Adsorbed particles occupy hollow sites (this as-sumption is not essential, because in the case ofadsorption on top sites the structure of the formalequations will be the same). The adsorption en-ergy of a given particle is considered to increaselinearly with the number of nn substrate atoms inthe metastable state (this is a driving force for thephase transition). In particular, the increase of theadsorption energy of anA particle after the tran-
V.P. Zhdanov, B. Kasemo / Applied Catalysis A: General 187 (1999) 61–71 65
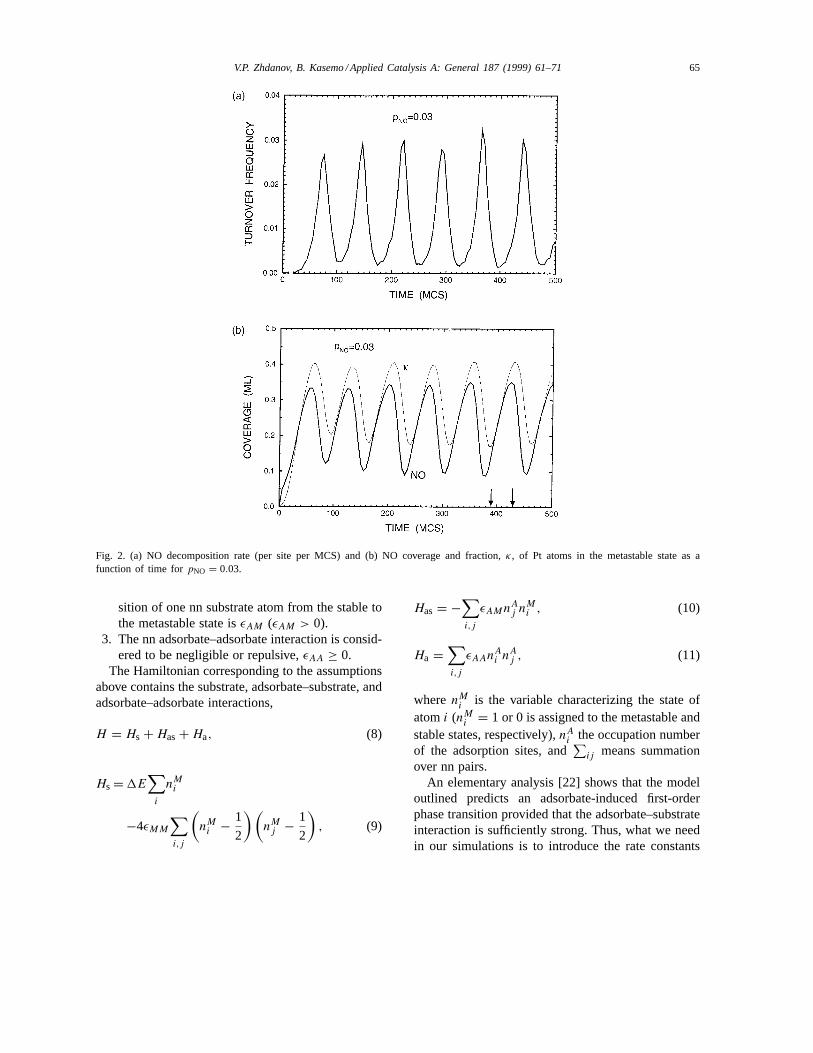
Fig. 2. (a) NO decomposition rate (per site per MCS) and (b) NO coverage and fraction,κ, of Pt atoms in the metastable state as afunction of time forpNO = 0.03.
sition of one nn substrate atom from the stable tothe metastable state isεAM (εAM > 0).
3. The nn adsorbate–adsorbate interaction is consid-ered to be negligible or repulsive,εAA ≥ 0.
The Hamiltonian corresponding to the assumptionsabove contains the substrate, adsorbate–substrate, andadsorbate–adsorbate interactions,
H = Hs + Has+ Ha, (8)
Hs = 1E∑
i
nMi
−4εMM
∑i,j
(nM
i − 1
2
) (nM
j − 1
2
), (9)
Has = −∑i,j
εAMnAj nM
i , (10)
Ha =∑i,j
εAAnAi nA
j , (11)
wherenMi is the variable characterizing the state of
atomi (nMi = 1 or 0 is assigned to the metastable and
stable states, respectively),nAi the occupation number
of the adsorption sites, and∑
ij means summationover nn pairs.
An elementary analysis [22] shows that the modeloutlined predicts an adsorbate-induced first-orderphase transition provided that the adsorbate–substrateinteraction is sufficiently strong. Thus, what we needin our simulations is to introduce the rate constants
66 V.P. Zhdanov, B. Kasemo / Applied Catalysis A: General 187 (1999) 61–71
for all the relevant elementary rate processes in ac-cordance with the model. General prescriptions ofhow to realize this procedure are described in [33].The simplest reasonable set of rules for simulatingelementary reaction steps is as follows.
Adsorption ofA particles occurs on vacant adsorp-tion sites with unit probability.
Desorption ofA particles is affected byA–A andA–M lateral interactions. The normalized dimension-less probability of desorption of a given particle isdefined as (we usekB = 1)
Wdes= exp
(EiT
), (12)
whereEi = ∑j (εAAnA
j − εAMnMj ) is a sum of nn
interactions.Diffusion of A particles occurs via jumps to nn
vacant sites. The probabilities of these jumps usuallydepend [33] on lateral interactions in the ground andactivated states (the terms ‘activated’ and ‘ground’correspond here to the transition state theory). Takinginto account that the details of diffusion complicatedby adsorbate–substrate lateral interactions are notwell established, we use for the jump probabilitiesthe Metropolis (MP) rule,
Wdif = 1 for 1E ≤ 0
and
Wdif = exp
(−1E
T
)for 1E > 0,
where 1E is the energy difference between the fi-nal and initial states. This rule, compatible with thedetailed balance principle, seems to be reasonable inour case (at least as a first approximation) becauseit predicts rather rapid diffusion on perfect stable ormetastable patches, rapid jumps at the phase bound-aries from the perfect to the metastable phase, but slowjumps in the opposite direction (because the adsorp-tion energy on metastable patches is higher).
Decomposition ofA (i.e., of NO) occurs providedthat (i) at least one nn site is vacant and (ii) all theM atoms adjacent toA and to a vacant site are in themetastable state (the latter condition takes into accountthat NO decomposition occurs primarily on the(1×1)
phase [27]). The effect of lateral interactions on theA-decomposition rate is for simplicity neglected (if
necessary, it can be taken into account as described in[34]).
Surface restructuring occurs via changes of the stateof M atoms. The probabilities of the transitions fromthe metastable to the stable state and back are givenby the MP rule (as in the case ofA diffusion).
4. Model parameters
To simulate the reaction kinetics, we use the fol-lowing set of parameters:1E/T = 2, εMM/T =0.5, εAM/T = 2 (such values are typical for sur-face restructuring). TheA–A lateral interactions arefor simplicity neglected,εAA = 0. For this set of themodel parameters corresponding to fixed temperature,we haveT ' 0.40Tc, whereTc is the critical temper-ature for the first-order adsorbate-induced phase tran-sition on the surface (Tc was calculated by analyzingtheA adsorption isotherms at different temperatures).
In addition, we need to introduce the dimension-less parameters,pres andprea (pres+ prea ≤ 1), char-acterizing the relative rates of surface restructuring,adsorption–reaction steps, and diffusion ofA parti-cles. The rates of these processes are considered tobe proportional topres, prea, and 1− pres− prea, re-spectively. In reality, the rate of surface restructuringis lower than that of the adsorption–reaction steps (i.e.pres < prea) which are in turn much slower comparedtoA diffusion (i.e.pres+prea � 1). In our simulations,we employpres/(pres+ prea) = 0.3. In addition, weuse the numberNdif ≡ (1− pres− prea)/(pres+ prea)
characterizing the ratio of the rates ofA diffusion andthe other processes. The results below are presentedfor Ndif = 1000.
In our model, the catalytic cycle includesA (NO)adsorption, desorption, and decomposition. To simu-late these steps, we introduce the dimensionless para-meterspNO for A adsorption andpdes for A desorp-tion. The rates of these processes are assumed to beproportional topNO andpdes, respectively. TheA de-composition rate is considered to be proportional to1−pdes. The simulations were executed forpdes= 0.3
5. Algorithm of simulations
The MC algorithm for simulating the reaction ki-netics consists of sequential trials of reaction, surface
V.P. Zhdanov, B. Kasemo / Applied Catalysis A: General 187 (1999) 61–71 67
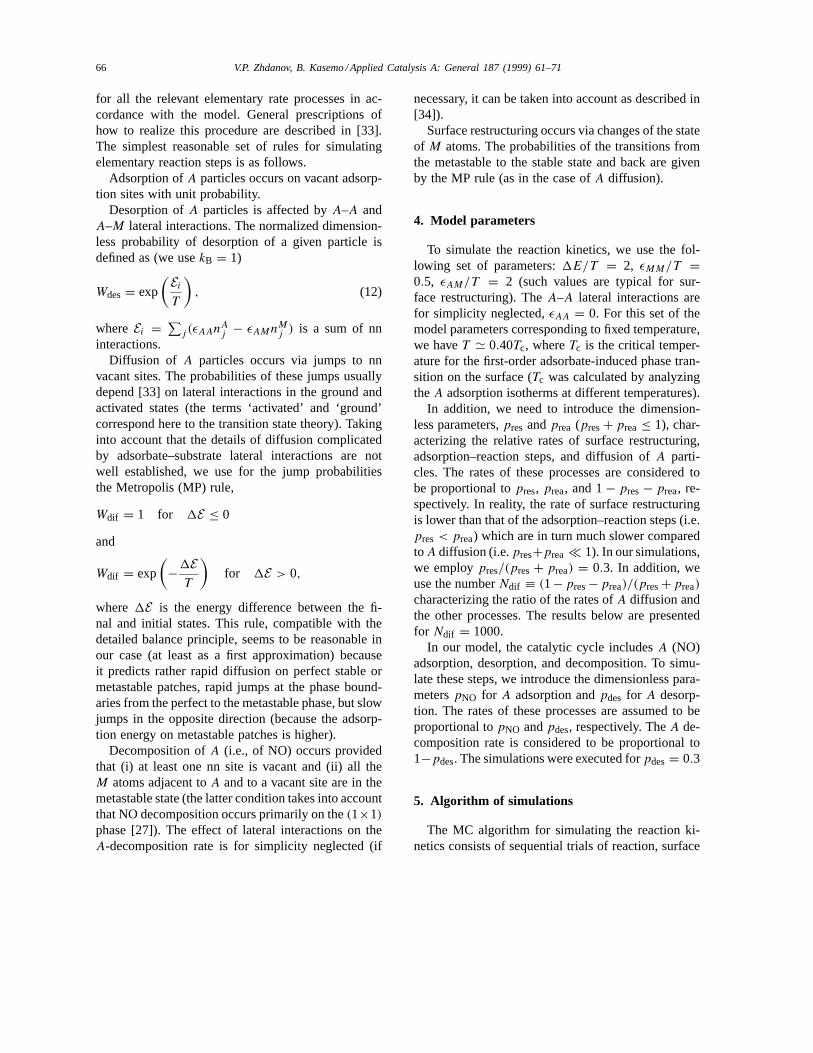
Fig. 3. (a) and (b) Snapshots of a(200× 200) lattice for the run, shown in Fig. 2, at stages (see arrows in Fig. 2(b)) when the fraction ofPt atoms in the metastable state is minimum and maximum, respectively. Panels (c) and (d) exhibit a(50× 50) fragment of the lattices(a) and (b), respectively.
restructuring, andA diffusion. A random numberρ(ρ ≤ 1) is generated. Ifρ < prea, an adsorption–reaction trial is realized (item 1). Forprea < ρ <
prea+ pres, an attempt of surface restructuring is exe-
cuted (item 2). Ifρ > prea+ pres, anA-diffusion trialis performed (item 3).1. An adsorption–reaction trial contains several
steps. (i) An adsorption site is chosen at random.
68 V.P. Zhdanov, B. Kasemo / Applied Catalysis A: General 187 (1999) 61–71
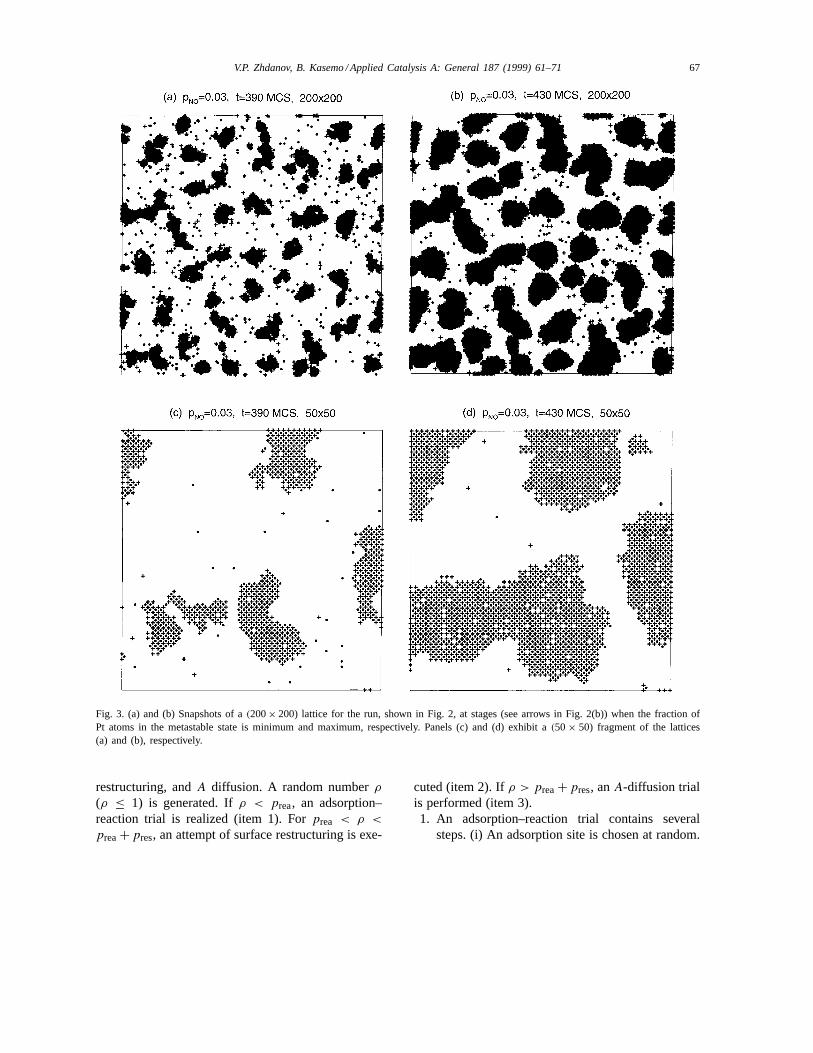
Fig. 4. (a) NO decomposition rate (per site per MCS) and (b) NO coverage and fraction of Pt atoms in the metastable state as a functionof time for pNO = 0.07.
(ii) A new random numberρ′ is generated. (iii) Ifthe site selected is vacant,A adsorption is realizedprovided thatρ′ < pNO. (iv) If the site selected isoccupied byA, A desorption or decomposition isrealized forρ′ < pdesandρ′ > pdes, respectively.For A desorption, a new random numberρ′′ isgenerated and the attempt is accepted ifρ′′ <
Wdes, whereWdes ≤ 1 is the normalized desorp-tion probability given by Eq. (12). ForA decom-position, one of the nn sites is chosen at randomand the trial is accepted if this site is vacant.
2. For surface restructuring, aM atom selected atrandom tries to change its state according to theMP rule.
3. For A diffusion, an adsorption site is chosen atrandom. If the site is vacant, the trial ends. Other-wise, anA particle located in this site tries to
diffuse. In particular, an adjacent site is randomlyselected, and if the latter site is vacant, theA par-ticle jumps to it with the probability prescribedby the MP rule.
Simulating the reaction kinetics, we consider thatinitially (at t = 0) the surface is clean and all theMatoms are in the stable state. The results have beenobtained for the(L × L)M lattices withL = 200 andperiodic boundary conditions. For oscillatory kinet-ics accompanied by phase separations, these boundaryconditions make sense provided that the typical size ofislands is much lower than the lattice size. The latterrequirement is fulfilled in our study.
To measure time, we use the so-called MCstep (MCS) defined as(L × L) attempts of theadsorption–reaction-surface-restructuring events. Inprinciple, one might define one MCS as(L × L) tri-
V.P. Zhdanov, B. Kasemo / Applied Catalysis A: General 187 (1999) 61–71 69
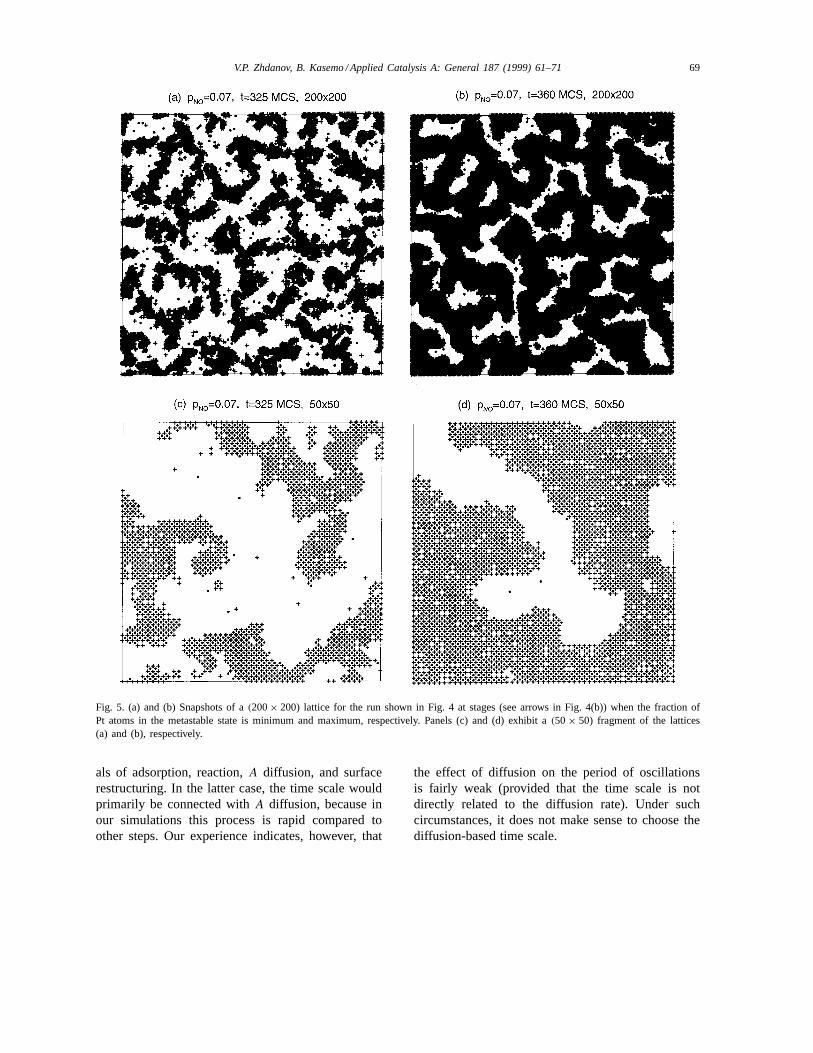
Fig. 5. (a) and (b) Snapshots of a(200× 200) lattice for the run shown in Fig. 4 at stages (see arrows in Fig. 4(b)) when the fraction ofPt atoms in the metastable state is minimum and maximum, respectively. Panels (c) and (d) exhibit a(50× 50) fragment of the lattices(a) and (b), respectively.
als of adsorption, reaction,A diffusion, and surfacerestructuring. In the latter case, the time scale wouldprimarily be connected withA diffusion, because inour simulations this process is rapid compared toother steps. Our experience indicates, however, that
the effect of diffusion on the period of oscillationsis fairly weak (provided that the time scale is notdirectly related to the diffusion rate). Under suchcircumstances, it does not make sense to choose thediffusion-based time scale.
70 V.P. Zhdanov, B. Kasemo / Applied Catalysis A: General 187 (1999) 61–71
Finally, it seems to be reasonable to discuss the re-lationship between the dimensionless MC probabili-ties and time and real rate constants and time. De-scribing the catalytic cycle, we have considered thatthe sum of the maximum probabilities of desorptionand decomposition is equal to unity. Physically, thismeans thatpdes = kdes/(kdes+ kdec) andpdec ≡ 1 −pdes= kdec/(kdes+ kdec), wherekdes andkdec are themaximum values of the desorption and decompositionrate constants. ForA adsorption, we accordingly havepNO = kadPNO/(kdes+kdec), wherekadPNO is the rate(per site) of adsorption on a clean surface (kad is theadsorption rate constant, andPNO is the NO pressure).The MC time is defined in our simulations via theadsorption–reaction-surface-restructuring events. Thismeans that the MC and real times are interconnectedas tMC = (kdes+ kdec + kres)t (kres is the maximumvalue of the rate constant of surface restructuring).
6. Results of simulations
With the specification above (Section 4), we haveonly one governing parameter,pNO (this parameter isproportional to NO pressure). Well-developed oscilla-tory kinetics are found for 0.01 ≤ pNO ≤ 0.5. Physi-cally, it is clear that oscillations can really be observedin such a broad interval only provided that the H2pressure is changed together with the NO pressure inorder to guarantee applicability of the reduced model(the experiment [24] does show oscillations in a wideNO-pressure range provided that the ratio of NO andH2 pressures is kept approximately constant).
Typical oscillatory kinetics calculated forpNO =0.03 are shown in Fig. 2. The NO coverage and am-plitude of oscillations are in this case relatively small,and NO molecules are located in non-overlapping is-lands (Fig. 3). To rationalize the mechanism of oscilla-tions, let us start from one of the points (see, e.g., Fig.3(b)) when the fraction of Pt atoms in the metastablestate is maximum. In this case, the restructured is-lands are relatively large, the local NO coverage in-side islands is rather high, and an additional supply ofNO molecules to the islands from the unrestructuredpatches is almost perfectly balanced by NO decompo-sition inside islands. The balance is however not com-pletely perfect because NO decomposition is an au-tocatalytic process. Thus, the NO coverage inside is-
lands starts to decrease. The latter is accompanied bya slow decrease of the restructured islands and also byformation of defects on the island structure. With in-creasing time, the restructured islands become rathersmall. Supply of NO molecules to such islands fromthe unrestructured patches results in the increase ofNO coverage inside islands. The latter stabilizes theisland structure and the islands start to grow. Eventu-ally, the islands again become relatively large.
With increasingpNO, the NO coverage and ampli-tude of oscillations become larger (see e.g., Fig. 4 forpNO = 0.07), and the NO islands merge as shown inFig. 5. Our preliminary simulations indicate [36] thatwith further increase inpNO the model predicts perioddoubling and chaos.
The results presented were obtained forL = 200andNdif = 1000 for times up to 500 MCS. At muchlonger times (e.g.,t = 3000 MCS), the period andamplitude of oscillations and shape of islands wereproved to be the same as att ' 500 MCS. In addi-tion, we have proven that the kinetics calculated arestable with respect to variation ofNdif andL. The ef-fect of increasingNdif from 1000 to 10,000 on oscil-lations was found to be nearly negligible. For varyingL from 100 to 400, the amplitude of oscillations de-creases but only slightly. Thus, adsorbate diffusion isable in our case to maintain synchronization of oscil-lations. For very large lattices (L � 500), this mech-anism synchronization may in principle be weak atvery long times (for a discussion, see [14]). Neverthe-less, the oscillations can really be observed providedthat the desynchronization time is longer compared tothe time of measurements. Alternatively, synchroniza-tion of oscillations might occur via the gas phase (de-tailed discussion of the latter phenomenon is beyondour goals).
7. Conclusion
We have shown that using the lattice-gas model onecan explicitly simulate phase separation on the nmscale during kinetic oscillations in catalytic reactionsaccompanied by adsorbate-induced surface restructur-ing. As an example, we analyzed a generic reducedreaction scheme mimicking the NO–H2 reaction onPt(1 0 0). In the present simulations, we employed thesimplest set of lateral interactions and simplest dynam-
V.P. Zhdanov, B. Kasemo / Applied Catalysis A: General 187 (1999) 61–71 71
ics of NO diffusion and decomposition and surface re-structuring. Changing values of lateral interaction andrules for elementary processes, one can obtain newphenomena and kinetics. The model can also be em-ployed to simulate oscillations in other reactions (e.g.,CO oxidation or NO reduction on Pt(1 0 0) [35,37]).
Acknowledgements
We thank Prof. B.E. Nieuwenhuys for presentingus the results of simulations [30] before publication.Financial support for this work has been obtained fromTFR (Contract No. 281-95-782) and from the NUTEKCompetence Center for Catalysis at Chalmers. Oneof us (V.P. Zh.) is grateful for the Waernska GuestProfessorship at Göteborg University.
References
[1] V.P. Zhdanov, B. Kasemo, Surf. Sci. Rep. 20 (1994) 111.[2] E. Albano, Heterog. Chem. Rev. 3 (1996) 389.[3] R. Imbihl, G. Ertl, Chem. Rev. 95 (1995) 697.[4] M. Gruyters, D.A. King, J. Chem. Soc., Faraday Trans. 93
(1997) 2947.[5] F. Schüth, B.E. Henry, L.D. Schmidt, Adv. Catal. 39 (1993)
51.[6] M.M. Slinko, N.I. Jaeger, Oscillatory heterogeneous catalytic
systems, in: Studies in Surface Science and Catalysis, vol.86, Elsevier, Amsterdam, 1994.
[7] B.C. Sales, J.E. Turner, M.B. Maple, Surf. Sci. 114 (1982)381.
[8] N.A. Collins, S. Sandaresan, Y.J. Chabal, Surf. Sci. 180 (1987)136.
[9] D. Kulginov, V.P. Zhdanov, B. Kasemo, J. Chem. Phys. 106(1997) 3117.
[10] H.H. Rotermund, Surf. Sci. Rep. 29 (1997) 265.[11] R. Imbihl, M.P. Cox, G. Ertl, H. Müller, W. Brenig, J. Chem.
Phys. 83 (1985) 1578.
[12] M. Gruyters, T. Ali, D.A. King, J. Phys. Chem. 100 (1996)14417.
[13] V.N. Kuzovkov, O. Kortlüke, W. von Niessen, J. Chem. Phys.108 (1998) 5571.
[14] R.J. Gelten, A.P. Jansen, R.A. van Santen, J.J. Lukkien, J.P.L.Segers, P.A.J. Hibers, J. Chem. Phys. 108 (1998) 5921.
[15] E.V. Albano, J. Chem. Phys. 109 (1998) 7498.[16] G. Ertl, P.R. Norton, J. Rüstig, Phys. Rev. Lett. 49 (1982)
177.[17] M.P. Cox, G. Ertl, R. Imbihl, Phys. Rev. Lett. 54 (1985) 1725.[18] T.E. Jackman, K. Griffith, J.A. Davies, P.R. Norton, J. Chem.
Phys. 79 (1983) 3529.[19] M. Kim, W.S. Sim, D.A. King, J. Chem. Soc., Faraday Trans.
92 (1996) 4781.[20] V. Gorodetskii, J. Lauterbach, H.H. Rotermund, J.H. Block,
G. Ertl, Nature 370 (1994) 276.[21] Yu. Suchorski, J. Beben, R. Imbihl, Surf. Sci. 405 (1998)
L477.[22] V.P. Zhdanov, B. Kasemo, J. Stat. Phys. 90 (1998) 79.[23] J. Siera, P. Cobden, K. Tanaka, B.E. Nieuwenhuys, Catal.
Lett. 10 (1991) 335.[24] P. Cobden, J. Siera, K. Tanaka, B.E. Nieuwenhuys, J. Vac.
Sci. Technol. A 10 (1992) 2487.[25] M. Slinko, T. Fink, T. Löher, H.H. Madden, S.J. Lombardo,
R. Imbihl, G. Ertl, Surf. Sci. 264 (1992) 157.[26] M. Slinko, T. Fink, T. Löher, H.H. Madden, S.J. Lombardo,
R. Imbihl, G. Ertl, Surf. Sci. 269 (1992) 481.[27] S.J. Lombardo, T. Fink, R. Imbihl, J. Chem. Phys. 98 (1993)
5526.[28] M. Gruyters, A.T. Pasteur, D.A. King, J. Chem. Soc., Faraday
Trans. 92 (1996) 2941.[29] A.G. Makeev, B.E. Nieuwenhuys, J. Chem. Phys. 108 (1998)
3740.[30] A.G. Makeev, B.E. Nieuwenhuys, Surf Sci. 418 (1998) 432.[31] S.K. Scott, Chemical Chaos, Clarendon Press, Oxford, 1991.[32] B. Hellsing, B. Kasemo, V.P. Zhdanov, J. Catal. 132 (1991)
210.[33] V.P. Zhdanov, Elementary Physicochemical Processes on
Solid Surfaces, Plenum Press, New York, 1991.[34] V.P. Zhdanov, B. Kasemo, J. Chem. Phys. 104 (1996) 2446.[35] V.P. Zhdanov, B. Kasemo, to be published.[36] V.P. Zhdanov, unpublished results.[37] V.P. Zhdanov, J. Chem. Phys. 110 (1999) 8748.


![Release 0.1.2dev0 Takafumi Arakaki...orgparse Documentation, Release 0.1.2dev0 (continued from previous page) >>> h2=h1.children[0] >>> h3=h2.children[0] >>> print(h1) * Heading 1](https://img.pdfslide.us/doc/110x75/608f2669b5a3452cf713b942/release-012dev0-takafumi-arakaki-orgparse-documentation-release-012dev0.jpg)