Embed Size (px)
Citation preview

Pag
e1
Montana Water Supply Outlook Report
April 1st, 2020
Snowpack across Montana has made a significant recovery since January 1st. Although March was below normal for snowfall in some locations, the abundant January and February snowfall and below-average temperatures during the month have resulted in snowpack on April 1st that is holding strong across the state. Water users are encouraged to view their specific river basin of interest to better under the relationship between snowpack, water year precipitation, and streamflow forecasts for their area of interest this year.
Pag
e2
For more water supply and resource management information, contact: Lucas Zukiewicz Water Supply Specialist Federal Building 10 East Babcock, Room 443 Bozeman, MT 59715 Phone 406-587-6843 [email protected] http://www.nrcs.usda.gov/wps/portal/nrcs/main/mt/snow/
Montana Water Supply Outlook Report as of April 1st, 2020
How Forecasts Are Made
Most of the annual streamflow in the Western United States originates as snowfall that has accumulated high in the mountains during winter and early spring. As the snowpack accumulates, hydrologists estimate the runoff that will occur when it melts. Predictions are based on careful measurements of snow water equivalent at selected index points. Precipitation, temperature, soil moisture and antecedent streamflow data are combined with snowpack data to prepare runoff forecasts. Streamflow forecasts are coordinated by Natural Resources Conservation Service and National Weather Service hydrologists. This report presents a comprehensive picture of water supply conditions for areas dependent upon surface runoff. It includes selected streamflow forecasts, summarized snowpack and precipitation data, reservoir storage data, and narratives describing current conditions. Snowpack data are obtained by using a combination of manual and automated SNOTEL measurement methods. Manual readings of snow depth and water equivalent are taken at locations called snow courses on a monthly or semi-monthly schedule during the winter. In addition, snow water equivalent, precipitation and temperature are monitored on a daily basis and transmitted via meteor burst telemetry to central data collection facilities. Both monthly and daily data are used to project snowmelt runoff. Forecast uncertainty originates from two sources: (1) uncertainty of future hydrologic and climatic conditions, and (2) error in the forecasting procedure. To express the uncertainty in the most probable forecast, four additional forecasts are provided. The actual streamflow can be expected to exceed the most probable forecast 50% of the time. Similarly, the actual streamflow volume can be expected to exceed the 90% forecast volume 90% of the time. The same is true for the 70%, 30%, and 10% forecasts. Generally, the 90% and 70% forecasts reflect drier than normal hydrologic and climatic conditions; the 30% and 10% forecasts reflect wetter than normal conditions. As the forecast season progresses, a greater portion of the future hydrologic and climatic uncertainty will become known and the additional forecasts will move closer to the most probable forecast. The United States Department of Agriculture (USDA) prohibits discrimination in its programs on the basis of race, color, national origin, sex, religion, age,
disability, political beliefs and marital or familial status. (Not all prohibited bases apply to all programs.) Persons with disabilities who require alternative means for communication of program information (Braille, large print, audiotape, etc.) should contact USDA's TARGET Center at (202) 720-2600 (voice and TDD). To file a complaint, write the Secretary of Agriculture, U.S. Department of Agriculture, Washington, D.C., 20250, or call 1-800-245-6340 (voice) or (202) 720-1127 (TDD). USDA is an equal employment opportunity employer.
Pag
e3
NRCS Highlight – Prevent Invasive Species Movement in Irrigation Water
We all anticipate spring run-off and the delivery of irrigation water flowing through canals and irrigation ways. As agricultural producers, we rely on high quality water being delivered efficiently through canals to over two million acres of irrigated land in Montana. Unfortunately, the quantity and quality of irrigation water can be compromised by invasive species. Invasive species, also known as exotics or non-native species, are plants, animals, insects, and aquatic species introduced into Montana’s habitats. Without natural predators or threats, these invasive species multiply and cause economic and environmental impacts such as clogged waterways, decreased native species diversity, damage to irrigation infrastructure, increased management costs, reduced pumping capacity, increased algae blooms, and decreased water quality.
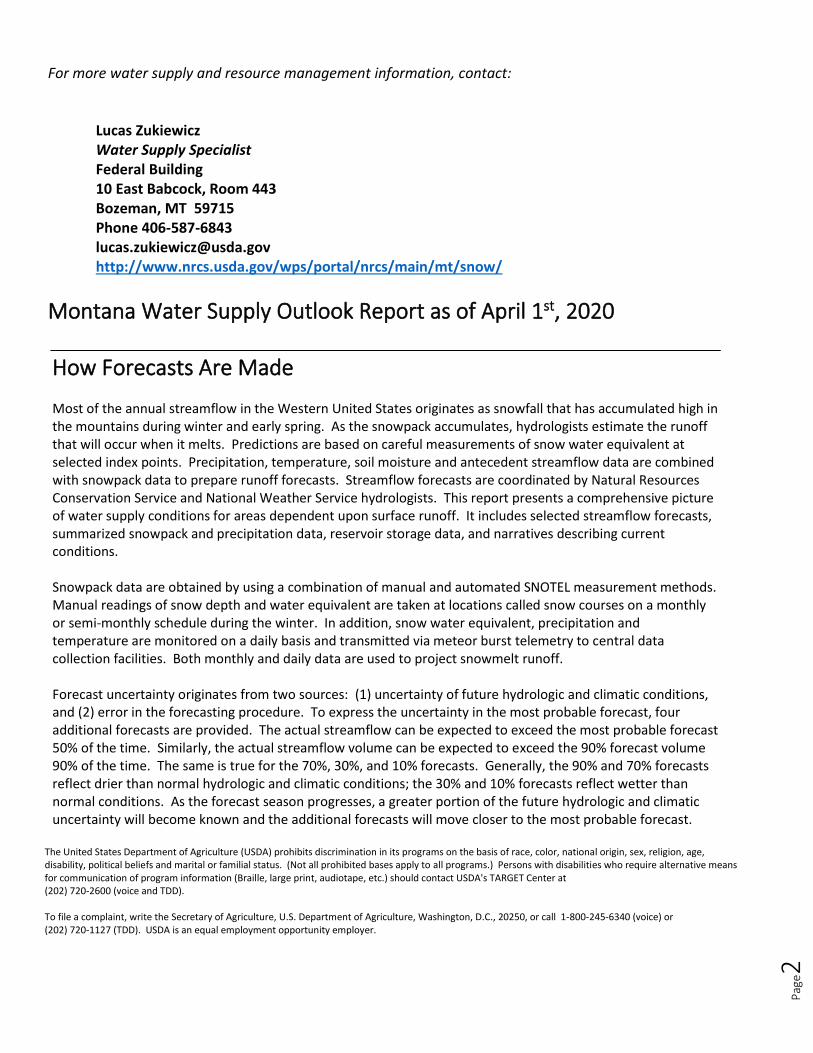
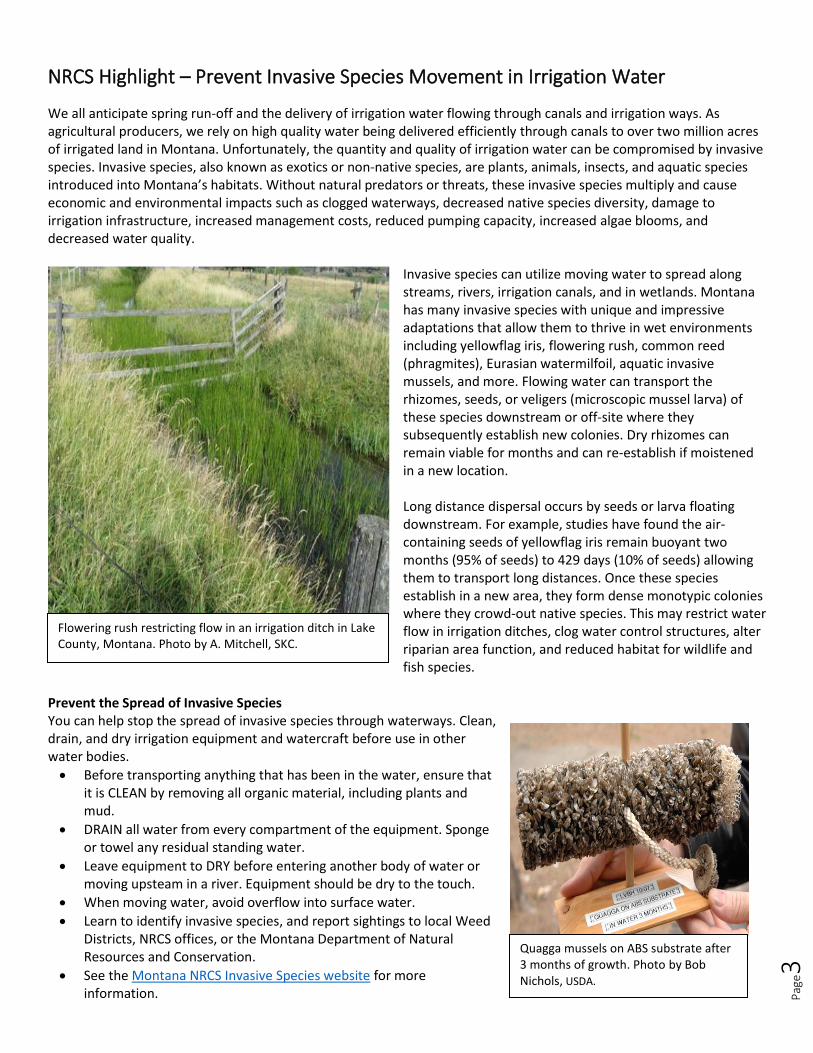
Invasive species can utilize moving water to spread along streams, rivers, irrigation canals, and in wetlands. Montana has many invasive species with unique and impressive adaptations that allow them to thrive in wet environments including yellowflag iris, flowering rush, common reed (phragmites), Eurasian watermilfoil, aquatic invasive mussels, and more. Flowing water can transport the rhizomes, seeds, or veligers (microscopic mussel larva) of these species downstream or off-site where they subsequently establish new colonies. Dry rhizomes can remain viable for months and can re-establish if moistened in a new location. Long distance dispersal occurs by seeds or larva floating downstream. For example, studies have found the air-containing seeds of yellowflag iris remain buoyant two months (95% of seeds) to 429 days (10% of seeds) allowing them to transport long distances. Once these species establish in a new area, they form dense monotypic colonies where they crowd-out native species. This may restrict water flow in irrigation ditches, clog water control structures, alter riparian area function, and reduced habitat for wildlife and fish species.
Prevent the Spread of Invasive Species You can help stop the spread of invasive species through waterways. Clean, drain, and dry irrigation equipment and watercraft before use in other water bodies.
• Before transporting anything that has been in the water, ensure that it is CLEAN by removing all organic material, including plants and mud.
• DRAIN all water from every compartment of the equipment. Sponge or towel any residual standing water.
• Leave equipment to DRY before entering another body of water or moving upsteam in a river. Equipment should be dry to the touch.
• When moving water, avoid overflow into surface water.
• Learn to identify invasive species, and report sightings to local Weed Districts, NRCS offices, or the Montana Department of Natural Resources and Conservation.
• See the Montana NRCS Invasive Species website for more information.
Quagga mussels on ABS substrate after 3 months of growth. Photo by Bob Nichols, USDA.
Flowering rush restricting flow in an irrigation ditch in Lake County, Montana. Photo by A. Mitchell, SKC.

Pag
e4
Monthly Weather – General Summary
The month of March didn’t yield the abundance of moisture to Montana as January and February did; storms during the
month favored the southwest and south-central mountain ranges. In these areas, above normal monthly snow totals
were reported due periods of southwest flow during mid March. Other regions, which had been benefitting from the
northwest and westerly flow during January and February, were left with below-normal snow totals and prolonged
periods between reported snowfall.
The month of March started on the warm side, with many mountain locations setting new records for the highest daily
average temperature on record at SNOTEL sites for March 6th (+/-25 years of history). The warm air moved out of the
state for the remainder of the month, with mountain temperatures staying near to below average for the daily average
temperature at most locations.
Cold arctic air, which spilled into
the state for a brief period
during the second week of
March, set new records for the
lowest daily average
temperature at many mountain
locations in northern and Central
Montana on March 14th.
Overall, mountain temperatures were below average for March, which is good news for water users in the state as it kept snowpack holding steady at mountain locations.
500mB and 850mB Height Analysis – Mean for the March 1st
through March 31st
period.
Pag
e5
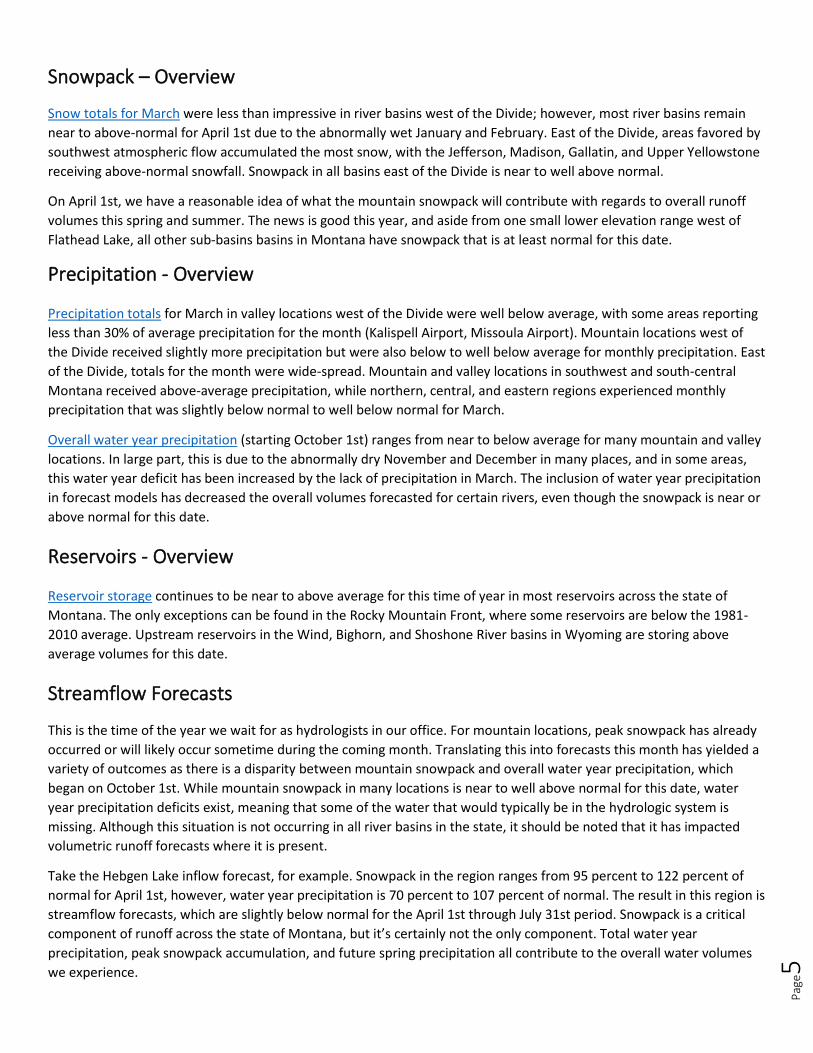
Snowpack – Overview
Snow totals for March were less than impressive in river basins west of the Divide; however, most river basins remain
near to above-normal for April 1st due to the abnormally wet January and February. East of the Divide, areas favored by
southwest atmospheric flow accumulated the most snow, with the Jefferson, Madison, Gallatin, and Upper Yellowstone
receiving above-normal snowfall. Snowpack in all basins east of the Divide is near to well above normal.
On April 1st, we have a reasonable idea of what the mountain snowpack will contribute with regards to overall runoff
volumes this spring and summer. The news is good this year, and aside from one small lower elevation range west of
Flathead Lake, all other sub-basins basins in Montana have snowpack that is at least normal for this date.
Precipitation - Overview Precipitation totals for March in valley locations west of the Divide were well below average, with some areas reporting
less than 30% of average precipitation for the month (Kalispell Airport, Missoula Airport). Mountain locations west of
the Divide received slightly more precipitation but were also below to well below average for monthly precipitation. East
of the Divide, totals for the month were wide-spread. Mountain and valley locations in southwest and south-central
Montana received above-average precipitation, while northern, central, and eastern regions experienced monthly
precipitation that was slightly below normal to well below normal for March.
Overall water year precipitation (starting October 1st) ranges from near to below average for many mountain and valley
locations. In large part, this is due to the abnormally dry November and December in many places, and in some areas,
this water year deficit has been increased by the lack of precipitation in March. The inclusion of water year precipitation
in forecast models has decreased the overall volumes forecasted for certain rivers, even though the snowpack is near or
above normal for this date.
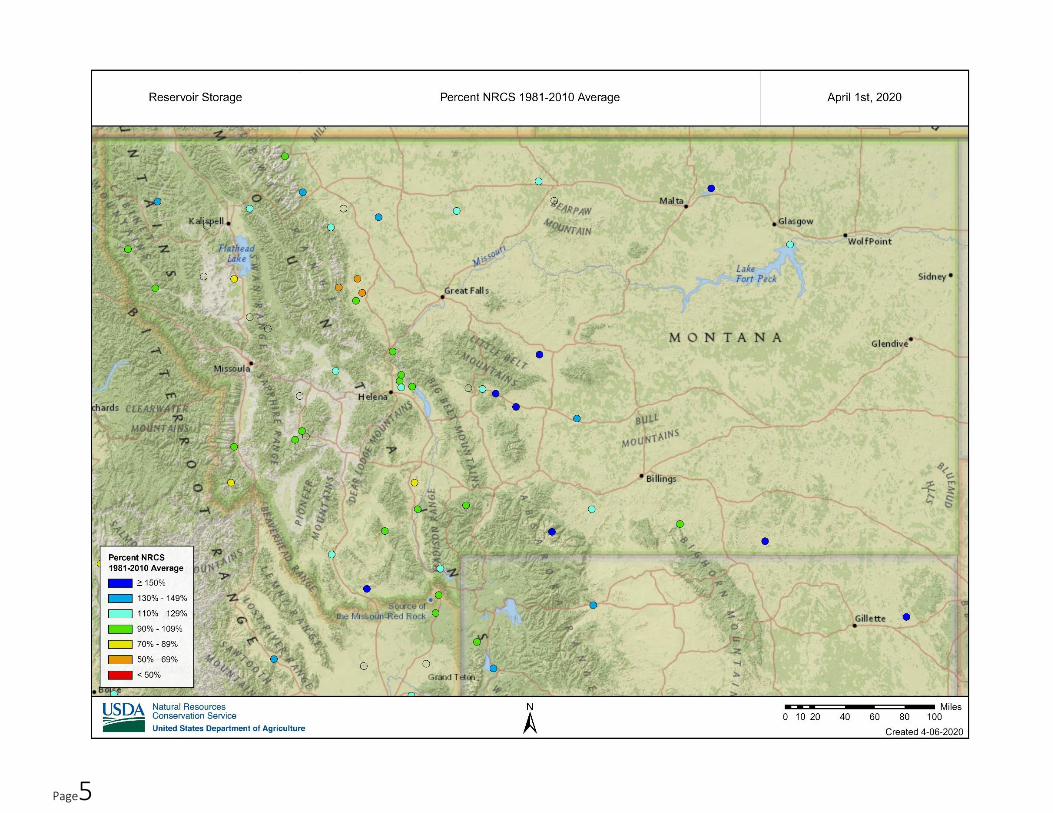
Reservoirs - Overview Reservoir storage continues to be near to above average for this time of year in most reservoirs across the state of
Montana. The only exceptions can be found in the Rocky Mountain Front, where some reservoirs are below the 1981-
2010 average. Upstream reservoirs in the Wind, Bighorn, and Shoshone River basins in Wyoming are storing above
average volumes for this date.
Streamflow Forecasts
This is the time of the year we wait for as hydrologists in our office. For mountain locations, peak snowpack has already
occurred or will likely occur sometime during the coming month. Translating this into forecasts this month has yielded a
variety of outcomes as there is a disparity between mountain snowpack and overall water year precipitation, which
began on October 1st. While mountain snowpack in many locations is near to well above normal for this date, water
year precipitation deficits exist, meaning that some of the water that would typically be in the hydrologic system is
missing. Although this situation is not occurring in all river basins in the state, it should be noted that it has impacted
volumetric runoff forecasts where it is present.
Take the Hebgen Lake inflow forecast, for example. Snowpack in the region ranges from 95 percent to 122 percent of
normal for April 1st, however, water year precipitation is 70 percent to 107 percent of normal. The result in this region is
streamflow forecasts, which are slightly below normal for the April 1st through July 31st period. Snowpack is a critical
component of runoff across the state of Montana, but it’s certainly not the only component. Total water year
precipitation, peak snowpack accumulation, and future spring precipitation all contribute to the overall water volumes
we experience.
Pag
e6
As a whole, streamflow forecasts across the state are still near to slightly above average for the April 1st through July
31st period. Water users are encouraged to look at the individual basin narratives for forecasts in their region of
interest, as forecasts can vary widely within a river basin. As we progress into spring, we should continue to accumulate
snowpack in the mid and high elevations, and May 1st forecasts will use a more accurate snapshot into our peak
snowpack at the high elevations.
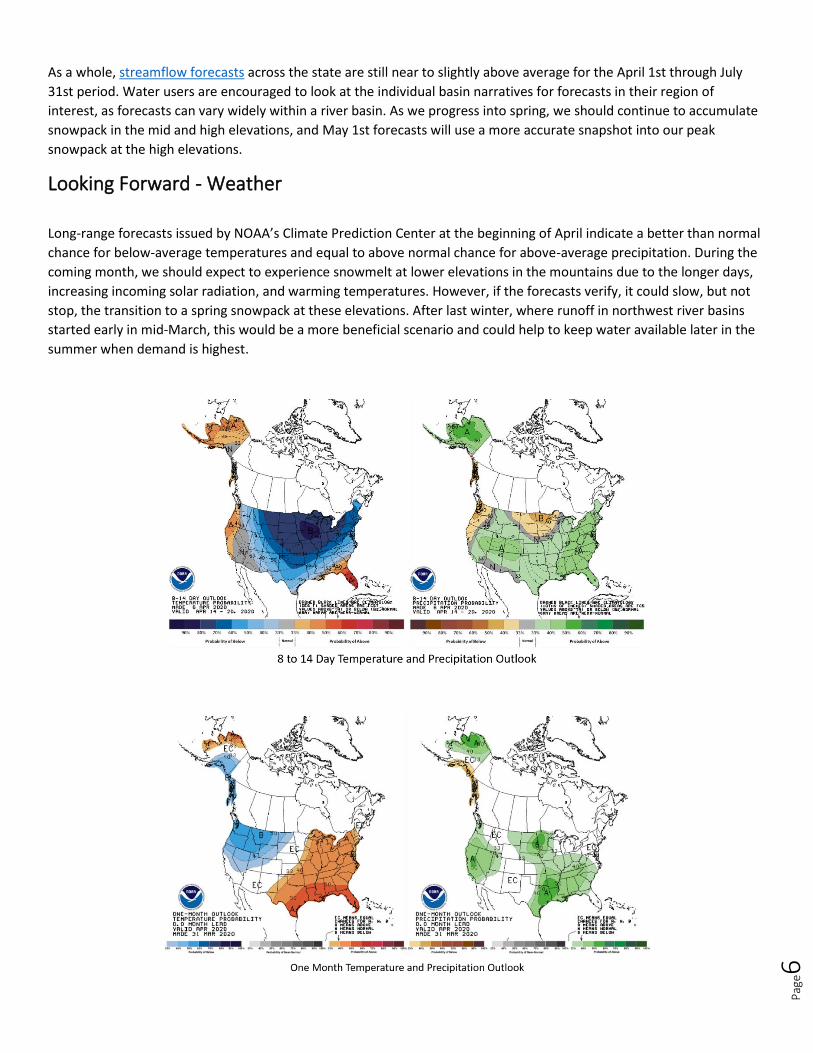
Looking Forward - Weather
Long-range forecasts issued by NOAA’s Climate Prediction Center at the beginning of April indicate a better than normal
chance for below-average temperatures and equal to above normal chance for above-average precipitation. During the
coming month, we should expect to experience snowmelt at lower elevations in the mountains due to the longer days,
increasing incoming solar radiation, and warming temperatures. However, if the forecasts verify, it could slow, but not
stop, the transition to a spring snowpack at these elevations. After last winter, where runoff in northwest river basins
started early in mid-March, this would be a more beneficial scenario and could help to keep water available later in the
summer when demand is highest.

Pag
e1
Data Table – Basin-Wide Values
Snow Water Equivalent% Normal Monthly % Avg Water Year % Avg % Average % Capacity
Columbia River Basin 108 70 93 128 63
Kootnenai in Montana 107 85 91 145 61
Flathead in Montana 109 73 98 116 63
Upper Clark Fork 105 58 90 105 79
Bitterroot 112 60 91 89 33
Lower Clark Fork 104 65 89 104 96
Missouri River Basin 112 93 99 115 78
Jefferson 109 89 96 120 64
Madison 106 117 93 110 79
Gallatin 115 119 114 98 54
Headwaters Mainstem 107 78 99 118 81
Smith-Judith-Musselshell 118 57 99 144 84
Sun-Teton-Marias 114 86 96 109 57
St. Mary-Milk 139 118 110 131 60
Yellowstone River Basin 113 87 100 103 58
Upper Yellowstone 119 115 106 116 51
Bighorn 112 77 102 99 58
Tongue 104 44 95 178 73
Powder 115 55 105
Montana State-Wide 111 85 97 118 72
Color Scale <50% 51 to 70% 71 to 90% 91% to 110% >110%
Precipitation Reservoir Storage4/1/2020

Page1

Page2

Page3

Page4
Page5

Page6

Pag
e7
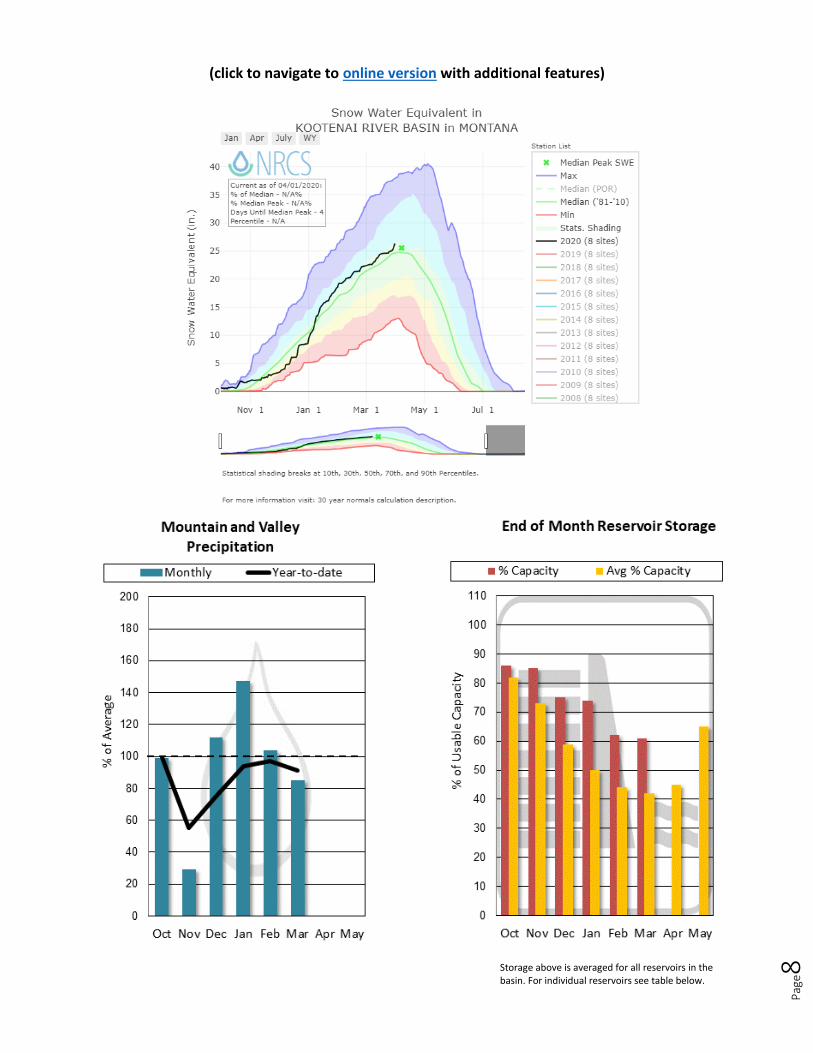
Kootenai River Basin
Snowpack for the year remains above normal in the Kootenai Basin as March storms have continued to add to totals accumulated mainly in January. Only Banfield Mountain and Hand Creek SNOTELs are below normal, with Hand Creek receiving the lowest March precipitation on record. On the west side of the basin, many sites gained an inch of snow water equivalent over the last few days of March, with Bear Mountain SNOTEL gaining almost four inches of water equivalent. North of the border, snow totals remain at or above normal as of April 1st. Snowpack, on average, peaks in mid-April in the Kootenai before transitioning to the melt phase of spring, but with the current NOAA 30 day prediction, the accumulation phase may be prolonged this year. Below-average temperatures and normal precipitation are forecasted. For now, streamflow forecasts for the mainstem of the Kootenai are above normal for the April 1st through July 31st period. Please reference the table below to see conditions in your region of interest.
Kootenai River Basin Data Summary
Snowpack Percent of 1981-2010
Normal (Median) Last Year Percentage of
Normal (Median)
KOOTENAY in CANADA 117% 74%
KOOTENAI MAINSTEM 106% 78%
TOBACCO 111% 82%
FISHER 102% 90%
YAAK 115% 86%
KOOTENAI RIVER BASIN in MONTANA 107% 83%
KOOTENAI ab BONNERS FERRY 109% 82%
Basin-Wide Snowpack 107% 83%
Precipitation Monthly Percentage of
Average WYTD Percentage of 1981-
2010 Average* WYTD Last Year
Percentage of Average
Mountain Precipitation 86% 92% 75%
Valley Precipitation 53% 74% 103%
Basin-Wide Precipitation 85% 91% 76%
*WYTD Precipitation is October 1st- Current
Reservoir Storage Percentage of Average
Percentage of Capacity (Total)
Last Year Percentage of Average
Basin-Wide Reservoir Storage 145% 61% 148%
*See Reservoir Storage Table for storage in individual reservoirs
Pag
e8
(click to navigate to online version with additional features)
Storage above is averaged for all reservoirs in the basin. For individual reservoirs see table below.

Pag
e9

Pag
e10
Flathead River Basin
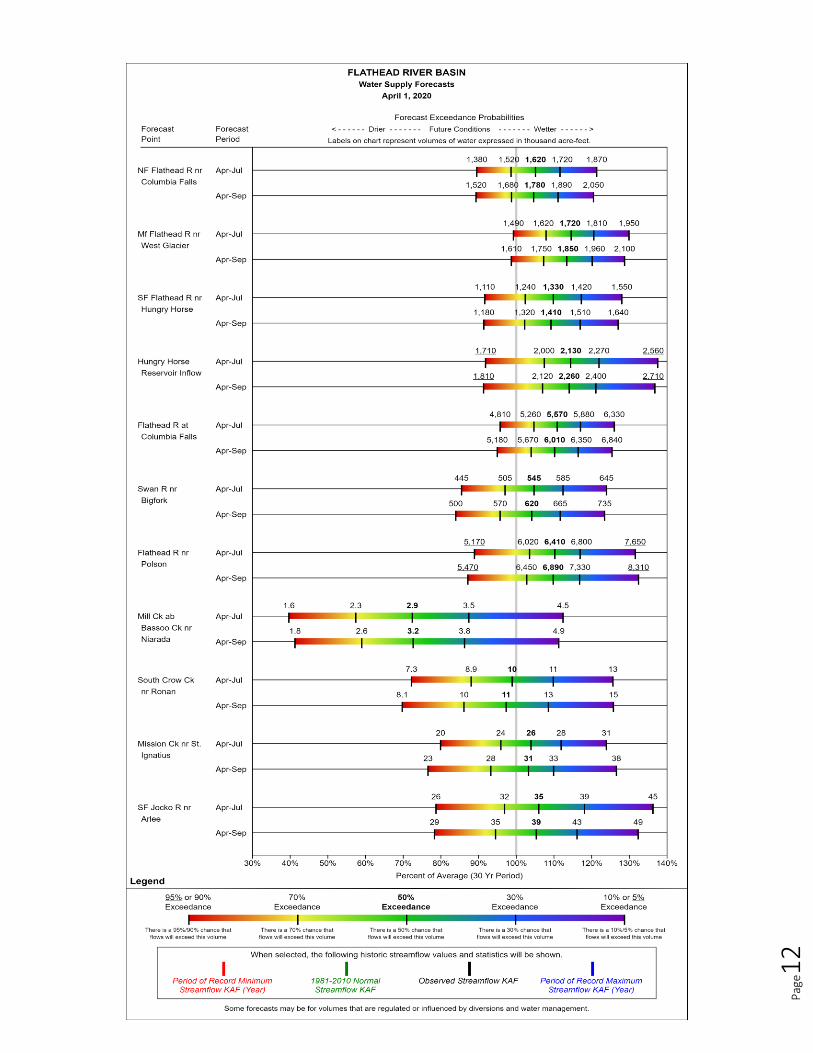
Snowpack in the Flathead basin remains above normal for the third month in a row, with storms favoring the North Fork during March, adding to the already above normal snow totals. Low elevation sites continue to hold below normal snowpack, a carryover from below-average early winter, and valley precipitation. SNOTEL Sites on the west side of the drainage are recording 50-90% of normal snowpack, and Hand Creek SNOTEL recorded its lowest March precipitation on record. As a result, west-wide sub-basins fed by lower elevation snowpack and valley precipitation are below normal, such as Flathead tributaries fed by the Salish Mountains and Ashley Lake Divide. These areas will be more dependent on late spring and summer precipitation to maintain flows throughout the summer. The North Fork, South Fork, and Middle Fork have streamflows forecasted to be above average for April 1st – July 31st period due to snow totals in the Mission, Swan, and Livingston Ranges ranging from 110-120% of normal. Please reference the tables below to find forecasts for your specific drainage.
Flathead River Basin Data Summary
Snowpack Percent of 1981-2010
Normal (Median) Last Year Percentage of
Normal (Median)
NF FLATHEAD in CANADA % %
NF FLATHEAD in MONTANA 114% 80%
MIDDLE FORK FLATHEAD 123% 72%
SOUTH FORK FLATHEAD 116% 82%
STILLWATER-WHITEFISH 92% 89%
SWAN 112% 84%
MISSION VALLEY 98% 94%
LITTLE BITTERROOT-ASHLEY 71% 115%
JOCKO 111% 86%
FLATHEAD in MONTANA 109% 85%
Basin-Wide Snowpack 109% 85%
Precipitation Monthly Percentage of
Average WYTD Percentage of 1981-
2010 Average* WYTD Last Year
Percentage of Average
Mountain Precipitation 74% 98% 84%
Valley Precipitation 28% 74% 93%
Basin-Wide Precipitation 73% 98% 84%
*Water Year-to-Date (WYTD) Precipitation is October 1st - Current
Reservoir Storage Percentage of Average
Percentage of Capacity (Total)
Last Year Percentage of Average
Basin-Wide Reservoir Storage 116% 63% 118%
*See Reservoir Storage Table for storage in individual reservoirs

Pag
e11
(click to navigate to online version with additional features)
Storage above is averaged for all reservoirs in the basin. For individual reservoirs see table below.
Pag
e12
Pag
e13
Upper Clark Fork River Basin
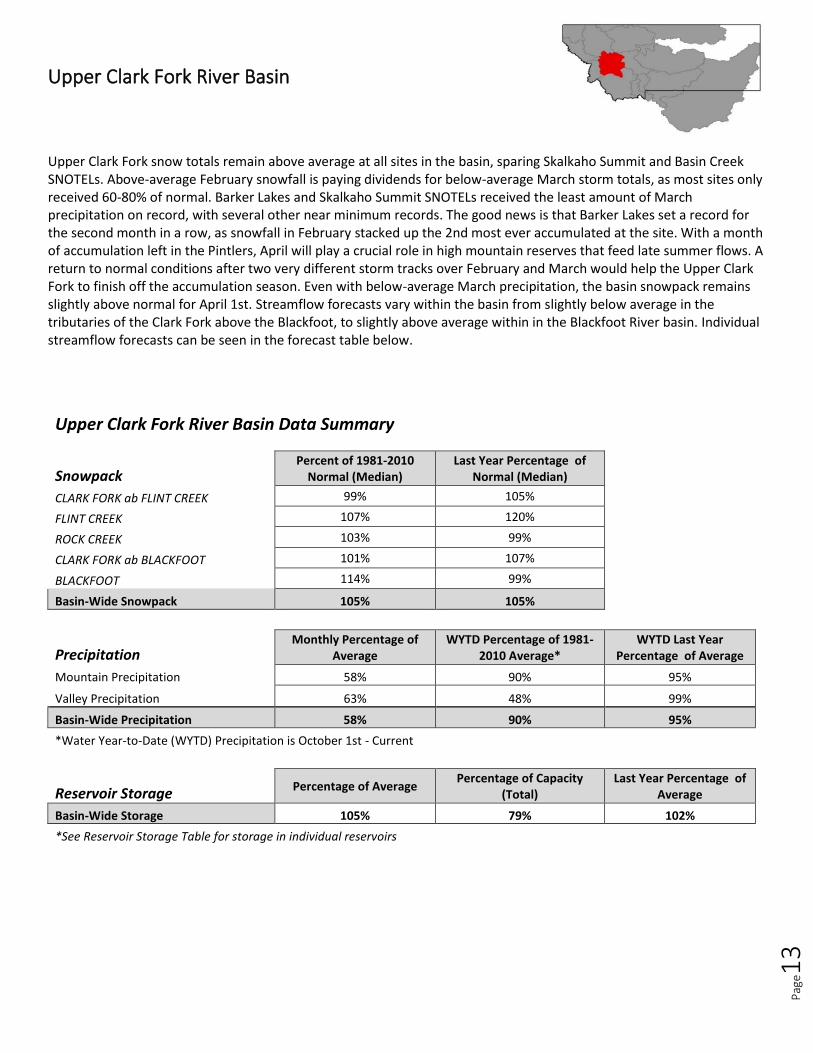
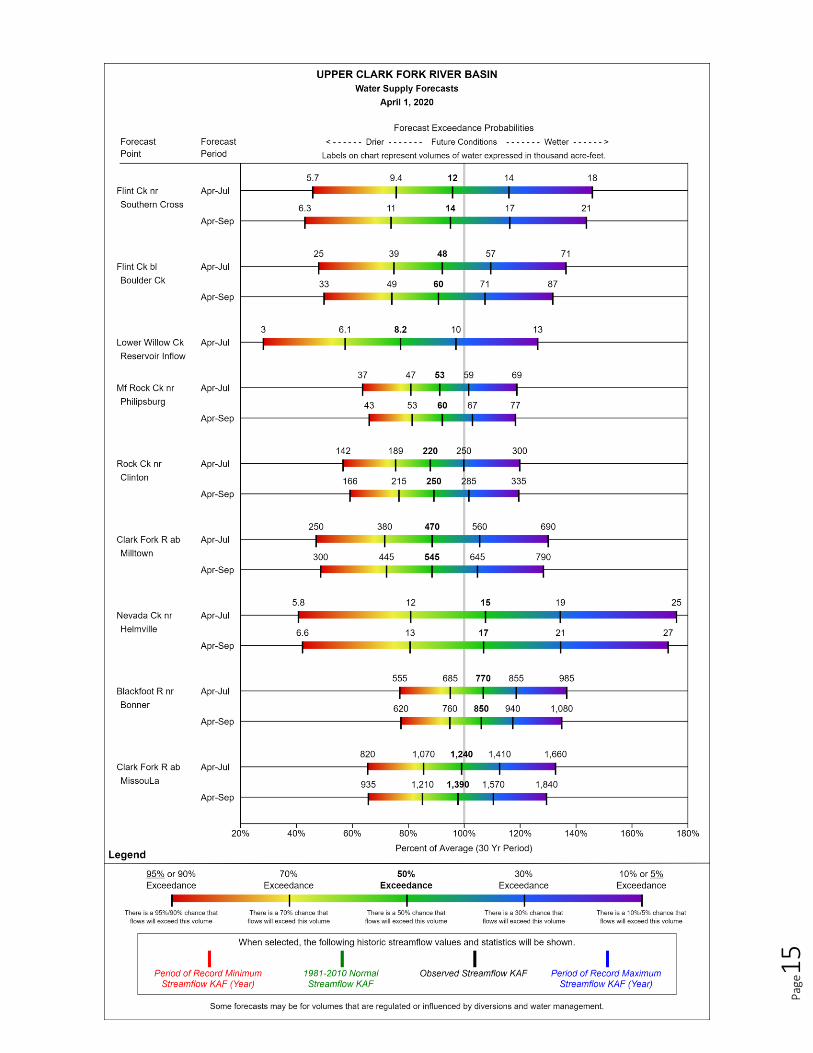
Upper Clark Fork snow totals remain above average at all sites in the basin, sparing Skalkaho Summit and Basin Creek SNOTELs. Above-average February snowfall is paying dividends for below-average March storm totals, as most sites only received 60-80% of normal. Barker Lakes and Skalkaho Summit SNOTELs received the least amount of March precipitation on record, with several other near minimum records. The good news is that Barker Lakes set a record for the second month in a row, as snowfall in February stacked up the 2nd most ever accumulated at the site. With a month of accumulation left in the Pintlers, April will play a crucial role in high mountain reserves that feed late summer flows. A return to normal conditions after two very different storm tracks over February and March would help the Upper Clark Fork to finish off the accumulation season. Even with below-average March precipitation, the basin snowpack remains slightly above normal for April 1st. Streamflow forecasts vary within the basin from slightly below average in the tributaries of the Clark Fork above the Blackfoot, to slightly above average within in the Blackfoot River basin. Individual streamflow forecasts can be seen in the forecast table below.
Upper Clark Fork River Basin Data Summary
Snowpack Percent of 1981-2010
Normal (Median) Last Year Percentage of
Normal (Median)
CLARK FORK ab FLINT CREEK 99% 105%
FLINT CREEK 107% 120%
ROCK CREEK 103% 99%
CLARK FORK ab BLACKFOOT 101% 107%
BLACKFOOT 114% 99%
Basin-Wide Snowpack 105% 105%
Precipitation Monthly Percentage of
Average WYTD Percentage of 1981-
2010 Average* WYTD Last Year
Percentage of Average
Mountain Precipitation 58% 90% 95%
Valley Precipitation 63% 48% 99%
Basin-Wide Precipitation 58% 90% 95%
*Water Year-to-Date (WYTD) Precipitation is October 1st - Current
Reservoir Storage Percentage of Average Percentage of Capacity
(Total) Last Year Percentage of
Average
Basin-Wide Storage 105% 79% 102%
*See Reservoir Storage Table for storage in individual reservoirs

Pag
e14
(click to navigate to online version with additional features)
Storage above is averaged for all reservoirs in the basin. For individual reservoirs see table below.
Pag
e15
Pag
e16
Bitterroot River Basin
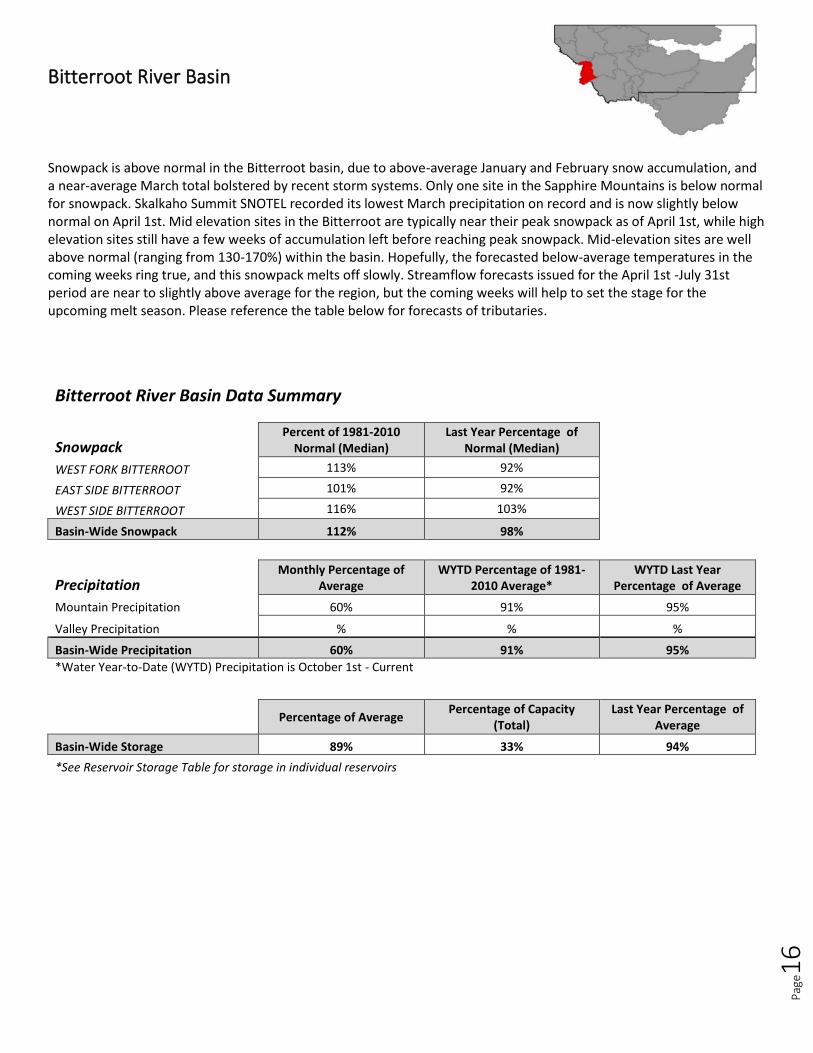
Snowpack is above normal in the Bitterroot basin, due to above-average January and February snow accumulation, and a near-average March total bolstered by recent storm systems. Only one site in the Sapphire Mountains is below normal for snowpack. Skalkaho Summit SNOTEL recorded its lowest March precipitation on record and is now slightly below normal on April 1st. Mid elevation sites in the Bitterroot are typically near their peak snowpack as of April 1st, while high elevation sites still have a few weeks of accumulation left before reaching peak snowpack. Mid-elevation sites are well above normal (ranging from 130-170%) within the basin. Hopefully, the forecasted below-average temperatures in the coming weeks ring true, and this snowpack melts off slowly. Streamflow forecasts issued for the April 1st -July 31st period are near to slightly above average for the region, but the coming weeks will help to set the stage for the upcoming melt season. Please reference the table below for forecasts of tributaries.
Bitterroot River Basin Data Summary
Snowpack Percent of 1981-2010
Normal (Median) Last Year Percentage of
Normal (Median)
WEST FORK BITTERROOT 113% 92%
EAST SIDE BITTERROOT 101% 92%
WEST SIDE BITTERROOT 116% 103%
Basin-Wide Snowpack 112% 98%
Precipitation Monthly Percentage of
Average WYTD Percentage of 1981-
2010 Average* WYTD Last Year
Percentage of Average
Mountain Precipitation 60% 91% 95%
Valley Precipitation % % %
Basin-Wide Precipitation 60% 91% 95%
*Water Year-to-Date (WYTD) Precipitation is October 1st - Current
Percentage of Average
Percentage of Capacity (Total)
Last Year Percentage of Average
Basin-Wide Storage 89% 33% 94%
*See Reservoir Storage Table for storage in individual reservoirs

Pag
e17
(click to navigate to online version with additional features)
Storage above is averaged for all reservoirs in the basin. For individual reservoirs see table below.

Pag
e18

Pag
e19
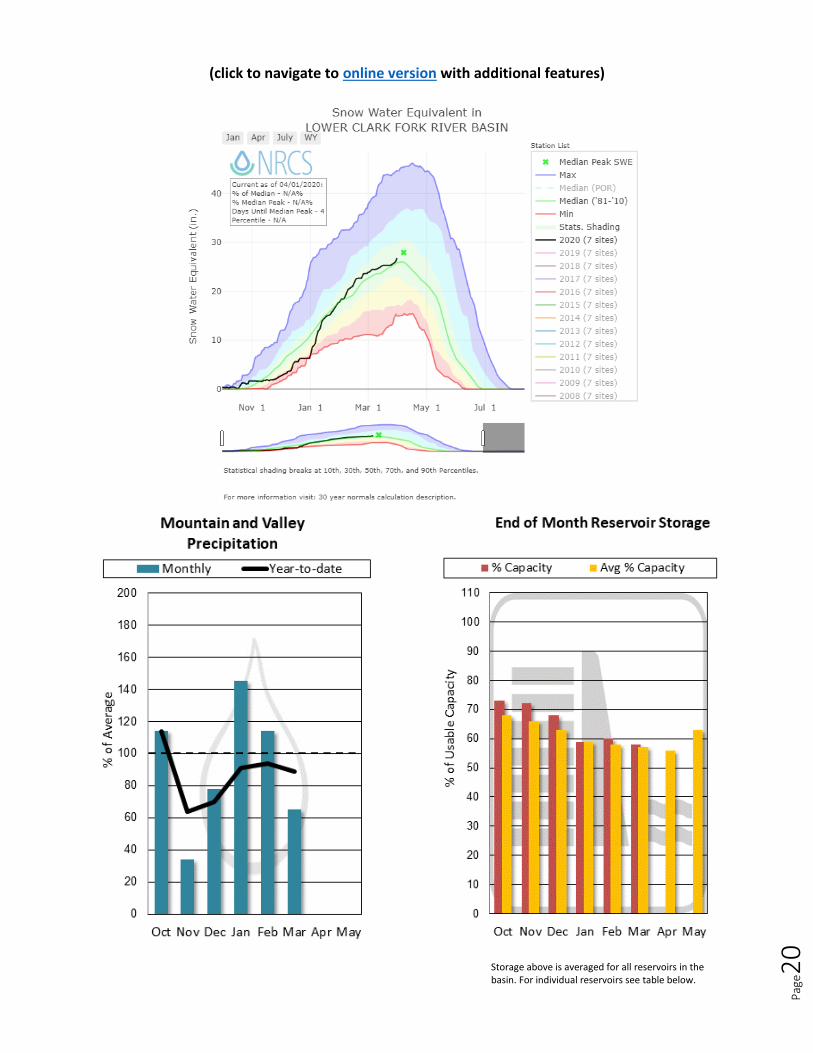
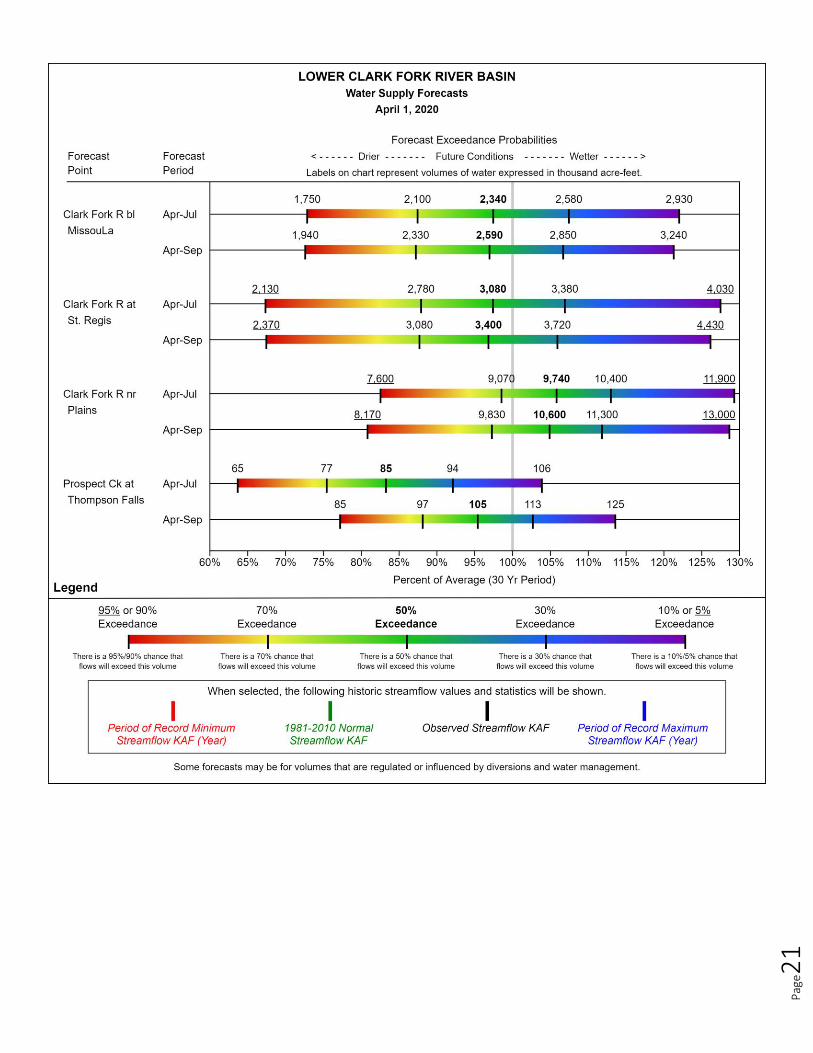
Lower Clark Fork River Basin
March snow totals in the Lower Clark Fork were below normal for most of the region, excluding the Cabinet Mountains, which enjoyed a late storm, pushing sites in the range to above normal. March gains in the Cabinets have brought almost all SNOTEL sites in the Lower Clark Fork to normal or above-normal snowpack for the year. Other regions in the Lower Clark Fork are coming off of an unusually wet February, which has propped up totals through April 1st. Additionally, the Upper Clark Fork, Bitterroot and Flathead Basins are all reporting healthy snowpacks. Streamflow forecasts are above slightly above average for April 1st – July 31st as a result of these snow totals. We still have two to three weeks left until the typical water year peak at high elevation sites, during which mountain snowpack continues to build. For individual streamflow forecasts, please reference the table below.
Lower Clark For River Basin Data Summary
Snowpack Percent of 1981-2010
Normal (Median) Last Year Percentage of
Normal (Median)
LOWER CLARK FORK RIVER BASIN 104% 94%
Basin-Wide 104% 94%
Precipitation Monthly Percentage of
Average WYTD Percentage of 1981-2010 Average*
WYTD Last Year Percentage of Average
Mountain Precipitation 67% 90% 84%
Valley Precipitation 22% 78% 143%
Basin-Wide Precipitation 65% 89% 85%
*Water Year-to-Date (WYTD) Precipitation is October 1st - Current
Reservoir Storage Percentage of Average Percentage of Capacity
(Total) Last Year Percentage
of Average
Basin-Wide Storage 104% 96% 104%
*See Reservoir Storage Table for storage in individual reservoirs
Pag
e20
(click to navigate to online version with additional features)
Storage above is averaged for all reservoirs in the basin. For individual reservoirs see table below.
Pag
e21
Pag
e22
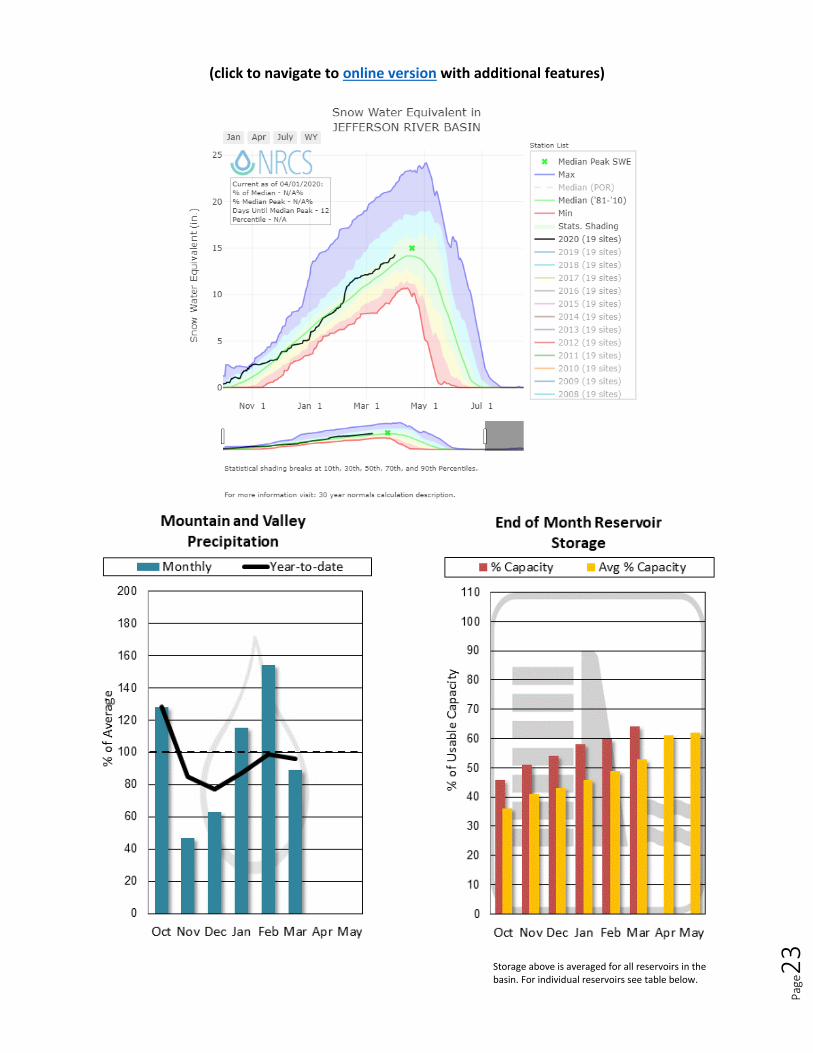
Jefferson River Basin
Snowpack in the Jefferson River basin is slightly above normal for April 1st, which is good news for water users. While
March yielded slightly below normal snowfall in the northern half of the basin, the southern ranges received near to
above normal snowfall. Water year precipitation within the river basin, which has been below average throughout this
water year due to the abnormally dry November and December, made some improvements in the southern sub-basins
and degraded slightly in the northern Boulder River basin. Reservoir storage at Lima and Clark Canyon is above average
for this time of year, and streamflow forecasts issued for April 1st through July 31st period indicate near to slightly
above average streamflows for many of the rivers and streams within the basin. For individual streamflow forecasts,
please reference the table below. Ample reservoir storage and favorable forecasts for the spring and summer runoff
suggest adequate water supply for irrigation and recreation at this time. However, a close eye should be kept on the
coming few months. Spring snowfall at higher elevations and rainfall at valley elevations contributes a significant
amount of the annual moisture to the region. Should things take a turn towards the dry side, streamflows could be less
than expected.
Jefferson River Basin Data Summary
Snowpack Percent of 1981-2010
Normal (Median) Last Year Percentage of
Normal (Median)
BEAVERHEAD 112% 106%
RUBY 111% 106%
BIGHOLE 107% 99%
BOULDER 108% 123%
Basin-Wide Snowpack 109% 106%
Precipitation Monthly Percentage of
Average WYTD Percentage of 1981-
2010 Average* WYTD Last Year
Percentage of Average
Mountain Precipitation 89% 96% 102%
Valley Precipitation % % %
Basin-Wide Precipitation 89% 96% 102%
*Water Year-to-Date (WYTD) Precipitation is October 1st - Current
Reservoir Storage Percentage of Average
Percentage of Capacity (Total)
Last Year Percentage of Average
Basin-Wide Storage 120% 64% 122%
*See Reservoir Storage Table for storage in individual reservoirs
Pag
e23
(click to navigate to online version with additional features)
Storage above is averaged for all reservoirs in the basin. For individual reservoirs see table below.

Pag
e24

Pag
e25
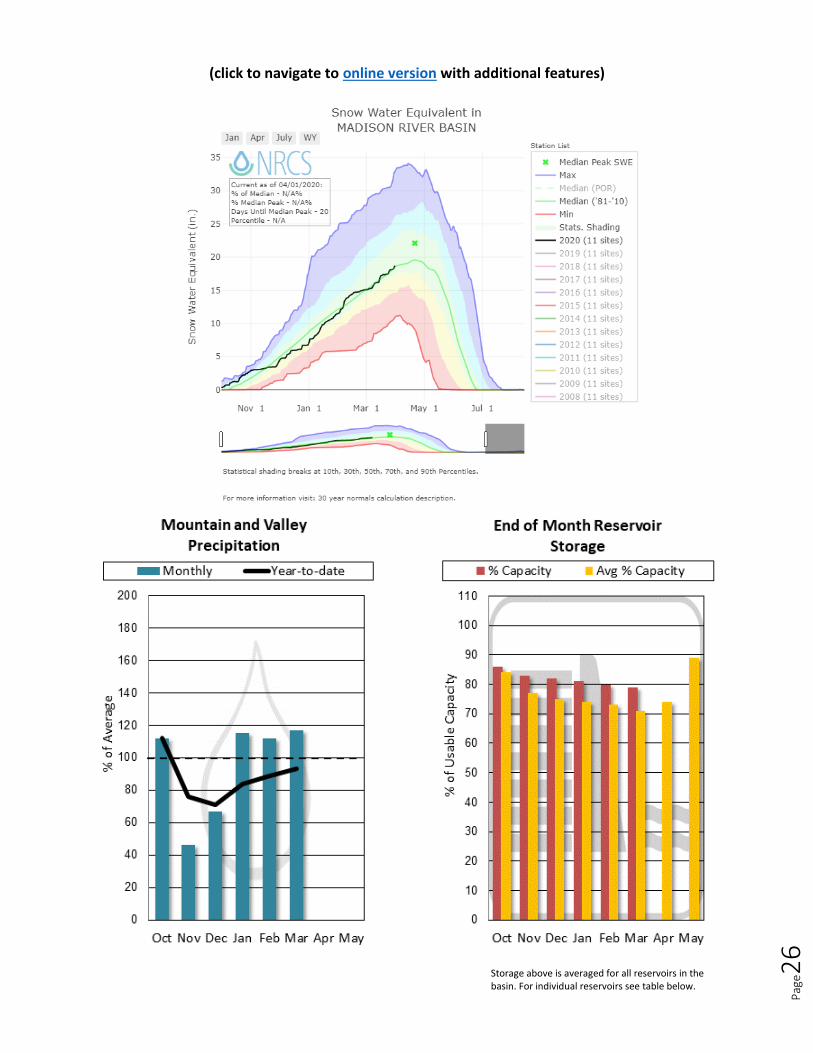
Madison River Basin
Occurring mid-month, moist southwest flow collided with an arctic cold front from Canada and was the perfect setup for
snowfall in the headwaters of the Madison River basin. Improvements occurred at all snowpack monitoring sites from
March 1st, and most SNOTEL sites are now reporting near to slightly above normal snowpack for April 1st. Water year
precipitation, which has been below average through this winter due to the abnormally dry November and December,
made some improvements during the month with totals ranging from 70% to 107% of normal on April 1st. Reservoir
storage in the local reservoirs ranges from near normal in Ennis Lake to slightly above average in Hebgen Lake.
Streamflow forecasts for the April 1st through July 31st period indicate near average streamflows for this spring and
summer runoff. For individual streamflow forecasts, please reference the table below. Given the slow start to winter in
this region, the combination of near to above average reservoir storage and favorable streamflow forecasts is excellent
news for local irrigators and recreationists. However, a close eye should be kept on the coming few months, as spring
snowfall at higher elevations and rainfall at valley elevations contributes a significant amount of the annual moisture to
the region. Should things take a turn towards the dry side, streamflows could be less than expected.
Madison River Basin Data Summary
Snowpack Percent of 1981-2010
Normal (Median) Last Year Percentage of
Normal (Median)
MADISON abv HEBGEN LAKE 101% 121%
MADISON blw HEBGEN LAKE 109% 109%
Basin-Wide Snowpack 106% 114%
Precipitation Monthly Percentage of
Average WYTD Percentage of 1981-
2010 Average* WYTD Last Year
Percentage of Average
Mountain Precipitation 115% 93% 107%
Valley Precipitation 149% 95% 114%
Basin-Wide Precipitation 117% 93% 107%
*Water Year-to-Date (WYTD) Precipitation is October 1st - Current
Reservoir Storage Percentage of Average Percentage of Capacity
(Total) Last Year Percentage of
Average
Basin-Wide Storage 110% 79% 111%
*See Reservoir Storage Table for storage in individual reservoirs
Pag
e26
(click to navigate to online version with additional features)
Storage above is averaged for all reservoirs in the basin. For individual reservoirs see table below.

Pag
e27
Pag
e28
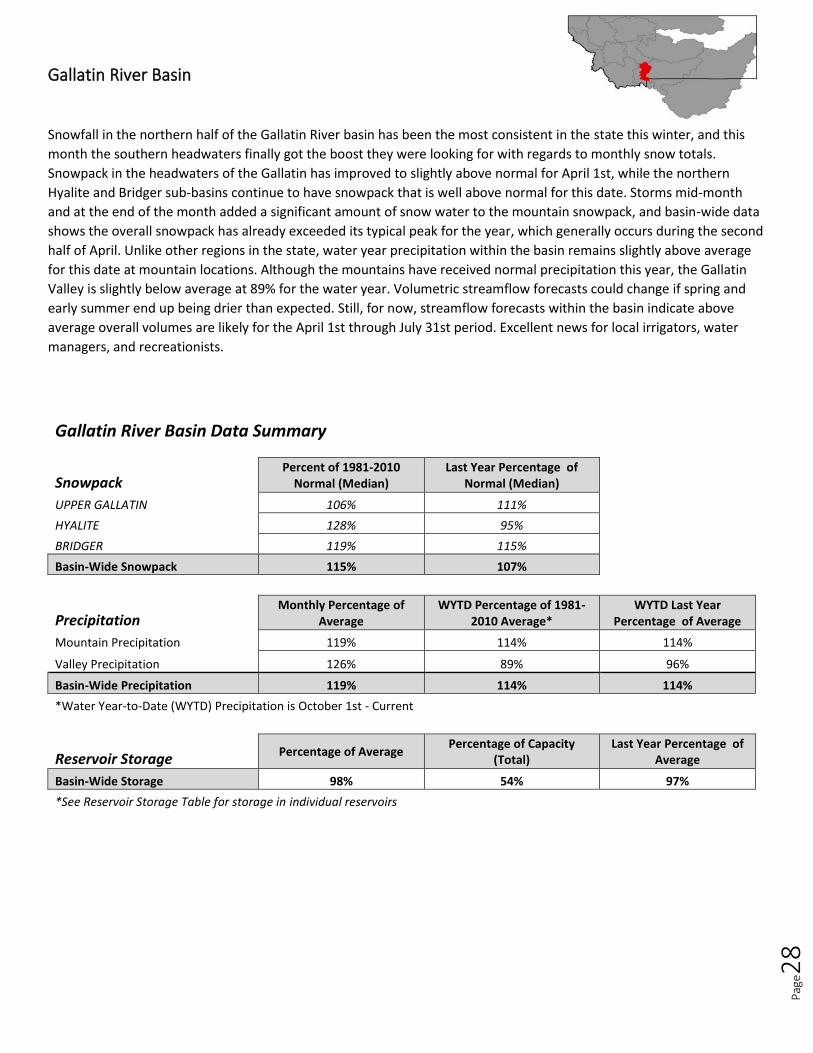
Gallatin River Basin
Snowfall in the northern half of the Gallatin River basin has been the most consistent in the state this winter, and this
month the southern headwaters finally got the boost they were looking for with regards to monthly snow totals.
Snowpack in the headwaters of the Gallatin has improved to slightly above normal for April 1st, while the northern
Hyalite and Bridger sub-basins continue to have snowpack that is well above normal for this date. Storms mid-month
and at the end of the month added a significant amount of snow water to the mountain snowpack, and basin-wide data
shows the overall snowpack has already exceeded its typical peak for the year, which generally occurs during the second
half of April. Unlike other regions in the state, water year precipitation within the basin remains slightly above average
for this date at mountain locations. Although the mountains have received normal precipitation this year, the Gallatin
Valley is slightly below average at 89% for the water year. Volumetric streamflow forecasts could change if spring and
early summer end up being drier than expected. Still, for now, streamflow forecasts within the basin indicate above
average overall volumes are likely for the April 1st through July 31st period. Excellent news for local irrigators, water
managers, and recreationists.
Gallatin River Basin Data Summary
Snowpack Percent of 1981-2010
Normal (Median) Last Year Percentage of
Normal (Median)
UPPER GALLATIN 106% 111%
HYALITE 128% 95%
BRIDGER 119% 115%
Basin-Wide Snowpack 115% 107%
Precipitation Monthly Percentage of
Average WYTD Percentage of 1981-
2010 Average* WYTD Last Year
Percentage of Average
Mountain Precipitation 119% 114% 114%
Valley Precipitation 126% 89% 96%
Basin-Wide Precipitation 119% 114% 114%
*Water Year-to-Date (WYTD) Precipitation is October 1st - Current
Reservoir Storage Percentage of Average
Percentage of Capacity (Total)
Last Year Percentage of Average
Basin-Wide Storage 98% 54% 97%
*See Reservoir Storage Table for storage in individual reservoirs

Pag
e29
(click to navigate to online version with additional features)
Storage above is averaged for all reservoirs in the basin. For individual reservoirs see table below.

Pag
e30

Pag
e31
Headwaters Mainstem (Missouri) River Basin
Snow accumulation for March was below normal at three out of five SNOTEL sites within the Missouri Mainstem River
basin. Overall, mountain and valley precipitation for March was 78% of average, with mountain locations receiving 74%
of normal during the month, while valley locations received 161% of average (Helena). SNOTEL sites to the west of
Canyon Ferry Reservoir received most of the snow accumulation in March from three or four storms. These widespread
storms occurred on the 8th, an event between the 14th and the 16th and a storm between the 23rd and the 26th. East
of Canyon Ferry in the Big Belts accumulation was more consistent throughout the month, with smaller amounts of
snow accumulating more frequently. Even with below-normal snow accumulation during the month, the overall basin-
wide snowpack is slightly above normal for this date, thanks to the significant mountain snowfall in January and
February. Only one SNOTEL site, the Tizer Basin SNOTEL located southeast of Helena in the Elkhorn Mountains, is
reporting below-normal snowpack totals for April 1st (89%). Streamflow forecasts within the basin reflect the above-
normal snowpack upstream in the Missouri Headwaters, and within the basin, and indicate near to slightly above
average streamflows are possible for the April 1st through July 31st period. For individual streamflow forecasts, please
reference the table below.
Headwaters Missouri Mainstem River Basin Data Summary
Snowpack Percent of 1981-2010
Normal (Median) Last Year Percentage of
Normal (Median)
HEADWATERS MAINSTEM 107% 108%
Basin-Wide Snowpack 107% 108%
Precipitation Monthly Percentage of
Average WYTD Percentage of 1981-
2010 Average* WYTD Last Year
Percentage of Average
Mountain Precipitation 74% 99% 110%
Valley Precipitation 161% 110% 166%
Basin-Wide Precipitation 78% 99% 112%
*Water Year-to-Date (WYTD) Precipitation is October 1st - Current
Reservoir Storage Percentage of Average
Percentage of Capacity (Total)
Last Year Percentage of Average
Basin-Wide Storage 115% 80% 119%
*See Reservoir Storage Table for storage in individual reservoirs

Pag
e32
(click to navigate to online version with additional features)
Storage above is averaged for all reservoirs in the basin. For individual reservoirs see table below.
Pag
e33
Pag
e34
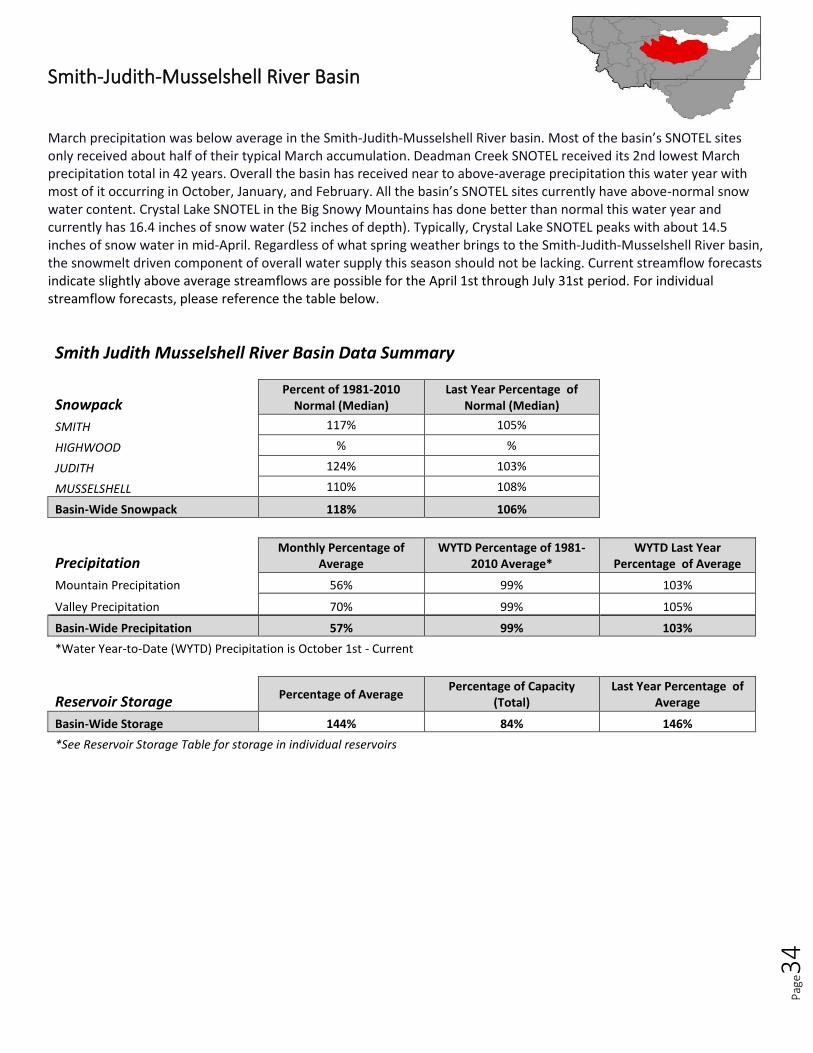
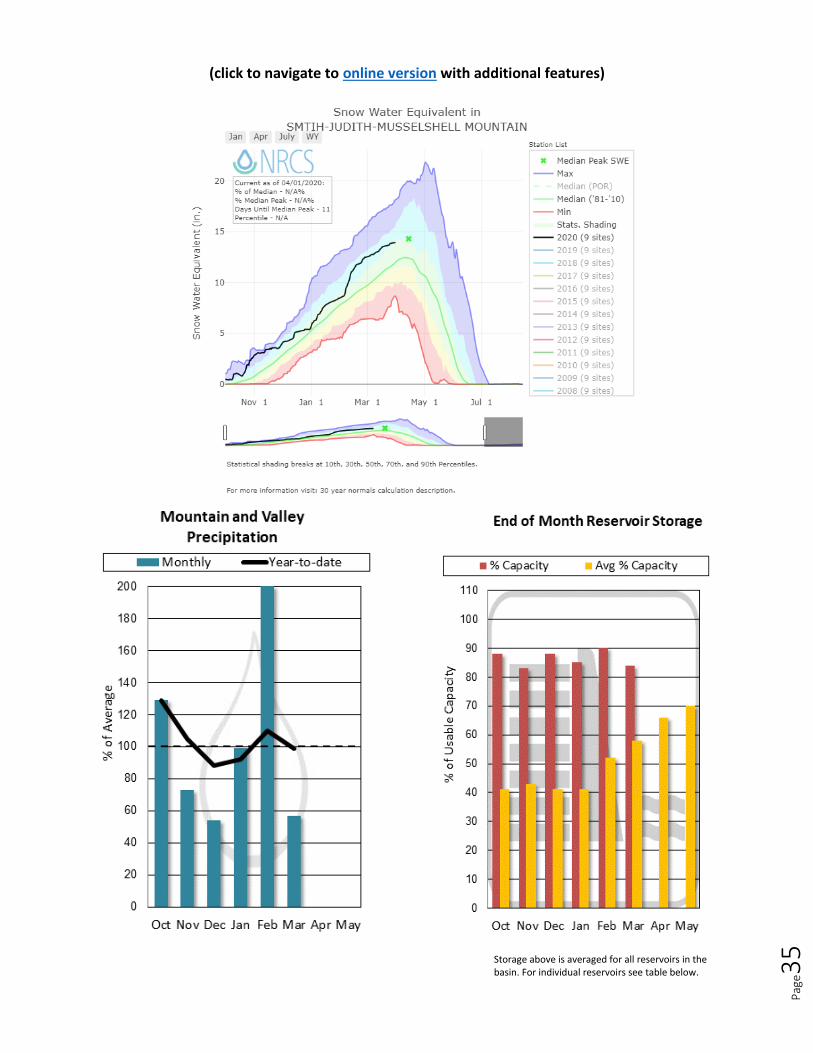
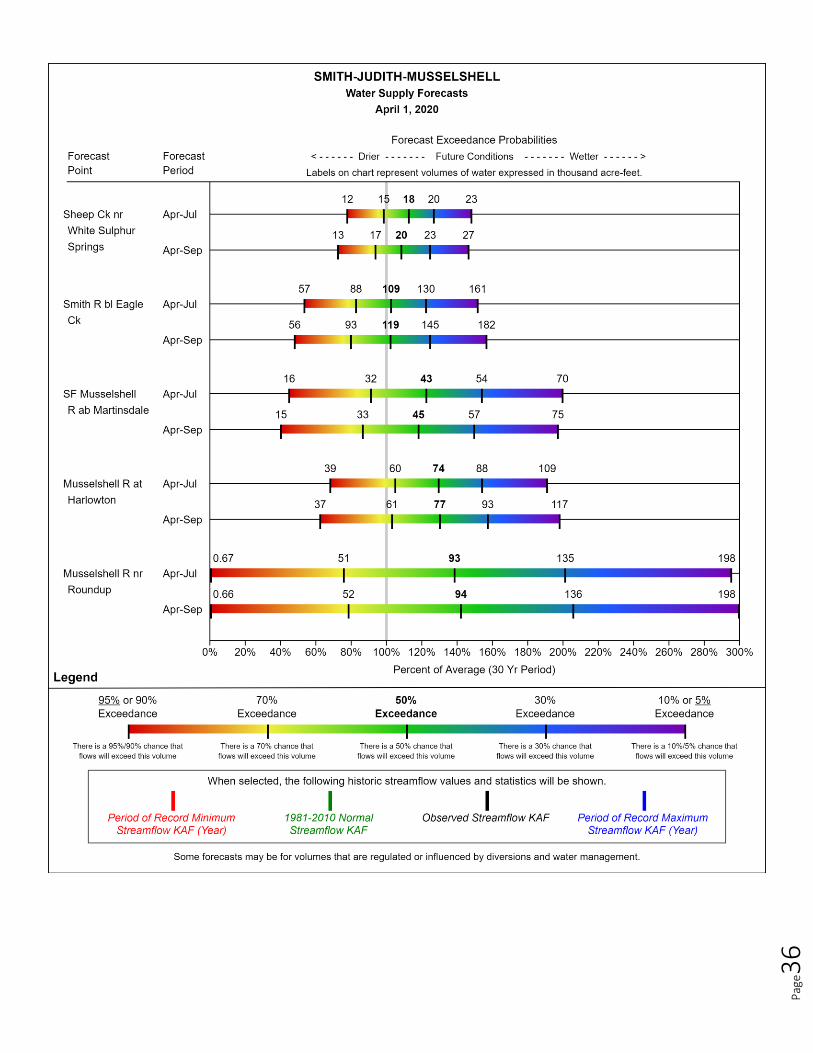
Smith-Judith-Musselshell River Basin
March precipitation was below average in the Smith-Judith-Musselshell River basin. Most of the basin’s SNOTEL sites only received about half of their typical March accumulation. Deadman Creek SNOTEL received its 2nd lowest March precipitation total in 42 years. Overall the basin has received near to above-average precipitation this water year with most of it occurring in October, January, and February. All the basin’s SNOTEL sites currently have above-normal snow water content. Crystal Lake SNOTEL in the Big Snowy Mountains has done better than normal this water year and currently has 16.4 inches of snow water (52 inches of depth). Typically, Crystal Lake SNOTEL peaks with about 14.5 inches of snow water in mid-April. Regardless of what spring weather brings to the Smith-Judith-Musselshell River basin, the snowmelt driven component of overall water supply this season should not be lacking. Current streamflow forecasts indicate slightly above average streamflows are possible for the April 1st through July 31st period. For individual streamflow forecasts, please reference the table below.
Smith Judith Musselshell River Basin Data Summary
Snowpack Percent of 1981-2010
Normal (Median) Last Year Percentage of
Normal (Median)
SMITH 117% 105%
HIGHWOOD % %
JUDITH 124% 103%
MUSSELSHELL 110% 108%
Basin-Wide Snowpack 118% 106%
Precipitation Monthly Percentage of
Average WYTD Percentage of 1981-
2010 Average* WYTD Last Year
Percentage of Average
Mountain Precipitation 56% 99% 103%
Valley Precipitation 70% 99% 105%
Basin-Wide Precipitation 57% 99% 103%
*Water Year-to-Date (WYTD) Precipitation is October 1st - Current
Reservoir Storage Percentage of Average
Percentage of Capacity (Total)
Last Year Percentage of Average
Basin-Wide Storage 144% 84% 146%
*See Reservoir Storage Table for storage in individual reservoirs
Pag
e35
(click to navigate to online version with additional features)
Storage above is averaged for all reservoirs in the basin. For individual reservoirs see table below.
Pag
e36

Pag
e37
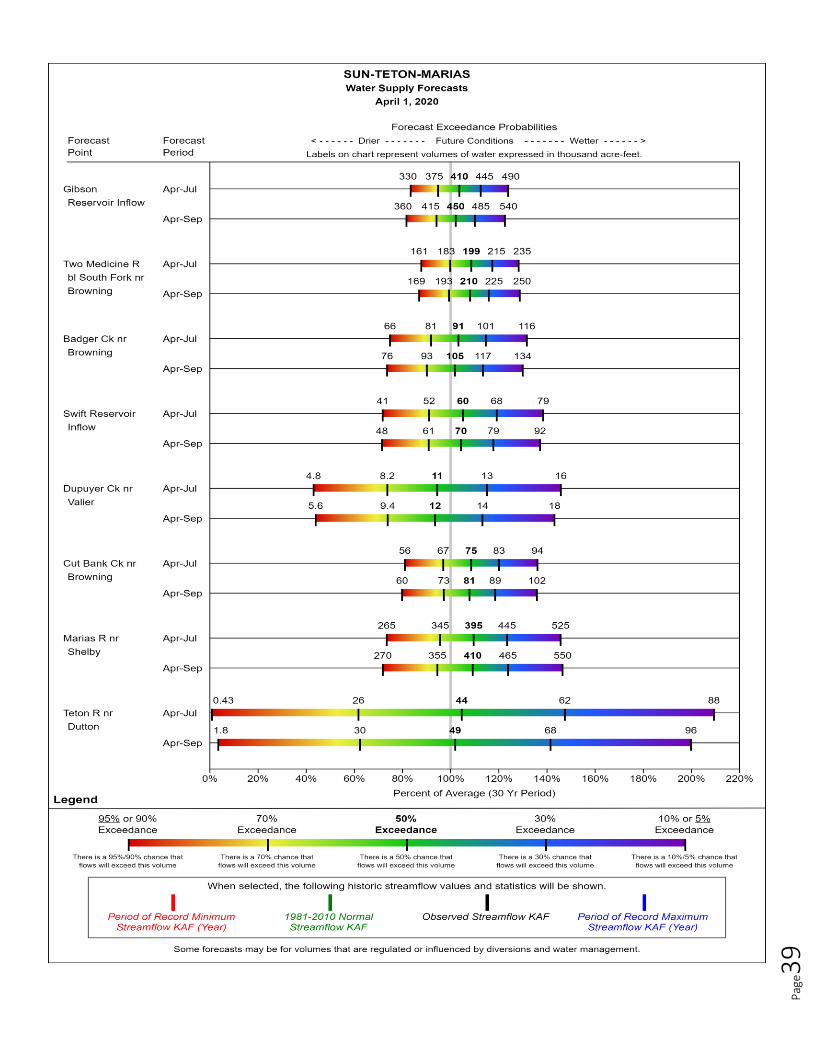
Sun-Teton-Marias River Basin
March precipitation was below average in the Sun-Teton-Marias River basin. Storms on March 11th and the 31st brought most of the month’s precipitation. Even after having a record-setting start to the water year, the basin is slightly behind average for water year-to-date precipitation. With that said, all the basin’s SNOTEL sites currently have above-normal snow water content, which is a result of the significant amount of snow they received before October 1st. Typically, the basin’s snowpack peaks in mid-April, and all non-burned sites have already reached their typical peak values. Spring is young, and there is still an opportunity for significant snow in the coming weeks. However, if that doesn’t pan out, the snowmelt driven component this season should not be lacking. Current streamflow forecasts indicate near to slightly above average streamflows are possible for the April 1st through July 31st period. For individual streamflow forecasts, please reference the table below.
Sun-Teton-Marias River Basin Data Summary
Snowpack Percent of 1981-2010
Normal (Median) Last Year Percentage of
Normal (Median)
SUN 103% 83%
TETON 121% 85%
MARIAS 125% 76%
Basin-Wide Snowpack 114% 80%
Precipitation Monthly Percentage of
Average WYTD Percentage of 1981-
2010 Average* WYTD Last Year
Percentage of Average
Mountain Precipitation 86% 95% 79%
Valley Precipitation 79% 149% 163%
Basin-Wide Precipitation 86% 96% 82%
*Water Year-to-Date (WYTD) Precipitation is October 1st - Current
Reservoir Storage Percentage of Average Percentage of Capacity
(Total) Last Year Percentage of
Average
Basin-Wide Storage 109% 57% 105%
*See Reservoir Storage Table for storage in individual reservoirs

Pag
e38
(click to navigate to online version with additional features)
Storage above is averaged for all reservoirs in the basin. For individual reservoirs see table below.
Pag
e39
Pag
e40
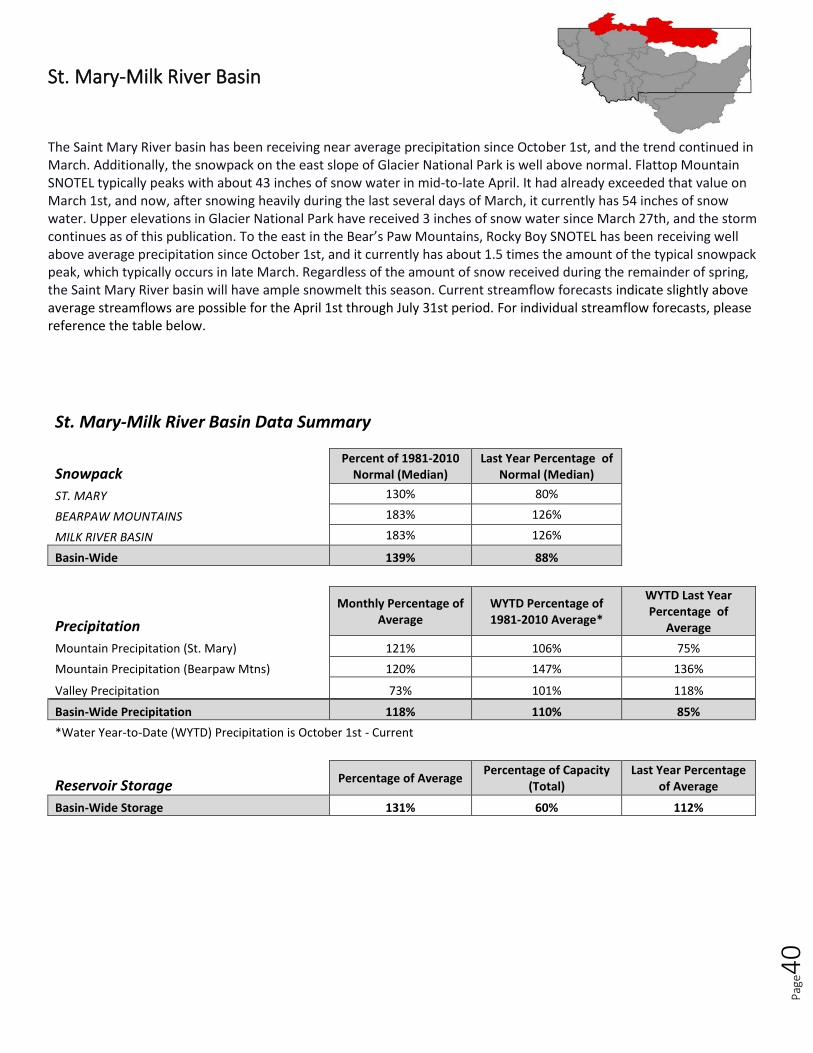
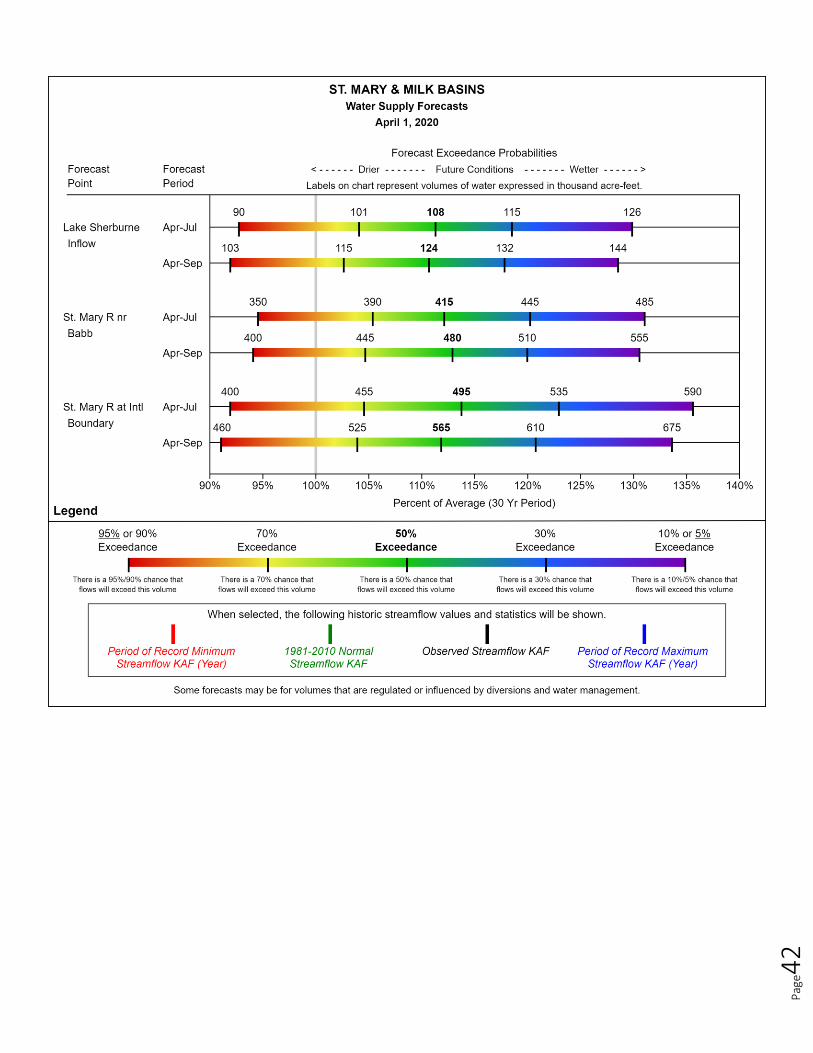
St. Mary-Milk River Basin
The Saint Mary River basin has been receiving near average precipitation since October 1st, and the trend continued in March. Additionally, the snowpack on the east slope of Glacier National Park is well above normal. Flattop Mountain SNOTEL typically peaks with about 43 inches of snow water in mid-to-late April. It had already exceeded that value on March 1st, and now, after snowing heavily during the last several days of March, it currently has 54 inches of snow water. Upper elevations in Glacier National Park have received 3 inches of snow water since March 27th, and the storm continues as of this publication. To the east in the Bear’s Paw Mountains, Rocky Boy SNOTEL has been receiving well above average precipitation since October 1st, and it currently has about 1.5 times the amount of the typical snowpack peak, which typically occurs in late March. Regardless of the amount of snow received during the remainder of spring, the Saint Mary River basin will have ample snowmelt this season. Current streamflow forecasts indicate slightly above average streamflows are possible for the April 1st through July 31st period. For individual streamflow forecasts, please reference the table below.
St. Mary-Milk River Basin Data Summary
Snowpack Percent of 1981-2010
Normal (Median) Last Year Percentage of
Normal (Median)
ST. MARY 130% 80%
BEARPAW MOUNTAINS 183% 126%
MILK RIVER BASIN 183% 126%
Basin-Wide 139% 88%
Precipitation
Monthly Percentage of Average
WYTD Percentage of 1981-2010 Average*
WYTD Last Year Percentage of
Average
Mountain Precipitation (St. Mary) 121% 106% 75%
Mountain Precipitation (Bearpaw Mtns) 120% 147% 136%
Valley Precipitation 73% 101% 118%
Basin-Wide Precipitation 118% 110% 85%
*Water Year-to-Date (WYTD) Precipitation is October 1st - Current
Reservoir Storage Percentage of Average
Percentage of Capacity (Total)
Last Year Percentage of Average
Basin-Wide Storage 131% 60% 112%

Pag
e41
(click to navigate to online version with additional features)
Storage above is averaged for all reservoirs in the basin. For individual reservoirs see table below.
Pag
e42

Pag
e43
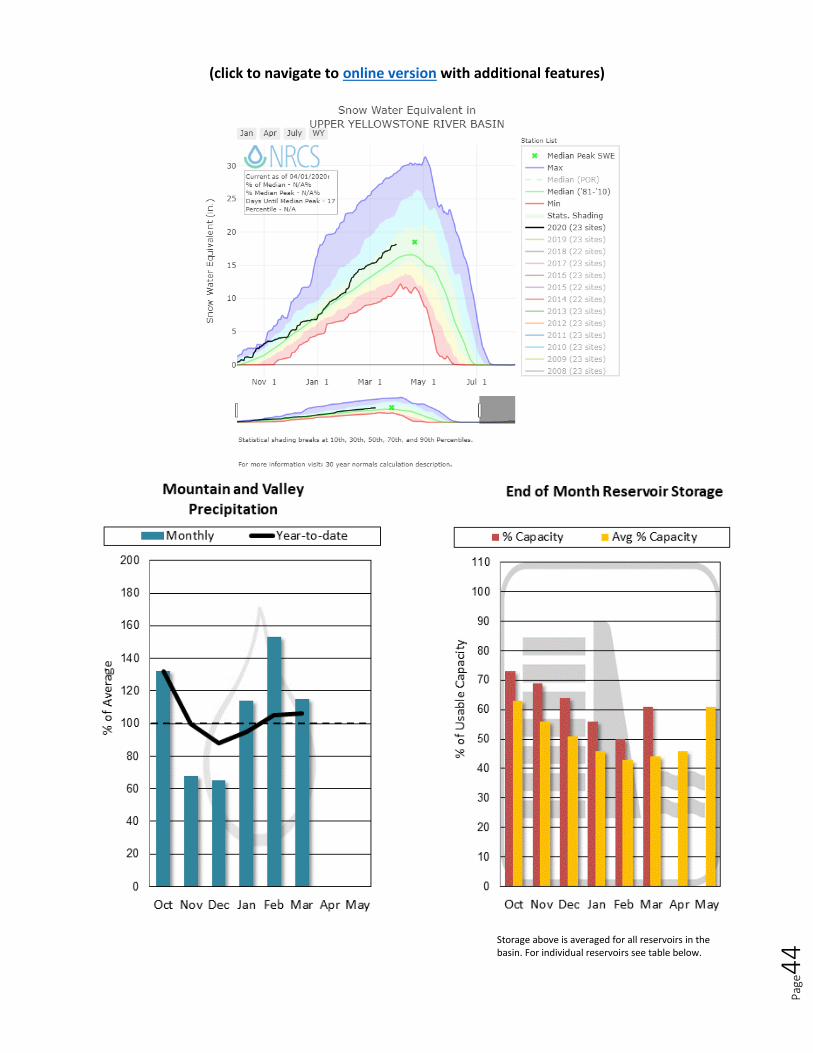
Upper Yellowstone River Basin
After experiencing consistent snowfall throughout the winter, the month of March didn’t disappoint in the mountain
ranges supplying water to the Upper Yellowstone River basin. Mid-month storms approaching from the southwest
favored the headwaters of the Yellowstone in the Absaroka and Beartooth Ranges, where above-normal snow totals
were recorded during the month. As of April 1st, the Upper Yellowstone River basin has a snowpack that is above
normal across the basin. Typically, snowpack peaks within the region in mid to late April, so there is still some time to go
before we know this year’s true peak snowpack. However, in most areas, the amount of snow on the ground has already
reached, or exceeded the typical seasonal peak, all but ensuring the snowmelt driven component of runoff will be
adequate for irrigation and recreation this spring and summer runoff season. Volumetric streamflow forecasts could
change if spring and early summer end up being drier than expected. Still, for now, streamflow forecasts within the
basin indicate above average overall volumes are likely for the April 1st through July 31st period. Excellent news for
water users in the region.
Upper Yellowstone River Basin Data Summary
Snowpack Percent of 1981-2010
Normal (Median) Last Year Percentage of
Normal (Median)
YELLOWSTONE ab LIVINGSTON 121% 106%
SHIELDS 108% 112%
BOULDER-STILLWATER 125% 106%
RED LODGE-ROCK CREEK 126% 128%
CLARK'S FORK 117% 101%
Basin-Wide Snowpack 119% 109%
Precipitation Monthly Percentage of
Average WYTD Percentage of 1981-
2010 Average* WYTD Last Year
Percentage of Average
Mountain Precipitation 115% 107% 104%
Valley Precipitation 105% 93% 106%
Basin-Wide Precipitation 115% 106% 104%
*Water Year-to-Date (WYTD) Precipitation is October 1st - Current
Reservoir Storage Percentage of Average Percentage of Capacity
(Total) Last Year Percentage
of Average
Basin-Wide Storage 116% 51% 134%
Pag
e44
(click to navigate to online version with additional features)
Storage above is averaged for all reservoirs in the basin. For individual reservoirs see table below.

Pag
e45

Pag
e46
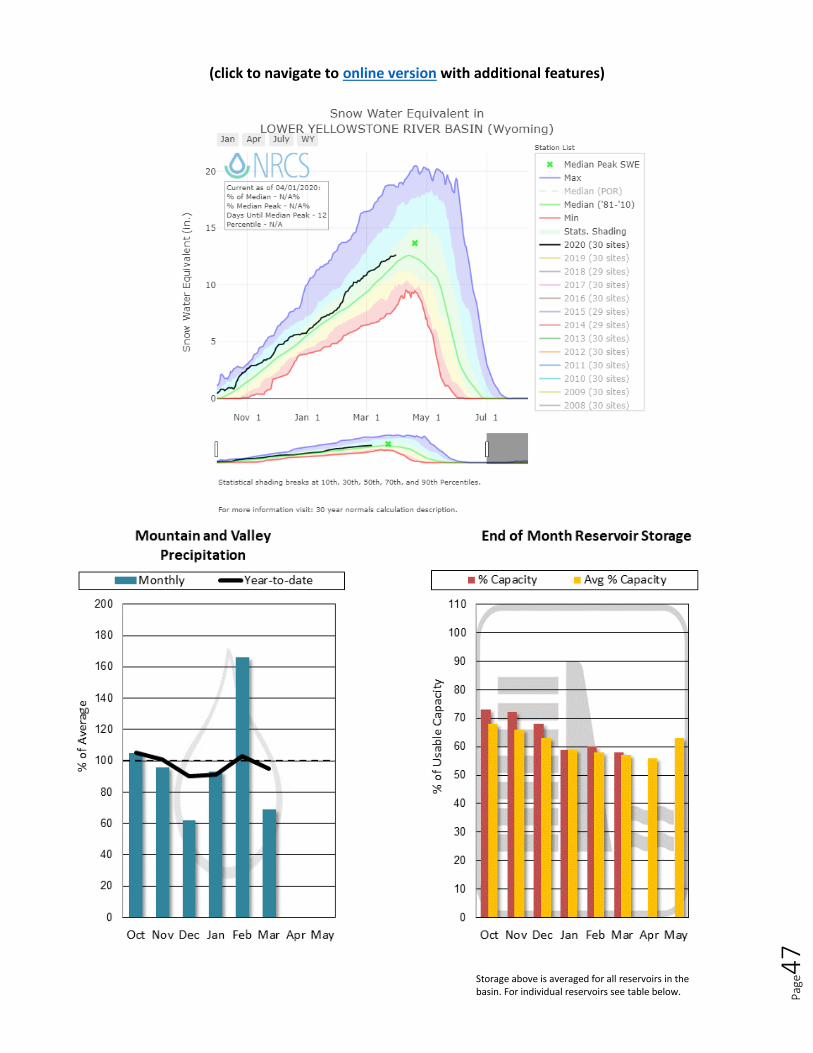
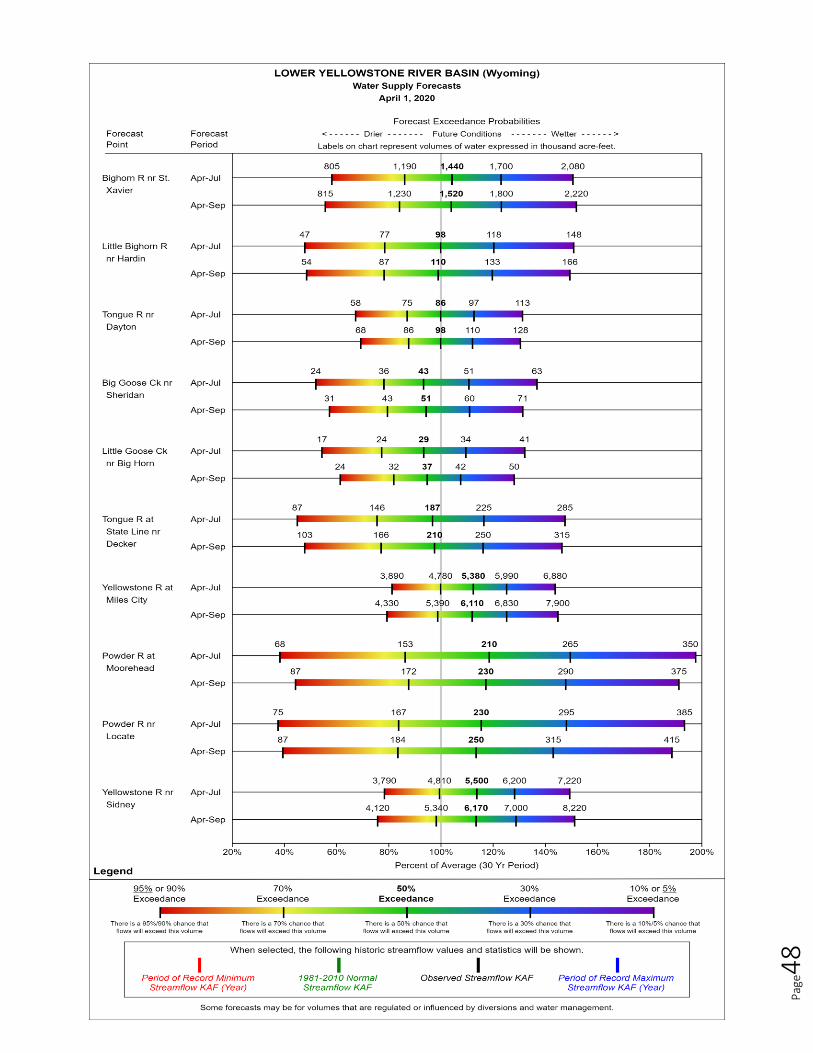
Lower Yellowstone River Basin
March precipitation was well below average across the entire Lower Yellowstone River basin, except for in the northern Absaroka Range. Valley weather stations from Boysen Reservoir to Lovell received record low monthly precipitation in March. Additionally, Bald Mountain, Tie Creek, and Bear Trap Meadow SNOTEL sites in the Bighorn Mountains had their 2nd lowest March precipitation total on record. Fortunately, monthly precipitation has been near average since October 1st, and the basin-wide snowpack is above normal. Currently, most of the basin’s snowpack is below its typical seasonal peak, which is normal. Stayed tuned to the local weather forecast, there are still 2-3 weeks remaining in the Lower Yellowstone River basin’s snowpack accumulation season, and spring can make or break for water supply in the region. Current streamflow forecasts indicate near to slightly above average streamflows are possible for the April 1st through July 31st period. For individual streamflow forecasts, please reference the table below.
Lower Yellowstone River Basin Data Summary
Snowpack Percent of 1981-2010
Normal (Median) Last Year Percentage of
Normal (Median)
WIND RIVER BASIN 109% 99%
SHOSHONE RIVER BASIN 111% 100%
BIGHORN RIVER BASIN 112% 93%
LITTLE BIGHORN BASIN 100% 77%
TONGUE RIVER BASIN 104% 77%
POWDER RIVER BASIN 115% 87%
Basin-Wide Snowpack 109% 92%
Precipitation Monthly Percentage of
Average WYTD Percentage of 1981-
2010 Average* WYTD Last Year
Percentage of Average
Mountain Precipitation 70% 95% 86%
Valley Precipitation 69% 96% 108%
Basin-Wide Precipitation 69% 95% 92%
*Water Year-to-Date (WYTD) Precipitation is October 1st - Current
Reservoir Storage Percentage of Average
Percentage of Capacity (Total)
Last Year Percentage of Average
Basin-Wide Storage 102% 58% 104%
Pag
e47
(click to navigate to online version with additional features)
Storage above is averaged for all reservoirs in the basin. For individual reservoirs see table below.
Pag
e48

Pag
e49
Issued by: Released by: Matt Lohr Tom Watson Chief State Conservationist Natural Resources Conservation Service Natural Resources Conservation Service U.S. Department of Agriculture Bozeman, Montana Report Created by: Montana Snow Survey Staff 10 East Babcock St, Room 443 Bozeman, MT 59715 Email: [email protected]
Montana Water Supply Outlook
Report Natural Resources Conservation Service