Embed Size (px)
Citation preview
Technical Report # 05/2012 January 2012
SPECIAL REPORT ON
PAKISTAN’S MONSOON 2011 RAINFALL
Government of Pakistan
Ministry of Defence
PAKISTAN METEOROLOGICAL DEPARTMENT
AArriiff MMaahhmmoooodd
NNaaddeeeemm FFaaiissaall
AAkkhhllaaqq JJaammeeeell
MONSOON (Jul-Sep) 2011 Rainfall (mm)
Astore
Babusar
BunjiChilas
Ghari Dupatta
Gilgit
GupisHunza
Kotli
Muzaffarabad
Rawalakot
Skardu
Barkhan
DalbandinKalat
Khuzdar
Panjgur
Quetta
Zhob
Balakot
Cherat
Chitral
Dir
Drosh
Kakul
Kalam
Malam Jaba
Parachinar
Patan
Saidu Sharif
Murree
Hill Station
GwadarJiwani
Lasbella
Nokkundi
OrmaraPasni
Sibi
Turbat
Uthal
Bannu
D.I.Khan
Kohat
Peshawar Risalpur
Bahawalnagar
Bhawalpur
Dhamial
D.G.Khan
Faisalabad
Islamabad
Jhang
Jhelum
Jouharabad
Kamra
Khanpur
Lahore
Mundi B.D.
Mangala
Mianwali
Multan
Noorpurthal
OkaraRafiqui
R.Y.Khan
Sahiwal
Sargodha
Sialkot
Badin
Chhor
Dadu
Hyderabad
Jacobabad
Karachi
Larkana
Mir Pur Khas
Mithi
Moenjodaro
Nawabshah
Padidan
RohriSukkar
Thatta
Tando jam
Plain Station
I R A N
SSppeecciiaall RReeppoorrtt oonn PPaakkiissttaann’’ss MMoonnssoooonn 22001111 RRaaiinnffaallll
Page # 1
SSSpppeeeccciiiaaalll RRReeepppooorrrttt ooonnn
PPPaaakkkiiissstttaaannn’’’sss MMMooonnnsssoooooonnn 222000111111 RRRaaaiiinnnfffaaallllll Arif Mahmood, Nadeem Faisal & Akhlaq Jameel
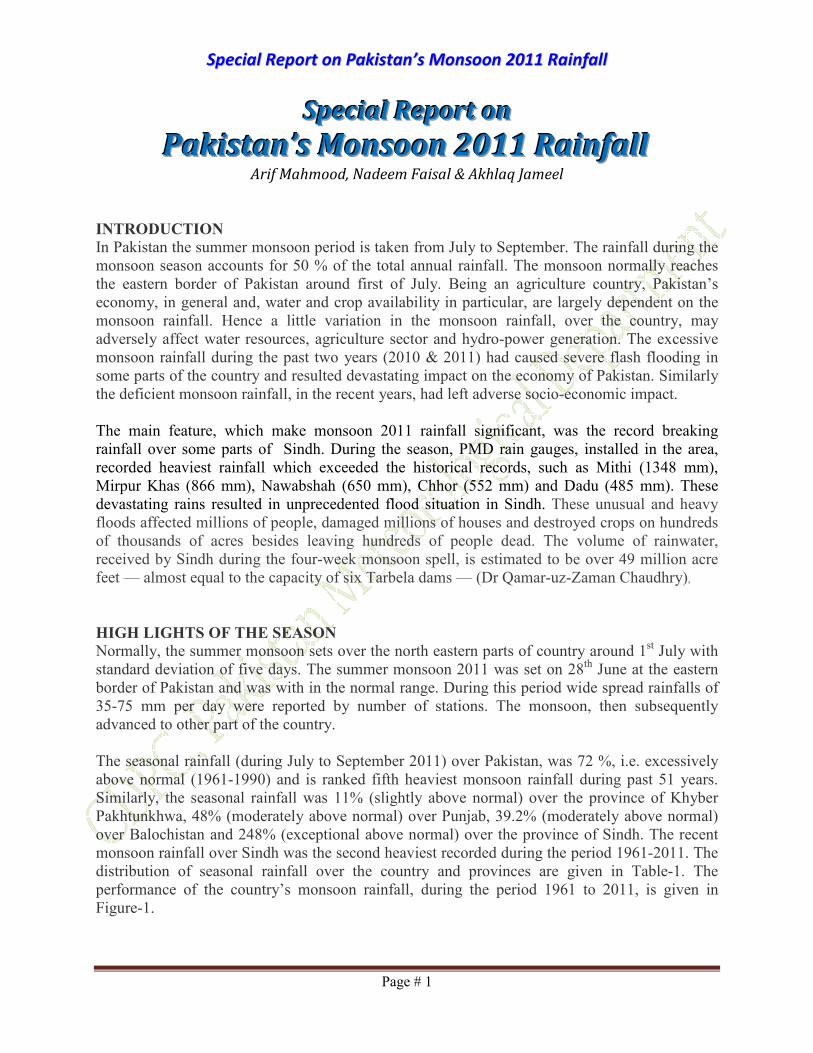
INTRODUCTION
In Pakistan the summer monsoon period is taken from July to September. The rainfall during the
monsoon season accounts for 50 % of the total annual rainfall. The monsoon normally reaches
the eastern border of Pakistan around first of July. Being an agriculture country, Pakistan’s
economy, in general and, water and crop availability in particular, are largely dependent on the
monsoon rainfall. Hence a little variation in the monsoon rainfall, over the country, may
adversely affect water resources, agriculture sector and hydro-power generation. The excessive
monsoon rainfall during the past two years (2010 & 2011) had caused severe flash flooding in
some parts of the country and resulted devastating impact on the economy of Pakistan. Similarly
the deficient monsoon rainfall, in the recent years, had left adverse socio-economic impact.
The main feature, which make monsoon 2011 rainfall significant, was the record breaking
rainfall over some parts of Sindh. During the season, PMD rain gauges, installed in the area,
recorded heaviest rainfall which exceeded the historical records, such as Mithi (1348 mm),
Mirpur Khas (866 mm), Nawabshah (650 mm), Chhor (552 mm) and Dadu (485 mm). These
devastating rains resulted in unprecedented flood situation in Sindh. These unusual and heavy
floods affected millions of people, damaged millions of houses and destroyed crops on hundreds
of thousands of acres besides leaving hundreds of people dead. The volume of rainwater,
received by Sindh during the four-week monsoon spell, is estimated to be over 49 million acre
feet — almost equal to the capacity of six Tarbela dams — (Dr Qamar-uz-Zaman Chaudhry),
HIGH LIGHTS OF THE SEASON
Normally, the summer monsoon sets over the north eastern parts of country around 1st July with
standard deviation of five days. The summer monsoon 2011 was set on 28th June at the eastern
border of Pakistan and was with in the normal range. During this period wide spread rainfalls of
35-75 mm per day were reported by number of stations. The monsoon, then subsequently
advanced to other part of the country.
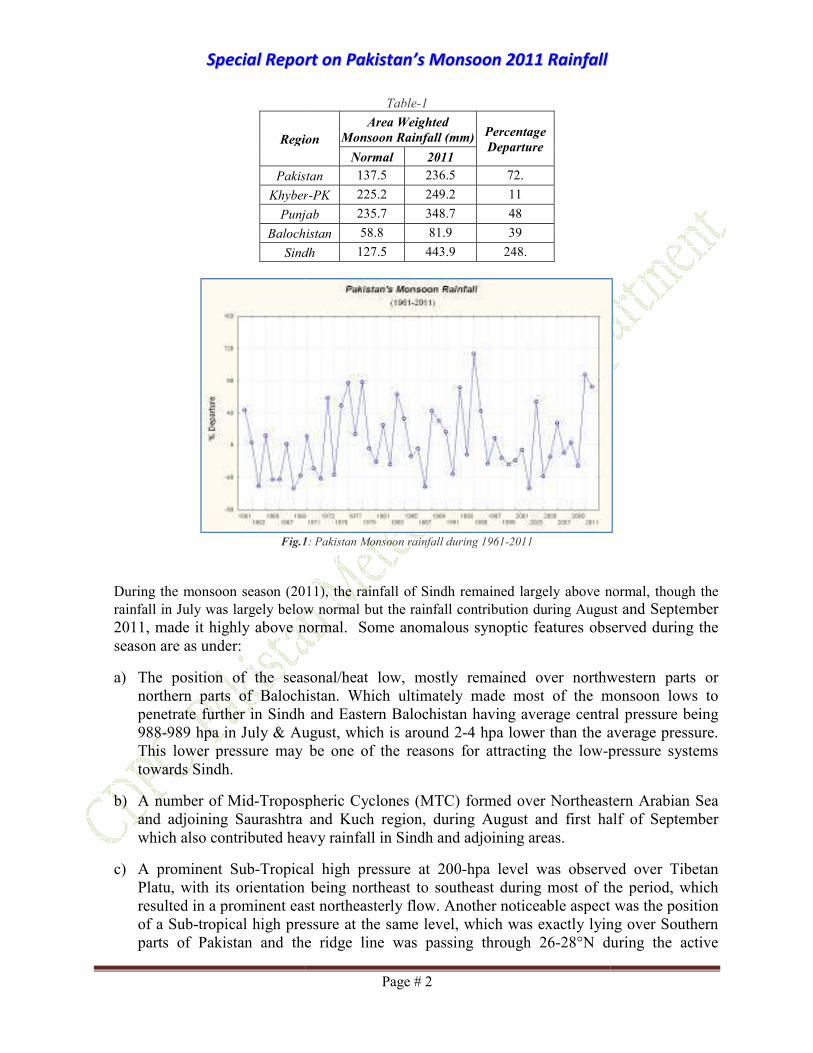
The seasonal rainfall (during July to September 2011) over Pakistan, was 72 %, i.e. excessively
above normal (1961-1990) and is ranked fifth heaviest monsoon rainfall during past 51 years.
Similarly, the seasonal rainfall was 11% (slightly above normal) over the province of Khyber
Pakhtunkhwa, 48% (moderately above normal) over Punjab, 39.2% (moderately above normal)
over Balochistan and 248% (exceptional above normal) over the province of Sindh. The recent
monsoon rainfall over Sindh was the second heaviest recorded during the period 1961-2011. The
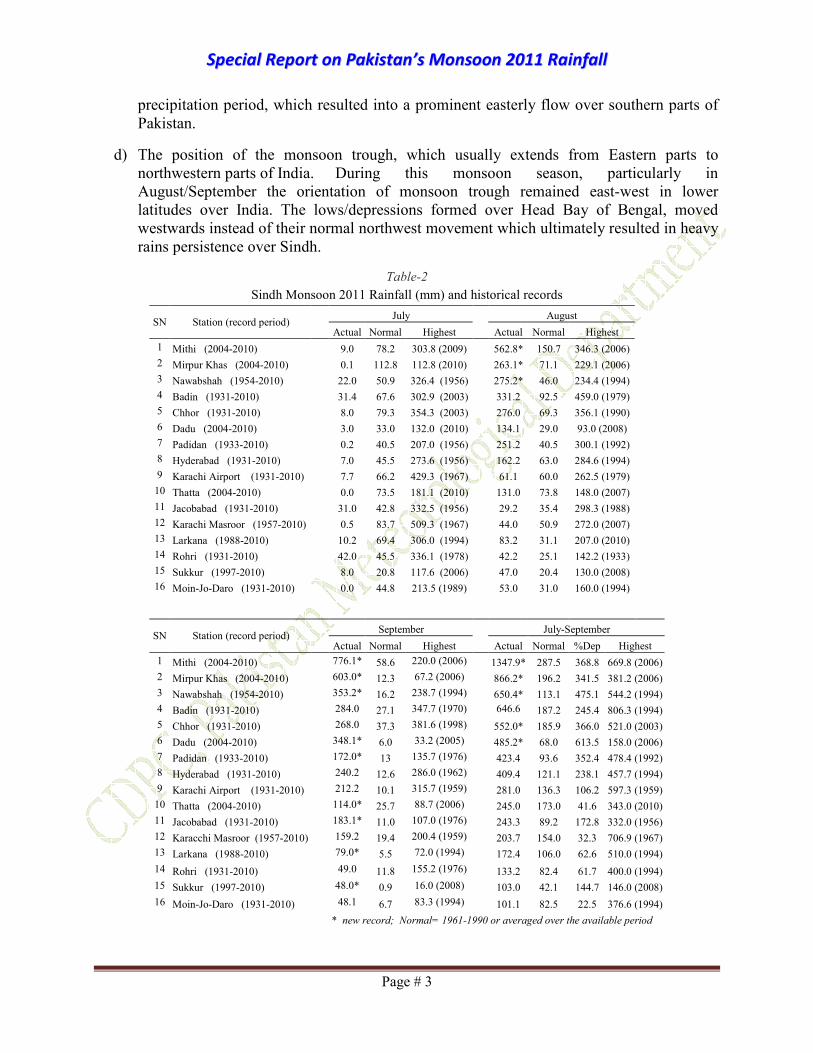
distribution of seasonal rainfall over the country and provinces are given in Table-1. The
performance of the country’s monsoon rainfall, during the period 1961 to 2011, is given in
Figure-1.
SSppeecciiaall RReeppoorr
Region
Pakista
Khyber
Punjab
Balochis
Sindh
Fig.1
During the monsoon season (2011
rainfall in July was largely below
2011, made it highly above nor
season are as under:
a) The position of the seasonorthern parts of Balochis
penetrate further in Sindh a
988-989 hpa in July & Aug
This lower pressure may b
towards Sindh.
b) A number of Mid-Tropospand adjoining Saurashtra a
which also contributed heav
c) A prominent Sub-Tropical Platu, with its orientation b
resulted in a prominent east
of a Sub-tropical high press
parts of Pakistan and the
rrtt oonn PPaakkiissttaann’’ss MMoonnssoooonn 22001111 RRaaiinnffaallll
Page # 2
Table-1
gion
Area Weighted
Monsoon Rainfall (mm) Percentage
Departure Normal 2011
kistan 137.5 236.5 72.
er-PK 225.2 249.2 11
njab 235.7 348.7 48
chistan 58.8 81.9 39
indh 127.5 443.9 248.
1: Pakistan Monsoon rainfall during 1961-2011
2011), the rainfall of Sindh remained largely above no
below normal but the rainfall contribution during August
ve normal. Some anomalous synoptic features obser
seasonal/heat low, mostly remained over northwe
lochistan. Which ultimately made most of the mo
indh and Eastern Balochistan having average central
August, which is around 2-4 hpa lower than the av
may be one of the reasons for attracting the low-pr
ospheric Cyclones (MTC) formed over Northeaste
htra and Kuch region, during August and first half
d heavy rainfall in Sindh and adjoining areas.
opical high pressure at 200-hpa level was observed
tion being northeast to southeast during most of the
t east northeasterly flow. Another noticeable aspect w
pressure at the same level, which was exactly lying
d the ridge line was passing through 26-28°N dur
ve normal, though the
ugust and September
observed during the
orthwestern parts or
e monsoon lows to
entral pressure being
the average pressure.
pressure systems
heastern Arabian Sea
st half of September
served over Tibetan
of the period, which
pect was the position
lying over Southern
N during the active
SSppeecciiaall RReeppoorrtt oonn PPaakkiissttaann’’ss MMoonnssoooonn 22001111 RRaaiinnffaallll
Page # 3
precipitation period, which resulted into a prominent easterly flow over southern parts of
Pakistan.
d) The position of the monsoon trough, which usually extends from Eastern parts to northwestern parts of India. During this monsoon season, particularly in
August/September the orientation of monsoon trough remained east-west in lower
latitudes over India. The lows/depressions formed over Head Bay of Bengal, moved
westwards instead of their normal northwest movement which ultimately resulted in heavy
rains persistence over Sindh.
Table-2
Sindh Monsoon 2011 Rainfall (mm) and historical records
SN Station (record period) July August
Actual Normal Highest Actual Normal Highest
1 Mithi (2004-2010) 9.0 78.2 303.8 (2009) 562.8* 150.7 346.3 (2006)
2 Mirpur Khas (2004-2010) 0.1 112.8 112.8 (2010) 263.1* 71.1 229.1 (2006)
3 Nawabshah (1954-2010) 22.0 50.9 326.4 (1956) 275.2* 46.0 234.4 (1994)
4 Badin (1931-2010) 31.4 67.6 302.9 (2003) 331.2 92.5 459.0 (1979)
5 Chhor (1931-2010) 8.0 79.3 354.3 (2003) 276.0 69.3 356.1 (1990)
6 Dadu (2004-2010) 3.0 33.0 132.0 (2010) 134.1 29.0 93.0 (2008)
7 Padidan (1933-2010) 0.2 40.5 207.0 (1956) 251.2 40.5 300.1 (1992)
8 Hyderabad (1931-2010) 7.0 45.5 273.6 (1956) 162.2 63.0 284.6 (1994)
9 Karachi Airport (1931-2010) 7.7 66.2 429.3 (1967) 61.1 60.0 262.5 (1979)
10 Thatta (2004-2010) 0.0 73.5 181.1 (2010) 131.0 73.8 148.0 (2007)
11 Jacobabad (1931-2010) 31.0 42.8 332.5 (1956) 29.2 35.4 298.3 (1988)
12 Karachi Masroor (1957-2010) 0.5 83.7 509.3 (1967) 44.0 50.9 272.0 (2007)
13 Larkana (1988-2010) 10.2 69.4 306.0 (1994) 83.2 31.1 207.0 (2010)
14 Rohri (1931-2010) 42.0 45.5 336.1 (1978) 42.2 25.1 142.2 (1933)
15 Sukkur (1997-2010) 8.0 20.8 117.6 (2006) 47.0 20.4 130.0 (2008)
16 Moin-Jo-Daro (1931-2010) 0.0 44.8 213.5 (1989) 53.0 31.0 160.0 (1994)
SN Station (record period) September July-September
Actual Normal Highest Actual Normal %Dep Highest
1 Mithi (2004-2010) 776.1* 58.6 220.0 (2006) 1347.9* 287.5 368.8 669.8 (2006)
2 Mirpur Khas (2004-2010) 603.0* 12.3 67.2 (2006) 866.2* 196.2 341.5 381.2 (2006)
3 Nawabshah (1954-2010) 353.2* 16.2 238.7 (1994) 650.4* 113.1 475.1 544.2 (1994)
4 Badin (1931-2010) 284.0 27.1 347.7 (1970) 646.6 187.2 245.4 806.3 (1994)
5 Chhor (1931-2010) 268.0 37.3 381.6 (1998) 552.0* 185.9 366.0 521.0 (2003)
6 Dadu (2004-2010) 348.1* 6.0 33.2 (2005) 485.2* 68.0 613.5 158.0 (2006)
7 Padidan (1933-2010) 172.0* 13 135.7 (1976) 423.4 93.6 352.4 478.4 (1992)
8 Hyderabad (1931-2010) 240.2 12.6 286.0 (1962) 409.4 121.1 238.1 457.7 (1994)
9 Karachi Airport (1931-2010) 212.2 10.1 315.7 (1959) 281.0 136.3 106.2 597.3 (1959)
10 Thatta (2004-2010) 114.0* 25.7 88.7 (2006) 245.0 173.0 41.6 343.0 (2010)
11 Jacobabad (1931-2010) 183.1* 11.0 107.0 (1976) 243.3 89.2 172.8 332.0 (1956)
12 Karacchi Masroor (1957-2010) 159.2 19.4 200.4 (1959) 203.7 154.0 32.3 706.9 (1967)
13 Larkana (1988-2010) 79.0* 5.5 72.0 (1994) 172.4 106.0 62.6 510.0 (1994)
14 Rohri (1931-2010) 49.0 11.8 155.2 (1976)
133.2 82.4 61.7 400.0 (1994)
15 Sukkur (1997-2010) 48.0* 0.9 16.0 (2008) 103.0 42.1 144.7 146.0 (2008)
16 Moin-Jo-Daro (1931-2010) 48.1 6.7 83.3 (1994) 101.1 82.5 22.5 376.6 (1994)
* new record; Normal= 1961-1990 or averaged over the available period
SSppeecciiaall RReeppoorrtt oonn PPaakkiissttaann’’ss MMoonnssoooonn 22001111 RRaaiinnffaallll
Page # 4
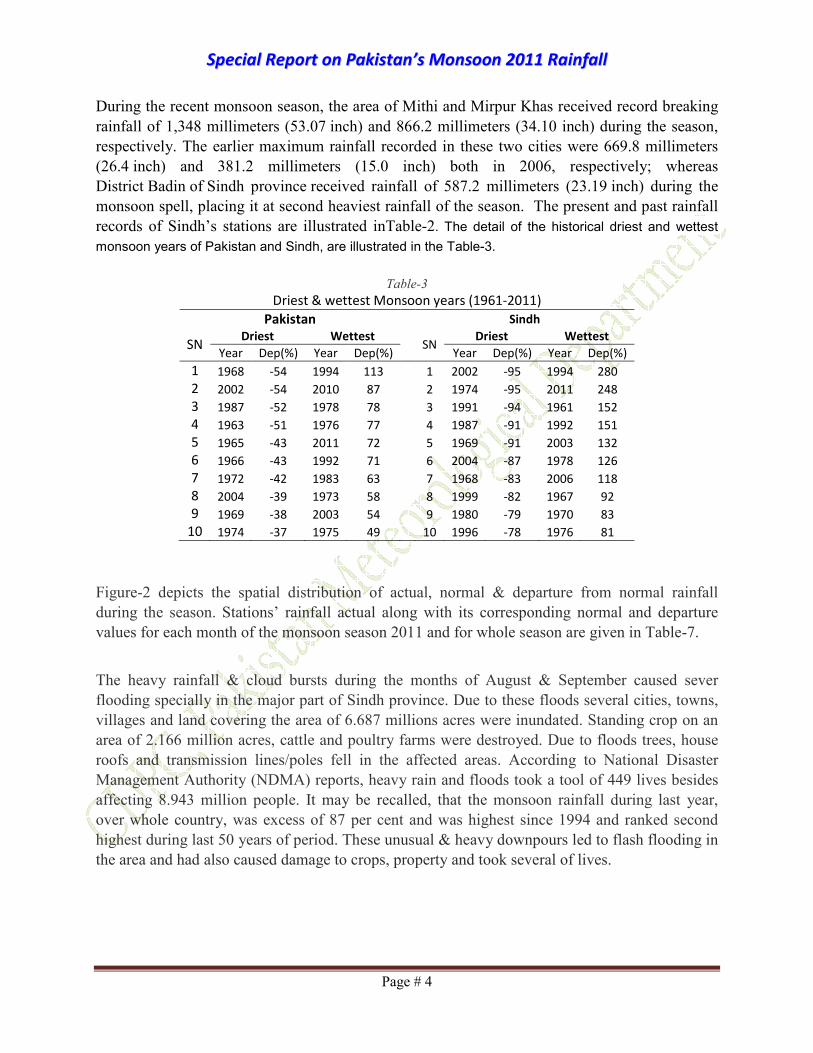
During the recent monsoon season, the area of Mithi and Mirpur Khas received record breaking
rainfall of 1,348 millimeters (53.07 inch) and 866.2 millimeters (34.10 inch) during the season,
respectively. The earlier maximum rainfall recorded in these two cities were 669.8 millimeters
(26.4 inch) and 381.2 millimeters (15.0 inch) both in 2006, respectively; whereas
District Badin of Sindh province received rainfall of 587.2 millimeters (23.19 inch) during the
monsoon spell, placing it at second heaviest rainfall of the season. The present and past rainfall
records of Sindh’s stations are illustrated inTable-2. The detail of the historical driest and wettest
monsoon years of Pakistan and Sindh, are illustrated in the Table-3.
Table-3
Driest & wettest Monsoon years (1961-2011)
Pakistan Sindh
SN Driest Wettest
SN Driest Wettest
Year Dep(%) Year Dep(%) Year Dep(%) Year Dep(%)
1 1968 -54 1994 113 1 2002 -95 1994 280
2 2002 -54 2010 87 2 1974 -95 2011 248
3 1987 -52 1978 78 3 1991 -94 1961 152
4 1963 -51 1976 77 4 1987 -91 1992 151
5 1965 -43 2011 72 5 1969 -91 2003 132
6 1966 -43 1992 71 6 2004 -87 1978 126
7 1972 -42 1983 63 7 1968 -83 2006 118
8 2004 -39 1973 58 8 1999 -82 1967 92
9 1969 -38 2003 54 9 1980 -79 1970 83
10 1974 -37 1975 49 10 1996 -78 1976 81
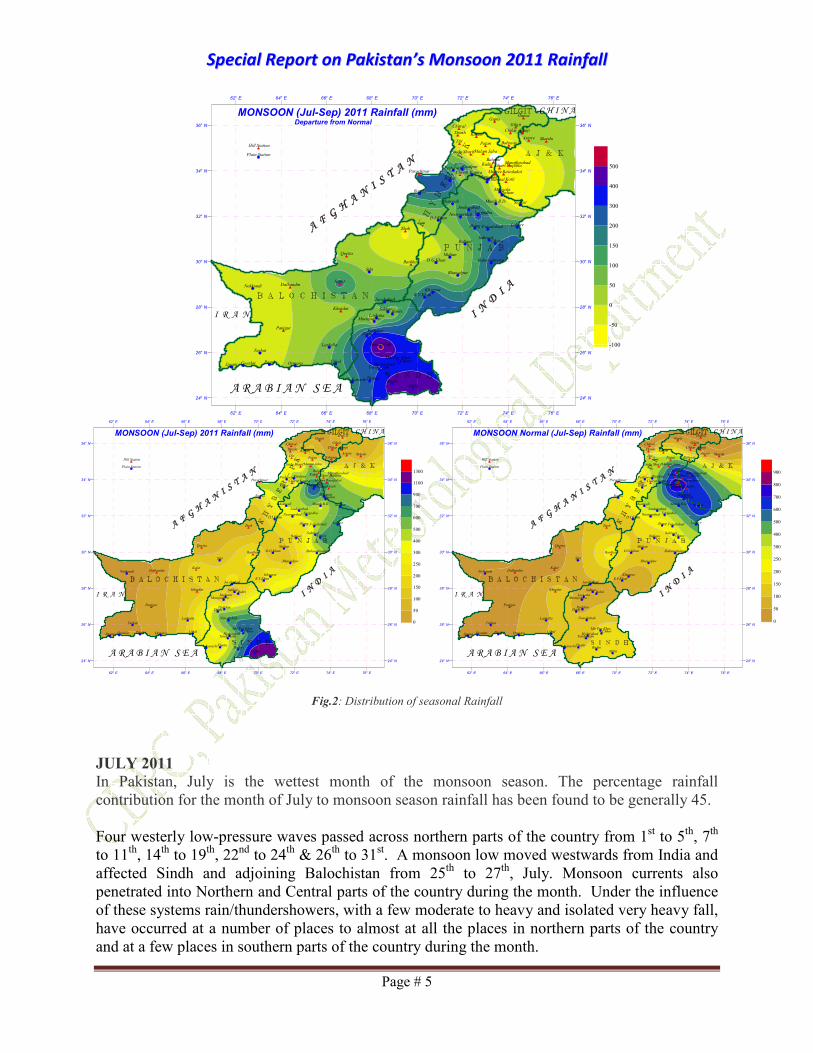
Figure-2 depicts the spatial distribution of actual, normal & departure from normal rainfall
during the season. Stations’ rainfall actual along with its corresponding normal and departure
values for each month of the monsoon season 2011 and for whole season are given in Table-7.
The heavy rainfall & cloud bursts during the months of August & September caused sever
flooding specially in the major part of Sindh province. Due to these floods several cities, towns,
villages and land covering the area of 6.687 millions acres were inundated. Standing crop on an
area of 2.166 million acres, cattle and poultry farms were destroyed. Due to floods trees, house
roofs and transmission lines/poles fell in the affected areas. According to National Disaster
Management Authority (NDMA) reports, heavy rain and floods took a tool of 449 lives besides
affecting 8.943 million people. It may be recalled, that the monsoon rainfall during last year,
over whole country, was excess of 87 per cent and was highest since 1994 and ranked second
highest during last 50 years of period. These unusual & heavy downpours led to flash flooding in
the area and had also caused damage to crops, property and took several of lives.
SSppeecciiaall RReeppoorrtt oonn PPaakkiissttaann’’ss MMoonnssoooonn 22001111 RRaaiinnffaallll
Page # 5
Fig.2: Distribution of seasonal Rainfall
JULY 2011
In Pakistan, July is the wettest month of the monsoon season. The percentage rainfall
contribution for the month of July to monsoon season rainfall has been found to be generally 45.
Four westerly low-pressure waves passed across northern parts of the country from 1st to 5
th, 7th
to 11th, 14
th to 19
th, 22
nd to 24
th & 26
th to 31
st. A monsoon low moved westwards from India and
affected Sindh and adjoining Balochistan from 25th to 27
th, July. Monsoon currents also
penetrated into Northern and Central parts of the country during the month. Under the influence
of these systems rain/thundershowers, with a few moderate to heavy and isolated very heavy fall,
have occurred at a number of places to almost at all the places in northern parts of the country
and at a few places in southern parts of the country during the month.
62° E 64° E 66° E 68° E 70° E 72° E 74° E 76° E
62° E 64° E 66° E 68° E 70° E 72° E 74° E 76° E
24° N
26° N
28° N
30° N
32° N
34° N
36° N
24° N
26° N
28° N
30° N
32° N
34° N
36° N
A R A B I A N S E A
C H I N AMONSOON (Jul-Sep) 2011 Rainfall (mm)Departure from Normal
AstoreBabusar
BunjiChilas
Ghari Dupatta
Gilgit
GupisHunza
Kotli
Muzaffarabad
Rawalakot
Skardu
Barkhan
DalbandinKalat
Khuzdar
Panjgur
Quetta
Zhob
Balakot
Cherat
Chitral
Dir
Drosh
Kakul
Kalam
Malam Jaba
Parachinar
Patan
Saidu Sharif
Murree
Hill Station
GwadarJiwani
Lasbella
Nokkundi
OrmaraPasni
Sibi
Turbat
Uthal
Bannu
D.I.Khan
Kohat
Peshawar Risalpur
Bahawalnagar
Bhawalpur
Dhamial
D.G.Khan
Faisalabad
Islamabad
Jhang
Jhelum
Jouharabad
Kamra
Khanpur
Lahore
Mundi B.D.
Mangala
Mianwali
Multan
Noorpurthal
OkaraRafiqui
R.Y.Khan
Sahiwal
Sargodha
Sialkot
Badin
Chhor
Dadu
Hyderabad
Jacobabad
Karachi
Larkana
Mir Pur Khas
Mithi
Moenjodaro
Nawabshah
Padidan
RohriSukkar
Thatta
Tando jam
Plain Station
I R A N
-100
-50
0
50
100
150
200
300
400
500
62° E 64° E 66° E 68° E 70° E 72° E 74° E 76° E
62° E 64° E 66° E 68° E 70° E 72° E 74° E 76° E
24° N
26° N
28° N
30° N
32° N
34° N
36° N
24° N
26° N
28° N
30° N
32° N
34° N
36° N
A R A B I A N S E A
C H I N AMONSOON (Jul-Sep) 2011 Rainfall (mm)
AstoreBabusar
BunjiChilas
Ghari Dupatta
Gilgit
GupisHunza
Kotli
Muzaffarabad
Rawalakot
Skardu
Barkhan
DalbandinKalat
Khuzdar
Panjgur
Quetta
Zhob
Balakot
Cherat
Chitral
Dir
Drosh
Kakul
Kalam
Malam Jaba
Parachinar
Patan
Saidu Sharif
Murree
Hill Station
GwadarJiwani
Lasbella
Nokkundi
OrmaraPasni
Sibi
Turbat
Uthal
Bannu
D.I.Khan
Kohat
Peshawar Risalpur
Bahawalnagar
Bhawalpur
Dhamial
D.G.Khan
Faisalabad
Islamabad
Jhang
Jhelum
Jouharabad
Kamra
Khanpur
Lahore
Mundi B.D.
Mangala
Mianwali
Multan
Noorpurthal
OkaraRafiqui
R.Y.Khan
Sahiwal
Sargodha
Sialkot
Badin
Chhor
Dadu
Hyderabad
Jacobabad
Karachi
Larkana
Mir Pur Khas
Mithi
Moenjodaro
Nawabshah
Padidan
RohriSukkar
Thatta
Tando jam
Plain Station
I R A N
0
50
100
150
200
250
300
400
500
600
700
900
1100
1300
62° E 64° E 66° E 68° E 70° E 72° E 74° E 76° E
62° E 64° E 66° E 68° E 70° E 72° E 74° E 76° E
24° N
26° N
28° N
30° N
32° N
34° N
36° N
24° N
26° N
28° N
30° N
32° N
34° N
36° N
A R A B I A N S E A
C H I N AMONSOON Normal (Jul-Sep) Rainfall (mm)
AstoreBabusar
BunjiChilas
Ghari Dupatta
Gilgit
GupisHunza
Kotli
Muzaffarabad
Rawalakot
Skardu
Barkhan
DalbandinKalat
Khuzdar
Panjgur
Quetta
Zhob
Balakot
Cherat
Chitral
Dir
Drosh
Kakul
Kalam
Malam Jaba
Parachinar
Patan
Saidu Sharif
Murree
Hill Station
GwadarJiwani
Lasbella
Nokkundi
OrmaraPasni
Sibi
Turbat
Uthal
Bannu
D.I.Khan
Kohat
Peshawar Risalpur
Bahawalnagar
Bhawalpur
Dhamial
D.G.Khan
Faisalabad
Islamabad
Jhang
Jhelum
Jouharabad
Kamra
Khanpur
Lahore
Mundi B.D.
Mangala
Mianwali
Multan
Noorpurthal
OkaraRafiqui
R.Y.Khan
Sahiwal
Sargodha
Sialkot
Badin
Chhor
Dadu
Hyderabad
Jacobabad
Karachi
Larkana
Mir Pur Khas
Mithi
Moenjodaro
Nawabshah
Padidan
RohriSukkar
Thatta
Tando jam
Plain Station
I R A N
0
50
100
150
200
250
300
400
500
600
700
800
900
SSppeecciiaall RReeppoorrtt oonn PPaakkiissttaann’’ss MMoonnssoooonn 22001111 RRaaiinnffaallll
Page # 6
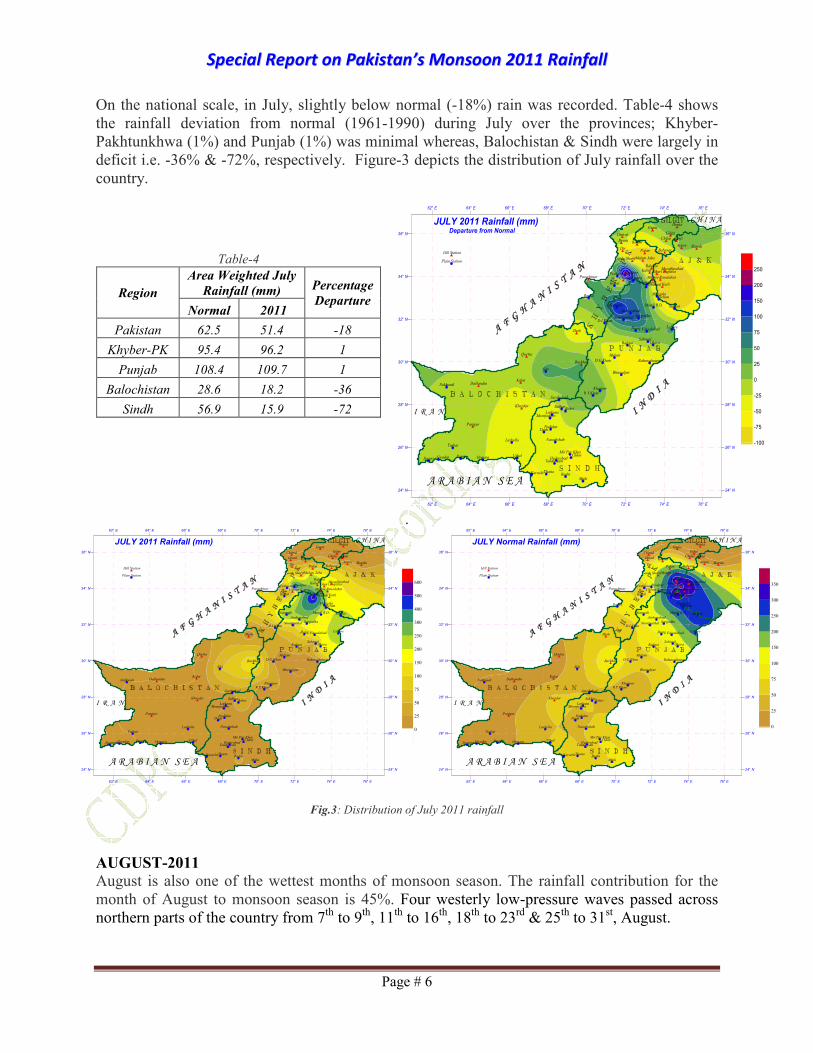
On the national scale, in July, slightly below normal (-18%) rain was recorded. Table-4 shows
the rainfall deviation from normal (1961-1990) during July over the provinces; Khyber-
Pakhtunkhwa (1%) and Punjab (1%) was minimal whereas, Balochistan & Sindh were largely in
deficit i.e. -36% & -72%, respectively. Figure-3 depicts the distribution of July rainfall over the
country.
Table-4
Region
Area Weighted July
Rainfall (mm) Percentage
Departure Normal 2011
Pakistan 62.5 51.4 -18
Khyber-PK 95.4 96.2 1
Punjab 108.4 109.7 1
Balochistan 28.6 18.2 -36
Sindh 56.9 15.9 -72
.
Fig.3: Distribution of July 2011 rainfall
AUGUST-2011 August is also one of the wettest months of monsoon season. The rainfall contribution for the
month of August to monsoon season is 45%. Four westerly low-pressure waves passed across
northern parts of the country from 7th to 9
th, 11
th to 16
th, 18
th to 23
rd & 25
th to 31
st, August.
62° E 64° E 66° E 68° E 70° E 72° E 74° E 76° E
62° E 64° E 66° E 68° E 70° E 72° E 74° E 76° E
24° N
26° N
28° N
30° N
32° N
34° N
36° N
24° N
26° N
28° N
30° N
32° N
34° N
36° N
A R A B I A N S E A
C H I N AJULY 2011 Rainfall (mm)Departure from Normal
AstoreBabusar
BunjiChilas
Ghari Dupatta
Gilgit
GupisHunza
Kotli
Muzaffarabad
Rawalakot
Skardu
Barkhan
DalbandinKalat
Khuzdar
Panjgur
Quetta
Zhob
Balakot
Cherat
Chitral
Dir
Drosh
Kakul
Kalam
Malam Jaba
Parachinar
Patan
Saidu Sharif
Murree
Hill Station
GwadarJiwani
Lasbella
Nokkundi
OrmaraPasni
Sibi
Turbat
Uthal
Bannu
D.I.Khan
Kohat
Peshawar Risalpur
Bahawalnagar
Bhawalpur
Dhamial
D.G.Khan
Faisalabad
Islamabad
Jhang
Jhelum
Jouharabad
Kamra
Khanpur
Lahore
Mundi B.D.
Mangala
Mianwali
Multan
Noorpurthal
OkaraRafiqui
R.Y.Khan
Sahiwal
Sargodha
Sialkot
Badin
Chhor
Dadu
Hyderabad
Jacobabad
Karachi
Larkana
Mir Pur Khas
Mithi
Moenjodaro
Nawabshah
Padidan
RohriSukkar
Thatta
Tando jam
Plain Station
I R A N
-100
-75
-50
-25
0
25
50
75
100
150
200
250
62° E 64° E 66° E 68° E 70° E 72° E 74° E 76° E
62° E 64° E 66° E 68° E 70° E 72° E 74° E 76° E
24° N
26° N
28° N
30° N
32° N
34° N
36° N
24° N
26° N
28° N
30° N
32° N
34° N
36° N
A R A B I A N S E A
C H I N AJULY 2011 Rainfall (mm)
AstoreBabusar
BunjiChilas
Ghari Dupatta
Gilgit
GupisHunza
Kotli
Muzaffarabad
Rawalakot
Skardu
Barkhan
DalbandinKalat
Khuzdar
Panjgur
Quetta
Zhob
Balakot
Cherat
Chitral
Dir
Drosh
Kakul
Kalam
Malam Jaba
Parachinar
Patan
Saidu Sharif
Murree
Hill Station
GwadarJiwani
Lasbella
Nokkundi
OrmaraPasni
Sibi
Turbat
Uthal
Bannu
D.I.Khan
Kohat
Peshawar Risalpur
Bahawalnagar
Bhawalpur
Dhamial
D.G.Khan
Faisalabad
Islamabad
Jhang
Jhelum
Jouharabad
Kamra
Khanpur
Lahore
Mundi B.D.
Mangala
Mianwali
Multan
Noorpurthal
OkaraRafiqui
R.Y.Khan
Sahiwal
Sargodha
Sialkot
Badin
Chhor
Dadu
Hyderabad
Jacobabad
Karachi
Larkana
Mir Pur Khas
Mithi
Moenjodaro
Nawabshah
Padidan
RohriSukkar
Thatta
Tando jam
Plain Station
I R A N
0
25
50
75
100
150
200
250
300
400
500
600
62° E 64° E 66° E 68° E 70° E 72° E 74° E 76° E
62° E 64° E 66° E 68° E 70° E 72° E 74° E 76° E
24° N
26° N
28° N
30° N
32° N
34° N
36° N
24° N
26° N
28° N
30° N
32° N
34° N
36° N
A R A B I A N S E A
C H I N AJULY Normal Rainfall (mm)
AstoreBabusar
BunjiChilas
Ghari Dupatta
Gilgit
GupisHunza
Kotli
Muzaffarabad
Rawalakot
Skardu
Barkhan
DalbandinKalat
Khuzdar
Panjgur
Quetta
Zhob
Balakot
Cherat
Chitral
Dir
Drosh
Kakul
Kalam
Malam Jaba
Parachinar
Patan
Saidu Sharif
Murree
Hill Station
GwadarJiwani
Lasbella
Nokkundi
OrmaraPasni
Sibi
Turbat
Uthal
Bannu
D.I.Khan
Kohat
Peshawar Risalpur
Bahawalnagar
Bhawalpur
Dhamial
D.G.Khan
Faisalabad
Islamabad
Jhang
Jhelum
Jouharabad
Kamra
Khanpur
Lahore
Mundi B.D.
Mangala
Mianwali
Multan
Noorpurthal
OkaraRafiqui
R.Y.Khan
Sahiwal
Sargodha
Sialkot
Badin
Chhor
Dadu
Hyderabad
Jacobabad
Karachi
Larkana
Mir Pur Khas
Mithi
Moenjodaro
Nawabshah
Padidan
RohriSukkar
Thatta
Tando jam
Plain Station
I R A N
0
25
50
75
100
150
200
250
300
350
SSppeecciiaall RReeppoorrtt oonn PPaakkiissttaann’’ss MMoonnssoooonn 22001111 RRaaiinnffaallll
Page # 7
Table-5
Region
Area Weighted
August Rainfall
(mm)
Percentage
Departure Normal 2011
Pakistan 55.4 88.0 59
Khyber-PK 94.0 102.3 9
Punjab 93.6 109.1 17
Balochistan 23.0 28.0 22
Sindh 52.4 194.6 271
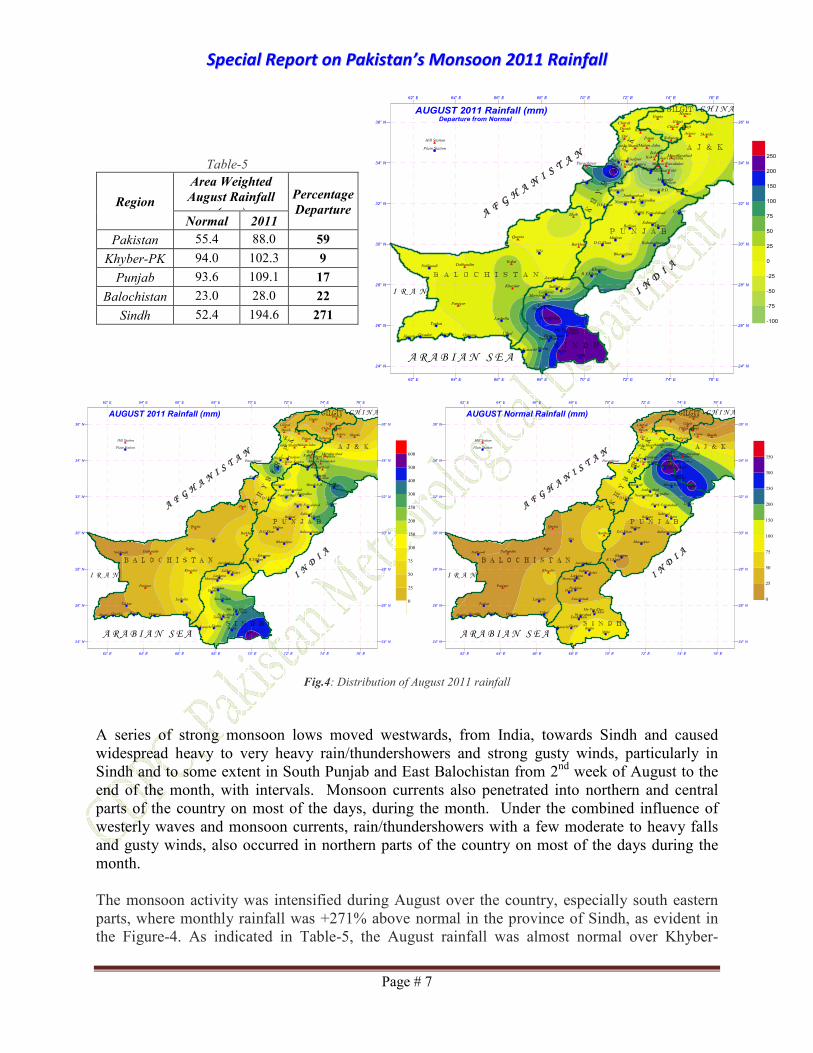
Fig.4: Distribution of August 2011 rainfall
A series of strong monsoon lows moved westwards, from India, towards Sindh and caused
widespread heavy to very heavy rain/thundershowers and strong gusty winds, particularly in
Sindh and to some extent in South Punjab and East Balochistan from 2nd week of August to the
end of the month, with intervals. Monsoon currents also penetrated into northern and central
parts of the country on most of the days, during the month. Under the combined influence of
westerly waves and monsoon currents, rain/thundershowers with a few moderate to heavy falls
and gusty winds, also occurred in northern parts of the country on most of the days during the
month.
The monsoon activity was intensified during August over the country, especially south eastern
parts, where monthly rainfall was +271% above normal in the province of Sindh, as evident in
the Figure-4. As indicated in Table-5, the August rainfall was almost normal over Khyber-
62° E 64° E 66° E 68° E 70° E 72° E 74° E 76° E
62° E 64° E 66° E 68° E 70° E 72° E 74° E 76° E
24° N
26° N
28° N
30° N
32° N
34° N
36° N
24° N
26° N
28° N
30° N
32° N
34° N
36° N
A R A B I A N S E A
C H I N AAUGUST 2011 Rainfall (mm)Departure from Normal
AstoreBabusar
BunjiChilas
Ghari Dupatta
Gilgit
GupisHunza
Kotli
Muzaffarabad
Rawalakot
Skardu
Barkhan
DalbandinKalat
Khuzdar
Panjgur
Quetta
Zhob
Balakot
Cherat
Chitral
Dir
Drosh
Kakul
Kalam
Malam Jaba
Parachinar
Patan
Saidu Sharif
Murree
Hill Station
GwadarJiwani
Lasbella
Nokkundi
OrmaraPasni
Sibi
Turbat
Uthal
Bannu
D.I.Khan
Kohat
Peshawar Risalpur
Bahawalnagar
Bhawalpur
Dhamial
D.G.Khan
Faisalabad
Islamabad
Jhang
Jhelum
Jouharabad
Kamra
Khanpur
Lahore
Mundi B.D.
Mangala
Mianwali
Multan
Noorpurthal
OkaraRafiqui
R.Y.Khan
Sahiwal
Sargodha
Sialkot
Badin
Chhor
Dadu
Hyderabad
Jacobabad
Karachi
Larkana
Mir Pur Khas
Mithi
Moenjodaro
Nawabshah
Padidan
RohriSukkar
Thatta
Tando jam
Plain Station
I R A N
-100
-75
-50
-25
0
25
50
75
100
150
200
250
62° E 64° E 66° E 68° E 70° E 72° E 74° E 76° E
62° E 64° E 66° E 68° E 70° E 72° E 74° E 76° E
24° N
26° N
28° N
30° N
32° N
34° N
36° N
24° N
26° N
28° N
30° N
32° N
34° N
36° N
A R A B I A N S E A
C H I N AAUGUST 2011 Rainfall (mm)
AstoreBabusar
BunjiChilas
Ghari Dupatta
Gilgit
GupisHunza
Kotli
Muzaffarabad
Rawalakot
Skardu
Barkhan
DalbandinKalat
Khuzdar
Panjgur
Quetta
Zhob
Balakot
Cherat
Chitral
Dir
Drosh
Kakul
Kalam
Malam Jaba
Parachinar
Patan
Saidu Sharif
Murree
Hill Station
GwadarJiwani
Lasbella
Nokkundi
OrmaraPasni
Sibi
Turbat
Uthal
Bannu
D.I.Khan
Kohat
Peshawar Risalpur
Bahawalnagar
Bhawalpur
Dhamial
D.G.Khan
Faisalabad
Islamabad
Jhang
Jhelum
Jouharabad
Kamra
Khanpur
Lahore
Mundi B.D.
Mangala
Mianwali
Multan
Noorpurthal
OkaraRafiqui
R.Y.Khan
Sahiwal
Sargodha
Sialkot
Badin
Chhor
Dadu
Hyderabad
Jacobabad
Karachi
Larkana
Mir Pur Khas
Mithi
Moenjodaro
Nawabshah
Padidan
RohriSukkar
Thatta
Tando jam
Plain Station
I R A N
0
25
50
75
100
150
200
250
300
400
500
600
62° E 64° E 66° E 68° E 70° E 72° E 74° E 76° E
62° E 64° E 66° E 68° E 70° E 72° E 74° E 76° E
24° N
26° N
28° N
30° N
32° N
34° N
36° N
24° N
26° N
28° N
30° N
32° N
34° N
36° N
A R A B I A N S E A
C H I N AAUGUST Normal Rainfall (mm)
AstoreBabusar
BunjiChilas
Ghari Dupatta
Gilgit
GupisHunza
Kotli
Muzaffarabad
Rawalakot
Skardu
Barkhan
DalbandinKalat
Khuzdar
Panjgur
Quetta
Zhob
Balakot
Cherat
Chitral
Dir
Drosh
Kakul
Kalam
Malam Jaba
Parachinar
Patan
Saidu Sharif
Murree
Hill Station
GwadarJiwani
Lasbella
Nokkundi
OrmaraPasni
Sibi
Turbat
Uthal
Bannu
D.I.Khan
Kohat
Peshawar Risalpur
Bahawalnagar
Bhawalpur
Dhamial
D.G.Khan
Faisalabad
Islamabad
Jhang
Jhelum
Jouharabad
Kamra
Khanpur
Lahore
Mundi B.D.
Mangala
Mianwali
Multan
Noorpurthal
OkaraRafiqui
R.Y.Khan
Sahiwal
Sargodha
Sialkot
Badin
Chhor
Dadu
Hyderabad
Jacobabad
Karachi
Larkana
Mir Pur Khas
Mithi
Moenjodaro
Nawabshah
Padidan
RohriSukkar
Thatta
Tando jam
Plain Station
I R A N
0
25
50
75
100
150
200
250
300
350
SSppeecciiaall RReeppoorrtt oonn PPaakkiissttaann’’ss MMoonnssoooonn 22001111 RRaaiinnffaallll
Page # 8
Pakhtonkhwa (9%) and slightly above normal over Punjab (17%) & Balochistan (22%). The
August monsoon rainfall, over province of Sindh (271 % above normal) is the heaviest recorded
during the period 1961-2011.
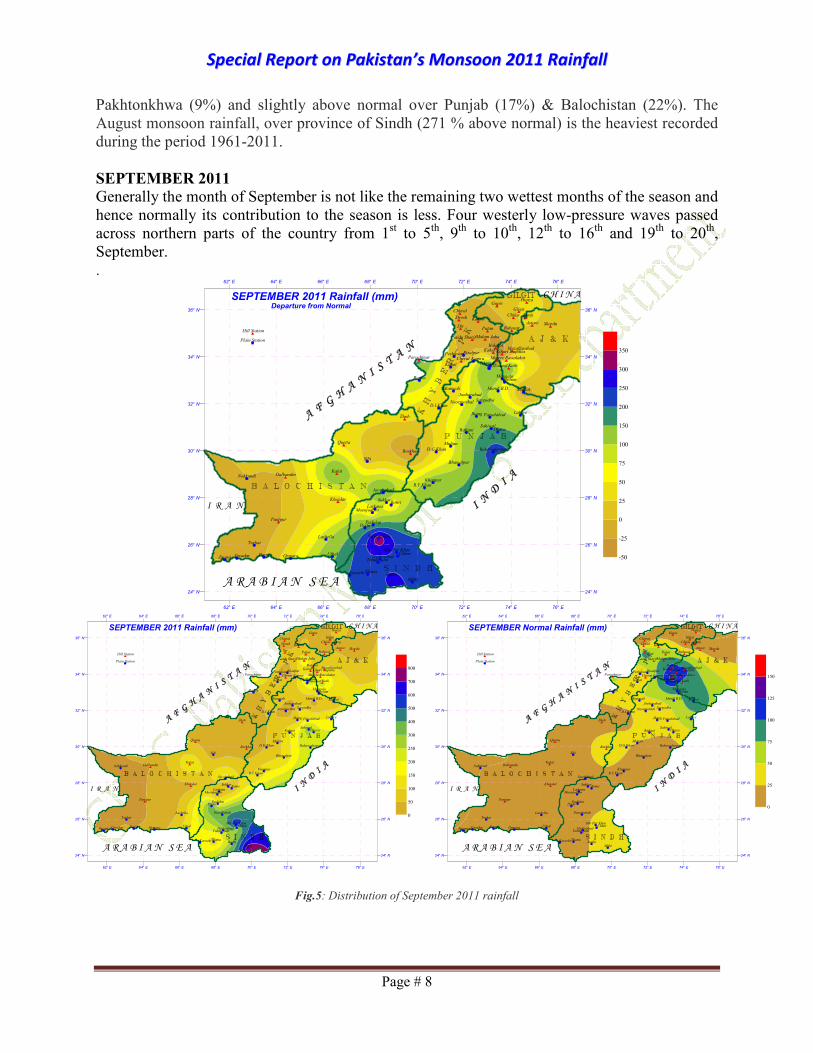
SEPTEMBER 2011
Generally the month of September is not like the remaining two wettest months of the season and
hence normally its contribution to the season is less. Four westerly low-pressure waves passed
across northern parts of the country from 1st to 5
th, 9
th to 10
th, 12
th to 16
th and 19
th to 20
th,
September.
.
Fig.5: Distribution of September 2011 rainfall
62° E 64° E 66° E 68° E 70° E 72° E 74° E 76° E
62° E 64° E 66° E 68° E 70° E 72° E 74° E 76° E
24° N
26° N
28° N
30° N
32° N
34° N
36° N
24° N
26° N
28° N
30° N
32° N
34° N
36° N
A R A B I A N S E A
C H I N ASEPTEMBER 2011 Rainfall (mm)Departure from Normal
AstoreBabusar
BunjiChilas
Ghari Dupatta
Gilgit
GupisHunza
Kotli
Muzaffarabad
Rawalakot
Skardu
Barkhan
DalbandinKalat
Khuzdar
Panjgur
Quetta
Zhob
Balakot
Cherat
Chitral
Dir
Drosh
Kakul
Kalam
Malam Jaba
Parachinar
Patan
Saidu Sharif
Murree
Hill Station
GwadarJiwani
Lasbella
Nokkundi
OrmaraPasni
Sibi
Turbat
Uthal
Bannu
D.I.Khan
Kohat
Peshawar Risalpur
Bahawalnagar
Bhawalpur
Dhamial
D.G.Khan
Faisalabad
Islamabad
Jhang
Jhelum
Jouharabad
Kamra
Khanpur
Lahore
Mundi B.D.
Mangala
Mianwali
Multan
Noorpurthal
OkaraRafiqui
R.Y.Khan
Sahiwal
Sargodha
Sialkot
Badin
Chhor
Dadu
Hyderabad
Jacobabad
Karachi
Larkana
Mir Pur Khas
Mithi
Moenjodaro
Nawabshah
Padidan
RohriSukkar
Thatta
Tando jam
Plain Station
I R A N
-50
-25
0
25
50
75
100
150
200
250
300
350
62° E 64° E 66° E 68° E 70° E 72° E 74° E 76° E
62° E 64° E 66° E 68° E 70° E 72° E 74° E 76° E
24° N
26° N
28° N
30° N
32° N
34° N
36° N
24° N
26° N
28° N
30° N
32° N
34° N
36° N
A R A B I A N S E A
C H I N ASEPTEMBER 2011 Rainfall (mm)
AstoreBabusar
BunjiChilas
Ghari Dupatta
Gilgit
GupisHunza
Kotli
Muzaffarabad
Rawalakot
Skardu
Barkhan
DalbandinKalat
Khuzdar
Panjgur
Quetta
Zhob
Balakot
Cherat
Chitral
Dir
Drosh
Kakul
Kalam
Malam Jaba
Parachinar
Patan
Saidu Sharif
Murree
Hill Station
GwadarJiwani
Lasbella
Nokkundi
OrmaraPasni
Sibi
Turbat
Uthal
Bannu
D.I.Khan
Kohat
Peshawar Risalpur
Bahawalnagar
Bhawalpur
Dhamial
D.G.Khan
Faisalabad
Islamabad
Jhang
Jhelum
Jouharabad
Kamra
Khanpur
Lahore
Mundi B.D.
Mangala
Mianwali
Multan
Noorpurthal
OkaraRafiqui
R.Y.Khan
Sahiwal
Sargodha
Sialkot
Badin
Chhor
Dadu
Hyderabad
Jacobabad
Karachi
Larkana
Mir Pur Khas
Mithi
Moenjodaro
Nawabshah
Padidan
RohriSukkar
Thatta
Tando jam
Plain Station
I R A N
0
50
100
150
200
250
300
400
500
600
700
800
62° E 64° E 66° E 68° E 70° E 72° E 74° E 76° E
62° E 64° E 66° E 68° E 70° E 72° E 74° E 76° E
24° N
26° N
28° N
30° N
32° N
34° N
36° N
24° N
26° N
28° N
30° N
32° N
34° N
36° N
A R A B I A N S E A
C H I N ASEPTEMBER Normal Rainfall (mm)
AstoreBabusar
BunjiChilas
Ghari Dupatta
Gilgit
GupisHunza
Kotli
Muzaffarabad
Rawalakot
Skardu
Barkhan
DalbandinKalat
Khuzdar
Panjgur
Quetta
Zhob
Balakot
Cherat
Chitral
Dir
Drosh
Kakul
Kalam
Malam Jaba
Parachinar
Patan
Saidu Sharif
Murree
Hill Station
GwadarJiwani
Lasbella
Nokkundi
OrmaraPasni
Sibi
Turbat
Uthal
Bannu
D.I.Khan
Kohat
Peshawar Risalpur
Bahawalnagar
Bhawalpur
Dhamial
D.G.Khan
Faisalabad
Islamabad
Jhang
Jhelum
Jouharabad
Kamra
Khanpur
Lahore
Mundi B.D.
Mangala
Mianwali
Multan
Noorpurthal
OkaraRafiqui
R.Y.Khan
Sahiwal
Sargodha
Sialkot
Badin
Chhor
Dadu
Hyderabad
Jacobabad
Karachi
Larkana
Mir Pur Khas
Mithi
Moenjodaro
Nawabshah
Padidan
RohriSukkar
Thatta
Tando jam
Plain Station
I R A N
0
25
50
75
100
125
150
SSppeecciiaall RReeppoorrtt oonn PPaakkiissttaann’’ss MMoonnssoooonn 22001111 RRaaiinnffaallll
Page # 9
A series of strong monsoon lows moved westwards, from India, towards Sindh and resulted in
widespread heavy to very heavy rain/thundershowers, with gusty winds in Sindh and at a few
places in South Punjab and East Balochistan, mostly during the first fortnight of the month.
Monsoon currents also penetrated into northern and central parts of the country during first three
weeks of the month. Under the combined influence of westerly waves and monsoon currents
rain/thundershowers, with a few moderate to heavy falls, have also occurred in northern parts of
the country on a number of day during first three weeks of the month i.e. September 2011.
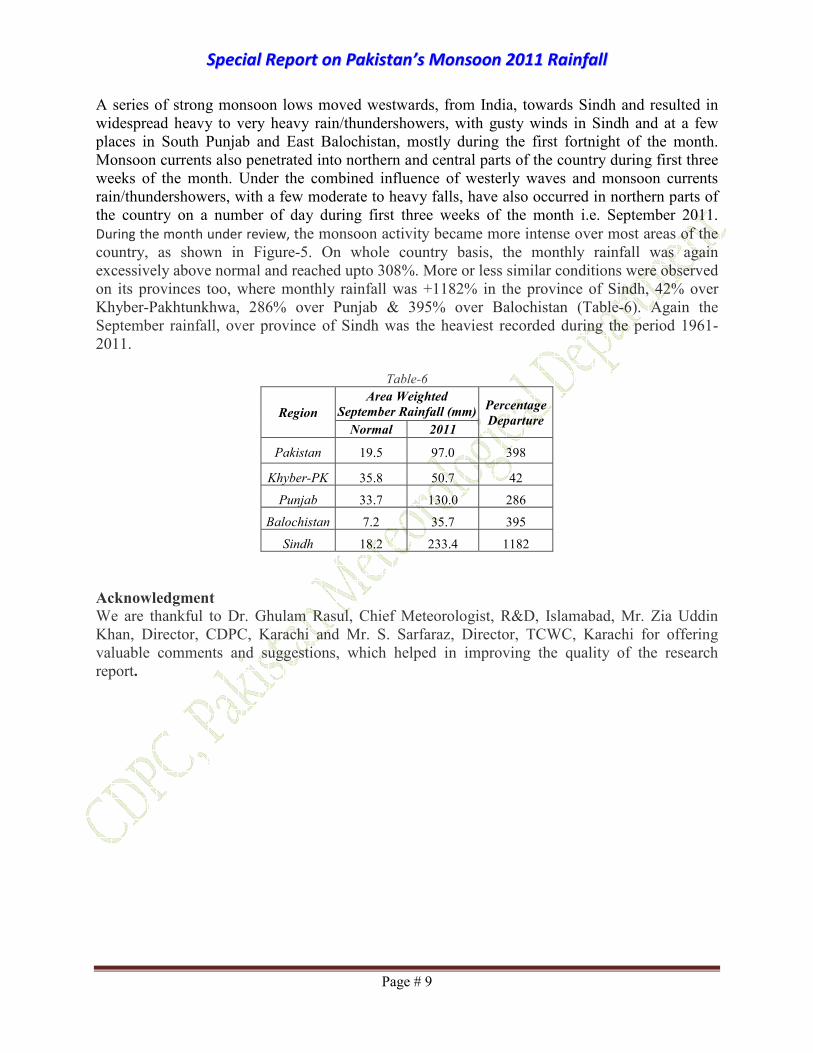
During the month under review, the monsoon activity became more intense over most areas of the
country, as shown in Figure-5. On whole country basis, the monthly rainfall was again
excessively above normal and reached upto 308%. More or less similar conditions were observed
on its provinces too, where monthly rainfall was +1182% in the province of Sindh, 42% over
Khyber-Pakhtunkhwa, 286% over Punjab & 395% over Balochistan (Table-6). Again the
September rainfall, over province of Sindh was the heaviest recorded during the period 1961-
2011.
Table-6
Region
Area Weighted
September Rainfall (mm) Percentage
Departure Normal 2011
Pakistan 19.5 97.0 398
Khyber-PK 35.8 50.7 42
Punjab 33.7 130.0 286
Balochistan 7.2 35.7 395
Sindh 18.2 233.4 1182
Acknowledgment
We are thankful to Dr. Ghulam Rasul, Chief Meteorologist, R&D, Islamabad, Mr. Zia Uddin
Khan, Director, CDPC, Karachi and Mr. S. Sarfaraz, Director, TCWC, Karachi for offering
valuable comments and suggestions, which helped in improving the quality of the research
report.
SSppeecciiaall RReeppoorrtt oonn PPaakkiissttaann’’ss MMoonnssoooonn 22001111 RRaaiinnffaallll
Page # 10
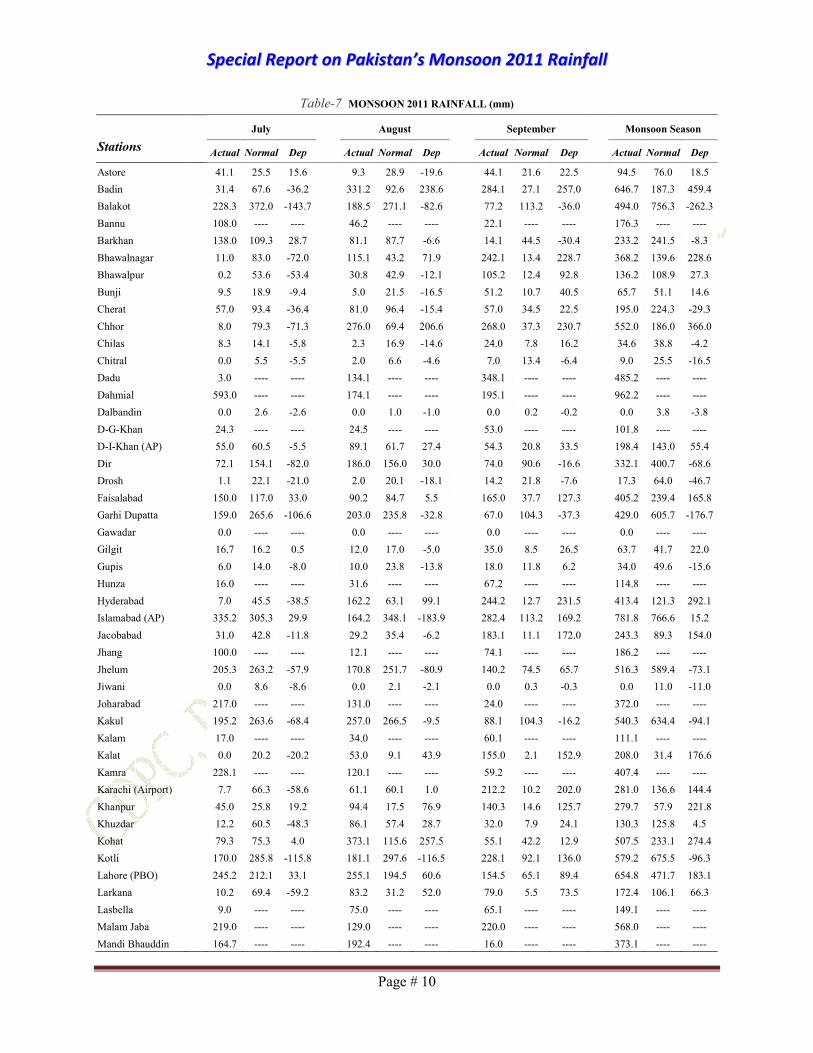
Table-7 MONSOON 2011 RAINFALL (mm)
Stations
July August September Monsoon Season
Actual Normal Dep Actual Normal Dep Actual Normal Dep Actual Normal Dep
Astore 41.1 25.5 15.6 9.3 28.9 -19.6 44.1 21.6 22.5 94.5 76.0 18.5
Badin 31.4 67.6 -36.2 331.2 92.6 238.6 284.1 27.1 257.0 646.7 187.3 459.4
Balakot 228.3 372.0 -143.7 188.5 271.1 -82.6 77.2 113.2 -36.0 494.0 756.3 -262.3
Bannu 108.0 ---- ---- 46.2 ---- ---- 22.1 ---- ---- 176.3 ---- ----
Barkhan 138.0 109.3 28.7 81.1 87.7 -6.6 14.1 44.5 -30.4 233.2 241.5 -8.3
Bhawalnagar 11.0 83.0 -72.0 115.1 43.2 71.9 242.1 13.4 228.7 368.2 139.6 228.6
Bhawalpur 0.2 53.6 -53.4 30.8 42.9 -12.1 105.2 12.4 92.8 136.2 108.9 27.3
Bunji 9.5 18.9 -9.4 5.0 21.5 -16.5 51.2 10.7 40.5 65.7 51.1 14.6
Cherat 57.0 93.4 -36.4 81.0 96.4 -15.4 57.0 34.5 22.5 195.0 224.3 -29.3
Chhor 8.0 79.3 -71.3 276.0 69.4 206.6 268.0 37.3 230.7 552.0 186.0 366.0
Chilas 8.3 14.1 -5.8 2.3 16.9 -14.6 24.0 7.8 16.2 34.6 38.8 -4.2
Chitral 0.0 5.5 -5.5 2.0 6.6 -4.6 7.0 13.4 -6.4 9.0 25.5 -16.5
Dadu 3.0 ---- ---- 134.1 ---- ---- 348.1 ---- ---- 485.2 ---- ----
Dahmial 593.0 ---- ---- 174.1 ---- ---- 195.1 ---- ---- 962.2 ---- ----
Dalbandin 0.0 2.6 -2.6 0.0 1.0 -1.0 0.0 0.2 -0.2 0.0 3.8 -3.8
D-G-Khan 24.3 ---- ---- 24.5 ---- ---- 53.0 ---- ---- 101.8 ---- ----
D-I-Khan (AP) 55.0 60.5 -5.5 89.1 61.7 27.4 54.3 20.8 33.5 198.4 143.0 55.4
Dir 72.1 154.1 -82.0 186.0 156.0 30.0 74.0 90.6 -16.6 332.1 400.7 -68.6
Drosh 1.1 22.1 -21.0 2.0 20.1 -18.1 14.2 21.8 -7.6 17.3 64.0 -46.7
Faisalabad 150.0 117.0 33.0 90.2 84.7 5.5 165.0 37.7 127.3 405.2 239.4 165.8
Garhi Dupatta 159.0 265.6 -106.6 203.0 235.8 -32.8 67.0 104.3 -37.3 429.0 605.7 -176.7
Gawadar 0.0 ---- ---- 0.0 ---- ---- 0.0 ---- ---- 0.0 ---- ----
Gilgit 16.7 16.2 0.5 12.0 17.0 -5.0 35.0 8.5 26.5 63.7 41.7 22.0
Gupis 6.0 14.0 -8.0 10.0 23.8 -13.8 18.0 11.8 6.2 34.0 49.6 -15.6
Hunza 16.0 ---- ---- 31.6 ---- ---- 67.2 ---- ---- 114.8 ---- ----
Hyderabad 7.0 45.5 -38.5 162.2 63.1 99.1 244.2 12.7 231.5 413.4 121.3 292.1
Islamabad (AP) 335.2 305.3 29.9 164.2 348.1 -183.9 282.4 113.2 169.2 781.8 766.6 15.2
Jacobabad 31.0 42.8 -11.8 29.2 35.4 -6.2 183.1 11.1 172.0 243.3 89.3 154.0
Jhang 100.0 ---- ---- 12.1 ---- ---- 74.1 ---- ---- 186.2 ---- ----
Jhelum 205.3 263.2 -57.9 170.8 251.7 -80.9 140.2 74.5 65.7 516.3 589.4 -73.1
Jiwani 0.0 8.6 -8.6 0.0 2.1 -2.1 0.0 0.3 -0.3 0.0 11.0 -11.0
Joharabad 217.0 ---- ---- 131.0 ---- ---- 24.0 ---- ---- 372.0 ---- ----
Kakul 195.2 263.6 -68.4 257.0 266.5 -9.5 88.1 104.3 -16.2 540.3 634.4 -94.1
Kalam 17.0 ---- ---- 34.0 ---- ---- 60.1 ---- ---- 111.1 ---- ----
Kalat 0.0 20.2 -20.2 53.0 9.1 43.9 155.0 2.1 152.9 208.0 31.4 176.6
Kamra 228.1 ---- ---- 120.1 ---- ---- 59.2 ---- ---- 407.4 ---- ----
Karachi (Airport) 7.7 66.3 -58.6 61.1 60.1 1.0 212.2 10.2 202.0 281.0 136.6 144.4
Khanpur 45.0 25.8 19.2 94.4 17.5 76.9 140.3 14.6 125.7 279.7 57.9 221.8
Khuzdar 12.2 60.5 -48.3 86.1 57.4 28.7 32.0 7.9 24.1 130.3 125.8 4.5
Kohat 79.3 75.3 4.0 373.1 115.6 257.5 55.1 42.2 12.9 507.5 233.1 274.4
Kotli 170.0 285.8 -115.8 181.1 297.6 -116.5 228.1 92.1 136.0 579.2 675.5 -96.3
Lahore (PBO) 245.2 212.1 33.1 255.1 194.5 60.6 154.5 65.1 89.4 654.8 471.7 183.1
Larkana 10.2 69.4 -59.2 83.2 31.2 52.0 79.0 5.5 73.5 172.4 106.1 66.3
Lasbella 9.0 ---- ---- 75.0 ---- ---- 65.1 ---- ---- 149.1 ---- ----
Malam Jaba 219.0 ---- ---- 129.0 ---- ---- 220.0 ---- ---- 568.0 ---- ----
Mandi Bhauddin 164.7 ---- ---- 192.4 ---- ---- 16.0 ---- ---- 373.1 ---- ----
SSppeecciiaall RReeppoorrtt oonn PPaakkiissttaann’’ss MMoonnssoooonn 22001111 RRaaiinnffaallll
Page # 11
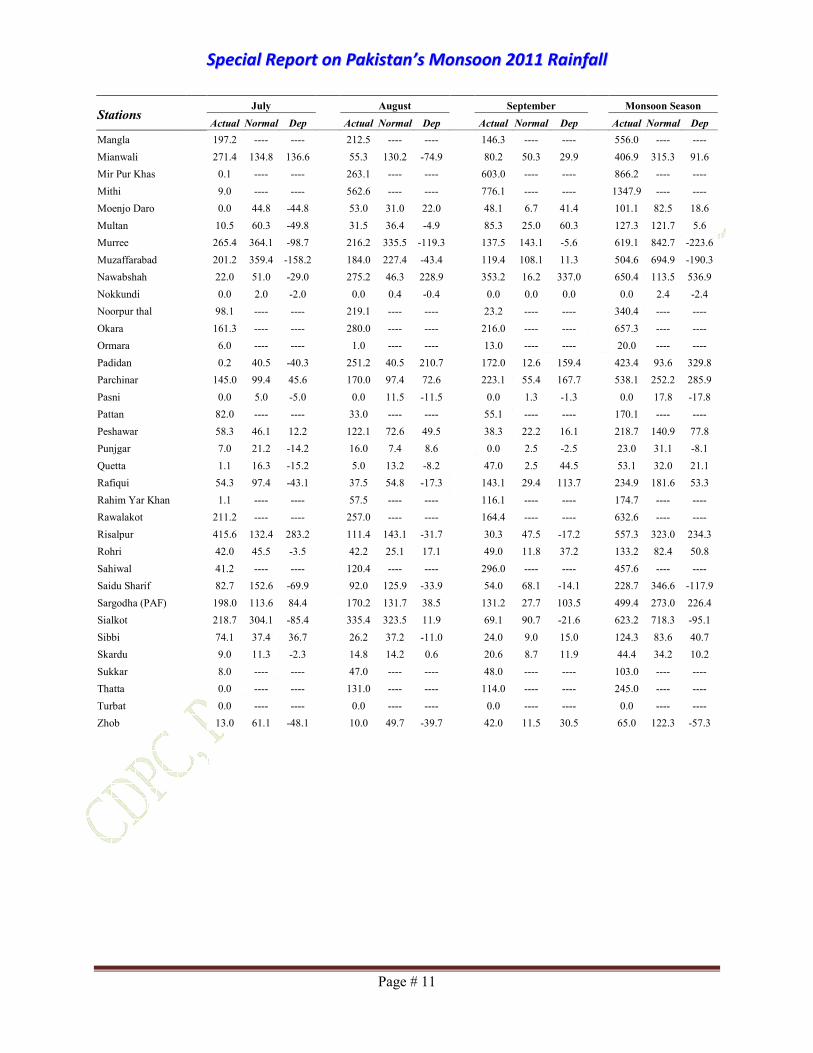
Stations July August September Monsoon Season
Actual Normal Dep Actual Normal Dep Actual Normal Dep Actual Normal Dep
Mangla 197.2 ---- ---- 212.5 ---- ---- 146.3 ---- ---- 556.0 ---- ----
Mianwali 271.4 134.8 136.6 55.3 130.2 -74.9 80.2 50.3 29.9 406.9 315.3 91.6
Mir Pur Khas 0.1 ---- ---- 263.1 ---- ---- 603.0 ---- ---- 866.2 ---- ----
Mithi 9.0 ---- ---- 562.6 ---- ---- 776.1 ---- ---- 1347.9 ---- ----
Moenjo Daro 0.0 44.8 -44.8 53.0 31.0 22.0 48.1 6.7 41.4 101.1 82.5 18.6
Multan 10.5 60.3 -49.8 31.5 36.4 -4.9 85.3 25.0 60.3 127.3 121.7 5.6
Murree 265.4 364.1 -98.7 216.2 335.5 -119.3 137.5 143.1 -5.6 619.1 842.7 -223.6
Muzaffarabad 201.2 359.4 -158.2 184.0 227.4 -43.4 119.4 108.1 11.3 504.6 694.9 -190.3
Nawabshah 22.0 51.0 -29.0 275.2 46.3 228.9 353.2 16.2 337.0 650.4 113.5 536.9
Nokkundi 0.0 2.0 -2.0 0.0 0.4 -0.4 0.0 0.0 0.0 0.0 2.4 -2.4
Noorpur thal 98.1 ---- ---- 219.1 ---- ---- 23.2 ---- ---- 340.4 ---- ----
Okara 161.3 ---- ---- 280.0 ---- ---- 216.0 ---- ---- 657.3 ---- ----
Ormara 6.0 ---- ---- 1.0 ---- ---- 13.0 ---- ---- 20.0 ---- ----
Padidan 0.2 40.5 -40.3 251.2 40.5 210.7 172.0 12.6 159.4 423.4 93.6 329.8
Parchinar 145.0 99.4 45.6 170.0 97.4 72.6 223.1 55.4 167.7 538.1 252.2 285.9
Pasni 0.0 5.0 -5.0 0.0 11.5 -11.5 0.0 1.3 -1.3 0.0 17.8 -17.8
Pattan 82.0 ---- ---- 33.0 ---- ---- 55.1 ---- ---- 170.1 ---- ----
Peshawar 58.3 46.1 12.2 122.1 72.6 49.5 38.3 22.2 16.1 218.7 140.9 77.8
Punjgar 7.0 21.2 -14.2 16.0 7.4 8.6 0.0 2.5 -2.5 23.0 31.1 -8.1
Quetta 1.1 16.3 -15.2 5.0 13.2 -8.2 47.0 2.5 44.5 53.1 32.0 21.1
Rafiqui 54.3 97.4 -43.1 37.5 54.8 -17.3 143.1 29.4 113.7 234.9 181.6 53.3
Rahim Yar Khan 1.1 ---- ---- 57.5 ---- ---- 116.1 ---- ---- 174.7 ---- ----
Rawalakot 211.2 ---- ---- 257.0 ---- ---- 164.4 ---- ---- 632.6 ---- ----
Risalpur 415.6 132.4 283.2 111.4 143.1 -31.7 30.3 47.5 -17.2 557.3 323.0 234.3
Rohri 42.0 45.5 -3.5 42.2 25.1 17.1 49.0 11.8 37.2 133.2 82.4 50.8
Sahiwal 41.2 ---- ---- 120.4 ---- ---- 296.0 ---- ---- 457.6 ---- ----
Saidu Sharif 82.7 152.6 -69.9 92.0 125.9 -33.9 54.0 68.1 -14.1 228.7 346.6 -117.9
Sargodha (PAF) 198.0 113.6 84.4 170.2 131.7 38.5 131.2 27.7 103.5 499.4 273.0 226.4
Sialkot 218.7 304.1 -85.4 335.4 323.5 11.9 69.1 90.7 -21.6 623.2 718.3 -95.1
Sibbi 74.1 37.4 36.7 26.2 37.2 -11.0 24.0 9.0 15.0 124.3 83.6 40.7
Skardu 9.0 11.3 -2.3 14.8 14.2 0.6 20.6 8.7 11.9 44.4 34.2 10.2
Sukkar 8.0 ---- ---- 47.0 ---- ---- 48.0 ---- ---- 103.0 ---- ----
Thatta 0.0 ---- ---- 131.0 ---- ---- 114.0 ---- ---- 245.0 ---- ----
Turbat 0.0 ---- ---- 0.0 ---- ---- 0.0 ---- ---- 0.0 ---- ----
Zhob 13.0 61.1 -48.1 10.0 49.7 -39.7 42.0 11.5 30.5 65.0 122.3 -57.3

The publication “Special Report on Pakistan’s Monsoon 2011 Rainfall“ is compiled & published by the office of
DDIIRREECCTTOORR
CClliimmaattee DDaattaa PPrroocceessssiinngg CCeennttrree
PPAAKKIISSTTAANN MMEETTEEOORROOLLOOGGIICCAALL DDEEPPAARRTTMMEENNTT Meteorological Complex, University Road, Karachi-75270
Phone # 021-99261412 Fax # 021-99261413 e-mail : [email protected]