Embed Size (px)
Citation preview
Monsanto: Yandell © 2012 1
Building Bridges from Breeding to Biometry and Biostatistics
Brian S. YandellProfessor of Horticulture & Statistics
Chair of StatisticsApril 2012
www.stat.wisc.edu/~yandell
Real knowledge is to know the extent of one’s ignorance.
Confucius (on a bench in Seattle)
Monsanto: Yandell © 2012 2
how did I get here?• Biostatistics, School of Public Health, UC-Berkeley 1981
– RA/TA with EL Scott, J Neyman, CL Chiang, S Selvin– PhD 1981
• non-parametric inference for hazard rates (Kjell A Doksum)– Annals of Statistics (1983) 50 citations to date
• research evolution– early career focus on survival analysis– shift to non-parametric regression (1984-99)– shift to statistical genomics (1991--)
• joined Biometry Program at UW-Madison in 1982– attracted by chance to blend statistics, computing and biology– valued balance of mathematical theory against practice– enjoyed developing methodology driven by collaboration
– Chair of Statistics 2011---
Monsanto: Yandell © 2012 3
outline
1. What are stat training options?
2. How to find that gene?
3. Are hotspots real?
4. Which came first? (causal models)
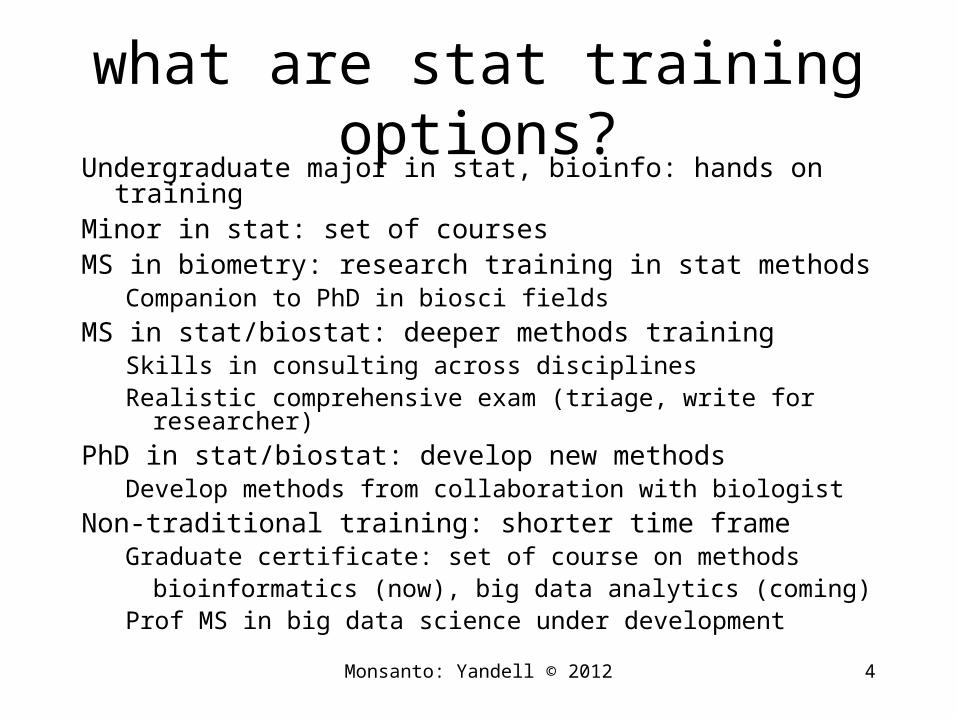
what are stat training options?Undergraduate major in stat, bioinfo: hands on trainingMinor in stat: set of coursesMS in biometry: research training in stat methods
Companion to PhD in biosci fields
MS in stat/biostat: deeper methods trainingSkills in consulting across disciplinesRealistic comprehensive exam (triage, write for researcher)
PhD in stat/biostat: develop new methodsDevelop methods from collaboration with biologist
Non-traditional training: shorter time frameGraduate certificate: set of course on methods
bioinformatics (now), big data analytics (coming)Prof MS in big data science under development
4Monsanto: Yandell © 2012
why train more statisticians?• 200K new jobs in stat by 2018
• Big data explosion• Lagging analytics expertise in every field
• Increasing demand for graduates…
• White House Big Data Initiative: $200M• Build capacity: algorithms, machines, people
• Madison Advanced Research Cyber Infrastructure• Campus-level coordination
• Substantial $$/yr requested
• Statistics will be major player
Monsanto: Yandell © 2012 5
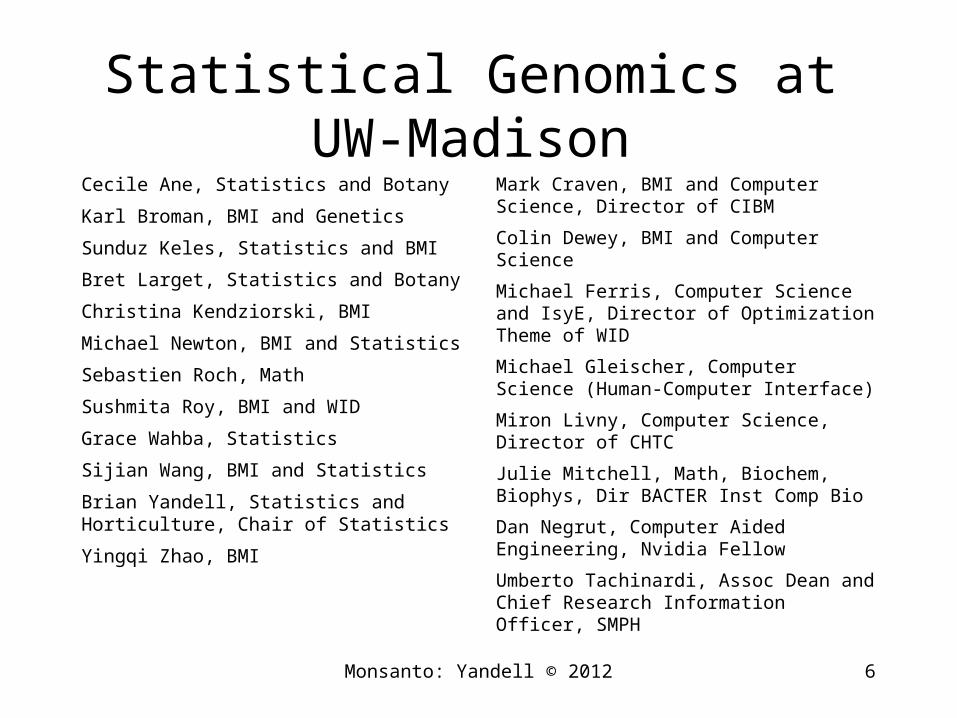
Statistical Genomics at UW-MadisonCecile Ane, Statistics and Botany
Karl Broman, BMI and Genetics
Sunduz Keles, Statistics and BMI
Bret Larget, Statistics and Botany
Christina Kendziorski, BMI
Michael Newton, BMI and Statistics
Sebastien Roch, Math
Sushmita Roy, BMI and WID
Grace Wahba, Statistics
Sijian Wang, BMI and Statistics
Brian Yandell, Statistics and Horticulture, Chair of Statistics
Yingqi Zhao, BMI
Mark Craven, BMI and Computer Science, Director of CIBM
Colin Dewey, BMI and Computer Science
Michael Ferris, Computer Science and IsyE, Director of Optimization Theme of WID
Michael Gleischer, Computer Science (Human-Computer Interface)
Miron Livny, Computer Science, Director of CHTC
Julie Mitchell, Math, Biochem, Biophys, Dir BACTER Inst Comp Bio
Dan Negrut, Computer Aided Engineering, Nvidia Fellow
Umberto Tachinardi, Assoc Dean and Chief Research Information Officer, SMPH
Monsanto: Yandell © 2012 6
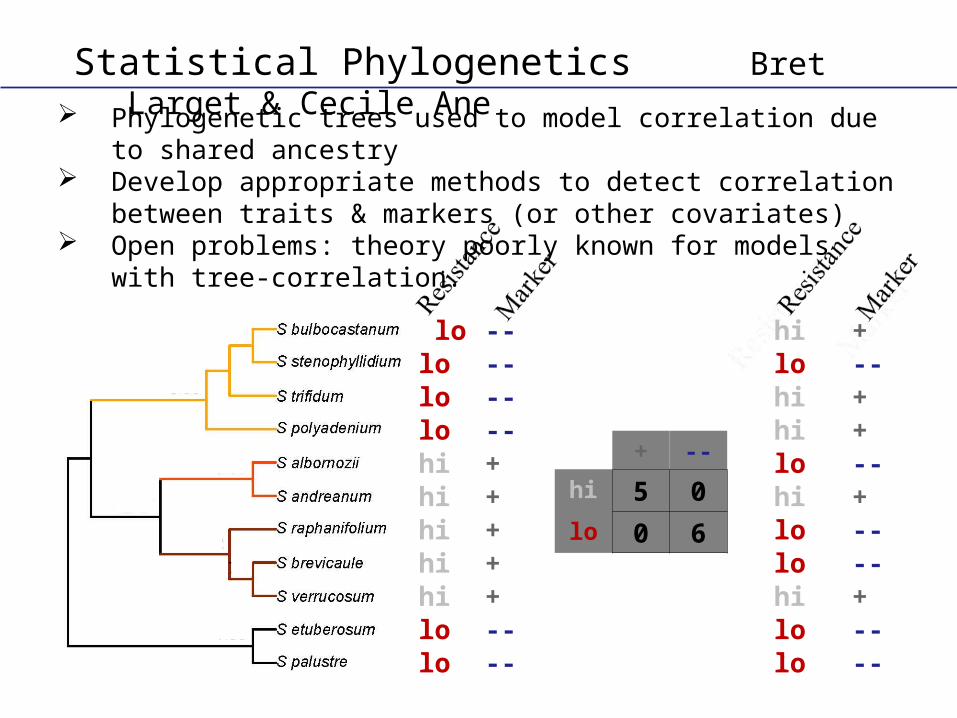
Phylogenetic trees used to model correlation due to shared ancestry Develop appropriate methods to detect correlation between traits &
markers (or other covariates) Open problems: theory poorly known for models with tree-correlation.
lolololohihihihihilolo
--------+++++----
+--++--+----+----
hilohihilohilolohilolo
+ --
hi 5 0
lo 0 6
Statistical Phylogenetics Bret Larget & Cecile Ane
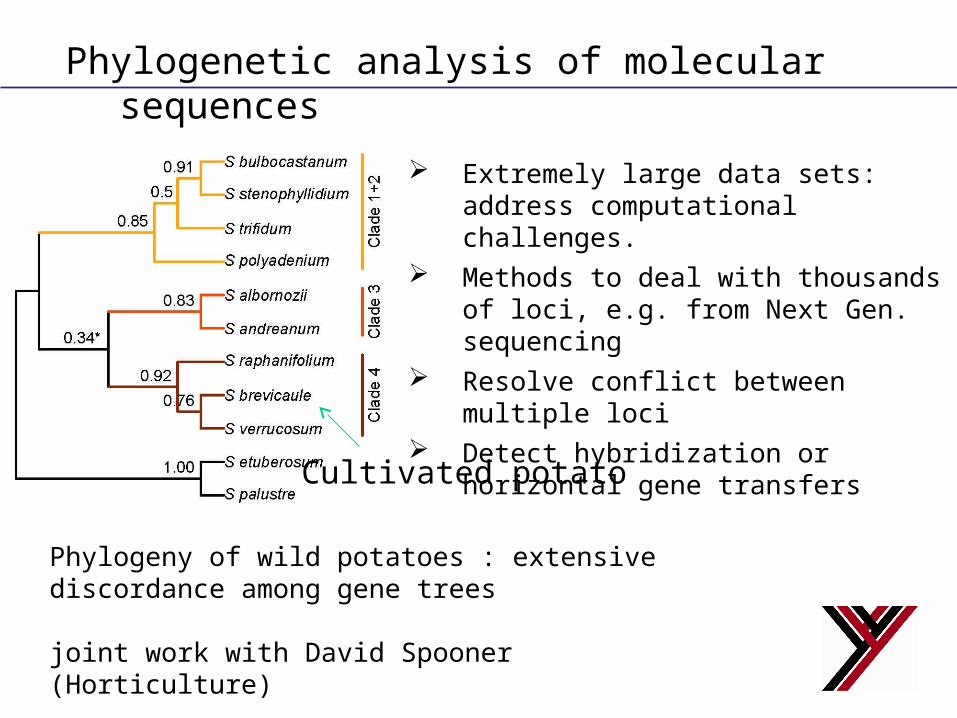
Phylogeny of wild potatoes : extensive discordance among gene trees
joint work with David Spooner (Horticulture)
Cultivated potato
Extremely large data sets: address computational challenges.
Methods to deal with thousands of loci, e.g. from Next Gen. sequencing
Resolve conflict between multiple loci Detect hybridization or horizontal gene
transfers
Phylogenetic analysis of molecular sequences
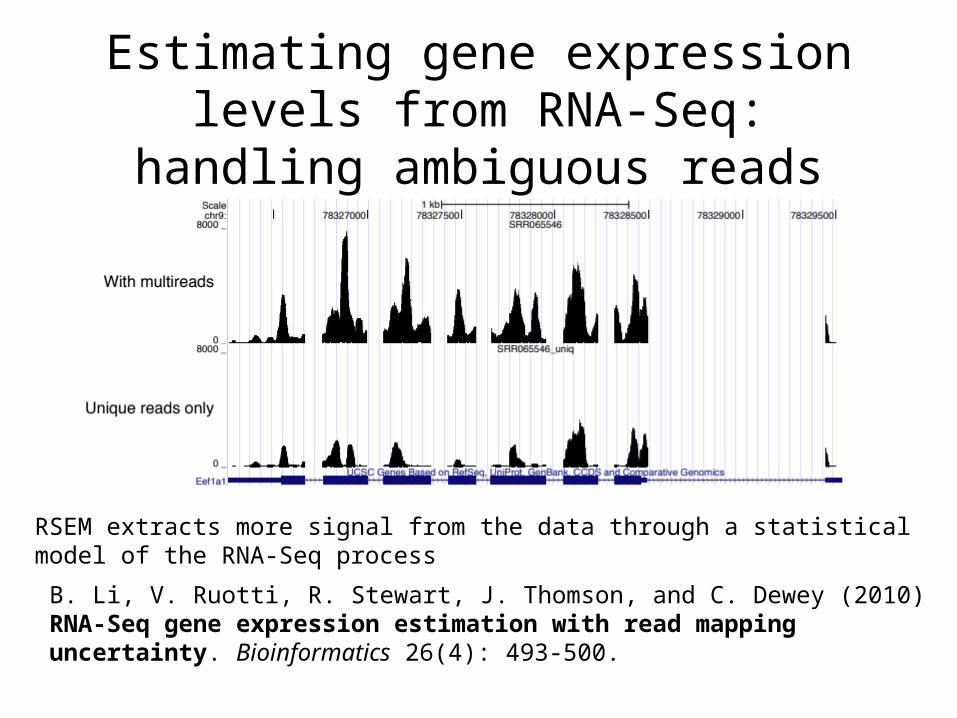
Estimating gene expression levels from RNA-Seq: handling ambiguous reads
B. Li, V. Ruotti, R. Stewart, J. Thomson, and C. Dewey (2010) RNA-Seq gene expression estimation with read mapping uncertainty. Bioinformatics 26(4): 493-500.
(RSEM)
RSEM extracts more signal from the data through a statistical model of the RNA-Seq process
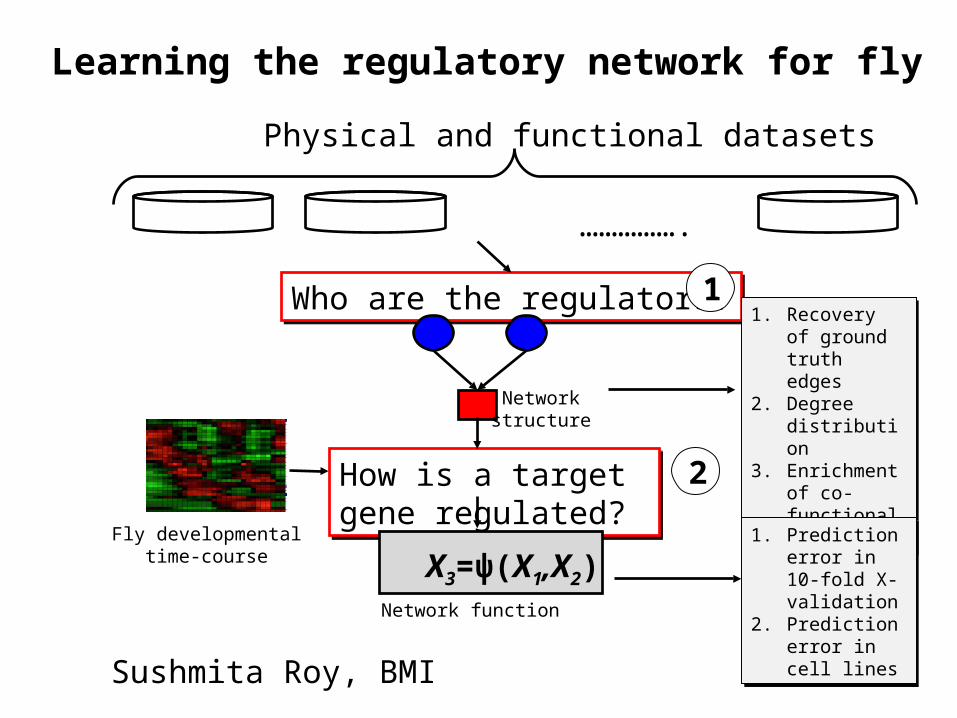
Learning the regulatory network for fly
10
Who are the regulators?Who are the regulators?
Physical and functional datasets
…………….
Network structure
11. Recovery of
ground truth edges
2. Degree distribution
3. Enrichment of co-functional targets
1. Recovery of ground truth edges
2. Degree distribution
3. Enrichment of co-functional targets
Validation
Validation1. Prediction error
in 10-fold X-validation
2. Prediction error in cell lines
1. Prediction error in 10-fold X-validation
2. Prediction error in cell lines
How is a target gene regulated?How is a target gene regulated?
Network function
X3=ψ(X1,X2)
2
Fly developmental time-course
Sushmita Roy, BMI
Monsanto: Yandell © 2012 11
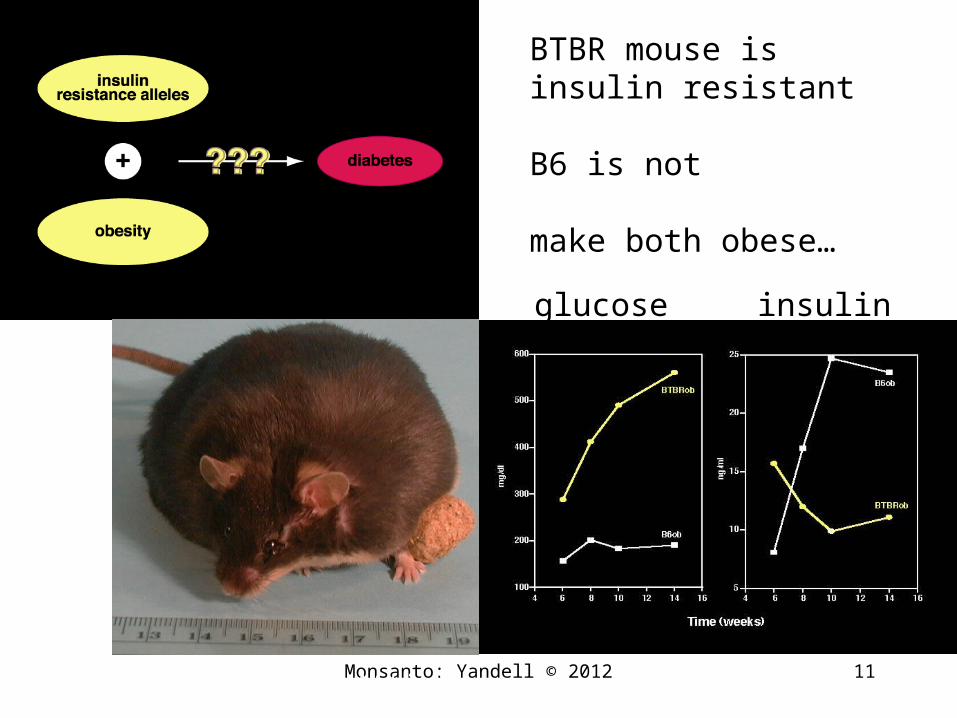
glucose insulin
(courtesy AD Attie)
BTBR mouse isinsulin resistant
B6 is not
make both obese…
Monsanto: Yandell © 2012 12
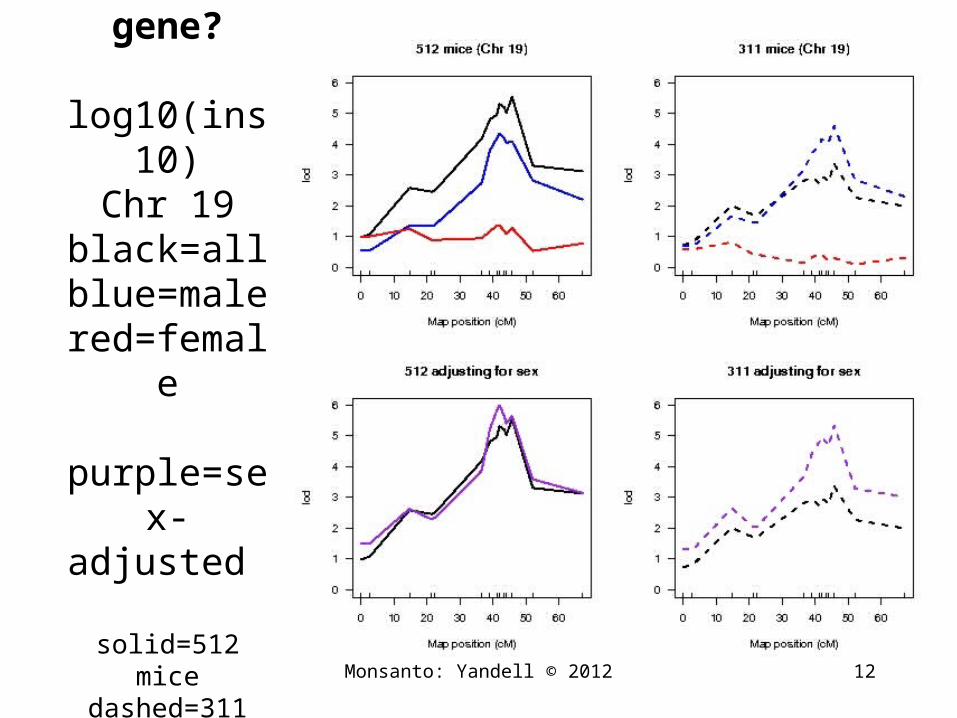
How to find that gene?
log10(ins10)Chr 19
black=allblue=malered=female purple=sex-
adjusted
solid=512 micedashed=311 mice
Monsanto: Yandell © 2012 13
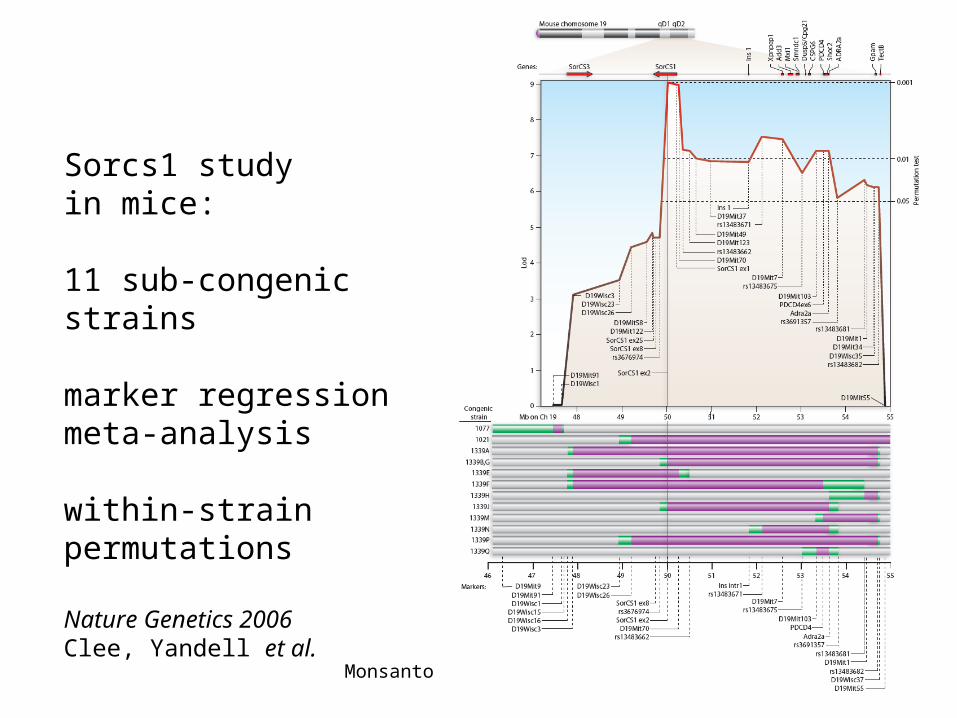
Sorcs1 studyin mice:
11 sub-congenic strains
marker regressionmeta-analysis
within-strain permutations
Nature Genetics 2006Clee, Yandell et al.
Monsanto: Yandell © 2012 14
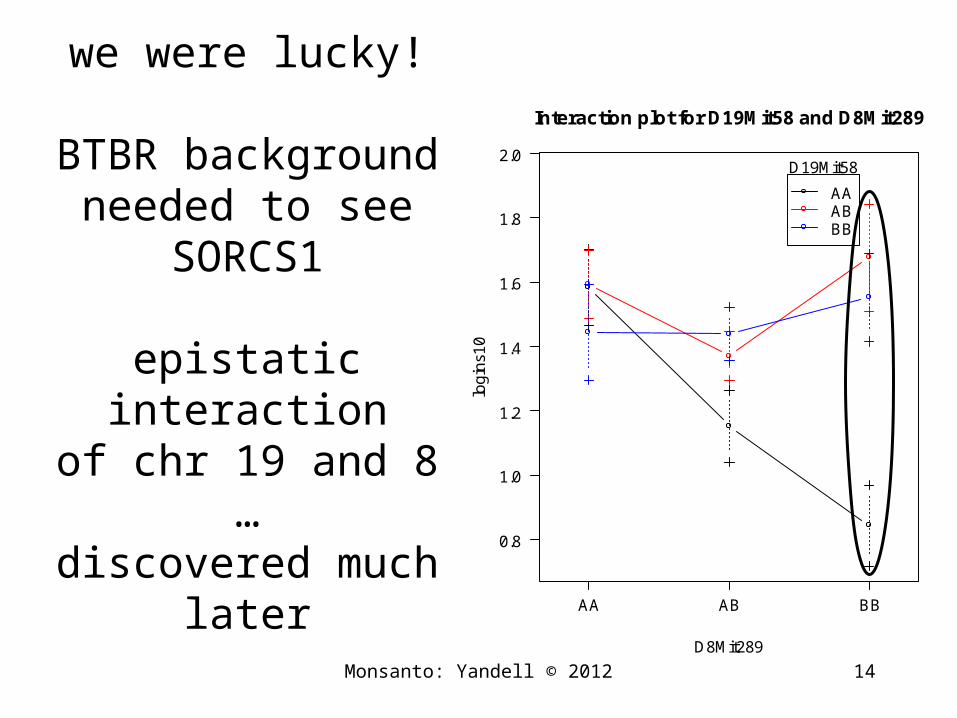
we were lucky!
BTBR backgroundneeded to see SORCS1
epistatic interactionof chr 19 and 8
…discovered much later 0.8
1.0
1.2
1.4
1.6
1.8
2.0
Interaction plot for D19Mit58 and D8Mit289
D8Mit289
log
ins1
0
AA AB BB
AAABBB
D19Mit58
1.0
1.2
1.4
1.6
1.8
Interaction plot for D19Mit58 and D17Mit180
D17Mit180
log
ins1
0
AA AB BB
AAABBB
D19Mit58
Monsanto: Yandell © 2012 15
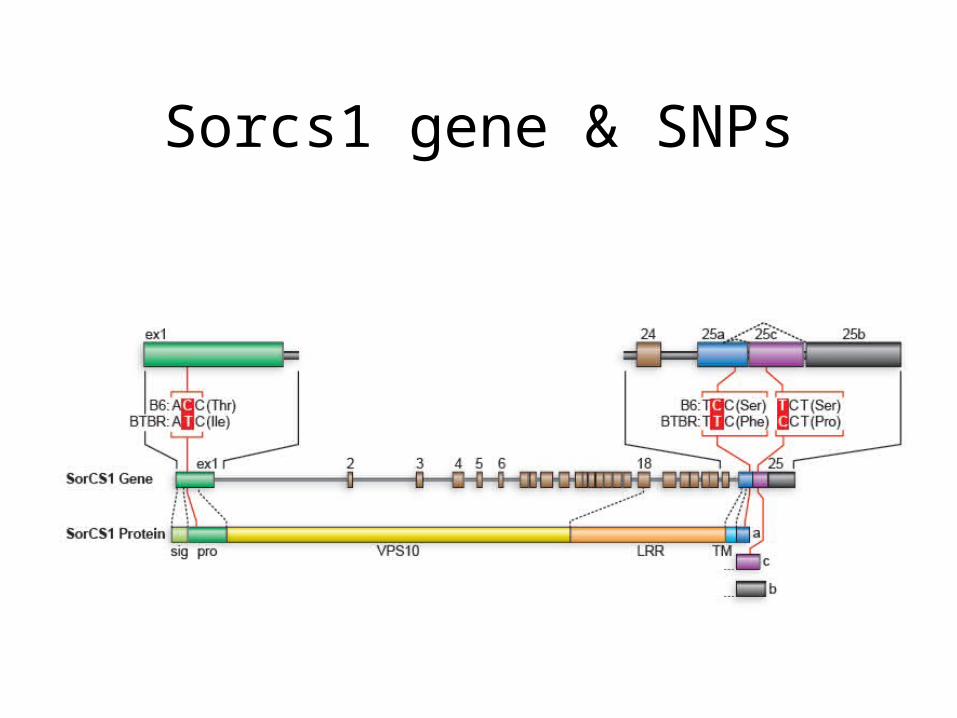
Sorcs1 gene & SNPs
Monsanto: Yandell © 2012 16
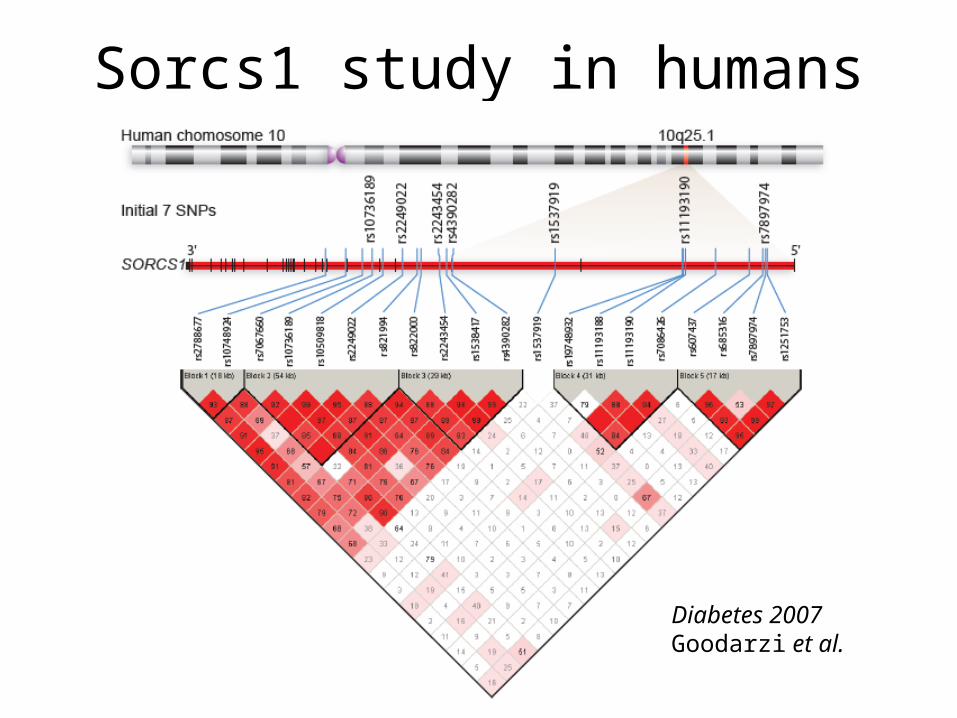
Sorcs1 study in humans
Diabetes 2007Goodarzi et al.
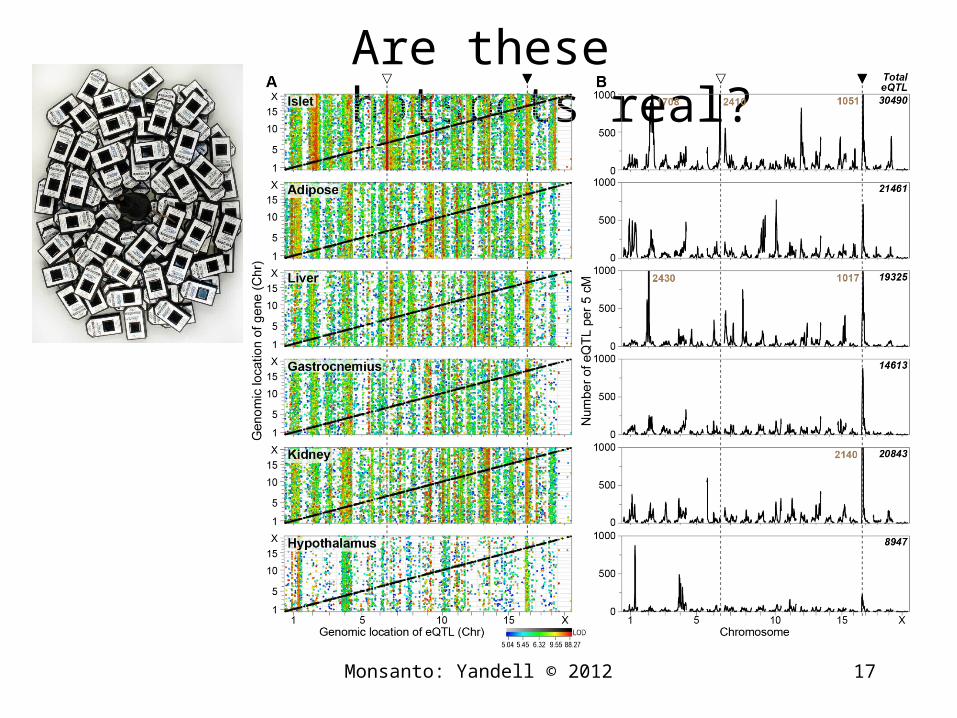
Monsanto: Yandell © 2012 17
Are these hotspots real?
Monsanto: Yandell © 2012 18
experimental context• B6 x BTBR obese mouse cross
– model for diabetes and obesity– 500+ mice from intercross (F2)– collaboration with Rosetta/Merck
• genotypes (1M values)– 5K SNP Affymetrix mouse chip (2K segregating SNPs)– care in curating genotypes! (map version, errors, …)
• phenotypes (120M values)– clinical phenotypes (200 / mouse)– gene expression traits (40K / mouse / 6 tissues)– other molecular traits (proteomic, miRNA, metabolomic)
MSRC5 2012 © Yandell 1919Monsanto: Yandell © 2012
MSRC5 2012 © Yandell 2020Monsanto: Yandell © 2012
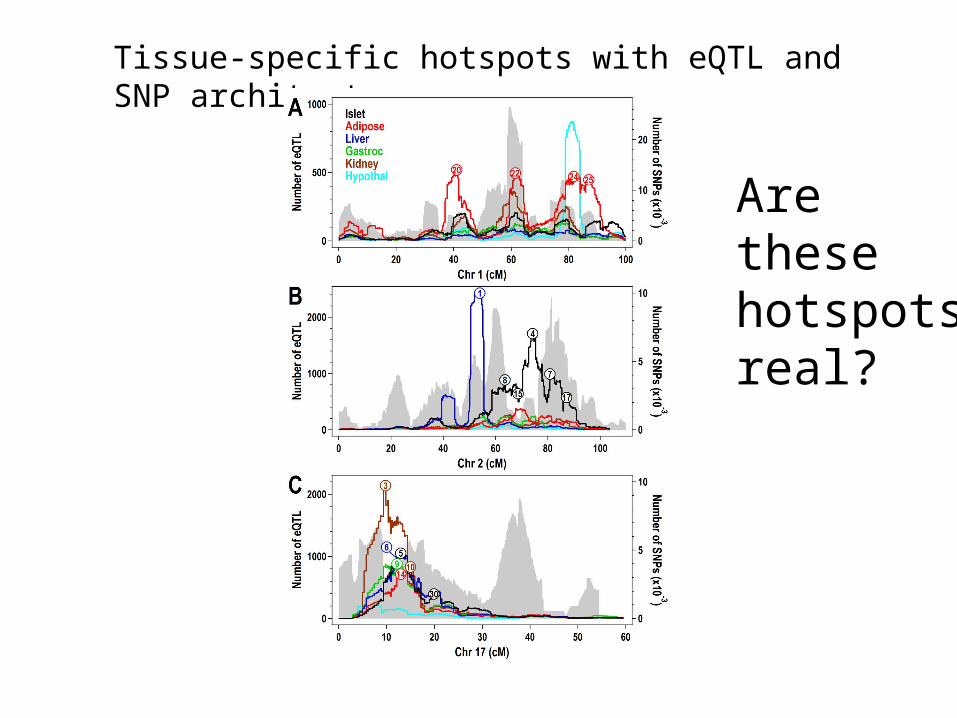
Tissue-specific hotspots with eQTL and SNP architecture
Are these hotspots real?
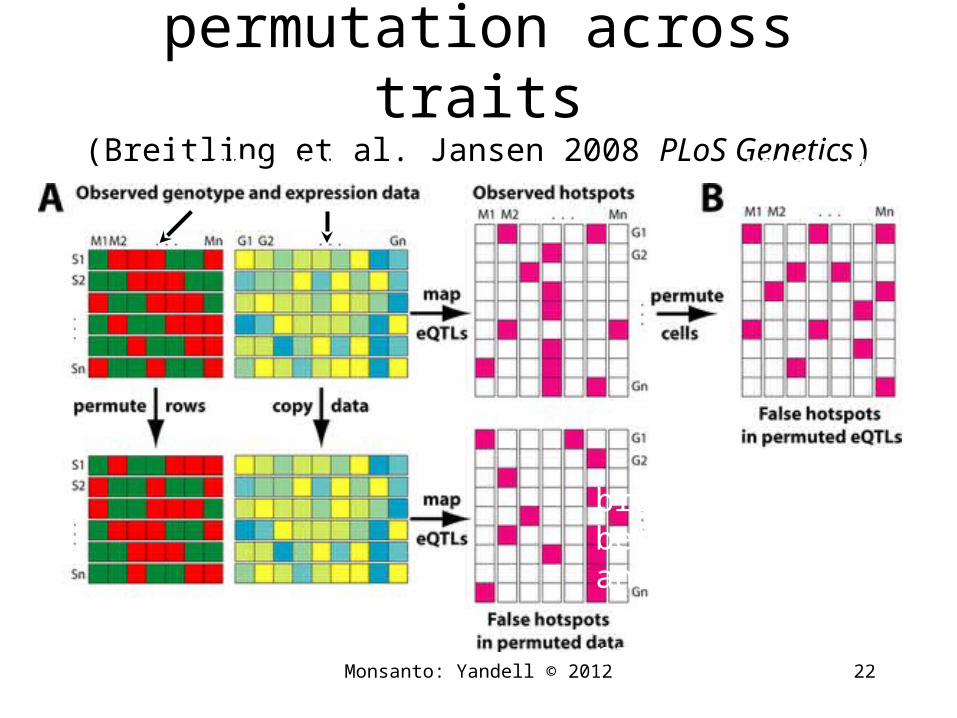
permutation across traits(Breitling et al. Jansen 2008 PLoS Genetics)
Monsanto: Yandell © 2012 22
gene expression
stra
in
marker
right way wrong way
break correlationbetween markersand traits
butpreserve correlationamong traits
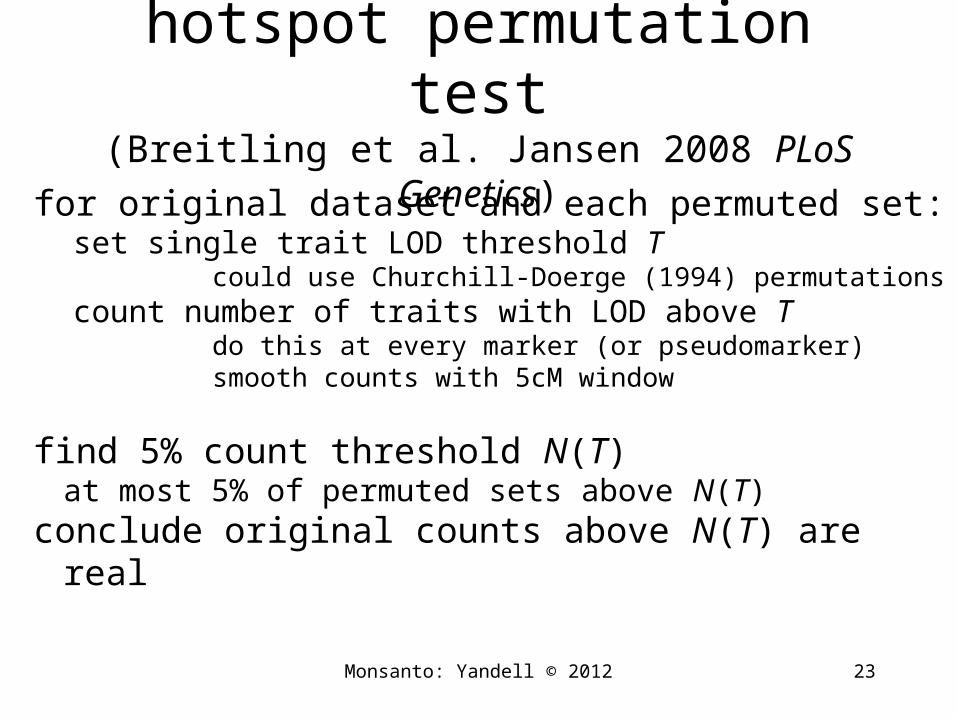
hotspot permutation test(Breitling et al. Jansen 2008 PLoS Genetics)
for original dataset and each permuted set:set single trait LOD threshold T
could use Churchill-Doerge (1994) permutationscount number of traits with LOD above T
do this at every marker (or pseudomarker)smooth counts with 5cM window
find 5% count threshold N(T)at most 5% of permuted sets above N(T)
conclude original counts above N(T) are real
Monsanto: Yandell © 2012 23
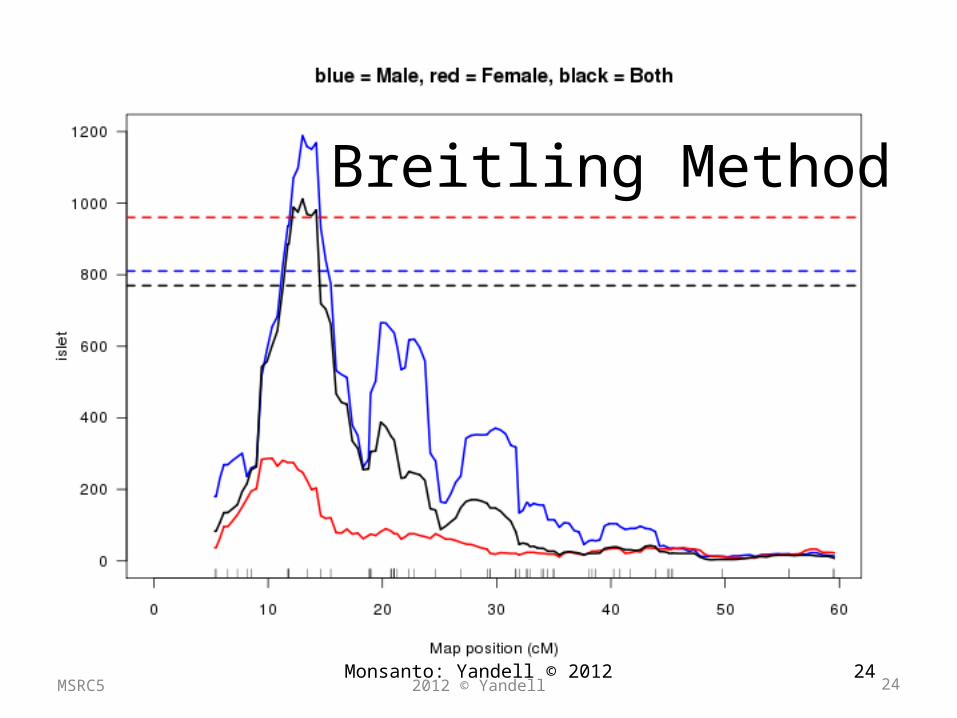
Breitling Method
2012 © Yandell 24MSRC524Monsanto: Yandell © 2012
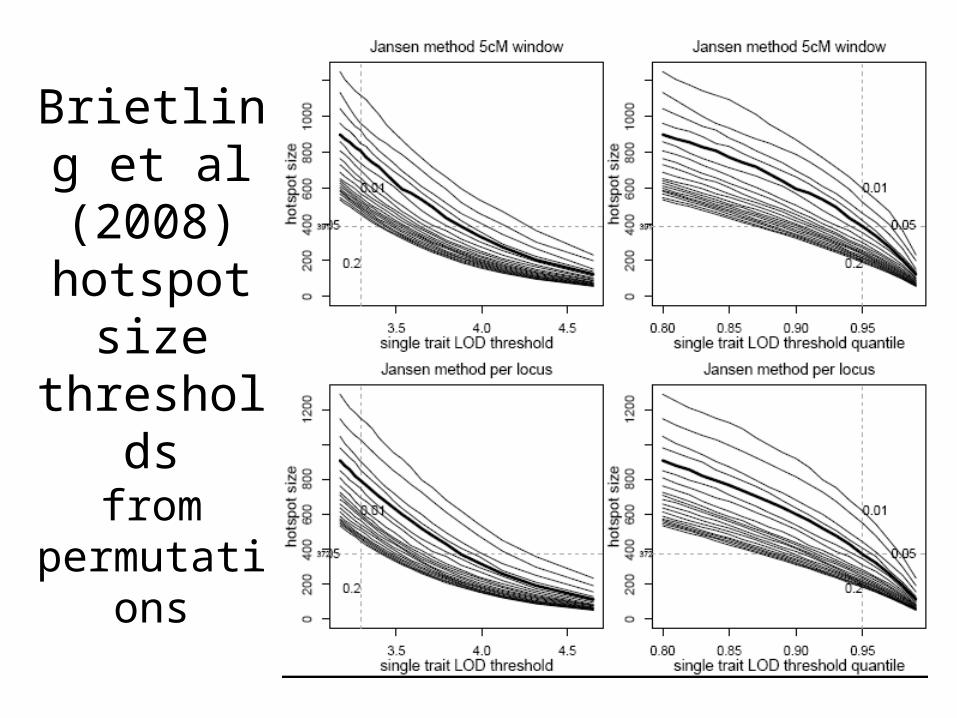
Brietling et al (2008)
hotspot size thresholds
from permutations
Monsanto: Yandell © 2012 25
rethinking the approach
• For a hotspots of size N, what threshold T(N) is just large enough to declare 5% significance?
• N = 1 (single trait)– What threshold T(1) is needed to declare any single
peak significant?– valid across all traits and whole genome
Chaibub Neto E, Keller MP, Broman AF, Attie AD, Jansen RC, Broman KW, Yandell BS, Quantile-based permutation thresholds for QTL hotspots. Genetics (tent. accepted).
26Monsanto: Yandell © 2012
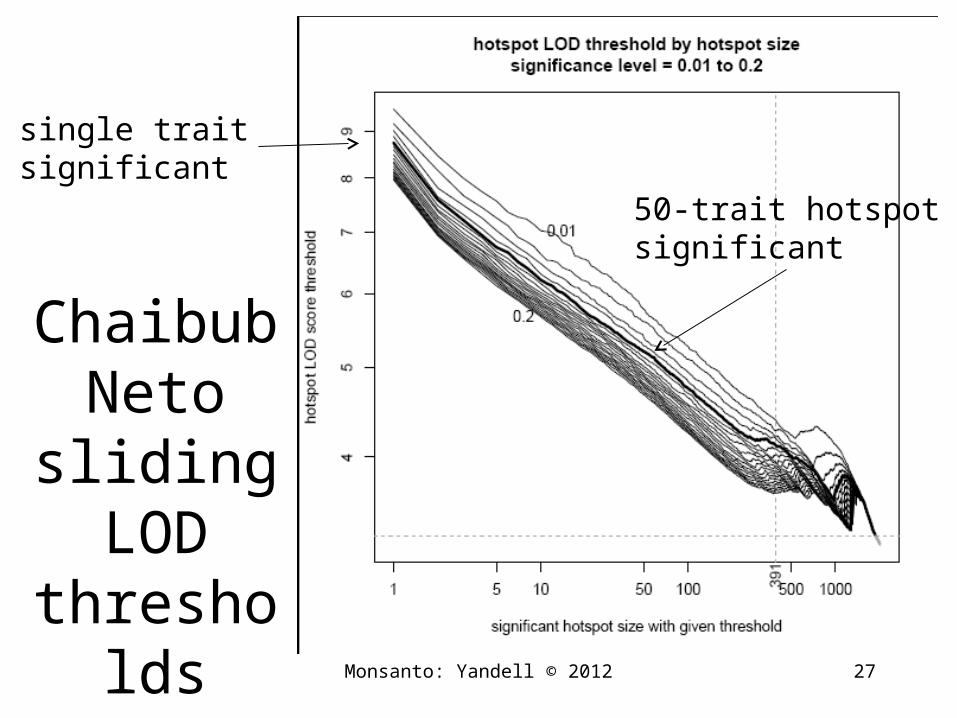
Chaibub Neto
sliding LOD
thresholdsMonsanto: Yandell © 2012 27
single traitsignificant
50-trait hotspotsignificant
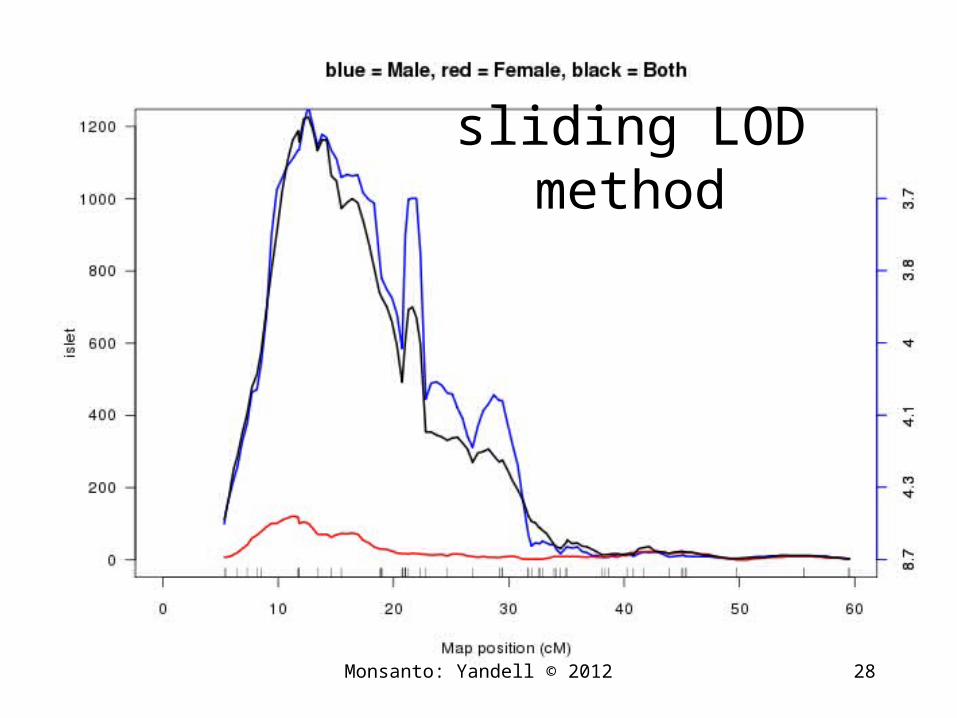
sliding LOD method
Monsanto: Yandell © 2012 28
Scaling up calculationsGenetics paper: 10B linear models to fit
mouse study: 1000 x 10B linear models!
parallelize computations on OpenScienceGrid
www.chtc.wisc.edu
500 individuals30,000 traits * 6 tissues2000 markers1000 permutations
Monsanto: Yandell © 2012 29
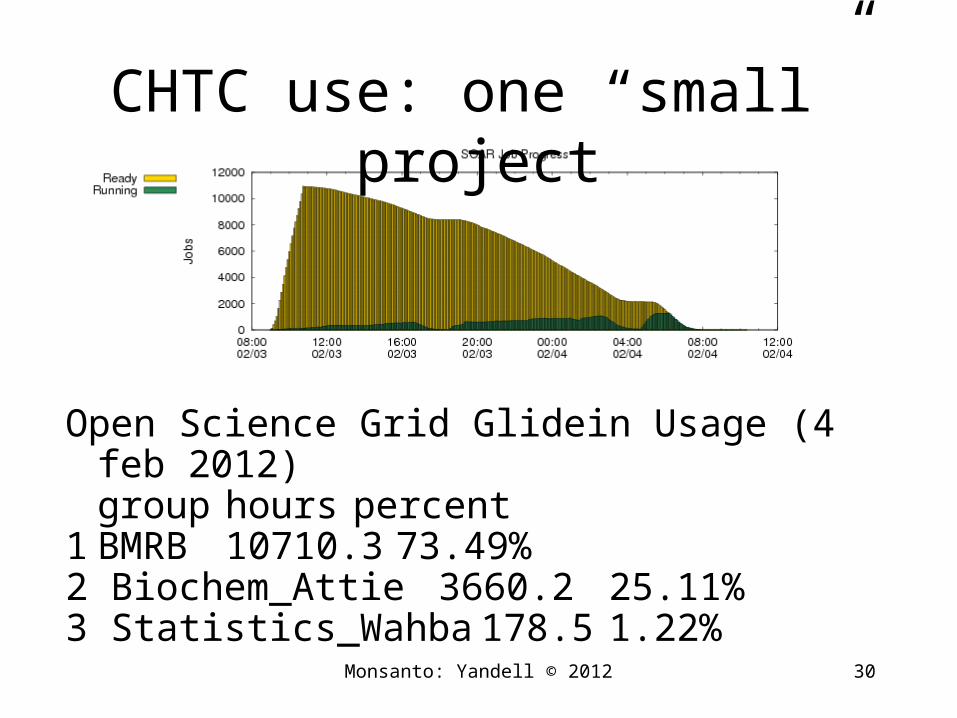
CHTC use: one “small” project
Open Science Grid Glidein Usage (4 feb 2012)group hourspercent
1 BMRB 10710.373.49% 2 Biochem_Attie 3660.2 25.11% 3 Statistics_Wahba 178.5 1.22%
Monsanto: Yandell © 2012 30
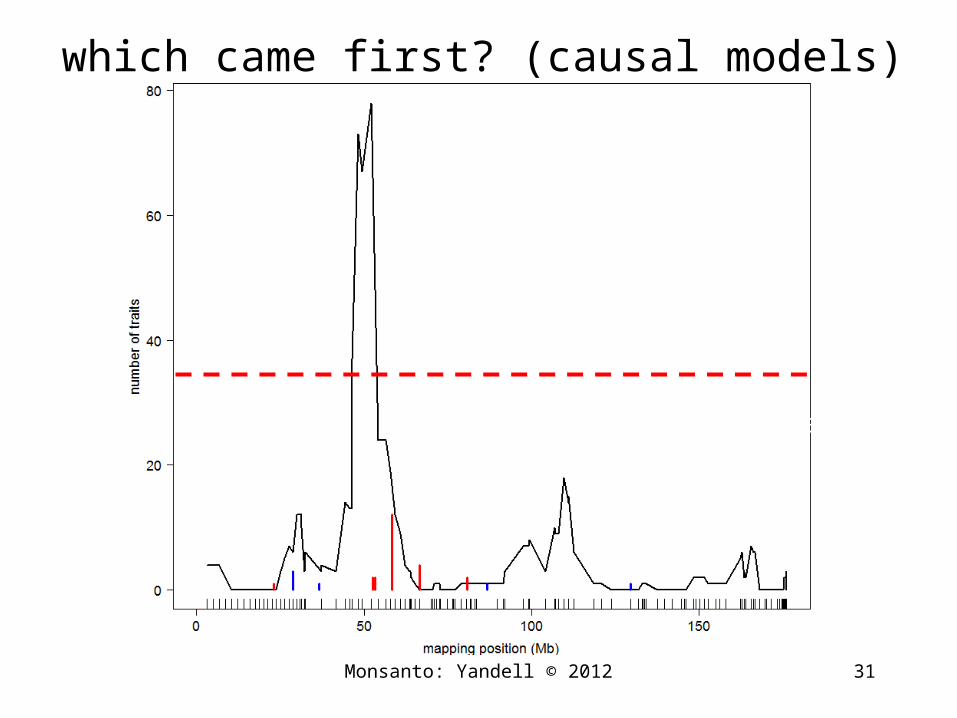
which came first? (causal models)
31Monsanto: Yandell © 2012
x% thresholdon number of traits
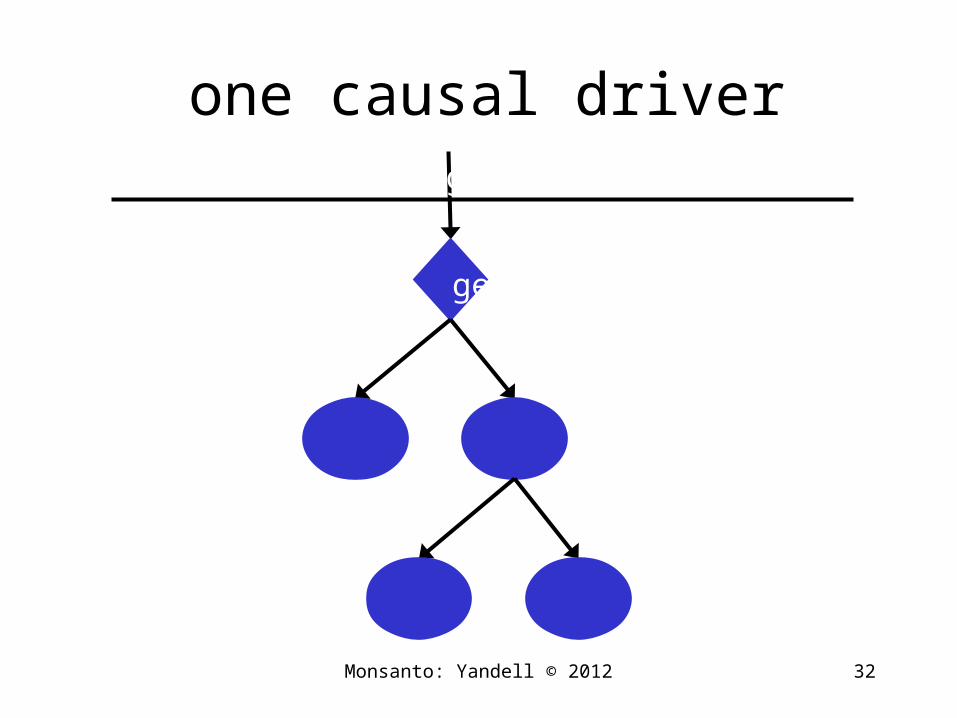
one causal driver
Monsanto: Yandell © 2012 32
chromosome
gene
gene product
downstream traits
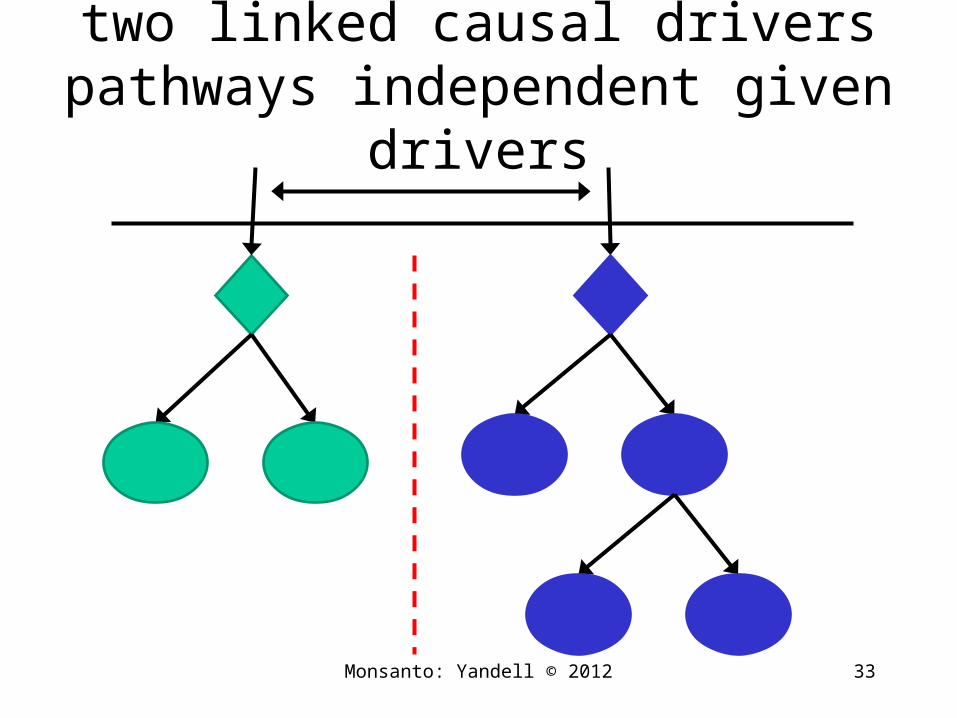
two linked causal driverspathways independent given drivers
Monsanto: Yandell © 2012 33
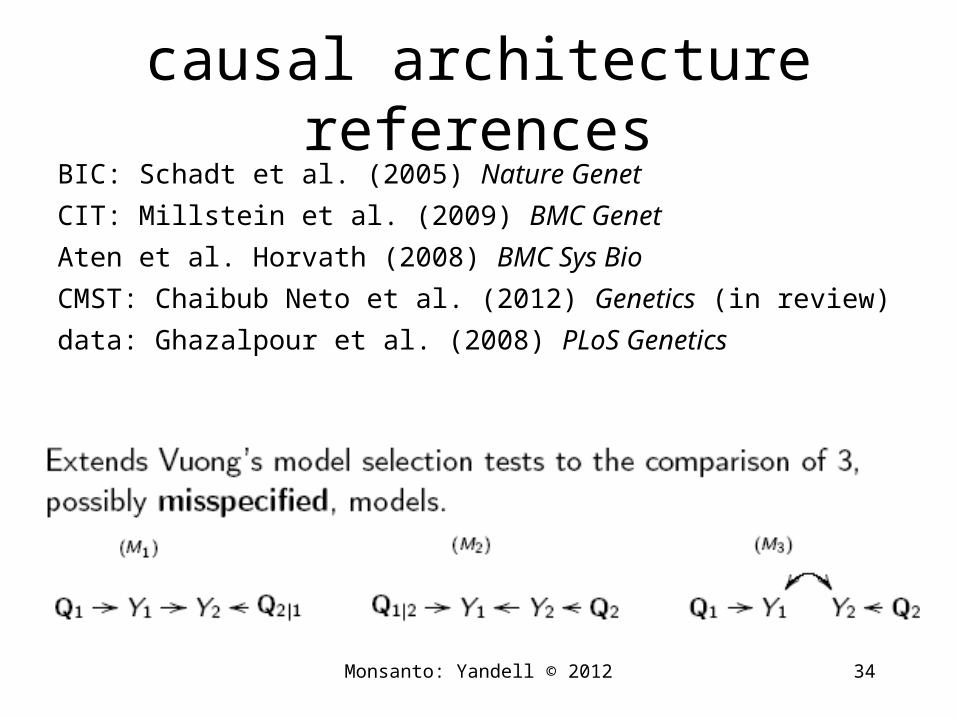
causal architecture referencesBIC: Schadt et al. (2005) Nature Genet
CIT: Millstein et al. (2009) BMC Genet
Aten et al. Horvath (2008) BMC Sys Bio
CMST: Chaibub Neto et al. (2012) Genetics (in review)
data: Ghazalpour et al. (2008) PLoS Genetics
Monsanto: Yandell © 2012 34
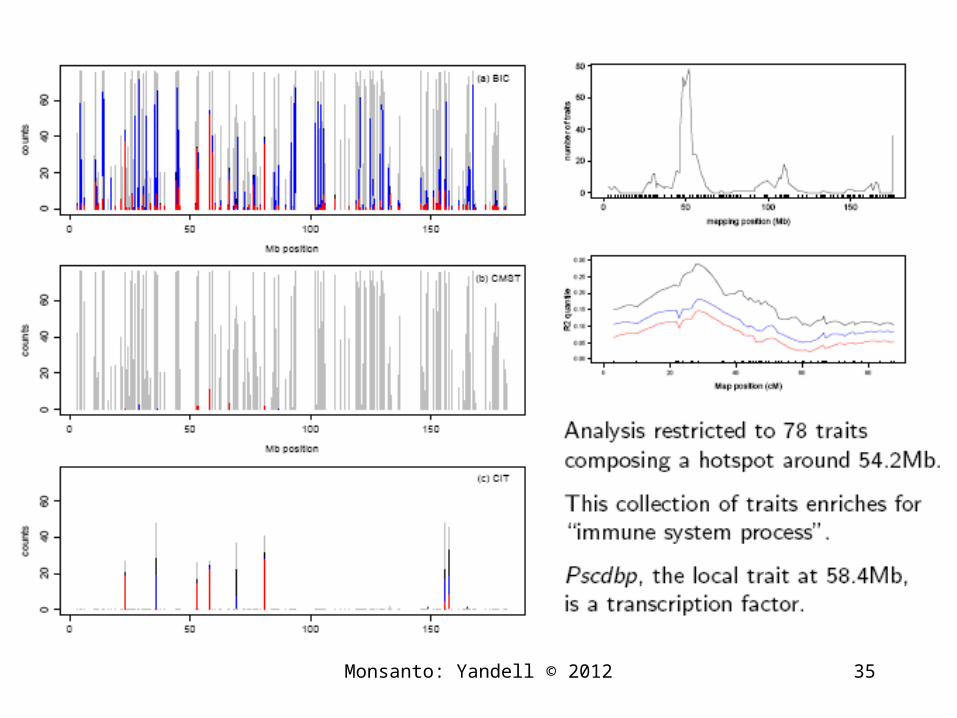
Monsanto: Yandell © 2012 35
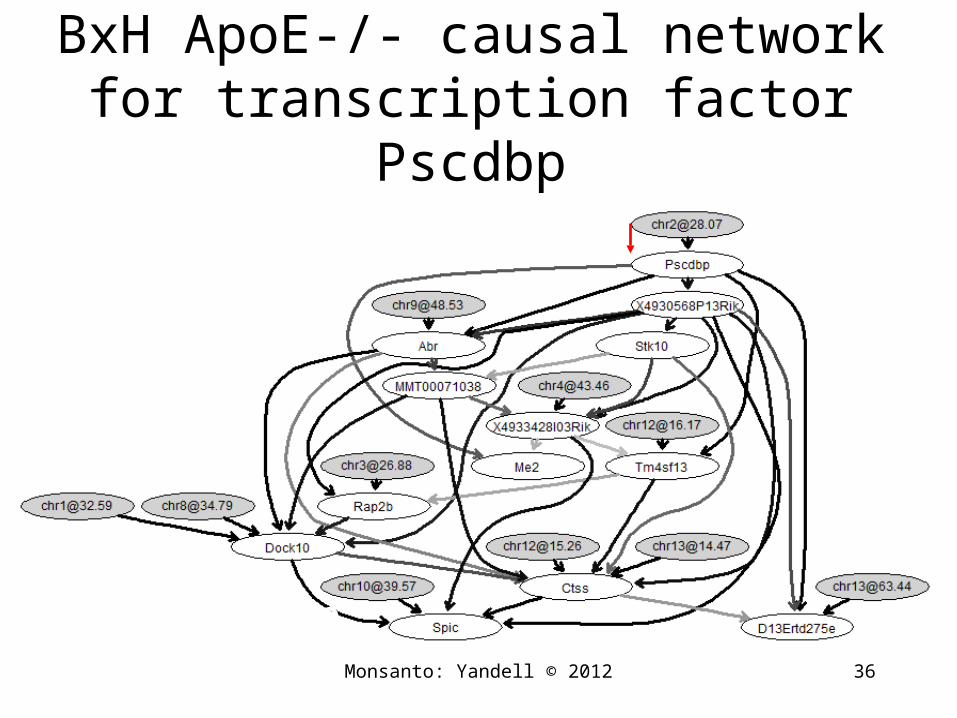
BxH ApoE-/- causal networkfor transcription factor Pscdbp
causal trait
36
work ofElias Chaibub Neto
Monsanto: Yandell © 2012
Monsanto: Yandell © 2012 37
causal phenotype networks
• goal: mimic biochemical pathways with directed (causal) networks
• problem: association (correlation) does not imply causation
• resolution: bring in driving causes– genotypes (at conception)– processes earlier in time
QTL-driven directed graphsgiven genetic architecture (QTLs), what causal
network structure is supported by data? R/qdg available at www.github.org/byandell
references Chaibub Neto, Ferrara, Attie, Yandell (2008) Inferring causal
phenotype networks from segregating populations. Genetics 179: 1089-1100. [doi:genetics.107.085167]
Ferrara et al. Attie (2008) Genetic networks of liver metabolism revealed by integration of metabolic and transcriptomic profiling. PLoS Genet 4: e1000034. [doi:10.1371/journal.pgen.1000034]
Monsanto: Yandell © 2012 38
causal graphical models in systems genetics
What if genetic architecture and causal network are unknown? jointly infer both using iteration
Chaibub Neto, Keller, Attie, Yandell (2010) Causal Graphical Models in Systems Genetics: a unified framework for joint inference of causal network and genetic architecture for correlated phenotypes. Ann Appl Statist 4: 320-339. [doi:10.1214/09-AOAS288]
R/qtlnet available from www.github.org/byandell
Related referencesSchadt et al. Lusis (2005 Nat Genet); Li et al. Churchill (2006 Genetics);
Chen Emmert-Streib Storey(2007 Genome Bio); Liu de la Fuente Hoeschele (2008 Genetics); Winrow et al. Turek (2009 PLoS ONE); Hageman et al. Churchill (2011 Genetics)
Monsanto: Yandell © 2012 39
Basic idea of QTLnet
iterate between finding QTL and network
genetic architecture given causal networktrait y depends on parents pa(y) in network
QTL for y found conditional on pa(y)Parents pa(y) are interacting covariates for QTL
scan
causal network given genetic architecturebuild (adjust) causal network given QTL
each direction change may alter neighbor edgesMonsanto: Yandell © 2012 40
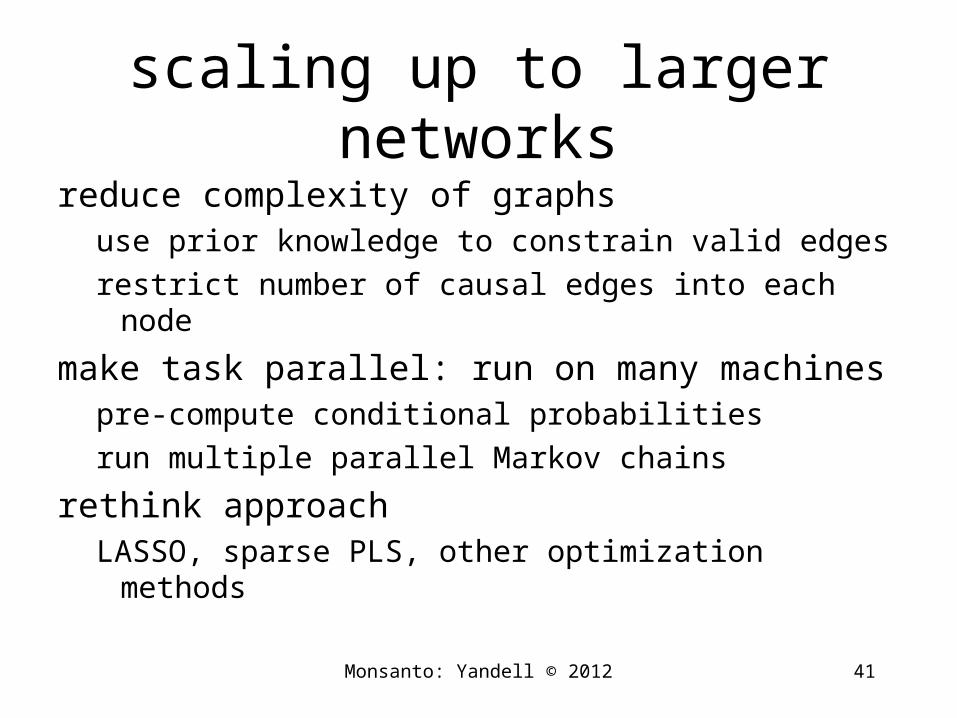
scaling up to larger networks
reduce complexity of graphsuse prior knowledge to constrain valid edges
restrict number of causal edges into each node
make task parallel: run on many machinespre-compute conditional probabilities
run multiple parallel Markov chains
rethink approachLASSO, sparse PLS, other optimization methods
Monsanto: Yandell © 2012 41
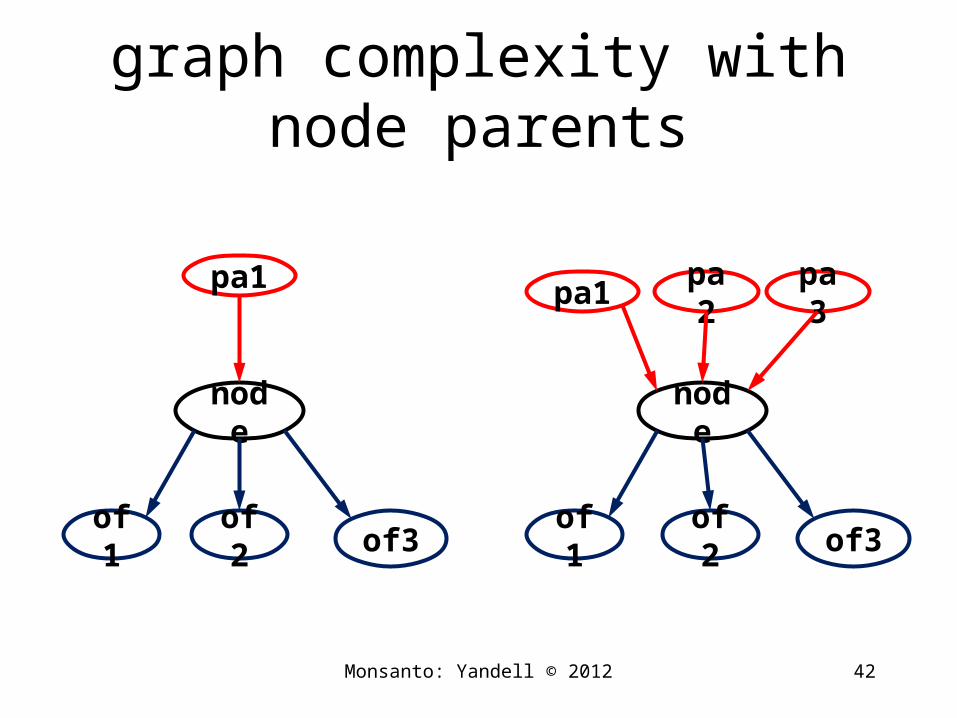
graph complexity with node parents
Monsanto: Yandell © 2012 42
pa2pa1
node
of2 of3of1
pa1
node
of2of1
pa3
of3
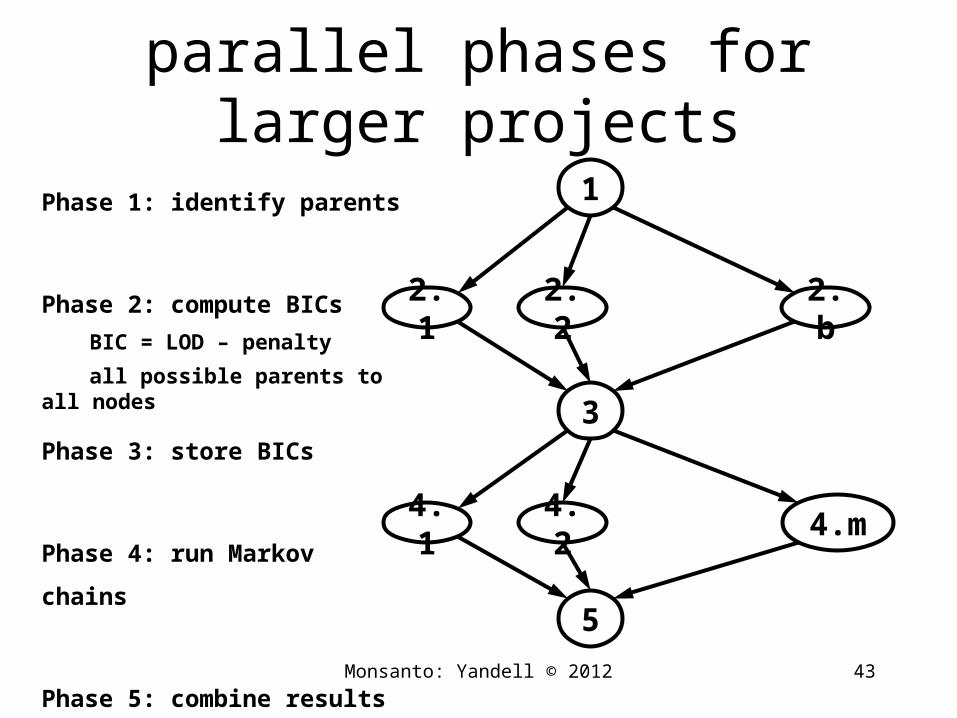
parallel phases for larger projects
Monsanto: Yandell © 2012 43
1
2.2 2.b2.1 …
3
4.2 4.m4.1 …
5
Phase 1: identify parents
Phase 2: compute BICs
BIC = LOD – penalty
all possible parents to all nodes
Phase 3: store BICs
Phase 4: run Markov chains
Phase 5: combine results
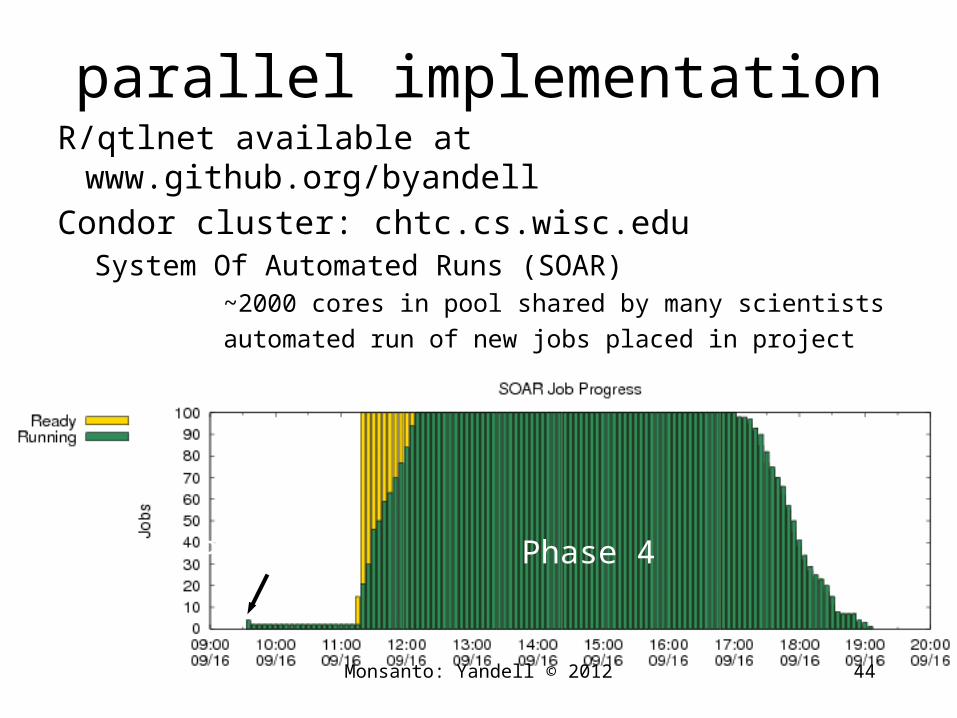
parallel implementationR/qtlnet available at www.github.org/byandell
Condor cluster: chtc.cs.wisc.eduSystem Of Automated Runs (SOAR)
~2000 cores in pool shared by many scientists
automated run of new jobs placed in project
Monsanto: Yandell © 2012 44
Phase 4Phase 2
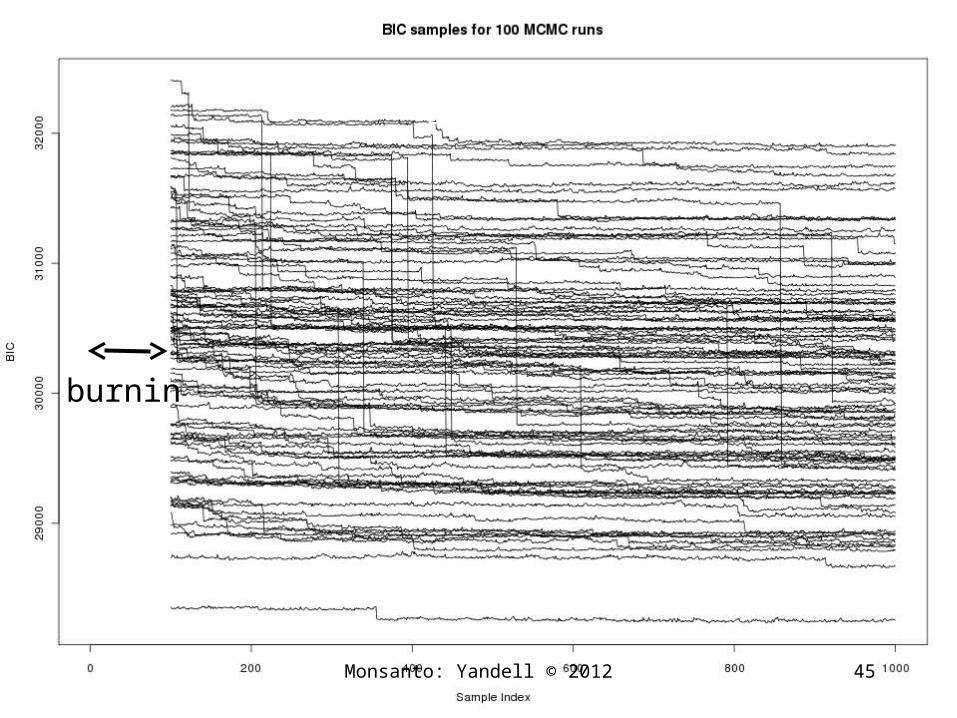
Monsanto: Yandell © 2012 45
single edge updates
100,000 runs
burnin
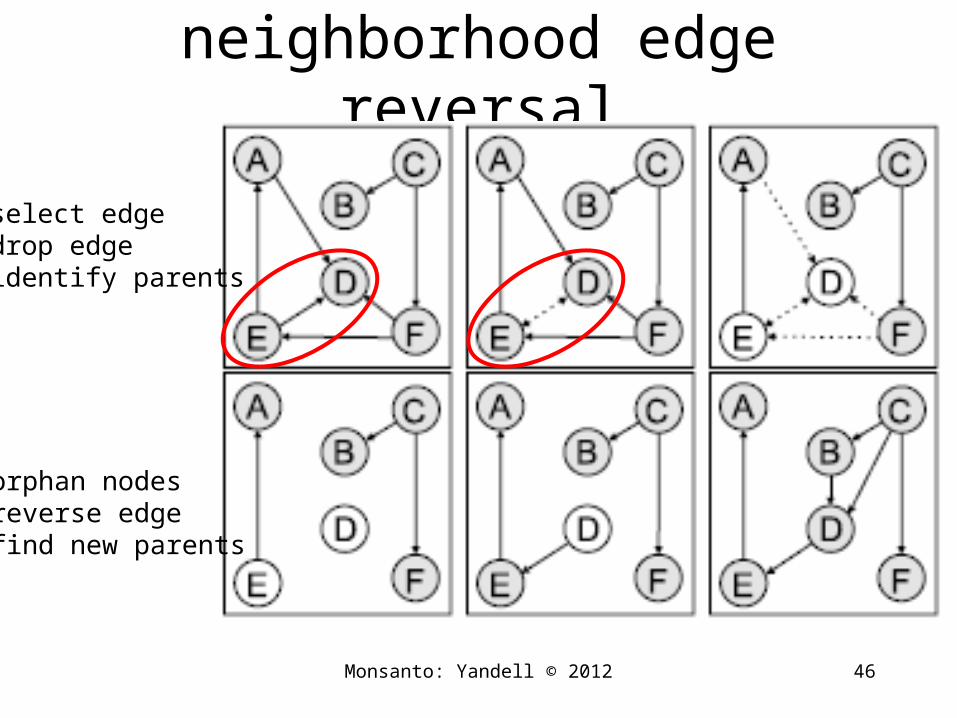
neighborhood edge reversal
Monsanto: Yandell © 2012 46Grzegorczyk M. and Husmeier D. (2008) Machine Learning 71 (2-3), 265-305.
orphan nodesreverse edgefind new parents
select edgedrop edgeidentify parents
Monsanto: Yandell © 2012 47
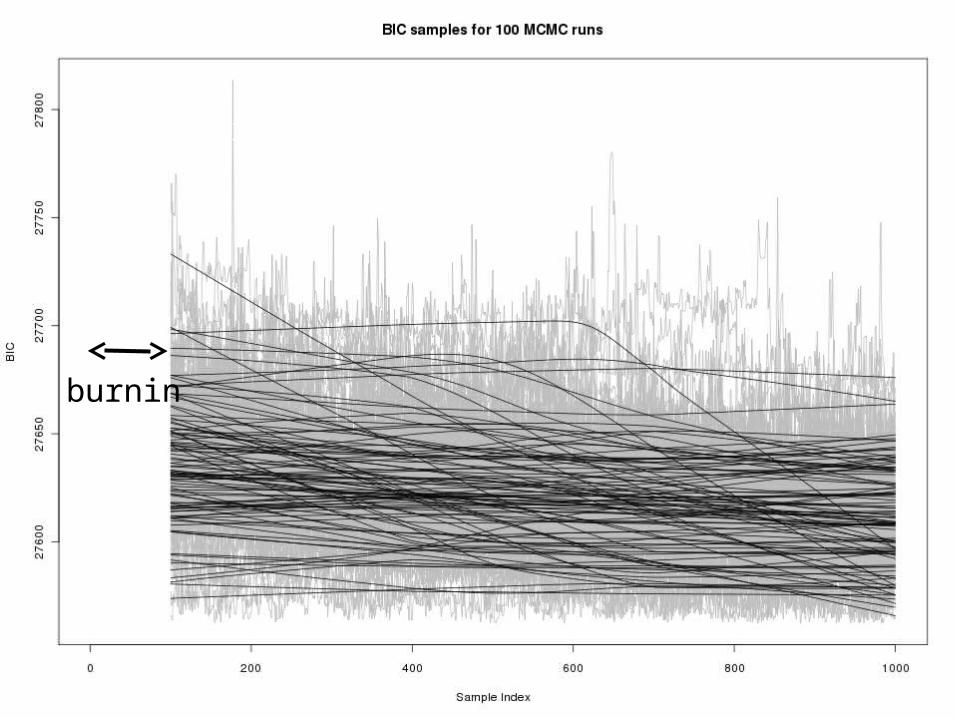
neighborhood for reversals only
100,000 runs
burnin
how to use functional information?functional grouping from prior studies
may or may not indicate direction
gene ontology (GO), KEGG
knockout (KO) panels
protein-protein interaction (PPI) database
transcription factor (TF) database
methods using only this information
priors for QTL-driven causal networksmore weight to local (cis) QTLs?
Monsanto: Yandell © 2012 48
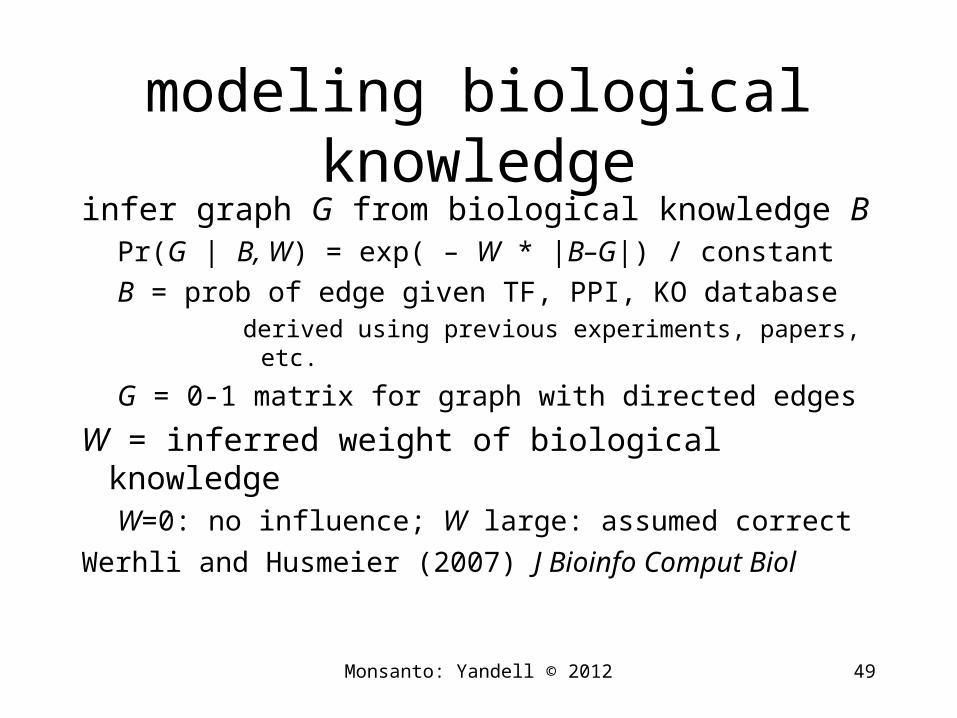
modeling biological knowledge
infer graph G from biological knowledge BPr(G | B, W) = exp( – W * |B–G|) / constant
B = prob of edge given TF, PPI, KO databasederived using previous experiments, papers, etc.
G = 0-1 matrix for graph with directed edges
W = inferred weight of biological knowledgeW=0: no influence; W large: assumed correct
Werhli and Husmeier (2007) J Bioinfo Comput Biol
Monsanto: Yandell © 2012 49
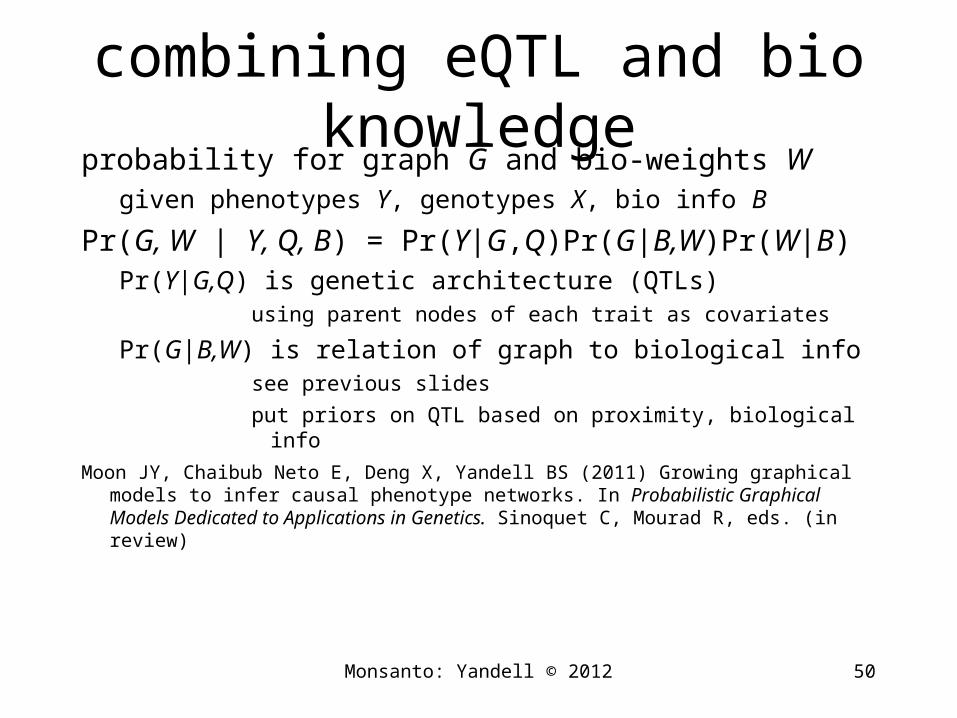
combining eQTL and bio knowledgeprobability for graph G and bio-weights W
given phenotypes Y, genotypes X, bio info B
Pr(G, W | Y, Q, B) = Pr(Y|G,Q)Pr(G|B,W)Pr(W|B)Pr(Y|G,Q) is genetic architecture (QTLs)
using parent nodes of each trait as covariates
Pr(G|B,W) is relation of graph to biological infosee previous slides
put priors on QTL based on proximity, biological info
Moon JY, Chaibub Neto E, Deng X, Yandell BS (2011) Growing graphical models to infer causal phenotype networks. In Probabilistic Graphical Models Dedicated to Applications in Genetics. Sinoquet C, Mourad R, eds. (in review)
Monsanto: Yandell © 2012 50