Embed Size (px)
Citation preview
Monroe County Office for the Aging Public Hearing
September 27, 2007

Agenda9:00-9:15 Welcome9:15-10:00 Presentation of
Demographics, Capacity & Utilization of LTC
Services 10:00-11:00 Open forum
MONROE COUNTYNY CONNECTS
LONG TERM CARE COUNCIL
Demographics, LTC Capacity & Utilization Overview
September 27, 2007
Finger Lakes Health Systems Agency

05
10152025303540
Millions
20002005201020152020202520302035204020452050
65-74 Yrs Old 75-84 Yrs Old 85 & Older
U.S. Population 65 & Olderby Age Group
Data Source: U.S. Dept of Commerce, Bureau of the Census, 2004 Interim Projections

0
5
10
15
20
25M
illions
20002005201020152020202520302035204020452050
20.0%19.6%
11.4%6.6%10.2%
19.9%
29.4%
24.0%
20.0%
12.8%
U.S. 85 & Older Population2000 to 2050
Data Source: U.S. Census Bureau, 2004 Projections
% Change from previous period
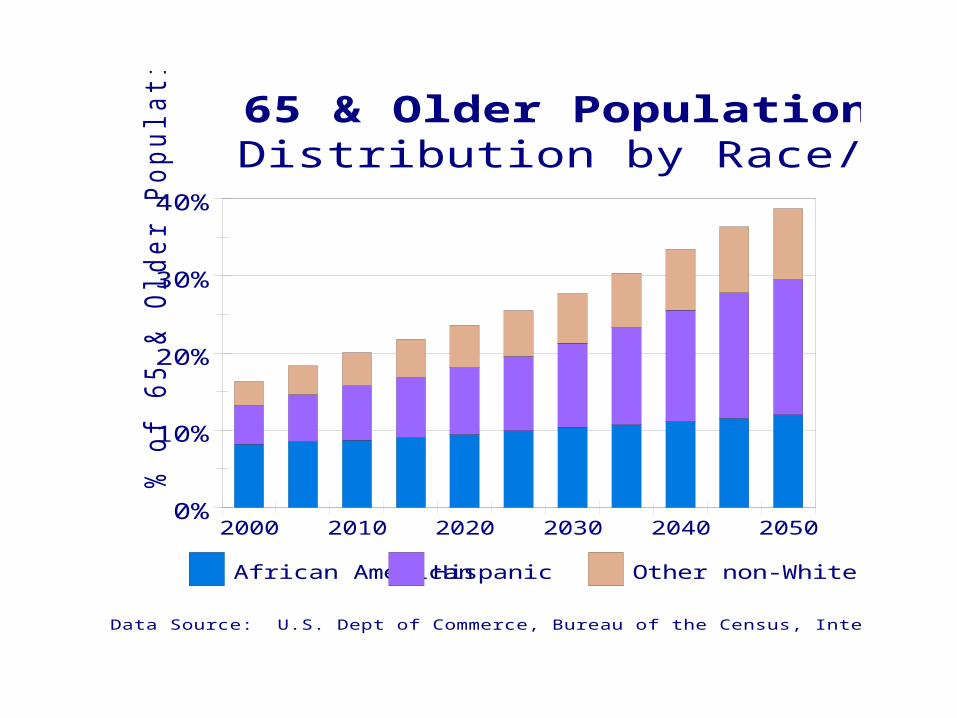
0%
10%
20%
30%
40%
% o
f 65 &
Old
er
Popula
tion
2000 2010 2020 2030 2040 2050
African American Hispanic Other non-White
65 & Older Population U.S.Distribution by Race/Ethnicity
Data Source: U.S. Dept of Commerce, Bureau of the Census, Interim National Projections, March 2004
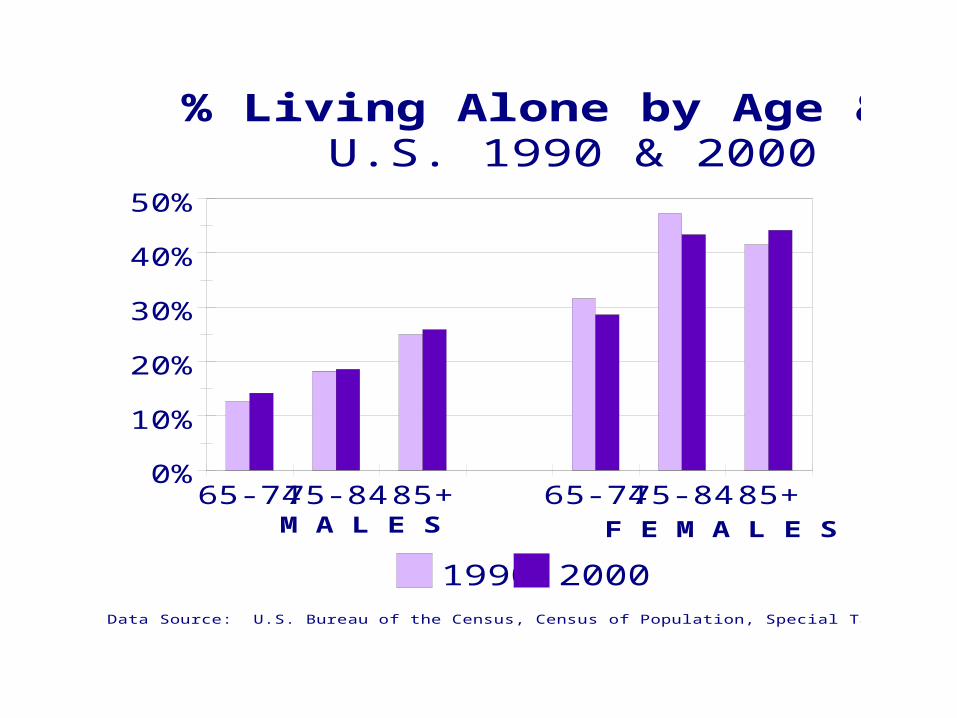
0%
10%
20%
30%
40%
50%
65-7475-84 85+ 65-7475-84 85+
1990 2000
% Living Alone by Age & GenderU.S. 1990 & 2000
M A L E S F E M A L E S
Data Source: U.S. Bureau of the Census, Census of Population, Special Tabulations on Aging
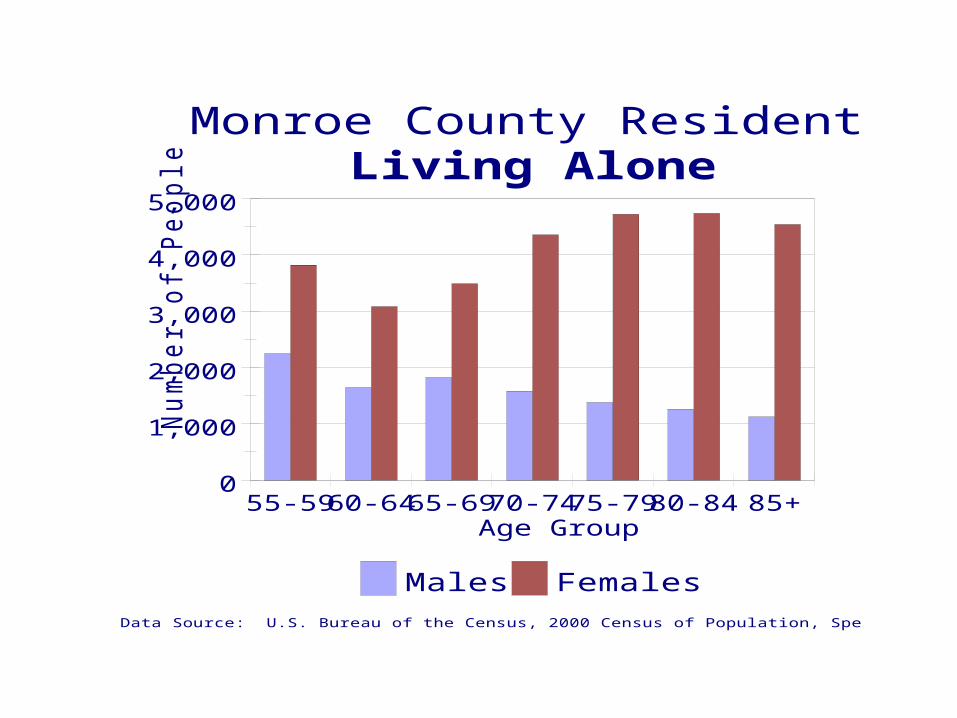
0
1,000
2,000
3,000
4,000
5,000N
um
ber
of P
eople
55-59 60-64 65-69 70-74 75-79 80-84 85+Age Group
Males Females
Monroe County Residents, 2000Living Alone
Data Source: U.S. Bureau of the Census, 2000 Census of Population, Special tabulation for US Office for Aging
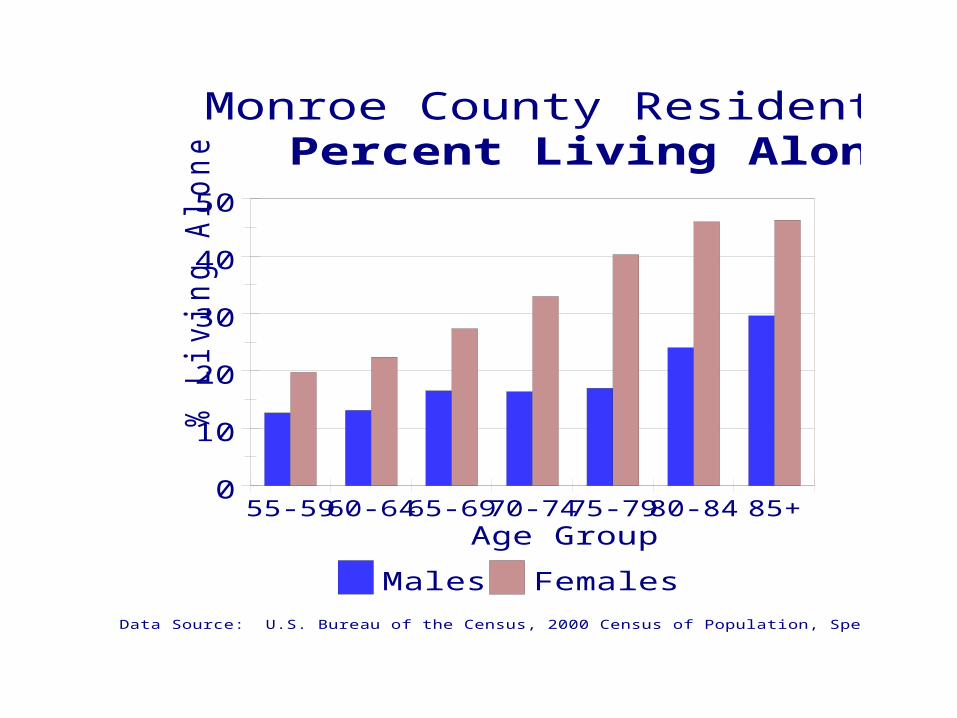
0
10
20
30
40
50%
Liv
ing
Alo
ne
55-59 60-64 65-69 70-74 75-79 80-84 85+Age Group
Males Females
Monroe County Residents, 2000Percent Living Alone
Data Source: U.S. Bureau of the Census, 2000 Census of Population, Special tabulation for US Office for Aging

0 10 20 30 40% of 2000 Monroe Co Population
60-64 Yr Olds
65-74 Yr Olds
75-84 Yr Olds
85 & Older
Diff Residence in Monroe CoNYS Outside Monroe
Outside NYS
2000 Monroe County Residents
%Who Moved between 1995 and 2000
U.S. Bureau of the Census, 2000 Census of Population, Special tabulations for US Office for Aging
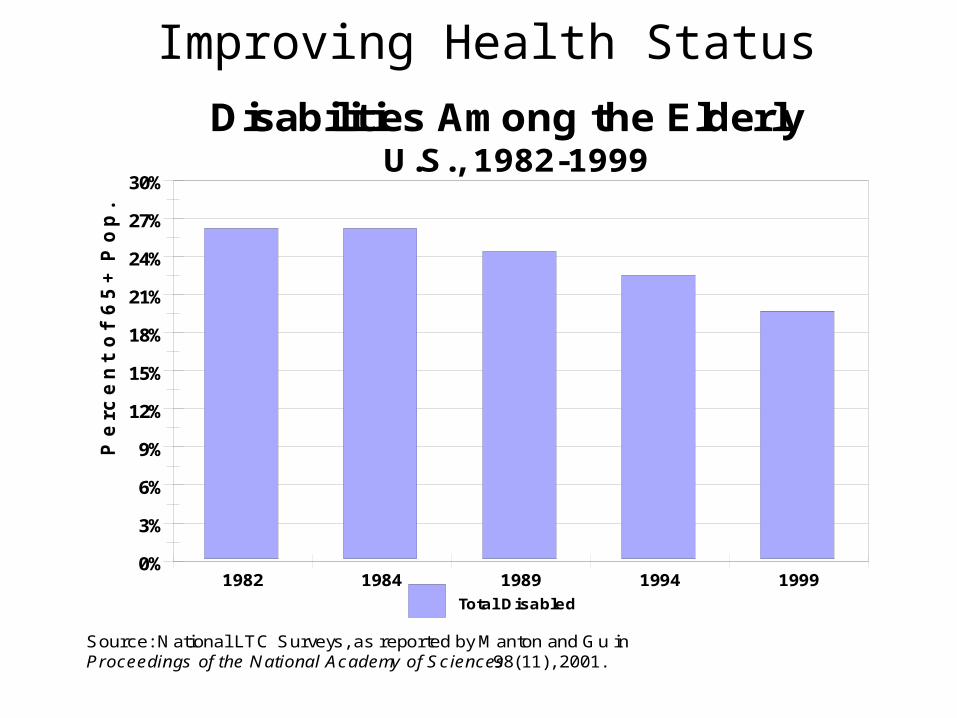
Improving Health Status
0%
3%
6%
9%
12%
15%
18%
21%
24%
27%
30%
Pe
rce
nt
of
65
+ P
op
.
1982 1984 1989 1994 1999
Total Disabled
Disabilities Among the ElderlyU.S., 1982-1999
Source: National LTC Surveys, as reported by M anton and Gu inProceedings of the National Academy of Sciences 98(11), 2001.
0
5
10
15
20
25%
of
Me
dic
are
En
rolle
es
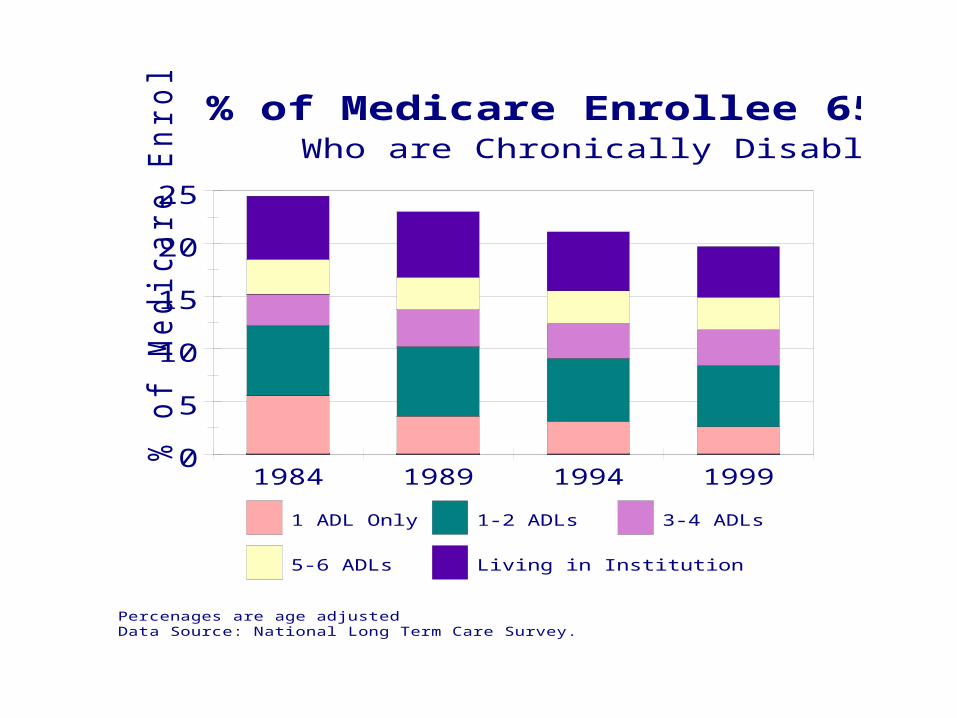
1984 1989 1994 1999
1 ADL Only 1-2 ADLs 3-4 ADLs
5-6 ADLs Living in Institution
% of Medicare Enrollee 65 & OlderWho are Chronically Disabled
Percenages are age adjustedData Source: National Long Term Care Survey.
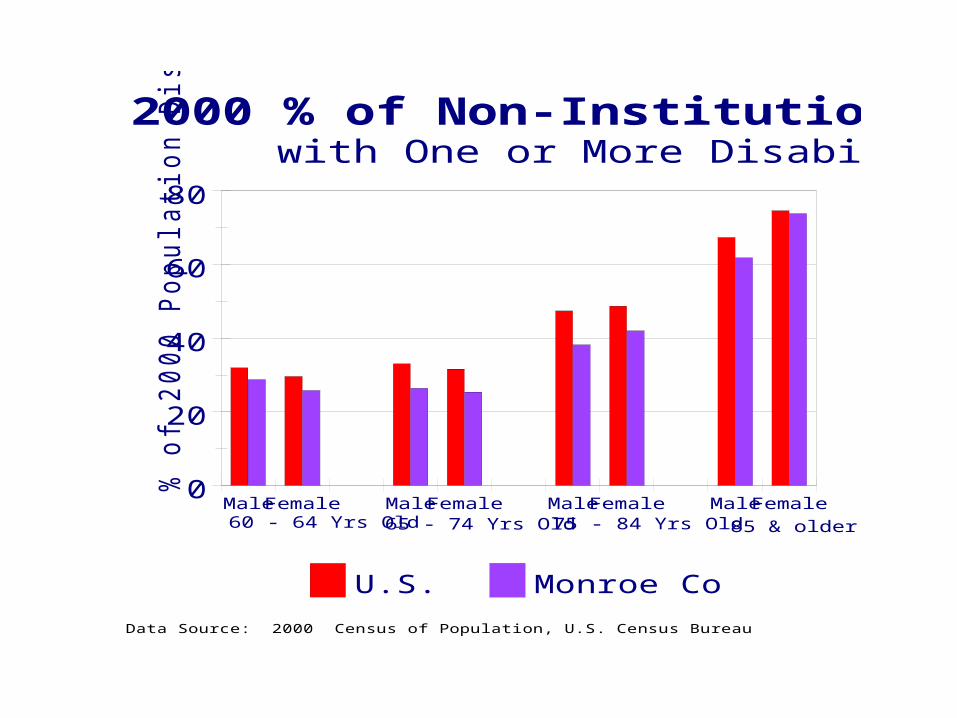
0
20
40
60
80%
of 2000 P
opula
tion D
isable
d
MaleFemale MaleFemale MaleFemale MaleFemale
U.S. Monroe Co
2000 % of Non-Institutional Populationwith One or More Disabilities
60 - 64 Yrs Old 65 - 74 Yrs Old 75 - 84 Yrs Old 85 & older
Data Source: 2000 Census of Population, U.S. Census Bureau
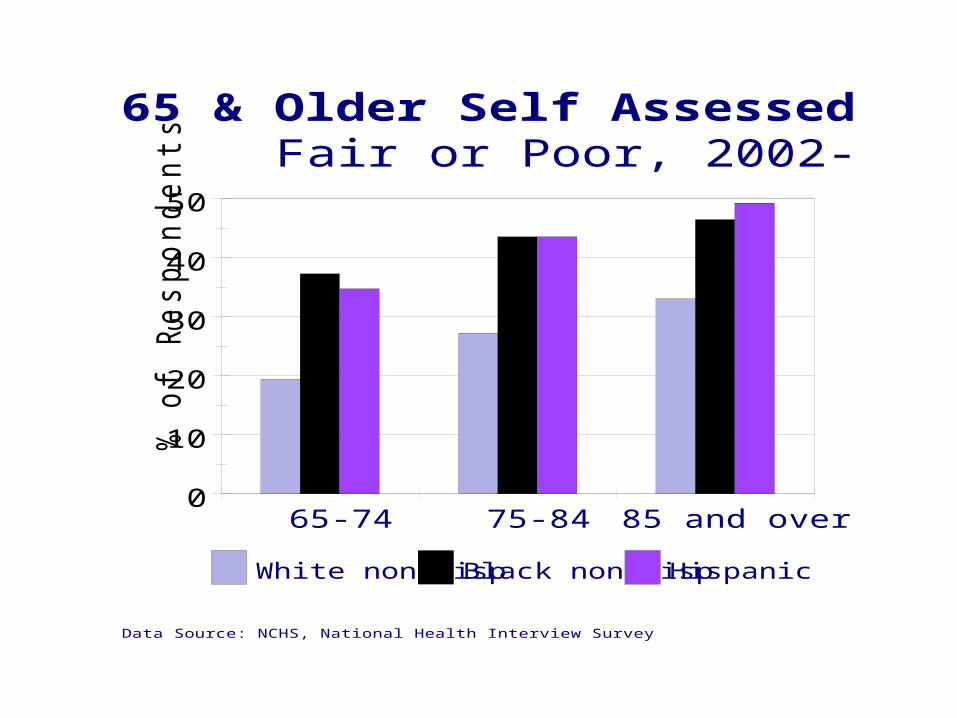
0
10
20
30
40
50%
of
Re
sp
on
de
nts
65-74 75-84 85 and over
White non-HispBlack non-Hisp Hispanic
65 & Older Self Assessed Health StatusFair or Poor, 2002-2004
Data Source: NCHS, National Health Interview Survey
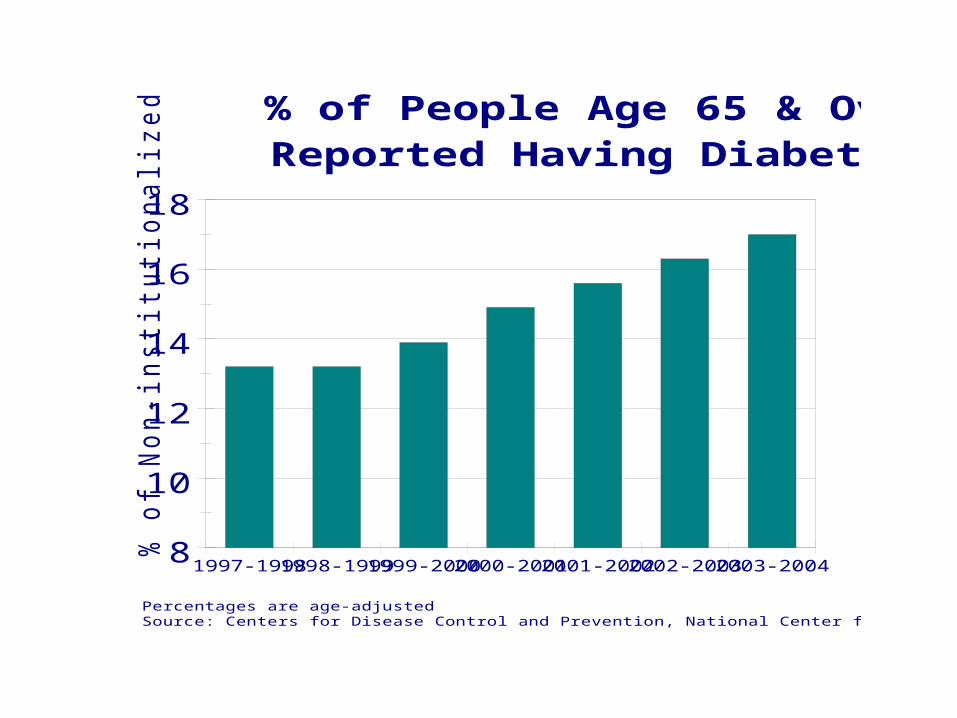
8
10
12
14
16
18
% o
f N
on-institu
tionalized P
opula
tion
1997-19981998-19991999-20002000-20012001-20022002-20032003-2004
% of People Age 65 & OverReported Having Diabetes
Percentages are age-adjustedSource: Centers for Disease Control and Prevention, National Center for Health Statistics, National Health Interview Survey
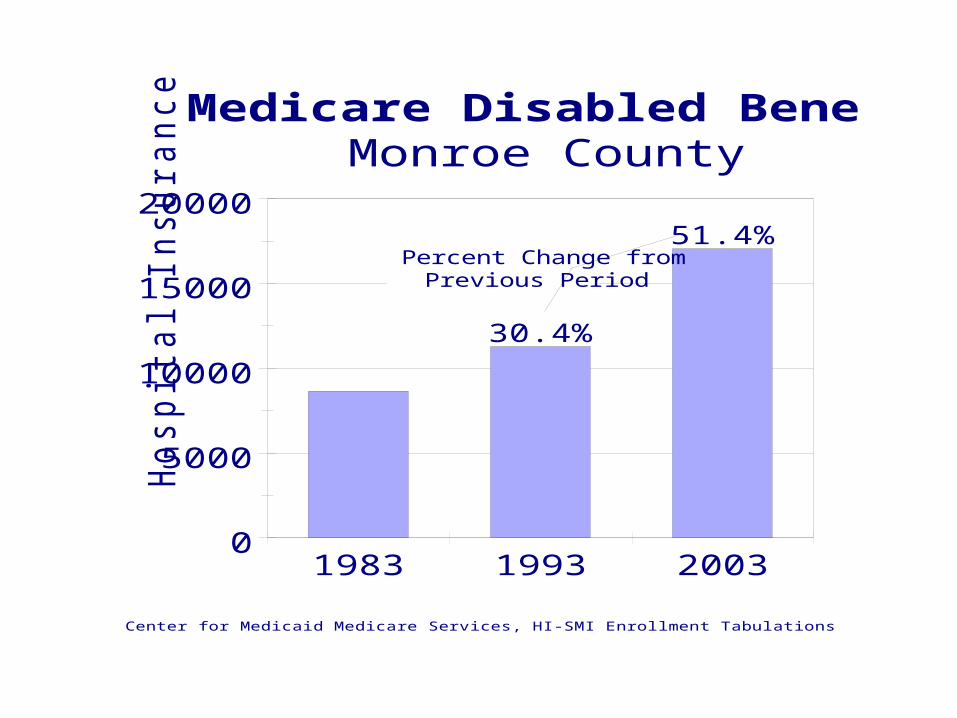
0
5000
10000
15000
20000
Hospital In
sura
nce
1983 1993 2003
30.4%
51.4%
Medicare Disabled BeneficiariesMonroe County
Center for Medicaid Medicare Services, HI-SMI Enrollment Tabulations
Percent Change fromPrevious Period

0
5,000
10,000
15,000
20,000
25,000
# E
ligib
les
1985 1996 2006
191.4%
37.0%
Medicaid & SubsistenceMedicaid Only
Monroe Co Medicaid EligiblesBlind & Disabled
Percent Change fromPrevious Period
Data Sources: NYS Dept of Social Services, & NYS Dept of Health

0
50
100
150
200
250M
illions
20002005201020152020202520302035204020452050
18-64 Yrs Old 65 & Older
US Population2000 - 2050
Data Source: U.S. Bureau of the Census, 2004 Projections
Long Term Care Capacity
&Utilization Overview
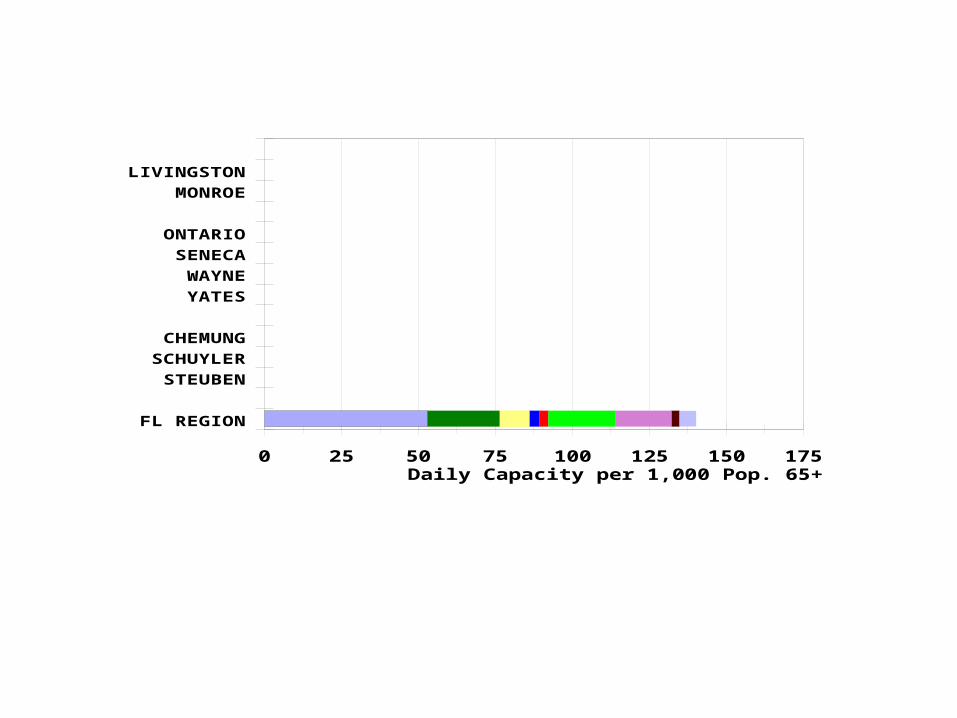
0 25 50 75 100 125 150 175Daily Capacity per 1,000 Pop. 65+
FL REGION
STEUBEN
SCHUYLER
CHEMUNG
YATES
WAYNE
SENECA
ONTARIO
MONROE
LIVINGSTON
Nursing Home Residential LTHHC Hospice Med. Day Care
Home Health Personal Care EISEP Soc. Day Care
LONG TERM CARE CAPACITY, 2005
Note:CHAA and EISEP are 2003 and 2000
0
20
40
60
80
100
120
140
160
180
200
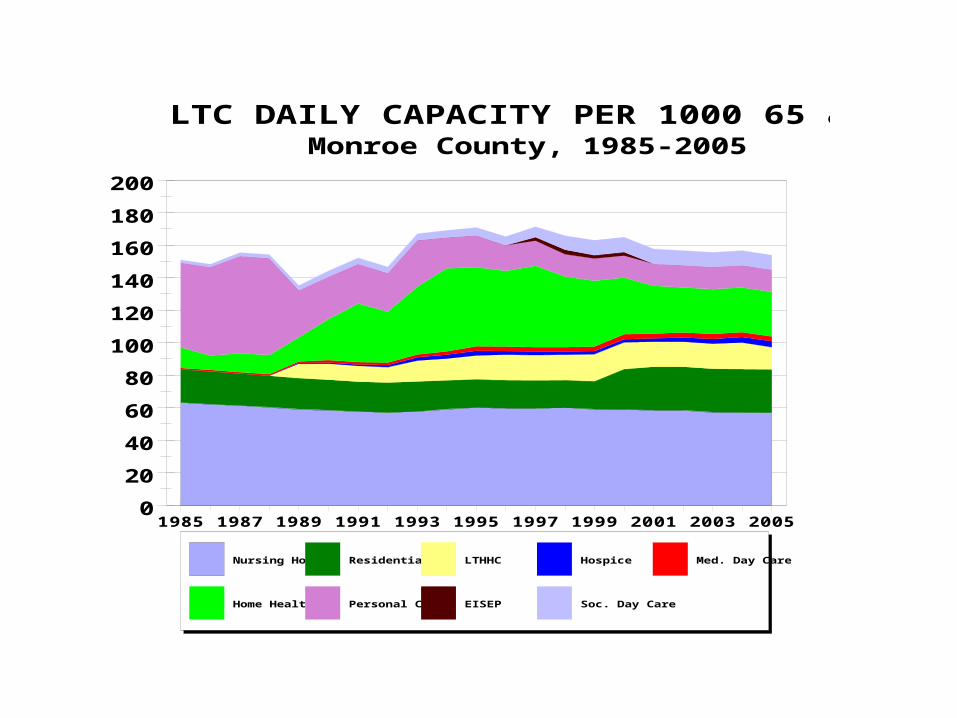
1985 1987 1989 1991 1993 1995 1997 1999 2001 2003 2005
Nursing Home Residential LTHHC Hospice Med. Day Care
Home Health Personal Care EISEP Soc. Day Care
LTC DAILY CAPACITY PER 1000 65 & OLDERMonroe County, 1985-2005
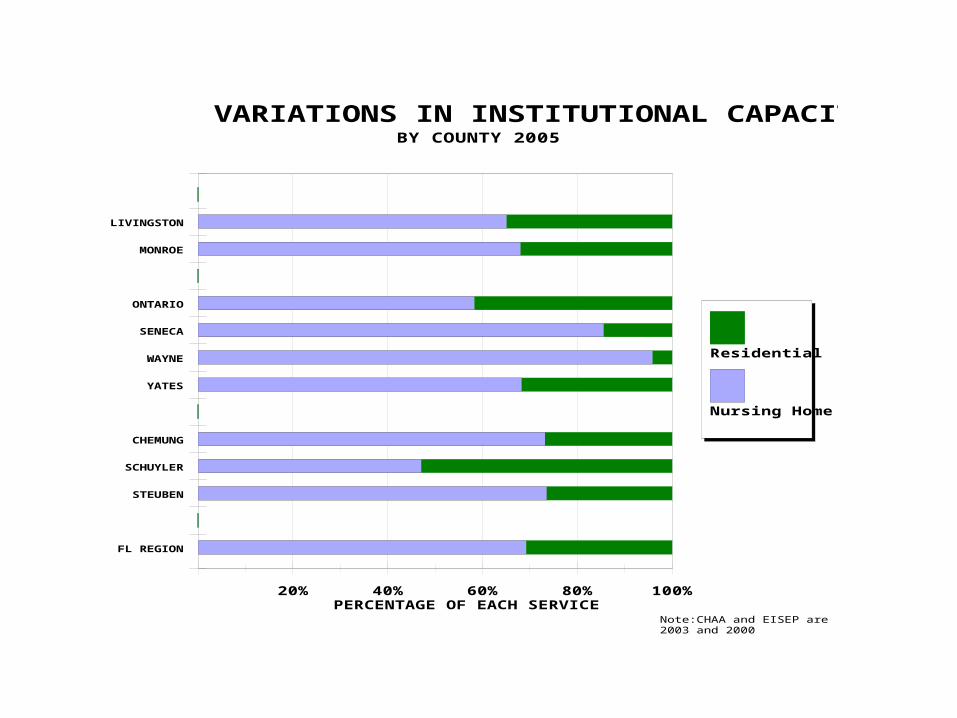
20% 40% 60% 80% 100%PERCENTAGE OF EACH SERVICE
FL REGION
STEUBEN
SCHUYLER
CHEMUNG
YATES
WAYNE
SENECA
ONTARIO
MONROE
LIVINGSTON
Residential
Nursing Home
VARIATIONS IN INSTITUTIONAL CAPACITYBY COUNTY 2005
Note:CHAA and EISEP are2003 and 2000

Use Rates
0
50
100
150
200
250N
H R
es
ide
nts
/1,0
00
Po
pu
lati
on
1994 1995 1996 1997 1998 1999 2000 2001 2002 2003
All Beds 55-64 All Beds 65-74 All Beds 75-84 All Beds 85+
Resident NH Use RatesFinger Lakes Region, 1994-2003
0
50
100
150
200
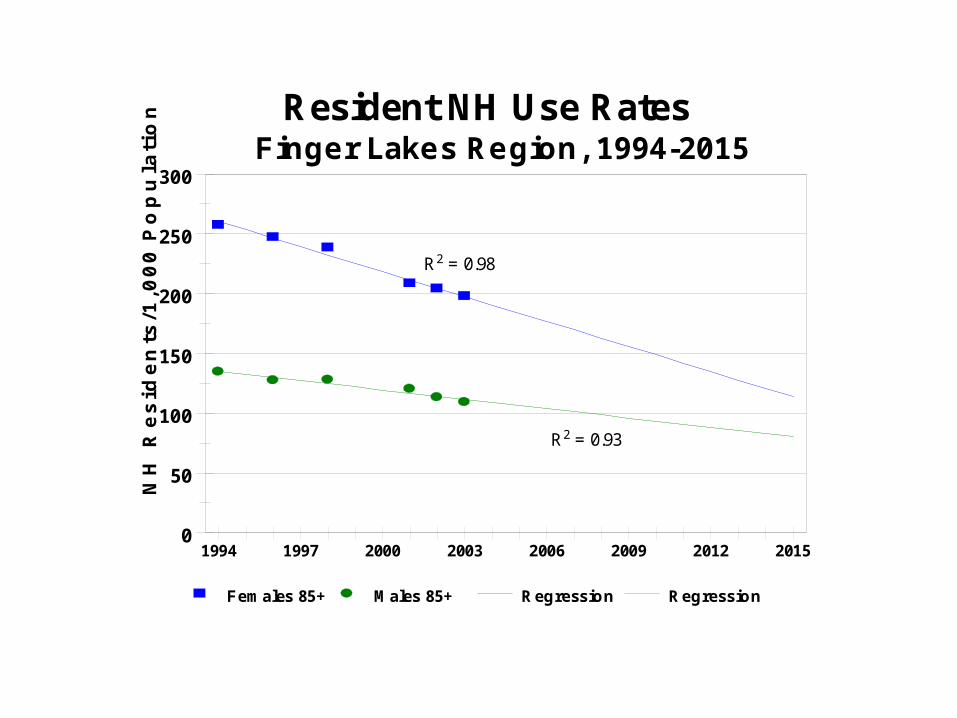
250
300
NH
Re
sid
en
ts/1
,00
0 P
op
ula
tio
n
1994 1997 2000 2003 2006 2009 2012 2015
Females 85+ M ales 85+ Regression Regression
Resident NH Use RatesFinger Lakes Region, 1994-2015
R2 = 0.98
R2 = 0.93

0
20
40
60
80%
of 2000 P
opula
tion D
isable
d
MaleFemale MaleFemale MaleFemale MaleFemale
U.S. Monroe Co
2000 % of Non-Institutional Populationwith One or More Disabilities
60 - 64 Yrs Old 65 - 74 Yrs Old 75 - 84 Yrs Old 85 & older
Data Source: 2000 Census of Population, U.S. Census Bureau
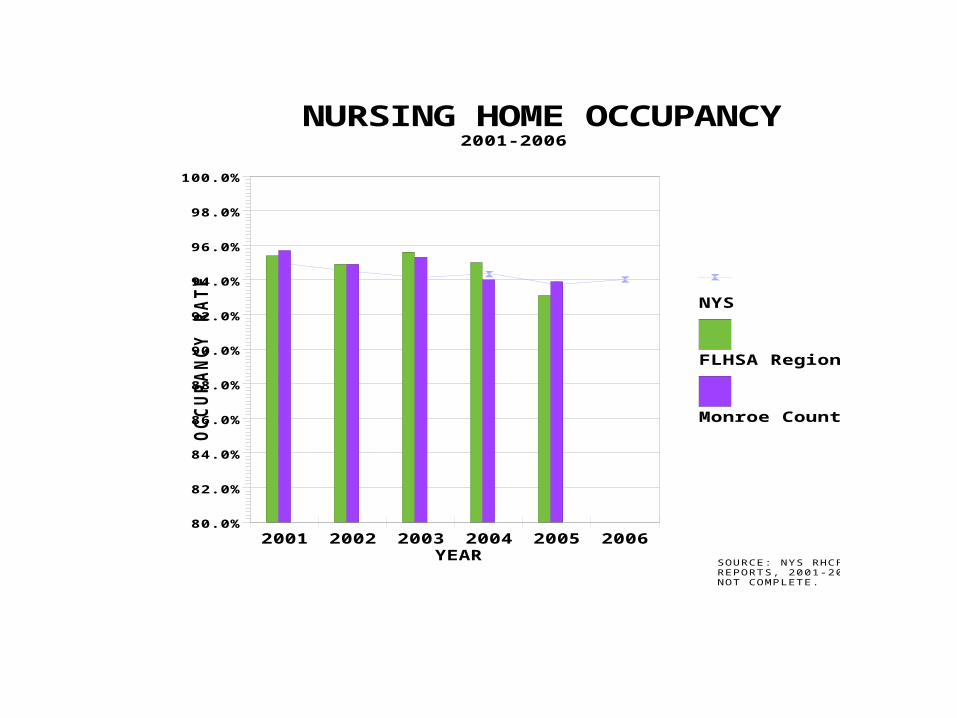
80.0%
82.0%
84.0%
86.0%
88.0%
90.0%
92.0%
94.0%
96.0%
98.0%
100.0%
OC
CU
PA
NC
Y R
AT
E
2001 2002 2003 2004 2005 2006YEAR
NYS
FLHSA Region
Monroe County
NURSING HOME OCCUPANCY2001-2006
SOURCE: NYS RHCF COSTREPORTS, 2001-2006* 2006 ISNOT COMPLETE.
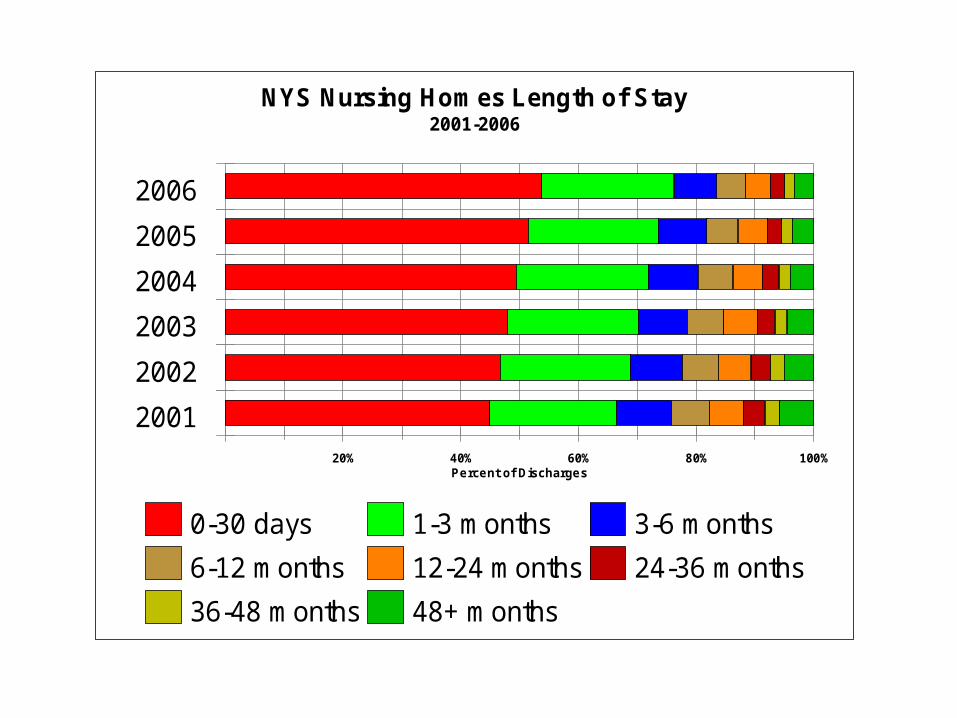
20% 40% 60% 80% 100%Percent of Discharges
2001
2002
2003
2004
2005
2006
0-30 days 1-3 months 3-6 months
6-12 months 12-24 months 24-36 months
36-48 months 48+ months
NYS Nursing Homes Length of Stay2001-2006
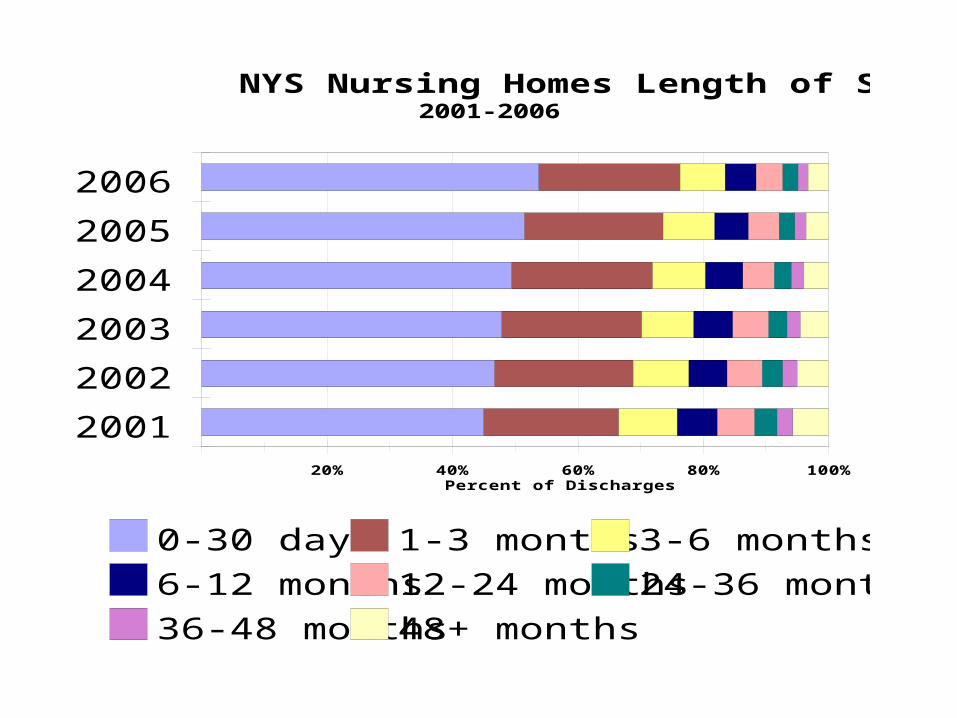
20% 40% 60% 80% 100%Percent of Discharges
2001
2002
2003
2004
2005
2006
0-30 days 1-3 months 3-6 months
6-12 months 12-24 months24-36 months
36-48 months48+ months
NYS Nursing Homes Length of Stay2001-2006
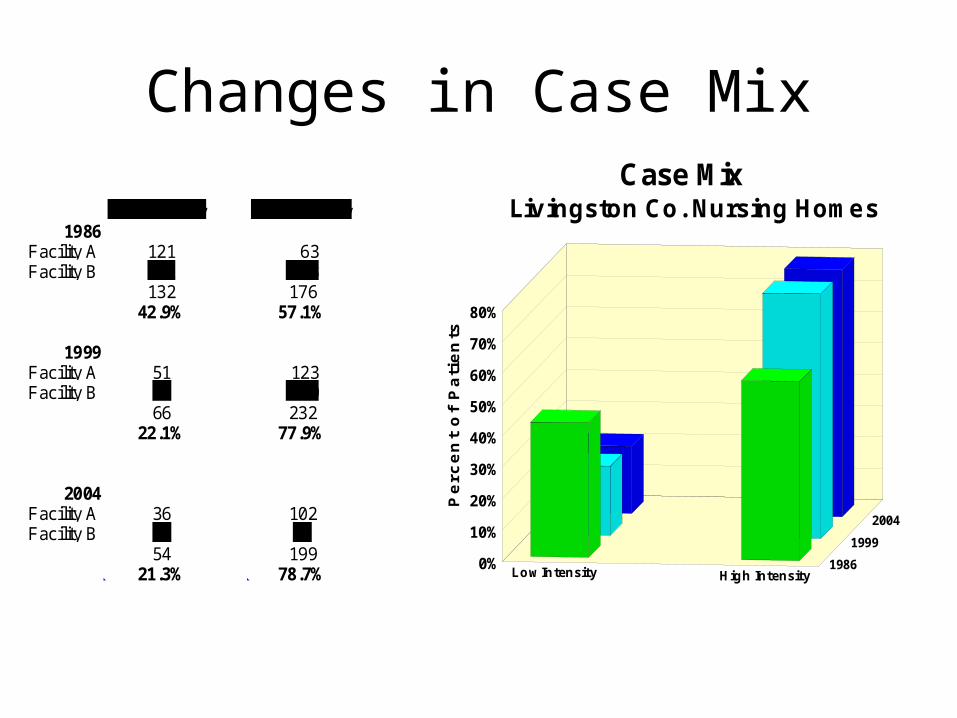
Changes in Case Mix
0%
10%
20%
30%
40%
50%
60%
70%
80%
Pe
rc
en
t o
f P
ati
en
ts
Low Intensity High Intensity1986
1999
2004
Case MixLivingston Co. Nursing HomesHigh IntensityLow Intensity
1986 63121Facility A 113 11Facility B176132
57.1%42.9%
1999 12351Facility A 10915Facility B23266
77.9%22.1%
200410236Facility A9718Facility B19954
78.7%21.3%

0
20
40
60
80
100
Bed
s P
er
1000 6
5 a
nd
Over
19731976
19791982
19851988
19911994
19972000
2003
Year
Monroe
FLHSA Region
Chemung
SKILLED BED COMPARISONBeds Per 1000 65 and over 1973-2005
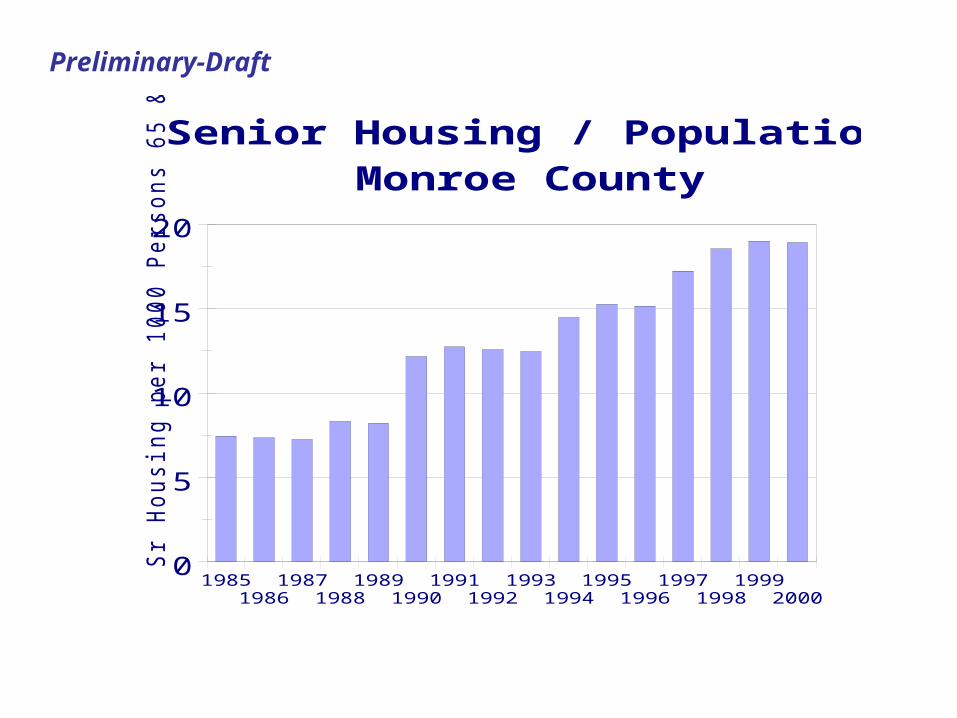
0
5
10
15
20
Sr
Housin
g p
er
1000 P
ers
ons 6
5 &
Old
er
19851986
19871988
19891990
19911992
19931994
19951996
19971998
19992000
Senior Housing / Population 65 & OlderMonroe County
Preliminary-Draft
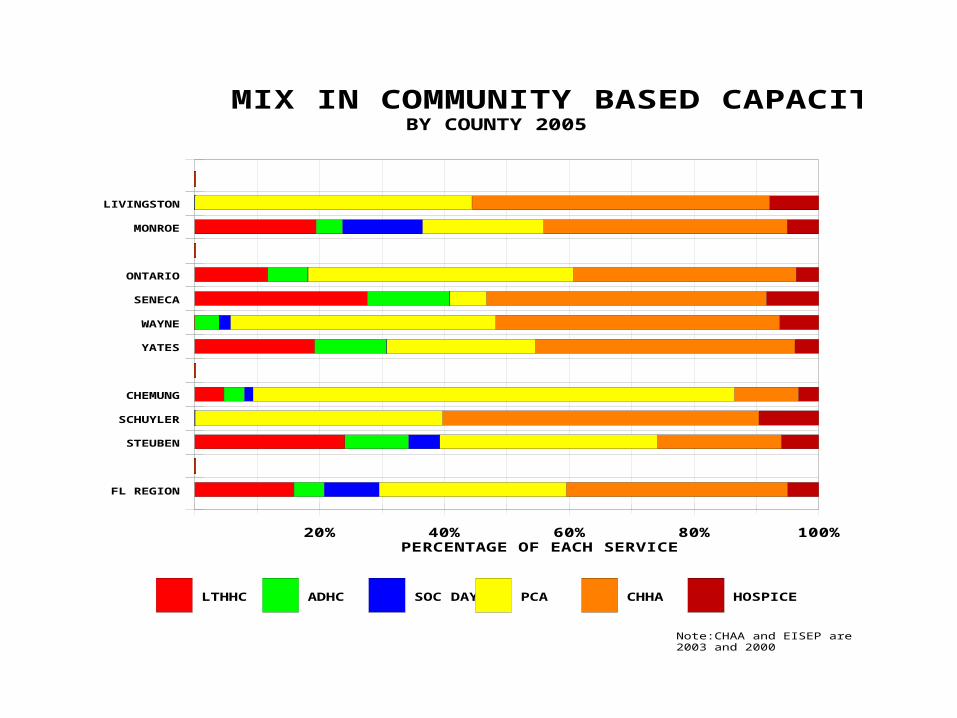
20% 40% 60% 80% 100%PERCENTAGE OF EACH SERVICE
FL REGION
STEUBEN
SCHUYLER
CHEMUNG
YATES
WAYNE
SENECA
ONTARIO
MONROE
LIVINGSTON
LTHHC ADHC SOC DAY PCA CHHA HOSPICE
MIX IN COMMUNITY BASED CAPACITYBY COUNTY 2005
Note:CHAA and EISEP are2003 and 2000
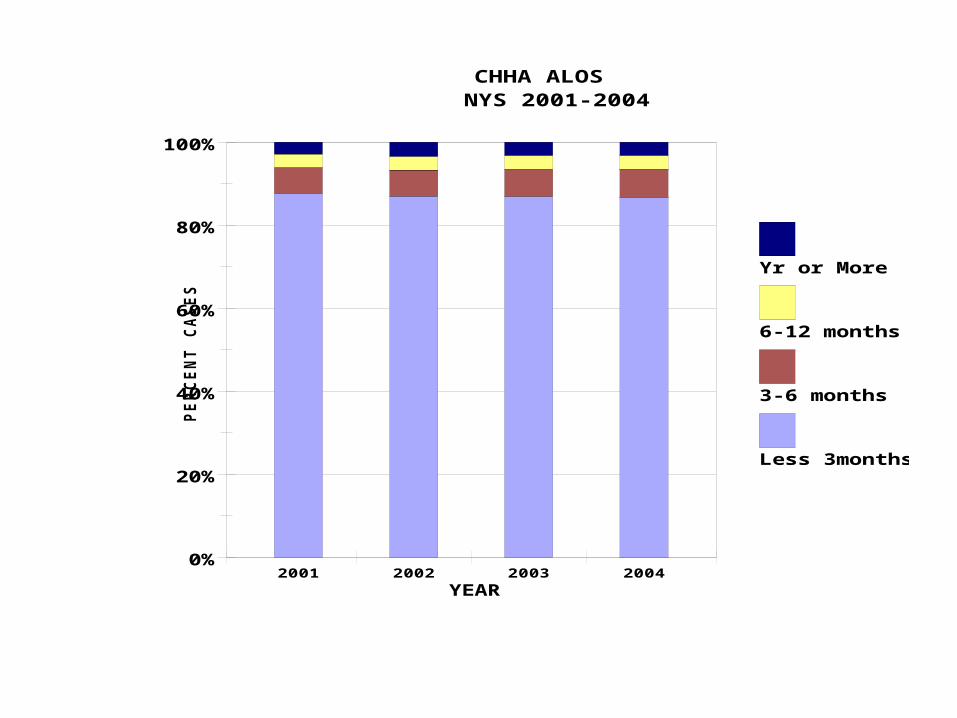
0%
20%
40%
60%
80%
100%
PE
RC
EN
T C
AS
ES
2001 2002 2003 2004YEAR
Yr or More
6-12 months
3-6 months
Less 3months
CHHA ALOSNYS 2001-2004
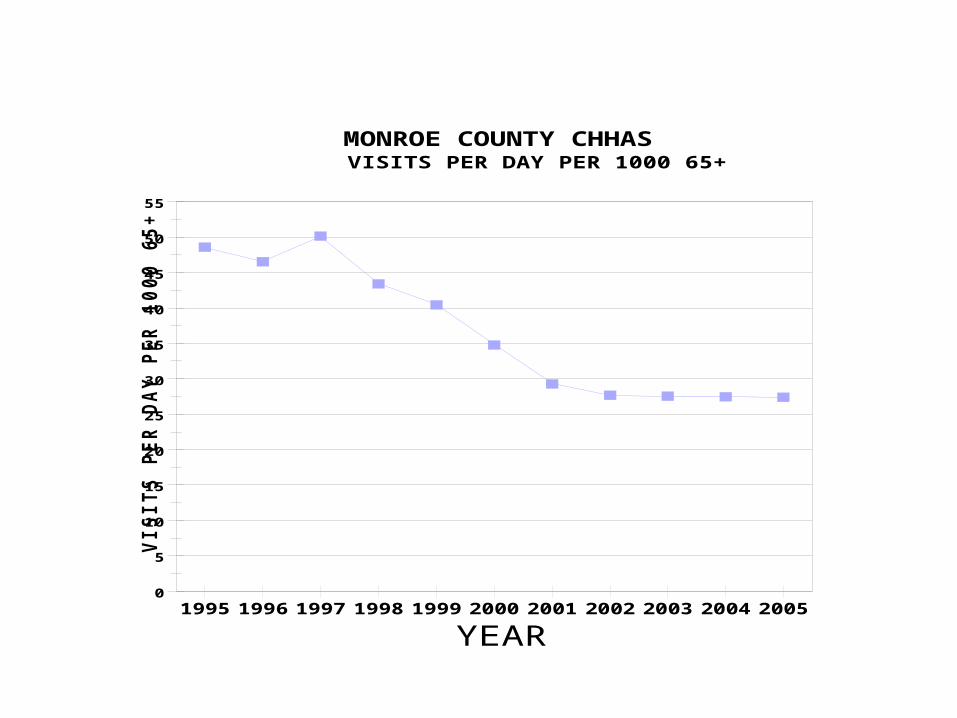
0
5
10
15
20
25
30
35
40
45
50
55
VIS
ITS
PE
R D
AY
PE
R 1
00
0 6
5+
1995 1996 1997 1998 1999 2000 2001 2002 2003 2004 2005
YEAR
MONROE COUNTY CHHASVISITS PER DAY PER 1000 65+
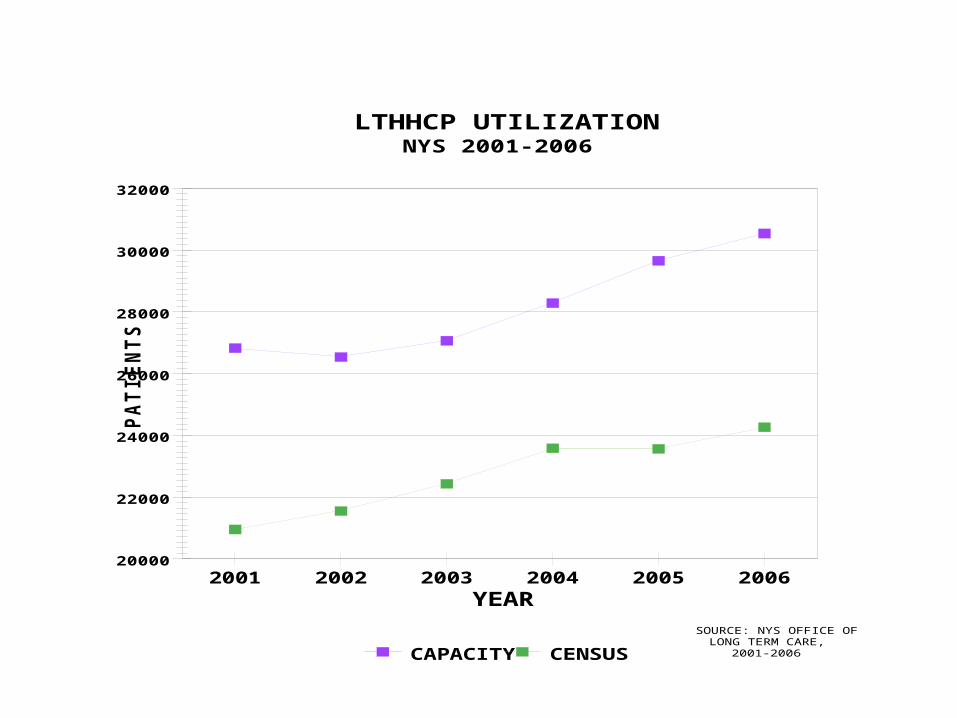
20000
22000
24000
26000
28000
30000
32000
PA
TIE
NT
S
2001 2002 2003 2004 2005 2006YEAR
CAPACITY CENSUS
LTHHCP UTILIZATIONNYS 2001-2006
SOURCE: NYS OFFICE OFLONG TERM CARE,
2001-2006
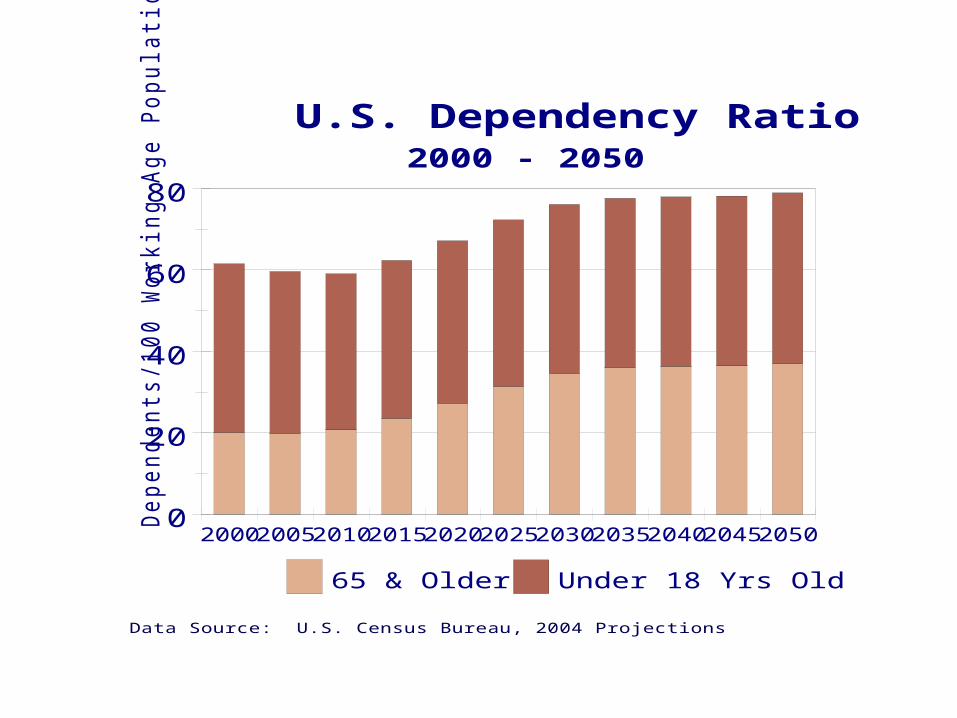
0
20
40
60
80
Dependents
/100 W
ork
ing A
ge P
opula
tion
20002005201020152020202520302035204020452050
65 & Older Under 18 Yrs Old
U.S. Dependency Ratio2000 - 2050
Data Source: U.S. Census Bureau, 2004 Projections
Public Forum “Ground Rules”
• Each speaker must fill out an index card (provided) with name, address, affiliation, phone and email.
• Each speaker has a maximum of 5 minutes to speak.
• The timekeeper will alert the speaker when s/he has 1 minute of time remaining.
• When a speaker’s allotted time is up, the time keeper will alert the speaker s/he has “no time remaining”.
• Depending on the number of speakers, the time keeper has discretion to allow a speaker more than 5 minutes total.
• Speakers are encouraged to leave a copy of their written testimony with the time keeper