Embed Size (px)
Citation preview
GeoConvention 2016: Optimizing Resources 1
Monogenic Phase Congruency: a novel approach to map lineaments from magnetic data over shale gas play of Horn River Basin, NE British Columbia, Canada Hassan H. Hassan and S.V. (Rao) Yalamanchili CGG Multi-Physics
Summary Identifying lineaments especially those attributed to faults and fractures from magnetic data is vital for oil and gas exploration in general and shale gas in particular. Their presence is crucial in defining potential shale gas plays because they provide pathway for oil and gas migration and accumulation. They also play an important role in geohazards detection. Several digital filtering techniques exist to delineate lineaments from magnetic data and among these techniques the derivative and the gradient based filters are the most popular ones. Although derivative and gradient based digital filters are powerful in mapping lineaments, they vary with direction, magnitude and scale; thus lineaments are often not mapped correctly. This paper is testing a new approach based on phase congruency that is able to map lineaments more accurately because it is invariant with direction, magnitude and scale. Phase congruency attempts to find locations in a signal where all the FFT components in the frequency domain are in-phase. These locations will generally correspond to zones of dislocations or in general term lineaments in a magnetic signal. Unlike derivative and gradient based filters which excel in identifying edge features, phase congruency is able to identify all kind of features that include edges and lines. Edges, in geological term, correspond to fault, fracture and lithological contact. Lines, on the other hand, correspond to ridges, igneous dikes, and buried channels. Normally, phase congruency is computed from FFT, wavelet or Log-Gabor filters but in this work the phase congruency was computed from the monogenic signal. Monogenic signal is the natural 3D extension of the analytic signal where Hilbert transform is replaced by Riesz transform. The monogenic phase congruency was applied to high resolution aeromagnetic (HRAM) data flown over the Horn River Basin which represents one of the largest shale gas plays in Canada. The preliminary results are very interesting and we were able to detect various lineaments in a more coherent fashion than is typical when derivative and gradient based filters are used. In addition, we were able to rank the lineaments according to the magnitude of phase congruency as weak (phase congruency magnitude ~ 0) or strong (phase congruency magnitude ~ 1.0).
Introduction One of the most important aspects of interpreting magnetic data especially in shale gas areas is to map lineaments which are generally displayed as linear or curvilinear anomalies on magnetic data. Although most of the existing geophysical methods can identify lineaments, magnetic measurement is perhaps one of the most favourable tools because it has the ability to collect data over a large and/or inaccessible area in a short period of time and at a low cost. Furthermore, the airborne magnetic method can be operated at remote locations, a feature that is not possible for some geophysical methods such as seismic. Most often, lineaments reflect subsurface geological features such as faults, fractures, lithological contacts, igneous dikes and buried channels and their presence is essential in defining potential shale gas plays. For example, there is evidence that faults and fracture related lineaments correlate positively with total content of gas in shale (Ding et al., 2011). In addition, lineaments provide information on the present day maximum horizontal stress that controls the direction of hydraulic fracture propagation which is necessary for effective hydraulic fracture treatment design (Gale et al., 2007).

GeoConvention 2016: Optimizing Resources 2
In general, lineaments are shown as dislocations or discontinuous zones on magnetic images. If these zones are presented as step (edge) function as shown in Figure 1, a condition arises where the Fourier frequency decomposition components (harmonics) of the magnetic image are maximally in-phase. This in-phase condition happens at the break of the step function and is referred to as phase congruency. We exploit this condition to efficiently map lineaments in magnetic data. Unlike derivative and gradient based filters which excel in mapping edge lineaments (i.e. faults, fractures and geological contacts), phase congruency is able to effectively map edge lineaments as well as line lineaments (i.e. ridges, igneous dikes and buried channels). Practically, a magnetic image can be decomposed into a linear combination of a set of symmetries (San Jose Estepar, 2010), specifically edges (odd symmetries) and lines (even symmetries) as illustrated in Figure 2. Image symmetries, such as those illustrated in Figure 2, are often observed as locations where the Fourier components of the image are in-phase (i.e. phase congruency).
Figure 1. Step function and its FFT harmonics showing the Figure 2. The decomposition of a signal into odd and Phase congruency location. even symmetries (modified after S.J. Estepar, 2010). Phase congruency was first introduced by Morrone and Owens (1987) for 1-D data. However, Kovesi (2003) made improvement to the algorithm and extended it to 2-D data. Since then, the algorithm is used in several fields of disciplines including geophysics. For example, Russell et al. (2010) used phase congruency to pick faults and fractures from 3-D seismic data. Phase congruency in general is computed from FFT, wavelet or Log-Gabor filters but in this study it is computed from the monogenic signal. Therefore, it is referred to as ‘monogenic phase congruency’ throughout this paper. Monogenic signal is the natural 3-D extension of the analytic signal where Hilbert transform is replaced by Reisz transform (Felsberg and Sommer, 2001; Hassan and Yalamanchili, 2013).
Figure 3. Index map of the study area. Figure 4. Generalized geology of Horn River Basin Showing RTP grid draped on topography. The area selected to test monogenic phase congruency is located in the Horn River of NE British Columbia, Canada (Fig. 3). The magnetic dataset (Fig. 4) used is owned by CGG Multi-Physics and was flown with a flight line spacing of 400m oriented NE/SW and a tie line spacing of 1200m oriented EW.

GeoConvention 2016: Optimizing Resources 3
The survey was flown with a draped ground clearance of 100m. The Horn River Basin is located at the eastern edge of the Foothills thrust belt and it is separated from the Liard Basin by a prominent Bovie Fault Zone (Fig. 4). The basin is intersected by three main Precambrian litho-tectonic magnetic basement terranes; Nahanni at the center, Fort Simpson Magmatic Arc to the east, and Fort Nelson Magmatic Arc to the west. The Fort Simpson and Fort Nelson Magmatic Arc Terranes have distinctive NS trending magnetic high (Fig. 4) and are characterized by the presence of ferrimagnetic minerals, most likely magnetite, which has a sufficiently high susceptibility to produce high amplitude anomalies characteristic of this terrane. Such large magnetization is usually indicative of calc-alkaline igneous rocks associated with magmatic-arc environments. The Nahanni terrane which is associated with a magnetic low is interpreted as thinned Fort Simpson basement (Cook et al., 1999). The Precambrian basement is covered by sedimentary rocks of the Horn River Basin. The Horn River Basin contains a sequence of stratigraphic horizons and plays that are considered potential for shale gas exploration. The main formations of interest for shale gas exploration in the Horn River Basin include the Devonian Muskwa shale and Evie shale (Walsh et al., 2006).
Theory The phase congruency (PC) algorithm that was developed by Kovesi (2003) and used in this paper is described below:
Where s and o denotes computation over scales and orientations, respectively; The symbols denote that the enclosed quantity is equal to itself if it is positive and to zero otherwise; W(x,y) is the sigmoid function used to weight a phase congruency; T is a quantity introduced to compensate image noise; ε is a small positive constant used to prevent division of zero; and ∆Φso(x,y) is a sensitive phase deviation function defined as:
The monogenic signal is computed from the real magnetic signal f(x,y) and its real (h1) and imaginary (h2) Riesz transforms, respectively as follow:
The monogenic amplitude (Aso) and phase (Φso) can be computed as follow:
Thus the monogenic phase congruency can be obtained by substituting equations (4) and (5) in equation (1) above.
Examples The reduced to the pole (RTP) total magnetic intensity image used as input to calculate the monogenic phase congruency is displayed in Figure 5a. We normally use the total horizontal gradient image of the
GeoConvention 2016: Optimizing Resources 4
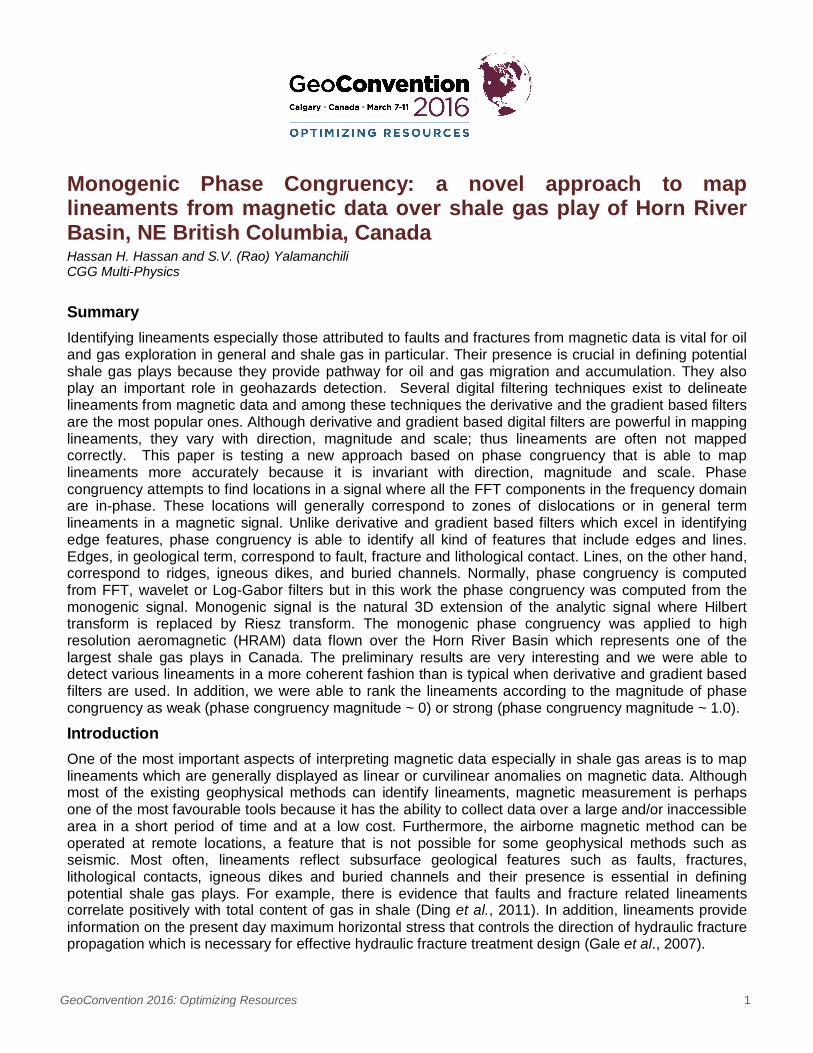
RTP (Fig. 5b) for mapping lineaments. Prior to computing the monogenic phase congruency the phase (Fig. 5c) and the amplitude of the monogenic signal were computed. The lineaments displayed on the monogenic phase image (Figures 5c) appear to be focused and more coherent in contrast to the one computed using traditional way of enhancing lineaments; for example the total horizontal gradient (Fig. 5b). The Bovie Fault zone, for example, is well defined in Figures 5c in comparison to Figure 5b. The monogenic phase congruency image computed from equation (1) is displayed in Figure 5d. In addition to lineaments, Figure 5d shows lineament magnitudes ranging from zero to one; zero (dark areas) indicates that no lineaments exist and one (bright areas) indicates strong lineaments. For example, the Bovie Fault Zone is associated with monogenic phase congruency of one (i.e., strong lineament).
Figure 5. Input data and their corresponding monogenic phase congruency results, (a) RTP total magnetic intensity image used as input, (b) Phase of RTP image computed using the monogenic signal, (c) Horizontal gradient of RTP image, and (d) computed monogenic phase congruency of the RTP total magnetic field image shown in Figure 5a.
Conclusions In this paper, a new approach based on the monogenic phase congruency is presented to analyze lineaments over shale gas play of the Horn River Basin. This new approach can be used as an alternative to traditional lineament mapping techniques such as derivatives and gradients as it gives better results (i.e., sharper, more coherent and continuous). Furthermore, with the monogenic phase congruency it is possible to rank lineaments into weak or strong based on their magnitude. Weak lineaments are associated with low magnitude monogenic phase congruency whereas strong lineaments, such as the Bovie Fault Zone in the Horn River Basin example, are associated with high magnitude monogenic phase congruency. Acknowledgements The authors would like to thank CGG for using the magnetic data and giving permission to publish this abstract.

GeoConvention 2016: Optimizing Resources 5
References
Cook, F.A., van der Velden, A.J., Hall, K.W., and Roberts, B.J., 1999, Tectonic delamination, and subcrustal imbrication of the Precambrian lithosphere in northwestern Canada mapped by LITHOPROBE: Geology, 26, 839-842. Ding W.L., Li C., Li C.Y., Xu C.C., Jiu K. and Zeng, W.T., 2011, Dominant factors of fracture development in shale and its relationship to gas accumulation: Earth Science Frontiers 19, 212-220 Felsberg, M., and Sommer, G., 2001, The Monogenic Signal: IEEE Trans. Signal Processing, 49, 3136-3140. Gale, J. F. W., Reed, R. M., and John Holder, 2007, Natural fractures in the Barnett Shale and their importance for hydraulic fracture treatments: American Association of Petroleum Geologists Bulletin, 91, 603-622. Hassan, H.H. and Yalamanchili, R., 2013, Monogenic signal decomposition: A new approach to enhance magnetic data: SEG Technical Program Expanded Abstracts 2013, 1206-1210. Kovesi, P.D., 2003, Phase congruency detects corners and edges: Seventh Australasian Conference on Digital Image Computing Techniques and Applications (DICTA’03), 309-318. Morrone, M.C., and Owens, R.A., 1987, Feature detection from local energy: Pattern Recognition Letters, 6, 303–313. Russell, B., Hampson, D. and Logel, J., 2010, Applying the phase congruency algorithm to seismic data slices: a carbonate case study: First Break, 28, 83-90. San Jose Estepar, 2010, Measurement of thin-layered structures in x-ray computer tomography: US Patent No. US2010/0172558A1, 15p. Walsh, W., Adams, C., Kerr, B., and Korol, J., 2006, Regional “shale gas” potential of the Triassic Doig and Montney Formations, Northeastern British Columbia: British Columbia Ministry of Energy, Mines and Petroleum Resources, Petroleum Geology Open file 2006-02.


![Open Access Genetic Control of -Cell Mass Homeostasis€¦ · Monogenic [MODY6] [146] PDX1 Transcription factor Insulin transcription [147], pancreas development [148] Monogenic [MODY4]](https://img.pdfslide.us/doc/110x75/6110925ed4eda8578404ac9a/open-access-genetic-control-of-cell-mass-homeostasis-monogenic-mody6-146-pdx1.jpg)


![06-13517 - Potluri v. Yalamanchili et al [PDF 79 KB]](https://img.pdfslide.us/doc/110x75/586907631a28ab136b8b974e/06-13517-potluri-v-yalamanchili-et-al-pdf-79-kb.jpg)