Embed Size (px)
Citation preview

Journal of Immunological Methods 405 (2014) 1–14
Contents lists available at ScienceDirect
Journal of Immunological Methods
j ourna l homepage: www.e lsev ie r .com/ locate / j im
Research paper
Monoclonal antibody binding-site diversity assessment with acell-based clustering assay
Sindy Liao-Chan, Joseph Zachwieja, Steven Gomez, Dana Duey,John Lippincott, Jan-Willem Theunissen ⁎Igenica Inc., 863 Mitten Road Suite 102, Burlingame, CA 94010, USA
a r t i c l e i n f o
Abbreviations: AU, approximately unbiased; BLI, biBSA, bovine serum albumin; CDR-H3, third complementarof heavy chain; DPEP1, Dipeptidase 1; ELISA, enzyme-assay; FBS, fetal bovine serum; HRP, horseradish peroxidantibody; mAb1, blocking antibody; mAb2, detection antbuffered saline; SFM, serum-free media; VH, heavy chain⁎ Corresponding author. Tel.: +1 201 320 1495; fax
E-mail addresses: [email protected] (S. [email protected] (J. Zachwieja), [email protected]@gmail.com (D. Duey), [email protected] ([email protected] (J.-W. Theunissen).
0022-1759/$ – see front matter © 2013 Elsevier B.V. Ahttp://dx.doi.org/10.1016/j.jim.2013.12.007
a b s t r a c t
Article history:Received 5 October 2013Received in revised form 12 December 2013Accepted 19 December 2013Available online 29 December 2013
The diversity of a panel of antibodies that target a specific antigen can be established in variousassay formats. In conventional epitope binning assays purified antibodies are tested in apairwise manner: two antibodies that compete with each other for binding to an antigen aregrouped into the same cluster or bin, while they are assigned to two different clusters whenthey do not compete. Here we present a high through put assay that enables grouping of crudehybridoma supernatants without a need for antibody purification. In addition, the assay doesnot require recombinant protein, because it is conducted on cells that express the antigen ofinterest. Hence, one can use the antibody-clustering assay for cell surface proteins that are notamenable to purification. Heavy chain variable region (VH) sequencing shows that VH
composition within clusters is conserved. Finally, the assay is in good agreement with aconventional epitope binning assay with purified antigen.
© 2013 Elsevier B.V. All rights reserved.
Keywords:Antibody sequencingBiosensorClustering assayEngineered cell linesEpitope binningMonoclonal antibody
1. Introduction
Monoclonal antibodies (mAbs) are a rapidly growingcategory of targeted therapeutic agents against both solubleand cell surface proteins (Beck et al., 2010; Scott et al., 2012).MAbs are often generated with standard hybridoma technol-ogy, single B cell sequencing, or display technologies. Rodentspecies immunized with a human antigen (i.e. target) willdevelop B cells secreting antigen-specific antibodies. B cells canbe fused with an immortal myeloma cell line to derivehybridoma cultures. Upon plating the hybridoma cultures in
o-layer interferometry;ity-determining regionlinked immunosorbentase; mAb, monoclonalibody; PBS, phosphate-variable region: +1 650 697 4900.han),ca.com (S. Gomez),J. Lippincott),
ll rights reserved.
96- or 384-well plates, crude culture supernatants are assayedfor specificity to the human target. Because fusions can yieldhundreds to thousands of target-specific hybridomas, screen-ing methods are needed to identify a smaller subset ofhybridomas for mAb purification and in-depth characteriza-tion. While these methods are often based on binding orfunctional effects of the mAbs, one widely used approach hasbeen to identify diversity based on epitopes of the mAbsthrough cross-competition assays. Enriching for mAb binding-site diversity in early screening is beneficial, as mAbs withdifferent epitopes can be functionally distinct (Dong et al.,2010; Koefoed et al., 2011; Niederfellner et al., 2011; Pedersenet al., 2010). In addition, identification of mAbs that can bindantigen simultaneously is valuable in designing reagents forother assays, such as immunogenicity or receptor occupancyassays (Byrd et al., 2012; Hellstrom et al., 1990).
Various epitope binning assays to screen formAb binding sitediversity exist. In classical sandwich ELISA experiments a mAb isimmobilized, antigen is allowed to bind and after an incubationinterval, a directly labeledmAb is added. If the immobilizedmAband directly labeled mAb do not compete for antigen binding, asignal is detected, and the mAbs are deemed to belong to

2 S. Liao-Chan et al. / Journal of Immunological Methods 405 (2014) 1–14
different clusters. On the other hand, if the two mAbs competefor binding, no signal is detected and the mAbs are assigned tothe same cluster. This classical ELISA or closely related formatscannot be deployed when using crude hybridoma supernatants,because the labeling reaction is usually performed with purifiedmAbs (Nakamura et al., 2012; Tsuji et al., 2012; Wagener et al.,1983). Clustering of crude mAb supernatants is possible with anELISA in which an immune complex of two mAbs associatedwith an antigen is detected with an enzyme-linked reagentspecific to a tag on the antigen (Nagata et al., 2004), or amultiplexed pairing assay (Jia et al., 2004; Miller et al., 2011). Inone example of amultiplexed assay,mAbs are bound to Luminexbeads via an anti-mouse IgG binding reagent (Miller et al., 2011).Each mAb is coupled to a different bead. Bead-labeled mAbs areincubated with antigen, followed by addition of a mAb that isprobed with a phycoerythrin-labeled anti-mouse IgG bindingreagent. Alternatively, mAb diversity in crude supernatants canbe assayed with biosensors (Abdiche et al., 2012; Abdiche et al.,2009; Estep et al., 2013; Fagerstam et al., 1990; Shi et al., 2006).While the latter three assay formats are compatible with the useof crude hybridoma supernatants, these assays require purifiedantigen.
Here, we describe a screening assay for profiling mAbdiversity of crude supernatants that does not require purifiedantigen. Instead, engineered cell lines expressing the humanantigen of interest are used to assess mAb relatedness.Engineered cell lines have multiple advantages over purifiedhuman proteins. First, an antigen preparation that containscontaminants or non-native forms of the antigen could lead toselection of mAb candidates that bind biologically irrelevantepitopes (Abdiche et al., 2012). Second, some cell surfaceproteins, especially when containing multiple extracellulardomains, are challenging to purify. Third, trans-membranedomains can be vital to the proper folding of the extracellulardomain of membrane proteins, so only cell surface expressioncan capture the native conformation. In contrast to cell-basedepitope binning assays with fluorescently conjugated purifiedmAbs (Ando et al., 2004; Fendly et al., 1990), the cell-basedscreening assay we developed does not require mAb purifica-tion and conjugation. In addition, the assay is relatively high-throughput in comparison to other protein- and cell-basedclustering assays, as hundreds of crude supernatants can bescreened.
2. Material and methods
2.1. Hybridoma and supernatant generation
129S6 mice (Taconic, Hudson, NY) were immunized withengineered murine sarcoma cells expressing human dipepti-dase 1 (DPEP1). All experiments with mice were performedin accordance with Igenica's institutional guidelines andregulations. Five weeks post-immunization the cells werereinjected intraperitoneally and four days post-injectionsplenocyteswere collected and fusedwith Sp2/mIL-6myelomacells (ATCC, Manassas, VA) using a standard polyethyleneglycol (PEG) procedure. The fused cells were plated out in384-well plates at a density that maximizes recovery of singlehybridoma clones. One week after plating the hybridomas,colony counts indicated that N85% of wells with hybridomasonly contained a single colony. DPEP1-specific hybridomaswere
selected by screening for binding to the cell line expressinghuman DPEP1 and not the parental line. Hybridomas wereadapted to Hybridoma SFM (Life Technologies, Carlsbad, CA)supplemented with 5% Super Low IgG Fetal Bovine Serum (FBS;Thermo/Hyclone, Logan, UT), OPI (oxaloacetate, pyruvate,insulin) (Sigma, St. Louis, MO), Hypoxanthine-Thymidine(Mediatech/Cellgro, Manassas, VA).
To confirm that our 384-well plating strategy maximizesrecovery of single hybridoma clones, we cloned all 22 IgG2ahybridomas used in Fig. 3A & B by limiting dilution. For eachhybridoma, two 96-well plates were set up containing either0.25 or 0.5 cells per well. On day 5 or 6 twelve wellscontaining single hybridomas were marked and on day 9 or10 media from these wells were assayed by cell ELISA. Uponobtaining 2 to 3 separate 4 mL clonal supernatants for eachIgG2a hybridoma, the cell-based clustering assay wasconducted with a single clone for each IgG2a hybridoma. Allcloned supernatants clustered in an identical manner com-pared to the supernatants used in Fig. 3A & B (SupplementaryFig. 1A & B, Fig. 3A & B).
2.2. Crude hybridoma supernatant characterization
Individual hybridoma supernatants incubated with themurine sarcoma cells expressing human DPEP1 were isotypedby using isotype-specific secondary antibodies (Goat anti-IgG1Horseradish Peroxidase (HRP) — Jackson ImmunoResearchcat.# 115-035-206, Goat anti-IgG2a HRP — cat.# 115-035-206,Goat anti-IgG2b HRP — cat.# 115-035-207, Goat anti-IgG3HRP — cat.# 115-035-209). The effective concentration ofthe hybridoma supernatants was measured by cell ELISAwith a 4-point dilution series (1:4, 1:16, 1:64 & 1:256) of thesupernatants and a murine Fc-specific secondary antibody(Jackson ImmunoResearch cat.# 115-035-071). Mouse IgGconcentrations in the hybridoma supernatants were establishedwith the Octet QK384 instrument (Fortebio, Menlo Park, CA)equipped with biosensors coated with goat anti-mouse IgG(Fortebio, part# 18-5024). A purified mAb spiked into culturemedia was used to establish a standard curve to calculatesupernatant concentrations. Characterization of the hybridomasupernatants requires a relatively small cell number: isotyping,specificity assessment, and cell-based titration for 96 differenthybridomas require a total of 6 × 10⁶ cells when seeding5 × 103 cells/well in 384-well plates. While isotyping andcell-based titration are conducted in singlet, specificityassessment is carried out in duplicate.
2.3. Hybridoma supernatant off-rate screening
Dissociation rates (off-rates) of the 43 anti-DPEP1 mAbsused in Figs. 3–6 & Supplementary Figs. 1–4 were establishedusing the Octet QK384 with anti-mouse IgG Fc sensors(Fortebio, part# 18-5090) hydrated in Hybridoma SFM sup-plemented with 5% Super Low IgG FBS. Crude hybridomasupernatants were immobilized to the sensor surface for 2 minand a baseline step was recorded by moving the sensors toPBS pH 7.4 for 2 min. Association of the recombinant humanDPEP1protein (Sino Biological Inc., cat.# 13543-H08H; 100 nMin PBS pH 7.4) was measured for 4 min and dissociation wasrecorded by moving the sensors to PBS pH 7.4 for 10 min.Reference sensors were dipped in PBS during the association

3S. Liao-Chan et al. / Journal of Immunological Methods 405 (2014) 1–14
step. The anti-mouse IgG Fc sensors were regenerated withthree short cycles of alternating 15 second steps of 10 mMglycine-HCl pH 1.5 and PBS pH 7.4. The sample plate waspre-warmed at 27 °C for 10 min prior to initiation of the assayand agitated at 1000 rpm throughout the entire experiment.Data collected at 27 °C was aligned to the baseline step andreference sensor subtracted in Octet Data Analysis 7.0 software.Data was also inter-step corrected by alignment to thedissociation step and filtered using the Savitzky–Golay equa-tion. Kinetic data was analyzed and fitted locally using a 1:1Langmuir bindingmodel. The kd(s−1),X2 and R2were reported.X2, a measurement of the goodness of curve fitting, is the sumof squared deviations, where deviation is the differencebetween the actual data point and the fitted curve. Valuesclose to zero indicate a good curve fit. R2, the coefficient ofdetermination, is an estimate of the goodness of the curve fitand is not directly related to the estimate of a specificparameter. Values close to 1.0 indicate a good curve fit.
2.4. Cell-based clustering assay
Murine sarcoma cells expressing DPEP1, seeded in384-well plates at 5 × 10³ cells/well, were incubated atroom temperature with media or a mAb (mAb1) of a certainisotype (e.g. IgG1/2b) at a dilution previously determined tobe 10× that required for saturation (Supplementary Table 1).We refer to mAb1 as a blocking mAb, because it potentiallyhinders binding of a second mAb. After 1 h, the cells werewashed three times with PBS supplemented with 0.1% BSA,fixed with 1% paraformaldehyde in PBS for 10 min, andwashed three times with PBS 0.1% BSA. Next, the cells wereincubated at room temperature for 1 h with either media or adetectionmAb (mAb2) of another isotype (e.g. IgG2a). For the43 DPEP1 blocking mAb1's and detection mAb2's used in thereproducibility experiments a median amount of 4 pmol[20 μl at 30 μg/ml] and 0.4 pmol [20 μl at 3 μg/ml], respec-tively, was used per well (Supplementary Table 2). After threewashes with PBS 0.1% BSA, the wells were incubated for30 min at room temperature with a secondary antibodyconjugated to HRP specific for the detection mAb (e.g. IgG2a)and detected with SuperSignal ELISA Pico ChemiluminescentSubstrate (Thermo Scientific part# 37069). The fixation, andwashes prior to and after the fixation, can be omitted, withoutaffecting the outcome of the clustering assay for the 43 DPEP1mAbs used in the reproducibility experiments (Supplemen-tary Fig. 1C & D). The mAb2 luminescence data for eachmAb2–mAb1 pair was divided by the mAb2 luminescencedata for wells incubated with media and mAb2 only, and thisfraction was multiplied by one hundred to obtain a percent-age of the control value. These normalized luminescencedata are tabulated in a two-dimensional matrix. In addition,the assay included control-wells that were only incubatedwith the blocking mAbs and presence of these blockingmAbs was detected with the appropriate isotype-specificHRP-conjugated secondary antibodies. When detectingblocking IgG1/2b mAbs, a 1:1 mixture of the anti-IgG1 HRPand the anti-IgG2b HRP conjugates was used. The clusteringassay requires a relatively small cell number: profiling 22blocking mAbs against 84 detection mAbs, requires a total of12 × 106 cells when seeding 5 × 10³ cells/well in 384-wellplates.
2.5. Biosensor-based clustering assay
Amine-reactive second generation sensors (AR2G) on anOctet QK384 instrument (Fortebio, Menlo Park, CA) wereequilibrated in water for 1 min and then activated witha freshly prepared mixture of 20 mM EDC (1-Ethyl-3-[3-dimethylaminopropyl] carbodimide hydrochloride) and10 mM sulfo-NHS (N-hydroxysulfosuccinimide) for 5 min. Ata 100 nM concentration in 10 mM sodium acetate pH 6 buffer,recombinant human DPEP1 antigen (Sino Biological Inc., cat.#13543-H08H) was covalently immobilized through NHS/EDCcoupling chemistry on the sensors for 4 min with a meanimmobilization level of 1.84 (± 0.29) nm, and excess reactiveesters were quenched with 1 M ethanolamine pH 8.5 for5 min. Antigen-coated sensors were then dipped in PBS for1 min to record a baseline step. Next, the antigen-coatedsensors were dipped in one blockingmAb (mAb1) and bindingwas measured until saturation for 10 min. The blockingmAb1-antigen coated sensors were washed for 15 s in PBS,and thenmoved towells containing an array of detectionmAbs(mAb2's) and bindingwasmeasured for 5 min. Antigen-coatedtips were regenerated with 3 short cycles of 20 secondalternating steps of Gentle Ab/Ag Elution Buffer pH 6.6(Thermo Scientific cat.# 21013) and PBS. The assay wasrepeated with the same mAb1 with a new array of mAb2's.Antigen-coated sensorswere used and regenerated three timesbefore a new set of sensorswas used. On control sensors,mediareplaced mAb1 and/or mAb2. Octet binding data was analyzedand processed using Octet Data Analysis 7.0 software. For allbinding steps, data was aligned to zero (baseline) on both thex- and y-axes. No referencing was applied. To obtain apercentage of the control response, themAb2 binding responsefor each mAb2-mAb1 pair was divided by the mAb2 bindingresponse for the biosensor incubated with media and mAb2only. The normalized binding responses are tabulated in atwo-dimensional matrix.
2.6. Analysis of clustering data
To compare antibodies in the two-dimensional matrices,the relative luminescence data from the cell-based clusteringassay or the relative binding data from the biosensor-basedclustering assay were plotted such that the detection mAbs(mAb2's) were in rows and the blocking mAbs (mAb1's)were in columns. The initial position of the antibodies inthese two-dimensional matrices was based on the order ofaddition of the antibody supernatants to the 384-well cellELISA plate or the biosensor. Pearson correlation coefficientswere calculated using the PEARSON function in MicrosoftExcel as described (Miller et al., 2011). Briefly, aftercalculating the Pearson correlation coefficients of the left-most column and every other column, the column withthe highest correlation was placed to the right of thefirst column. These calculations were repeated for all theother columns in the matrix, and the same calculationswere applied on the rows in the matrix. The antibody inthe leftmost column and the antibody in the top rowaffect the order of the antibodies in the Pearson-sortedtwo-dimensional matrix. The unsorted data in thetwo-dimensional matrices was also imported into R (The RProject for Statistical Computing (www.r-project.org); with
4 S. Liao-Chan et al. / Journal of Immunological Methods 405 (2014) 1–14
addition of the R package pvclust) to generate a clustergram(Suzuki and Shimodaira, 2006). Note that the data is trans-posed prior to being imported into R, i.e. the mAb2's are inseparate columns and the mAb1's are in separate rows. Anexample R script that sources data stored in a comma-separatedvalues file named “data.csv” is provided: line1: library (pvclust);line2: data b − read.table(“/Desktop/data.csv, header = TRUE,row.names = 1, sep=”,”); line3: result b − pvclust(data,nboot = 10000); line4: plot(result); line5: pvrect (result,alpha = 0.95).
2.7. VH sequencing
Heavy chain variable region sequencing was conducted asdescribed (Jones and Bendig, 1991). One microgram of RNAwas reverse transcribed with oligo-dT primers and SuperscriptIII (Life Technologies, Carlsbad, CA). PCR amplification of theheavy chain variable regions was conducted with the 5′ and 3′primer sets as described (Jones and Bendig, 1991). Sequenceanalysis was conducted with Lasergene 9 (DNAStar, Madison,WI). The phylogramwas generated using the ClustalWMethodin MegAlign (DNAStar). For each mAb, VBASE2 was used toderive the VH family, the VH and JH genes, and the CDR-H3sequence (Retter et al., 2005). Light chain sequencing was notconducted in this study.
3. Results
3.1. Overview of the cell-based clustering assay
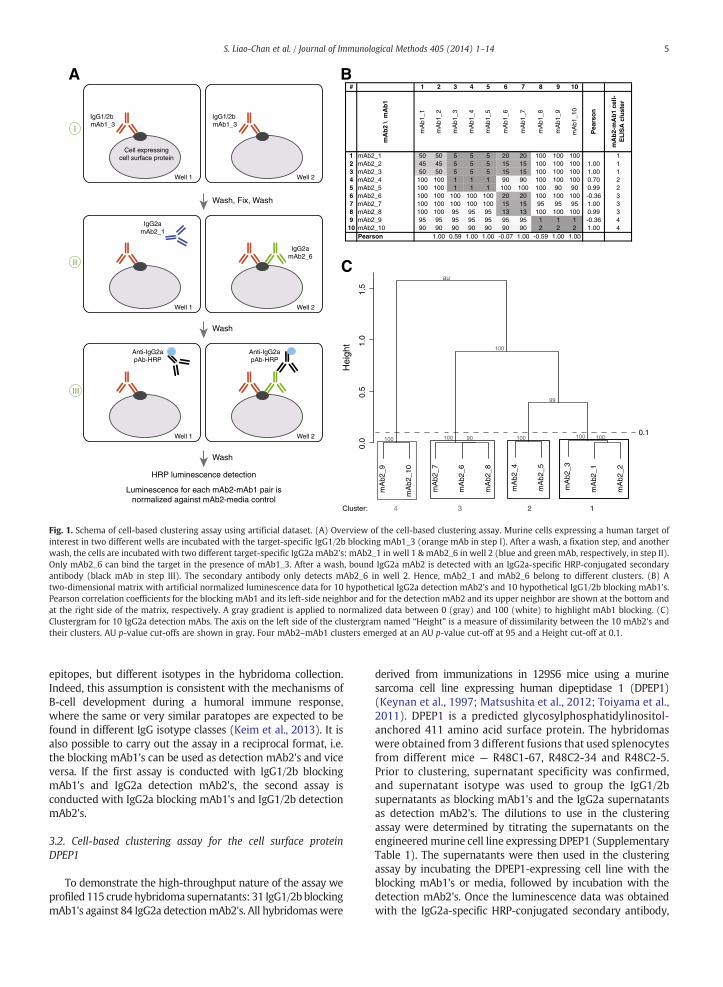
The cell-based clustering assay is based on sequentialbinding of two hybridoma supernatants to an engineeredmurine sarcoma cell line that expresses a human target ofinterest and takes advantage of the use of isotype-specificdetection. Other engineered cell lines or endogenous express-ing cell lines amenable to cell-based ELISA can also be used. Theisotype of the first blocking mAb (mAb1; e.g. IgG1 or IgG2b[abbreviated as IgG1/2b]) is different from the isotype of thesecond detection mAb (mAb2; e.g. IgG2a). Binding of mAb2 tocells is detected by adding an isotype-specific HRP-conjugatedsecondary polyclonal antibody (Fig. 1A). HRP luminescenceindicates that mAb1 and mAb2 can simultaneously bind to thecell surface-expressed human target. A reduction of HRPluminescence compared to the control (no mAb1), on theother hand, shows that the binding ofmAb1 interfereswith theconcurrent binding of mAb2.
Crude hybridoma supernatants with different IgG isotypesare used for the cell-based clustering assay. Before conductingthe assay, hybridoma supernatants are titrated and surveyed forspecificity and isotype. Specificity is establishedby screening thesupernatants on the engineered cell line that expresses thehuman target of interest and the parental cell line. Crudesupernatants are specific when they only stain the engineeredcell line with the human target. Supernatant isotype is estab-lished with the isotype-specific HRP-conjugated secondaryantibodies used in the cell-based clustering assay. A four-pointtitration on the engineered cell line is conducted to establish atwhat dilution the supernatant saturates staining. Specific,single-isotype hybridoma supernatants are grouped accordingto isotype. The blockingmAbs (mAb1; e.g. IgG1/2b) are used at adilution that is 10-fold greater than the saturating dilution,
whereas the detection mAbs (mAb2; e.g. IgG2a) are used at thesaturating dilution (Supplementary Table 1).
To establish mAb relatedness, the luminescence data forall the mAb2–mAb1 pairs is divided by the luminescence datafrom the wells incubated with media and mAb2 only and thefractions are multiplied by one hundred. This normalizeddata is tabulated in a two-dimensional matrix and used toderive a mAb2–mAb1 cell ELISA clustergram (e.g. [a mAb2[IgG2a]–mAb1[IgG1/2b] clustergram]; Fig. 1). In the two-dimensional matrix the mAb1's and the mAb2's are sortedbased on the Pearson product-moment correlation coeffi-cients of the normalized data (Fig. 1B). On the other hand, themAb2–mAb1 clustergram (Fig. 1C) shows the relatedness ofthe mAb2's by means of hierarchical clustering and p-valuereporting. The y-axis of the clustergram –Height – is ameasureof dissimilarity between mAb2's. MAb2's belong to the samecluster when their binding profiles in the presence of differentmAb1's are similar. AU (Approximately Unbiased) p-values arecomputed by multi-scale bootstrap resampling (Suzuki andShimodaira, 2006). For clusters with an AU p-value cut-offabove 95 the hypothesis that the cluster does not exist isrejected with a 0.05 significance level. Clusters are definedtop-down below a manually set Height cut-off on the y-axis,so that clusters do not contain highly dissimilar mAbs. Forexample, with a Height cut-off of 1, the first eight mAb2's(mAb2_1, 2, 3, 4, 5, 6, 7 & 8)would all fall into one cluster that isdissimilar from the cluster that contains mAb2_9 & mAb2_10(Fig. 1C). However, the blocking profiles for these first eightmAb2's are different when inspecting the two-dimensionalmatrix, indicating that the cluster contains dissimilar mAb2's(Fig. 1B). When clusters are defined top-down below a Heightcut-off of 0.1, four clusters emerge (Fig. 1C). Within each ofthese four clusters, the blocking profiles are similar. Forexample, cluster 1 mAb2's are blocked by mAb1_3, mAb1_4,mAb1_5, mAb1_6 & mAb1_7, while cluster 4 mAb2's areblocked by mAb1_8, mAb1_9 & mAb1_10. In addition, thePearson correlation coefficient between mAb2 pairs is onlygreater than 0.9 within each cluster, not between clusters.While a Height cut-off that is too high results in clusterscontaining dissimilar mAbs, a Height cut-off that is too lowresults in assignment of similar mAbs to different clusters. Forexample, when the Height cut-off is set at 0.01, mAb2_3 isassigned to its own cluster (Fig. 1C). However, the mAb2_3blocking profile is very similar to the mAb2_1 and mAb2_2blocking profiles, i.e. the blocking profiles vary only by10% in cluster 1 (Fig. 1B). Small differences in normalizedluminescence data can be ascribed to noise in the assay. Insummary, manual inspection of the normalized lumines-cence data and the Pearson correlation coefficients should beused to establish appropriate Height and AU p-value cut-offs.During later stages of mAb diversity assessment the Heightand AU p-value cut-offs can be adjusted by assessing assayreproducibility and conducting VH sequencing (Sections 3.2& 3.3, respectively).
An important attribute of the cell-based clustering assay isthat detection mAb2's of a particular isotype (e.g. IgG2a) canonly be profiled against blocking mAb1's of a different isotype(e.g. IgG1/2b). Because the high-throughput cell-based clus-tering assay enables profiling of a large collection of blockingmAb1's against a large collection of detection mAb2's, thesuccess of the assay relies on the presence ofmAbswith similar
C
A B
IgG1/2b mAb1_3
IgG1/2b mAb1_3
Well 1
Wash, Fix, Wash
I
III
Cell expressingcell surface protein
Well 2
II
0.1
1234Cluster:
IgG2amAb2_6
IgG2amAb2_1
Anti-IgG2apAb-HRP
Anti-IgG2apAb-HRP
Well 1 Well 2
Wash
Well 1 Well 2
Wash
HRP luminescence detection
Luminescence for each mAb2-mAb1 pair isnormalized against mAb2-media control
mA
b2_9
mA
b2_1
0
mA
b2_7
mA
b2_6
mA
b2_8
mA
b2_4
mA
b2_5
mA
b2_3
mA
b2_1
mA
b2_2
0.0
0.5
1.0
1.5
Hei
ght
100 10090100 100 100
99
100
au
# 1 2 3 4 5 6 7 8 9 10
mA
b2
\ m
Ab
1
mA
b1_1
mA
b1_2
mA
b1_3
mA
b1_4
mA
b1_5
mA
b1_6
mA
b1_7
mA
b1_8
mA
b1_9
mA
b1_1
0
Pea
rso
n
mA
b2-
mA
b1
cell-
EL
ISA
clu
ster
1 mAb2_1 50 50 5 5 5 20 20 100 100 100 12 mAb2_2 45 45 5 5 5 15 15 100 100 100 1.00 13 mAb2_3 50 50 5 5 5 15 15 100 100 100 1.00 14 mAb2_4 100 100 1 1 1 90 90 100 100 100 0.70 25 mAb2_5 100 100 1 1 1 100 100 100 90 90 0.99 26 mAb2_6 100 100 100 100 100 20 20 100 100 100 -0.36 37 mAb2_7 100 100 100 100 100 15 15 95 95 95 1.00 38 mAb2_8 100 100 95 95 95 13 13 100 100 100 0.99 39 mAb2_9 95 95 95 95 95 95 95 1 1 1 -0.36 4
10 mAb2_10 90 90 90 90 90 90 90 2 2 2 1.00 4Pearson 1.00 0.59 1.00 1.00 -0.07 1.00 -0.59 1.00 1.00
Fig. 1. Schema of cell-based clustering assay using artificial dataset. (A) Overview of the cell-based clustering assay. Murine cells expressing a human target ofinterest in two different wells are incubated with the target-specific IgG1/2b blocking mAb1_3 (orange mAb in step I). After a wash, a fixation step, and anotherwash, the cells are incubated with two different target-specific IgG2a mAb2's: mAb2_1 in well 1 & mAb2_6 in well 2 (blue and green mAb, respectively, in step II).Only mAb2_6 can bind the target in the presence of mAb1_3. After a wash, bound IgG2a mAb2 is detected with an IgG2a-specific HRP-conjugated secondaryantibody (black mAb in step III). The secondary antibody only detects mAb2_6 in well 2. Hence, mAb2_1 and mAb2_6 belong to different clusters. (B) Atwo-dimensional matrix with artificial normalized luminescence data for 10 hypothetical IgG2a detection mAb2's and 10 hypothetical IgG1/2b blocking mAb1's.Pearson correlation coefficients for the blocking mAb1 and its left-side neighbor and for the detection mAb2 and its upper neighbor are shown at the bottom andat the right side of the matrix, respectively. A gray gradient is applied to normalized data between 0 (gray) and 100 (white) to highlight mAb1 blocking. (C)Clustergram for 10 IgG2a detection mAbs. The axis on the left side of the clustergram named “Height” is a measure of dissimilarity between the 10 mAb2's andtheir clusters. AU p-value cut-offs are shown in gray. Four mAb2–mAb1 clusters emerged at an AU p-value cut-off at 95 and a Height cut-off at 0.1.
5S. Liao-Chan et al. / Journal of Immunological Methods 405 (2014) 1–14
epitopes, but different isotypes in the hybridoma collection.Indeed, this assumption is consistent with the mechanisms ofB-cell development during a humoral immune response,where the same or very similar paratopes are expected to befound in different IgG isotype classes (Keim et al., 2013). It isalso possible to carry out the assay in a reciprocal format, i.e.the blocking mAb1's can be used as detection mAb2's and viceversa. If the first assay is conducted with IgG1/2b blockingmAb1's and IgG2a detection mAb2's, the second assay isconducted with IgG2a blocking mAb1's and IgG1/2b detectionmAb2's.
3.2. Cell-based clustering assay for the cell surface proteinDPEP1
To demonstrate the high-throughput nature of the assay weprofiled 115 crudehybridoma supernatants: 31 IgG1/2bblockingmAb1's against 84 IgG2a detectionmAb2's. All hybridomaswere
derived from immunizations in 129S6 mice using a murinesarcoma cell line expressing human dipeptidase 1 (DPEP1)(Keynan et al., 1997; Matsushita et al., 2012; Toiyama et al.,2011). DPEP1 is a predicted glycosylphosphatidylinositol-anchored 411 amino acid surface protein. The hybridomaswere obtained from 3 different fusions that used splenocytesfrom different mice — R48C1-67, R48C2-34 and R48C2-5.Prior to clustering, supernatant specificity was confirmed,and supernatant isotype was used to group the IgG1/2bsupernatants as blocking mAb1's and the IgG2a supernatantsas detection mAb2's. The dilutions to use in the clusteringassay were determined by titrating the supernatants on theengineeredmurine cell line expressing DPEP1 (SupplementaryTable 1). The supernatants were then used in the clusteringassay by incubating the DPEP1-expressing cell line with theblocking mAb1's or media, followed by incubation with thedetection mAb2's. Once the luminescence data was obtainedwith the IgG2a-specific HRP-conjugated secondary antibody,
6 S. Liao-Chan et al. / Journal of Immunological Methods 405 (2014) 1–14
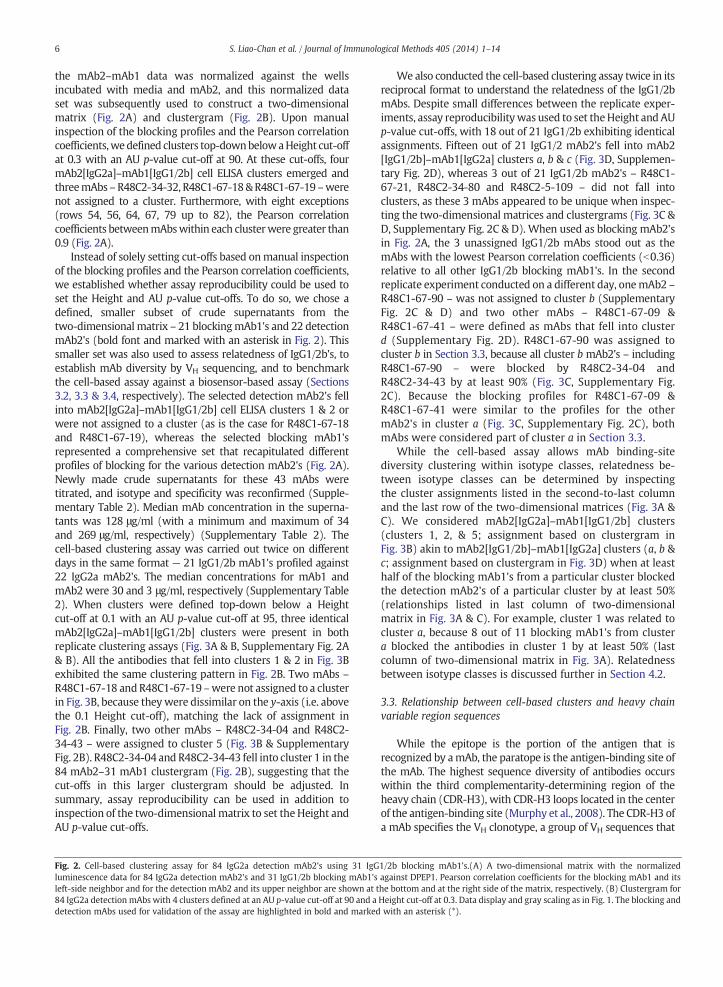
the mAb2–mAb1 data was normalized against the wellsincubated with media and mAb2, and this normalized dataset was subsequently used to construct a two-dimensionalmatrix (Fig. 2A) and clustergram (Fig. 2B). Upon manualinspection of the blocking profiles and the Pearson correlationcoefficients,wedefined clusters top-downbelowaHeight cut-offat 0.3 with an AU p-value cut-off at 90. At these cut-offs, fourmAb2[IgG2a]–mAb1[IgG1/2b] cell ELISA clusters emerged andthreemAbs–R48C2-34-32, R48C1-67-18&R48C1-67-19 –werenot assigned to a cluster. Furthermore, with eight exceptions(rows 54, 56, 64, 67, 79 up to 82), the Pearson correlationcoefficients betweenmAbswithin each clusterwere greater than0.9 (Fig. 2A).
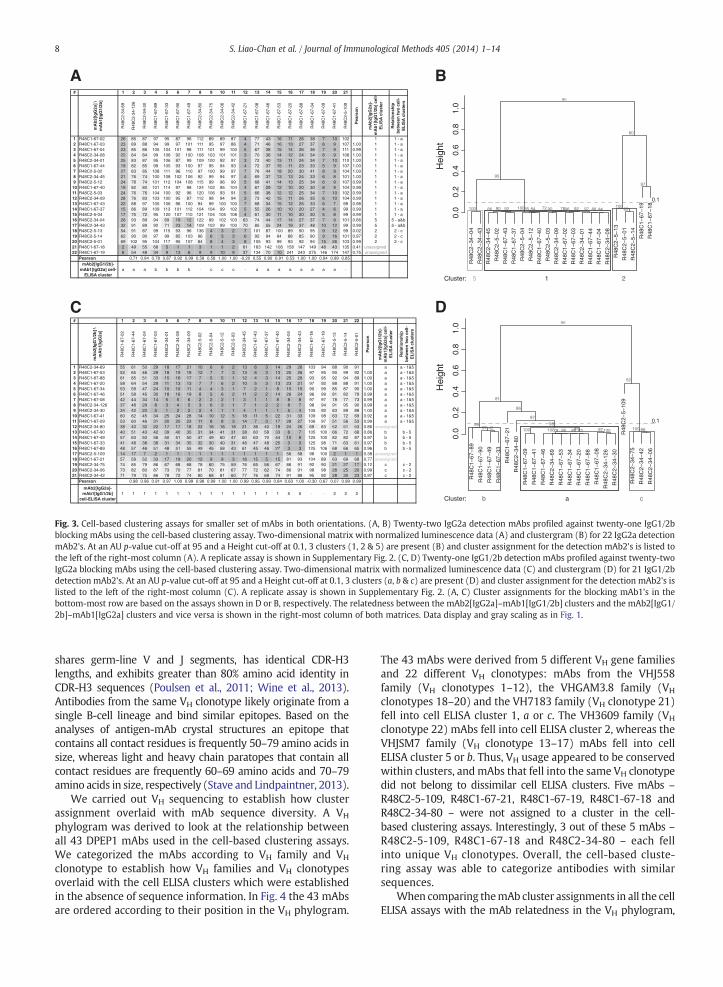
Instead of solely setting cut-offs based onmanual inspectionof the blocking profiles and the Pearson correlation coefficients,we established whether assay reproducibility could be used toset the Height and AU p-value cut-offs. To do so, we chose adefined, smaller subset of crude supernatants from thetwo-dimensional matrix – 21 blockingmAb1's and 22 detectionmAb2's (bold font and marked with an asterisk in Fig. 2). Thissmaller set was also used to assess relatedness of IgG1/2b's, toestablish mAb diversity by VH sequencing, and to benchmarkthe cell-based assay against a biosensor-based assay (Sections3.2, 3.3 & 3.4, respectively). The selected detection mAb2's fellinto mAb2[IgG2a]–mAb1[IgG1/2b] cell ELISA clusters 1 & 2 orwere not assigned to a cluster (as is the case for R48C1-67-18and R48C1-67-19), whereas the selected blocking mAb1'srepresented a comprehensive set that recapitulated differentprofiles of blocking for the various detection mAb2's (Fig. 2A).Newly made crude supernatants for these 43 mAbs weretitrated, and isotype and specificity was reconfirmed (Supple-mentary Table 2). Median mAb concentration in the superna-tants was 128 μg/ml (with a minimum and maximum of 34and 269 μg/ml, respectively) (Supplementary Table 2). Thecell-based clustering assay was carried out twice on differentdays in the same format — 21 IgG1/2b mAb1's profiled against22 IgG2a mAb2's. The median concentrations for mAb1 andmAb2 were 30 and 3 μg/ml, respectively (Supplementary Table2). When clusters were defined top-down below a Heightcut-off at 0.1 with an AU p-value cut-off at 95, three identicalmAb2[IgG2a]–mAb1[IgG1/2b] clusters were present in bothreplicate clustering assays (Fig. 3A & B, Supplementary Fig. 2A& B). All the antibodies that fell into clusters 1 & 2 in Fig. 3Bexhibited the same clustering pattern in Fig. 2B. Two mAbs –
R48C1-67-18 andR48C1-67-19 –were not assigned to a clusterin Fig. 3B, because theywere dissimilar on the y-axis (i.e. abovethe 0.1 Height cut-off), matching the lack of assignment inFig. 2B. Finally, two other mAbs – R48C2-34-04 and R48C2-34-43 – were assigned to cluster 5 (Fig. 3B & SupplementaryFig. 2B). R48C2-34-04 and R48C2-34-43 fell into cluster 1 in the84 mAb2–31 mAb1 clustergram (Fig. 2B), suggesting that thecut-offs in this larger clustergram should be adjusted. Insummary, assay reproducibility can be used in addition toinspection of the two-dimensional matrix to set the Height andAU p-value cut-offs.
Fig. 2. Cell-based clustering assay for 84 IgG2a detection mAb2's using 31 IgGluminescence data for 84 IgG2a detection mAb2's and 31 IgG1/2b blocking mAb1'sleft-side neighbor and for the detection mAb2 and its upper neighbor are shown at t84 IgG2a detection mAbs with 4 clusters defined at an AU p-value cut-off at 90 and adetection mAbs used for validation of the assay are highlighted in bold and marked
Wealso conducted the cell-based clustering assay twice in itsreciprocal format to understand the relatedness of the IgG1/2bmAbs. Despite small differences between the replicate exper-iments, assay reproducibilitywas used to set theHeight andAUp-value cut-offs, with 18 out of 21 IgG1/2b exhibiting identicalassignments. Fifteen out of 21 IgG1/2 mAb2's fell into mAb2[IgG1/2b]–mAb1[IgG2a] clusters a, b & c (Fig. 3D, Supplemen-tary Fig. 2D), whereas 3 out of 21 IgG1/2b mAb2's – R48C1-67-21, R48C2-34-80 and R48C2-5-109 – did not fall intoclusters, as these 3 mAbs appeared to be unique when inspec-ting the two-dimensional matrices and clustergrams (Fig. 3C &D, Supplementary Fig. 2C & D). When used as blocking mAb2'sin Fig. 2A, the 3 unassigned IgG1/2b mAbs stood out as themAbs with the lowest Pearson correlation coefficients (b0.36)relative to all other IgG1/2b blocking mAb1's. In the secondreplicate experiment conducted on a different day, onemAb2 –
R48C1-67-90 – was not assigned to cluster b (SupplementaryFig. 2C & D) and two other mAbs – R48C1-67-09 &R48C1-67-41 – were defined as mAbs that fell into clusterd (Supplementary Fig. 2D). R48C1-67-90 was assigned tocluster b in Section 3.3, because all cluster b mAb2's – includingR48C1-67-90 – were blocked by R48C2-34-04 andR48C2-34-43 by at least 90% (Fig. 3C, Supplementary Fig.2C). Because the blocking profiles for R48C1-67-09 &R48C1-67-41 were similar to the profiles for the othermAb2's in cluster a (Fig. 3C, Supplementary Fig. 2C), bothmAbs were considered part of cluster a in Section 3.3.
While the cell-based assay allows mAb binding-sitediversity clustering within isotype classes, relatedness be-tween isotype classes can be determined by inspectingthe cluster assignments listed in the second-to-last columnand the last row of the two-dimensional matrices (Fig. 3A &C). We considered mAb2[IgG2a]–mAb1[IgG1/2b] clusters(clusters 1, 2, & 5; assignment based on clustergram inFig. 3B) akin to mAb2[IgG1/2b]–mAb1[IgG2a] clusters (a, b &c; assignment based on clustergram in Fig. 3D) when at leasthalf of the blocking mAb1's from a particular cluster blockedthe detection mAb2's of a particular cluster by at least 50%(relationships listed in last column of two-dimensionalmatrix in Fig. 3A & C). For example, cluster 1 was related tocluster a, because 8 out of 11 blocking mAb1's from clustera blocked the antibodies in cluster 1 by at least 50% (lastcolumn of two-dimensional matrix in Fig. 3A). Relatednessbetween isotype classes is discussed further in Section 4.2.
3.3. Relationship between cell-based clusters and heavy chainvariable region sequences
While the epitope is the portion of the antigen that isrecognized by amAb, the paratope is the antigen-binding site ofthe mAb. The highest sequence diversity of antibodies occurswithin the third complementarity-determining region of theheavy chain (CDR-H3), with CDR-H3 loops located in the centerof the antigen-binding site (Murphy et al., 2008). The CDR-H3 ofa mAb specifies the VH clonotype, a group of VH sequences that
1/2b blocking mAb1's.(A) A two-dimensional matrix with the normalizedagainst DPEP1. Pearson correlation coefficients for the blocking mAb1 and itshe bottom and at the right side of the matrix, respectively. (B) Clustergram forHeight cut-off at 0.3. Data display and gray scaling as in Fig. 1. The blocking andwith an asterisk (*).

B
0.3
14 23
A
R48
C1−
67−1
8*R
48C
1−67
−19*
R48
C2−
34−
33R
48C
2−34
−13
6R
48C
2−34
−22
R48
C2−
34−4
3*R
48C
2−34
−47
R48
C2−
34−4
*R
48C
2−34
−12
R48
C1−
67−
24R
48C
1−67
−26
R48
C1−
67−
38 R48
C2−
34−
2R
48C
1−67
−16
R48
C1−
67−
22R
48C
1−67
−23
R48
C1−
67−
47R
48C
1−67
−50
R48
C1−
67−4
4*R
48C
1−67
−40*
R48
C1−
67−4
3*R
48C
2−5−
5R
48C
2−5−
3*R
48C
2−5−
7R
48C
1−67
−30
R48
C1−
67−3
7*R
48C
1−67
−14
R48
C1−
67−
7R
48C
1−67
−27
R48
C1−
67−2
*R
48C
1−67
−4*
R48
C1−
67−3
*R
48C
1−67
−13
R48
C1−
67−
15R
48C
1−67
−35
R48
C2−
5−28
R48
C2−
34−
39R
48C
2−5−
12*
R48
C2−
34−
40R
48C
2−34
−45*
R48
C2−
34−
16R
48C
2−5−
51R
48C
2−5−
55R
48C
2−5−
58R
48C
2−5−
52R
48C
2−5−
57R
48C
2−5−
17R
48C
2−5−
20R
48C
2−5−
25R
48C
2−34
−49
R48
C2−
34−8
*R
48C
2−34
−56
R48
C2−
34−
55R
48C
2−34
−25
R48
C2−
34−
65R
48C
2−34
−27
R48
C2−
5−33
R48
C2−
34−
23R
48C
2−34
−13
5R
48C
2−34
−88
R48
C2−
5−45
R48
C2−
5−30
R48
C2−
5−35 R
48C
2−34
−13
R48
C2−
5−2*
R48
C2−
34−9
*R
48C
2−34
−1*
R48
C2−
5−4*
R48
C2−
5−6
R48
C1−
67−
48R
48C
1−67
−6
R48
C1−
67−
25R
48C
1−67
−36
R48
C2−
5−65
R48
C2−
5−49
R48
C2−
34−
38 R48
C2−
34−
32R
48C
2−5−
42R
48C
2−5−
1*R
48C
2−34
−54
R48
C2−
5−50
R48
C2−
5−18
R48
C2−
5−13
*R
48C
2−5−
14*
0.0
0.2
0.4
0.6
0.8
1.2
Hei
ght
8590 859999 728899 70 8495 8398 100 7081 76 6097 8199 867495 9999 8096 9790 80100 99 8099 96 9997 9799 98 99 93100 9199 98 97 9289100 100100 98100 999898 826879 98 96 768995 1009889
808976 727592 99
8997
8383
62
au
99
Cluster:
1 2 3 4 5 6 7 8 9 10 11 12 13 14 15 16 17 18 19 20 21 22 23 24 25 26 27 28 29 30 31
mA
b2
\ m
Ab
1
R48
C1-
67-5
R48
C1-
67-1
0
R48
C1-
67-5
6
R48
C1-
67-4
6*
R48
C1-
67-2
0*
R48
C1-
67-7
3
R48
C1-
67-7
7
R48
C1-
67-8
8*
R48
C1-
67-3
4*
R48
C1-
67-8
*
R48
C1-
67-5
3*
R48
C2-
34-6
9*
R48
C2-
34-1
0
R48
C2-
34-1
43
R48
C2-
5-27
R48
C1-
67-2
1*
R48
C1-
67-4
1*
R48
C1-
67-9
*
R48
C2-
5-10
9*
R48
C2-
34-1
26*
R48
C2-
34-1
07
R48
C2-
34-3
0*
R48
C1-
67-8
9*
R48
C1-
67-9
0*
R48
C1-
67-3
3*
R48
C1-
67-4
9*
R48
C2-
34-7
5*
R48
C2-
34-4
2*
R48
C2-
34-6
*
R48
C2-
34-3
6
R48
C2-
34-8
0*
Pea
rso
n
mA
b2-
mA
b1
cell-
E
LIS
A c
lust
er
123456789101112131415161718192021222324252627282930313233343536373839404142434445464748495051525354555657585960616263646566676869707172737475767778798081828384
R48C1-67-2*R48C1-67-4*R48C1-67-15R48C1-67-35R48C1-67-13R48C1-67-7R48C1-67-27R48C1-67-37*R48C1-67-30R48C2-5-3*R48C2-5-7R48C2-5-5R48C1-67-43*R48C1-67-40*R48C1-67-44*R48C1-67-47R48C1-67-50R48C1-67-23R48C1-67-22R48C1-67-16R48C1-67-14R48C1-67-3*R48C2-34-40R48C2-34-45*R48C2-34-16R48C2-5-55R48C2-5-51R48C2-5-20R48C2-5-17R48C2-5-58R48C2-5-52R48C2-5-57R48C2-5-25R48C2-34-49R48C2-5-12*R48C2-34-39R48C2-34-27R48C2-5-35R48C2-5-30R48C2-5-45R48C2-34-88R48C2-34-25R48C2-34-65R48C2-5-33R48C2-34-23R48C2-34-55R48C2-34-135R48C2-34-56R48C2-34-8*R48C2-34-9*R48C2-5-4R48C2-5-6R48C2-34-1*R48C2-34-4*R48C2-34-12R48C2-34-47R48C2-34-43*R48C2-34-22R48C2-34-136R48C2-34-33R48C1-67-48R48C1-67-25R48C1-67-6R48C2-34-38R48C2-5-49R48C2-5-65R48C1-67-36R48C2-5-1*R48C2-34-54R48C2-5-14*R48C2-5-13*R48C2-5-18R48C2-5-50R48C2-5-42R48C2-34-32R48C1-67-24R48C1-67-26R48C1-67-38R48C2-5-28R48C2-34-2R48C2-34-13R48C2-5-2*R48C1-67-19*R48C1-67-18*
Pearson
4 5 12 23 8 6 7 19 23 53 11 15 10 13 10 5 10 7 103 68 42 59 77 75 88 82 80 78 71 77 1166 8 17 28 12 8 9 21 27 56 15 19 14 16 9 8 11 8 96 75 50 78 88 89 99 96 94 86 77 85 1178 7 16 26 11 7 9 19 27 69 14 16 14 12 10 7 12 7 93 68 42 71 101 100 95 94 89 87 97 87 1228 7 16 30 12 8 8 22 34 68 15 16 15 18 13 7 11 8 97 76 56 70 115 119 110 105 91 101 109 97 1455 6 12 22 9 7 7 16 28 58 12 13 12 12 8 9 9 7 101 66 39 57 93 98 112 103 97 86 101 92 1354 4 10 17 7 6 6 12 19 39 9 11 8 8 6 6 6 4 89 69 35 61 95 88 91 91 93 81 86 95 1261 1 3 9 4 2 3 8 12 34 3 6 4 6 3 4 2 1 103 71 29 57 101 101 94 88 91 88 96 98 1336 5 10 19 8 6 6 13 18 52 9 12 11 11 11 7 6 4 101 76 41 83 127 123 102 100 100 99 115 109 1346 5 11 21 9 7 7 16 22 53 10 13 15 14 13 8 7 5 93 82 48 102 133 133 93 98 97 106 125 115 13316 13 21 40 18 13 15 31 40 90 22 26 22 27 16 16 15 25 96 75 57 92 113 115 105 101 95 110 121 122 10513 15 21 40 18 14 14 30 39 76 19 19 15 21 13 15 14 15 105 68 48 68 105 112 102 99 97 106 115 109 9814 15 20 39 18 12 17 28 40 79 20 25 21 23 14 14 15 16 108 88 58 94 129 110 95 91 93 107 111 129 935 4 11 24 7 7 8 19 25 44 11 16 10 14 9 7 9 5 102 79 36 65 94 92 101 105 106 113 87 111 985 5 15 29 8 8 8 23 30 49 14 18 13 18 10 6 12 6 106 80 42 65 85 90 96 109 101 110 83 110 935 5 14 29 8 7 7 21 28 51 15 15 9 14 9 5 10 6 101 77 35 56 75 78 96 99 91 99 77 111 864 3 10 23 6 5 6 14 21 39 10 11 8 10 7 5 8 4 96 69 29 47 82 82 101 104 96 92 80 108 972 2 9 13 4 4 3 9 16 30 6 9 5 8 3 4 4 2 96 67 22 50 85 81 106 102 99 101 74 116 913 3 9 19 6 5 7 17 20 38 8 12 7 9 4 5 7 4 94 57 24 41 66 70 98 93 95 89 66 87 814 3 12 23 8 6 6 18 24 48 10 12 8 10 5 6 9 5 102 66 27 40 75 71 116 106 93 87 71 88 962 2 5 11 3 2 3 6 10 22 5 6 3 4 3 2 4 1 90 41 14 23 71 72 104 111 94 88 74 87 955 6 12 21 8 9 8 14 21 42 11 11 9 9 7 10 8 5 99 83 35 73 85 101 94 106 90 81 86 93 1369 9 13 23 13 6 7 17 26 82 12 16 12 12 13 7 11 13 99 74 47 72 97 90 110 98 91 86 92 94 12614 17 24 39 23 18 17 34 46 75 90 28 26 28 15 22 21 15 100 75 61 83 105 109 101 93 92 85 105 95 11515 16 21 35 23 18 17 31 43 70 100 27 24 22 16 21 20 16 100 76 60 78 114 107 107 98 86 82 103 100 11817 14 21 35 21 15 15 29 40 80 100 29 23 25 17 19 18 14 98 79 59 81 107 110 102 90 89 85 96 91 12518 15 18 36 20 16 15 29 40 84 112 30 26 22 19 19 18 16 100 78 61 82 122 122 102 101 91 93 110 97 12818 14 19 33 21 15 15 30 39 79 104 29 26 22 21 17 18 15 96 78 58 81 122 116 104 92 92 90 97 97 11720 16 24 34 22 17 18 32 38 81 97 32 29 26 22 19 19 16 92 73 57 82 112 109 88 100 82 88 101 95 10919 16 21 35 19 15 16 32 40 88 98 33 31 26 19 20 17 15 93 77 59 85 119 119 94 95 94 95 112 93 12620 17 23 40 23 17 18 33 42 81 104 33 32 33 23 21 20 16 106 88 67 85 125 124 102 91 94 99 119 98 13820 18 22 41 24 16 17 32 40 87 118 27 27 27 21 19 19 18 105 86 68 85 124 120 107 91 97 91 118 101 13719 19 22 41 25 16 18 32 40 87 114 33 28 26 21 19 18 16 110 87 70 84 114 116 102 100 90 94 117 101 13222 14 21 39 23 15 16 32 43 99 113 29 25 25 17 18 17 12 106 83 61 80 124 116 103 106 91 96 114 102 13415 15 22 43 22 16 17 36 46 87 106 31 26 26 15 15 20 15 102 74 57 84 113 112 93 93 89 92 109 102 12020 16 20 36 22 14 15 30 41 89 112 36 34 28 19 17 20 17 102 74 70 92 128 127 100 90 98 100 120 111 1137 8 8 15 13 9 9 13 20 42 106 10 8 6 6 14 6 5 87 50 23 57 111 124 116 99 87 89 95 106 10016 9 20 36 14 14 14 32 43 61 95 26 15 18 12 14 13 7 90 74 37 51 92 84 103 90 88 89 74 95 8917 13 25 41 17 18 18 36 46 67 101 35 26 32 18 16 18 10 100 81 50 63 98 83 96 102 96 100 79 105 9614 14 25 42 16 16 17 35 46 70 113 32 25 30 15 15 19 9 105 82 52 66 92 93 104 106 98 106 86 109 9313 8 22 39 16 13 15 31 40 61 103 35 23 33 13 12 17 9 98 90 49 62 84 85 95 93 92 96 82 103 8814 12 22 38 18 17 17 32 43 61 91 34 21 30 12 14 21 11 101 80 39 64 81 78 90 86 90 92 75 104 7817 8 19 40 13 12 14 28 37 57 95 26 19 25 12 11 15 8 96 75 42 58 85 68 89 89 84 83 71 96 8828 9 21 39 16 15 15 33 41 55 95 27 18 27 12 12 19 9 102 81 47 63 81 75 95 96 83 84 73 99 10413 12 24 39 15 16 16 33 41 69 100 33 21 30 14 15 18 11 101 86 46 57 86 83 95 96 81 83 71 94 9214 12 24 39 18 17 17 35 48 75 107 31 21 27 15 15 21 11 98 87 43 61 80 87 104 95 88 97 77 100 9011 12 26 45 18 16 19 39 54 67 101 35 23 35 15 13 23 12 101 84 52 62 73 78 91 80 88 91 79 102 838 8 17 30 14 13 14 25 38 48 106 19 14 20 9 13 16 6 96 79 40 56 83 77 92 87 94 92 77 102 7915 14 28 48 21 21 22 42 51 66 106 35 25 32 16 17 25 14 91 81 37 59 79 85 103 102 87 95 73 108 6211 11 25 49 14 14 15 32 47 57 68 26 14 26 10 10 17 11 104 89 45 66 83 85 103 111 97 112 85 125 6010 9 26 43 14 12 13 28 38 57 24 24 16 22 12 10 16 10 100 86 41 64 87 79 100 101 94 105 80 116 014 13 19 32 18 12 13 28 36 77 18 18 14 18 12 12 15 25 108 79 52 68 107 106 101 98 96 90 104 100 014 16 21 38 18 15 17 31 41 80 23 18 18 21 15 15 15 17 96 79 58 77 114 120 106 100 94 98 116 107 014 15 22 40 19 15 15 30 43 84 22 23 23 27 16 14 16 15 102 89 64 97 126 113 96 92 96 107 118 114 011 9 18 33 12 12 12 25 34 55 19 19 12 18 10 54 14 9 110 83 37 58 87 55 72 33 107 109 82 130 013 14 28 42 15 15 18 31 37 56 26 26 17 24 12 70 19 13 105 77 37 56 77 40 71 26 99 108 73 119 7124 21 28 42 23 18 20 33 38 80 94 33 30 29 21 91 26 20 96 76 53 76 99 68 75 25 89 86 94 94 9615 15 20 32 22 15 17 29 38 77 100 26 21 19 14 72 18 12 95 70 44 77 106 67 70 24 90 91 98 101 10052 12 21 38 16 16 17 33 40 63 110 31 18 25 14 57 19 9 104 86 43 66 81 57 72 25 94 97 74 105 9043 41 53 50 34 48 46 47 51 52 103 52 38 54 33 47 50 38 90 73 42 59 63 43 61 30 86 84 60 99 4537 38 45 44 30 38 37 39 42 42 106 51 41 51 36 48 42 37 91 71 42 57 62 30 40 9 75 76 52 91 4632 32 48 57 26 41 36 33 44 43 45 32 25 37 34 50 28 21 84 75 34 52 64 18 35 3 24 11 8 96 3826 27 35 42 29 41 39 41 32 43 35 40 38 42 45 50 25 28 98 70 45 76 93 28 28 2 22 9 9 98 5035 42 39 45 38 30 32 28 30 54 36 40 46 42 41 77 21 32 90 72 46 80 84 25 34 3 20 13 12 76 4441 43 50 56 54 61 57 53 58 61 88 42 35 42 43 67 42 44 90 68 46 60 78 16 20 3 4 7 4 92 2445 41 58 67 52 67 64 57 63 59 103 32 19 27 43 50 34 29 94 62 27 47 67 22 30 3 8 8 7 93 3575 72 71 81 87 83 73 74 74 104 110 38 36 42 76 75 34 42 106 74 48 75 100 32 31 7 10 18 15 94 5036 34 39 66 65 65 67 60 65 76 46 16 15 23 50 50 29 35 107 59 33 51 99 21 22 1 9 2 2 102 4786 78 72 74 81 74 75 78 76 90 73 58 65 61 99 14 20 16 104 80 52 101 135 125 101 87 42 27 22 127 8380 73 69 76 75 63 71 71 72 97 95 60 64 64 73 26 26 24 97 79 64 91 114 113 95 85 26 25 27 107 93104 85 77 83 89 74 79 72 79 102 110 59 71 65 93 20 21 16 101 81 66 95 125 121 102 85 26 32 37 107 12180 67 73 71 73 65 66 67 67 81 100 54 57 62 90 18 16 13 86 69 53 80 116 117 96 77 19 25 25 100 11995 88 78 74 83 72 71 72 75 99 105 59 65 67 89 22 30 27 103 88 70 87 126 118 101 84 38 44 52 101 13177 75 63 78 72 60 63 64 73 88 115 51 57 62 78 14 12 8 108 77 69 81 112 108 99 82 21 26 28 97 11776 56 69 74 54 69 65 62 70 66 97 54 42 60 57 16 39 31 98 77 45 56 86 85 85 88 24 28 19 91 9415 12 16 55 6 5 6 9 12 49 98 54 44 58 18 5 2 2 91 65 43 48 76 69 81 66 7 11 8 93 796 5 15 24 9 8 9 18 26 44 14 16 11 17 7 9 11 6 90 76 29 48 63 68 103 92 31 21 14 90 916 6 10 22 9 6 7 15 21 50 10 13 13 13 15 7 9 9 103 72 41 79 125 122 99 91 36 21 21 109 1311 1 2 7 2 1 1 3 6 37 2 4 3 3 2 3 2 1 98 65 25 70 122 109 88 77 43 37 39 96 13319 11 20 33 21 14 16 28 37 93 97 108 27 23 15 21 18 13 97 68 59 121 121 140 93 96 103 105 127 106 12011 10 25 45 15 16 15 31 42 60 22 27 17 26 12 10 22 11 107 97 40 72 86 82 102 213 105 112 82 126 7312 12 22 37 16 15 17 28 37 53 21 26 17 25 11 16 18 12 104 81 43 51 82 81 98 93 38 27 19 101 015 14 19 34 25 14 14 29 38 78 19 22 21 21 21 17 18 140 96 89 62 92 118 129 110 98 104 113 119 122 03 4 6 49 109 175 189 199 174 63 10 4 3 4 6 13 128 118 109 69 7 26 20 1 4 3 3 3 2 32 4
160160 199 278 243 292 303 264 265 277 213 2 1 2 90 44 56 88 101 32 3 29 41 2 3 2 2 2 1 50 2
0.990.991.000.990.991.000.990.990.970.990.980.961.001.000.991.000.990.990.980.950.980.930.990.991.001.000.991.001.001.001.001.000.990.990.950.960.991.001.000.990.990.990.990.990.990.980.980.960.940.960.990.990.870.920.860.990.940.830.960.570.900.920.750.930.920.880.540.950.970.980.970.970.910.740.760.940.980.780.700.760.67-0.180.66
11111111111111111111111111111111111111111111111111111111114433333332222222-1111111--
0.98
0.97
0.95
0.92
0.97
1.00
0.98
0.99
0.78
0.57
0.53
0.81
0.95
0.74
0.35
0.36
0.72
0.06
0.38
0.61
0.82
0.84
0.82
0.84
0.88
0.59
0.98
0.91
0.39
0.04
7S. Liao-Chan et al. / Journal of Immunological Methods 405 (2014) 1–14
R48
C2−
34−
04
R48
C2−
34−
43
R48
C2−
34−
45
R48
C2−
5−02
R48
C1−
67−
43
R48
C1−
67−
37
R48
C2−
5−04
R48
C2−
5−12
R48
C1−
67−
40
R48
C2−
5−03
R48
C2−
34−
09
R48
C1−
67−
02
R48
C1−
67−
03
R48
C2−
34−
01
R48
C1−
67−
44
R48
C1−
67−
04
R48
C2−
34−
08
R48
C2−
5−13
R48
C2−
5−01
R48
C2−
5−14
R48
C1−
67−
19
R48
C1−
67−
18
0.0
0.2
0.1
0.1
0.4
0.6
0.8
1.0
BA
DC
Hei
ght
au
1 2Cluster: 5
R48
C1−
67−
89
R48
C1−
67−
90
R48
C1−
67−
49
R48
C1−
67−
33
R48
C1−
67−
21
R48
C2−
34−
80
R48
C1−
67−
09
R48
C1−
67−
41
R48
C1−
67−
46
R48
C2−
34−
69
R48
C1−
67−
53
R48
C1−
67−
34
R48
C1−
67−
20
R48
C1−
67−
88
R48
C1−
67−
08
R48
C2−
34−
126
R48
C2−
34−
30
R48
C2−
5−10
9
R48
C2−
34−
75
R48
C2−
34−
42
R48
C2−
34−
06
0.0
0.2
0.4
0.6
0.8
1.0
Hei
ght
b a cCluster:
95100
97
60
948896 9786 90848592100 927690 72100
95
83 10079 8886100100 97 6610099429799 98
87
86
81
52
au# 1 2 3 4 5 6 7 8 9 10 11 12 13 14 15 16 17 18 19 20 21 22
mA
b2[
IgG
1/2b
] \
mA
b1[
IgG
2a]
R48
C1-
67-0
2
R48
C1-
67-4
4
R48
C1-
67-0
4
R48
C1-
67-0
3
R48
C2-
34-0
1
R48
C2-
34-0
8
R48
C2-
34-0
9
R48
C2-
5-02
R48
C2-
5-04
R48
C2-
5-12
R48
C2-
5-03
R48
C2-
34-4
5
R48
C1-
67-4
3
R48
C1-
67-3
7
R48
C1-
67-4
0
R48
C2-
34-0
4
R48
C2-
34-4
3
R48
C1-
67-1
8
R48
C1-
67-1
9
R48
C2-
5-13
R48
C2-
5-14
R48
C2-
5-01
Pea
rso
n
mA
b2[
IgG
1/2b
]-m
Ab
1[Ig
G2a
] ce
ll-E
LIS
A c
lust
er
Rel
atio
nsh
ip
bet
wee
n t
wo
cel
l-E
LIS
A c
lust
ers
1 R48C2-34-69 55 61 50 29 18 17 21 10 6 6 2 13 6 3 14 29 26 103 94 88 90 91 a a - 1&52 R48C1-67-53 52 65 46 29 18 19 19 12 7 7 3 13 6 3 13 25 26 97 95 90 99 92 1.00 a a - 1&53 R48C1-67-88 61 65 51 33 15 16 17 7 5 5 1 12 4 3 14 25 26 93 95 92 94 89 1.00 a a - 1&54 R48C1-67-20 58 64 54 29 11 13 13 7 7 6 2 10 5 3 13 23 21 97 92 88 88 91 1.00 a a - 1&55 R48C1-67-34 53 59 47 24 10 10 11 4 4 3 1 7 2 1 8 15 15 90 99 85 87 90 1.00 a a - 1&56 R48C1-67-46 51 58 45 30 18 16 19 8 5 6 2 11 2 2 14 26 24 96 99 81 82 79 0.99 a a - 1&57 R48C1-67-08 42 44 34 14 5 5 6 2 2 2 1 3 1 1 8 8 8 97 97 78 77 73 0.99 a a - 1&58 R48C2-34-126 37 48 29 8 3 4 5 3 6 3 1 7 1 2 2 8 7 98 94 91 95 90 0.99 a a - 1&59 R48C2-34-30 34 42 20 5 1 2 2 2 4 1 1 4 1 1 1 5 4 105 92 83 89 88 1.00 a a - 1&5
10 R48C1-67-41 60 62 45 34 25 24 28 14 10 12 5 18 11 5 22 31 33 109 98 63 72 69 0.92 a a - 1&511 R48C1-67-09 53 60 46 31 20 20 23 11 8 8 3 14 7 3 17 28 27 106 97 51 56 53 0.99 a a - 1&512 R48C2-34-80 38 40 32 22 17 17 18 22 16 16 18 21 36 40 19 24 26 69 83 52 51 53 0.86 unassigned13 R48C1-67-90 40 51 43 42 39 40 35 31 34 41 31 38 60 58 33 6 7 105 100 66 72 68 0.86 b b - 514 R48C1-67-49 57 63 50 56 50 51 50 47 49 60 47 60 63 70 44 10 8 125 100 82 82 87 0.97 b b - 515 R48C1-67-33 41 48 38 38 31 34 35 32 30 40 31 46 47 48 25 3 3 125 98 71 63 61 0.97 b b - 516 R48C1-67-89 48 57 46 51 48 51 55 49 45 58 43 61 45 46 27 3 3 125 106 68 66 65 0.96 b b - 517 R48C2-5-109 14 17 7 2 1 1 1 1 1 1 1 1 1 1 1 56 58 98 100 2 1 1 0.38 unassigned18 R48C1-67-21 57 59 52 33 17 19 20 12 9 9 3 16 15 5 15 81 93 104 89 63 69 68 0.77 unassigned19 R48C2-34-75 74 85 79 86 67 68 68 78 60 75 59 76 65 56 67 86 91 92 90 21 27 17 0.12 c c - 220 R48C2-34-06 73 82 80 87 73 70 77 81 70 81 67 77 72 62 74 86 91 98 98 28 25 20 0.99 c c - 221 R48C2-34-42 71 79 75 86 78 72 74 80 68 81 60 77 76 68 74 91 88 95 92 28 30 23 0.97 c c - 2
Pearson 0.98 0.96 0.91 0.97 1.00 0.99 0.98 0.99 1.00 1.00 0.99 0.95 0.99 0.84 0.63 1.00 -0.30 0.67 0.07 0.99 0.99
mAb2[IgG2a]-mAb1[IgG1/2b]
cell-ELISA cluster1 1 1 1 1 1 1 1 1 1 1 1 1 1 1 5 5 - - 2 2 2
# 1 2 3 4 5 6 7 8 9 10 11 12 13 14 15 16 17 18 19 20 21m
Ab
2[Ig
G2a
] \
mA
b1[
IgG
1/2b
]
R48
C2-
34-6
9
R48
C2-
34-1
26
R48
C2-
34-3
0
R48
C1-
67-8
9
R48
C1-
67-3
3
R48
C1-
67-9
0
R48
C1-
67-4
9
R48
C2-
34-8
0
R48
C2-
34-7
5
R48
C2-
34-0
6
R48
C2-
34-4
2
R48
C1-
67-2
1
R48
C1-
67-0
8
R48
C1-
67-4
6
R48
C1-
67-5
3
R48
C1-
67-2
0
R48
C1-
67-8
8
R48
C1-
67-3
4
R48
C1-
67-0
9
R48
C1-
67-4
1
R48
C2-
5-10
9
Pea
rso
n
mA
b2[
IgG
2a]-
mA
b1[
IgG
1/2b
] ce
ll-E
LIS
A c
lust
er
Rel
atio
nsh
ip
bet
wee
n t
wo
cel
l-E
LIS
A c
lust
ers
1 R48C1-67-02 26 85 87 97 95 87 96 112 89 89 87 4 77 43 16 11 26 38 7 10 102 1 1 - a2 R48C1-67-03 23 89 88 94 99 97 101 111 95 97 86 4 71 46 16 13 27 37 6 9 107 1.00 1 1 - a3 R48C1-67-04 23 85 86 105 104 101 98 111 101 99 100 5 67 38 15 14 26 36 7 9 111 0.99 1 1 - a4 R48C2-34-08 22 84 84 99 106 92 100 108 103 101 101 3 70 36 14 12 24 34 8 9 106 1.00 1 1 - a5 R48C2-34-01 25 83 87 95 106 87 99 109 100 92 97 3 72 40 13 11 24 34 7 10 110 1.00 1 1 - a6 R48C1-67-44 19 82 85 99 105 93 100 97 95 94 93 4 72 37 15 11 23 33 5 9 107 1.00 1 1 - a7 R48C2-5-02 27 83 85 108 111 96 110 97 100 99 97 7 76 44 18 20 30 41 8 9 104 1.00 1 1 - a8 R48C2-34-45 21 76 74 100 108 102 106 92 99 94 97 4 69 37 13 13 24 33 6 8 101 1.00 1 1 - a9 R48C2-5-12 24 78 74 101 112 104 108 115 99 96 99 5 68 41 14 13 25 34 6 9 107 0.99 1 1 - a
10 R48C1-67-40 19 82 80 101 114 97 98 124 102 95 104 4 67 29 12 10 20 30 6 9 104 0.99 1 1 - a11 R48C2-5-03 24 76 76 104 100 92 96 120 106 93 91 5 66 38 12 12 25 34 7 10 102 0.99 1 1 - a12 R48C2-34-09 28 76 83 103 100 95 87 112 98 94 94 3 73 42 15 11 26 35 6 10 104 0.99 1 1 - a13 R48C1-67-43 22 88 97 105 106 96 100 94 99 100 100 7 68 34 15 12 25 33 6 7 99 0.98 1 1 - a14 R48C1-67-37 15 86 89 109 113 101 112 104 104 99 102 5 55 26 10 10 20 27 4 6 99 0.99 1 1 - a15 R48C2-5-04 17 75 72 95 120 107 110 121 104 105 108 4 61 30 11 10 20 30 5 8 99 0.99 1 1 - a16 R48C2-34-04 26 93 89 94 69 19 12 122 99 102 103 63 74 44 17 14 27 37 7 9 101 0.66 5 5 - a&b17 R48C2-34-43 32 91 89 92 71 23 14 109 102 99 100 70 85 55 24 19 37 48 10 12 99 0.99 5 5 - a&b18 R48C2-5-13 54 91 87 99 115 93 96 136 4 3 2 7 101 87 100 89 90 95 9 12 99 0.02 2 2 - c19 R48C2-5-14 62 90 90 97 99 85 103 96 6 3 3 6 92 94 94 88 85 90 9 16 101 0.97 2 2 - c20 R48C2-5-01 69 102 95 104 117 95 107 84 8 4 3 8 105 93 99 93 92 94 15 26 103 0.99 2 2 - c21 R48C1-67-18 2 49 55 68 5 1 1 3 1 1 2 61 163 142 108 158 147 149 48 43 135 0.41 unassigned 22 R48C1-67-19 6 54 48 34 9 13 6 9 9 10 9 37 134 70 10 241 243 275 146 174 147 0.75 unassigned
Pearson 0.71 0.94 0.78 0.87 0.92 0.99 0.58 0.58 1.00 1.00 -0.20 0.55 0.90 0.91 0.53 1.00 1.00 0.94 0.99 0.85mAb2[IgG1/2b]-
mAb1[IgG2a] cell-ELISA cluster
a a a b b b b - c c c - a a a a a a a a -
Fig. 3. Cell-based clustering assays for smaller set of mAbs in both orientations. (A, B) Twenty-two IgG2a detection mAbs profiled against twenty-one IgG1/2bblocking mAbs using the cell-based clustering assay. Two-dimensional matrix with normalized luminescence data (A) and clustergram (B) for 22 IgG2a detectionmAb2's. At an AU p-value cut-off at 95 and a Height cut-off at 0.1, 3 clusters (1, 2 & 5) are present (B) and cluster assignment for the detection mAb2's is listed tothe left of the right-most column (A). A replicate assay is shown in Supplementary Fig. 2. (C, D) Twenty-one IgG1/2b detection mAbs profiled against twenty-twoIgG2a blocking mAbs using the cell-based clustering assay. Two-dimensional matrix with normalized luminescence data (C) and clustergram (D) for 21 IgG1/2bdetection mAb2's. At an AU p-value cut-off at 95 and a Height cut-off at 0.1, 3 clusters (a, b & c) are present (D) and cluster assignment for the detection mAb2's islisted to the left of the right-most column (C). A replicate assay is shown in Supplementary Fig. 2. (A, C) Cluster assignments for the blocking mAb1's in thebottom-most row are based on the assays shown in D or B, respectively. The relatedness between the mAb2[IgG2a]–mAb1[IgG1/2b] clusters and the mAb2[IgG1/2b]–mAb1[IgG2a] clusters and vice versa is shown in the right-most column of both matrices. Data display and gray scaling as in Fig. 1.
8 S. Liao-Chan et al. / Journal of Immunological Methods 405 (2014) 1–14
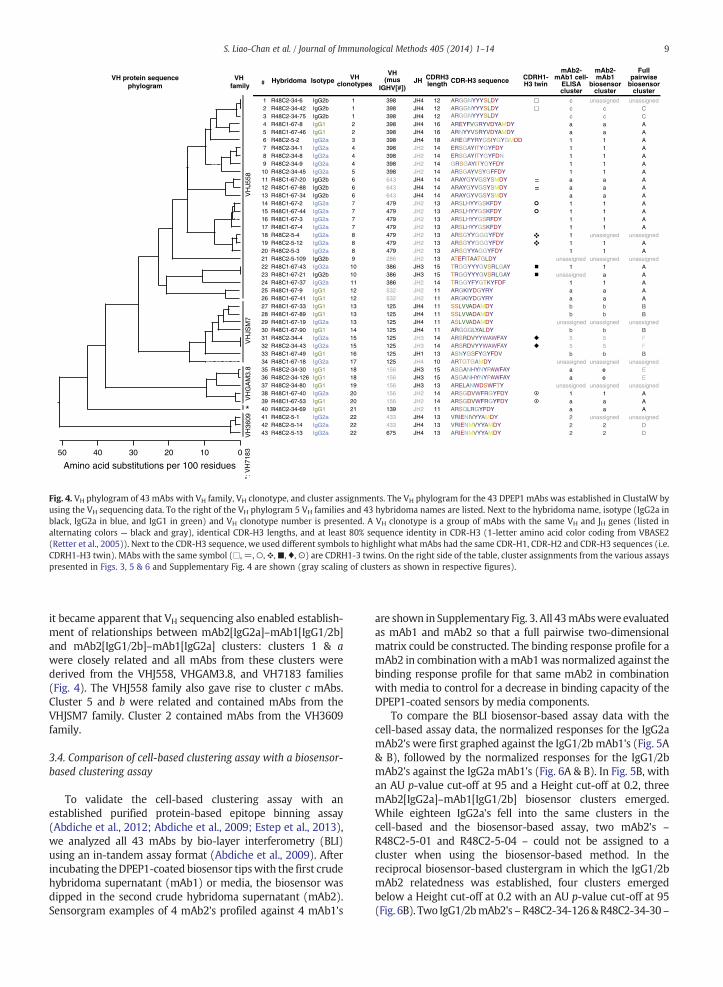
shares germ-line V and J segments, has identical CDR-H3lengths, and exhibits greater than 80% amino acid identity inCDR-H3 sequences (Poulsen et al., 2011; Wine et al., 2013).Antibodies from the same VH clonotype likely originate from asingle B-cell lineage and bind similar epitopes. Based on theanalyses of antigen-mAb crystal structures an epitope thatcontains all contact residues is frequently 50–79 amino acids insize, whereas light and heavy chain paratopes that contain allcontact residues are frequently 60–69 amino acids and 70–79amino acids in size, respectively (Stave and Lindpaintner, 2013).
We carried out VH sequencing to establish how clusterassignment overlaid with mAb sequence diversity. A VH
phylogram was derived to look at the relationship betweenall 43 DPEP1 mAbs used in the cell-based clustering assays.We categorized the mAbs according to VH family and VH
clonotype to establish how VH families and VH clonotypesoverlaid with the cell ELISA clusters which were establishedin the absence of sequence information. In Fig. 4 the 43 mAbsare ordered according to their position in the VH phylogram.
The 43 mAbs were derived from 5 different VH gene familiesand 22 different VH clonotypes: mAbs from the VHJ558family (VH clonotypes 1–12), the VHGAM3.8 family (VH
clonotypes 18–20) and the VH7183 family (VH clonotype 21)fell into cell ELISA cluster 1, a or c. The VH3609 family (VH
clonotype 22) mAbs fell into cell ELISA cluster 2, whereas theVHJSM7 family (VH clonotype 13–17) mAbs fell into cellELISA cluster 5 or b. Thus, VH usage appeared to be conservedwithin clusters, and mAbs that fell into the same VH clonotypedid not belong to dissimilar cell ELISA clusters. Five mAbs –
R48C2-5-109, R48C1-67-21, R48C1-67-19, R48C1-67-18 andR48C2-34-80 – were not assigned to a cluster in the cell-based clustering assays. Interestingly, 3 out of these 5 mAbs –R48C2-5-109, R48C1-67-18 and R48C2-34-80 – each fellinto unique VH clonotypes. Overall, the cell-based cluste-ring assay was able to categorize antibodies with similarsequences.
When comparing themAb cluster assignments in all the cellELISA assays with the mAb relatedness in the VH phylogram,
VH family
VH protein sequencephylogram
VH
J558
VH
JSM
7V
HG
AM
3.8
VH
3609
*: V
H71
83
Amino acid substitutions per 100 residues
01020304050
*
# Hybridoma Isotype VHclonotypes
VH(mus
IGHV[#])JH CDRH3
length CDR-H3 sequence CDRH1-H3 twin
mAb2-mAb1 cell-
ELISAcluster
mAb2-mAb1
biosensorcluster
Fullpairwise
biosensorcluster
1 R48C2-34-6 IgG2b 1 398 JH4 12 ARGGNYYYSLDY2 R48C2-34-42 IgG2b 1 398 JH4 12 ARGGNYYYSLDY3 R48C2-34-75 IgG2b 1 398 JH4 12 ARGGNYYYSLDY
4 R48C1-67-8 IgG1 2 398 JH4 16 AREYFVGRYVDYAMDY5 R48C1-67-46 IgG1 2 398 JH4 16 ARNYYVSRYVDYAMDY6 R48C2-5-2 IgG2a 3 398 JH4 18 AREGFYRYGSIYGYGMDD7 R48C2-34-1 IgG2a 4 398 JH2 14 ERSGAYITYGYFDY8 R48C2-34-8 IgG2a 4 398 JH2 14 ERSGAYITYGYFDN9 R48C2-34-9 IgG2a 4 398 JH2 14 GRSGAYITYGYFDY
10 R48C2-34-45 IgG2a 5 398 JH2 14 ARSGAYVSYGFFDY11 R48C1-67-20 IgG2b 6 643 JH4 14 ARAYGYVGSYSMDY12 R48C1-67-88 IgG2b 6 643 JH4 14 ARAYGYVGSYSMDY13 R48C1-67-34 IgG2b 6 643 JH4 14 ARAYGYVGSYSMDY14 R48C1-67-2 IgG2a 7 479 JH2 13 ARSLHYYGSKFDY15 R48C1-67-44 IgG2a 7 479 JH2 13 ARSLHYYGSKFDY16 R48C1-67-3 IgG2a 7 479 JH2 13 ARSLHYYGSRFDY17 R48C1-67-4 IgG2a 7 479 JH2 13 ARSLHYYGSKFDY18 R48C2-5-4 IgG2a 8 479 JH2 13 ARSGYYGGGYFDY19 R48C2-5-12 IgG2a 8 479 JH2 13 ARSGYYGGGYFDY20 R48C2-5-3 IgG2a 8 479 JH2 13 ARSGYYAGGYFDY21 R48C2-5-109 IgG2b 9 286 JH2 13 ATEFITAATGLDY22 R48C1-67-43 IgG2a 10 386 JH3 15 TRGGYYYGVSRLGAY23 R48C1-67-21 IgG2b 10 386 JH3 15 TRGGYYYGVSRLGAY24 R48C1-67-37 IgG2a 11 386 JH2 14 TRGGYFYGTKYFDF25 R48C1-67-9 IgG1 12 532 JH2 11 ARGKIYDGYRY26 R48C1-67-41 IgG1 12 532 JH2 11 ARGKIYDGYRY27 R48C1-67-33 IgG1 13 125 JH4 11 SSLVVADAMDY28 R48C1-67-89 IgG1 13 125 JH4 11 SSLVVADAMDY29 R48C1-67-19 IgG2a 13 125 JH4 11 ASLVVADAMDY30 R48C1-67-90 IgG1 14 125 JH4 11 ARGGGLYALDY31 R48C2-34-4 IgG2a 15 125 JH3 14 ARSRDVYYWAWFAY32 R48C2-34-43 IgG2a 15 125 JH3 14 ARSRDVYYWAWFAY33 R48C1-67-49 IgG1 16 125 JH1 13 ASNYGSFYGYFDV34 R48C1-67-18 IgG2a 17 125 JH4 10 ARTGTGAMDY35 R48C2-34-30 IgG1 18 156 JH3 15 ASGANHYNYPAWFAY36 R48C2-34-126 IgG1 18 156 JH3 15 ASGANHYNYPAWFAY37 R48C2-34-80 IgG1 19 156 JH3 13 ARELANWDSWFTY38 R48C1-67-40 IgG2a 20 156 JH2 14 ARSGDVWFRGYFDY39 R48C1-67-53 IgG1 20 156 JH2 14 ARSGDVWFRGYFDY40 R48C2-34-69 IgG1 21 139 JH2 11 ARSQLRGYFDY41 R48C2-5-1 IgG2a 22 433 JH4 13 VRIENIVYYAMDY42 R48C2-5-14 IgG2a 22 433 JH4 13 VRIENMVYYAMDY43 R48C2-5-13 IgG2a 22 675 JH4 13 ARIENMVYYAMDY
c unassigned unassignedc c Cc c Ca a Aa a A1 1 A1 1 A1 1 A1 1 A1 1 Aa a Aa a Aa a A1 1 A1 1 A1 1 A1 1 A1 unassigned unassigned1 1 A1 1 A
unassigned unassigned unassigned1 1 A
unassigned a A1 1 Aa a Aa a Ab b Bb b B
unassigned unassignedb b B5 5 F5 5 Fb b B
unassigned
unassigned
unassigned unassigneda e Ea e E
unassigned unassigned unassigned1 1 Aa a Aa a A2 unassigned unassigned2 2 D2 2 D
==
Fig. 4. VH phylogram of 43 mAbs with VH family, VH clonotype, and cluster assignments. The VH phylogram for the 43 DPEP1 mAbs was established in ClustalW byusing the VH sequencing data. To the right of the VH phylogram 5 VH families and 43 hybridoma names are listed. Next to the hybridoma name, isotype (IgG2a inblack, IgG2a in blue, and IgG1 in green) and VH clonotype number is presented. A VH clonotype is a group of mAbs with the same VH and JH genes (listed inalternating colors — black and gray), identical CDR-H3 lengths, and at least 80% sequence identity in CDR-H3 (1-letter amino acid color coding from VBASE2(Retter et al., 2005)). Next to the CDR-H3 sequence, we used different symbols to highlight what mAbs had the same CDR-H1, CDR-H2 and CDR-H3 sequences (i.e.CDRH1-H3 twin). MAbs with the same symbol (□, =,○,❖,■, ♦,⊙) are CDRH1-3 twins. On the right side of the table, cluster assignments from the various assayspresented in Figs. 3, 5 & 6 and Supplementary Fig. 4 are shown (gray scaling of clusters as shown in respective figures).
9S. Liao-Chan et al. / Journal of Immunological Methods 405 (2014) 1–14
it became apparent that VH sequencing also enabled establish-ment of relationships between mAb2[IgG2a]–mAb1[IgG1/2b]and mAb2[IgG1/2b]–mAb1[IgG2a] clusters: clusters 1 & awere closely related and all mAbs from these clusters werederived from the VHJ558, VHGAM3.8, and VH7183 families(Fig. 4). The VHJ558 family also gave rise to cluster c mAbs.Cluster 5 and b were related and contained mAbs from theVHJSM7 family. Cluster 2 contained mAbs from the VH3609family.
3.4. Comparison of cell-based clustering assay with a biosensor-based clustering assay
To validate the cell-based clustering assay with anestablished purified protein-based epitope binning assay(Abdiche et al., 2012; Abdiche et al., 2009; Estep et al., 2013),we analyzed all 43 mAbs by bio-layer interferometry (BLI)using an in-tandem assay format (Abdiche et al., 2009). Afterincubating theDPEP1-coated biosensor tipswith the first crudehybridoma supernatant (mAb1) or media, the biosensor wasdipped in the second crude hybridoma supernatant (mAb2).Sensorgram examples of 4 mAb2's profiled against 4 mAb1's
are shown in Supplementary Fig. 3. All 43mAbswere evaluatedas mAb1 and mAb2 so that a full pairwise two-dimensionalmatrix could be constructed. The binding response profile for amAb2 in combinationwith amAb1was normalized against thebinding response profile for that same mAb2 in combinationwith media to control for a decrease in binding capacity of theDPEP1-coated sensors by media components.
To compare the BLI biosensor-based assay data with thecell-based assay data, the normalized responses for the IgG2amAb2's were first graphed against the IgG1/2b mAb1's (Fig. 5A& B), followed by the normalized responses for the IgG1/2bmAb2's against the IgG2a mAb1's (Fig. 6A & B). In Fig. 5B, withan AU p-value cut-off at 95 and a Height cut-off at 0.2, threemAb2[IgG2a]–mAb1[IgG1/2b] biosensor clusters emerged.While eighteen IgG2a's fell into the same clusters in thecell-based and the biosensor-based assay, two mAb2's –
R48C2-5-01 and R48C2-5-04 – could not be assigned to acluster when using the biosensor-based method. In thereciprocal biosensor-based clustergram in which the IgG1/2bmAb2 relatedness was established, four clusters emergedbelow a Height cut-off at 0.2 with an AU p-value cut-off at 95(Fig. 6B). Two IgG1/2bmAb2's –R48C2-34-126&R48C2-34-30 –

BA
DC
1
1
5 2
R48
C1−
67−
18
R48
C1−
67−
19
R48
C2−
34−
04
R48
C2−
34−
43
R48
C2−
34−
09
R48
C2−
34−
01
R48
C1−
67−
40
R48
C1−
67−
03
R48
C2−
5−02
R48
C1−
67−
37
R48
C1−
67−
02
R48
C2−
5−12
R48
C2−
5−03
R48
C1−
67−
43
R48
C2−
34−
45
R48
C2−
34−
08
R48
C1−
67−
44
R48
C1−
67−
04
R48
C2−
5−04
R48
C2−
5−01
R48
C2−
5−14
R48
C2−
5−13
0.0
0.2 0.2
0.2
0.4
0.6
0.8
1.0
1.2
1.4
Hei
ght
949580100 68 8181 9784 9679 879898100
9054
5472
58
au
R48
C2−
5−01
R48
C2−
5−13
R48
C2−
5−14
R48
C1−
67−
19
R48
C1−
67−
18
R48
C2−
5−04
R48
C2−
34−
04
R48
C2−
34−
43
R48
C2−
5−03
R48
C2−
34−
09
R48
C1−
67−
44
R48
C2−
34−
08
R48
C2−
5−02
R48
C1−
67−
02
R48
C1−
67−
03
R48
C1−
67−
43
R48
C1−
67−
37
R48
C2−
5−12
R48
C2−
34−
45
R48
C1−
67−
04
R48
C1−
67−
40
R48
C2−
34−
01
0.0
0.2
0.4
0.6
0.8
1.0
1.2
Hei
ght
99100 969996100 8898 100100100 96 8979 7896 9394
100
99
au
2
Cluster:
Cluster:
# 1 2 3 4 5 6 7 8 9 10 11 12 13 14 15 16 17 18 19 20 21m
Ab
2[Ig
G2a
] \
mA
b1[
IgG
1/2b
]
R48
C2-
34-6
9
R48
C1-
67-5
3
R48
C1-
67-2
0
R48
C1-
67-3
4
R48
C1-
67-8
8
R48
C1-
67-2
1
R48
C1-
67-0
9
R48
C1-
67-4
1
R48
C1-
67-4
6
R48
C1-
67-0
8
R48
C2-
34-3
0
R48
C2-
34-8
0
R48
C2-
34-0
6
R48
C2-
34-4
2
R48
C2-
34-7
5
R48
C1-
67-3
3
R48
C1-
67-8
9
R48
C2-
34-1
26
R48
C2-
5-10
9
R48
C1-
67-9
0
R48
C1-
67-4
9
Pea
rso
n
mA
b2-
mA
b1
bio
sen
sor
clu
ster
1 R48C1-67-02 13 12 19 27 17 10 8 5 19 13 40 44 104 39 33 37 94 61 34 88 69 12 R48C2-5-12 10 12 21 30 22 14 10 9 18 10 39 43 85 39 35 37 72 50 31 63 59 0.98 13 R48C2-5-03 14 14 22 28 18 11 10 10 16 12 45 47 106 45 39 44 75 63 27 74 66 0.99 14 R48C1-67-44 8 6 13 17 9 3 4 3 10 8 37 44 102 30 23 37 74 54 22 70 69 0.99 15 R48C1-67-04 11 9 12 19 14 4 7 5 14 7 31 36 77 28 19 27 56 45 16 53 55 1.00 16 R48C1-67-43 11 12 19 26 15 6 8 7 14 9 53 54 108 45 33 36 71 61 25 74 76 0.99 17 R48C2-34-08 13 14 21 20 14 6 9 8 12 7 34 47 107 31 27 41 75 52 21 65 71 0.98 18 R48C2-34-45 12 11 18 23 13 8 9 7 17 11 39 48 91 32 28 48 80 55 24 74 68 0.98 19 R48C2-5-02 16 15 23 27 19 10 13 11 15 13 44 52 81 43 39 46 80 61 25 79 71 0.99 1
10 R48C1-67-37 11 10 20 29 18 12 12 11 13 13 37 49 66 35 33 38 71 59 32 61 60 0.98 111 R48C2-34-01 11 9 15 30 20 6 15 10 21 14 37 48 87 29 24 37 85 57 38 67 66 0.97 112 R48C1-67-40 7 4 6 20 10 1 10 5 10 5 31 43 90 26 19 34 90 52 41 79 55 0.99 113 R48C1-67-03 11 8 13 18 8 10 16 10 12 7 31 44 86 37 30 35 94 49 48 85 67 0.99 114 R48C2-34-09 13 11 20 27 14 0 7 7 19 -1 17 23 103 41 33 37 65 32 17 82 73 0.89 115 R48C2-34-04 17 11 17 27 18 6 17 12 14 11 37 58 120 50 34 24 59 55 27 16 13 0.63 516 R48C2-34-43 19 17 23 25 16 8 14 13 22 15 40 64 111 45 38 28 54 52 33 18 21 0.99 517 R48C2-5-04 14 16 31 35 24 13 14 12 19 12 37 16 28 20 25 -2 26 35 25 30 37 0.27 unassigned18 R48C2-5-14 25 54 44 77 61 11 14 18 19 -5 24 20 21 17 21 31 46 27 32 100 117 0.53 219 R48C2-5-13 21 44 29 40 21 -4 -6 11 1 -25 7 -1 11 6 10 13 35 15 29 139 156 0.93 220 R48C2-5-01 96 79 46 170 155 5 28 29 39 21 39 46 15 9 12 35 96 78 34 96 72 0.40 unassigned21 R48C1-67-18 14 85 65 219 201 106 94 72 -26 -40 -20 4 11 9 15 6 30 65 39 -3 12 0.62 unassigned22 R48C1-67-19 27 48 49 71 57 40 88 84 52 35 26 3 9 11 20 3 25 30 3 0 18 0.60 unassigned
Pearson 0.66 0.93 0.88 1.00 0.76 0.88 0.97 0.10 0.87 0.80 0.76 0.79 0.91 0.93 0.50 0.84 0.62 0.35 0.26 0.93
# 1 2 3 4 5 6 7 8 9 10 11 12 13 14 15 16 17 18 19 20 21 22
mA
b2[
IgG
2a]
\ m
Ab
1[Ig
G2a
]
R48
C1-
67-0
2
R48
C2-
34-0
1
R48
C2-
34-0
8
R48
C1-
67-4
4
R48
C1-
67-0
4
R48
C1-
67-4
0
R48
C2-
5-12
R48
C2-
34-4
5
R48
C2-
5-02
R48
C2-
5-03
R48
C2-
5-04
R48
C1-
67-0
3
R48
C2-
34-0
9
R48
C1-
67-3
7
R48
C1-
67-4
3
R48
C2-
5-13
R48
C2-
5-14
R48
C2-
5-01
R48
C1-
67-1
8
R48
C1-
67-1
9
R48
C2-
34-4
3
R48
C2-
34-0
4
Pea
rso
n
mA
b2-
mA
b1
bio
sen
sor
clu
ster
1 R48C1-67-02 8 12 9 15 11 16 4 12 8 8 10 12 15 11 15 61 41 67 96 42 9 14 12 R48C1-67-03 6 10 7 11 10 12 3 10 6 7 6 6 9 4 10 52 34 53 88 40 4 9 0.99 13 R48C2-5-02 13 17 13 19 16 22 8 17 9 12 13 15 17 11 15 55 33 57 79 40 9 19 0.99 14 R48C2-5-03 11 16 14 21 16 25 6 19 13 13 16 16 16 9 19 61 41 59 74 43 11 20 0.99 15 R48C2-34-08 8 10 11 16 12 18 4 14 7 8 8 11 12 6 13 65 48 70 87 41 7 14 0.99 16 R48C1-67-44 4 6 5 9 6 12 0 7 1 3 4 5 6 1 6 60 45 71 83 41 3 7 1.00 17 R48C2-34-09 5 9 6 15 10 18 -2 14 3 5 5 6 10 0 9 61 32 49 66 32 4 14 0.97 18 R48C2-34-04 12 15 11 16 14 21 4 12 5 6 7 8 13 2 9 66 38 61 53 37 7 11 0.97 19 R48C2-34-43 14 16 12 18 15 21 7 15 10 13 13 13 16 0 14 63 40 66 50 39 9 17 0.99 1
10 R48C2-5-12 20 22 20 28 25 30 12 24 20 21 20 21 25 12 27 55 29 49 76 51 15 26 0.87 111 R48C2-34-45 8 11 9 13 9 16 4 12 6 6 7 11 11 6 12 42 18 46 85 47 6 12 0.98 112 R48C1-67-40 0 4 2 5 3 8 -1 5 -1 -2 2 2 3 3 2 35 13 35 98 44 1 2 0.99 113 R48C2-34-01 6 8 6 11 8 12 2 9 3 6 6 9 8 7 8 36 17 35 94 47 4 9 1.00 114 R48C1-67-04 4 8 6 10 8 12 1 7 3 4 4 7 8 3 5 30 13 33 90 32 4 12 0.99 115 R48C1-67-43 7 11 7 14 10 19 2 13 6 5 7 10 12 4 10 34 6 15 68 41 -1 8 0.93 116 R48C1-67-37 18 19 19 20 19 25 12 21 17 18 19 22 22 12 19 33 17 21 69 53 18 22 0.97 117 R48C2-5-04 16 23 21 29 24 31 9 27 19 19 20 21 28 12 24 69 37 62 21 20 14 26 0.11 unassigned18 R48C2-5-14 49 70 57 68 84 86 54 70 47 52 44 40 45 9 18 43 14 22 39 34 24 40 -0.08 219 R48C2-5-13 47 62 42 63 75 79 46 62 25 25 25 23 29 -4 -3 27 -6 2 28 19 9 17 0.98 220 R48C2-5-01 89 101 72 80 84 114 67 84 51 44 34 42 60 7 7 16 7 8 73 40 44 61 0.90 221 R48C1-67-18 110 126 88 93 97 117 84 110 63 57 40 52 79 57 32 41 15 33 23 24 0 4 0.73 unassigned22 R48C1-67-19 46 55 37 48 57 79 45 74 40 36 27 15 30 53 33 37 3 11 21 25 1 15 0.86 unassigned
Pearson 1.00 0.99 0.99 0.99 0.99 0.99 0.99 0.98 0.99 0.98 0.94 0.97 0.63 0.81 0.23 0.91 0.97 0.34 0.77 0.13 0.97
Fig. 5. Biosensor-based clustering assay for IgG2a detection mAbs. (A, B) Twenty-two IgG2a detection mAbs profiled against twenty-one IgG1/2b blocking mAbsusing the biosensor-based clustering assay. Two-dimensional matrix with normalized binding response (A) and clustergram (B) for twenty-two IgG2a detectionmAb2's. At an AU p-value cut-off at 95 and a Height cut-off at 0.2, 3 clusters (1, 2 & 5) are present in the clustergram (B) and cluster assignment for the detectionmAb2's is listed in the right-most column of the matrix (A). (C, D) Twenty-two IgG2a detection mAbs profiled against same twenty-two IgG2a blocking mAbsusing the biosensor-based clustering assay. Two-dimensional matrix with normalized binding response (C) and clustergram (D) for twenty-two IgG2a detectionmAb2's. Two clusters are present in the clustergram (D) with a Height cut-off at 0.2: cluster 1 is defined at an AU p-value cut-off at 92 and cluster 2 is defined at anAU p-value cut-off at 95. Cluster assignment for the detection mAb2's is listed in the right-most column of the matrix (C). Data display and gray scaling as in Fig. 1.
10 S. Liao-Chan et al. / Journal of Immunological Methods 405 (2014) 1–14
fell into a new cluster (cluster e), one related to cluster a. WhileR48C1-34-6 no longer fell into cluster c, R48C1-67-21 wasassigned to cluster a (Fig. 5B). The other seventeen IgG1/2bmAb2's clustered in a similar manner in the cell-based andbiosensor-based assay. In light of the VH sequencing data, itseemedmore appropriate to set the Height cut-offs at 0.2 in thebiosensor-based assays, because cluster fragmentation oc-curred at lower Height cut-offs. For example, cluster a in Fig.6A fragmented into multiple clusters at a Height cut-off of 0.1with classification of mAbs from the same VH clonotype –
R48C1-67-08 and R48C1-67-46 – into different clusters(Section 3.3). Overall, good agreement was observedbetween the cell-based and biosensor-based assays withHeight cut-offs at 0.1 and 0.2, respectively.
A full pairwise comparison cannot be conducted whenusing the cell-based clustering assay, because mAbs with thesame isotype cannot be tested against each other.We postulatethat as long as the diversity of the blocking mAb1 collection isequivalent to the diversity of the detection mAb2 collection, afull pairwise comparison is not required. To establish whether
mAb binding-site diversity was equivalent in the set of 22IgG2a mAbs and the set of 21 IgG1/2b mAbs, we derived atwo-dimensional matrix and clustergram in which the IgG2a'swere profiled both as mAb1 and mAb2 (Fig. 5C & D). Clusterswere defined at an AU p-value cut-off at 95 and a Height cut-offat 0.2, with the exception of cluster 1. In light of the VH
sequencing data, it seemed more appropriate to set the AUp-value cut-off for cluster 1 at 92, so that VH clonotypes 4 & 7did not segregate into 2 separate clusters (Section 3.3).When cluster assignments between themAb2[IgG2a]–mAb1[IgG1/2b] clustergram (Fig. 5B) and the mAb2[IgG2a]–mAb1[IgG2a] clustergram (Fig. 5D) were compared, few differ-ences were observed — cluster 5 was part of cluster 1 andR48C2-5-4 fell into cluster 2 (Fig. 5D). The two-dimensionalmatrix and clustergram in which the IgG1/2b mAbs wereassayed both as mAb1 and mAb2 (Fig. 6C & D) were alsoequivalent to the matrix and clustergram in which the IgG1/2bmAbs were profiled as mAb2 against the IgG2a mAbs as mAb1(Fig. 6A & B), with one exception — R48C1-67-21 did not fallinto a cluster (Fig. 6D), similar to what was seen in the
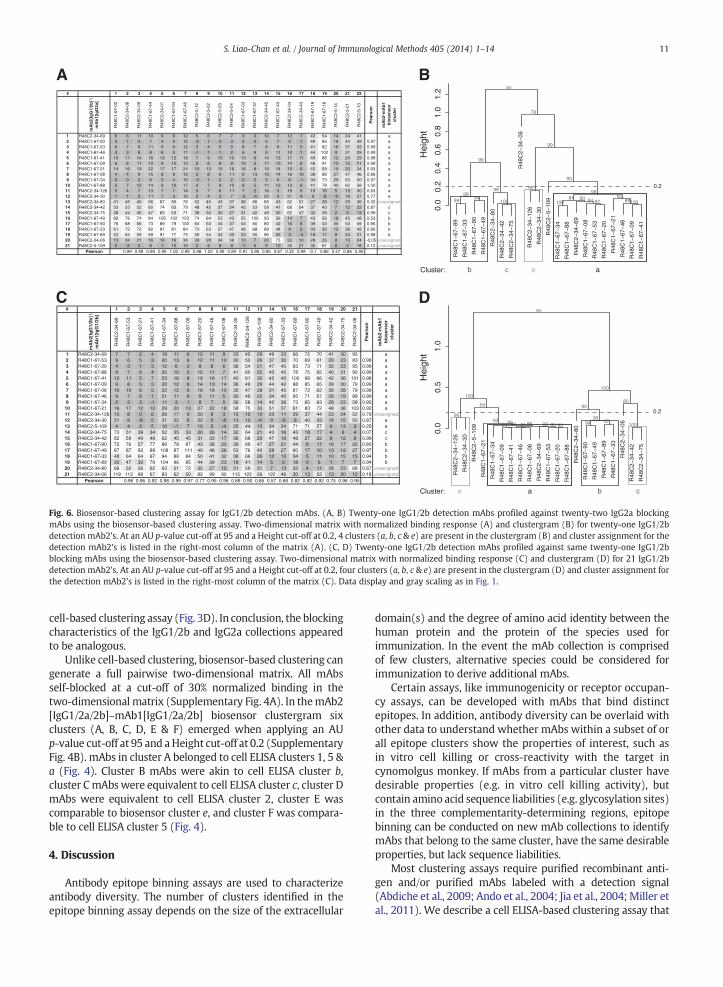
BA
DC
b aec
R48
C1−
67−
89
R48
C1−
67−
33
R48
C1−
67−
90
R48
C1−
67−
49
R48
C2−
34−
80
R48
C2−
34−
42
R48
C2−
34−
75
R48
C2−
34−
06
R48
C2−
34−
126
R48
C2−
34−
30
R48
C2−
5−10
9
R48
C1−
67−
34
R48
C1−
67−
88
R48
C2−
34−
69
R48
C1−
67−
08
R48
C1−
67−
53
R48
C1−
67−
20
R48
C1−
67−
21
R48
C1−
67−
46
R48
C1−
67−
09
R48
C1−
67−
41
0.0
0.2 0.2
0.2
0.4
0.6
0.8
1.0
1.2
Hei
ght
R48
C2−
34−
126
R48
C2−
34−
30
R48
C2−
5−10
9
R48
C1−
67−
21
R48
C1−
67−
34
R48
C1−
67−
09
R48
C1−
67−
41
R48
C1−
67−
46
R48
C1−
67−
08
R48
C2−
34−
69
R48
C1−
67−
53
R48
C1−
67−
20
R48
C1−
67−
88
R48
C2−
34−
80
R48
C1−
67−
90
R48
C1−
67−
49
R48
C1−
67−
89
R48
C1−
67−
33
R48
C2−
34−
06
R48
C2−
34−
42
R48
C2−
34−
75
0.0
0.5
1.0
Hei
ght
9993 90 95 10086 9398 9496 5793 9596
905980
100
100
au
e ba c
100 10097100 899499 908494 9599 9899 99
95
99
99
78
au
Cluster:
Cluster:
# 1 2 3 4 5 6 7 8 9 10 11 12 13 14 15 16 17 18 19 20 21 22m
Ab
2[Ig
G1/
2b]
\ m
Ab
1[Ig
G2a
]
R48
C1-
67-0
2
R48
C2-
34-0
8
R48
C2-
34-0
9
R48
C1-
67-4
4
R48
C2-
34-0
1
R48
C1-
67-0
4
R48
C1-
67-4
0
R48
C2-
5-12
R48
C2-
5-02
R48
C2-
5-03
R48
C2-
5-04
R48
C1-
67-0
3
R48
C1-
67-3
7
R48
C2-
34-4
5
R48
C1-
67-4
3
R48
C2-
34-0
4
R48
C2-
34-4
3
R48
C1-
67-1
9
R48
C1-
67-1
8
R48
C2-
5-14
R48
C2-
5-01
R48
C2-
5-13
Pea
rso
n
mA
b2-
mA
b1
bio
sen
sor
clu
ster
1 R48C2-34-69 6 6 11 10 9 6 12 5 6 7 7 9 3 10 7 12 7 43 54 14 34 41 a2 R48C1-67-20 3 1 4 7 4 5 10 -2 1 2 3 2 0 5 7 5 1 49 85 18 43 39 0.97 a3 R48C1-67-53 6 7 9 11 9 6 12 3 4 5 5 8 7 8 9 11 5 41 82 16 37 33 0.99 a4 R48C1-67-46 3 3 6 8 6 5 11 -1 1 1 2 6 9 5 11 10 1 44 102 9 31 29 0.99 a5 R48C1-67-41 10 11 14 16 13 12 18 7 9 10 10 13 6 14 13 17 11 49 88 12 24 29 0.98 a6 R48C1-67-09 6 8 11 12 9 10 13 5 8 8 8 10 5 11 10 14 8 46 91 10 15 21 0.99 a7 R48C1-67-21 14 16 19 22 17 17 24 10 13 15 16 16 8 19 18 13 6 42 59 19 20 34 0.93 a8 R48C1-67-08 4 4 9 15 6 9 12 2 8 9 11 9 13 10 14 16 10 38 88 27 47 46 0.86 a9 R48C1-67-34 0 0 2 6 3 4 10 -3 1 2 2 0 2 5 6 6 -1 34 73 29 53 50 0.97 a
10 R48C1-67-88 5 7 10 14 9 10 17 4 7 9 10 8 5 11 12 13 6 41 78 40 62 58 1.00 a11 R48C2-34-126 5 4 7 13 7 7 14 5 7 6 11 7 2 16 5 18 9 19 16 5 15 30 0.63 e12 R48C2-34-30 1 1 2 11 7 3 15 2 4 3 7 -2 -4 20 4 21 4 9 -8 -9 18 27 0.77 e13 R48C2-34-80 41 45 40 56 67 65 76 52 45 43 37 36 66 65 43 62 51 27 26 12 29 36 0.32 unassigned14 R48C2-34-42 53 53 52 60 74 65 79 48 42 37 34 42 53 59 41 66 54 37 43 7 12 22 0.87 c15 R48C2-34-75 38 44 40 47 62 53 71 38 33 30 27 31 42 48 30 62 47 32 39 2 5 13 0.99 c16 R48C1-67-49 69 76 74 84 105 102 123 74 64 53 43 55 100 93 56 14 7 43 56 16 45 48 0.53 b17 R48C1-67-90 76 68 56 73 89 79 100 64 53 44 37 44 80 80 42 16 8 39 43 35 53 59 0.95 b18 R48C1-67-33 61 72 72 82 91 81 84 70 63 57 47 46 68 89 48 9 2 33 30 15 36 42 0.90 b19 R48C1-67-89 53 65 59 69 91 77 75 59 54 42 33 33 55 96 25 3 -4 18 17 9 24 31 0.98 b20 R48C2-34-06 13 24 21 16 16 16 38 29 28 34 36 13 7 20 75 22 10 28 25 8 13 24 -0.05 unassigned21 R48C2-5-109 0 -3 0 8 1 10 15 2 8 8 8 -1 6 9 10 33 21 32 61 0 4 18 0.12 unassigned
Pearson 0.99 0.99 0.99 0.99 1.00 0.99 0.98 1.00 0.99 0.99 0.91 0.96 0.95 0.67 0.32 0.99 -0.1 0.86 0.47 0.86 0.95
# 1 2 3 4 5 6 7 8 9 10 11 12 13 14 15 16 17 18 19 20 21
mA
b2[
IgG
1/2b
] \
mA
b1[
IgG
1/2b
]
R48
C2-
34-6
9
R48
C1-
67-5
3
R48
C1-
67-2
1
R48
C1-
67-4
1
R48
C1-
67-3
4
R48
C1-
67-8
8
R48
C1-
67-0
9
R48
C1-
67-2
0
R48
C1-
67-4
6
R48
C1-
67-0
8
R48
C2-
34-3
0
R48
C2-
34-1
26
R48
C2-
5-10
9
R48
C2-
34-8
0
R48
C1-
67-3
3
R48
C1-
67-8
9
R48
C1-
67-9
0
R48
C1-
67-4
9
R48
C2-
34-4
2
R48
C2-
34-7
5
R48
C2-
34-0
6
Pea
rso
n
mA
b2-
mA
b1
bio
sen
sor
clu
ster
1 R48C2-34-69 7 7 2 4 18 11 6 12 11 9 33 45 29 49 33 66 72 70 41 30 95 a2 R48C1-67-53 9 6 5 3 20 13 6 12 11 10 30 50 26 37 30 70 69 61 29 23 83 0.98 a3 R48C1-67-20 4 3 1 3 12 6 2 8 8 6 36 54 21 47 45 83 73 71 32 23 95 0.99 a4 R48C1-67-88 9 7 6 4 20 10 5 15 11 7 41 60 22 43 45 78 75 65 40 31 90 0.99 a5 R48C1-67-41 12 11 5 7 23 16 8 19 16 17 40 61 30 45 40 100 98 66 42 36 101 0.98 a6 R48C1-67-09 9 8 5 5 20 12 6 14 13 14 36 49 29 44 42 88 85 65 39 30 79 0.99 a7 R48C1-67-08 10 10 8 5 22 12 6 16 18 10 35 47 28 31 45 87 72 62 36 28 79 0.99 a8 R48C1-67-46 9 7 6 1 21 11 6 9 11 5 30 49 22 34 40 95 71 67 26 19 88 0.99 a9 R48C1-67-34 2 3 3 -1 11 3 1 8 7 5 36 58 14 42 36 73 65 63 28 23 58 0.95 a
10 R48C1-67-21 16 17 12 12 29 20 13 27 22 18 58 75 33 51 37 61 83 72 48 38 103 0.92 a11 R48C2-34-126 15 8 0 6 26 17 9 20 8 3 15 10 10 23 11 29 37 44 23 24 52 0.79 unassigned12 R48C2-34-30 21 8 -8 5 31 22 8 22 2 -8 13 12 -4 9 -5 8 40 33 18 15 50 0.87 e13 R48C2-5-109 4 4 3 5 10 -1 7 10 5 -4 25 44 13 34 24 71 71 57 6 13 3 0.25 e14 R48C2-34-75 73 51 39 34 52 35 33 20 26 14 32 64 21 43 16 43 18 17 4 6 4 0.07 c15 R48C2-34-42 82 59 49 48 62 45 45 31 33 17 36 68 29 47 19 46 27 22 8 12 8 0.99 c16 R48C1-67-90 72 76 57 77 86 78 87 43 38 23 39 69 47 27 21 44 8 11 16 17 25 0.80 b17 R48C1-67-49 87 67 82 88 108 87 111 49 46 26 53 76 40 28 27 60 17 10 13 12 27 0.97 b18 R48C1-67-33 48 64 64 67 94 88 84 50 41 32 38 66 26 12 13 34 5 11 10 15 15 0.94 b19 R48C1-67-89 30 47 32 79 104 96 85 44 39 23 18 41 14 5 0 18 0 6 1 7 7 0.94 b20 R48C2-34-80 66 52 56 62 63 51 72 35 27 12 31 59 31 7 13 33 4 11 28 23 68 0.67 unassigned21 R48C2-34-06 119 113 88 67 83 62 50 82 99 90 115 122 56 122 46 30 13 52 13 20 12 0.18 unassigned
Pearson 0.96 0.96 0.92 0.98 0.99 0.97 0.77 0.95 0.96 0.89 0.90 0.85 0.57 0.66 0.82 0.82 0.92 0.75 0.96 0.95
Fig. 6. Biosensor-based clustering assay for IgG1/2b detection mAbs. (A, B) Twenty-one IgG1/2b detection mAbs profiled against twenty-two IgG2a blockingmAbs using the biosensor-based clustering assay. Two-dimensional matrix with normalized binding response (A) and clustergram (B) for twenty-one IgG1/2bdetection mAb2's. At an AU p-value cut-off at 95 and a Height cut-off at 0.2, 4 clusters (a, b, c & e) are present in the clustergram (B) and cluster assignment for thedetection mAb2's is listed in the right-most column of the matrix (A). (C, D) Twenty-one IgG1/2b detection mAbs profiled against same twenty-one IgG1/2bblocking mAbs using the biosensor-based clustering assay. Two-dimensional matrix with normalized binding response (C) and clustergram (D) for 21 IgG1/2bdetection mAb2's. At an AU p-value cut-off at 95 and a Height cut-off at 0.2, four clusters (a, b, c & e) are present in the clustergram (D) and cluster assignment forthe detection mAb2's is listed in the right-most column of the matrix (C). Data display and gray scaling as in Fig. 1.
11S. Liao-Chan et al. / Journal of Immunological Methods 405 (2014) 1–14
cell-based clustering assay (Fig. 3D). In conclusion, the blockingcharacteristics of the IgG1/2b and IgG2a collections appearedto be analogous.
Unlike cell-based clustering, biosensor-based clustering cangenerate a full pairwise two-dimensional matrix. All mAbsself-blocked at a cut-off of 30% normalized binding in thetwo-dimensional matrix (Supplementary Fig. 4A). In themAb2[IgG1/2a/2b]–mAb1[IgG1/2a/2b] biosensor clustergram sixclusters (A, B, C, D, E & F) emerged when applying an AUp-value cut-off at 95 and aHeight cut-off at 0.2 (SupplementaryFig. 4B). mAbs in cluster A belonged to cell ELISA clusters 1, 5 &a (Fig. 4). Cluster B mAbs were akin to cell ELISA cluster b,cluster CmAbs were equivalent to cell ELISA cluster c, cluster DmAbs were equivalent to cell ELISA cluster 2, cluster E wascomparable to biosensor cluster e, and cluster F was compara-ble to cell ELISA cluster 5 (Fig. 4).
4. Discussion
Antibody epitope binning assays are used to characterizeantibody diversity. The number of clusters identified in theepitope binning assay depends on the size of the extracellular
domain(s) and the degree of amino acid identity between thehuman protein and the protein of the species used forimmunization. In the event the mAb collection is comprisedof few clusters, alternative species could be considered forimmunization to derive additional mAbs.
Certain assays, like immunogenicity or receptor occupan-cy assays, can be developed with mAbs that bind distinctepitopes. In addition, antibody diversity can be overlaid withother data to understand whether mAbs within a subset of orall epitope clusters show the properties of interest, such asin vitro cell killing or cross-reactivity with the target incynomolgus monkey. If mAbs from a particular cluster havedesirable properties (e.g. in vitro cell killing activity), butcontain amino acid sequence liabilities (e.g. glycosylation sites)in the three complementarity-determining regions, epitopebinning can be conducted on new mAb collections to identifymAbs that belong to the same cluster, have the same desirableproperties, but lack sequence liabilities.
Most clustering assays require purified recombinant anti-gen and/or purified mAbs labeled with a detection signal(Abdiche et al., 2009; Ando et al., 2004; Jia et al., 2004;Miller etal., 2011). We describe a cell ELISA-based clustering assay that

12 S. Liao-Chan et al. / Journal of Immunological Methods 405 (2014) 1–14
uses crude hybridoma supernatants and cells expressing thehuman antigen of interest. This cell-based assay can be used toscreen large hybridoma collections. We show that this assay iscomparable to a biosensor-based clustering assay and that thecell ELISA clusters largely parallel themAbdiversity establishedby VH sequencing.
4.1. Defining mAb clusters
In this report we used a two-dimensional matrix andhierarchical clustering of the mAb1 blocking profiles to assessmAb2 diversity (Miller et al., 2011; Suzuki and Shimodaira,2006). Clusters were defined top-down below a manually setHeight cut-off on the y-axiswith calculated AUp-values greaterthan 90 to 95. Failure to use a Height cut-off results in reportingfewer clusters that contain dissimilar mAbs. For example,without a Height cut-off, only 2 clusters with an AU p-valuecut-off at 95 emerged in Fig. 6B: from left to right, the firstcluster contained 7 mAbs, placing R48C2-34-80 and clustersb & c mAbs together. However, the blocking profiles forR48C2-34-80 and clusters b & c mAbs in the two-dimensionalmatrix were clearly distinct (Fig. 6A). While a Height cut-offthat is too high results in establishment of clusters withdissimilar mAbs, a Height cut-off that is too low triggers theopposite — i.e. similar mAbs segregate into multiple clusters.
Furthermore, assay reproducibility and VH sequencing on asmaller hybridoma subset can be used to set and potentiallyadjust theHeight andAUp-value cut-offs. For example, the IgG2amAb2 clusters were identical in the replicate assays at Heightand AU p-value cut-offs at 0.1 and 95, respectively (Fig. 3B &Supplementary Fig. 2B), and appeared to be biologically mean-ingful, because mAbs from the same VH clonotype did notsegregate into multiple clusters (Fig. 4). Importantly, theadjusted cut-offs can be applied to the first clustering assay tore-assess mAb diversity in the large hybridoma collection. Forexample, the replicate assays reassign R48C2-34-4 & R48C2-34-42 to cluster 5, a cluster related to, but distinct from cluster 1(Fig. 3B & Supplementary Fig. 2B). When inspecting cluster 1 inthe large-scale clustering assay (Fig. 2B), R48C2-34-4, R48C2-34-42 and three other hybridomas (all on the far-left in cluster 1;R48C2-34-22, R48C2-34-47 and R48C2-34-12) appear to bedistinct from the other hybridomas in cluster 1.
4.2. Antibodies as blocking or detection mAbs in the cell-basedclustering assay
When working with mouse mAbs, an inherent feature ofthe cell-based clustering assay is thatmAbdiversity can only beinterrogated between isotype classes. In the event class switchrecombination is biased heavily towards a particular isotype,the method could be limiting. Alternatively, newly isolatedmAbs from other species (e.g. rat or human) could easily becompared with known mouse mAbs by using the appropriatesecondary antibodies.
In this report, we carry out the cell-based clustering assay intwo formats by using the murine blocking mAb1's as murinedetection mAb2's, and vice versa. Once all mAbs have beenprofiled as detection mAb2's, they are assigned to a mAb2–mAb1 cluster. We consider mAb2[IgG2a]–mAb1[IgG1/2b] clus-ters related to mAb2[IgG1/2b]–mAb1[IgG2a] clusters and viceversawhen at least half of the blockingmAb1's from a particular
cluster (blocking mAb1's assigned to clusters when assayed asdetection mAb2's) block the detection mAb2's of a particularcluster by at least 50%. In the rightmost columns in Fig. 3A & C,cluster relationshipswere not symmetrical. For example, cluster1 in Fig. 3A was related to cluster a, whereas cluster a in Fig. 3Cwas related to clusters 1 & 5. Cluster asymmetry is due to thefact that certainmAbs do not exhibit the same binding profile inboth assay orientations, a phenomenon described by others asasymmetry in the blocking matrix (Abdiche et al., 2009; Nagataet al., 2004). A possible explanation for this asymmetry is thatthese mAbs have poor binding properties. However, theoff-rates for all mAbs were reasonable (Supplementary Table2). As an alternate explanation, epitope–paratope interaction 1could block accessibility of epitope 2 for paratope 2 due to steric,electrostatic or allosteric effects, but the reciprocal is notnecessarily true, resulting in asymmetry in the blocking matrix.To establish and validate the cell-based clustering assaywe onlyestablished mAb2 clustergrams by using the mAb1 blockingprofiles for the different mAb2's. However, one can also look atmAb1 relatedness by generating a clustergram using the mAb2competition profiles for the various mAb1's.
We recommend selecting mAbs from both isotype classesfor further characterization, not only to confirm mAbbinding-site diversity, but also to obtain greater mAbsequence diversity. While the blocking properties of theDPEP1 IgG2a mAb and IgG1/2b mAb groups were equivalent,less sequence redundancy was observed between the twoisotype classes, because somatic hypermutation occurs uponclass switch recombination (Keim et al., 2013). In Fig. 4, wereported 7 pairs of CDRH1-3 twin sequences — only 2 out ofthe 7 pairs contain different isotypes.
4.3. VH sequencing to corroborate cluster assignments
VH sequencing was useful as a technique to validate mAbdiversity captured by the cell-based clustering assay. Uponheavy chain variable region sequencing, we assigned anti-bodies to VH families and VH clonotypes. Because mAbs thatfell into the same VH clonotype did not belong to dissimilarcell ELISA clusters, we feel that AU p-value cut-offs between90 and 95 were appropriate for mAb categorization. Wereported 5 VH families and 22 VH clonotypes for the 43 DPEP1antibodies used to evaluate the reproducibility of thecell-based clustering assay. VH family usage within clusterssuggested that for a given epitope, only a fewmembers of thegerm-line repertoire were used to establish the correspond-ing paratope. The DPEP1 hybridomaswere derived from threedifferent fusions: R48C1-67, R48C2-34 and R48C2-5. Within aspecific VH clonotype containing multiple mAbs (13 out of 22clonotypes contain more than 1 mAb), we did not observemAbs derived from different fusions, supporting the notionthat mAbs belonging to the same VH clonotype are derivedfrom a single B cell lineage. Also, 3 VH clonotypes (10, 13, 20)contained mAbs with different isotypes, further supportingthe assumption that the IgG1/2b and IgG2a mAb collectionscontain mAbs with comparable epitopes. Two DPEP1mAb clusters that did not undergo VH sequencing – clusters3 & 4 (Fig. 2B) – potentially contain additional VH sequencediversity.
In addition, VH sequencing was used to make adjustmentsto a small subset of the biosensor-based cluster assignments.

13S. Liao-Chan et al. / Journal of Immunological Methods 405 (2014) 1–14
For example, we adjusted the AU p-value cut-off to 92 forcluster 1 in one of the biosensor-based assays (Fig. 5D),because mAbs from the same VH clonotypes segregated at anAU p-value cut-off of 95.
4.4. Cell-based versus biosensor-based clustering assays
The cell-based clustering assay was validated against abiosensor-based method. Overall, mAb2 cluster assignmentswere similar in both assays (Fig. 4). Small differences incluster assignments between the two assay formats could beattributable to assay-specific characteristics. While 2 mAbs –
R48C2-34-30 & R48C2-34-126 – fell into cluster a in thecell-based assay, they fell into cluster e in the biosensor-basedassay. Three mAbs – R48C2-34-6, R48C2-5-4, and R48C2-5-1 –
fell into clusters in the cell-based assay, but could not beassigned to a cluster in the biosensor-based assay. One mAb –
R48C1-67-21 – remained unassigned in the cell-based assay,and fell into cluster a in the biosensor-based assay. Some assaycharacteristics that may amplify differences between thetwo approaches include, but are not limited to the following:(1) turnover of the protein at the cell surface in the cell-basedassay when the wash, fixation step, and wash between mAb1andmAb2 incubation are omitted (Supplementary Fig. 1C&D);(2) non-native conformation and/or aggregated protein in thebiosensor-based assay; (3)media interference in the cell-basedand/or biosensor-based assay.
5. Conclusion
In this report we describe a cell-based clustering assay thatenables assessment of mAb diversity in large crude hybridomasupernatant collections using engineered cells that express ahuman target of interest.We show that the assay is reproducibleand produces results equivalent to a biosensor-based clusteringassay and consistent with clustering based on VH sequencing.Importantly, we have also successfully used the cell-basedclustering assay to cluster mAb collections against variousmembrane proteins with multiple extracellular domains forwhich recombinant protein fragments are not available (datanot shown). While we carried out the cell-based clusteringassay with an engineered cell line, the cell-based clusteringassaymay be performedwith established, endogenous express-ing cell lines that are amenable to cell-based ELISAs.
Supplementary data to this article can be found online athttp://dx.doi.org/10.1016/j.jim.2013.12.007.
Acknowledgments
We would like to thank Thi-Sau Migone, DianeHollenbaugh and Scott Klakamp for proofreading the article,Karl Schweighofer for help with the R package pvclust forhierarchical clustering, Zhi-Wei Li for the sarcoma cell lineexpressing DPEP1, and Barbara Daine-Matsuoka for helpwith hybridoma cloning.
References
Abdiche, Y.N., Malashock, D.S., Pinkerton, A., Pons, J., 2009. Exploringblocking assays using Octet, ProteOn, and Biacore biosensors. Anal.Biochem. 386, 172.
Abdiche, Y.N., Lindquist, K.C., Stone, D.M., Rajpal, A., Pons, J., 2012. Label-freeepitope binning assays of monoclonal antibodies enable the identifica-tion of antigen heterogeneity. J. Immunol. Methods 382, 101.
Ando, T., Latif, R., Daniel, S., Eguchi, K., Davies, T.F., 2004. Dissecting linearand conformational epitopes on the native thyrotropin receptor.Endocrinology 145, 5185.
Beck, A., Wurch, T., Bailly, C., Corvaia, N., 2010. Strategies and challengesfor the next generation of therapeutic antibodies. Nat. Rev. Microbiol. 10,345.
Byrd, J.C., Kipps, T.J., Flinn, I.W., Cooper, M., Odenike, O., Bendiske, J., Rediske,J., Bilic, S., Dey, J., Baeck, J., O'Brien, S., 2012. Phase I study of the anti-CD40 humanized monoclonal antibody lucatumumab (HCD122) inrelapsed chronic lymphocytic leukemia. Leuk. Lymphoma 53, 2136.
Dong, J., Demarest, S.J., Sereno, A., Tamraz, S., Langley, E., Doern, A., Snipas, T.,Perron, K., Joseph, I., Glaser, S.M., Ho, S.N., Reff, M.E., Hariharan, K., 2010.Combination of two insulin-like growth factor-I receptor inhibitoryantibodies targeting distinct epitopes leads to an enhanced antitumorresponse. Mol. Cancer Ther. 9, 2593.
Estep, P., Reid, F., Nauman, C., Liu, Y., Sun, T., Sun, J., Xu, Y., 2013. Highthroughput solution-based measurement of antibody–antigen affinityand epitope binning. mAbs 5, 270.
Fagerstam, L.G., Frostell, A., Karlsson, R., Kullman,M., Larsson, A., Malmqvist, M.,Butt, H., 1990. Detection of antigen–antibody interactions by surfaceplasmon resonance. Application to epitope mapping. J. Mol. Recognit. 3,208.
Fendly, B.M., Winget, M., Hudziak, R.M., Lipari, M.T., Napier, M.A., Ullrich, A.,1990. Characterization of murine monoclonal antibodies reactive toeither the human epidermal growth factor receptor or HER2/neu geneproduct. Cancer Res. 50, 1550.
Hellstrom, K.E., Yelton, D.E., Fell, H.P., Beaton, D., Gayle, M., MacLean, M., Kahn,M.,Hellstrom, I., 1990. Epitope mapping and use of anti-idiotypic antibodies tothe L6 monoclonal anticarcinoma antibody. Cancer Res. 50, 2449.
Jia, X.C., Raya, R., Zhang, L., Foord, O., Walker, W.L., Gallo, M.L., Haak-Frendscho, M., Green, L.L., Davis, C.G., 2004. A novel method ofmultiplexed competitive antibody binning for the characterization ofmonoclonal antibodies. J. Immunol. Methods 288, 91.
Jones, S.T., Bendig, M.M., 1991. Rapid PCR-cloning of full-length mouseimmunoglobulin variable regions. Biotechnology 9, 579.
Keim, C., Kazadi, D., Rothschild, G., Basu, U., 2013. Regulation of AID, the B-cell genome mutator. Gene Dev. 27, 1.
Keynan, S., Asipu, A., Hooper, N.M., Turner, A.J., Blair, G.E., 1997. Stableand temperature-sensitive transformation of baby rat kidney cells bySV40 suppresses expression of membrane dipeptidase. Oncogene 15,1241.
Koefoed, K., Steinaa, L., Soderberg, J.N., Kjaer, I., Jacobsen, H.J., Meijer, P.J.,Haurum, J.S., Jensen, A., Kragh, M., Andersen, P.S., Pedersen, M.W., 2011.Rational identification of an optimal antibody mixture for targeting theepidermal growth factor receptor. mAbs 3, 584.
Matsushita, H., Vesely, M.D., Koboldt, D.C., Rickert, C.G., Uppaluri, R., Magrini,V.J., Arthur, C.D., White, J.M., Chen, Y.S., Shea, L.K., Hundal, J., Wendl,M.C., Demeter, R., Wylie, T., Allison, J.P., Smyth, M.J., Old, L.J., Mardis, E.R.,Schreiber, R.D., 2012. Cancer exome analysis reveals a T-cell-dependentmechanism of cancer immunoediting. Nature 482, 400.
Miller, P.L., Wolfert, R.L., Diedrich, G., 2011. Epitope binning of murinemonoclonal antibodies by a multiplexed pairing assay. J. Immunol. Methods365, 118.
Murphy, K.P., Janeway, C., Travers, P., Walport, M., 2008. Janeway'sImmunobiology, 7th edn. Garland Science, New York.
Nagata, S., Numata, Y., Onda, M., Ise, T., Hahn, Y., Lee, B., Pastan, I., 2004.Rapid grouping of monoclonal antibodies based on their topographicalepitopes by a label-free competitive immunoassay. J. Immunol.Methods 292, 141.
Nakamura, G.R., Fonseca, D.P., O'Rourke, S.M., Vollrath, A.L., Berman, P.W.,2012. Monoclonal antibodies to the V2 domain of MN-rgp120: finemapping of epitopes and inhibition of alpha4beta7 binding. PLoS ONE7, e39045.
Niederfellner, G., Lammens, A., Mundigl, O., Georges, G.J., Schaefer, W.,Schwaiger, M., Franke, A., Wiechmann, K., Jenewein, S., Slootstra, J.W.,Timmerman, P., Brannstrom, A., Lindstrom, F., Mossner, E., Umana, P.,Hopfner, K.P., Klein, C., 2011. Epitope characterization and crystalstructure of GA101 provide insights into the molecular basis for type I/II distinction of CD20 antibodies. Blood 118, 358.
Pedersen,M.W., Jacobsen,H.J., Koefoed, K., Hey, A., Pyke, C., Haurum, J.S., Kragh,M.,2010. Sym004: a novel synergistic anti-epidermal growth factor receptorantibody mixture with superior anticancer efficacy. Cancer Res. 70, 588.
Poulsen, T.R., Jensen, A., Haurum, J.S., Andersen, P.S., 2011. Limits forantibody affinity maturation and repertoire diversification inhypervaccinated humans. J. Immunol. 187, 4229.
Retter, I., Althaus, H.H., Munch, R., Muller, W., 2005. VBASE2, an integrative Vgene database. Nucleic Acids Res. 33, D671.

14 S. Liao-Chan et al. / Journal of Immunological Methods 405 (2014) 1–14
Scott, A.M., Wolchok, J.D., Old, L.J., 2012. Antibody therapy of cancer. Nat.Rev. Cancer 12, 278.
Shi, E., Fury, W., Li, W., Mikulka, W., Aldrich, T., Rafique, A., Chen, G.,Hoffenberg, S., Daly, T.J., Radziejewski, C., 2006. Monoclonal antibodyclassification based on epitope-binding using differential antigendisruption. J. Immunol. Methods 314, 9.
Stave, J.W., Lindpaintner, K., 2013. Antibody and antigen contact residuesdefine epitope and paratope size and structure. J. Immunol. 191, 1428.
Suzuki, R., Shimodaira, H., 2006. Pvclust: an R package for assessing theuncertainty in hierarchical clustering. Bioinformatics 22, 1540.
Toiyama, Y., Inoue, Y., Yasuda, H., Saigusa, S., Yokoe, T., Okugawa, Y., Tanaka, K.,Miki, C., Kusunoki, M., 2011. DPEP1, expressed in the early stages of coloncarcinogenesis, affects cancer cell invasiveness. J. Gastroenterol. 46, 153.
Tsuji, I., Sato, S., Otake, K., Watanabe, T., Kamada, H., Kurokawa, T., 2012.Characterization of a variety of neutralizing anti-heparin-bindingepidermal growth factor-like growth factor monoclonal antibodies bydifferent immunization methods. mAbs 4, 732.
Wagener, C., Yang, Y.H., Crawford, F.G., Shively, J.E., 1983. Monoclonalantibodies for carcinoembryonic antigen and related antigens as a modelsystem: a systematic approach for the determination of epitopespecificities of monoclonal antibodies. J. Immunol. 130, 2308.
Wine, Y., Boutz, D.R., Lavinder, J.J., Miklos, A.E., Hughes, R.A., Hoi, K.H., Jung,S.T., Horton, A.P., Murrin, E.M., Ellington, A.D., Marcotte, E.M., Georgiou,G., 2013. Molecular deconvolution of the monoclonal antibodies thatcomprise the polyclonal serum response. Proc. Natl. Acad. Sci. U. S. A.110, 2993.