Embed Size (px)
Citation preview

Monmouth Real Estate Investment Corporation
A Public REIT Since 1968
July 2021Investor Presentation
NYSE: MNR

This presentation may contain forward‐looking statements within the meaning of Section 27A of the Securities Act of 1933, asamended, Section 21E of the Securities Exchange Act of 1934, as amended. Forward‐looking statements provide Monmouth RealEstate Investment Corporation’s current expectations or forecasts of future events. Forward‐looking statements include statementsabout Monmouth’s expectations, beliefs, intentions, plans, objectives, goals, strategies, future events, performance and underlyingassumptions and other statements that are not historical facts. You can identify forward‐looking statements by their use offorward‐looking words, such as “may,” “will,” “anticipate,” “expect,” “believe,” “intend,” “plan,” “should,” “seek,” or comparableterms, or the negative use of those words, but the absence of these words does not necessarily mean that a statement is notforward‐looking. The forward‐looking statements are based on Monmouth’s beliefs, assumptions and expectations of its futureperformance, taking into account all information currently available to it. Forward‐looking statements are not predictions of futureevents. These beliefs, assumptions and expectations can change as a result of many possible events or factors, not all of which areknown to Monmouth. Some of these factors are described under the headings “Risk Factors” and “Management’s Discussion andAnalysis of Financial Condition and Results of Operations” as included in Monmouth’s Annual Report on Form 10‐K for the fiscal yearended September 30, 2020, its Quarterly Reports on Form 10‐Q for the quarterly periods ended June 30, 2021, March 31,2021, andDecember 31, 2020, and its other periodic reports filed with the Securities and Exchange Commission, which are accessible on SEC’sElectronic Data Gathering, Analysis and Retrieval website, or “EDGAR” at www.sec.gov. These factors should not be construed asexhaustive and should be read in conjunction with other cautionary statements that are included in this presentation and inMonmouth’s SEC filings. These and other risks, uncertainties and factors could cause Monmouth’s actual results to differ materiallyfrom those included in any forward‐looking statements it makes. Any forward‐looking statement speaks only as of the date onwhich it is made. New risks and uncertainties arise over time, and it is not possible for Monmouth to predict those events or how theymay affect it. Except as required by law, Monmouth is not obligated to, and does not intend to, update or revise any forward‐lookingstatements, whether as a result of new information, future events or otherwise. You should not place undue reliance on theseforward‐looking statements, as events described or implied in such statements may not occur.
This presentation may include references to “FFO” and “AFFO”, which are non‐GAAP financial measures. A reconciliation of “FFO”and “AFFO” to the most comparable GAAP financial measures is included in our most recent Quarterly Report on Form 10‐Q and/orour Supplemental Information package as of June 30, 2021, furnished to shareholders on Form 8‐K, and is available on our websiteat www.mreic.reit.
2

The future effects of the evolving impact of COVID‐19 are uncertain, however at this time webelieve that the fallout from COVID‐19 will not have a material adverse effect on our financialcondition.Monmouth went into the global pandemic very well positioned with a strong balance sheet, a high‐quality tenant roster, nearly full occupancy, and a well‐covered dividend. Our resilient rentcollection results during these challenging times highlights the mission‐critical nature of our assetsand underscores the essential need for our tenants’ operations. In addition, because our weightedaverage lease maturity is 7.2 years and our weighted average fixed‐rate mortgage debt maturity is11.1 years, we expect our income streams to remain resilient for years to come.
3
COVID‐19 Global Pandemic
Tenant Rent Collections and Occupancy During COVID‐19 Pandemic
For the month of September‐October 99.8% For the month of November 100% For the month of December‐June 99.9%
For the month of March 100% For the month of April–July 99.9% For the month of August 99.7%
Occupancy over 99% Throughout
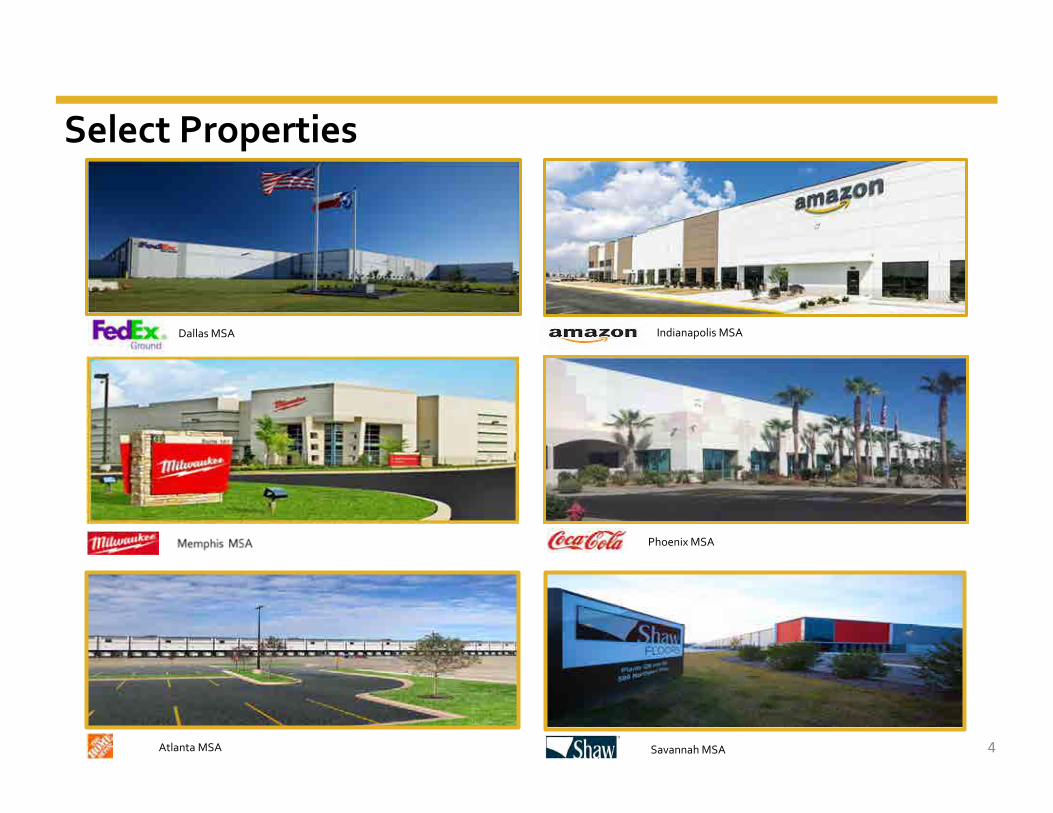
Select Properties
Atlanta MSA Savannah MSA
Phoenix MSA
4
Dallas MSA Indianapolis MSA

Company Overview
Memphis MSA
Indianapolis MSA
Single tenant, net‐leased Industrial REIT specializing in well‐located, modern properties subject to long‐term leases primarily to investment grade tenants or their subsidiaries
Property portfolio contains 24.7 million square feet, consisting of 121 properties with 99.7% occupancy
Geographically diversified portfolio across 32 states with a focus on major seaports, major intermodal ports, and major airports
Quality roster of investment grade tenants Approximately 83% of rental revenue is from investment grade
tenants or their subsidiaries, including Amazon, Beam Suntory, Coca‐Cola, FedEx, Home Depot, International Paper, Magna, National Oilwell, Raytheon Technologies, Shaw Industries, Sherwin‐Williams, Siemens, Toyota, UPS and other high‐quality companies
Strong recent growth Monmouth successfully grew GLA by approximately 60% during
the past five years In fiscal 2020, we closed on five properties with approximately 1.2
million square feet for $175.1 million Thus far in fiscal 2021, closed on three properties totaling 1.3
million square feet for $224.0 million Current acquisition pipeline includes five highly‐automated
properties containing approximately 1.6 million square feet with a total purchase price of $183.6 million
• All five properties are leased long‐term to investment grade tenants
Conservative capital structure 27.1% Net Debt to Total Market Capitalization 6.0x Net Debt/Adjusted EBITDA 2.1x Fixed Charge Coverage 11.1 years Weighted Average Fixed Rate Mortgage Debt Maturity
Source: MNR 10‐Q and subsequent press releases5
Daytona Beach MSA

Portfolio Overview 121 properties geographically diversified across 32 states, totaling
approximately 24.7 million square feet of GLA Highest occupancy rate in the Industrial REIT sector at 99.7% Currently in our sixth consecutive year with above 98.9% occupancy Most modern industrial property portfolio with a weighted average
building age of 10.1 years FedEx portfolio weighted average building age is 9.5 years
Average building size is approximately 204,000 square feet Weighted average lease maturity is 7.2 years Weighted average rent per square foot is $6.59 Ample expansion capability with a land to building ratio of 5.3:1 FedEx portfolio land to building ratio is 6.3:1 Simple business model
No off‐balance sheet joint ventures No in‐house development division No significant amount of non‐income producing land To serve the digital economy
99.6% 99.3% 99.6%98.9%
99.4%99.7%
90.0%
91.0%
92.0%
93.0%
94.0%
95.0%
96.0%
97.0%
98.0%
99.0%
100.0%
FY 2016 FY 2017 FY 2018 FY 2019 FY 2020 Current
Occupancy
100.0%92.0%
69.0%76.0%
87.0%100.0%
0.0%10.0%20.0%30.0%40.0%50.0%60.0%70.0%80.0%90.0%100.0%
FY 2016 FY 2017 FY 2018 FY 2019 FY 2020 FY2021
Tenant Retention
6
Charlotte MSA
Consistent Results
Source: MNR 10‐Q and subsequent press releases

Portfolio Growth
7
13.9 16.0
18.8 21.2
22.3 23.4
6.0
10.0
14.0
18.0
22.0
26.0
30.0
FY 2015 FY 2016 FY 2017 FY 2018 FY2019 FY2020 FY2021E
25.2
Total S
quare Fe
et (in Millions
)
Total GLA
Total Real Estate Assets
$0.941$1.158
$1.432
$1.720$1.867
$0.4
$0.8
$1.2
$1.6
$2.0
$2.4
FY 2015 FY 2016 FY 2017 FY 2018 FY2019 FY2020 FY2021E
$2.044
$2.333
Total Re
al Estate Assets ($ in Billions
)
Source: MNR 10‐Q and subsequent press releases

Capital Structure
$0.0
$0.5
$1.0
$1.5
$2.0
$2.5
$3.0
$3.5
FY 2015 FY 2016 FY 2017 FY 2018 FY 2019 FY 2020 Q3 2021
Total M
arke
t Cap
italization ($ in Billions
)
Common Equity Preferred Equity Debt
8Source: MNR 10‐Q and subsequent press releases

Financial Highlights
The decrease in AFFO per share was primarily attributable to a $5.5 million increase in Preferred Dividend expense as a result of an increase in preferred shares outstanding, as well as a $4.3 million decrease in dividend income, partially offset by a $9.6 million increase in Net Operating Income (NOI).
Source: MNR 10‐Q and subsequent press releases
Gross Revenue
Adjusted Funds from Operations per Share
$0
$50
$100
$150
$200
2015 2016 2017 2018 2019 2020 9MOS'20 9MOS'21
+ 20%+ 23%
+ 5%
$0.00
$0.20
$0.40
$0.60
$0.80
2015 2016 2017 2018 2019 2020 9MOS'20 9MOS'21
‐ 2%‐ 8%
‐3.3%
9
$ in M
illions
+ 23%
+ 9%+ 14%
+ 14%
Gross Revenue has grown at an average annual rate of 17% over the past five years
AFFO per share has grown at an average annual rate of 7% over the past five years
+ 23%
+5%

Ecommerce Trends and MNR’s Portfolio
Source: U.S. Census Bureau & eMarketer & eMarketer.com
Monmouth was early in anticipating consumer spending’s shift from traditional stores to internet sales. The entire retail industry continues to migrate from brick and mortar stores to omni‐channel platforms.
This has led to significant demand for large, modern industrial distribution centers. U.S. ecommerce sales are expected to grow to $933 billion in 2021, representing a 17.9% increase from 2020 and 15.3% of total
U.S. retail sales. Today, Monmouth’s vast FedEx and Amazon holdings represent an integral part of the growing ecommerce ecosystem.
ECommerce Sales
$‐
$100
$200
$300
$400
$500
$600
$700
$800
$900
$1,000
2011 2012 2013 2014 2015 2016 2017 2018 2019 2020 2021E
$ in Billions
CAGR: 17%
10

11Source: U.S. Census Bureau
1.30
1.35
1.40
1.45
1.50
1.55
1.60
1.65
1.70
1.75
1.80
'92 '94 '96 '98 '00 '02 '04 '06 '08 '10 '12 '14 '16 '18 '20
Supply chains need to be more resilient in a Post‐Pandemic World. Inventory levels are projected to increase substantially. This will drive greater industrial space demand.
Inventories‐to‐Sales Ratio, Retailers

Triple Digit Demographic Shifts
12
Metropolitan areas with the greatest daily net population exodus and gain (Pre‐COVID Trends)
Source: Bloomberg analysis of U.S. Census data

13Source: S&P Global Market Intelligence as of 7/30/21
Strategic Locations
1.74 – 37.60
37.60 – 70.6070.60 – 112.60
112.60 – 207.00
207.00 – 2,872.94
U.S RailroadsMREIC Current PropertiesMREIC Properties Under Contract
Population Density (#/sq. mi.)
Monmouth’s Property Portfolio with U.S. Population Density and U.S. Railroads
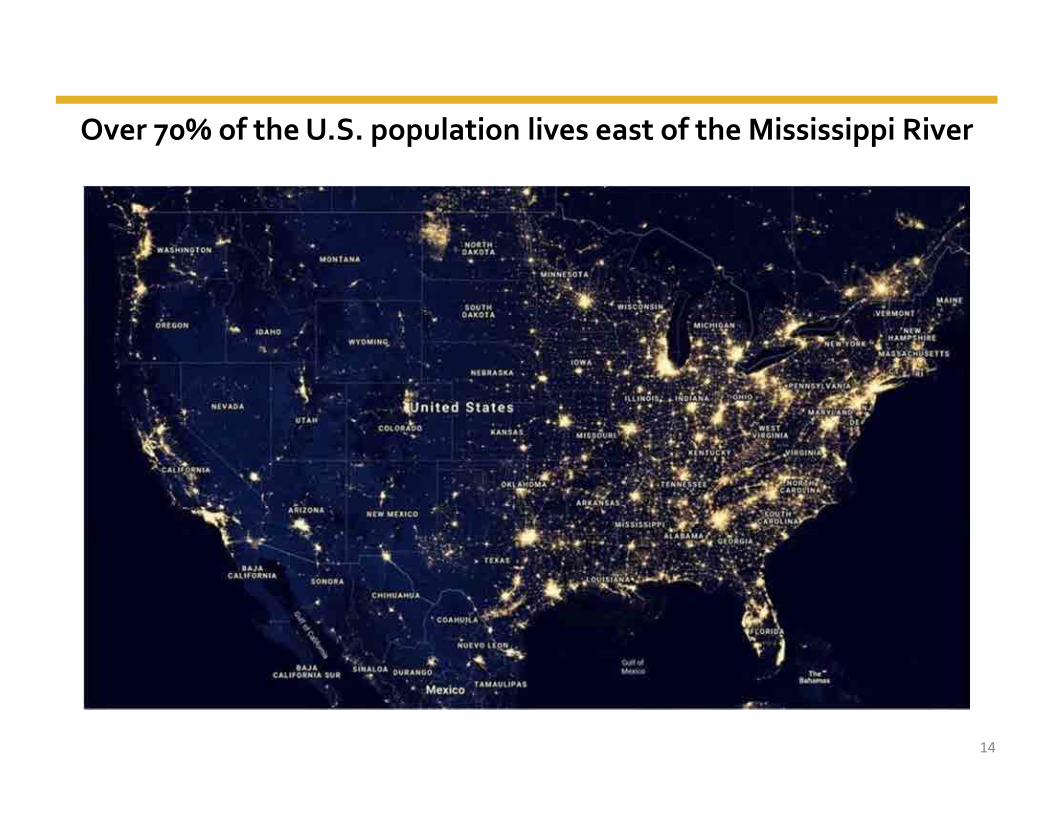
Over 70% of the U.S. population lives east of the Mississippi River
14

USLAX/USLGB anchored vessels
15
Supply Chain Bottle Neck on West Coast

Expanded Panama Canal Changes the Balance
Source: JLL Research
Since 2008, shipping container volumes on East Coast ports have increased dramatically by 46.8%. West Coast ports have seen some growth as well, albeit at a much slower rate of 18.4%.
The Post‐Pandemic environment will likely accelerate this trend further.
56.5%54.0%
52.4% 51.1%
43.5%46.0%
47.6% 48.9%
0.0%
10.0%
20.0%
30.0%
40.0%
50.0%
60.0%
2008 2014 2016 2018
Share of to
tal TEU
s
West Coast East Coast
16

Portfolio Markets & Panama Canal Expansion
Source: MNR 10‐Q, subsequent press releases, Parsons Brinckerhoff Panama Canal Expansion Study, June 2012; Panama Canal Authority, Canal Expansion Programs – Components Report April 2012, Washington Post: “Modernization of the Panama Canal”; January 2013
Monmouth’s acquisition pipeline currently comprises five new build‐to‐suit industrial properties containing approximately 1.6 million square feet with an aggregate purchase price of $183.6 million. All five highly‐automated properties are leased to investment grade tenants or their subsidiaries.
Over 70% of the U.S. population lives east of the Mississippi River. Following nine years of construction costing $5.4 billion, the Panama Canal expansion project opened on June 26, 2016. North American ports have been spending billions of dollars in order to accommodate these larger ships,
These ships have more than twice the cargo capacity of the older ships. The expanded Panama Canal allows larger vessels an approximate 29 days shorter transit time from the Atlantic to the Pacific oceans. Container traffic has been rapidly shifting to the East Coast ports.
17
Eastern Coastal
East Coast Inland
Gulf coast & Mississippi valley
Non‐impacted marketsExisting Properties
Acquisitions Under Contract

High Quality Tenant Base
Approximately 83% of rental revenue is from investment grade tenants or subsidiaries Higher investment grade tenant base than any other REIT
Rental roster includes Amazon, Beam Suntory, Coca‐Cola, FedEx, Home Depot, International Paper, Keurig Dr Pepper, Magna, Milwaukee Tool, National Oilwell, RaytheonTechnologies, Shaw Industries, Sherwin‐Williams, Siemens, Snap‐on, Toyota , ULTA, UPS and other high quality companies
Monmouth began investing in properties leased to FedEx in 1994 Recent acquisitions include four properties consisting of an additional 1.0 million square feet leased to FedEx Sixteen FedEx expansion projects completed since Fiscal 2014, increasing the rent and lease terms of these
facilities, with several parking expansion projects currently underway
Largest Percentage of Investment Grade Tenants in the REIT Sector
18Source: MNR 10‐Q and subsequent press releases

FedEx’s average U.S. daily package volume
0
2
4
6
8
10
12
14
16
18
FY 2018 FY 2019 FY 2020 FY 2021
inMillions
Ground Express
Source: The Wall Street Journal
Driven by Ground home deliveries, FedEx’s average daily package volume is now at all‐time record levels
19
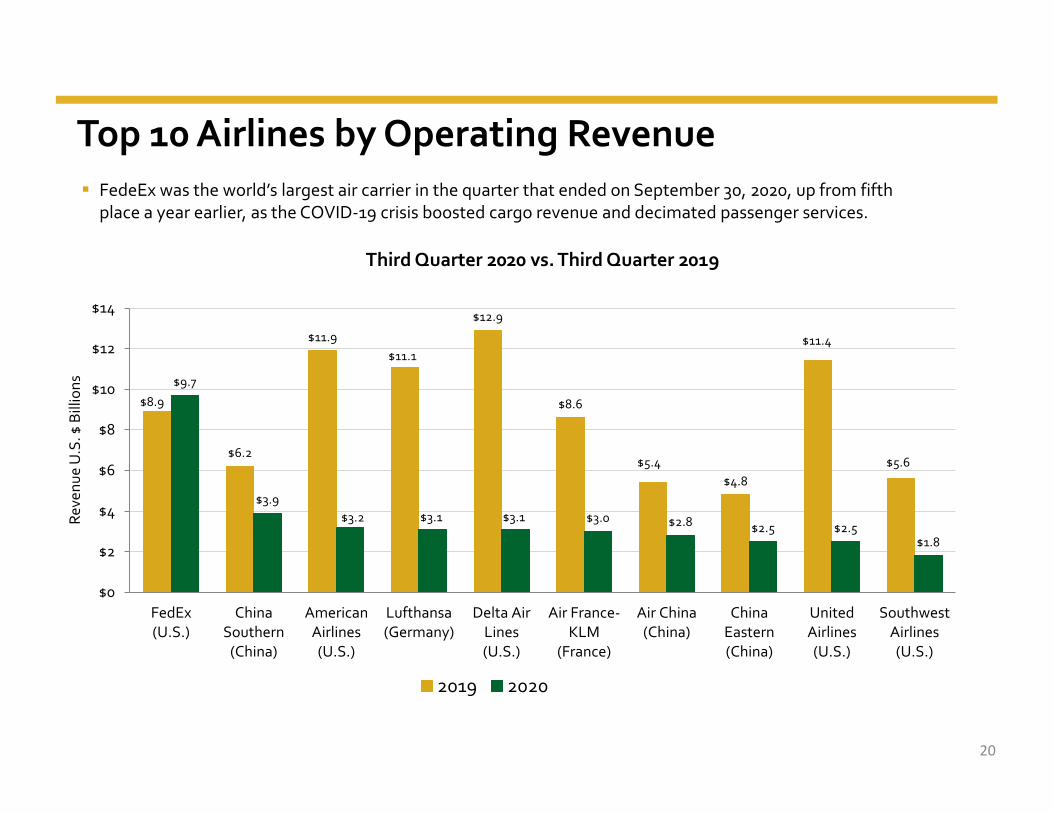
Top 10 Airlines by Operating Revenue
Third Quarter 2020 vs. Third Quarter 2019
$8.9
$6.2
$11.9$11.1
$12.9
$8.6
$5.4$4.8
$11.4
$5.6
$9.7
$3.9$3.2 $3.1 $3.1 $3.0 $2.8 $2.5 $2.5
$1.8
$0
$2
$4
$6
$8
$10
$12
$14
FedEx(U.S.)
ChinaSouthern(China)
AmericanAirlines(U.S.)
Lufthansa(Germany)
Delta AirLines(U.S.)
Air France‐KLM
(France)
Air China(China)
ChinaEastern(China)
UnitedAirlines(U.S.)
SouthwestAirlines(U.S.)
2019 2020
FedeEx was the world’s largest air carrier in the quarter that ended on September 30, 2020, up from fifth place a year earlier, as the COVID‐19 crisis boosted cargo revenue and decimated passenger services.
Reve
nue U.S. $ Billions
20

FedEx Ground, 41.4%
FedEx Express, 4.7%
Amazon, 6.0%Milwaukee Tool,
3.5%
Shaw Industries, 3.4%
Home Depot, 3.4%
ULTA, 2.7%
Jim Beam Brands, 2.4%
Remaining Tenants, 32.5%
FedEx Ground, 51.6%
FedEx Express, 4.7%
Amazon, 6.6%
Home Depot, 4.0%
Shaw Industries, 2.2%
Milwaukee Tool, 1.9%
ULTA, 1.7%
International Paper, 1.6%
B.Braun Medical, 1.4%
Remaining Tenants, 24.3%
High Quality Tenants
Square Footage by TenantAnnual Rent by Tenant
21Source: MNR 10‐Q and subsequent press releases
FDX and its subsidiaries represent 56.3% of Annual Rent
FDX and its subsidiaries represent 46.1% of Square Footage
Total Annual Rent: $162.0 million Total Square Footage: 24.7 million

Land – to – Building Ratios
5:1
6:1
4:1
0
2
4
6
8
Total Monmouth Portfolio FedEx Properties Non‐FedEx Properties
22
Monmouth’s properties contain ample land in order to accommodate future expansion projects Our FedEx properties contain even more land in order to accommodate their significant parking requirements Numerous expansion projects are currently underway

Ohio, 9.6%
Georgia, 9.3%
Florida, 9.0%
Indiana, 8.0%
Texas, 7.3%
Kentucky, 5.3%South Carolina, 5.2%
North Carolina, 5.0%
Mississippi, 4.7%
Illinois, 3.9%
Remaining States, 32.7%
Georgia, 10.0%
Florida, 9.9%
Ohio, 9.8%
Texas, 8.5%
Indiana, 6.9%
South Carolina, 6.1%
North Carolina, 5.4%
Illinois, 3.9%
New Jersey, 3.7%
Michigan, 3.5%
Remaining States, 32.3%
Geographic Focus
Annual Rent by State Square Footage by State
23
Our 24.7 million square foot portfolio is well diversified across 32 states We have high concentrations in several of the most business friendly states
Source: MNR 10‐Q and subsequent press releases
Total Annual Rent: $162.0 million Total Square Footage: 24.7 million

Summary Portfolio Metrics
Source: S&P Global Market Intelligence as of 7/26/2021
24
Current Occupancy
Rate
Rent Roll (% next 3 years by base revenues)
99.7%
98.3%97.6%
97.2% 97.0%96.6%
96.1%
94.5%
91.0%92.0%93.0%94.0%95.0%96.0%97.0%98.0%99.0%100.0%101.0%
MNR EGP DRE PLD STAG FR TRNO PSB
19.9%
30.4%34.1% 36.5%
40.7% 42.1%
48.2%
53.9%
0.0%
10.0%
20.0%
30.0%
40.0%
50.0%
60.0%
MNR DRE STAG TRNO FR PLD EGP PSB
Highest occupancy rate in the sector
Limited near term rent roll
Highest occupancy rate Strongest Tenants Longest lease terms Youngest portfolio in the Industrial REIT sector with a weighted average building age of 10.1 years

Fiscal 2020 & 2021 Acquisitions Monmouth has completed over $1.5 billion in acquisitions and more than doubled portfolio GLA over the past seven years. In fiscal 2020, Monmouth acquired five properties containing approximately 1.2 million square feet for $175.1 million, all are net‐leased
to investment grade tenants or their subsidiaries. Thus far in fiscal 2021, Monmouth acquired three properties containing approximately 1.3 million square feet for $224.0 million. Monmouth’s acquisition pipeline currently contains approximately 1.6 million square feet consisting of five new build‐to‐suit properties,
all of which are net‐leased to investment grade tenants or their subsidiaries, with an aggregate purchase price of $183.6 million.
Fiscal 2020 Acquisitions FY 2021
MSAs:Indianapolis,
INColumbus,
OHGreensboro,
NCSalt Lake City,
UTOklahoma City,
OKColumbus,
OHAtlanta,GA
Burlington,VT
Tenant:
Credit Rating:(S&P/Moody’s)
AA‐/A2 A‐/A3 BBB/Baa2 BBB/Baa2 AA‐/A2 BBB/Baa2 A/A2 BBB/Baa2
Year Built: 2019 2020 2020 2020 2020 2020 2020 2021
Size (sf): 615,747 152,995 286,281 69,734 120,780 500,268 657,518 143,794
Acres: 78.6 24.5 39.3 7.5 21.5 100.0 130.23 43.40
Purchase Price: $81,500,000 $17,874,148 $47,644,571 $12,863,600 $15,200,000 $73,304,000 $95,935,000 $54,789,000
Price/SF: $132.36 $116.83 $166.43 $184.47 $125.85 $146.53 $145.90 $381.02
Lease Maturity: 8/31/2034 1/31/2030 4/30/2035 3/31/2035 8/31/2030 9/30/2035 11/30/2040 5/31/2036
Total Annualized Rental Revenue for properties purchased in fiscal 2020 & fiscal 2021:
$24,113,000
25Source: MNR 10‐Q and subsequent press releases

Select Acquisitions
FedEx Ground –Orlando, FL MSA – 311,000 sf
26Source: MNR 10‐Q and subsequent press releases
This photo illustrates the strong demand for our locations, and how integral they are to the Ecommerce ecosystem.Situated on the I‐4 corridor between Tampa and Orlando, Walmart recently constructed two large ecommerce fulfillment
centers (one on each side of our FedEx facility) totaling 2.35 million square feet.
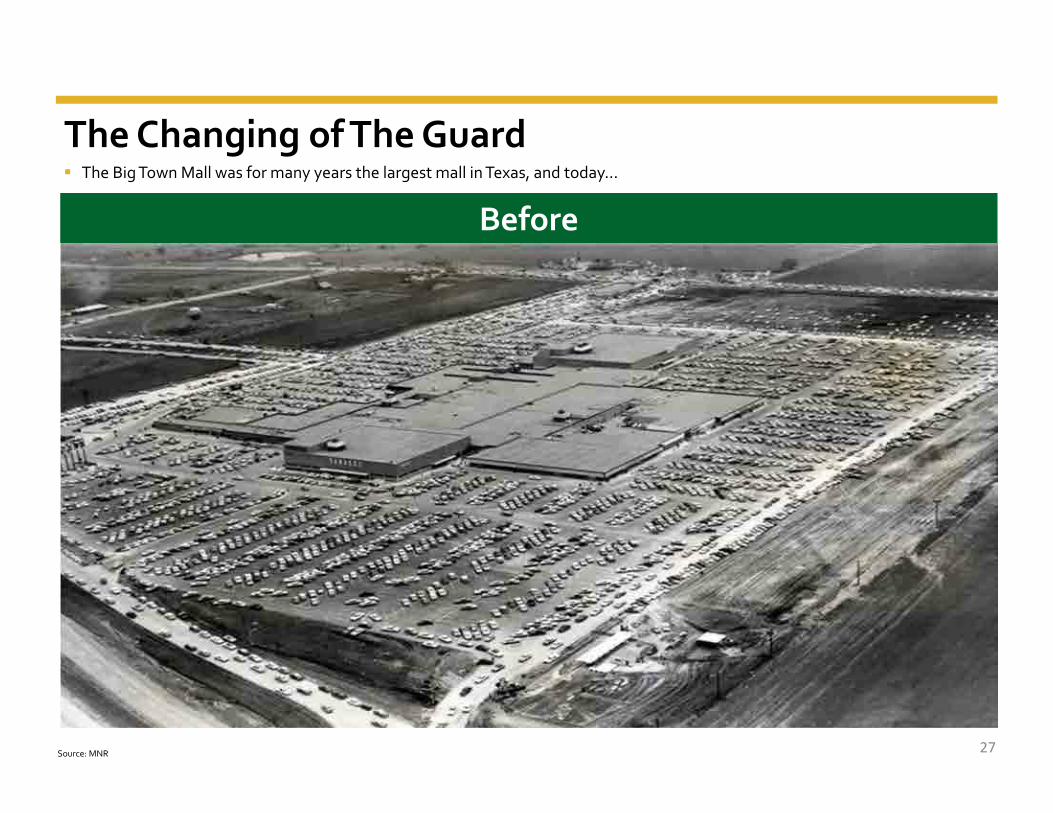
The Changing of The Guard
Before
27Source: MNR
The Big Town Mall was for many years the largest mall in Texas, and today…

The Changing of The Guard
After
28Source: MNR
This large 65 acre parcel situated six miles east of downtown Dallas is now the site of Monmouth’s new 352,000 sf FedEx facility.

Acquisition Pipeline Large highly‐automated acquisition pipeline comprising
approximately 1.6 million square feet with a purchase price of $183.6 million
100% is leased to investment grade tenants Leases commence throughout fiscal 2021 and 2022 Acquisitions included in the pipeline have a weighted
average lease maturity of 13.4 years Nine expansion projects completed within the last five years with
a total cost of $35.1 million These expansions resulted in extending the weighted average
lease terms by approximately 12 years and produced approximately 9% unlevered annual returns on cost from increased rents
Several parking expansion projects are currently under construction
29
Built‐to‐Suit Infrastructure Installation (material and handling equipment is owned by tenant)
Salt Lake City MSABuilt‐to‐Suit Infrastructure Installation (material and handling equipment is owned by tenant)
Source: MNR 10‐Q and subsequent press releases

Lease Expirations Are Well Dispersed Strong embedded rent growth potential. Weighted average lease maturity currently at 7.2 years. Weighted average rent per occupied square foot of $6.59. National average rent psf for industrial real estate
currently is $7.03 and trending higher.
Monmouth historically averages approximately 90% annual tenant retention. Achieved 100% tenant retention in fiscal 2021.
Fiscal 2021 leases increased by 6% on a GAAP basis. Monmouth’s properties contain additional land and
excess parking.
0 sq. ft.
500 sq. ft.
1,000 sq. ft.
1,500 sq. ft.
2,000 sq. ft.
2,500 sq. ft.
3,000 sq. ft.
2022 2023 2024 2025 2026 2027 2028 2029 2030 2031 2032 2033 2034 2035 2036 2041
$8.52$5.28
$5.70
$6.25
$4.98
$6.00$6.24
$5.46 $8.85
Fiscal Year
$9.74$8.30
$22.48
GLA 4.3% 8.6% 7.7% 10.6% 7.0% 9.7% 8.8% 7.4% 4.5% 4.9% 8.6% 4.2% 6.3% 3.5% 0.6% 2.7%
ABR 3.5% 7.5% 7.3% 8.0% 6.7% 8.2% 7.3% 6.5% 5.2% 6.0% 11.6% 5.5% 5.8% 5.1% 2.0% 3.4%
Expirin
g Sq
uare Foo
tage (0
00’s)
30
Expiring square footage (‘000’s)Average rent per occupied square foot of expiring square footage is shown above each bar
$5.79
$5.56
$7.99 $7.70
Source: MNR 10‐Q and subsequent press releases, GLA: Gross Leasable Area, ABR: Annual Base Rent

Favorable US Industrial Fundamentals
Source: CBRE Research, Green Street, and Cushman & Wakefield
Current economic indicators are very favorable for the US industrial real estate sector and Monmouth’s modern portfolio due to: Rampant growth in Ecommerce which has accelerated further due to the COVID‐19 Pandemic Increased inventory stocking due to the COVID‐19 Pandemic Manufacturing growth due to supply chains shifting back to the U.S. Over nine consecutive years of positive net absorption Continued benefits from the recently completed Panama Canal expansion
US Industrial Construction (000’s) US Industrial Occupancy
0
100,000
200,000
300,000
400,000
500,000
2006 2008 2011 2013 2016 2018 202185%
90%
95%
100%
2006 2009 2012 2015 2018 2019 2021
95.5%
476,100
31
US Industrial Cap Rates
4%
6%
8%
10%
2006 2009 2012 2015 2018 2021
4.1%

Conservative Balance Sheet Conservative capital structure
27.1% Net Debt to total market capitalization 6.0x Net Debt/Adjusted EBITDA 2.1x Fixed Charge Coverage 91.2% fixed rate debt, weighted average interest rate of 3.8%
Limited debt maturities each year through 2025 83.9% of debt consists of modest LTV asset level mortgage financing Weighted average mortgage maturity of 11.1 years, representing one of the
longest debt maturity schedules in the REIT sector $474.3 million in potential liquidity
$148.4 million in REIT marketable securities (approximately 5.9% of gross assets)
$135.0 million available on our $225.0 million unsecured revolving line of credit, plus an additional $100.0 million potentially available on an accordion feature
$90.9 million in cash In October 2018, we completed our first Common Stock offering since 2014,
with the sale of 9.2 million shares generating gross proceeds of $138 million
(1) All dollar amounts except stock price are in millionsSource: MNR 10‐Q and subsequent press releases
Debt Maturities
Total Market Capitalization (1)
Equity, 54%
Debt, 30%
Preferred, 16%
Total Shares Outstanding (6/30/21) 98,302,207
Stock Price (6/30/21) $18.72
Equity Market Capitalization $1,840.2
Mortgage Notes Payable 849.0
Loans Payable 165.0
Total Debt $1,014.0
Total Preferred Stock 549.6
Total Market Capitalization $3,403.8
32
$0
$100
$200
$300
$400
$500
$600
2021 2022 2023 2024 2025 Thereafter
16.7%
6.6%8.0%
52.4%
1.6%
14.7%Total D
ebt ($ in M
illions
)
Loans Payable
Mortgages
% of Total Debt Outstanding
Mobile, AL

Long Term Reliable Cash Dividends
Source: S&P Global Market Intelligence
Monmouth is now in its 30th consecutive year of having maintained or increased its dividend, representing one of the best track records in the entire REIT sector.
On January 14, 2021, Monmouth increased its dividend by 5.9% to $0.18 per quarter($0.72 per year), making our third dividend increase in 5 years. These 3 dividend increases total 20%.
Current AFFO dividend payout ratio is 90.0%. Monmouth was one of the only REITs that maintained its dividend throughout the Great Recession. 100% cash dividends since inception. Best rent collection and occupancy results during the COVID‐19 Pandemic in the Industrial Property sector.
$0.57 $0.58 $0.58 $0.58 $0.58 $0.58 $0.58 $0.60 $0.60 $0.60 $0.60 $0.60 $0.60 $0.60 $0.60 $0.60 $0.60 $0.64 $0.64
$0.68 $0.68 $0.68 $0.71
$‐
$0.10
$0.20
$0.30
$0.40
$0.50
$0.60
$0.70
$0.80
1999
2000
2001
2002
2003
2004
2005
2006
2007
2008
2009
2010
2011
2012
2013
2014
2015
2016
2017
2018
2019
2020
2021
Dividends Per Share
33
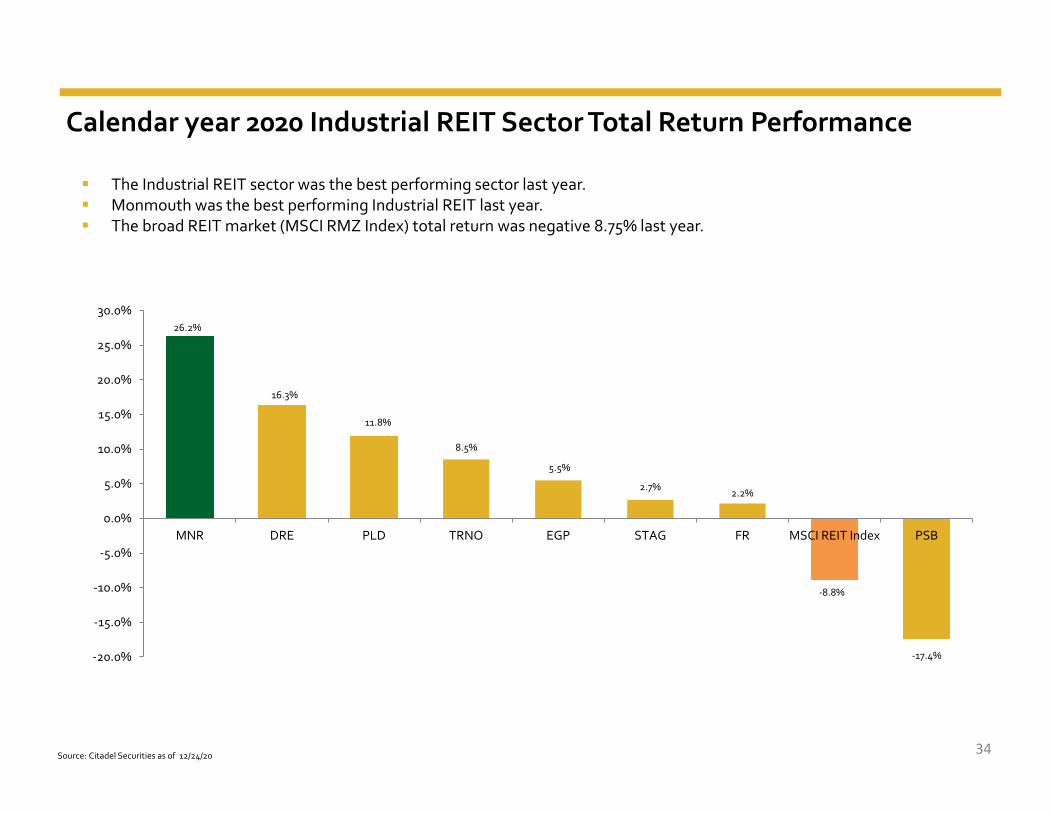
Calendar year 2020 Industrial REIT Sector Total Return Performance
Source: Citadel Securities as of 12/24/20
26.2%
16.3%
11.8%
8.5%
5.5%
2.7% 2.2%
‐8.8%
‐17.4%‐20.0%
‐15.0%
‐10.0%
‐5.0%
0.0%
5.0%
10.0%
15.0%
20.0%
25.0%
30.0%
MNR DRE PLD TRNO EGP STAG FR MSCI REIT Index PSB
The Industrial REIT sector was the best performing sector last year. Monmouth was the best performing Industrial REIT last year. The broad REIT market (MSCI RMZ Index) total return was negative 8.75% last year.
34

Peer Analysis
Source: S&P Global Market Intelligence as of 7/26/2021NOTE: MNR peers include DRE, EGP, FR, PLD, PSB, STAG and TRNO
Dividend Yield
2021E FFO Multiple 2021E FFO Payout Ratio
Total Debt/Total Market Capitalization
35
41.5x
31.7x 30.5x 30.3x 28.4x
22.7x 22.5x20.1x
0.0x
5.0x
10.0x
15.0x
20.0x
25.0x
30.0x
35.0x
40.0x
45.0x
TRNO PLD EGP DRE FR PSB MNR STAG
29.8%
25.4%
18.9% 18.6% 18.5%16.8%
10.1%
0.0%0.0%
5.0%
10.0%
15.0%
20.0%
25.0%
30.0%
35.0%
MNR STAG FR DRE EGP PLD TRNO PSB
3.8%3.6%
2.7%
2.0% 2.0% 2.0%1.8% 1.7%
0.0%
0.5%
1.0%
1.5%
2.0%
2.5%
3.0%
3.5%
4.0%
MNR STAG PSB DRE FR PLD EGP TRNO
86.1%
72.7% 70.8%62.9% 61.3% 60.2%
56.2% 54.4%
0.0%10.0%20.0%30.0%40.0%50.0%60.0%70.0%80.0%90.0%100.0%
MNR STAG TRNO PLD PSB DRE FR EGP

Long Term Performance
Source: S&P Global Market Intelligence as of 7/26/2021
15Year
‐200‐100
0100200300400500600
7/26
/200
6
7/26
/200
7
7/26
/200
8
7/26
/200
9
7/26
/201
0
7/26
/201
1
7/26
/201
2
7/26
/201
3
7/26
/201
4
7/26
/201
5
7/26
/201
6
7/26
/201
7
7/26
/201
8
7/26
/201
9
7/26
/202
0
7/26
/202
1
36
Dividend Yield3.8% 3.6%
2.7%
2.0% 2.0% 2.0%1.8% 1.7%
0.0%
0.5%
1.0%
1.5%
2.0%
2.5%
3.0%
3.5%
4.0%
MNR STAG PSB DRE FR PLD EGP TRNO
MNR Peer Group RMS
491.57%
252.61%180.37%
Monmouth is one of the top performing REITs Slide utilizes a 15 year period to illustrate long term performance including during the Global Financial Crisis
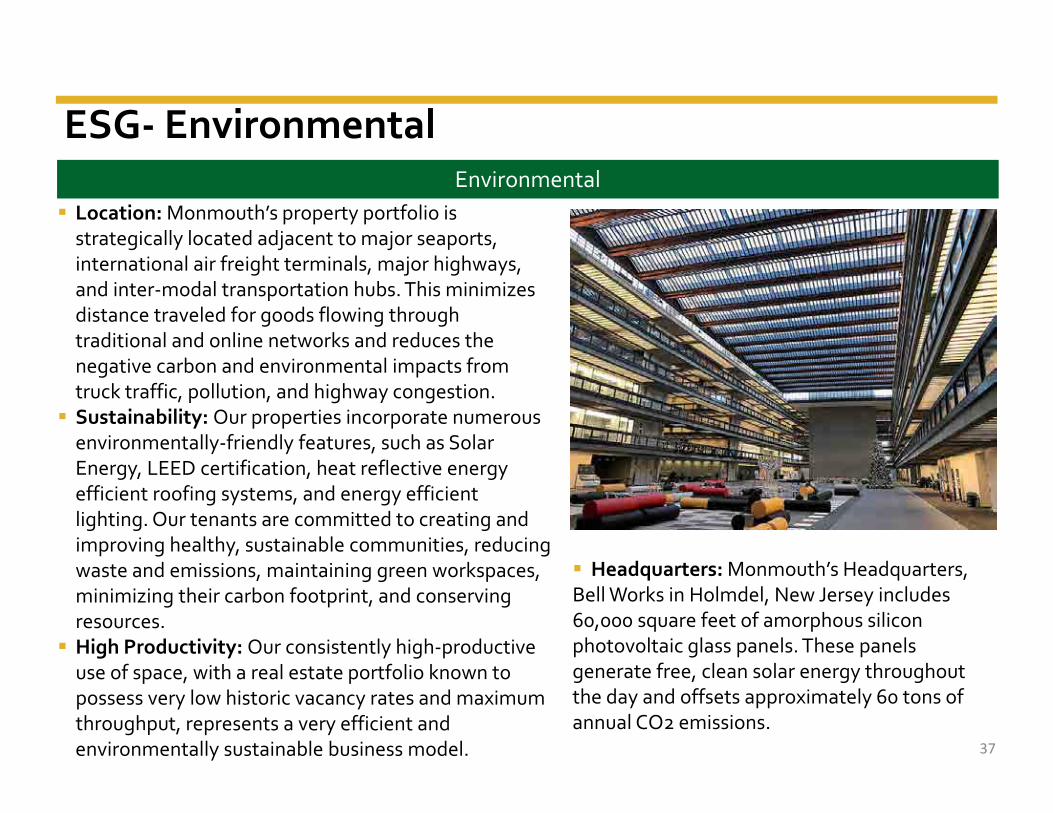
Location: Monmouth’s property portfolio is strategically located adjacent to major seaports, international air freight terminals, major highways, and inter‐modal transportation hubs. This minimizes distance traveled for goods flowing through traditional and online networks and reduces the negative carbon and environmental impacts from truck traffic, pollution, and highway congestion. Sustainability: Our properties incorporate numerous environmentally‐friendly features, such as Solar Energy, LEED certification, heat reflective energy efficient roofing systems, and energy efficient lighting. Our tenants are committed to creating and improving healthy, sustainable communities, reducing waste and emissions, maintaining green workspaces, minimizing their carbon footprint, and conserving resources. High Productivity: Our consistently high‐productive use of space, with a real estate portfolio known to possess very low historic vacancy rates and maximum throughput, represents a very efficient and environmentally sustainable business model.
ESG‐ EnvironmentalEnvironmental
37
Headquarters: Monmouth’s Headquarters, Bell Works in Holmdel, New Jersey includes 60,000 square feet of amorphous silicon photovoltaic glass panels. These panels generate free, clean solar energy throughout the day and offsets approximately 60 tons of annual CO2 emissions.

ESG‐ Social & Governance
Independent Board: 9 out of 13 Board Members (69%) are independent. Diversity of Board: Our board currently includes two women and the age of our board members ranges from 32 years of age to 87 years of
age. The Governance Committee mandates that at least one candidate representing a diversity of gender, race, ethnicity, age, and/or sexual orientation be included in each pool of candidates from which a Board nominee is chosen.
Plurality Plus Voting for Election of Directors: A nominee who does not receive a majority of the votes cast in his or her uncontested election must offer to resign as a director.
Annual Board Self‐Evaluation: Our directors engage in annual individual performance evaluations. Named Executive Officer (NEO) Stock Ownership: Effective October 1, 2017, our Named Executive Officers are subject to Stock Ownership
Guidelines recommending 2x their base salary. Director Stock Ownership: Effective September 12,2017, our Independent Directors are subject to Stock Ownership Guidelines
recommending 3x their annual cash fee. Insider Ownership: Our insider ownership reflects approximately 6% of all shares outstanding, resulting in a strong alignment of ownership
with fellow shareholders. Clawback Policy: Effective October 1, 2017, performance‐based compensation to a Named Executive Officer may be recouped if the NEO
engaged in fraud or willful misconduct contributing to the need for a material restatement of financial results. Annual Say‐on‐Pay: Non‐binding votes on executive compensation are held annually.
38
Social
Diversity in Management Team: Monmouth’s key functions are approximately 50% diverse based on gender, race, or ethnicity. Competitive Compensation, Work‐Life Balance: Our employees are compensated without regard to gender, race or ethnicity, and routinely
recognized for outstanding performance. Employees are offered great flexibility to meet personal and family needs. Ethics and Integrity: We adhere to a robust Code of Business Conduct and Ethics which extends to our suppliers and vendors, as applicable.
We afford all employees meaningful whistleblower protections. All claims will be investigated and addressed without fear of reprisal. Community: Monmouth supports its Named Executive Officers and all other employees serving on non‐profit boards and engaging in
charitable activities in the greater community. Partnership: Working with our major tenants, our buildings have been utilized to bring urgently needed medical supplies, food, clothing, and
other aid to areas throughout the world that have been stricken by natural disasters.
Governance

Key Investment Highlights
Best‐in‐Class Single Tenant Net‐Lease Industrial Portfolio
39
Geographically Diversified with a High Quality Tenant Base
Demonstrated Portfolio, Earnings, and Dividend Growth
Conservative Balance Sheet
Experienced & Aligned Management Team with 6% Ownership
Well Positioned for Future Growth

2020 Annual report is available on our website. Please contact our IR department if you would like to receive a hard copy.
Monmouth Real Estate Investment CorporationLearn more at: www.mreic.reit/interlockingfragility

Equity Commonwealth to Acquire Monmouth Real Estate for $3.4 Billion Equity Commonwealth to Transition into the Industrial Sector
Chicago and Holmdel, NJ – May 4, 2021 – Equity Commonwealth (NYSE: EQC) and Monmouth Real Estate Investment Corporation (NYSE: MNR), or Monmouth, today announced that they haveentered into a definitive merger agreement by which Equity Commonwealth will acquire Monmouth in an all‐stock transaction, valued at approximately $3.4 billion, including the assumption of debt.The combined company is expected to have a pro forma equity market capitalization of approximately $5.5 billion.Under the terms of the agreement, Monmouth shareholders will receive 0.67 shares of Equity Commonwealth stock for every share of Monmouth stock they own. Based on the closing price for EquityCommonwealth on May 4, 2021, this represents approximately $19.40 per Monmouth share. The merger agreement provides for Monmouth to declare and pay one additional regular quarterlycommon stock dividend of $0.18 per share without Equity Commonwealth paying a corresponding common dividend to its shareholders. Accordingly, the total consideration to be received by theMonmouth shareholders in the transaction is $19.58 per Monmouth share.Equity Commonwealth and Monmouth shareholders are expected to own approximately 65% and 35%, respectively, of the pro forma company following the close of the transaction.“The transaction provides Equity Commonwealth with a high‐quality, net‐leased industrial business with stable cash flows while preserving EQC’s balance sheet capacity for future acquisitions,” saidSam Zell, Chairman of the Board of Equity Commonwealth.“Monmouth provides an attractive and scalable platform,” said David Helfand, President, Chief Executive Officer and Trustee of Equity Commonwealth. “With significant cash and balance sheetcapacity, we have the ability to grow the platform and create long‐term value for shareholders.”Monmouth’s portfolio is comprised of 120 properties totaling 24.5 million square feet***. In addition, Monmouth has 6 properties totaling 1.8 million square feet under contract and leased toinvestment grade tenants. Closings for these acquisitions are expected in 2021 and 2022.“Following a strategic alternatives process, our Board unanimously determined that the merger with Equity Commonwealth is the best outcome to maximize value for Monmouth stockholders,” said Michael P. Landy, President and CEO of Monmouth. “Our stockholders will benefit from Equity Commonwealth’s preeminent leadership team, which has an exceptional track record of delivering shareholder value, its strong balance sheet and its focused strategy to build on Monmouth’s over 50 years of success creating a market leading industrial REIT.”
Strategic and Financial Rationale• Attractive entry point into a fast‐growing sector with robust long‐term fundamentals. The transaction provides the companies’ shareholders the opportunity to build a leading industrial businessand participate in the long‐term growth of the sector.• Balance of scale, stability and growth. The income stability of the portfolio, coupled with Equity Commonwealth’s sponsorship and strong balance sheet, is expected to provide the combinedcompany with stable recurring cash flows and significant dry powder for future acquisitions.• High‐quality properties. The portfolio consists of single tenant, net‐leased industrial assets, geographically located across 31 states with a focus on the Eastern United States. Many properties are near airports, seaports, transportation hubs, and situated within or near major population centers, positioning the portfolio well to serve both the first and last mile of the supply chain. With a weighted average building age of 9.9 years, much of the portfolio consists of Class A logistics facilities, featuring modern specs and building features.• Fully‐funded growth strategy. Equity Commonwealth is well‐positioned to execute on its growth strategy, which is not dependent on raising additional debt or equity capital. Upon closing of the acquisition, Equity Commonwealth is expected to have approximately $2.5 billion of pro forma cash on the balance sheet. Further, Equity Commonwealth plans to dispose of its four office properties totaling 1.5 million square feet and Monmouth’s portfolio of marketable securities over time and reinvest the proceeds in future acquisitions. • Improved leverage. Post‐merger shareholders are expected to benefit from an improved leverage profile. Equity Commonwealth expects to pay $25 per share plus accrued distributions to cash out Monmouth’s $550 million 6.125% Series C Redeemable Preferred Stock in connection with the merger. This is anticipated to create immediate savings of approximately $34 million per annum. Equity Commonwealth has a conservative financing strategy and anticipates long‐term leverage targets to be in line with the industrial REIT sector. • Increased diversification over time. For the three months ending March 31, 2021, Monmouth’s largest tenant accounts for 55% of Monmouth’s annual rent. Equity Commonwealth plans to diversify its tenant base and industry concentrations as the portfolio grows.
Leadership and GovernanceStrong corporate governance will continue to be paramount at Equity Commonwealth. The company will continue to be led by President and Chief Executive Officer David Helfand and the existingsenior management team. Upon closing, the number of trustees on Equity Commonwealth’s board will be expanded to 10, with two individuals designated by Monmouth’s board. Sam Zell will remainthe Chairman of the Board of Trustees.
41***As of March 31, 2021 and reflects the sale of the 60,400 square foot building located in Carlstadt (New York, NY), NJ for $13.0 million on April 15, 2021.

Dividend PolicyMonmouth plans to continue to pay its regular quarterly common stock dividend and its Series C Cumulative Redeemable Preferred Stock dividend between signing and closing of the transaction.Equity Commonwealth expects to begin paying a quarterly dividend after the transaction has closed. The Board of Trustees will determine the timing and amount of the dividend.
Transaction Timing & ApprovalThe transaction is expected to close during the second half of 2021, subject to customary closing conditions, including approval by the common shareholders of both Equity Commonwealth andMonmouth.The Board of Trustees of Equity Commonwealth and the Board of Directors of Monmouth Real Estate have each unanimously approved the transaction.
AdvisorsGoldman Sachs & Co. LLC is acting as financial advisor and Fried, Frank, Harris, Shriver and Jacobson LLP is serving as legal advisor to Equity Commonwealth. J.P. Morgan Securities LLC and CS CapitalAdvisors, LLC are acting as financial advisors and Stroock & Stroock & Lavan LLP is serving as legal advisor to Monmouth.
Conference Call InformationEquity Commonwealth will host a webcast and conference call to discuss the transaction on Wednesday, May 5, 2021, at 9:00 A.M. CT. The conference call will be available via live audio webcast onwww.eqcre.com. A replay of the audio webcast will also be available following the call. To access the call via telephone, use (877) 407‐9039 (Domestic) or (201) 689‐8470 (International), no passcode isrequired. An investor presentation will be available on Equity Commonwealth’s investor relations page at ir.eqcre.com/corporate‐profile/.
About Equity CommonwealthEquity Commonwealth (NYSE: EQC) is a Chicago based, internally managed and self‐advised real estate investment trust (REIT) with commercial office properties in the United States. EQC’s portfoliois comprised of 4 properties totaling 1.5 million square feet.
About MonmouthMonmouth Real Estate Investment Corporation (NYSE: MNR), founded in 1968, is one of the oldest public equity REITs in the world. Monmouth specializes in single tenant, net‐leased industrialproperties, subject to long‐term leases, primarily to investment grade tenants. Monmouth is a fully integrated and self‐managed real estate company, whose property portfolio consists of 120properties, containing a total of approximately 24.5 million rentable square feet, geographically diversified across 31 states.
Regulation FD DisclosuresWe use any of the following to comply with our disclosure obligations under Regulation FD: press releases, SEC filings, public conference calls, or our websites. We routinely post important informationon our websites at www.eqcre.com and www.mreic.reit, including information that may be deemed to be material. We encourage investors and other interested parties to monitor these distributionchannels for material disclosures.
No Offer or SolicitationThis communication is not intended to and does not constitute an offer to sell or the solicitation of an offer to buy, sell or solicit any securities or any proxy, vote or approval in any jurisdiction pursuantto or in connection with the proposed merger or otherwise, nor shall there be any sale of securities in any jurisdiction in which such offer, solicitation or sale would be unlawful prior to registration orqualification under the securities laws of any such jurisdiction. No offer of securities shall be deemed to be made except by means of a prospectus meeting the requirements of Section 10 of theSecurities Act of 1933, as amended.
Additional Information andWhere to Find ItIn connection with the proposed merger, Equity Commonwealth intends to file a registration statement on Form S‐4 with the U.S. Securities and Exchange Commission (“SEC”) to register the commonshares of Equity Commonwealth to be issued pursuant to the merger. The registration statement will include a prospectus and joint proxy / solicitation statement which will be sent to the commonshareholders of Equity Commonwealth and the common shareholders of Monmouth seeking their respective approvals of the merger (the “solicitation statement / prospectus”). Equity Commonwealthand Monmouth may also file other documents regarding the proposed merger with the SEC. This communication is not intended to be, and is not, a substitute for such filings or for any other documentthat Equity Commonwealth and/or Monmouth may file with the SEC in connection with the proposed merger. Shareholders are urged to read the solicitation statement/prospectus, as well as anyamendment or supplement thereto and any other relevant documents filed with the SEC in connection with the proposed merger, when they become available, because they will contain importantinformation about Equity Commonwealth, Monmouth and the proposed mergers. Investors and security holders will be able to obtain free copies of the registration statement and solicitationstatement / prospectus and other documents filed with the SEC, when they become available, through the website maintained by the SEC at www.sec.gov. Copies of documents filed with the SEC willalso be available free of charge from Equity Commonwealth and Monmouth using the sources indicated below.
42

Participants in the SolicitationEquity Commonwealth and Monmouth and certain of their respective directors and executive officers and other employees may be deemed to be participants in the solicitation of proxies inconnection with the proposed merger under the rules of the SEC. Investors may obtain information regarding the names, affiliations and interests of directors and executive officers of EquityCommonwealth in Equity Commonwealth’s proxy statement for its 2021 annual meeting of shareholders, which was filed with the SEC on April 27, 2021, as well as in its other filings with theSEC. Information about Monmouth’s directors and executive officers is available in Monmouth’s Annual Report on Form 10‐K for Monmouth’s fiscal year ended September 30, 2020, filed withthe SEC on November 23, 2020, and in other documents filed by Monmouth with the SEC. Other information regarding participants in the proxy solicitation and a description of their direct andindirect interests, by security holdings or otherwise, will be included in the registration statement on Form S‐4, the solicitation statement / prospectus and other relevant materials to be filedwith the SEC regarding the proposed merger (if and when they become available). You may obtain free copies of these documents at the SEC’s website at www.sec.gov. Copies of documentsfiled with the SEC will also be available free of charge from Equity Commonwealth and Monmouth using the sources indicated below.
Forward‐Looking StatementsSome of the statements contained in this press release constitute forward‐looking statements within the meaning of the federal securities laws, including, but not limited to, statementsregarding consummating the merger, asset sales and other transactions described herein and the timing thereof. Any forward‐looking statements contained in this press release are intended tobe made pursuant to the safe harbor provisions of Section 21E of the Securities Exchange Act of 1934, as amended. Forward‐looking statements relate to expectations, beliefs, projections,future plans and strategies, anticipated events or trends and similar expressions concerning matters that are not historical facts. In some cases, you can identify forward‐looking statements bythe use of forward‐looking terminology such as “may,” “will,” “should,” “expects,” “intends,” “plans,” “anticipates,” “believes,” “estimates,” “predicts,” “potential,” or the negative of thesewords and phrases or similar words or phrases which are predictions of or indicate future events or trends and which do not relate solely to historical matters. You can also identify forward‐looking statements by discussions of strategy, plans or intentions.The forward‐looking statements contained in this press release reflect Equity Commonwealth’s and Monmouth’s current views about future events and are subject to numerous known andunknown risks, uncertainties, assumptions and changes in circumstances regarding Equity Commonwealth and Monmouth that may cause actual results to differ significantly from thoseexpressed in any forward‐looking statement, including, without limitation, (i) inability to complete the proposed merger because, among other reasons, one or more conditions to the closing ofthe proposed merger may not be satisfied or waived; (ii) uncertainty as to the timing of completion of the proposed merger; (iii) potential adverse effects or changes to relationships with EquityCommonwealth’s or Monmouth’s respective tenants, employees, service providers or other parties resulting from the announcement or completion of the proposed merger; (iv) the outcome ofany legal proceedings that may be instituted against the parties and others related to the merger agreement; (v) possible disruptions from the proposed merger that could harm EquityCommonwealth’s or Monmouth’s respective business, including current plans and operations; (vi) unexpected costs, charges or expenses resulting from the proposed merger; (vii) uncertainty ofthe expected financial performance of Equity Commonwealth following completion of the proposed merger, including the possibility that the benefits anticipated from the proposed merger willnot be realized or will not be realized within the expected time period; (viii) legislative, regulatory and economic developments; and (ix) unpredictability and severity of catastrophic events,including, but not limited to, acts of terrorism, outbreak of war or hostilities and epidemics and pandemics, including COVID‐19, as well as Equity Commonwealth’s or Monmouth’smanagement’s response to any of the aforementioned factors. These factors should not be construed as exhaustive and should be read in conjunction with other risk factors and cautionarystatements that are included in Equity Commonwealth’s and Monmouth’s SEC filings. Equity Commonwealth and Monmouth do not guarantee that the transactions and events described willhappen as described (or that they will happen at all).While forward‐looking statements reflect good faith beliefs, they are not guarantees of future performance. Equity Commonwealth and Monmouth disclaim any obligation to publicly update orrevise any forward‐looking statement to reflect changes in underlying assumptions or factors, of new information, data or methods, future events or other changes.
ContactsEquity Commonwealth ‐ Investors & MediaSarah Byrnes(312) 646‐[email protected] ‐ InvestorsBecky Coleridge(732) 577‐[email protected] ‐MediaAndrew Siegel / Jim GoldenJoele Frank(212) 355‐4449
43