Embed Size (px)
Citation preview
Monitoring Tomcat with JMX
Christopher SchultzChief Technology OfficerTotal Child Health, Inc.
* Slides available on the Linux Foundation / ApacheCon2016 web site and athttp://people.apache.org/~schultz/ApacheCon NA 2016/Monitoring Apache Tomcat withJMX.odp
Java Management Extensions
● Protocol and API for managing and monitoring
– Access data via JMX “Mbeans”
– Read and write bean attributes
– Invoke operations
– Receive notifications
● JVM exposes certain status
● Tomcat exposes certain status
Monitoring JVM
● Heap status
● Total, free, used memory
● Garbage collection
● GC pause times
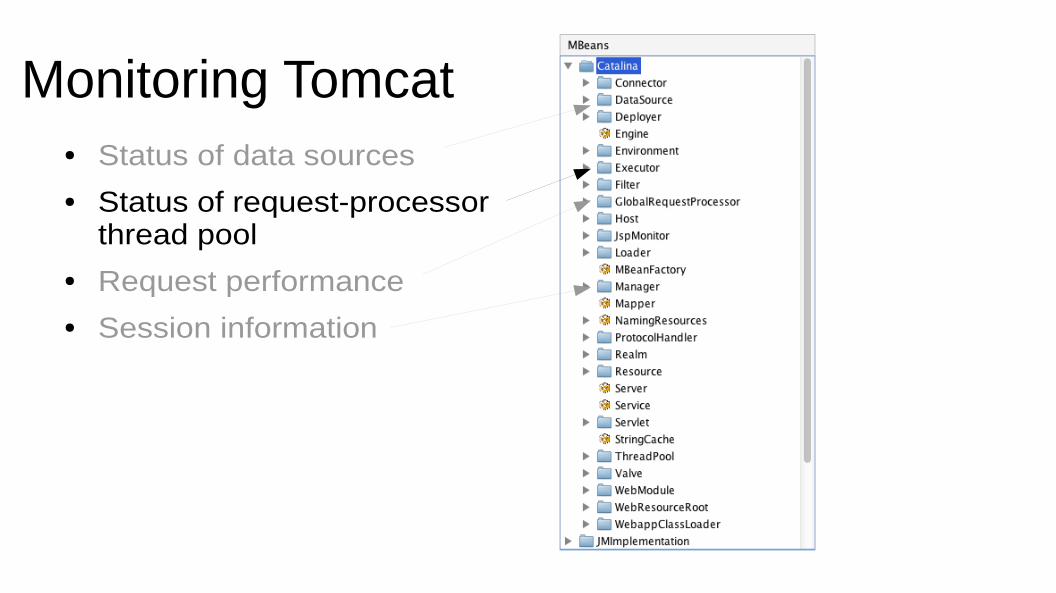
Monitoring Tomcat
● Status of connector
● Status of request-processor thread pool
● Status of data sources
● Request performance
JMX Tools
● jconsole (JDK)
● VisualVM (JDK, app bundle)
● Most profilers (e.g. YourKit, etc.)
● Custom tools using javax.management API
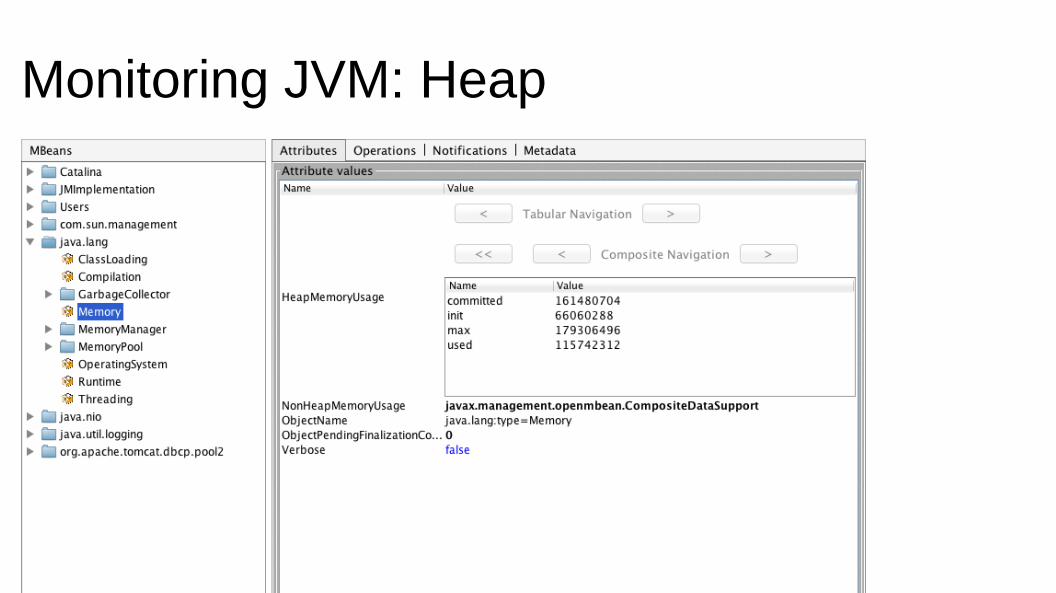
Monitoring JVM: Heap
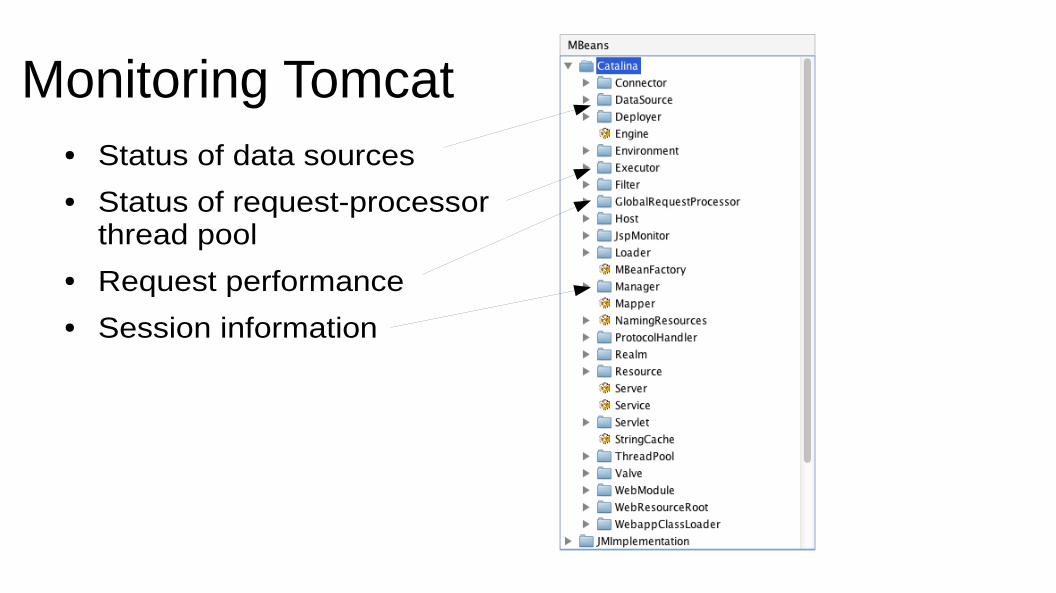
Monitoring Tomcat● Status of data sources
● Status of request-processorthread pool
● Request performance
● Session information
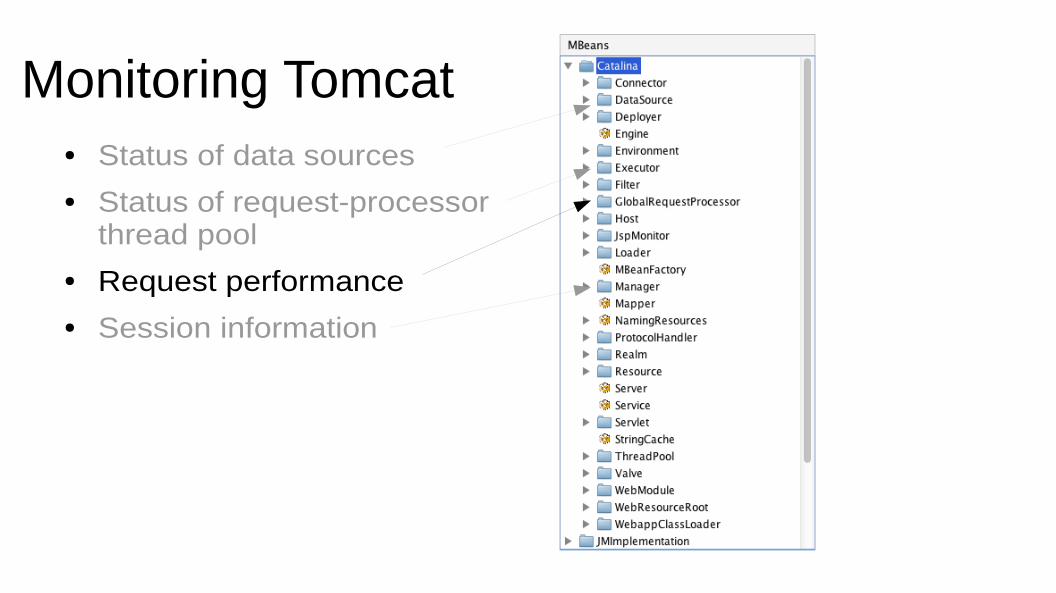
Monitoring Tomcat● Status of data sources
● Status of request-processorthread pool
● Request performance
● Session information
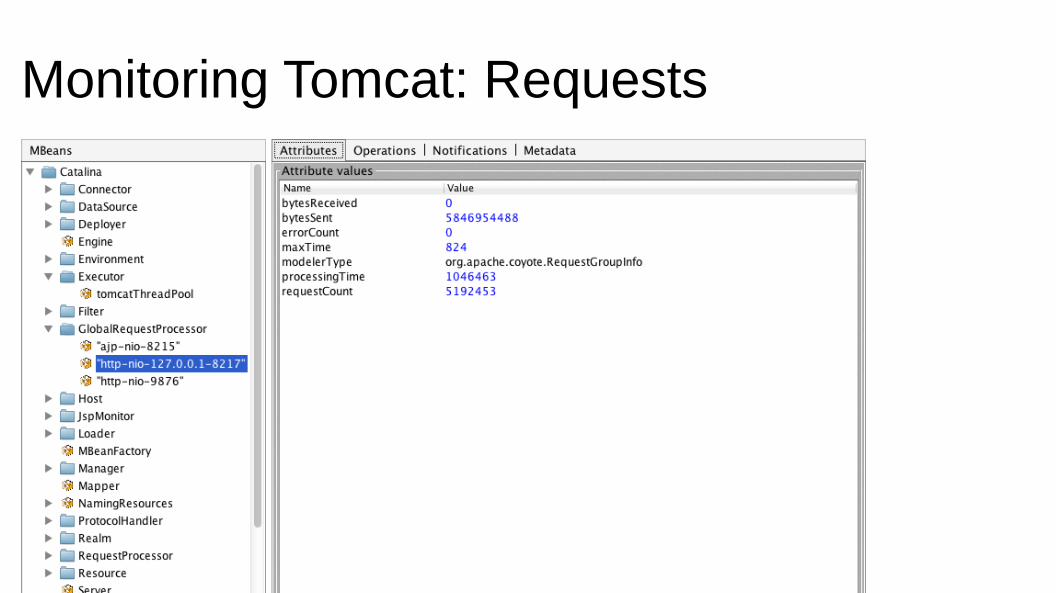
Monitoring Tomcat: Requests
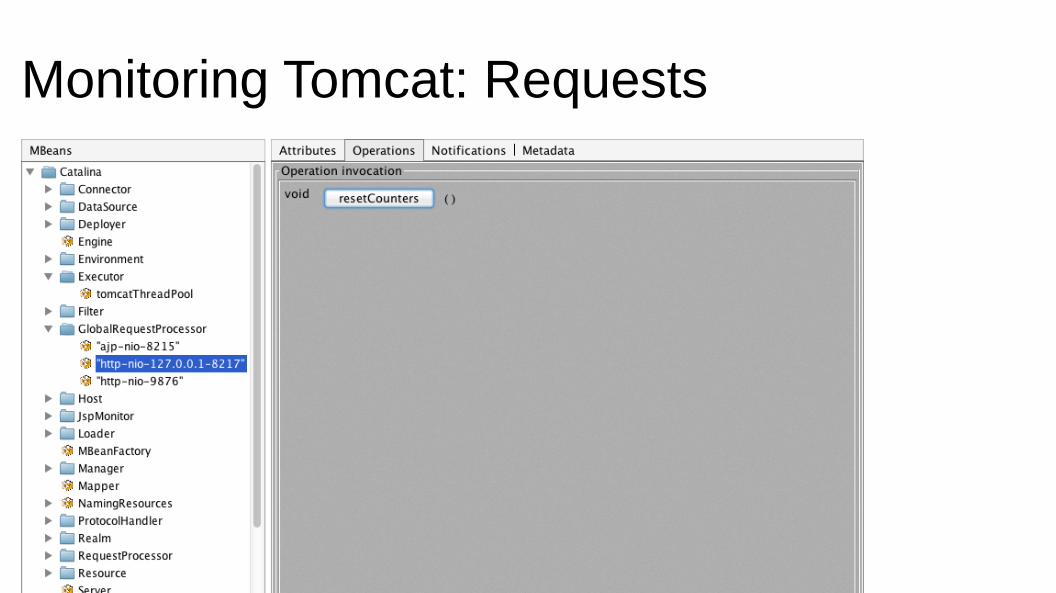
Monitoring Tomcat: Requests
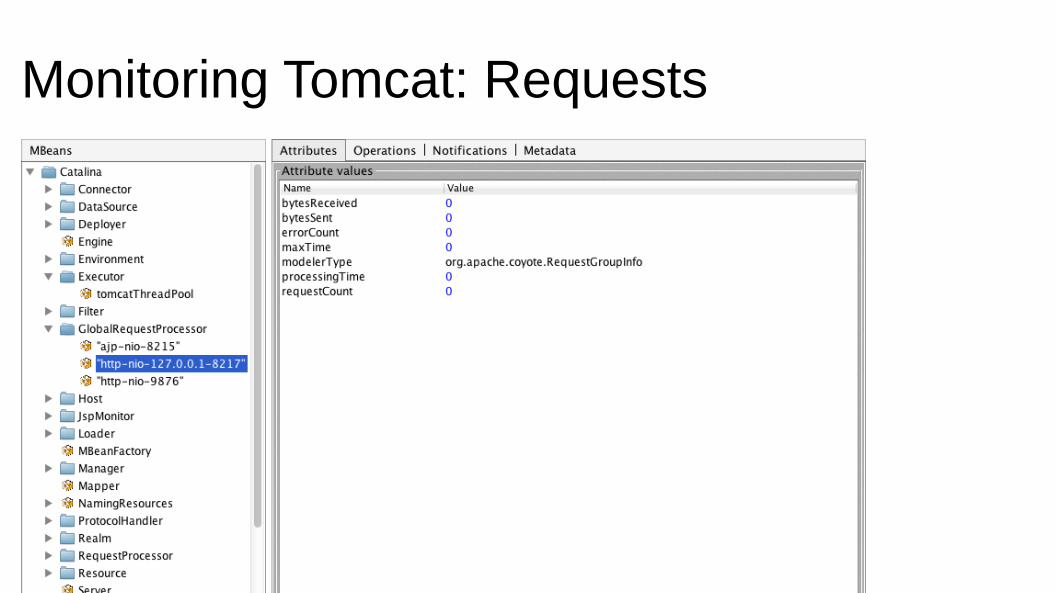
Monitoring Tomcat: Requests
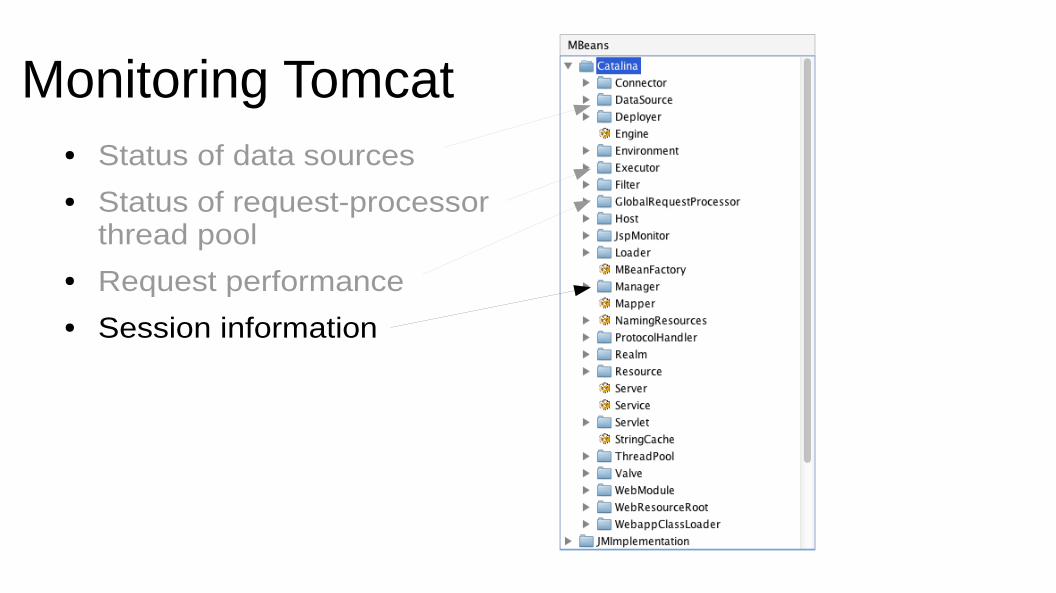
Monitoring Tomcat● Status of data sources
● Status of request-processorthread pool
● Request performance
● Session information
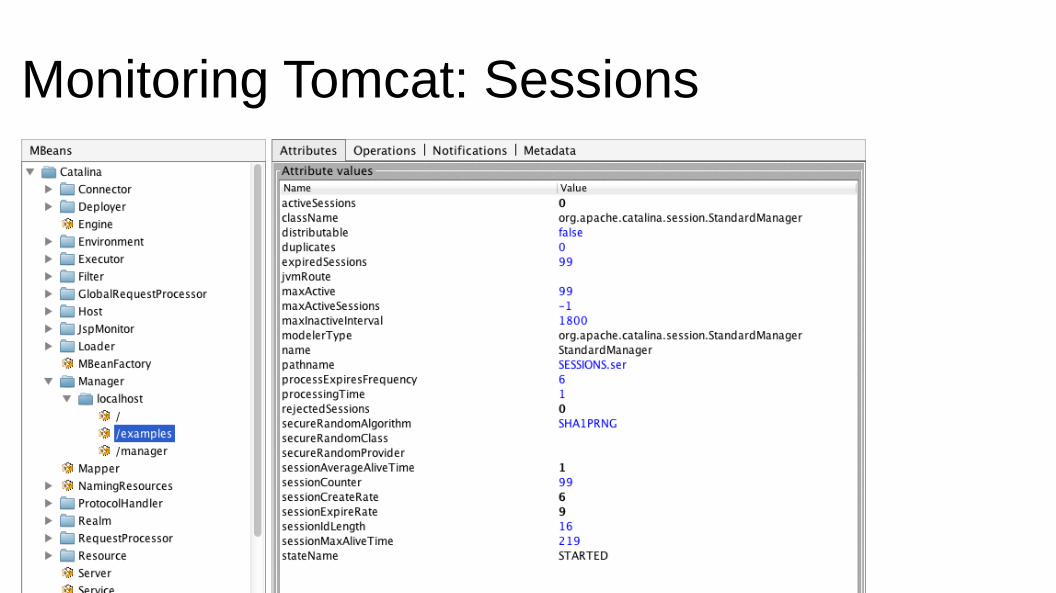
Monitoring Tomcat: Sessions
Monitoring Tomcat● Status of data sources
● Status of request-processorthread pool
● Request performance
● Session information
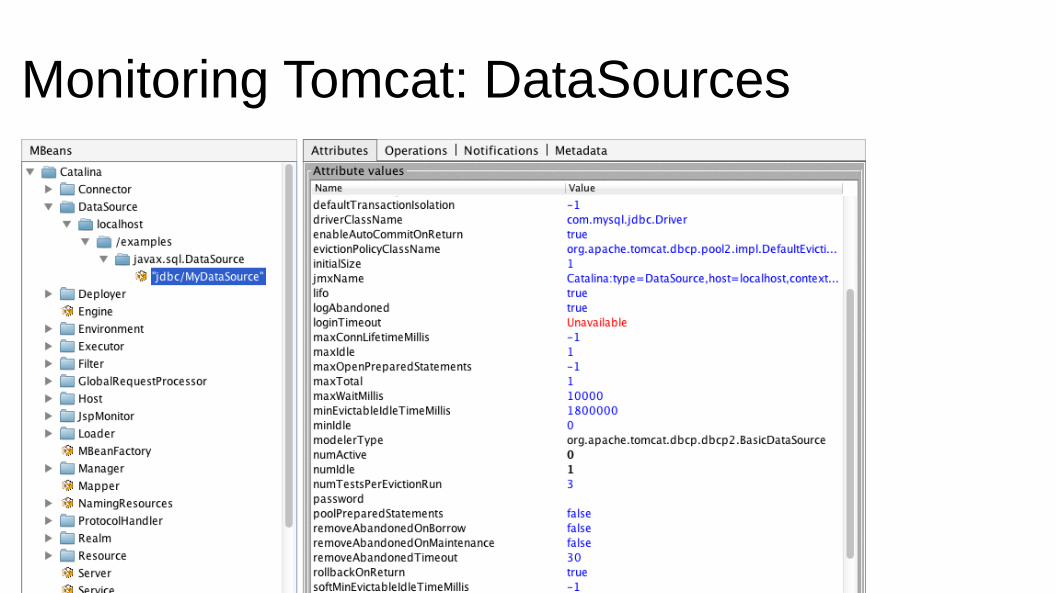
Monitoring Tomcat: DataSources
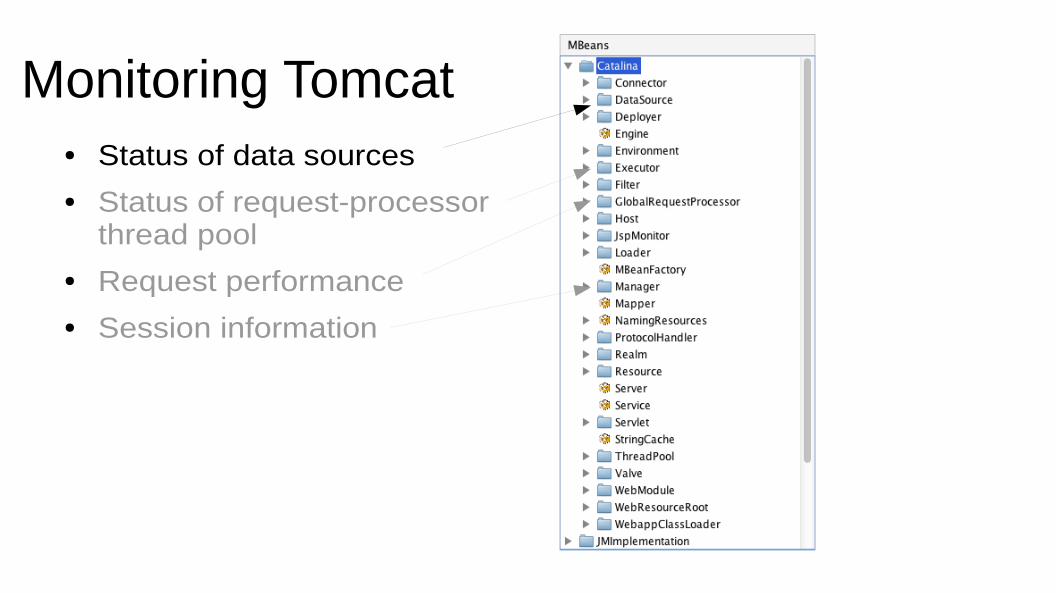
Monitoring Tomcat● Status of data sources
● Status of request-processorthread pool
● Request performance
● Session information
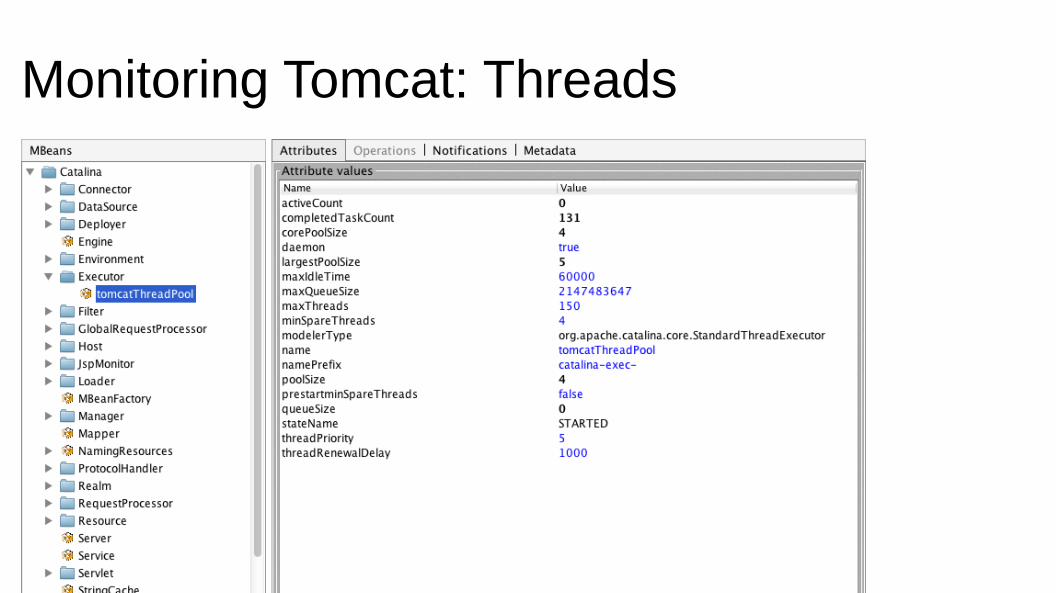
Monitoring Tomcat: Threads
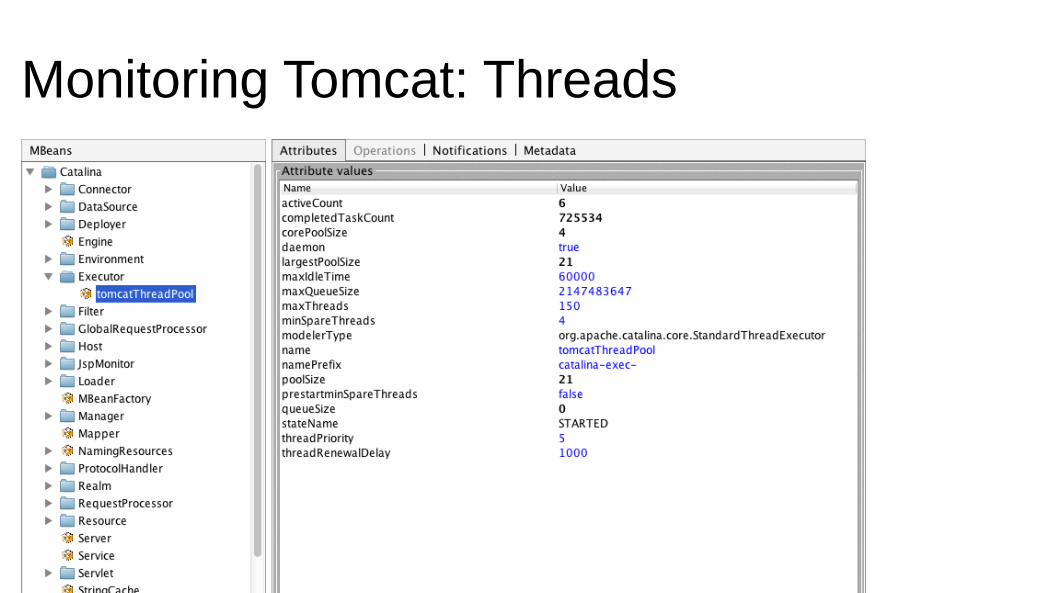
Monitoring Tomcat: Threads
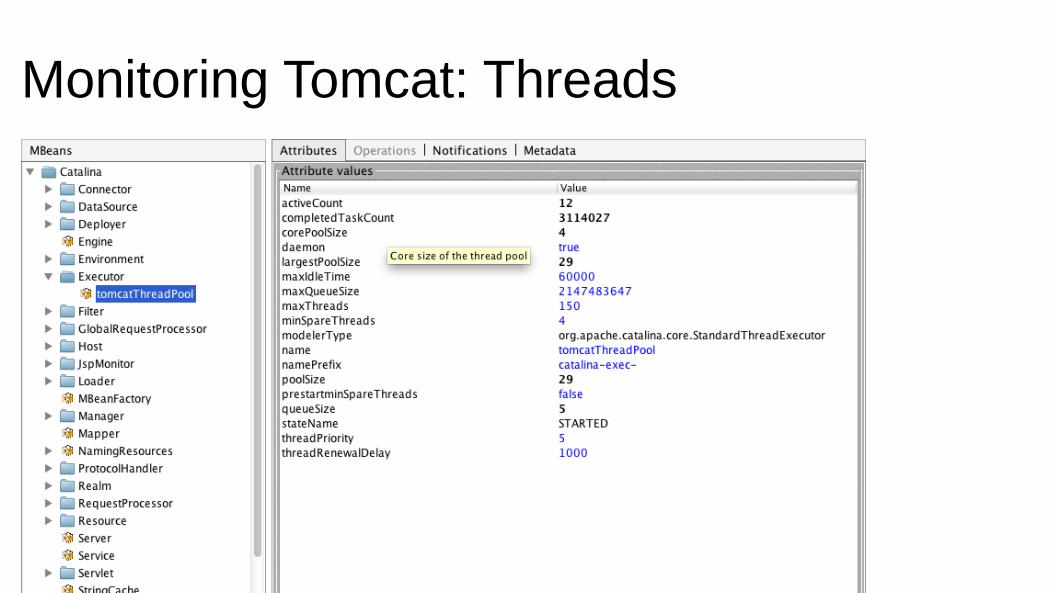
Monitoring Tomcat: Threads
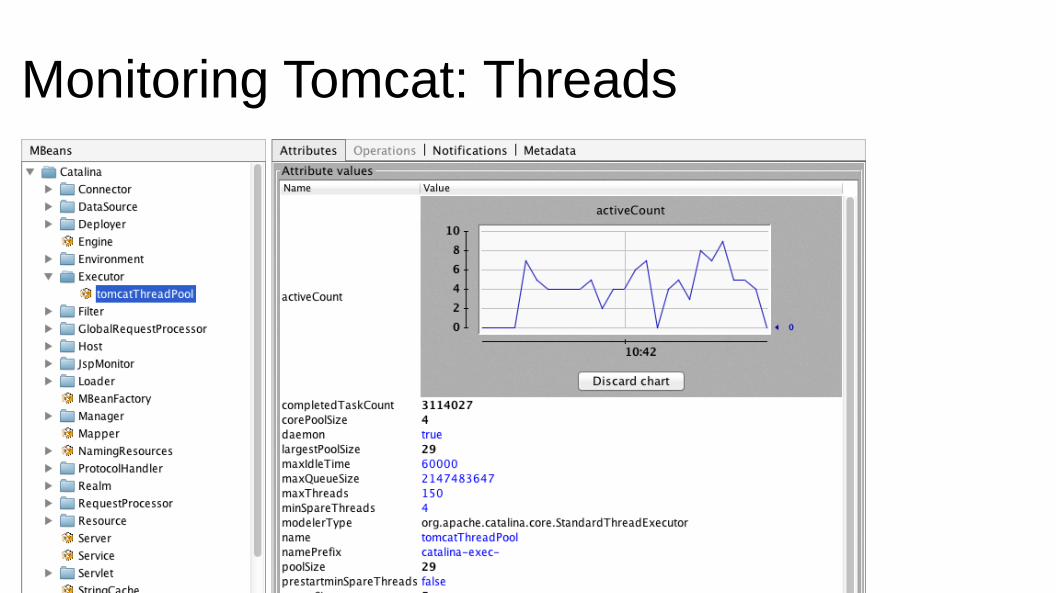
Monitoring Tomcat: Threads
Monitoring Your Application
● Monitor Application Processes
● Performance Metrics
● On-the-fly re-configuration
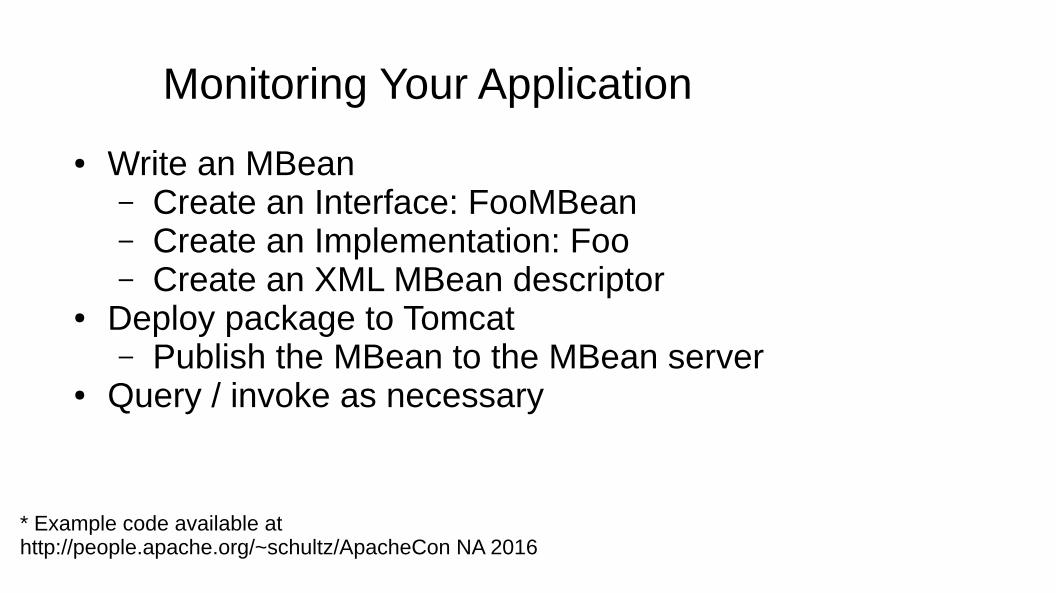
Monitoring Your Application
● Write an MBean– Create an Interface: FooMBean– Create an Implementation: Foo– Create an XML MBean descriptor
● Deploy package to Tomcat– Publish the MBean to the MBean server
● Query / invoke as necessary
* Example code available at http://people.apache.org/~schultz/ApacheCon NA 2016
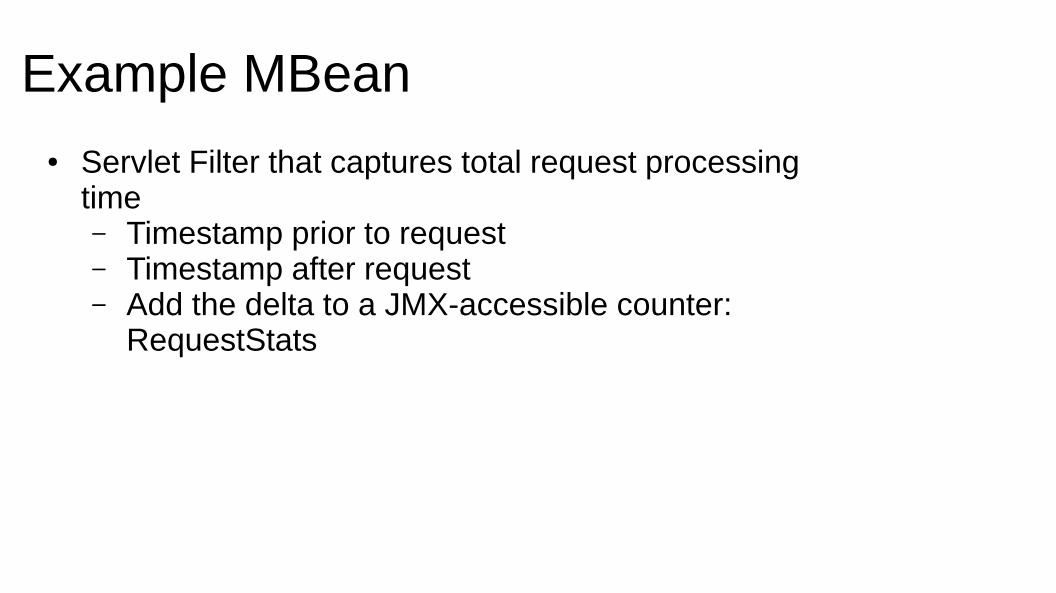
Example MBean
● Servlet Filter that captures total request processingtime– Timestamp prior to request– Timestamp after request– Add the delta to a JMX-accessible counter:
RequestStats
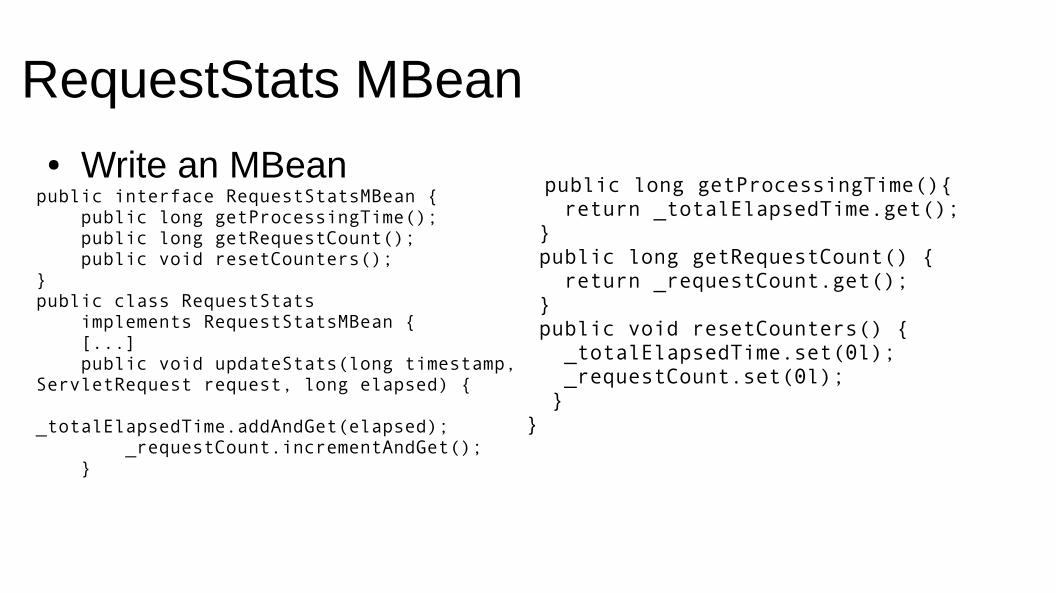
RequestStats MBean● Write an MBean
public interface RequestStatsMBean { public long getProcessingTime(); public long getRequestCount(); public void resetCounters();}public class RequestStats implements RequestStatsMBean { [...] public void updateStats(long timestamp,ServletRequest request, long elapsed) { _totalElapsedTime.addAndGet(elapsed); _requestCount.incrementAndGet(); }
public long getProcessingTime(){ return _totalElapsedTime.get(); } public long getRequestCount() { return _requestCount.get(); } public void resetCounters() { _totalElapsedTime.set(0l); _requestCount.set(0l); }}
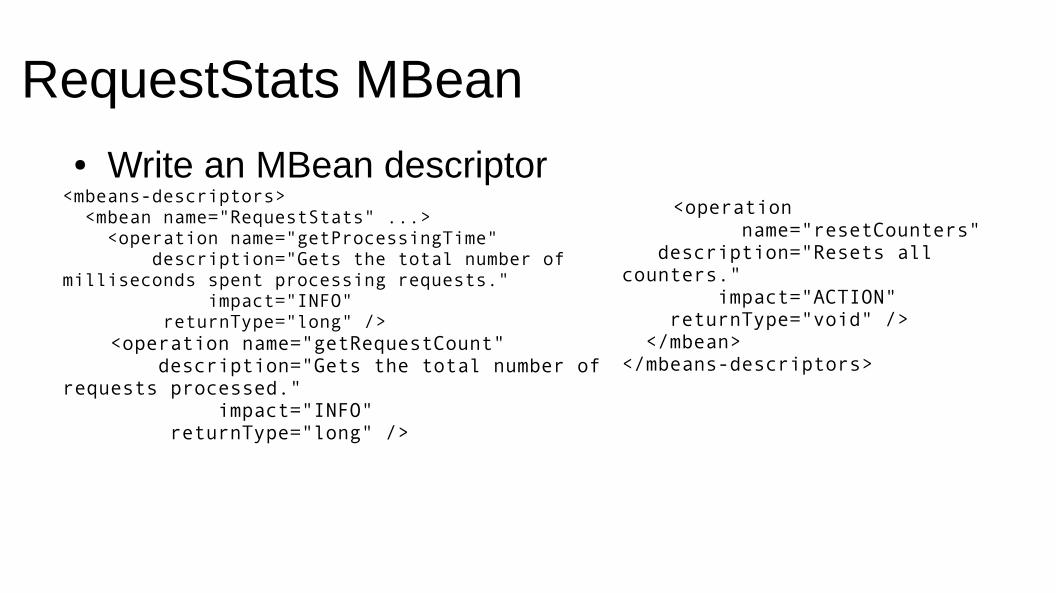
RequestStats MBean● Write an MBean descriptor
<mbeans-descriptors> <mbean name="RequestStats" ...> <operation name="getProcessingTime" description="Gets the total number ofmilliseconds spent processing requests." impact="INFO" returnType="long" /> <operation name="getRequestCount" description="Gets the total number ofrequests processed." impact="INFO" returnType="long" />
<operation name="resetCounters" description="Resets allcounters." impact="ACTION" returnType="void" /> </mbean></mbeans-descriptors>
RequestStats MBean● Create JAR
– Java interface
– Java implementation
– mbeans-descriptors.xml
● Put JAR into $CATALINA_BASE/lib
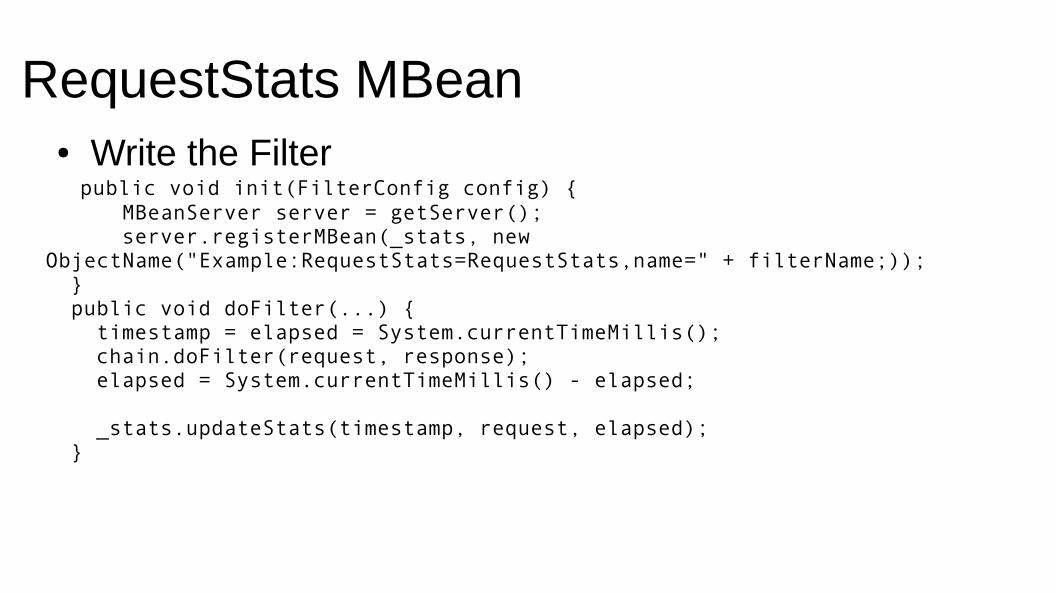
RequestStats MBean● Write the Filter
public void init(FilterConfig config) { MBeanServer server = getServer(); server.registerMBean(_stats, newObjectName("Example:RequestStats=RequestStats,name=" + filterName;)); } public void doFilter(...) { timestamp = elapsed = System.currentTimeMillis(); chain.doFilter(request, response); elapsed = System.currentTimeMillis() - elapsed;
_stats.updateStats(timestamp, request, elapsed); }
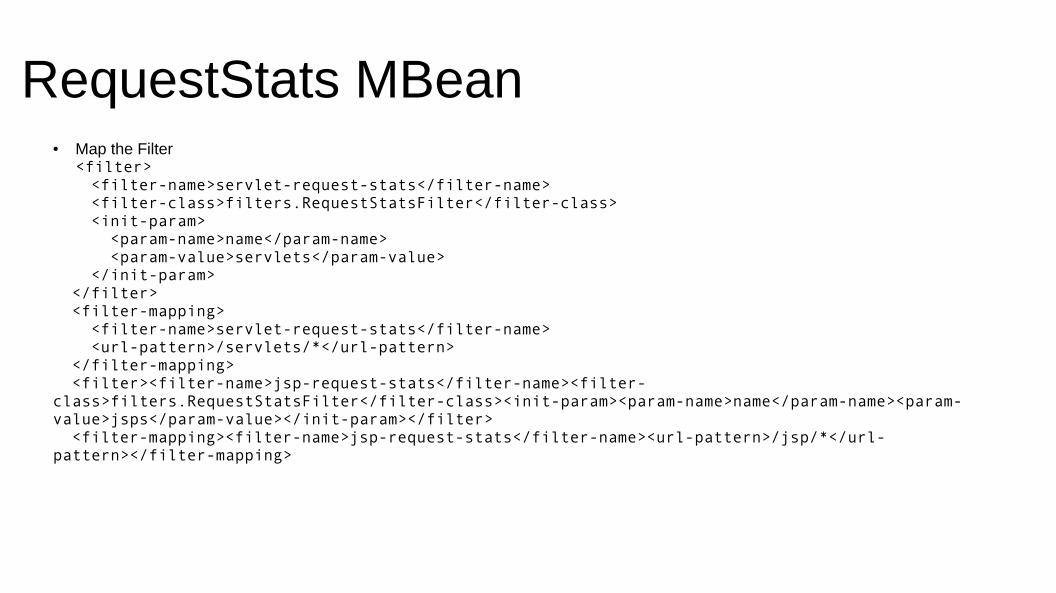
RequestStats MBean● Map the Filter <filter> <filter-name>servlet-request-stats</filter-name> <filter-class>filters.RequestStatsFilter</filter-class> <init-param> <param-name>name</param-name> <param-value>servlets</param-value> </init-param> </filter> <filter-mapping> <filter-name>servlet-request-stats</filter-name> <url-pattern>/servlets/*</url-pattern> </filter-mapping> <filter><filter-name>jsp-request-stats</filter-name><filter-class>filters.RequestStatsFilter</filter-class><init-param><param-name>name</param-name><param-value>jsps</param-value></init-param></filter> <filter-mapping><filter-name>jsp-request-stats</filter-name><url-pattern>/jsp/*</url-pattern></filter-mapping>
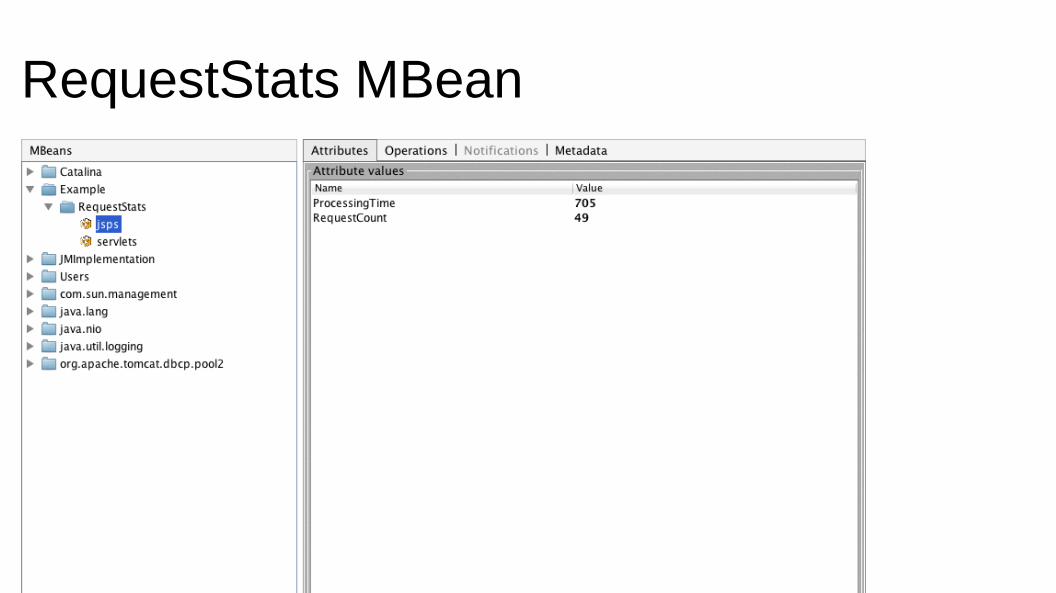
RequestStats MBean
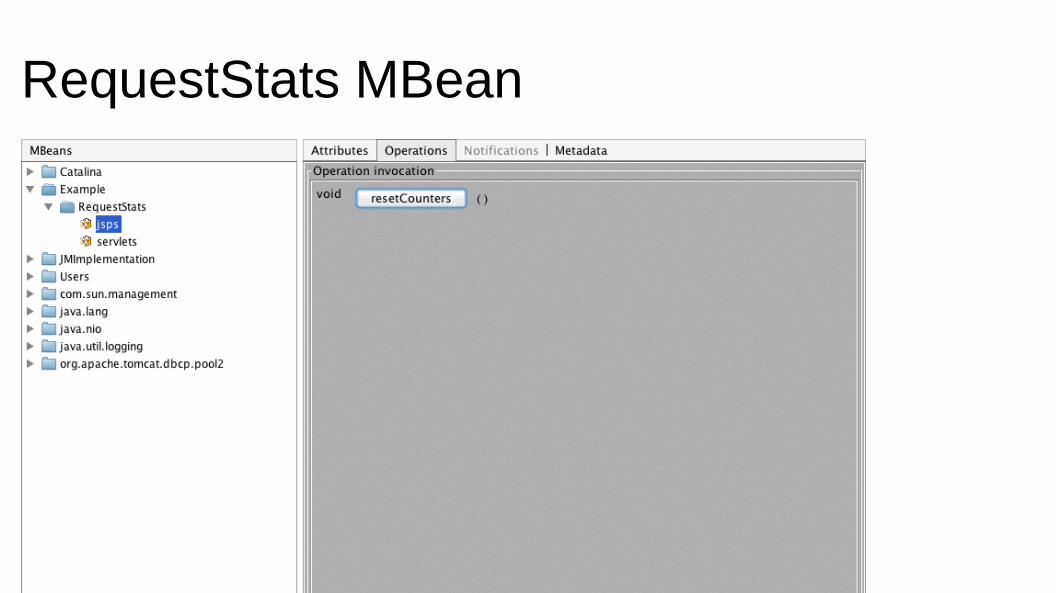
RequestStats MBean
Automated Monitoring
● Remote Access
● Large Scale
● Constant
Automated Monitoring
● Remote Access
● Large Scale
● Constant
● Need more tools!
Automated Monitoring
● Nagios
– Simple
– Flexible
– Well-deployed
– No-cost community version available
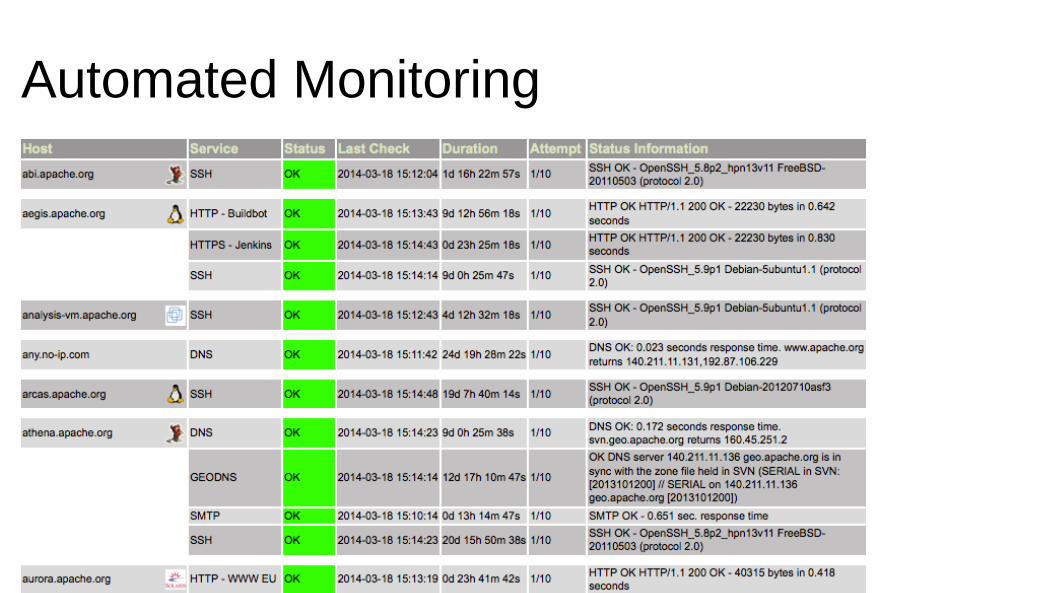
Automated Monitoring
Nagios Monitoring
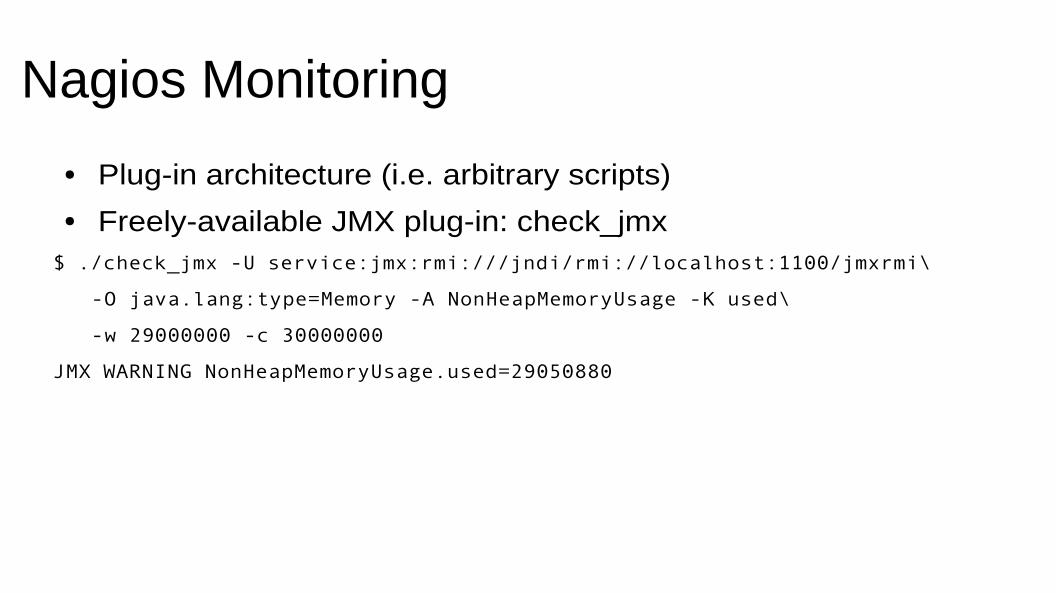
● Plug-in architecture (i.e. arbitrary scripts)
● Freely-available JMX plug-in: check_jmx$ ./check_jmx -U service:jmx:rmi:///jndi/rmi://localhost:1100/jmxrmi\
-O java.lang:type=Memory -A NonHeapMemoryUsage -K used\
-w 29000000 -c 30000000
JMX WARNING NonHeapMemoryUsage.used=29050880
Nagios Monitoring
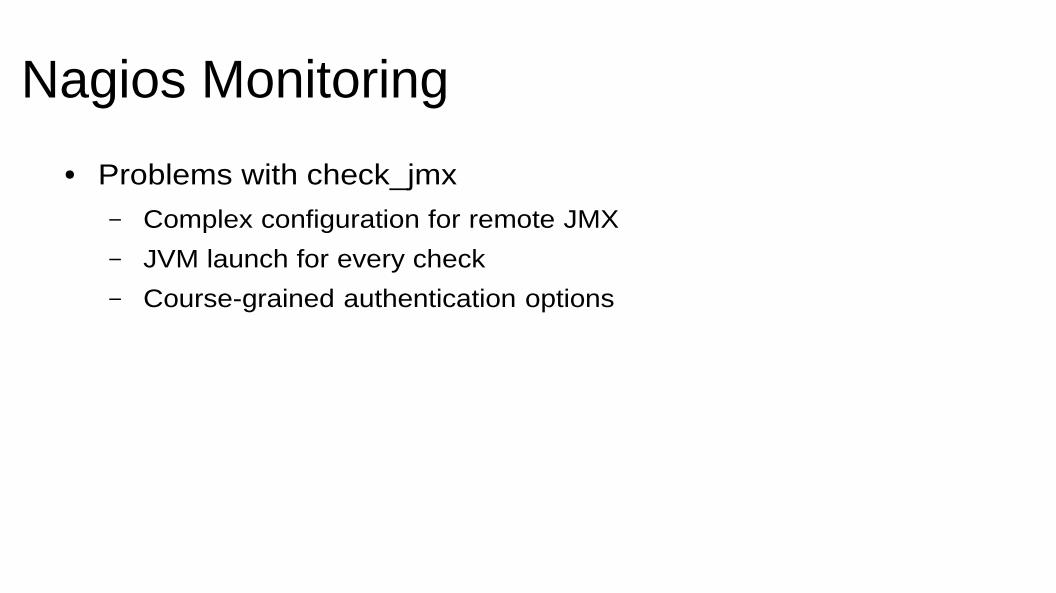
● Problems with check_jmx
– Complex configuration for remote JMX
– JVM launch for every check
– Course-grained authentication options
Nagios Monitoring
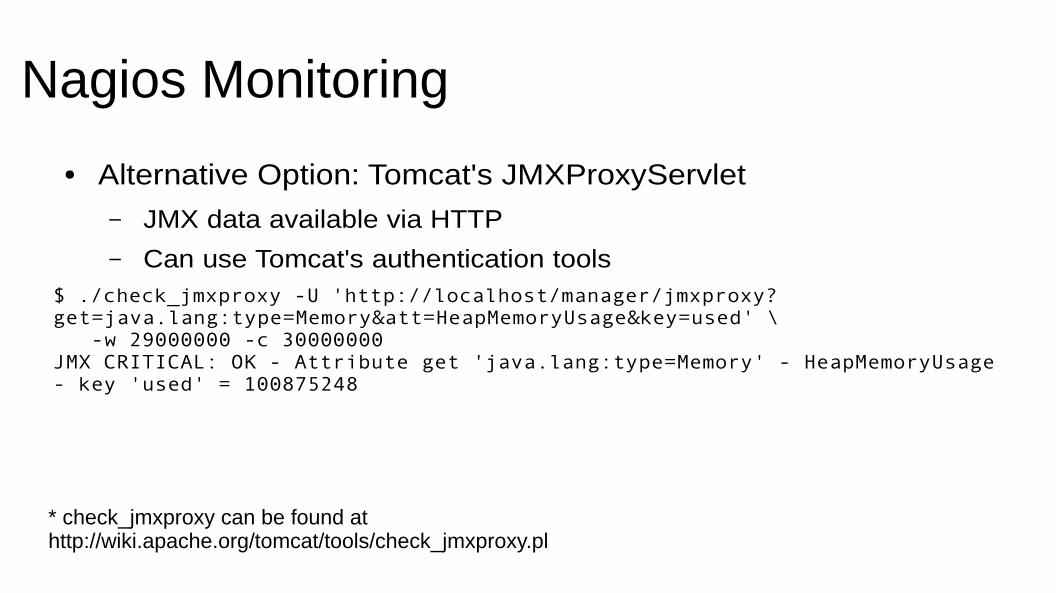
● Alternative Option: Tomcat's JMXProxyServlet
– JMX data available via HTTP
– Can use Tomcat's authentication tools$ ./check_jmxproxy -U 'http://localhost/manager/jmxproxy?get=java.lang:type=Memory&att=HeapMemoryUsage&key=used' \ -w 29000000 -c 30000000JMX CRITICAL: OK - Attribute get 'java.lang:type=Memory' - HeapMemoryUsage- key 'used' = 100875248
* check_jmxproxy can be found athttp://wiki.apache.org/tomcat/tools/check_jmxproxy.pl
Nagios Monitoring
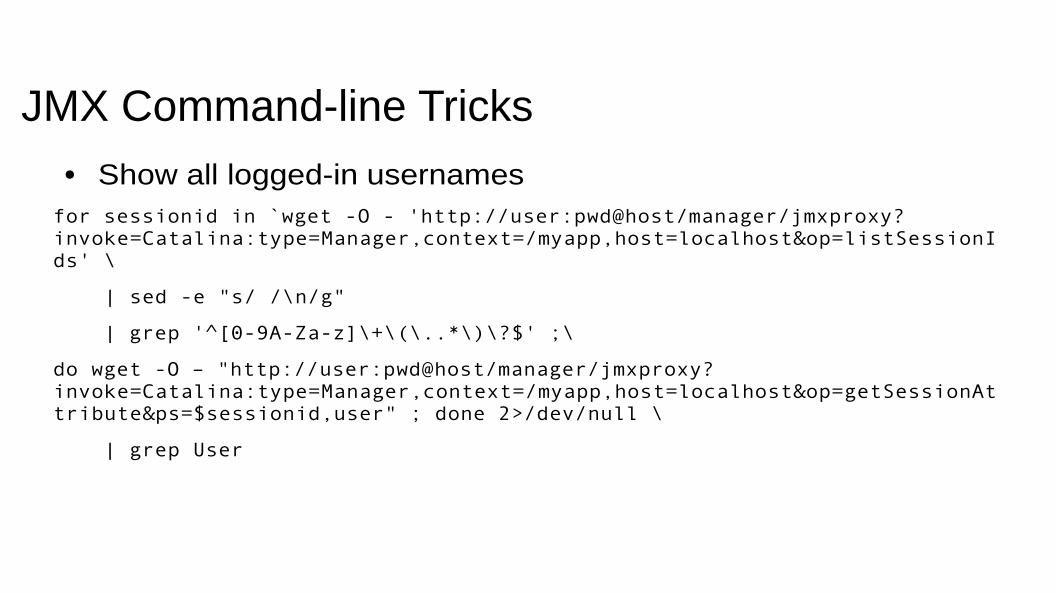
JMX Command-line Tricks● Show all logged-in usernamesfor sessionid in `wget -O - 'http://user:pwd@host/manager/jmxproxy?invoke=Catalina:type=Manager,context=/myapp,host=localhost&op=listSessionIds' \
| sed -e "s/ /\n/g"
| grep '^[0-9A-Za-z]\+\(\..*\)\?$' ;\
do wget -O – "http://user:pwd@host/manager/jmxproxy?invoke=Catalina:type=Manager,context=/myapp,host=localhost&op=getSessionAttribute&ps=$sessionid,user" ; done 2>/dev/null \
| grep User
Tracking Values Over Time● Some metrics are best observed as deltas
– Session count
– Request error count
● Requires that you have a history of data
● Requires that you consult the history of that data
● check_jmxproxy provides such capabilities
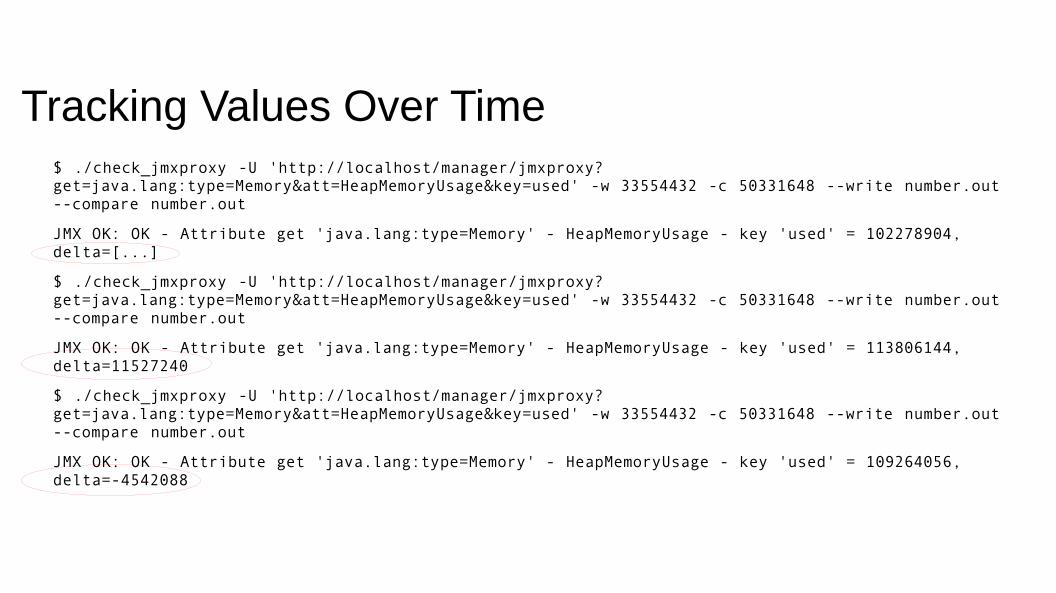
Tracking Values Over Time$ ./check_jmxproxy -U 'http://localhost/manager/jmxproxy?get=java.lang:type=Memory&att=HeapMemoryUsage&key=used' -w 33554432 -c 50331648 --write number.out--compare number.out
JMX OK: OK - Attribute get 'java.lang:type=Memory' - HeapMemoryUsage - key 'used' = 102278904,delta=[...]
$ ./check_jmxproxy -U 'http://localhost/manager/jmxproxy?get=java.lang:type=Memory&att=HeapMemoryUsage&key=used' -w 33554432 -c 50331648 --write number.out--compare number.out
JMX OK: OK - Attribute get 'java.lang:type=Memory' - HeapMemoryUsage - key 'used' = 113806144,delta=11527240
$ ./check_jmxproxy -U 'http://localhost/manager/jmxproxy?get=java.lang:type=Memory&att=HeapMemoryUsage&key=used' -w 33554432 -c 50331648 --write number.out--compare number.out
JMX OK: OK - Attribute get 'java.lang:type=Memory' - HeapMemoryUsage - key 'used' = 109264056,delta=-4542088
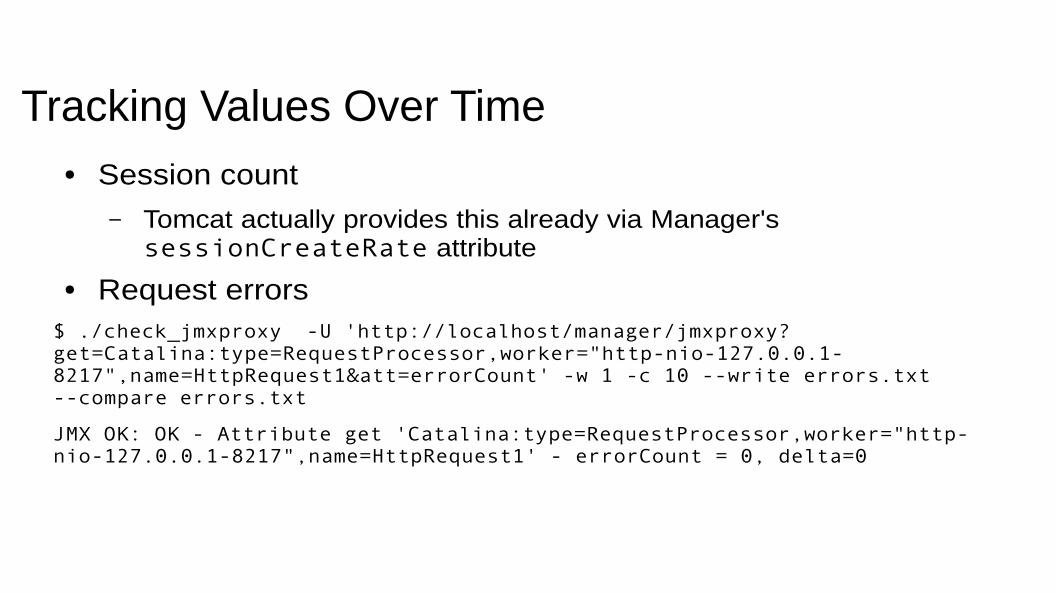
Tracking Values Over Time● Session count
– Tomcat actually provides this already via Manager'ssessionCreateRate attribute
● Request errors$ ./check_jmxproxy -U 'http://localhost/manager/jmxproxy?get=Catalina:type=RequestProcessor,worker="http-nio-127.0.0.1-8217",name=HttpRequest1&att=errorCount' -w 1 -c 10 --write errors.txt--compare errors.txt
JMX OK: OK - Attribute get 'Catalina:type=RequestProcessor,worker="http-nio-127.0.0.1-8217",name=HttpRequest1' - errorCount = 0, delta=0
Detecting OutOfMemory● Many sources of OOME
– Heap exhaustion
– PermGen exhaustion
– Hit thread limit
– Hit file descriptor limit
Detecting OutOfMemory● Two types of heap OOME
– One thread generates lots of local references
– All threads collaborate to generate globally-reachable objects (e.g.session data)
● Former is recoverable, latter is not
● You want to be notified in any case
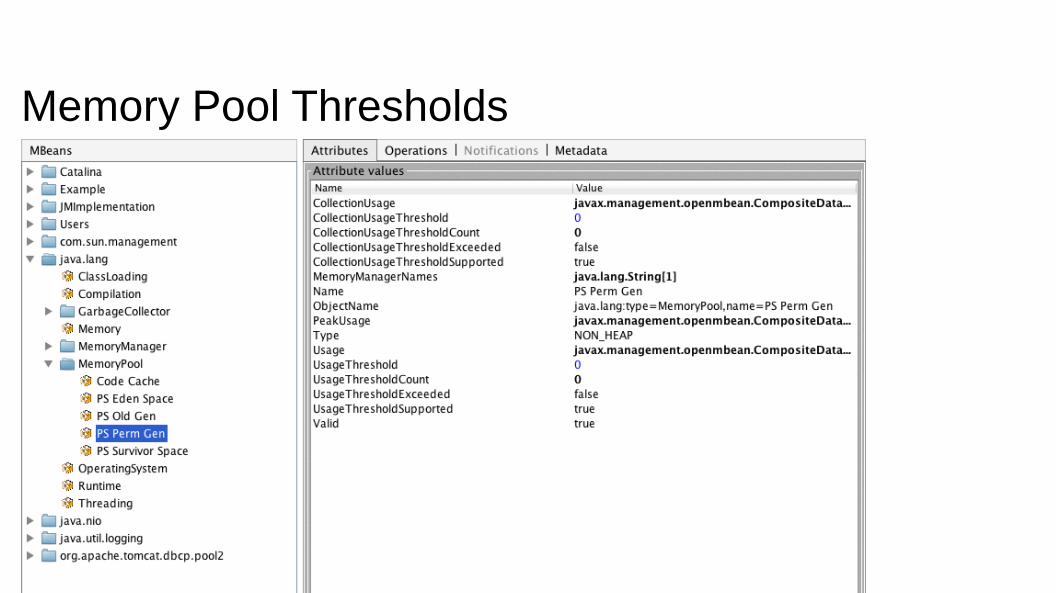
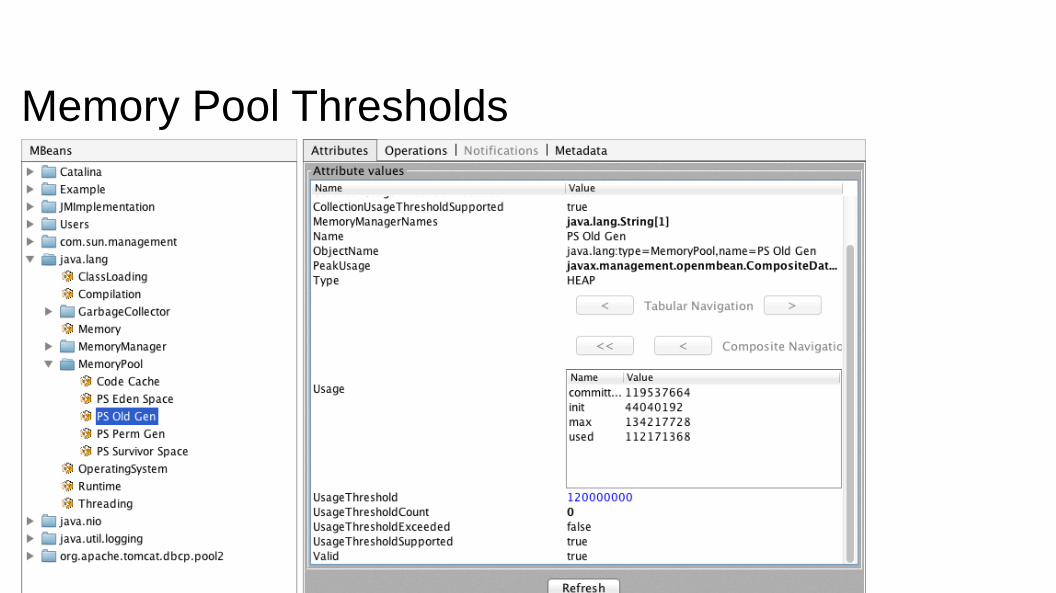
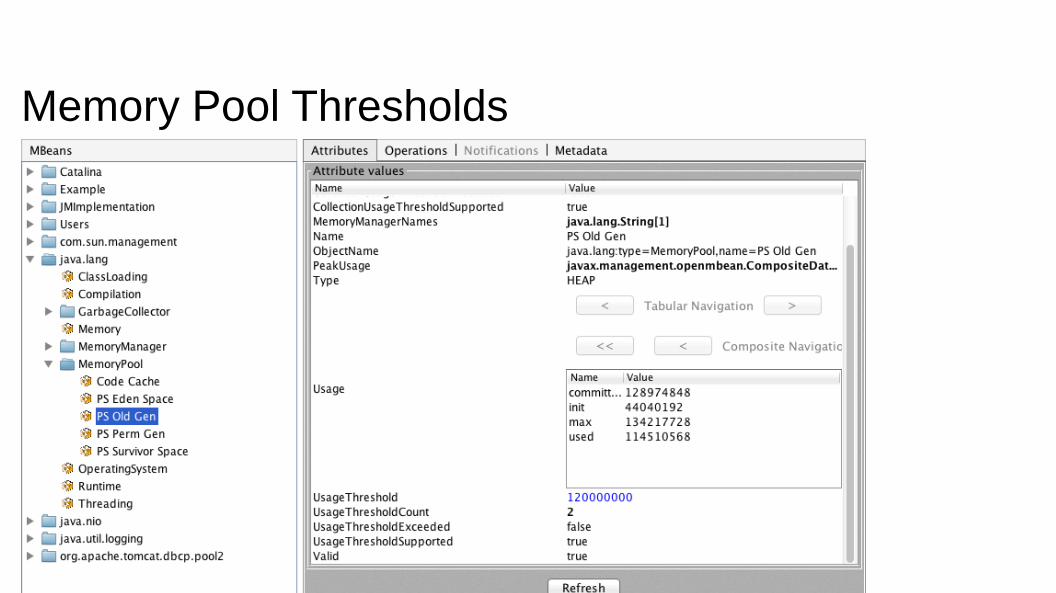
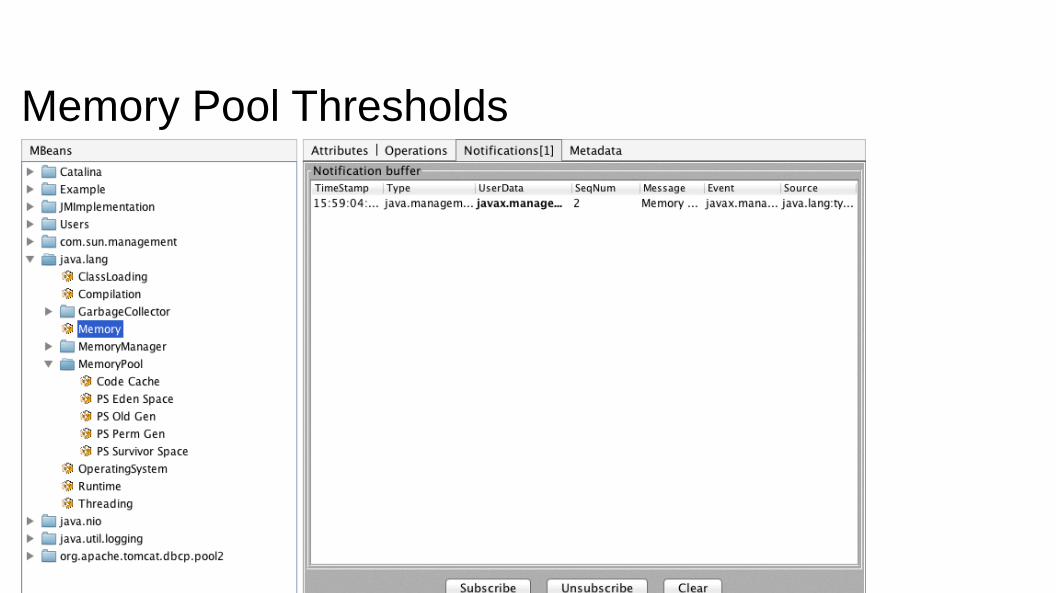
Memory Pool Thresholds
Memory Pool Thresholds
Memory Pool Thresholds
Memory Pool Thresholds
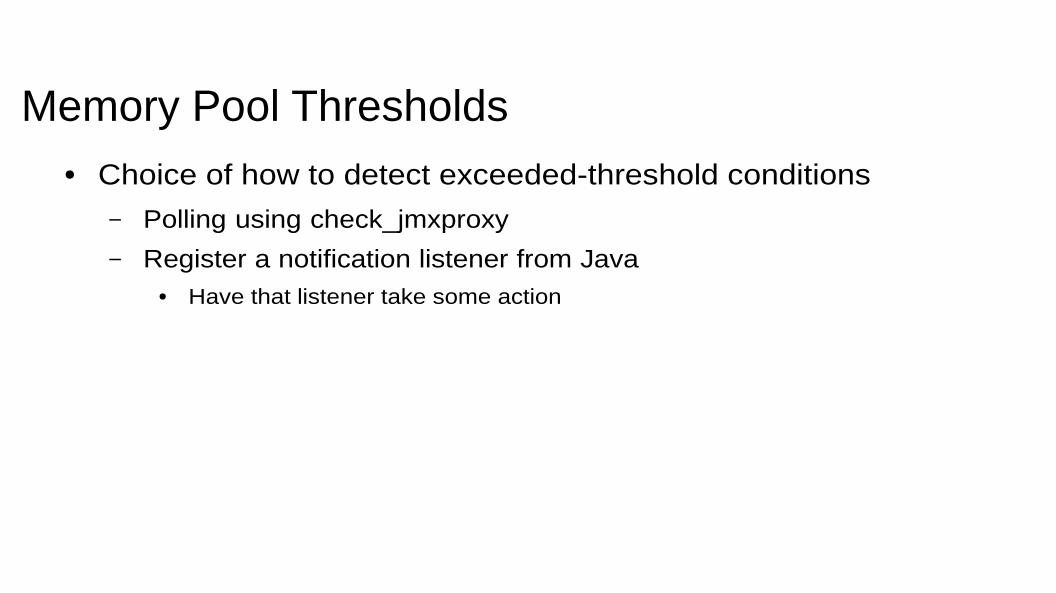
Memory Pool Thresholds● Choice of how to detect exceeded-threshold conditions
– Polling using check_jmxproxy
– Register a notification listener from Java● Have that listener take some action
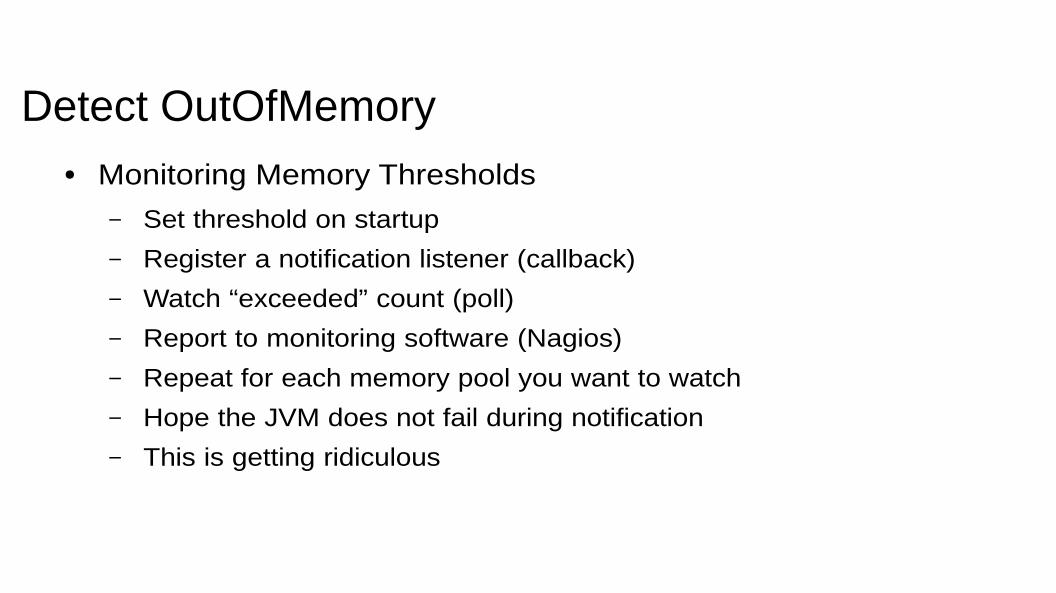
Detect OutOfMemory● Monitoring Memory Thresholds
– Set threshold on startup
– Register a notification listener (callback)
– Watch “exceeded” count (poll)
– Report to monitoring software (Nagios)
– Repeat for each memory pool you want to watch
– Hope the JVM does not fail during notification
– This is getting ridiculous
Detecting OutOfMemory● JVM has an easier way
● Use -XX:OnOutOfMemoryError to run a command on first OOME detected by the JVM
● Need a command to notify Nagios
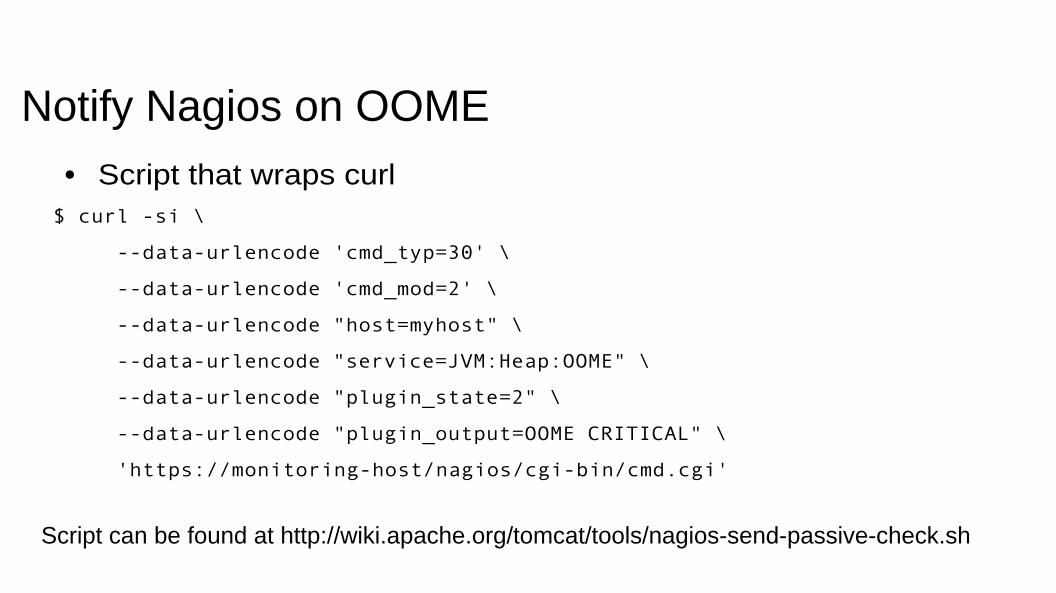
Notify Nagios on OOME● Script that wraps curl$ curl -si \
--data-urlencode 'cmd_typ=30' \
--data-urlencode 'cmd_mod=2' \
--data-urlencode "host=myhost" \
--data-urlencode "service=JVM:Heap:OOME" \
--data-urlencode "plugin_state=2" \
--data-urlencode "plugin_output=OOME CRITICAL" \
'https://monitoring-host/nagios/cgi-bin/cmd.cgi'
Script can be found at http://wiki.apache.org/tomcat/tools/nagios-send-passive-check.sh
Monitoring Tomcat with JMX● JMX Provides Monitoring and Management of JVMs
● Tomcat exposes a great amount of information via JMX
● Applications can expose anything to JMX via MBeans
● JRE ships with tools for light JMX interaction
● Practical use of JMX requires some additional tools
Resources● Presentation Slides
http://people.apache.org/~schultz/ApacheCon NA 2016/Monitoring ApacheTomcat with JMX.odp
● Nagios passive-check scripthttp://wiki.apache.org/tomcat/tools/nagios-send-passive-check.sh
● check_jmxproxyhttp://wiki.apache.org/tomcat/tools/check_jmxproxy.pl
● Special thanks to Christopher Blunck (MBeans info)http://oss.wxnet.org/mbeans.html