Embed Size (px)
Citation preview
Monitoring the Effect of Micro-oxygenation before Malolactic Fermentation on South African Pinotage Red Wine with Different Colour and Phenolic Analyses L. Geldenhuys 1 , A. Oberholster2, W.J. du Toit3
Department of Agriculture: Western Cape, Private Bag Xl, 7607 Elsenburg, South Africa Department of Viticulture and Enology, University of California, One Shields Avenue, Davis, CA 95616-8749, USA Department of Viticulture and Oenology, Private Bag Xl, 7620 Matieland (Stellenbosch), South Africa
Submitted for publication: January 2012 Accepted for publication: April 2012
Key words: micro-oxygenation, red wine, Pinotage, tannins, anthocyanins
The use of micro-oxygenation and its effect on the quality of the red wine varietal, Pinotage, is largely unknown. The influence of adding different oxygen dosages before malolactic fermentation on the phenolic composition and colour stabifisation of wine made from Pinotage was studied, and the suitabifity of certain spectrophotometric and RP-HPLC analyses to determine these changes were assessed in tanks of commercial lengths. Total oxygen dosages of 0 mgfL, 16 mgIL and 32 mgfL were applied, after which the wines underwent malolactic fermentation and maturation in the same tanks for two additional months. Decreases in anthocyanin concentration showed a strong inversely proportional correlation with increasing polymeric pigment concentration. This suggests that the addition of oxygen contributed to the early stabifisation of wine colour in Pinotage red wine. Overall, tannin concentrations were not significantly influenced by the oxygen treatments, although lower levels were observed in wines treated with oxygen. An important finding of the study was that there appeared to be little difference in the colour and phenolic composition of the wines between the 16 mgfL and 32 mgfL oxygen treatments. Good correlations were found between certain spectrophotometric techniques and the RP-HPLC analysis used to study changes induced by micro-oxygenation (total anthocyanins, total phenols). The colour and phenolic composition of Pinotage wine can be influenced before malolactic fermentation by micro-oxygenation. Some spectrophotometric phenolic analyses showed the same tendencies as observed with RP-HPLC (anthocyanins, monomeric flavan-3-ols, tannins), indicating their suitabifity to follow phenolic and colour changes induced by micro-oxygenation in Pinotage red wine.
INTRODUCTION Introducing oxygen to red wine in a controlled, quantifiable manner to simulate the advantages of oxygen exposure during barrel maturation (micro-oxygenation) has become increasingly popular in recent years. The oxygen dosage can be varied and can be applied after fennentation and during maturation. Various effects of oxygen have been identified by previous workers, most involving the formation of polymeric phenols in the wine and the stabilisation of wine colour (Castellari et al., 2000; McCord, 2003; Llaudy et al., 2006; Du Toit et aL, 2006a,b; Perez-Magarino et al., 2007; Gomez-Plaza & Cano-Lopez, 2011; Schmidtke et al., 2011).
Anthocyanins are responsible for the colour in red wine, but the monomeric forms are sensitive to decolourising by sulphur dioxide (502).Anthocyanins react with otherphenolic compounds, primarily flavan-3-ols, during fermentation and ageing to form more complex and stable polymeric pigments.
Several authors have elucidated the mechanisms involved in the formation of these more stable pigments (Remy et al., 2000; Romero & Bakker, 2000; Saucier et al., 2004). The proposed mechanisms involve direct condensation reactions between anthocyanins and flavanols, reactions involving acetaldehyde to form anthocyanin-tannin adducts linked by an ethyl bridge, and the formation of pyranoanthocyanins through the reaction between anthocyanins and yeast metabolites. These polymerisation reactions produce pigments that are less sensitive to the bleaching effect of sulphur dioxide and to changes in pH (Du Toit et al., 2006a).
Pinotage, developed in South Africa, is an important red wine cultivar of that country. Although De Beer et al. (2008) investigated the effect of oxygen additions (not performed with micro-oxygenation) to Pinotage wine after malolactic fermentation (MLF), to our knowledge there still is little published data on how different oxygen additions
* Corresponding author: [email protected] [Tel: +27 21 8082022; Fax: +27 21 80847811 Acknowledgements: The authors would like to thank P van Rensburg andMP Botes at Distell Winery for technical support; Winetech, THRIP and the NRF forfinancial support; andM Kiddfor statistical analyses of the data
S. Afr. J. EnoL Vitic., VoL 33, No. 2,2012 150

151
Pinotage and Micm-oxygenation
added before MLF affect the composition of Pinotage red wine. The objective of this study was thus to investigate what influence different oxygen additions before malolactic fermentation have on the colour and phenolic composition of a Pinotage wine, as well as how these effects evolve during short-term maturation. We also aimed to compare certain spectrophotometric analyses with those of HPLC to assess their suitability in tracking changes in the colour and phenolic composition of Pinotage red wine treated with micro-oxygenation.
MATERIALS AND METHODS Preparation of wine The experiment was performed at the Distell Winery, Stellenbosch, South Africa on cv. Pinotage during the 2008 harvest season. SO2 was added to the crushed grapes at 20 mg/L, while no SO2 was added to the wine after the completion of alcoholic fermentation. The wine was prepared with standard winemaking techniques using the Saccharomyces cerevisiae yeast NT 50 at 0.25 g/L according to the supplier's recommendations (Anchor Yeast, Biotechnologies, South Africa). After the completion of alcoholic fermentation, the wine was divided into six stainless steel tanks of 200 L each. The height of each tank was 3.2 m, which is similar to the height of tanks used in a commercial cellar. The wine was racked from the gross lees to prevent oxygen absorption by the yeast lees. The NTU was not measured.
Before the start of the experiment, the pH, titratable acidity (TA), volatile acidity (VA), sugar content, alcohol concentration and malic acid concentration were determined using a Grapescan FT 120 instrument (Foss Electric, Denmark) (Nieuwoudt et al., 2004). The pH of the wine was 3.70 and this was confirmed using a Metrohm titration unit (Metrohm Ltd., Switzerland). Alcoholic fermentation was considered to be complete when the residual sugar content of the wine was below 4 gIL. The FT 120 instrument showed that the wines were fermented dry (a sugar content of 2.80 g/L).
Six tanks were included in the final study, comprising of two controls (receiving no oxygen), two oxygenated tanks (receiving a total of 16 mg/L of oxygen applied over a period of eight days and thus receiving an average of 2 mg/LI day for eight consecutive days), and two oxygenated tanks receiving a total of 32 mg/L (thus receiving an average of 4 mg/Llday of oxygen applied over a period of eight days) The oxygen was introduced into the wine on a continuous basis by means of a micro-oxygenation unit supplied by Agrovin DosiOx (Spain), via a ceramic sparger positioned at the base of the tank. Oxygen additions took place just after the completion of alcoholic fermentation, before the onset of MLF.
Malolactic fermentation All the wines underwent MLF and were inoculated with CH16 (Christiaan Hansen; Oenococcus oeni) at 1 g/hL. Malolactic fermentation was conducted at 20°C and took 34 days to complete. Malic and lactic acid concentrations were monitored with a GrapescanFT 120 instrument (Foss Electric, Denmark) (Nieuwoudt et al., 2004). MLF was considered to be completed when the malic acid concentration was lower than 0.3 g/L.
Maturation After the completion of MLF and the taking of the post-MLF samples, 50 mg/L of sulphur dioxide was added to the wine and it was matured in the same tanks for a further two months. After this period, the wine was discarded.
Wine sampling Samples were taken at the bottom valve of each tank before the start of oxygen addition. After oxygenation, samples were taken at the bottom, middle and top valve of each tank, including the control. After malolactic fermentation and maturation, samples were taken at the bottom valve. Samples were immediately frozen in 100 mL glass vials and stored at -20°C.
Spectrophotometric analyses All spectrophotometric analyses were performed using an AnalyticJena Specord 50 UV/VIS spectrophotometer (Jena, Germany). Samples were centrifuged for 2 min at 2000 rpm to remove any solid particles that could influence the reading. All analyses were done at the same time to quantify all samples under the same conditions or with the same calibration curve, where possible. All analyses were performed in triplicate.
Colour and anthocyanin analyses Colour intensity and modified colour intensity were measured and calculated as the sum of the measurements taken at 420 nm, 520 nm and 620 nm (Boulton, 2001). The hue and modified hue were calculated by the absorbance at 420 nm divided by that at 520 nm (Somers & Evans, 1977).
Total anthocyanin concentration was determined using a method that is based on the properties of anthocyanins to vary in colour according to the pH and to be bleached by sulphur dioxide (Ribereau-Gayon et al., 2006). Wine samples (250 tL) were diluted into two test tubes, each containing 5 mL of 1 M hydrochloric acid in ethanol. To one test tube, 2 mL of water was added, and to the other 2 mL of a freshly prepared 5% sodium bisulphite solution. After 20 min the absorbance readings were taken at 520 nm in both samples and the difference in absorbance was multiplied by a constant, 875, to obtain the anthocyanin concentration in mg/L. The method measures mainly anthocyanins, but the contribution made by a small percentage of polymeric pigments may also be included in the reading. No standard is used in this method.
Analyses of monomeric flavanols Monomeric flavanols were measured with the aldehydic reagent, 4-dimethyl-aminocinnamaldehyde (DMAC), which reacts with all free meta-hydroxyl groups on the aromatic A-ring in an acidic medium to determine monomeric flavan-3-ols (Nagel & Glories, 1991). Proanthocyanidins also contain the reactive meta-hydroxyl groups, but react with DMAC to a much lesser extent than monomeric flavan-3-ols. Anthocyanins and flavonols were excluded due to their electron-withdrawing functional groups.
The DMAC reagent was prepared by dissolving 0.25 g of the p-dimethylamino-cinnamaldehyde (DMAC) in 500 mL of the HC1-MeOH (250 mL of concentrated hydrochloric acid, 32%, made up to 1 L by using methanol). (+)-Catechin
S. Afr. J. Enol. Vitic., Vol. 33, No. 2,2012

Pinotage and Micro-oxygenation 152
hydrate (Fluka) was used to construct a calibration curve with a concentration range of between 2.5 mgfL and 50 mgfL (7 calibration points, R2 = 0.99) for the determination of the final concentration in mgfL CE (catechin equivalents). The absorbance was measured at 640 nm after exactly 2 min at room temperature.
Total phenols analysis The total phenol concentration was quantified using the method developed by Folin-Denis, but later improved by Folin-Ciocalteu (Singleton & Rossi, 1965). The reagent, phosphotungstic-phosphomolybdic acid, oxidises phenols and is itself reduced to a blue molybdenum tungsten complex. All hydroxyl groups are oxidised in this method, thus it can provide an overestimation of the phenols present (Singleton & Rossi, 1965, Singleton et al., 1999). The standard curve was constructed using gallic acid (Fluka), ranging in concentration from 0 to 2 000 mgfL. Red wine samples were diluted 10 times and 100 pL of each diluted sample was mixed with 2 mL Folin-Ciocalteu reagent (Fluka) and 1.5 mL of 20% sodium bicarbonate and made up to 10 mL with distilled water. After two hours at room temperature, the absorbance of the sample was read at 765 nm.
Total tannin analysis Total tannin analysis was performed with a protein precipitation assay (Adams & Habertson, 1999). Tannin precipitation was carried out using bovine serum albumin (BSA) (1 mg/mL) in a buffer (A) containing 200mM of acetic acid and 170 mM of NaCl of which the pH was adjusted to 4.9. When necessary, wines were diluted with a buffer (B) of 12% aqueous ethanol (v/v) containing 5 g/L potassium bitartrate adjusted to pH 3.3 with HC1 to prevent an under-or overestimation of the tannin concentration. The wine (diluted/undiluted, 500 pL) was mixed with 1 mL of buffer A and BSA (1 mg/mL), allowed to react at room temperature for 15 min and then centrifuged to produce a pellet due to the formation of the tannin-protein complex. The supernatant was discarded and the pellet was washed twice with 1 mL of buffer A. The supernatant was once again discarded and 875 jiL of buffer C, containing 5% triethanolamine (v/v) (TEA) and 5% sodium dodecyl sulphate (w/v) (SDS) were added to dissolve the pellet. The absorbance of the sample was measured at 510 nm and noted as the background reading. To the same cuvette, 125 jtL of 10 mM ferric chloride in 10 mM HC1 was added and left to incubate for 10 min. The final absorbance measurement was then taken.
The amount of protein-precipitable tannin in the sample was calculated as the (final absorbance minus zero catechin reading) minus (the background multiplied by 0.875) and plotted onto a standard curve constructed with (+)-catechin hydrate (Fluka) to express the final concentration in catechin equivalents. The dilution was also taken into consideration. Catechin was used as a standard, since it is found as one of the subunits and cannot precipitate protein by itself.
RP-HPLC analysis Reversed-phase high-performance liquid chromatography (RP-HPLC) was performed on a Hewlett Packard Agilent
1100 series HPLC system equipped with a diode array detector (Agilent Technologies, Palo Alto, CA, USA). Data processing was done with Chemstation software (Hewlett Packard, Waldbronn, Germany). Separations were carried out on a polystyrene/divinylbenzene reversed-phase column (PLRP-S, iooA, 250 x 4.6 mm, 5 .tm) from Polymer Laboratories, Ltd (Shropshire, UK), protected with a guard cartridge (PLRP-S, 10 x 4.6 mm) (Polymer Laboratories) of the same packing material. The following mobile phases were used: solvent A, containing de-ionised water with 1.5% v/v ortophosphoric acid (Reidel-de Haën), and solvent B, consisting of 80% acetonitrile (Chromasolve, Reidel-de Haën) with 20% of solvent A. A linear gradient was used from 0 min (with solvent A 94% and solvent B 6%) to 73 mm (solvent A 69% and solvent B 31%) to 78 min (solvent A 38%, solvent B 62 1/6), staying constant for 8 mm to 86 mm, and then back to the starting conditions for 4 mm to 90 min (solvent A 94% and solvent B 6%). A flow rate of 1 mL/min and a column temperature of 35°C were used. This procedure was adapted from the method of Peng et al. (2002).
Phenols were quantified using external standards: (+)-catechin hydrate (Fluka), (-)-epicatechin (Sigma), gallic acid (Fluka), p-coumaric acid (Sigma), malvidin-3-glucoside (Fluka), quercitin-3-glucoside (Fluka) and quercitin (Extrasynthése). Monomeric and dimeric flavanols and polymeric phenols were quantified at 280 nm as mg/L catechin units with a quantification limit of 1.5 mg/L, and epicatechin as epicatechin with a quantification limit of 1.5 mgfL. Cinnamic acids have a maximal absorbance at 316 nm and the individual compounds were expressed as mg/L p-coumaric units with a quantification limit of 0.275 mg/L. Flavonol-glycosides and flavonol aglycones were quantffied at 360 nm as mg/L quercitin with a quantification limit of 0.05 mg/L. Anthocyanins, pigments and polymeric pigments were quantified at 520 nm as mgfL malvidin-3-glucoside with a quantffication limit of 1.25 mgfL. The quantification limit for gallic acid was 0.25 mg/L. Total anthocyanins are the sum of all the monomeric anthocyanins quantffied in malvidin-3-glucoside units. Polymeric pigments and phenols were defined as the quantified amount in malvidin-3-glucoside (520 nm) and catechin (280 nm) equivalents respectively, using the area of a large unresolved peak at the end of the chromatographic run that has been shown to be polymeric in nature (Peng et al., 2002). The samples were unfrozen and centrifuged for 5 min at 14 000 rpm before injection. Thereafter each sample was placed in a 1.5 mL dark coloured vial and protected with nitrogen gas from oxidation. The limit of detection is defined as a signal-to-noise ratio of 1 to 3. The limit of quantffication was determined as the smallest area that could be accurately integrated (< 3% standard deviation).
Statistical analysis Mean values and standard deviations were calculated using one-way analysis of variance (ANOVA). The significance of differences between mean values obtained was determined using a student t-test at the 95% signfficance level, with p < 0.05, using Statistica 8 (StatSoft Inc.) software.
S. Afr. J. EnoL Vitic., VoL 33, No. 2,2012

153
Pinotage and Micm-oxygenation
RESULTS Position in tank All spectrophotometric and HPLC analyses showed no significant differences between the positions where the samples were taken, suggesting that the oxygen sparged at the bottom of the tank diffused upwards and was absorbed evenly into the wine (results not shown). The dissolved oxygen in the wine was not measured at the three different positions due to equipment restrictions in such a long tank (3.2 m). However, in a study perfonned by Durner et al. (2010b), no dissolved oxygen gradients were observed in the
tank when similar micro-oxygenation equipment, tank sizes and oxygen additions as in our study were used in red wine before MLF.
Colour intensity, optical density and hue All the wines decreased in colour intensity (CI) during MLF, but the CI of the oxygenated wines was signfficantly higher than that of the control (Table 1). However, there were no signfficant differences between the control and oxygenated treatments after two months' maturation in the tank. Similarly, oxygenation resulted in an increase in 420,
TABLE 1 Colour measurements of the control and oxygenated treatments over time.
Colour intensity Control MO 16 MO 32 Before OX 12.28 ± 0.18' 12.35 ± 024ab 12.125 ± 0.07 After OX 11.56 ± 0.18 12.66 ± 015b 12.49 ± 039ab
After MLF 8.47 ± 112d 10.59 ± 0.26ce 10.23 ± 0.62e1
Two months after MLF 8.87 ± 0.13dg 973 ± 0909 9.31 ± 0.38&
Optical density - 420 nm Control MO 16 MO 32 Before OX 3.23 ± 0.06a 3.24 ± 0.08a 3.18 ± 0.03
After OX 3.14 ± 0.06ab 3.66 ± 0.06c 3.61 ± 0.11 c
AfterMLF 2.61 ±0.27" 3.26±0.05a 317017ab
Two months after MLF 2.65 ± 006d 2.92 ± 0. 1 Obe 2.80 ± 0.08 1e
Optical density - 520 nm Control MO 16 MO 32 Before OX 7.90 ± 0.09a 7.95 ± 0.13a 7.82 ± 005ab
After OX 7.24 ± 0.15" 7.61 ± O.Ilab 7.51 ± 024ab
After MLF 4.76 ± 0.72c 5.84 ± 0.18" 5.63 ± 0.37ce
Two months after MLF 5.16 ± 0.11 5.55 ± 0.16e 5.32 ± 0.26c
Optical density - 620 nm Control MO 16 MO 32 Before OX 1.15 ± 0.03ab 1.16 ± 004ab 1.13 ± 0.Ola
After OX 1.18 ± 0.02ab 1.39 ± 0.03cde 1.37 ± 0.07 After MLF 1.10 ± 0.13a 1.50 ± 004d 1.43 ± 008cd
Two months after MLF 1.07 ± 0.OP 1.27 ± 0.04be 1.19 ± 004ab
Colour hue Control MO 16 MO 32 Before OX 0.41 ± 0.06a 0.41 ± 0.03a 0.41 ± 0.05a
After OX 0.43 ± 0.00e 0.48 ± ØØØb 0.48 ± ØØØb
After MLF 0.55 ± 0.20c 0.56 ± 0.26c 0.56 ± 0.05c
Two months after MLF 0.51 ± 010d 0.53 ± 005d 0.53 ± 006d
Modified colour hue Control MO 16 MO 32 Before OX 0.46 ± 0.00a 0.48 ± 001 ab 0.46 ± 0.00a
After OX 0.48 ± 0.00be 0.52 ± 0.00" 0.52 ± 0.00" After MLF 0.50 ± 0.OP 0.53 ± ØØØd 0.53 ± ØØØd
Two months after MLF 0.53 ± 001d 0.53 ± ØØØd 0.53 ± 002d
Modified colour intensity Control MO 16 MO 32 Before OX 12.22 ± 0 . 58ab 12.89 ± 0.02a 12.78 ± 0.03 After OX 11.98 ± 0.52M 11.78 ± 0.50bde 12.07 ± 0.43bc
After MLF 11.6 ± 0.33be 12.45 ± 0.36acd 12.36 ± 0.17 Two months after MLF 10.45 ± 0.07k 11.21 ± 0.12d1 11.20 ± 0.55e
aAll data is expressed in absorbance units (AU). Values displayed are the average of duplicate treatments, with the standard deviation of triplicate measurements displayed after the concentration. The letter after each concentration denotes the significant differences at a 5% confidence interval for each colour measurement (MO 16 = 16 mgfL oxygen addition, MO 32 = 32 mgfL oxygen addition).
S. Afr. J. Enol. Vitic., Vol. 33, No. 2,2012
Pinotage and Micro-oxygenation 154
520 and 620 nm absorbance measurements, hue, modified hue and modified CI, although not always significantly. The difference observed between CI and modified CI is due to SO2 adjustments made directly after MLF.
Malolactic fermentation caused a definite decrease in the absorbance at 520 nm and CI, but an increase in 420 nm, hue and modified hue in all the treatments. All colour measurements decreased during the two months of ageing after MLF, except modified hue, which stabilised in the treatments to which oxygen had been added. After two months of ageing, the differences between the control and oxygenated treatments decreased and, in many cases, were not significantly different any more.
Anthocyanins and polymeric pigments The anthocyanin concentrations as deteimined by spectrophotometry and RP-HPLC (Table 2) decreased over time in all the wines, but more rapidly in the oxygen-treated wines. The anthocyanin concentrations remained relatively stable during the two-month ageing period, with the control having signfficantly more anthocyanins (spectrophotometry) than the oxygenated wines after two months of ageing.
Also evident from this study was the increase in polymeric pigment concentration (Fig. 1), with a subsequent decrease in anthocyanin concentration over time. The decrease in anthocyanin concentration as measured by spectrophotometry (Ribereau-Gayon et al., 2006), and the simultaneous increase in polymeric pigment concentration, showed a strong inversely proportional correlation (r2 = 0.7382). This observation was especially apparent in the wines treated with oxygen.
The anthocyanin concentrations determined by RP-HPLC and spectrometry showed the same tendencies (r2 = 0.9062). Both methods thus seem suitable to measure anthocyanins when following evolution during fermentation in young Pinotage red wine during micro-oxygenation.
Monomeric flavanols Monomeric flavanol concentrations decreased signfficantly compared to the control in the treated tanks after oxygen addition, as determined spectrophotometrically with the DMAC method (Table 3). The same decreasing trend was found for monomeric flavanols deteimined by RP-
HPLC, which was calculated as the sum of (+)-catechin, (-)-epicatechin, gallocatechin, epigallocatechin and epicatechingallate. Both methods of analysis showed that there was an increase in monomeric flavanol concentration after MLF, with higher concentrations in the controls. Thereafter the control remained constant according to RP-HPLC analyses, but decreased in the DMAC index. According to the latter type of analysis, the oxygenated treatments decreased even further with ageing, whereas the RP-HPLC analyses showed an increase in monomeric flavanol concentrations after two months of ageing.
Although there were differences when comparing the DMAC index and RP-HPLC results for monomeric flavanols, the data still correlated well (R 2 = 0.8626). Both these methods showed differences in the flavanol concentrations in Pinotage red wines exposed to micro-oxygenation.
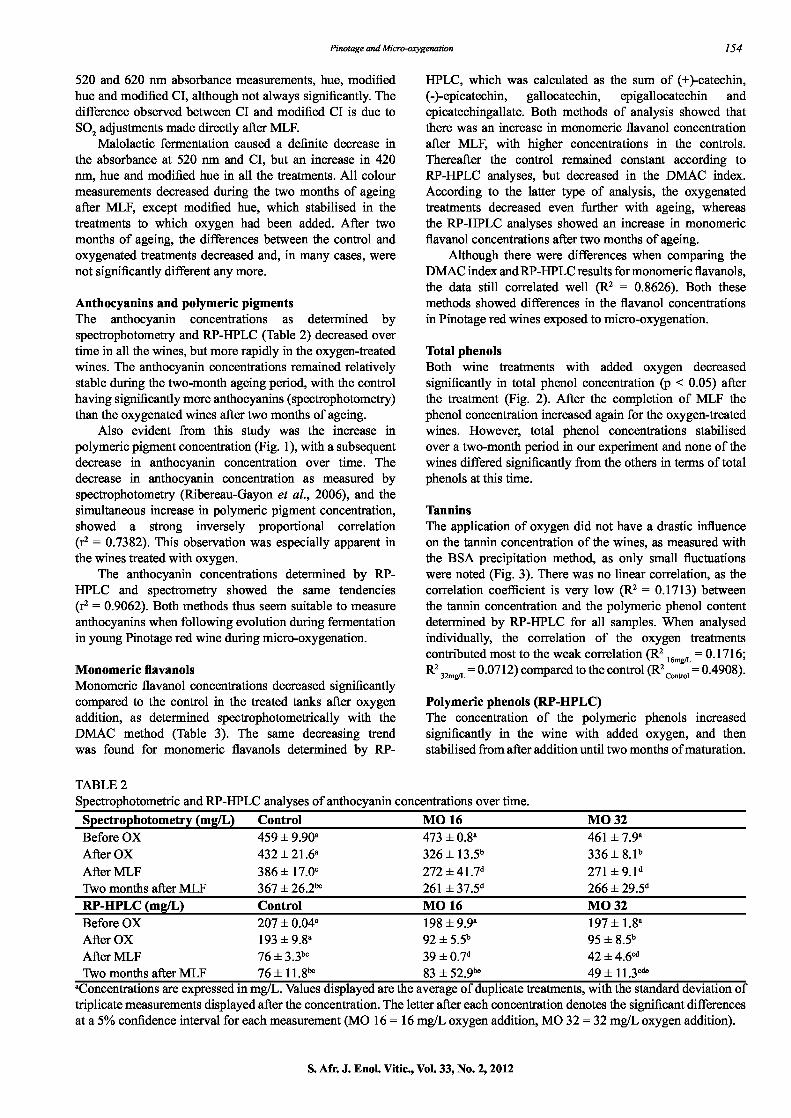
Total phenols Both wine treatments with added oxygen decreased significantly in total phenol concentration (p < 0.05) after the treatment (Fig. 2). After the completion of MLF the phenol concentration increased again for the oxygen-treated wines. However, total phenol concentrations stabilised over a two-month period in our experiment and none of the wines differed significantly from the others in terms of total phenols at this time.
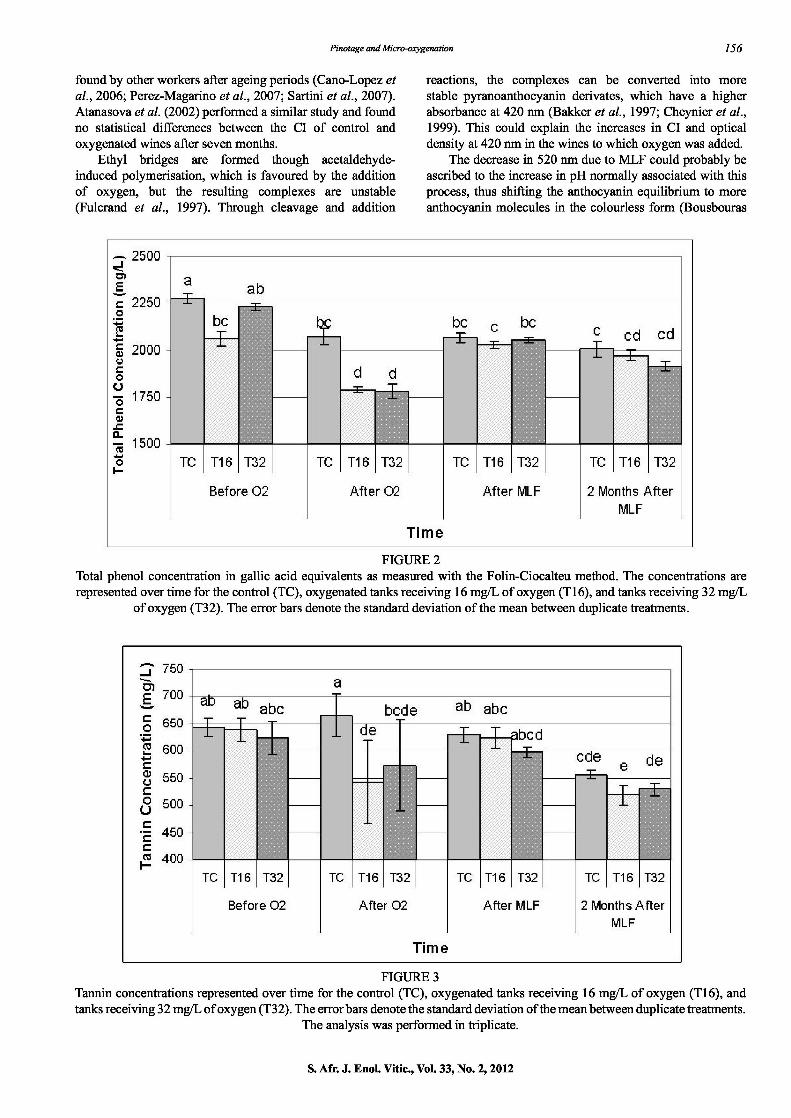
Tannins The application of oxygen did not have a drastic influence on the tannin concentration of the wines, as measured with the BSA precipitation method, as only small fluctuations were noted (Fig. 3). There was no linear correlation, as the correlation coefficient is very low (R 2 = 0.1713) between the tannin concentration and the polymeric phenol content deteimined by RP-HPLC for all samples. When analysed individually, the correlation of the oxygen treatments contributed most to the weak correlation (R2 = 0.171 6
l6mg/L
R232mg = 0.0712) compared to the control (R2 1 = 0.4908).
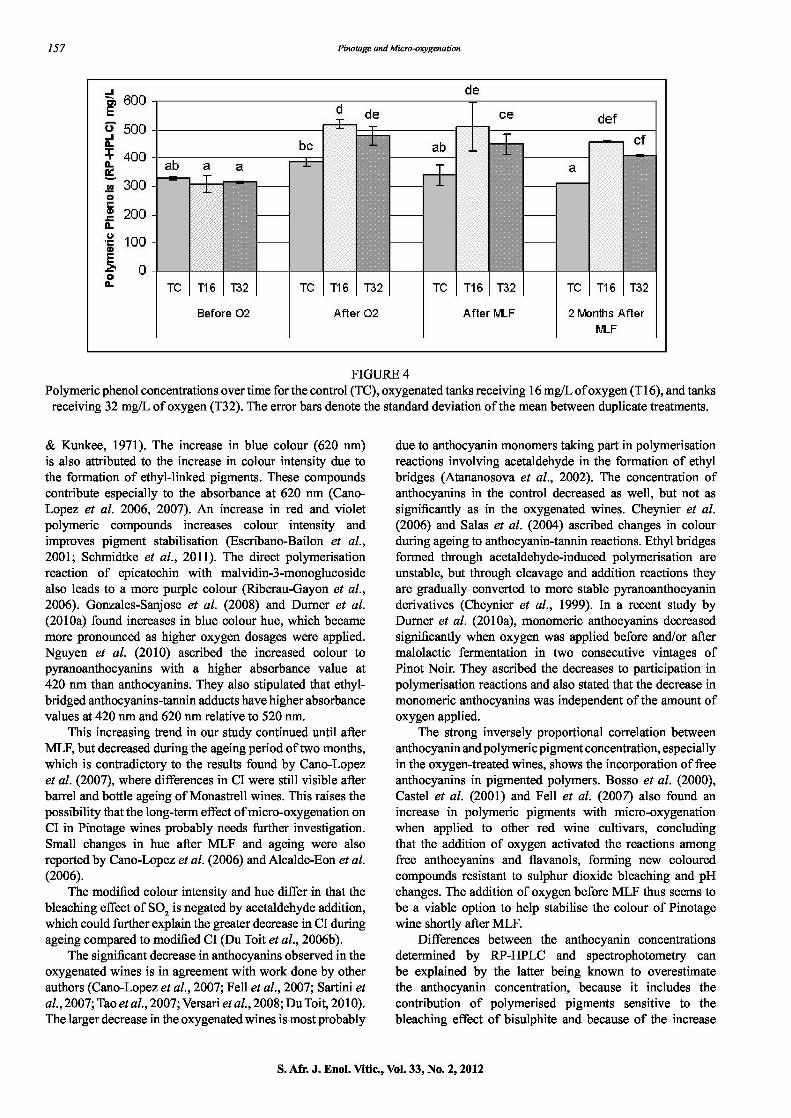
Polymeric phenols (RP-HPLC) The concentration of the polymeric phenols increased significantly in the wine with added oxygen, and then stabilised from after addition until two months of maturation.
TABLE 2 Spectrophotometric and RP-HPLC analyses of anthocyanin concentrations over time.
Spectrophotometry (mgIL) Control MO 16 MO 32 Before OX 459 ± 9.90a 473 ± 0.8a 461 ± 79a AfterOX 432±21.6a 326±13.5" 336±8.1" After MLF 386 ± 17.0c 272 ± 41.7" 271 ± 9.1" Two months after MLF 367 ± 26.2be 261 ± 37.5" 266 ± 29.5" RP-HPLC (mg/L) Control MO 16 MO 32 Before OX 207 ± 0.04a 198 ± 99a 197 ± 1.8 AfterOX 193 ±9.8a 9255b 9585b After MLF 76± 33bc 39 ± 07d 42± 4.6' Two months after MLF 76 ± 11.8be 83 ± 52.9be 49 ± 11.3 cde
aConcentrations are expressed in mgfL. Values displayed are the average of duplicate treatments, with the standard deviation of triplicate measurements displayed after the concentration. The letter after each concentration denotes the significant differences at a 5% confidence interval for each measurement (MO 16= 16 mgfL oxygen addition, MO 32= 32 mgfL oxygen addition).
S. Afr. J. EnoL Vitic., VoL 33, No. 2,2012

Pinotage and Micm-oxygenation
d d d
de Tde J j e
LLbC T 1 jabc
ab tTi ab BO AO AMLF 2AMLF
155
55
50
—J
E 45 = 0
40
35 0 0-
U) I
30 of E - 25
C.) I- a) E > 20
15
10 Control l6mg/L
mg Ti me
FIGURE 1 Polymeric pigment concentration (mgfL, RP-HPLC) of the control and oxygenated wines (16 mgfL and 32 mgfL oxygen) over time (p = 0.025). BO represents samples analysed before oxygen addition; AO represents samples analysed after oxygen was added; AMLF represents samples analysed after the completion of MLF; and 2AMLF represents the end of a two-month ageing period. Error bars indicate the standard deviation for two repeats, and the letter above each data point identifies the signfficant
difference at a 5% confidence interval.
TABLE 3 Monomeric flavan-3-ol concentrations deteimined by spectrophotometry and RP-HPLC over timea
DMAC index (mgfL) Control MO 16 MO 32 Before OX 387 ± 7.91b 415 ± 1.2a 392 ± 12.7ab After OX 412 ± 15 .2a 326 ± 169cd 328 ± 10.8' AfterMLF 415±11.7a 372 1.9be 381±1.6" Two months after MLF 352 ± 10.9 324 ± 4•7c1 320 ± 6.1" RP-HPLC (mgfL) Control MO 16 MO 32 BeforeOX 102±4.8a 104±1.1a 103±11.5 After OX 105 ± 120ab 78 ± 10.7c 78 ± 10.0 AfterMLF 13287d 114±1.5e 11215be
Two months after MLF 134 ± 79d 129 ± 2.8" 127 ± 5.1" ayalues displayed are the average concentration in mgfL for duplicate treatments, with the standard deviation of triplicate measurements displayed after the concentration. The letter after each concentration denotes the signfficant differences at a 5% confidence interval for each measurement (MO 16= 16 mgfL oxygen addition, MO 32= 32 mgfL oxygen addition).
The polymeric phenol content of the oxygenated wines was thus signfficantly higher than that of the control (Fig. 4), even after two months' ageing. The initial significant increase in polymeric phenol concentration for the oxygenated wines is in agreement with the decrease in monomeric flavanol concentration detennined by HPLC.
Flavonols (RP-HPLC) All individual flavonols decreased over time, except quercetin, which increased steadily (p = 0.00002) over time
(results not shown). However, there was a significantly lower quercetin concentration in the treated wines (about 0.70 mgfL) just after the oxygen treatment compared to the control (1.05 mgfL), but the differences disappeared after an ageing period of two months.
DISCUSSION Although oxygen additions initially led to significant changes in CI, only small differences were observed after a two-month ageing period. These small differences were also
S. Afr. J. Enol. Vitic., Vol. 33, No. 2,2012
Pinotage and Micro-oxygenation
156
found by other workers after ageing periods (Cano-Lopez et al., 2006; Perez-Magarino et al., 2007; Sartini et al., 2007). Atanasova et al. (2002) perfonned a similar study and found no statistical differences between the CI of control and oxygenated wines after seven months.
Ethyl bridges are formed though acetaldehyde-induced polymerisation, which is favoured by the addition of oxygen, but the resulting complexes are unstable (Fulcrand et al., 1997). Through cleavage and addition
reactions, the complexes can be converted into more stable pyranoanthocyanin derivates, which have a higher absorbance at 420 nm (Bakker et al., 1997; Cheynier et al., 1999). This could explain the increases in CI and optical density at 420 nm in the wines to which oxygen was added.
The decrease in 520 nm due to MLF could probably be ascribed to the increase in pH normally associated with this process, thus shifting the anthocyanin equilibrium to more anthocyanin molecules in the colourless form (Bousbouras
— 2500
C)
E a ab c 2250 —±-
bc bc C bc -+-
C Cd cd 2000
U —- d d 0
C-) 1750
C
CL .c
1500 —
TC Ti 6 T32 TC Ti 6 T32 TC T16 T32 TC Ti 6 T32
Before 02 After 02 After MLF 2 Months After MLF
Time
FIGURE 2 Total phenol concentration in gallic acid equivalents as measured with the Folin-Ciocalteu method. The concentrations are represented over time for the control (TC), oxygenated tanks receiving 16 mgfL of oxygen (T16), and tanks receiving 32 mgfL
of oxygen (T32). The error bars denote the standard deviation of the mean between duplicate treatments.
2 750 a
700 ab ab abc
_].bcde ab abc
650 ± cd 600
+ + - - t,
cde e de 550
500 -I- -i- 450
400 -
Ic 116 132 Ic 116 132 IC 116 132 TC 116 132
Before 02 After 02 After MLF 2 Months After MLF
Time
FIGURE 3 Taimin concentrations represented over time for the control (TC), oxygenated tanks receiving 16 mgfL of oxygen (T16), and tanks receiving 32 mgfL of oxygen (T32). The errorbars denote the standard deviation of the mean between duplicate treatments.
The analysis was performed in triplicate.
S. Afr. J. EnoL Vitic., VoL 33, No. 2,2012
157 Pinotage and Micm-oxygenation
de —CM 6OO• E ce def
500• IL Cf bc ab 400•
ab a a --
• 300
200•
.100- CD
0• 0 IL IC 116 132 TC 116 T32 IC 116 132 IC T16 132
Before 02 After 02 After K&F 2 Months After
rJLF
FIGURE 4 Polymeric phenol concentrations over time for the control (TC), oxygenated tanks receiving 16 mgfL of oxygen (Ti 6), and tanks
receiving 32 mgfL of oxygen (T32). The error bars denote the standard deviation of the mean between duplicate treatments.
& Kunkee, 1971). The increase in blue colour (620 nm) is also attributed to the increase in colour intensity due to the formation of ethyl-linked pigments. These compounds contribute especially to the absorbance at 620 nm (Cano-Lopez et al. 2006, 2007). An increase in red and violet polymeric compounds increases colour intensity and improves pigment stabilisation (Escribano-Bailon et al., 2001; Schmidtke et al., 2011). The direct polymerisation reaction of epicatechin with malvidin-3-monoglucoside also leads to a more purple colour (Riberau-Gayon et al., 2006). Gonzales-Sanjose et al. (2008) and Durner et al. (2010a) found increases in blue colour hue, which became more pronounced as higher oxygen dosages were applied. Nguyen et al. (2010) ascribed the increased colour to pyranoanthocyanins with a higher absorbance value at 420 nm than anthocyanins. They also stipulated that ethyl-bridged anthocyanins-tannin adducts have higher absorbance values at 420 nm and 620 nm relative to 520 nm.
This increasing trend in our study continued until after MLF, but decreased during the ageing period of two months, which is contradictory to the results found by Cano-Lopez et al. (2007), where differences in CI were still visible after barrel and bottle ageing of Monastrell wines. This raises the possibility that the long-term effect of micro-oxygenation on CI in Pinotage wines probably needs further investigation. Small changes in hue after MLF and ageing were also reported by Cano-Lopez et al. (2006) and Alcalde-Eon et al. (2006).
The modified colour intensity and hue differ in that the bleaching effect of SO2 is negated by acetaldehyde addition, which could further explain the greater decrease in CI during ageing compared to modffied CI (Du Toit et al., 2006b).
The significant decrease in anthocyanins observed in the oxygenated wines is in agreement with work done by other authors (Cano-Lopez et al., 2007; Fell et al., 2007; Sartini et al., 2007; Tao et al., 2007; Versari et al., 2008; Du Toit, 2010). The larger decrease in the oxygenated wines is most probably
due to anthocyanin monomers taking part in polymerisation reactions involving acetaldehyde in the formation of ethyl bridges (Atananosova et al., 2002). The concentration of anthocyanins in the control decreased as well, but not as signfficantly as in the oxygenated wines. Cheynier et al. (2006) and Salas et al. (2004) ascribed changes in colour during ageing to anthocyanin-tannin reactions. Ethyl bridges formed through acetaldehyde-induced polymerisation are unstable, but through cleavage and addition reactions they are gradually converted to more stable pyranoanthocyanin derivatives (Cheynier et al., 1999). In a recent study by Durner et al. (2010a), monomeric anthocyanins decreased signfficantly when oxygen was applied before and/or after malolactic fermentation in two consecutive vintages of Pinot Noir. They ascribed the decreases to participation in polymerisation reactions and also stated that the decrease in monomeric anthocyanins was independent of the amount of oxygen applied.
The strong inversely proportional correlation between anthocyanin and polymeric pigment concentration, especially in the oxygen-treated wines, shows the incorporation of free anthocyanins in pigmented polymers. Bosso et al. (2000), Castel et al. (2001) and Fell et al. (2007) also found an increase in polymeric pigments with micro-oxygenation when applied to other red wine cultivars, concluding that the addition of oxygen activated the reactions among free anthocyanins and flavanols, foiming new coloured compounds resistant to sulphur dioxide bleaching and pH changes. The addition of oxygen before MLF thus seems to be a viable option to help stabilise the colour of Pinotage wine shortly after MLF.
Differences between the anthocyanin concentrations determined by RP-HPLC and spectrophotometry can be explained by the latter being known to overestimate the anthocyanin concentration, because it includes the contribution of polymerised pigments sensitive to the bleaching effect of bisulphite and because of the increase
S. Afr. J. Enol. Vitic., Vol. 33, No. 2,2012

Pinotage and Micro-oxygenation 158
in colouration due to the lowered pH (Llaudy et al., 2006). Pigments resistant to sulphite bleaching are also not necessarily polymeric and, in addition, some polymeric pigments are not resistant to sulphite bleaching (Remy et al., 2000). The RP-HPLC method separates individual pigments, making the deteimination of only monomeric anthocyanins possible, which further explains differences observed between the two methods (Rivas-Gonzalo et al., 1992). However, the two types of measurements showed the same tendencies, indicating that both methods are suitable to measure the decrease in anthocyanin in a young red wine during micro-oxygenation.
An increase in the mean degree of polymerisation (mDP) could have led to the observed decrease in monomeric flavanols after the addition of oxygen (Llaudy et al., 2006), specifically the formation of larger polymers that are favoured by the addition of oxygen (Somers, 1971; Nikfardjam & Dykes, 2002). However, the increase in flavanol concentrations after MLF could be due to the cleavage of polymers and the resulting release of monomers (Cheynier et al., 1999). Catechin, a predominant contributing monomer, was found to be lower in oxygenated wines in other studies (Ferranini et al., 2001; Du Toit et al., 2006b), which was also true in our study (results not shown).
The RP-HPLC analyses showed lower concentrations of monomeric flavan-3-ols than the DMAC index, which could be ascribed to the fact that only five different monomeric flavan-3-ols were quantified by RP-HPLC. Also, the DMAC index includes proanthocyanidins in its measurement, which could affect the final concentration, although they react to a much lesser extent than the monomeric flavan-3-ols (Nagel & Glories, 1991). The good correlation between RP-HPLC and the DMAC index indicates that both these methods can be used to follow the evolution of flavan-3-ols in wines undergoing micro-oxygenation.
The initial lower total phenol concentration (as measured with the Folin-Ciocalteu method) where oxygen was added could be due to condensation, oxidation and possible precipitation, but these tendencies were not observed at a later stage. Llaudy et al. (2006) found only a slight decrease in total phenolic concentration during oxygen addition, while Perez-Margarino et al. (2007) stated that, in some cases, oxygenated wines have lower phenolic concentrations. Lower total phenol concentrations after malolactic fermentation have also been found by other authors (Ferranini et al., 2001; Amati et al., 2002). Changes in the structure of individual phenols as new compounds are formed can lead to a different response with the Folin-Ciocalteu assay (Fell et al., 2007), resulting in changes in the total phenol concentration measured.
Our study only revealed significant changes in tannin concentrations initially after oxygen additions. Work done by Llaudy et al. (2006) showed a decreasing tendency in tannin concentration in both the control and oxygenated wines over time. In contrast with our results, Cano-Lopez et al. (2006) found a decrease in tannin concentration during MLF, with oxygenated wines having a slightly higher tannin content. Dimers and trimers do not respond in a protein-binding assay such as BSAprecipitation, and the effectiveness of the method is therefore limited to those oligomeric proanthocyanidins
with a degree of polymerisation greater than four units (Adams & Habertson, 1999). The BSA tannin method should correlate well with the polymeric phenol peak that eluted at the end of a run, as obtained from RP-HPLC (Mercurio & Smith, 2008). However, averypoor correlation was observed, especially for those wines treated with oxygen. The lack of a good correlation between tannin and polymeric phenol as quantified with RP-HPLC in the oxygen-treated wines could be due to the incorporation of pigments and ethyl bridges, which interfere with the precipitation reaction oftannins with proteins (Mercurio & Smith, 2008). Another reason could be that the larger oxidised tannin polymers may not precipitate protein as efficiently, or that they are incorporated into soluble complexes with the protein and therefore yield poor correlation (J.F. Harbertson, personal communication, 2009). De Beer et al. (2004) found a good correlation between the high-molecular-weight portion of normal-phase HPLC and the protein-precipitable tannins, but the effect of oxygen was not investigated in this study. Clearly, further research into these aspects is required to assess the most optimal method to measure tannin concentrations in wines undergoing micro-oxygenation. Changes in the monomeric flavan-3-ols and polymeric phenol concentrations were due to their involvement in polymeric polymerisation reactions (Gomez-Plaza & Cano-Lopez, 2011). Although not signfficant, the decrease in polymeric phenol concentration observed during the ageing period could be due to breakdown reactions of the polymers, as well as to precipitation (Haslam, 1980; 'Vidal et al., 2002).
Our results indicated a decrease in individual flavonols over time, except for quercetin, which increased. The latter is not in accord with studies done by Fang et al. (2007), who found a loss in quercetin as time proceeded. The increase in quercetin could be due to the hydrolysis of quercetin glucosides in the acidic wine medium (Price et al., 1995). The greater loss of quercetin in the oxygen-treated wines could possibly be due to the high reactivity of this molecule with oxygen (Park et al., 2003), but these differences became non-significant during ageing. This is in agreement with Sartini et al. (2007). Perez-Magarino et al. (2007), however, found that the oxygenated wines, and not the control, had the highest concentration of quercetin.
CONCLUSIONS It can be concluded that the effect of oxygen sparged at the bottom of the tank was the same on the phenolic and colour composition of the wine at different positions in the tank. This implies that a winemaker using this technique on a commercial scale would achieve the same effect of oxygenation throughout the wine if the tank was tall enough to ensure adequate dissolution of the oxygen into the wine during sparging. Although the study involved a tank of commercial tank length, the extension of this study to larger tanks is still a topic worthy of investigation in order to determine how well oxygen is dissolved throughout the length of a bulk wine tank. The rate of dissolution in such a case could also ensure valuable data that is applicable to this widely used technique in the industry.
The application of micro-oxygenation is beneficial in terms of the colour development of Pinotage red wine,
S. Afr. J. EnoL Vitic., VoL 33, No. 2,2012
159
Pinotage and Micm-oxygenation
as significant differences were found between the controls and oxygen-treated wines in terms of colour intensity, free anthocyanins, polymeric pigments and polymeric phenols just after MLF. This technique can thus be used to increase and stabilise the colour of Pinotage wine before MLF, which leads to more polymeric pigments and polymeric phenols even after two months' ageing. However, the increase in colour intensity decreased quickly with ageing, and the oxygenated treatments were not signfficantly different from the control after two months of ageing. The treatment did not have a signfficant influence on the tannin concentration, and small differences were observed in total phenol concentrations. Colour and phenol measurements indicated that the two oxygen treatments (16 and 32 mgfL) were mostly not significantly different from each other, indicating that. for this Pinotage wine, an oxygen addition of 16 mgfL was adequate. The long-term effects of micro-oxygenation during ageing on the colour and phenolic and sensory characteristics of Pinotage red wine should be investigated further. However, it seems that a number of spectrophotometric and HPLC analysis methods for colour and phenolic compounds are suitable to follow the progression of micro-oxygenation in Pinotage red wines. This study could contribute to how winemakers manage oxygen in Pinotage red wines.
LITERATURE CITED
Adams, D.O & Harbertson, J.F., 1999. Use of alkaline phosphates for the analysis of tannins in grapes and red wines. Am. J. Enol. Vit. 50, 247-252.
Alcalde-Eon, C., Escribano-Bailon, M.T., Santos-Buelga, C. & Rivas-Gonzalo, J.C., 2006. Changes in the detailed pigment composition of red wine during maturity and ageing. A comprehensive study. Anal. Chim. Acta. 563, 238-254.
Amati, A., Arfelli, G., Castellari, M. & Simoni, M., 2002. Effetto dell'ossigenazione controllata sulla frazione fenolica dei vini rossi. Industrie della Bevande 29, 606-6 12.
Atanasova, V., Fulcrand, H., Cheynier, V. & Moutounet, M., 2002. Effect of oxygenation on polyphenol changes occurring in the course of wine-making. Anal. Chim. Acta. 458, 15-27.
Bakker, J., Picinelli, A. & Bridle, P., 1997. Model wine solutions: color and composition changes during ageing. Vitis 32, 111-118.
Bosso, A., Guaita, M., Vaudano, E. & Di-Stefano, R., 2000. Influenza dell' ossigeno sull' evoluzione dei composti fenolici durante la conservazione dei vini rossi. Industrie delle Bevande 29, 630-640.
Boulton, R., 2001. The copigmentation of anthocyanins and its role in the color of red wine: a critical review. Am. J. Enol. Vitic. 52, 67-87.
Bousbouras, G.E. & Kunkee, R.E., 1971. Effect of pH on malolactic fermentation in wine. Am. J. Enol. Vitic. 22, 121-126.
Cheynier, V., Es Safi, N.E. & Fulcrand, H., 1999. Structure and color properties of anthocyanins and related pigments. In: Mosquera, M.I.M., et al. (eds). Proc. Intern. Congress on Pigments in Food and Technology. pp 23-25.
Cano-Lopez, M., Pardo-Minguez, F., Lopez-Roca, J.M. & Gomez-Plaza, E., 2006. Effect of microoxygenation on anthocyanin and derived pigment content and chromatic characteristics of red wines Am. J. Enol. Vitic. 57, 325-33 1.
Cano-Lopez, M., Pardo-Minguez, F., Lopez-Roca, J.M. & Gomez-Plaza, E., 2007. Chromatic characteristics and anthocyanin profile of a micro-oxygenated red wine after oak or bottle maturation. Eur. Food Res. Technol. 225, 127-132.
Castel, C., Morand, A., Pujol, G. & Naudin, R., 2001. Influence de la micro-oxygenation sur la composition phenolique et les caracteres sensoriels des vins rouges. Industrie delle Bevande 30, 271-276.
Castellari, M., Matricardi, L., Arfelli, G., Galassi, S. & Amati, A., 2002. Level of single bioactive phenolics in red wine as a function of the oxygen supplied during storage. Food Chem. 69, 61-67.
CheynierV., Es-Safi N.E., FulcrandH., 1999. Structure and colourproperties of anthocyanins and related pigments. In: Minguez-Mosquera MI, Galan MJ, Mendez DH, eds. Pigments in food technology. Seville, Spain: 23-35.
De Beer, D., Harbertson, J.F., Kihnartin, P.A., Roginsky, V., Barsukova, T., Adams, D.O. & Waterhouse, A.L., 2004. Phenolics: a comparison of diverse analytical methods. Am. J. Enol. Vitic. 55, 3 89-400.
De Beer, D., Joubert, E., Marais, J., Du Toit, W., Fourie, B. & Manley, M., 2008. Characterisation of Pinotage wine during maturation on different oak products. S. Afr. J. Enol. Vitic. 29: 39-49.
Durner, S., Ganss, S. & Fischer, U., 2010b. Monitoring oxygen uptake and consumption during microoxygenation treatments before and after malolactic fermentation. Am. J. Enol. Vitic. 61, 465-473.
Durner, D., Weber, F., Neddermeyer, J., Koopmann, K., Winterhalter, P. & Fischer, U., 2010a. Sensory and color changes induced by microoxygenation treatments of Pinot Noir before and after malolactic fermentation. Am. J. Enol. Vitic. 61, 474-485.
Du Toit, W.J. 2010. Chapter 8: Micro-oxygenation, oak alternatives and added tannins and wine quality. In: Reynolds, A.G. (ed). Managing wine quality: oenology and wine quality, vol. 2. Woodhead Publishing Limited, Cambridge, UK. pp. 226-254.
Du Toit, W.J., Marais, J., Pretorius, I.S. & Du Toit, M., 2006a. Oxygen in must and wine: a review. S. Afr. J. Enol. Vitic. 27, 76-94.
Du Toit, W.J., Lisjak, K., Marais, J. & Du Toit, M., 2006b. The effect of microoxygenation on the phenolic composition, quality and aerobic wine-spoilage microorganisms of different South African red wines. S. Afr. J. Enol. Vitic. 27, 57-67.
Escribano-Bailon, T., Alvarez-Garcia, M., Rivas-Gonzalo, J.C., Heredia, F.J. & Santos-Buelga, C., 2001. Color and stability of pigments derived from the acetaldehyde-mediated condensation between malvidin-3-0-glucoside and (+)-catechin. J. Agric. Food Chem. 49, 1213-1217.
Fang, F., Li, J.M., Pan, Q.H. & Huang, W.D., 2007. Determination of red wine flavonoids by HPLC and effect of ageing. Food Chem. 101,428-433.
Fell, A., Dykes, SI., Nicolau, L. & Kihnartin, P.A., 2007. Electrochemical microoxidation of red wine. Am. J. Enol. Vitic. 58, 443-450.
Ferranini, R., Girardi, F., De Conti, D. & Castellari, M., 2001. Esperienze di applicazione della microossigenazione come tecnica d'affinamento dei vini. Industrie della bevande 30, 116-118.
Fulcrand, H., Cheynier, V., Oszmianski, J. & Moutounet, M., 1997. An oxidized tartaric acid residue as a new bridge potentially competing with acetaldehyde in flavan-3-ol condensation. Phytochem. 46, 223 -227.
Gomez-Plaza, E. & Cano-Lopez, M., 2011. A review on micro-oxygenation of red wines: claims, benefits and the underlying chemistry. Food. Chem. 125, 1131-1140.
Gonzales-Sanjose, M.L., Ortega-Heras, M. & Perez-Magarino, 5., 2008 Microoxygenation treatment and sensory properties of young red wines. Food. Sci. Technol. 14, 123-130.
Haslam, E., 1980. In vino veritas: oligomeric procyanidins and the ageing of red wines. Phytochem. 19, 2577-2582.
Llaudy, M., Canals, R., Gonzales-Manzano, S., Canals, J.M., Santos-Buelga, C. & Zamora, F., 2006. Influence of micro-oxygenation treatment before oak ageing on phenolic compounds composition, astringency, and color of red wine. J. Agric. Food Chem. 54, 4246-4252.
S. Afr. J. Enol. Vitic., Vol. 33, No. 2,2012
Pinotage and Micro-oxygenation
160
McCord, J., 2003. Application of toasted oak and micro-oxygenation to ageing of Cabernet Sauvignon wines. Austt N Z. Grapegr. Winemaker July, 43-53.
Mercurio, M.D. & Smith, P.A., 2008. Tannin quantification in red grapes and wine: comparison of polysaccharide- and protein-based tannin precipitation techniques and their ability to model wine astringency. J. Agric. Food Chem. 56, 5528-5537.
Nagel, C.W. & Glories, Y., 1991. Use of a modified dimethylaminocinnamaldehyde reagent for analysis of flavanols. Am. J. Enol. Vitic. 42, 364-366.
Nguyen, D.D., Nicolau, L., Dykes, S.I. & Kilmartin, PA., 2010. Influence of microoxygenation on reductive sulphur off-odors and color development in a Cabernet Sauvignon wine. Am. J. Enol. Vitic. 61,457-464.
Nieuwoudt, H.H., Prior, BA., Pretorius, IS., Manley, M. & Bauer, F.F., 2004. Principle component analysis applied to Fourier transform infrared spectroscopy for the design of calibration sets for glycerol prediction models in wine and for the detection and classification of outlier samples. J. Agric. Food. Chem. 52, 3728-3735.
Nikfardjam, M.P. & Dykes, 5., 2002. Micro-oxygenation research at Lincoln University. Austr. N Z. Grapegr. Winemaker 66-68.
Park, C., So, H.S., Shin, C.H., Back, S.H., Moon, B.S., Lee, D.W. & Park, R., 2003. Quercitin protects the hydrogen peroxide-induced apoptosis via inhibition of mitochondrial dysfunction in H9c2 cardiomyoblast cells. Biochem. Phann. 66, 1278-1295.
Peng, Z., Iland, PG., Oberholster, A., Sefton, M.A. & Waters, E.J., 2002. Analysis of pigmented polymers in red wine by reversed phase HPLC. Austr. J. Grape Wine Res. 8, 70-75.
Perez-Magarino, S., Sanchez-Iglesias, M., Ortega-Heras, M., Gonzales-Huerta, C. & Gonzales-Sanjose, ML., 2007. Color stabilisation of red wines by microoxygenation treatment before malolactic fermentation. Food Chem. 101, 881-893.
Price, S., Breen, P., Valladao, M. & Watson, B., 1995. Cluster sun exposure and quercetin in Pinot noir grapes and wine. Am. J. Enol. Vitic. 46, 187-194.
Remy, S., Fulcrand, H., Labarbe, B., Cheynier, V. & Moutounet, M., 2000. First confirmation in red wine of products resulting from direct anthocyanin-tannin reactions. J. Sci. Food Agric. 80, 745-751.
Ribereau-Gayon, P., Glories, Y., Meujean, A. & Dubourdieu, D., 2006. Handbook of enology, vol 2. The chemistry of wine stabilisation and treatments. John Wiley and Sons, New York.
Rivas-Gonzalo, J.C., Gutierrez, Y., Hebrero, E. & Santos-Buelga, C., 1992. Comparison of the methods for the determination of anthocyanins in red wines. Am. J. Enol. Vitic. 43, 210-214.
Romero, C. & Bakker, J., 2002. Effect of acetaldehyde and several acids on the formation of vitisin A in model wine anthocyanin and color evolution. Int. J. Food Sci. Technol. 35, 129-140.
Salas, E., Atanasova, C., Poncet-Legrand, C., Meudec, E., Mazauric, J.P. & Cheynier, V., 2004. Demonstration of the occurrence of flavanol-anthocyanin adducts in wine and in model solutions. Anal. Chim. Acta. 513, 325-332.
Sartini, E., Arfelli, G., Fabiani, A. & Piva, A., 2007. Influence of chips, lees, and micro-oxygenation during ageing on the phenolic composition of a red Sangiovese wine. Food Chem. 104, 1599-1604.
Saucier, C., Mirabel, M., Guerra, C. & Glories, Y., 2004. Tannin-anthocyanin interactions: influence on wine color. In: Waterhouse, A.L. & Kennedy, J.A. (eds). Red wine color: revealing the mysteries. American Chemical Society! Oxford University Press, Washington, DC. pp. 265-273.
Schmidtke, L.M., Clark, A.C. & Scollary, G.R., 2011. Micro-oxygenation of red wine: techniques, applications, and outcomes. Crit. Rev. Food. Sci. Nutr. 51, 115-131.
Singleton, V.L. & Rossi, J.A., 1965. Colorimetry of total phenolics with phosphomolybdic-phosphotungstic acid reagents. Am. J. Enol. Vitic. 16, 144-158.
Singleton, V.L., Orthofer, R. & Lamuela-Raventos, R.M., 1999. Analysis of total phenols and other oxidation substrates and antioxidants by means of Folin-Ciocalteu reagent. Meth. Enzymol. 299, 152-178.
Somers, T.C., 1971. The polymeric nature of wine pigments. Phytochem. 10, 2175-2186. Somers, T.C. & Evans, ME., 1977. Spectral evaluation of young red wines: anthocyanin equilibria, total phenolics, free and molecular SO 2, "chemical age". J. Sci. Food Agric. 28, 279-287.
Tao, J., Dykes, S.I. & Kihnartin, PA., 2007. Effect of SO 2 concentration on polyphenol development during red wine micro-oxygenation. J. Agric. Food. Chem. 55, 6104-6109. Versari, A., Boulton, R.B. & Paq,inello, G.P., 2008. A comparison of analytical methods for measuring the color components of red wines. Food Chem. 106, 397-402.
Vidal, S., Cartalade, D.M., Souquet, J.M., Fulcrand, H. & Cheynier, V., 2002. Changes in proanthocyanidin chain-length in wine-like model solutions. J. Agric. Food Chem. 50, 2261-2266.
S. Afr. J. EnoL Vitic., VoL 33, No. 2,2012