Embed Size (px)
Citation preview

Report No. 436 MONITORING SWINE FECAL CONTAMINATION IN THE CAPE FEAR RIVER WATERSHED BASED ON THE DETECTION AND QUANTIFICATION OF HOG-SPECIFIC BACTEROIDES-PREVOTELLA 16s rRNA GENES By Ann M. Arfken1,2, Michael A. Mallin2, Lawrence B. Cahoon1, Bongkeun Song1,2*
1Department of Biology and Marine Biology University of North Carolina-Wilmington Wilmington, NC 2Center for Marine Sciences University of North Carolina-Wilmington Wilmington, NC *Lead Principal Investigator
UNC-WRRI-436 The research on which this report is based was supported by funds provided by the North Carolina General Assembly and/or the US Geological Survey through the NC Water Resources Research Institute. Contents of this publication do not necessarily reflect the views and policies of WRRI, nor does mention of trade names or commercial products constitute their endorsement by the WRRI, the State of North Carolina, or the US Geological Survey. This report fulfills the requirements for a project completion report of the Water Resources Research Institute of The University of North Carolina. The authors are solely responsible for the content and completeness of the report.
WRRI Project No. 70248 December 2013

2
ABSTRACT
Monitoring fecal contamination in watersheds is important from both a human health and ecological perspective, especially in areas where concentrated animal feeding operations (CAFOs) are abundant. One such area is the lower Cape Fear River watershed, where approximately 5,000,000 head of swine are housed in CAFOs along major tributaries of the watershed, including the Black and Northeast Cape Fear Rivers. In order to evaluate hog waste contamination in the lower Cape Fear River watershed, we examined surface water samples from hog lagoons and streams within the Black River and the Northeast Cape Fear River watersheds using molecular microbiological techniques including Terminal Restriction Fragment Length Polymorphism (T-RFLP) and Quantitative PCR (Q-PCR) of Bacteroides 16S rDNA. Environmental parameters including physical and geochemical characteristics of water samples and coliform counts were measured to determine correlations with the Q-PCR data. T-RFLP analyses showed similar community structures of Bacteroides groups in the hog lagoons and varying community structures in the river samples. However, the dominant bp 229-230 T-RFs found in the hog lagoon samples did not correspond to hog-specific peaks found in previous studies, limiting this technique’s usefulness for host-specific identification. In addition, Q-PCR data of hog-specific Bacteroides-Prevotella 16S rRNA gene numbers did not correlate to the relative abundance of the 229-230 bp T-RF in the river samples. Based on the Q-PCR results, however, sites PB (Panther Branch) and BC117 (Burgaw Creek and Highway 117) in the Northeast Cape Fear River watershed and site 6RC (Six Runs Creek) in the Black River watershed had the highest overall and most consistent levels of hog waste contamination. In the Northeast Cape Fear River watershed, hog waste contamination was highest at sites located immediately downstream from hog related activities. In the Black River, the highest level of hog-specific Bacteroides-Prevotella 16S rDNA abundance was detected at site 6RC, which drains a watershed containing 153 CAFOs. Site GCO (Great Coharie Creek – 95 CAFOs in watershed) and LCO (Little Coharie Creek – 63 CAFOs in watershed) also had considerable hog-specific Bacteroides-Prevotella 16S rDNA abundance. COL (Colly Creek) was a relatively unimpacted site and hog-specific Bacteroides-Prevotella 16S rRNA genes were detected on only one occasion, during the month May 2009. Correlation analyses between various nutrients and hog-specific Bacteroides-Prevotella abundance were found to be entirely site-specific. At sites COL and SAR (Sarecta, on the upper Northeast Cape Fear River) monthly ammonium levels were significantly and positively correlated with the numbers of the hog-specific Bacteroides-Prevotella 16S rRNA genes. Conductivity at site GCO and turbidity at site PB were positively and significantly correlated to Bacteroides-Prevotella 16S rDNA abundance. In terms of rainfall effects, Bacteroides-Prevotella 16S rRNA gene copy numbers were positively and significantly correlated to rainfall amounts 3 days prior to sampling at LCO and during the day of sampling at site 6RC. Overall, molecular techniques, particularly Q-PCR, demonstrated abundance and frequency of swine waste contamination at sites downstream from swine CAFOS indicating that present management techniques do not keep swine waste from contaminating the Cape Fear Watershed. It is recommended that bimonthly monitoring of sites PB and BC117 in the Northeast Cape Fear River for hog-specific Bacteroides-Prevotella should continue due to their close proximity to hog-related activities. In the Black River, bimonthly monitoring or post-rainfall monitoring of upstream sites LCO, GCO and 6RC is recommended.

3
LIST OF TABLES
TABLE PAGE
1. Bimonthly levels of Bacteroides-Prevotella 16S rRNA gene copy numbers in the Cape Fear River Watershed……………………………………………..17
2. Bimonthly fecal coliform counts present in the Cape Fear River
Watershed………………………………………………………………………………..19 3. Bimonthly concentrations of ammonium present in the Cape Fear River
Watershed………………………………………………………………………………..20
4. Bimonthly concentrations of nitrate/nitrite present in the Cape Fear River Watershed……………………………………………………………………21 5. Bimonthly total nitrogen levels present in the Cape Fear River Watershed………………………………………………………………………………..22 6. Bimonthly total phosphorus levels present in the Cape Fear River Watershed………………………………………………………………………………..23 7. Bimonthly concentrations of orthophosphate present in the Cape Fear River Watershed……………………………………………………………………24 8. Bimonthly concentrations of dissolved oxygen present in the Cape Fear River Watershed……………………………………………………………………25 9. Bimonthly concentrations of chlorophyll a present in the Cape Fear River Watershed………………………………………………………………………….26 10. Bimonthly conductivity levels measured in the Cape Fear River
Watershed………………………………………………………………………………..27 11. Bimonthly total suspended solids measurements in the Cape Fear
River Watershed………………………………………………………………………….28 12. Bimonthly turbidity levels measured in the Cape Fear River
Watershed………………………………………………………………………………..29 13. Bimonthly temperatures measurements in the Cape Fear River
Watershed………………………………………………………………………………..30
14. Bimonthly pH measurements in the Cape Fear River Watershed…..………………….........31

4
PAGE 15. Bimonthly total rainfall measurements 3 days prior to sampling in
the Cape Fear River Watershed…………………………………………………….........32
16. Bimonthly total rainfall measurements on the day of sampling in the Cape Fear River Watershed……………………………………………………...............33
17. Correlation coefficients (R) between Bacteroides-Prevotella 16S
rRNA gene copy numbers and physical/nutrient parameters……………………………34
5
LIST OF FIGURES
FIGURE PAGE
1. Locations of sampling sites in the Cape Fear River Watershed………..…………….………11 2. Representative hog lagoon and river T-RFLP profiles………………………………………..14 3. MDS plot of Bacteroides-Prevotella communities in hog lagoons
and bimonthly sampling sites based on T-RFLP peak similarity………………………..15 4. Bubble plot of relative abundance of bp 229-230 T-RF in hog
lagoons and bimonthly sampling sites…………………………………………………...16 5. Comparison graphs of Bacteroides-Prevotella 16S rRNA gene copy
numbers in the Cape Fear River Watershed……………………………………………..18

6
ACKNOWLEDGEMENTS
We would like to acknowledge Rena Haltom and Matthew McIver for river sampling in 2009-2010. We also thank Kraig Westerbeek and Murphy Brown, LLC, a division of Smithfield Foods, for providing hog lagoon waste samples from various locations at North Carolina.

7
1. INTRODUCTION
Hog farming in North Carolina is a billion-dollar industry, ranked second only to Iowa in terms of total hog production; an estimated 10 million pigs are farmed within North Carolina borders (USNASS 2007). In order to accommodate such vast numbers of livestock, large scale, industrialized hog producers utilize concentrated animal feeding operations (CAFOs). CAFOs in turn, produce significant quantities of hog manure waste. In North Carolina, swine excrete approximately 15 million metric tons of raw waste including 101,000 metric tons of nitrogen and 22,700 metric tons of phosphorus annually (Mallin and Cahoon 2003). The majority of pig manure slurry is pumped or drained from massive hog houses into outdoor holding lagoons (EPA 1997). When the lagoons reach a certain level, the liquid supernatant is sprayed onto surrounding fields. These lagoons and spray-fields are subject to flooding, stormwater runoff, and soil leaching resulting in fecal and microbial contamination of downstream water bodies and nearby watersheds (Mallin 2000, Mallin and Cahoon 2003). Pollution from CAFOs during and after large storms has been well documented in North Carolina (Burkholder et al. 1997; Mallin et al. 1997). However, chronic runoff from lagoons and subsurface movement from spray-fields also occurs that contributes to fecal contamination in North Carolina’s watersheds (Mallin and Cahoon 2003). North Carolina’s lower Cape Fear River watershed contains approximately 5,000,000 head of swine housed in CAFOs, primarily in the Black and Northeast Cape Fear River watersheds. Major episodic CAFO pollution events have been documented from these watersheds (Mallin et al. 1997. Mallin 2000). However, so far no definitive investigation has been conducted to identify swine manure contamination as a source of chronic microbial pollution in North Carolina’s Cape Fear watershed.
Fecal pollution of water sources imposes serious risks to human health and aquatic ecosystems. Fecal matter often contains pathogenic microbes such as Cryptosporidium, Giardia, Salmonella and Escherichia coli that may contaminate drinking water supplies (Meays et al. 2004). Fecal matter is also rich in nitrogen and phosphorus, which may lead to eutrophication of nearby lakes and rivers. Current standard Environmental Protection Agency (EPA) practices rely on enumeration and cultivation of fecal indicators to monitor contamination in recreational and public water sources (EPA 2003). Fecal indicator bacteria include total fecal coliforms, E. coli, and fecal enterococci (Okabe et al. 2007). Unfortunately, these enumeration methods do not allow for identification of the contamination source (Field et al. 2003, Scott et al. 2002). In addition, fecal contaminants such as enterococci and E. coli are able to survive and proliferate outside of a host (Desmarais et al. 2001), creating a dispute as to their accuracy as a pollution indicator (Scott et al. 2002, Simpson et al. 2002). Non-coliform bacteria of the Bacteroides-Prevotella group have been proposed as alternate fecal indicators of water contamination (Daly et al. 2001, Hold et al. 2002, and Leser et al. 2002). Bacteroides are abundant in the intestines of warm-blooded animals, with a 1000-fold greater concentration than coliform bacteria (Fiksdal et al. 1985) and are believed to be host-specific (Bernhard and Field 2000a and b, Simpson et al. 2004). These bacteria are also obligate anaerobes that will not survive long outside of a host’s intestinal tract (Fiksdal et al. 1985, Allsop and Stickler 1985). Their strict anaerobic and nutrient requirements make them a good indicator species of recent fecal pollution. On the other hand,

8
these conditions have also limited the use of Bacteroides as indicators due to the complexity of cultivating obligate anaerobes (Okabe et al. 2007).
Sequence analysis of 16S rRNA genes showed that Bacteroides have host-specific distributions (Allsop and Stickler 1985, Fiksdal et al. 1985, Kreader 1995). It is believed that enteric bacteria such as Bacteroides have coevolved with their host providing the host-specificity (Dick et al. 2005). Human and ruminant specific Bacteroides 16S rRNA genes were the first genetic markers developed for fecal source discrimination (Bernhard and Field 2000a and b). Okabe et al (2007) developed specific 16S rRNA gene primers for the Bacteroides in cow and pig, and distinguished pig and cow fecal contamination in natural river water.
Real time PCR or Quantitative-PCR (Q-PCR) has utilized Bacteroides 16S rRNA genes as a sensitive, culture-independent genetic indicator to quantify the levels of fecal contamination from specific hosts. Q-PCR allows for rapid quantification and identification of host-specific contamination without the need for cultivating and isolating bacteria (Dick and Field 2004). Traditional methods of fecal enumeration such as the U.S. EPA-approved Colilert-18 test require culture for at least 18 hours for completion (Toranzos and McFeters 1997). Using Q-PCR, results can be obtained within 3-4 hours with traditional PCR methods and potentially within 30 min using advanced thermocycling techniques. Additionally, culture methods used for enumerating E. coli cells often underestimate total abundance because these methods do not account for E. coli cells that are viable but are non culturable (VBNC) (Servais et al. 2009). Q-PCR quantifies the number of genome units present in a sample, encompassing both culturable and VBNC E. coli cells, which provides for a more sensitive enumeration method.
Another molecular method for identifying hog-specific contamination is Terminal Restriction Fragment Length Polymorphism (T-RFLP) of Bacteroides 16S rRNA genes, which is a type of genetic fingerprint of a microbial community. T-RFLP is a simple and quick technique that uses restriction enzymes to digest amplified DNA (fluorescently labeled with either a forward or reverse primer) at a specific point, and then measuring the resulting length, height and area of each terminal restriction fragment (T-RF) (Kim et al. 2004). Savichtcheva and Okabe (2009) showed that pig-specific markers had lengths of 102 base pairs (bp) and between 138-141 bp when the amplicons of Bacteroides 16S rRNA genes were digested with the AciI restriction enzyme. It may be possible to assess different sources of fecal contamination including pig, cow and human based on T-RFLP analyses of Bacteroides 16S rRNA genes.
With the development of new molecular tools, the Cape Fear River watershed’s water quality can be monitored more insightfully through quantification and detection of hog fecal contamination from hog farms and lagoons. The goals of this research were (i) to detect swine manure contamination in the stream and river waters of the Northeast Cape Fear River and Black River basins using PCR based methods specific for the 16S rRNA genes of Bacteroides-Prevotella found in swine, (ii) to compare Bacteroides-Prevotella community structures in hog lagoon and river samples using T-RFLP analysis, (iii) to quantify the levels of swine manure

9
contamination in surface water using quantitative PCR of the hog specific Bacteroides-Prevotella 16S rRNA genes, (iv) to monitor spatial and temporal variations of contamination levels in different locations of both rivers, and (v) to compare genetic results with standard water quality parameter measures. We hypothesize that (i) swine manure contamination will be detected in the Cape Fear River watershed (ii) there will be correlations present between the abundance of hog-specific Bacteroides-Prevotella 16S rRNA genes and environmental parameters and (iii) hog-specific Bacteroides-Prevotella 16S rRNA gene abundances at monitoring sites will be related to each site proximity to hog facilities.

10
2. METHODS
2.1 Sample Collection
2.1.1 Hog Lagoon Samples. 18 different hog lagoon samples were kindly provided by Murphy-Brown, LLC, a division of Smithfield Foods. Hog lagoon slurries (1.2 mL) were centrifuged at 10,000g for 5 minute to concentrate biomass for DNA extraction.
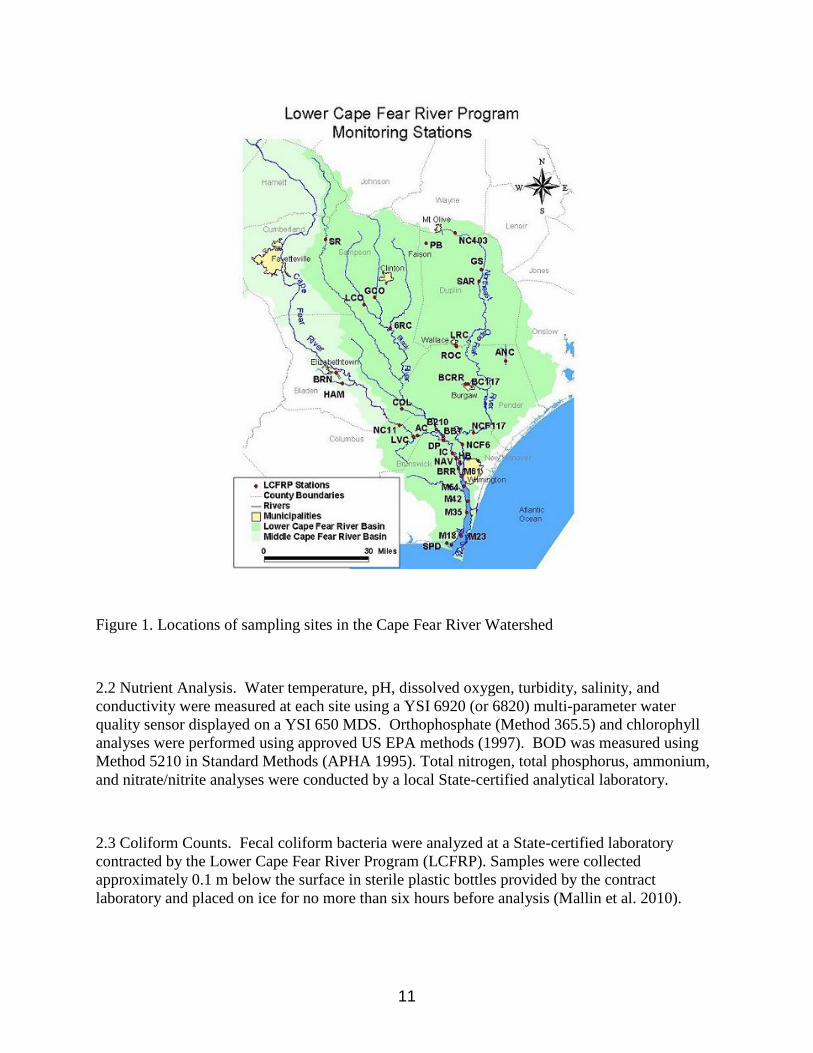
2.1.2 River Samples. Water samples were collected from 5 sites in the Black River watershed and 4 sites in the Northeast Cape Fear River watershed according to the procedures in the Lower Cape Fear River Program Quality Assurance/Quality Control (QA/QC) manual. The 5 sites in the Black River watershed include Great Coharie Creek at SR 1214 (GCO: N34˚ 55´ 6.852˝, W78˚ 23´ 19.4274˝), Little Coharie Creek at SR 1207 (LCO): N34˚ 50´ 5.028˝, W78˚ 22´ 15.1314˝), Six Runs Creek at SR 1003 (6RC: N34˚ 47´ 36.852˝, W78˚ 18´ 42.912˝), Colly Creek at NC 53 (COL: N34˚ 27´ 54˝, W78˚ 15´ 55.9074˝), and Black River at Highway 210 bridge (B210: N34˚ 25´ 52.9674˝, W78˚ 8´ 40.632˝). The 4 sites in the Northeast Cape Fear River watershed include Panther Branch below Bay Valley Foods (PB: N35˚ 8´ 4.02˝, W78˚ 8´ 10.68˝), Goshen Swamp at NC 11 (GS: N35˚ 1´ 45.2274˝, W77˚ 51´ 5.1474˝), Northeast Cape Fear River near Sarecta (SAR: N34˚ 58´ 44.3994˝ W77˚ 51´ 45.036˝), and Burgaw Creek at US 117 (BC117: N34˚ 33´ 50.0754˝, W77˚ 56´ 19.392˝). Sites were selected based on the nearby surrounding concentration of hog farms and CAFOs. Sites LCO, GCO, 6RC, PB, GS, and SAR are all located downstream from multiple (> 20) CAFO sites. Of the 9 sampling locations, the land surrounding both sites COL and BC117 contains the least number of hog lagoons. Three upstream CAFOs are found within the Colly Creek watershed. However, the sampling location within the Colly Creek watershed is located the furthest away from hog farming activities and is considered a non-contaminated site. Four CAFO sites are located within the Burgaw watershed as well as a large sausage factory near the sampling site; due to its close proximity to the sausage factory, BC117 is considered a possible contaminated site.
The river samples were collected every other month beginning in May 2009 and ending in May of 2010. Samples were collected for May 2009, July 2009, September 2009, November 2009, January 2010, March 2010, and May 2010. For site PB, samples were collected at the beginning of February 2010 instead of January 2010 due to freezing conditions. Water samples were collected in sterile 500 ml Pyrex glass bottles and stored on ice for transportation. Each sample was individually filtered on a sterile filter (Whatman GF/F 47 mm with pore size of 0.7 µm). The filters were wrapped in aluminum foil and stored at -20°C until DNA was extracted.
11
Figure 1. Locations of sampling sites in the Cape Fear River Watershed
2.2 Nutrient Analysis. Water temperature, pH, dissolved oxygen, turbidity, salinity, and conductivity were measured at each site using a YSI 6920 (or 6820) multi-parameter water quality sensor displayed on a YSI 650 MDS. Orthophosphate (Method 365.5) and chlorophyll analyses were performed using approved US EPA methods (1997). BOD was measured using Method 5210 in Standard Methods (APHA 1995). Total nitrogen, total phosphorus, ammonium, and nitrate/nitrite analyses were conducted by a local State-certified analytical laboratory.
2.3 Coliform Counts. Fecal coliform bacteria were analyzed at a State-certified laboratory contracted by the Lower Cape Fear River Program (LCFRP). Samples were collected approximately 0.1 m below the surface in sterile plastic bottles provided by the contract laboratory and placed on ice for no more than six hours before analysis (Mallin et al. 2010).

12
2.4 Rainfall Data. Monthly rainfall data for each site were collected from the North Carolina State University’s State Climate Office of North Carolina’s website: http://www.nc-climate.ncsu.edu/cronos/.
2.5 Molecular Detection
2.5.1 DNA Extraction. Prior to DNA extraction, the filter purged with river water was cut into half using a sterilized razorblade. Environmental DNA was extracted from filters or hog lagoon pellets using the PowerSoil DNA Kit (Mo-bio Laboratories, Inc., Carlsbad, CA) following the manufacture’s protocol. All samples were disrupted using a Thermo Savant Fast Prep FP 120 Cell Disrupter (Qbiogene Inc. Carlsbad CA).
2.5.2 T-RFLP Analysis. Bacteroides 16S rRNA genes in both hog lagoons and river samples were amplified using 6-FAM-labeled Bac32F and Bac708R primers as described by Bernhard and Field (2000). PCR products were run on 1.0% agarose using gel electrophoresis. Samples positive for the Bacteroides 16S rRNA gene displayed an amplified band at approximately 676 bp. Positive PCR products were gene-cleaned using the UltraClean GelSpin DNA Purification Kit (Mo-Bio, Carlsbad, CA). DNA was quantified using the Quant-iT dsDNA Assay Kit, High Sensitivity (Invitrogen, Carlsbad, CA). A total of 20ng of PCR product was digested overnight at 37˚C with 5 units of AciI restriction endonuclease (New England Biolabs, Ipswich MA). The restriction enzyme AciI was selected based on a previous study (Savichtcheva and Okabe 2009). Digested products were precipitated with isopropanol and run on a 3130x/ Genetic Analyzer (Applied Biosystems, Carlsbad CA). Fragment analysis was conducted using the Gene Mapper 4.0 software (Applied Biosystems, Carlsbad CA).
2.5.3 Generating Real-Time PCR Standards. Quantitative PCR standard of the hog-specific Bacteroides-Prevotella 16S rRNA gene was generated using GoTaq master mix (Promega) and the primers qPS422F (Okabe et al. 2007) and Bac708R (Bernhard and Field 2000). The reactions were carried out as follows: 95˚C for 15 min, followed by 40 cycles of denaturation at 95˚C for 15s annealing at 62˚C for 1 min and extension at 75˚C for 35s. PCR products were cleaned following the protocol for the UltraClean GelSpin DNA Purification Kit (Mo-Bio, Carlsbad, CA). Clone libraries were constructed (Perfect Prep Cloning Kit, 5 Prime, Gaithersburg, MD). Sequencing was conducted using the Big Dye Terminator v1.1, v3.1 sequencing method and run on a 3130x/ Genetic Analyzer (Applied Biosystems, Carlsbad CA). Sequence identification and verification of hog specificity was achieved by using a BLAST search on the National Center for Biotechnology Information database (http://www.ncbi.nlm.nih.gov/). Plasmid extraction was conducted on a positively identified hog-specific Bacteroides-Prevotella 16S rRNA clone for the PCR products from Bac-2 using the Zyppy Plasmid Miniprep Kit (Zymo, Irvine CA). Serial dilutions of extracted plasmid DNA were used for quantification standards of Real-Time PCR.
13
2.5.4 Real-Time PCR. Real-Time PCR reactions using 1.0 ng/μL DNA per sample of river water were conducted on the 7500 Fast Real-Time PCR system (Applied Biosystems, Carlsbad CA) using the SYBR® Green PCR Master mix (Invitrogen, Carlsbad CA) and the Q-PCR primers qPS422F and Bac708R. Reactions were carried out as described above in generating real-time PCR standards. Amplification calculations based on the standard curve slopes were performed using ABI PRISM 7000 sequence detection software (Applied Biosystems, Carlsbad CA).
2.5.5 Statistical Analysis. Correlation analyses were performed to assess significant relationships between gene copy numbers and environmental parameters. T-RFLP fingerprints were analyzed using T-RFLP Analysis Expedited (T-Rex) software (Culman et al. 2009, http://trex.biohpc.org/). Variations in Bacteroides 16S rDNA communities were assessed using a Bray-Curtis similarity matrix, which was then used to perform a multidimensional scaling (MDS) analysis in Primer-5 software package (Primer-E Ltd., Lutton UK) to visualize spatial and temporal variations in the communities.

14
3. RESULTS
3.1 T-RFLP Profile Analysis. T-RFLP analysis of Bacteroides 16S rRNA genes was conducted to determine and compare the dominant members of Bacteroides communities in hog lagoon and river samples. All 18 hog lagoon samples were positive for PCR of Bacteroides 16S rRNA gene. The number of T-RFs found in the hog lagoon samples varied between 2 and 5 with all dominant T-RFs within 133 to 230 bp. The predominant T-RFs were found to be 229 and 230 bp. Both T-RFs had up to 59.4% of the relative abundance of measureable lagoon T-RFs, indicating them to be a potential hog-specific Bacteroides 16S rRNA gene marker (Figure 2A). The second and third most common T-RFs had fragment sizes of 223 bp and 227-228 bp. The 223 bp and 133 bp T-RFs represented 13.3% and 7.6% respectively, of the total T-RF area in hog lagoon samples (Figure 2B and C). Of the 62 stream and river samples, 61 were positive for the PCR of Bacteroides 16S rRNA genes. The Bacteroides 16S rRNA gene was not detected for site COL during March 2010. In addition, the samples collected from GCO September 2009, LCO November 2009 and 6RC May 2009 were not included in further analysis due to poor quality of PCR amplification.
The numbers of T-RFs in the stream and river samples were highly varied across all samples depending on the sites and sampling months. The predominant T-RFs found in the river samples had 227-228 bp sizes with a relative abundance of 36% (Figure 2D). The second and third most abundant T-RFs had fragment sizes of 52 bp with a 6.9% relative abundance and 50 bp with a 5.9% relative abundance, respectively. The potential hog-specific indicator T-RFs with 229-230 bp was the fourth most abundant T-RFs in the stream and river samples with a relative abundance of 5.4%.
Figure 2. Representative hog lagoon and river T-RFLP profiles: (A) hog lagoon 3141 (B) hog lagoon (C) hog lagoon 3141 (D) river site GCO March 2009

15
3.2 MDS Analysis. Bacteroides 16S rDNA T-RFLP fingerprints were compared to examine the similarities of Bacteroides communities among the 18 hog lagoon and 58 stream and river water samples. The MDS plot (Fig 3) demonstrated the comparison of Bacteroides community structures detected in hog lagoon and river water samples. Hog lagoon communities clustered separately from river samples with the exception of the sample from BC117 July 2009, which partially overlapped the hog lagoon cluster. There was no discernible temporal or spatial clustering among the various monthly river samples.
Figure 3. MDS plot of Bacteroides-Prevotella communities in hog lagoons and bimonthly sampling sites based on T-RFLP peak similarity
In order to test the presence of the hog specific indicator T-RFs in the stream and river samples, the relative abundances of the 229-230 bp T-RFs were visually represented as bubble sizes in the MDS plot (Fig 4). Of all the river sites, 6RC July 2009, 6RC January 2010 and BC117 July 2009 had the largest bubble sizes and their Bacteroides communities were clustered closest to the hog lagoons. As the Bacteroides communities of various river sites radiated outward and away from the hog lagoon cluster, bubble size proportionally decreased. Communities furthest away from the hog lagoon cluster did not have the 229-230bp T-RFs.

16
Figure 4. Bubble plot of relative abundance of bp 229-230 T-RF in hog lagoons and bimonthly sampling sites
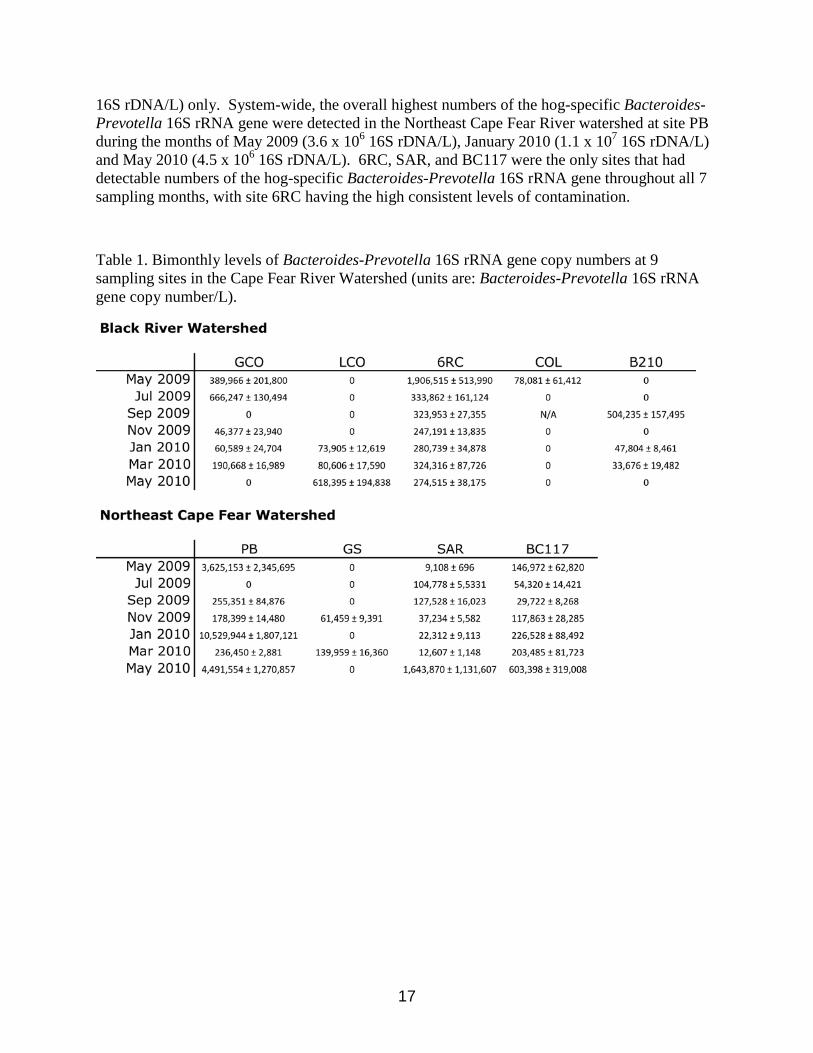
3.3 Quantification of water samples by real-time PCR assay. The hog-specific primers qPS422F and Bac708R were used to quantify the hog specific-Bacteroides-Prevotella 16S rRNA gene, which was identified as the 229-230 bp T-RFs based on in silico analysis of Bacteroides-Prevotella 16S rRNA genes. Nineteen out of 34 samples from the Black River watershed and 22 out of 28 samples from the Northeast Cape Fear River had detectable levels of the hog-specific Bacteroides-Prevotella 16S rRNA gene (Table 1). Based on Q-PCR data, 16S rDNA values above 5.0 x 10⁵ copies per 1L of filtered water were considered high hog waste contamination and 16S rDNA/L values below 1.0 x 10⁵ copies were considered low contamination. 16S rRNA gene copies measuring between high and low levels were designated as moderate contamination. For all stream and river sites within the Northeast Cape Fear watershed, May 2009 and May 2010 samples had relatively high levels of contamination and samples from November 2009 had generally the lowest levels of contamination on a per site basis (Fig 5). In the Northeast Cape Fear River watershed for May 2010, the high levels of contamination seemed to decrease from upstream (site PB) to downstream (site SAR). PB drains into the upper Northeast Cape Fear River upstream of SAR (Fig. 1). In the Black River watershed, the levels of hog waste contamination found at sites GCO (drains a watershed of 95 CAFOs) and LCO (drains a watershed of 63 CAFOs) were generally less than the levels found at 6RC, which drains a watershed of 153 CAFOs (Mallin et al. 2001). Site COL had the least amount of hog waste contamination, having detectable hog specific 16S rDNA for the month of May 2009 (7.8 x 10⁴
17
16S rDNA/L) only. System-wide, the overall highest numbers of the hog-specific Bacteroides-Prevotella 16S rRNA gene were detected in the Northeast Cape Fear River watershed at site PB during the months of May 2009 (3.6 x 10⁶ 16S rDNA/L), January 2010 (1.1 x 10⁷ 16S rDNA/L) and May 2010 (4.5 x 10⁶ 16S rDNA/L). 6RC, SAR, and BC117 were the only sites that had detectable numbers of the hog-specific Bacteroides-Prevotella 16S rRNA gene throughout all 7 sampling months, with site 6RC having the high consistent levels of contamination.
Table 1. Bimonthly levels of Bacteroides-Prevotella 16S rRNA gene copy numbers at 9 sampling sites in the Cape Fear River Watershed (units are: Bacteroides-Prevotella 16S rRNA gene copy number/L).

18
Figure 5. Comparison graphs of Bacteroides-Prevotella 16S rRNA gene copy numbers at 9 sampling sites in the Cape Fear River Watershed. Error bars represent 1 standard deviation.

19
3.4 Enumeration of fecal coliform counts. Fecal coliform counts were collected for all 9 stream and river sites over a period of 1 year on a bimonthly basis beginning in May 2009 and ending in May 2010, with the exception of site COL during the month of September 2009 (Table 2). Fecal coliform counts were consistently higher for all months in the Northeast Cape Fear River compared to the Black River; coliform counts ranged from 101 to 104 CFUs (colony-forming units per 100 mL). In the Black River, average fecal coliform counts were higher in the winter months (November and January) versus those in the summer months. In the Northeast Cape Fear River watershed, fecal coliform counts had no notable temporal pattern. However, on a spatial scale sites PB and BC117 had consistently higher overall fecal coliform counts than all other sites. Fecal coliform counts were above the North Carolina water quality standard of 200 CFU/100 mL for the following sites: PB (May 2009, July 2009, September 2009, November 2009 and May 2010), GS (July 2009), SAR (May 2009, September 2009 and November 2009) and BC117 (May 2009, July 2009, September 2009, November 2009 and January 2010) (Table 2). We note that both PB and BC117 receive inputs from wastewater treatment facilities in addition to non-point source pollution. No sites in the Black River watershed exceeded the North Carolina CFU standard during the months sampled.
Table 2. Bimonthly fecal coliform counts present at 9 sampling sites in the Cape Fear River Watershed (units are: CFU/100 mL).
20
3.5 Nutrient Analyses
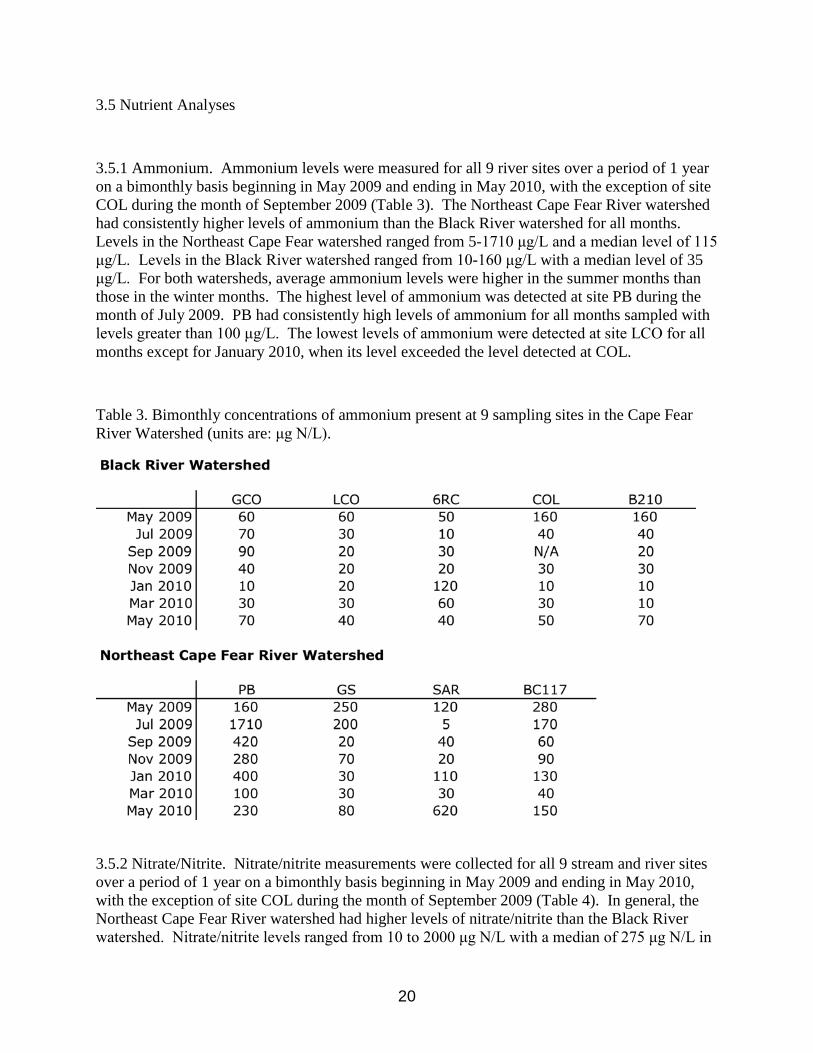
3.5.1 Ammonium. Ammonium levels were measured for all 9 river sites over a period of 1 year on a bimonthly basis beginning in May 2009 and ending in May 2010, with the exception of site COL during the month of September 2009 (Table 3). The Northeast Cape Fear River watershed had consistently higher levels of ammonium than the Black River watershed for all months. Levels in the Northeast Cape Fear watershed ranged from 5-1710 μg/L and a median level of 115 μg/L. Levels in the Black River watershed ranged from 10-160 μg/L with a median level of 35 μg/L. For both watersheds, average ammonium levels were higher in the summer months than those in the winter months. The highest level of ammonium was detected at site PB during the month of July 2009. PB had consistently high levels of ammonium for all months sampled with levels greater than 100 μg/L. The lowest levels of ammonium were detected at site LCO for all months except for January 2010, when its level exceeded the level detected at COL.
Table 3. Bimonthly concentrations of ammonium present at 9 sampling sites in the Cape Fear River Watershed (units are: μg N/L).
3.5.2 Nitrate/Nitrite. Nitrate/nitrite measurements were collected for all 9 stream and river sites over a period of 1 year on a bimonthly basis beginning in May 2009 and ending in May 2010, with the exception of site COL during the month of September 2009 (Table 4). In general, the Northeast Cape Fear River watershed had higher levels of nitrate/nitrite than the Black River watershed. Nitrate/nitrite levels ranged from 10 to 2000 μg N/L with a median of 275 μg N/L in

21
the Black River watershed, and from 10 to 21,100 μg N/L with a median of 840 μg N/L in the Northeast Cape Fear watershed. Site BC117 exceeded the North Carolina drinking water standard of 10 mg/L for nitrate for months July 2009, September 2009 and May 2010; this site also had the highest concentrations of nitrate for all stations and months sampled. Station BC117 is located downstream of the town of Burgaw wastewater treatment plant and has received high nitrate levels for many years (Mallin et al. 2010). No other sites exceeded the North Carolina drinking water standard for nitrate during the months sampled. In the Black River watershed nitrate/nitrite levels were generally highest in January and March 2010. On a spatial scale, site 6RC maintained the highest nitrate levels followed by GCO and LCO (all of these sites receive only non-point source runoff), with somewhat lesser nitrate/nitrite levels downstream at B210 in the Black River proper; the relatively unimpacted site COL had lowest nitrate/nitrite levels. Sites PB, GS, and SAR had increased levels of nitrate/nitrite in January and March 2010, but decreased levels during the summer months. While there is a drinking water standard, there are no ambient water quality standards for nitrate levels in North Carolina. However, previous research in this system (Mallin et al. 2004) demonstrated that nitrate concentrations > 500 μg N/L led to significant increases in chlorophyll a and BOD in experimental bioassays.
Table 4. Bimonthly concentrations of nitrate/nitrite present at 9 sampling sites in the Cape Fear River Watershed (units are: μg N/L).

22
3.5.3 Total Nitrogen. Total nitrogen measurements were collected for all 9 stream and river sites over a period of 1 year on a bimonthly basis beginning in May 2009 and ending in May 2010, with the exception of site COL during the month of September 2009 (Table 5). Overall total nitrogen levels were consistently higher in the Northeast Cape Fear River watershed than in the Black River watershed. Levels in the Northeast Cape Fear River watershed ranged from 800 μg N/L to 21,110 μg N/L with a median of 1,865 μg N/L while levels in the Black River watershed ranged from 410 μg N/L to 2,550 μg N/L with a median of 1,144 μg N/L. In the Black River watershed, most sites had the lowest levels of total nitrogen during November 2009 compared to all other months. In the Northeast Cape Fear River total nitrogen levels were lowest during May 2009. Site B210 had the highest total nitrogen levels for all sites and all months sampled.
Table 5. Bimonthly total nitrogen levels present at 9 sampling sites in the Cape Fear River Watershed (units are: μg N/L).

23
3.5.4 Total Phosphorus. Total phosphorus measurements were collected for all 9 river sites over a period of 1 year on a bimonthly basis beginning in May 2009 and ending in May 2010, with the exception of site COL during the month of September 2009 (Table 6). Overall levels of phosphorus were higher in the Northeast Cape Fear River watershed than in the Black River watershed. Levels in the Northeast Cape Fear River watershed ranged from 40 μg P/L to 3,040 μg P/L with a median of 210 μg P/L while levels in the Black River watershed ranged from 20 μg P/L to 300 μg P/L with a median of 100 μg P/L. In both rivers, phosphorus levels were generally lower in the winter months and increased in the summer months. Site BC117 and site PB in the Northeast Cape Fear River watershed had the highest overall levels of phosphate; both of these sites are downstream of wastewater treatment plant effluents (Mallin et al. 2010)
Table 6. Bimonthly total phosphorus levels present at 9 sampling sites in the Cape Fear River Watershed (units are: μg P/L).

24
3.5.5 Orthophosphate. Orthophosphate measurements were collected for all 9 stream and river sites for a 9 month period on a bimonthly basis beginning in May 2009 and ending in January 2010, with the exception of site COL during the month of September 2009 and site PB February 2010 (Table 7). Orthophosphate levels were similar between both watersheds except for site BC117 in the Northeast Cape Fear River watershed, which had elevated levels of orthophosphate. The lowest levels of orthophosphate occurred during January 2009 for both rivers and the highest levels occurred during July and September 2009.
Table 7. Bimonthly concentrations of orthophosphate present at 9 sampling sites in the Cape Fear River Watershed (units are: μg/L).

25
3.5.6 Dissolved Oxygen. Dissolved oxygen was measured for all 9 stream and river sites over a period of 1 year on a bimonthly basis beginning in May 2009 and ending in May 2010, with the exception of site COL during the month of September 2009 (Table 8). Average dissolved oxygen was generally higher at sites in the Black River watershed compared to those in the Northeast Cape Fear River watershed. The highest levels of dissolved oxygen for both watersheds occurred during the winter months (November 2009, January 2010 and March 2010) with the highest levels being detected during January 2010. The lowest levels of dissolved oxygen occurred at site PB May 2009 (1.2 mg/L) and at GS July 2009 and September 2009 (2.5 mg/L). Sites that measured below the North Carolina State swamp water (blackwater) standard of 4.0 mg/L were PB (May 2009), GS (May 2009, July 2009, September 2009 and May 2010), and BC117 (May 2010), all located in the Northeast Cape Fear River watershed. Sites LCO and 6RC were the only sites that maintained dissolved oxygen measurements above 5.0 mg/L for all months sampled.
Table 8. Bimonthly concentrations of dissolved oxygen present at 9 sampling sites in the Cape Fear River Watershed (units are: mg/L).

26
3.5.7 Chlorophyll a. Chlorophyll a levels were measured for all 9 stream and river sites over a period of 1 year on a bimonthly basis beginning in May 2009 and ending in May 2010, with the exception of site COL during the month of September 2009 (Table 9). Overall chlorophyll a levels were higher in the Northeast Cape Fear River watershed than in the Black River watershed. Levels of chlorophyll a ranged from 0 to 7.0 μg/L in the Black River watershed and from 1.0 to 438.0 μg/L in the Northeast Cape Fear watershed. Both PB and GS exceeded the North Carolina standard of 40 μg/L in July 2009. Site GS also exceed 40 μg/L again in May 2010. No sites in the Black River exceeded the North Carolina standards set for chlorophyll a. Chlorophyll a levels in the Northeast Cape Fear River were highest in the summer months and highest at sites PB during July 2009 and GS July 2009. There was no discernable seasonal pattern for chlorophyll a in the Black River.
Table 9. Bimonthly concentrations of chlorophyll a present at 9 sampling sites in the Cape Fear River Watershed (units are: μg/L).

27
3.5.8 Conductivity. Conductivity measurements were collected for all 9 stream and river sites over a period of 1 year on a bimonthly basis beginning in May 2009 and ending in May 2010, with the exception of site COL during the month of September 2009 (Table 10). Overall, the Northeast Cape Fear River watershed had higher levels of conductivity than the Black River watershed for all months sampled. In general conductivity levels were highest for November 2009 in the Black River watershed and highest for July 2009 in the Northeast Cape Fear River watershed. Site GCO had the highest levels of conductivity for the Black River watershed and site PB had the highest levels of conductivity for the Northeast Cape Fear River watershed. Site PB had the highest level of conductivity out of all sites during July 2009 with a conductivity level of 12.33 mS/cm.
Table 10. Bimonthly conductivity levels measured at 9 sampling sites in the Cape Fear River Watershed (units are: mS/cm).
28
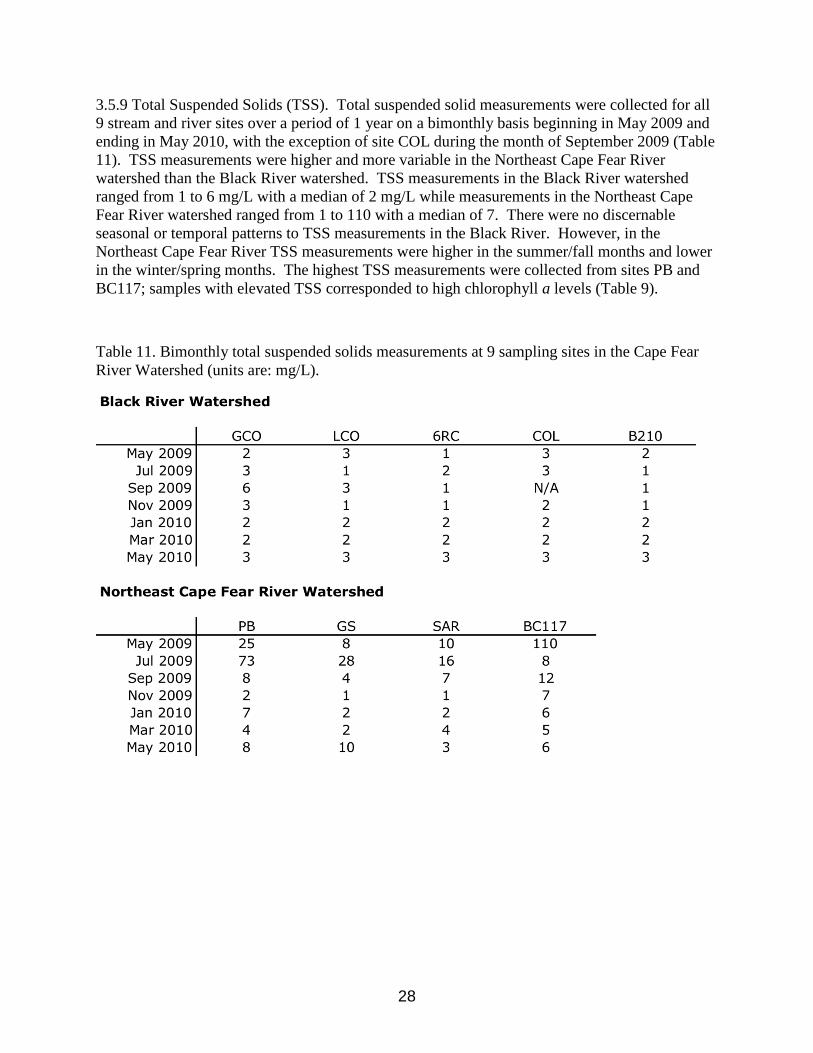
3.5.9 Total Suspended Solids (TSS). Total suspended solid measurements were collected for all 9 stream and river sites over a period of 1 year on a bimonthly basis beginning in May 2009 and ending in May 2010, with the exception of site COL during the month of September 2009 (Table 11). TSS measurements were higher and more variable in the Northeast Cape Fear River watershed than the Black River watershed. TSS measurements in the Black River watershed ranged from 1 to 6 mg/L with a median of 2 mg/L while measurements in the Northeast Cape Fear River watershed ranged from 1 to 110 with a median of 7. There were no discernable seasonal or temporal patterns to TSS measurements in the Black River. However, in the Northeast Cape Fear River TSS measurements were higher in the summer/fall months and lower in the winter/spring months. The highest TSS measurements were collected from sites PB and BC117; samples with elevated TSS corresponded to high chlorophyll a levels (Table 9).
Table 11. Bimonthly total suspended solids measurements at 9 sampling sites in the Cape Fear River Watershed (units are: mg/L).

29
3.5.10 Turbidity. Turbidity measurements were collected for all 9 stream and river sites over a period of 1 year on a bimonthly basis beginning in May 2009 and ending in May 2010, with the exception of site COL during the month of September 2009 (Table 12). Turbidity was generally higher and more variable in the Northeast Cape Fear River watershed than in the Black River watershed. Turbidity measurements in the Black River watershed ranged from 1 to 13 NTUs with a median of 3 NTUs while measurements in the Northeast Cape Fear River watershed ranged from 0 to 167 with a median of 7. Site BC117 exceeded the North Carolina freshwater turbidity standard of < 50 NTUs for the month of May 2009. No other sites exceeded the North Carolina turbidity standard. There was no discernable temporal pattern in the Black River. However, on a spatial scale site COL had the lowest overall turbidity measurements. In the Northeast Cape Fear River sites PB and BC117 had the highest turbidity measurements for most months sampled; several of the samples with high turbidity also had high TSS (Table 11).
Table 12. Bimonthly turbidity levels measured at 9 sampling sites in the Cape Fear River Watershed (units are: NTU).

30
3.5.11 Temperature. Water temperature measurements were collected for all 9 stream and river sites over a period of 1 year on a bimonthly basis beginning in May 2009 and ending in May 2010, with the exception of site COL during the month of September 2009 (Table 13). Monthly average temperatures were slightly higher in the Black River watershed than in the Northeast Cape Fear River watershed. The lowest temperatures for both rivers occurred during Jan 2010 and the highest temperatures occurred during July 2009. There was no consistent spatial pattern to temperature measurements in either the Black River or the Northeast Cape Fear River watersheds.
Table 13. Bimonthly temperatures measurements at 9 sampling sites in the Cape Fear River Watershed (units are: ˚C).
31
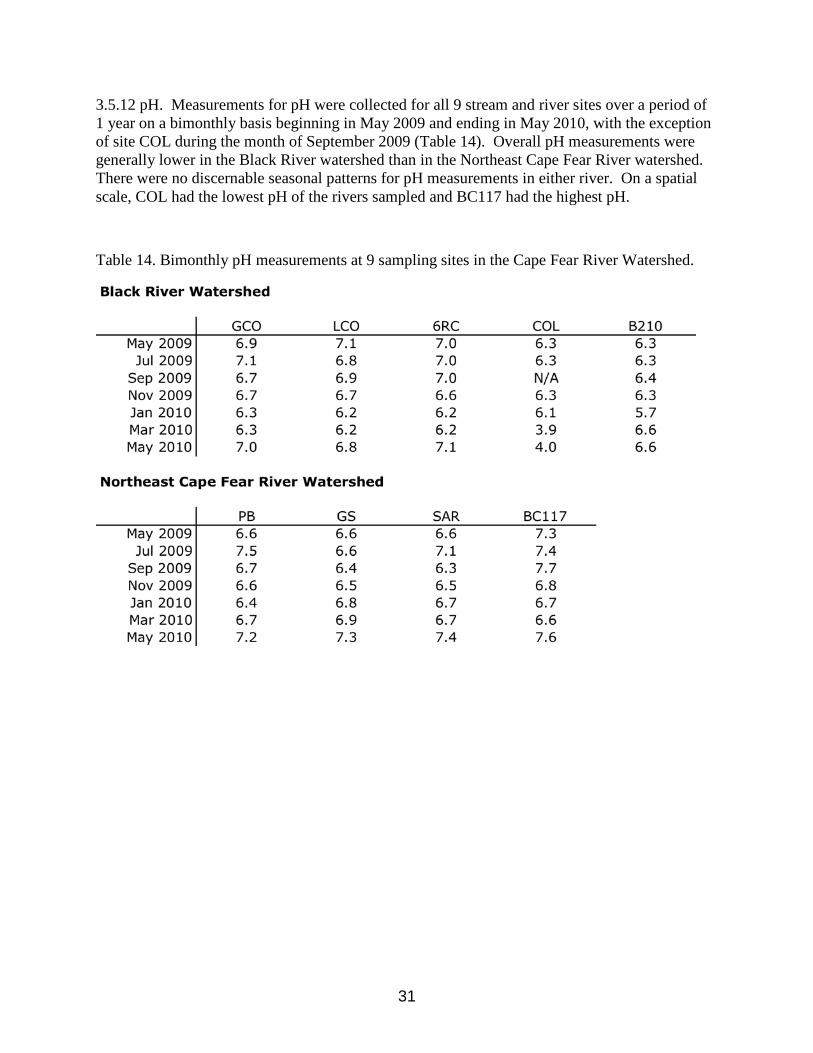
3.5.12 pH. Measurements for pH were collected for all 9 stream and river sites over a period of 1 year on a bimonthly basis beginning in May 2009 and ending in May 2010, with the exception of site COL during the month of September 2009 (Table 14). Overall pH measurements were generally lower in the Black River watershed than in the Northeast Cape Fear River watershed. There were no discernable seasonal patterns for pH measurements in either river. On a spatial scale, COL had the lowest pH of the rivers sampled and BC117 had the highest pH.
Table 14. Bimonthly pH measurements at 9 sampling sites in the Cape Fear River Watershed.

32
3.5.13 Rainfall amounts. Rainfall amounts were measured for each of the 9 stream and river sites over a period of 1 year on a bimonthly basis beginning in May 2009 and ending in May 2010, with the exception of site COL during the month of September 2009 (Table 15 and 16). Rainfall totals were measured for a period for 3 days prior to sampling and then again for the day of sampling. Rainfall amounts were generally higher for sites within the Northeast Cape Fear River watershed than the Black River watershed. In the Northeast Cape Fear River watershed, May and November had overall higher amounts of rainfall than all other months. In the Black River watershed, both May 2009 and 2010 had higher average amounts of rainfall. Sites BC117 and PB had the highest rainfall totals of all sites while GCO had the lowest rainfall amounts.
Table 15. Bimonthly total rainfall measurements at 9 sampling sites 3 days prior to sampling in the Cape Fear River Watershed (units are: inches).

33
Table 16. Bimonthly total rainfall measurements on the day of sampling at 9 sampling sites in the Cape Fear River Watershed (units are: inches).
3.5.14. Correlation Analyses. Bimonthly nutrient and physical parameters for all 9 sites measured from May 2009 through May 2010 were compared to hog-specific Bacteroides-Prevotella 16S rDNA abundance (Table 17). There was no overall pattern that existed among all the sites or between the rivers regarding nutrients and hog-specific Bacteroides-Prevotella contamination. Instead, correlation between various nutrients and hog-specific Bacteroides-Prevotella contamination was entirely site specific. Monthly ammonium levels at sites COL and SAR were positively correlated with the monthly numbers of the hog-specific Bacteroides-Prevotella 16S rRNA gene. Both had a correlation coefficient of r = 0.97 and a p-value of 0.001 and 0.00035 respectively. The monthly concentrations of chlorophyll a at site 6RC were negatively correlated (r = -0.75) with monthly numbers of the hog-specific Bacteroides-Prevotella 16S rRNA gene, but the correlation was not significant (p = 0.052). Conductivity at site GCO was positively and significantly correlated (r = 0.78) to Bacteroides-Prevotella contamination (p = 0.037) while at site PB, turbidity was positively and significantly correlated (r = 0.77, p = 0.04). However at site SAR, Bacteroides-Prevotella numbers were significantly correlated to pH measurements (r = 0.76, p = 0.05). In terms of rainfall totals, both sites LCO and 6RC rainfall amounts were significantly correlated to hog-specific Bacteroides-Prevotella contamination. At site LCO, rain 3 days prior to sampling significantly correlated with hog-specific Bacteroides-Prevotella numbers increases (r = 0.98, p = 0.0001) and rain during the day of sampling significantly correlated to hog-specific Bacteroides-Prevotella increases at site 6RC (r = 0.80, p = 0.03). Hog-specific Bacteroides-Prevotella contamination at sites B210, GS and BC117 did not significantly correlate with any of the measured nutrients.

34
Table 17. Correlation coefficients (R) between Bacteroides-Prevotella 16S rRNA gene copy numbers and physical/nutrient parameters, at 9 sampling sites. Significant correlations (p < 0.05) are in bold.
35
4. DISCUSSION
Both T-RFLP analyses and quantitative PCR analyses were used to identify and monitor potential hog waste contamination in the various stream and river sites in the lower Cape Fear River watershed. T-RFLP profiles of Bacteroides 16S rRNA genes were analyzed in order to compare variations in Bacteroides communities among stream, river and hog lagoon samples and to identify potential hog-specific T-RFs. The MDS plot (Fig. 3) showed the presence of distinct Bacteroides communities in hog lagoons and rivers. The 229-230 bp T-RFs were predominant in the lagoon samples and are considered to be hog-specific T-RFs. In comparison, the river samples had varying T-RF fragment sizes with no specific T-RF encompassing more than 50% of the total peak abundance. These variations in T-RF fragment sizes indicate that many different Bacteroides populations are present in river water and originate from various fecal resources such as ruminant, human, and canine. The 227-228 bp T-RFs found in all but one river sample have been shown from previous studies to be present in dogs, geese, horses and pig fecal samples (Fogarty and Voytek 2005, Liu et al. 2010). In addition, the “cow-specific” T-RF with 124 bp (Liu et al. 2010) was detected in river samples from both B210 and GCO. With AciI restriction enzyme digestion, T-RFs with 102,133-138-141, 154-157, 190, 249, and 351 bp were considered as potential hog-specific indicators (Okabe and Savichtcheva 2009). However, the lagoon T-RFLP data in this study showed 229-230 bp T-RFs as dominant and hog specific while the T-RFs with 138, 154-157, 190, 249, or 351 bp were not detected. Only one or two lagoon samples had T-RFs with 102 bp and 141 bp but with less than 0.6% peak abundance. However, the third most abundant peak found in the hog lagoons for this study occurred at 133 bp T-RF with 7.6% of total abundance. This peak corresponded to Bacteroides 16S rRNA sequences that were not identified for host organisms (Okabe and Savichtcheva 2009). Furthermore, Fogarty and Voytek (2005) found 414 bp T-RF to be the most abundant peak, present in 74% of hog fecal samples analyzed. Only 1 of the 18 hog lagoons sampled had the 414 bp T-RF. These variations in hog-specific T-RFs may be due to a combination of differences in Bacteroides populations that result from different types of pigs being raised, age/sex of pigs, diet differences, manure storage/treatment, antibiotic usage, environmental conditions, migration and location (Tannok 1997). The relative abundance of the hog-specific indicator 229-230 bps TR-F found in this study did not correlate to the levels of hog-specific Bacteroides 16S genes quantified by Q-PCR assays. This discrepancy is most likely a result of the limitation of hog-specific T-RF detection based on T-RFLP analysis. More studies similar to this one will need to be conducted in order to determine the extent of variation in hog Bacteroides populations and whether regional patterns exist in the Cape Fear Watershed.
Q-PCR of the hog-specific Bacteroides-Prevotella 16S rRNA gene determined spatial and temporal variation of hog lagoon waste contamination in the lower Cape Fear River watershed. In the Northeast Cape Fear River, site PB had consistently higher numbers of hog-specific Bacteroides-Prevotella detection than any other site despite having relatively fewer numbers of upstream CAFOs (approximately 12 small to midsize). However, unlike other sampling stations the PB site is located directly downstream from one large-sized CAFO. The close proximity to a CAFO is most likely a factor in the increased numbers of hog-specific Bacteroides-Prevotella at

36
site PB. Additionally, hog-specific Bacteroides-Prevotella numbers at site PB were strongly correlated to relatively increased turbidity levels (Table 12). This relatively increased turbidity may be an indicator of direct run-off or discharge from nearby hog lagoons. High turbidity is characteristic of hog lagoon spills (Burkholder et al. 1997; Mallin et al. 1997). Sinclair et al. (2009) reported that turbidity levels were positively correlated to presumptive E. coli and somatic coliphages suggesting a link between sediment and microorganism transport. Mallin et al. (2001) found strong correlations between turbidity and fecal coliform counts in streams in the lower Cape Fear watershed.
Site GS, which had the lowest overall levels of hog-specific Bacteroides-Prevotella detection, is downstream from site PB, and from several CAFOs, but none are directly located near the GS sampling station. In fact, the sampling station is located between two National Pollutant Discharge Elimination System (NPDES) point discharge sites. A short distance downstream from GS is site SAR, which had similarly low levels of hog-specific Bacteroides-Prevotella detection, with the exception of May 2010. Site BC117, the furthest downstream site, has no hog CAFOs located near the sampling station and only 4 small (<5,000 head) CAFOs within its watershed. However, there is a large pork sausage factory located upstream of the sampling station. Run-off or discharge from the factory may account for why site BC117 had consistently high detection of hog-specific Bacteroides-Prevotella for all months sampled, despite its remoteness from large hog CAFOs. Overall, hog-specific Bacteroides-Prevotella contamination in the Northeast Cape Fear River watershed seemed to depend primarily on proximity of the sampling site to upstream hog-related facilities. Sites furthest away from hog farming activities had the least amount of contamination compared to those directly downstream from a hog facility. On a seasonal basis, all but one site had a peak in hog-specific Bacteroides-Prevotella contamination during May 2010. This is most likely a result from run-off or leaching from seasonal spraying of fields with lagoon waste.
With the exception of B210, the sampling sites in the Black River watershed represent large tributary streams rather than the river proper (Fig. 1). Sites LCO, GCO and 6RC all have many CAFOs in their watersheds (Mallin et al. (2001) and run downstream to site B210. COL is located on a separate, relatively unimpacted small western branch of the river that flows downstream to site B210. However, University of North Carolina Wilmington researchers have seen wild hogs in the vicinity of COL during sampling trips, which may be responsible for the swine contamination detected in May 2009. The LCO site is directly downstream from 2 medium CAFOs, while site GCO is located directly downstream from 3 small and 1 medium CAFO. Hog waste contamination at site GCO correlated with increased conductivity while contamination at site LCO correlated with rainfall amounts 3 days prior to sampling (Table 16). Nnane et al. (2011) demonstrated that levels of fecal bacteria tended to be more than 10 times higher in river water collected during heavy rainfall events. Mallin et al. (2001) showed that rainfall within 24 hr prior to sampling was positively correlated with fecal coliform counts in 11 streams in the lower Cape fear watershed, including some of the sites in this study. Rainfall induces run-off contaminated with accumulated fecal matter and resuspension of fecal indicator organisms. Because site LCO and GCO are located on separate branches of the Northeast Cape Fear and receive input from different CAFOs, it is expected that these sites would present

37
dissimilar seasonal hog-specific Bacteroides-Prevotella contamination patterns. Site 6RC, located on Six Runs Creek, had the highest overall hog-specific Bacteroides-Prevotella contamination in the Black River watershed. Even though the sampling station is not located immediately downstream from any CAFOs, it drains a watershed containing 153 CAFOs (Mallin et al. 2001). With the exception of July 2009 and May 2010, contamination at site 6RC is higher than either GCO or LCO. Site 6RC contamination levels are also significantly correlated to rain events on the day of sampling (Table 16), as were fecal coliform counts (Mallin et al. 2001). Site COL had the lowest overall levels of hog waste contamination of all the river sites. This result was expected due to COL being located on a relatively un-impacted tributary of the Black River; site COL does not receive any contamination from the main river and the sampling station is not located near any hog CAFOs. Site B210, the furthest downstream site sampled on the Black River, had hog-specific contamination for the months September 2009, January 2010 and March 2010. There are no hog lagoons located near site B210 so it is likely that hog-specific Bacteroides-Prevotella contamination for those months most likely came from further upstream. Because the contamination occurred during the fall and winter months only, this may correspond to the length of survival of Bacteroides-Prevotella in the environment. In colder weather, Bacteroides-Prevotella may be able to remain viable in the river for a longer period of time and thus likely to be found further downstream. Bacteroides-Prevotella fragilis found in human guts showed greater environmental survival rates in winter possibly due to cooler temperatures and decreased predation (Ballesté and Blanch 2010). In addition, Bacteroides-Prevotella levels at all sample sites on the Black River were negatively correlated with increased DO concentrations. Environmental Bacteroides-Prevotella strains have demonstrated higher survival rates in water with low DO concentrations most likely due to their sensitivity to reactive oxygen (Ballesté and Blanch 2010).
5. SUMMARY
Microbial hog waste contamination in the Northeast Cape Fear River watershed seemed to depend primarily on proximity of the sampling site from upstream hog related facilities. Sites furthest away from hog farming activities had the least amount of microbial contamination compared to those directly downstream from a hog facility. On a seasonal basis, all but one site had a peak in hog-specific Bacteroides-Prevotella abundance during May 2010. This is most likely a result from run-off or leaching from seasonal spraying of fields with lagoon waste. Monitoring efforts in this river should focus on sites located near hog CAFOs and processing plants, particularly sites PB and BC117. In comparison to the Northeast Cape Fear River watershed, hog waste contamination in the Black River watershed appears to be more related to number of CAFOs in the individual watersheds as opposed to sampling site proximity to hog CAFOs. Hog-specific Bacteroides-Prevotella abundance was highest at 6RC (153 CAFOs in watershed), followed by GCO (95 CAFOs in watershed) and then LCO (63 CAFOs in watershed). In cooler months, Bacteroides-Prevotella most likely remain viable or detectable for increased amounts of time allowing hog-specific Bacteroides contamination to reach further downstream to location B210. Bacteroides-Prevotella monitoring for this river would be most

38
beneficial at sites located upstream near sites GCO and LCO, and other locations where high densities of CAFOs are located.
6. CONCLUSIONS
T-RFLP fingerprints provide a quick and simplified snapshot of Bacteroides communities present in environmental samples. This technique may be useful to monitor shifts in Bacteroides communities based on seasonal or temporal variation. However, T-RFLP fingerprints are not reliable indicators of hog-specificity. Designated hog-specific peaks did not correlate to Bacteroides contamination measured by Q-PCR. In addition, the purported hog-specific peaks in this study did not correspond to any previous published hog-specific peaks. Q-PCR, on the other hand, is a useful molecular technique to determine hog-specific Bacteroides-Prevotella contamination and the amount of hog-specific Bacteroides-Prevotella 16S rRNA gene copy numbers present in environmental samples. Hog-specific Bacteroides-Prevotella 16S rRNA genes were detected at all sampling sites, with several sites continually testing positive for hog-specific Bacteroides-Prevotella throughout the sampling period of May 2009 – May 2010. The correlations that existed between the measured physical/nutrient parameters and hog-specific Bacteroides-Prevotella 16S rRNA gene copy numbers were site specific. There were no overall trends regarding nutrients/physical factors and levels of lagoon waste contamination, although rainfall was significantly related to microbial hog signals at some locations. These results provide molecular evidence that swine waste is leaving CAFOs and entering public waterways; thus present management techniques are insufficient to keep such waste on-site.
7. RECOMMENDATIONS
Bimonthly monitoring of sites PB and BC117 in the Northeast Cape Fear River for hog-specific Bacteroides-Prevotella should continue due to their close proximity to hog-related activities. Of particular concern is site BC117. Site BC117 was continuously contaminated with hog-specific Bacteroides-Prevotella despite being located far from any hog lagoons or CAFOs. This site may be being contaminated with hog-specific Bacteroides-Prevotella from illegal dumping or sausage factory effluent. In the Black River, bimonthly monitoring or post-rainfall monitoring of upstream sites LCO, GCO and 6RC is recommended. Both the GCO branch and LCO branch of the Black River flow downstream through areas with high concentrations of hog CAFOs. Site 6RC in particular (with 153 CAFOs in its watershed), had consistently higher hog-specific Bacteroides-Prevotella contamination than all other sampling sites.
39
LITERATURE CITED
Allsop, K. and D. J. Stickler. 1985. An assessment of Bacteroides fragilis group organisms as indicators of human faecal pollution. Journal of Applied Bacteriology 58: 95-99.
APHA. 1995. Standard Methods for the Examination of Water and Wastewater, 19th ed. American Public Health Association, Washington, D.C.
Ballesté, E. and A. R. Blanch. 2010. Persistence of Bacteroides species populations in a river measured by molecular and culture techniques. Applied and Environmental Microbiology 76: 7608-7616.
Bernhard A. E., and K. G. Field. 2000a. Identification of nonpoint sources of fecal pollution in coastal waters b using host-specific 16srDNA markers from fecal anaerobes. Applied and Environmental Microbiology 66: 1587-1594
Bernhard A. E., and K. G. Field. 2000b. A PCR assay to discriminate human and ruminant feces on the basis of host differences in Bacteroides-Prevotella gene encoding 16S ribosomal RNA. Applied Environmental Microbiology 66: 4571-4574.
Burkholder, J.M., M.A. Mallin, H.B. Glasgow, Jr., L.M. Larsen, M.R. McIver, G.C. Shank, N. Deamer-Melia, D.S. Briley, J. Springer, B.W. Touchette and E. K. Hannon. 1997. Impacts to a coastal river and estuary from rupture of a swine waste holding lagoon. Journal of Environmental Quality 26:1451-1466.
Cotta, M. A., T. R. Whitehead, and R. L. Zeltwanger. 2003. Isolation, characterization and comparison of bacteria from swine faeces and manure storage pits. Environmental Microbiology 5: 737-754.
Daly K., C. S. Stewart, H. J. Flint, and S. P Shirazi-Beechey. 2001. Bacterial diversity within the equine large intestine as revealed by molecular analysis of cloned 16S rRNA genes. Federation of European Microbiological Societies Microbiology Ecology 38: 141-151.
Desmarais, T. R., H. M. Solo-Gabrield, and C. J. Palmer. 2001. Influence of soil on fecal indicator organisms in a tidally influenced subtropical environment. Applied Microbiology 68: 1165-1172.
Dick, L. K., and K. G. Field. 2004. Rapid estimation of numbers of fecal Bacteroidetes by use of a quantitative PCR assay for 16S rRNA genes. Applied and Environmental Microbiology 70: 5695-5697.
Dick, L. K., A. E. Bernhard, T. J. Brodeur, J. W. Santo Domingo, J. M. Simpson, S. P. Walters, and K. G. Field. 2005. Host distributions of uncultivated fecal Bacteroidales bacteria reveal genetic markers for fecal source identification. Applied and Environmental Microbiology 71: 3184-3191.

40
Environmental Protection Agency (EPA). 1997. Animal waste disposal issues. United States Environmental Protection Agency Office of Inspector General. [Accessed 2011 February]. Available from http://www.epa.gov/oig/reports/1997/hogchp1.
Environmental Protection Agency (EPA). 2003. Bacterial water quality standards for recreational waters (freshwater and marine waters). United States Environmental Protection Agency Office of Water. EPA/823/R-03/008,
Ficksdal L., J. S. Maki, S. J. LaCroix, and J. T. Staley. 1985. Survival and detection of Bacteroides spp., prospective indicator bacteria. Applied and Environmental Microbiology 49: 148-150.
Field K. G., A. E. Bernhard, and T. J. Brodeur. 2003. Molecular approaches to microbiological monitoring: fecal source detection. Environmental Monitoring Assessment 81: 313-326.
Fogarty, L. R. and M. A. Voytek. 2005. Comparison of Bacteroides-Prevotella 16S rRNA genetic markers for fecal samples from different animal species. Applied and Environmental Microbiology 71: 5999-6007.
Hold, G. L., S. E. Pryde, V. J. Russell, E. Furrie, and H. J. Flint. 2002. Assessment of microbial diversity in human colonic samples by 16S rDNA sequence analysis. Federation of European Microbiological Societies Microbiology Ecology 39: 33-39.
Kim, J. B., M. S. Moon, D. H. Lee, S. T. Lee, M. Bazzicalupo, and C. K. Kim. 2004. Comparative analysis of cyanobacterial communities from polluted reservoirs in Korea. Journal of Microbiology 42: 181-187
Kreader, C. A. 1995. Design and evaluation of Bacteroides DNA probes for the specific detection of human fecal pollution. Applied and Environmental Microbiology 61: 1171-1179.
Leser, T. D., J. A. Amenuvor, T. K. Jensen, R. H. Lindecrona, M. Boye, and K. Moller. 2002. Culture-independent analysis of gut bacteria: the pig gastrointestinal tract microbiota revisited. Applied and Environmental Microbiology 68: 673-690.
Liu, R., M. H. Y. Chiang, C. H. I. Lun, P. Qian, and S. C. K. Lau. 2010. Host-specific 16S rRNA gene markers of Bacteroidales for source tracking of fecal pollution in the subtropical coastal seawater of Hong Kong. Water Research 44: 6164-6174.
Mallin, M. A. 2000. Impacts of industrial animal production on rivers and estuaries. 2000. American Scientist 88: 2-13.
Mallin, M. A., J. M. Burkholder, M. R. McIver, G. C. Shank, H. B. Glasgow, B. W. Touchette, and J. Springer. 1997. Comparative effects of poultry and swine waste lagoon spills on the quality of receiving streamwaters. Environmental Quality 26: 1622-1631.
Mallin, M.A., S.H. Ensign, M.R. McIver, G.C. Shank and P.K. Fowler. 2001. Demographic, landscape, and meteorological factors controlling the microbial pollution of coastal waters. Hydrobiologia 460:185-193.
41
Mallin, M. A. and L. B. Cahoon. 2003. Industrialized animal production – a major source of nutrient and microbial pollution to aquatic ecosystems. Population and Environment 24: 369-385.
Mallin, M.A., M.R. McIver, S.H. Ensign and L.B. Cahoon. 2004. Photosynthetic and heterotrophic impacts of nutrient loading to blackwater streams. Ecological Applications 14:823-838.
Mallin, M.A., M.R. McIver and J.F. Merritt. 2010. Environmental Assessment of the Lower Cape Fear River System, 2009. CMS Report No. 10-04, Center for Marine Science, University of North Carolina at Wilmington, Wilmington, N.C.
Meays, C. L., K. Broersma, R. Nordin, and A. Mazumder. 2004. Source tracking fecal bacteria in water: a critical review of current methods. Journal of Environmental Management 73: 71-79.
Nnane, D. E., J. E. Edbon, and H. D. Taylow. 2011. Integrated analysis of water quality parameters for cost-effective faecal pollution management in river catchments. Water Research 45: 2235-2246.
Okabe S., N. Okayama, O. Savichtcheva, and T. Ito. 2007. Quantification of host-specific Bacteroides-Prevotella 16S rRNA genetic markers for assessment of fecal pollution in freshwater. Applied Microbial Biotechnology 73: 890-901.
Savichtcheva, O. and S. Okabe. 2009. Qualitative and quantitative estimation of host-specific fecal pollution using Bacteroides-Prevotella 16S rRNA genetic markers by T-RFLP and real-time PCR analyses. Water Science and Technology 59.9: 1831-1840.
Scott T. M., J. B. Rose, T. M. Jenkins, S. R. Farrah, and J. Lukasik. 2002. Microbial source tracking: current methodology and future directions. Applied and Environmental Microbiology 68: 5796-5803.
Servais, P., J. Prats, J. Passerat, and T. Garcia-Armisen. 2009. Abundance of culturable versus viable Escherichia coli in freshwater. Canadian Journal of Microbiology 55: 905-909.
Simpson, J. M., J. W. Santo Domingo, and D. J. Reasoner. 2002. Microbial source tracking: state of the science. Environmental Science and Technology 45: 5279-5288.
Simpson, J. M., J. W. Santo Domingo, and J. W. Reasoner. 2004. Assessment of equine fecal contamination: the search for alternative bacterial source-tracking targets. Federation of European Microbiological Societies Microbiology Ecology 46: 65-75.
Sinclair, A., D. Hebb, R. Jamieson, R. Gordon, K. Benedict, K. Fuller, C. Stratton, and A. Madani. 2009. Growing season surface water loading of faecal indicator organisms within a rural watershed. Water Research 43: 1199-1206.
Tannok, G. W. 1997. Modification of the normal microbiota by diet, stress, antimicrobial agents, and probiotics. Pages 434-465 in R. J. Mackie and B. A. White (editors) Gastrointestinal microbiology, vol. 2: gastrointestinal microbes and host interactions. Academic Press, New York, NY.

42
Toranzos, G. A., and G. A. McFeters. 1997. Detection of indicator microorganisms in environmental freshwaters and drinking waters. Pages 184-194 in Walter (editor), Manual of Environmental Microbiology. American Society for Microbiology, Washington, D.C.
USNASS. 2007. US National Agricultural Statistics Service census data for 2007. [Accessed 2011 February]. Available at www.nass.usda.gov/Publications/2007/Full_Report.

43
APPENDIX I – Acronyms used in this report
6RC Six Runs Creek (sampling location)
B210 Black River at Highway 210 (sampling location)
BC117 Burgaw Creek at Highway 117 (sampling location)
BOD Biochemical Oxygen Demand
BP Base Pairs
CAFO Concentrated Animal Feeding Operation
CFU Colony Forming Unit
COL Colly Creek (sampling location)
DO Dissolved Oxygen
GCO Great Coharie Creek (sampling location)
GS Goshen Swamp (sampling location)
LCFRP Lower Cape Fear River Program
LCO Little Coharie Creek (sampling location)
MDS Multidimensional Scaling
PCR Polymerase Chain Reaction
PB Panther Branch (sampling location)
rDNA Ribosomal Deoxyribonucleic Acid
rRNA Ribosomal Ribonucleic Acid
SAR Sarecta (sampling location in Northeast Cape Fear River)
T-RF Terminal Restriction Fragment
T-RFLP Terminal Restriction Length Polymorphism
TSS Total Suspended Solids
Q-PCR Quantitative Polymerase Chain Reaction