Embed Size (px)
Citation preview
Surveillance Summaries October 6, 2006 / Vol. 55 / No. SS-9
depardepardepardepardepartment of health and human sertment of health and human sertment of health and human sertment of health and human sertment of health and human servicesvicesvicesvicesvicesCenters for Disease Control and PreventionCenters for Disease Control and PreventionCenters for Disease Control and PreventionCenters for Disease Control and PreventionCenters for Disease Control and Prevention
Morbidity and Mortality Weekly Report
Monitoring Progress TowardAchieving Maternal and Infant
Healthy People 2010 Objectives —19 States, Pregnancy Risk Assessment
Monitoring System (PRAMS), 2000–2003
MMWR
CONTENTS
Introduction......................................................................... 2
Methods .............................................................................. 3
Results ................................................................................. 5
Discussion ........................................................................... 8
Conclusions ....................................................................... 10
References......................................................................... 10
The MMWR series of publications is published by the CoordinatingCenter for Health Information and Service, Centers for DiseaseControl and Prevention (CDC), U.S. Department of Health andHuman Services, Atlanta, GA 30333.
Suggested Citation: Centers for Disease Control and Prevention.[Title]. Surveillance Summaries, [Date]. MMWR 2006;55(No. SS-#).
Editorial BoardWilliam L. Roper, MD, MPH, Chapel Hill, NC, Chairman
Virginia A. Caine, MD, Indianapolis, INDavid W. Fleming, MD, Seattle, WA
William E. Halperin, MD, DrPH, MPH, Newark, NJMargaret A. Hamburg, MD, Washington, DC
King K. Holmes, MD, PhD, Seattle, WADeborah Holtzman, PhD, Atlanta, GA
John K. Iglehart, Bethesda, MDDennis G. Maki, MD, Madison, WI
Sue Mallonee, MPH, Oklahoma City, OKStanley A. Plotkin, MD, Doylestown, PA
Patricia Quinlisk, MD, MPH, Des Moines, IAPatrick L. Remington, MD, MPH, Madison, WI
Barbara K. Rimer, DrPH, Chapel Hill, NCJohn V. Rullan, MD, MPH, San Juan, PR
Anne Schuchat, MD, Atlanta, GADixie E. Snider, MD, MPH, Atlanta, GA
John W. Ward, MD, Atlanta, GA
Centers for Disease Control and PreventionJulie L. Gerberding, MD, MPH
Director
Tanja Popovic, MD, PhD(Acting) Chief Science Officer
James W. Stephens, PhD(Acting) Associate Director for Science
Steven L. Solomon, MDDirector, Coordinating Center for Health Information and Service
Jay M. Bernhardt, PhD, MPHDirector, National Center for Health Marketing
Judith R. Aguilar(Acting) Director, Division of Health Information Dissemination (Proposed)
Editorial and Production StaffEric E. Mast, MD
(Acting) Editor, MMWR Series
Suzanne M. Hewitt, MPAManaging Editor, MMWR Series
Teresa F. RutledgeLead Technical Writer-Editor
Jeffrey D. Sokolow, MAProject Editor
Beverly J. HollandLead Visual Information Specialist
Lynda G. CupellMalbea A. LaPete
Visual Information Specialists
Quang M. Doan, MBAErica R. Shaver
Information Technology Specialists
Vol. 55 / SS-9 Surveillance Summaries 1
Corresponding address: Division of Reproductive Health, National Centerfor Chronic Disease Prevention and Health Promotion, CDC, 4770 BufordHighway, N.E., MS K-22, Atlanta, GA 30341. Telephone: 770-488-6260;Fax: 770-488-6291; E-mail: [email protected].
Monitoring Progress Toward Achieving Maternal and InfantHealthy People 2010 Objectives — 19 States, Pregnancy Risk
Assessment Monitoring System (PRAMS), 2000–2003Katherine Suellentrop, MPH1
Brian Morrow, MA1
Letitia Williams, MPH2
Denise D’Angelo, MPH2
1Division of Reproductive Health, National Center for Chronic Disease Prevention and Health Promotion, CDC2Science Applications International Corporation (SAIC)
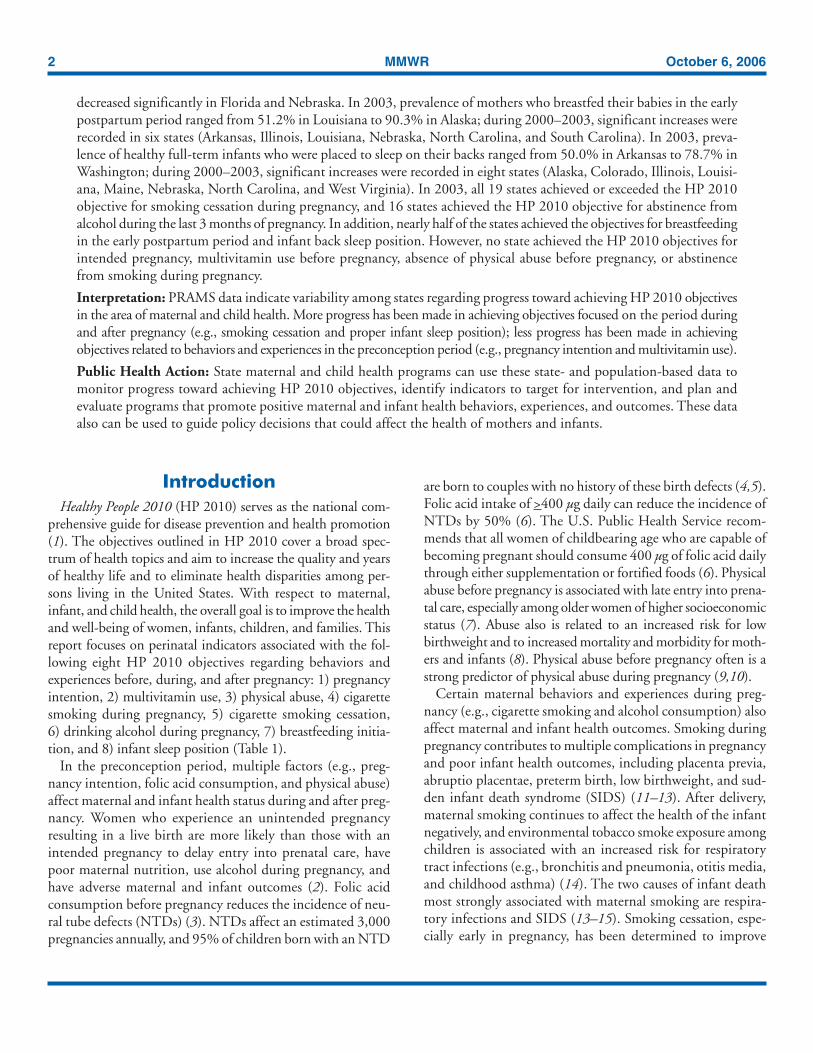
Abstract
Problem/Condition: Certain modifiable maternal behaviors and experiences before, during, and after pregnancy areassociated with adverse health outcomes for the mother and her infant (e.g., physical abuse, insufficient folic acidconsumption, smoking during pregnancy, and improper infant sleep position). Information about these behaviors andexperiences is needed to monitor trends in maternal and infant health, enhance understanding of the relation betweenmaternal behaviors and infant health outcomes, plan and evaluate maternal and infant health programs, direct policydecisions, and monitor progress toward achieving the national Healthy People 2010 [HP 2010] objectives (US Depart-ment of Health and Human Services. Healthy people 2010. 2nd ed. With understanding and improving health and objectivesfor improving health [2 vols.]. Washington, DC: US Department of Health and Human Services; 2000).
Reporting Period Covered: 2000–2003.
Description of System: The Pregnancy Risk Assessment Monitoring System (PRAMS) is an ongoing, state- andpopulation-based surveillance system designed to monitor selected maternal behaviors and experiences that occurbefore, during, and after pregnancy among women who deliver live-born infants. PRAMS employs a mixed mode data-collection methodology; up to three self-administered surveys are mailed to a sample of mothers; nonresponders arefollowed up with telephone interviews. Self-reported survey data are linked to selected birth certificate data and weightedfor sample design, nonresponse, and noncoverage to create annual PRAMS analysis data sets that can be used toproduce statewide estimates of perinatal health behaviors and experiences among women delivering live infants. Thisreport summarizes data for 2000–2003 from 19 states (Alabama, Alaska, Arkansas, Colorado, Florida, Hawaii, Illinois,Louisiana, Maine, Nebraska, New Mexico, New York, North Carolina, Ohio, Oklahoma, South Carolina, Utah, Wash-ington, and West Virginia) that measured progress toward achieving HP 2010 objectives for eight perinatal indicators:1) pregnancy intention, 2) multivitamin use, 3) physical abuse, 4) cigarette smoking during pregnancy, 5) cigarettesmoking cessation, 6) drinking alcohol during pregnancy, 7) breastfeeding initiation, and 8) infant sleep position.
Results: In 2003, prevalence of intended pregnancy among women having a live birth ranged from 48.1% in Louisianato 66.5% in Maine; during 2000–2003, no state experienced a statistically significant (p<0.05) increase in prevalenceof intended pregnancy, and one state experienced a significant decrease. In 2003, prevalence of multivitamin useat least four times per week during the month before pregnancy ranged from 23.0% in Arkansas to 45.2% in Maine;during 2000–2003, multivitamin use increased significantly in three states (Illinois, North Carolina, and Utah). In2003, prevalence of physical abuse by a husband or partner during the 12 months before pregnancy ranged from 2.2%in Maine to 7.6% in New Mexico; during 2000–2003, significant decreases were recorded in three states (Alaska,Hawaii, and Nebraska). In 2003, prevalence of abstinence from cigarette smoking during the last 3 months of preg-nancy ranged from 72.5% in West Virginia to 96.1% in Utah; during 2000–2003, a significant increase was recorded inUtah. In 2003, prevalence of smoking cessation during pregnancy ranged from 30.2% in West Virginia to 65.8% in
Utah; during 2000–2003, a significant increase was recordedin Utah. In 2003, prevalence of abstinence from alcoholduring the last 3 months of pregnancy ranged from 91.3%in Colorado to 98.0% in Utah; during 2000–2003, absti-nence increased significantly in Louisiana and Utah but
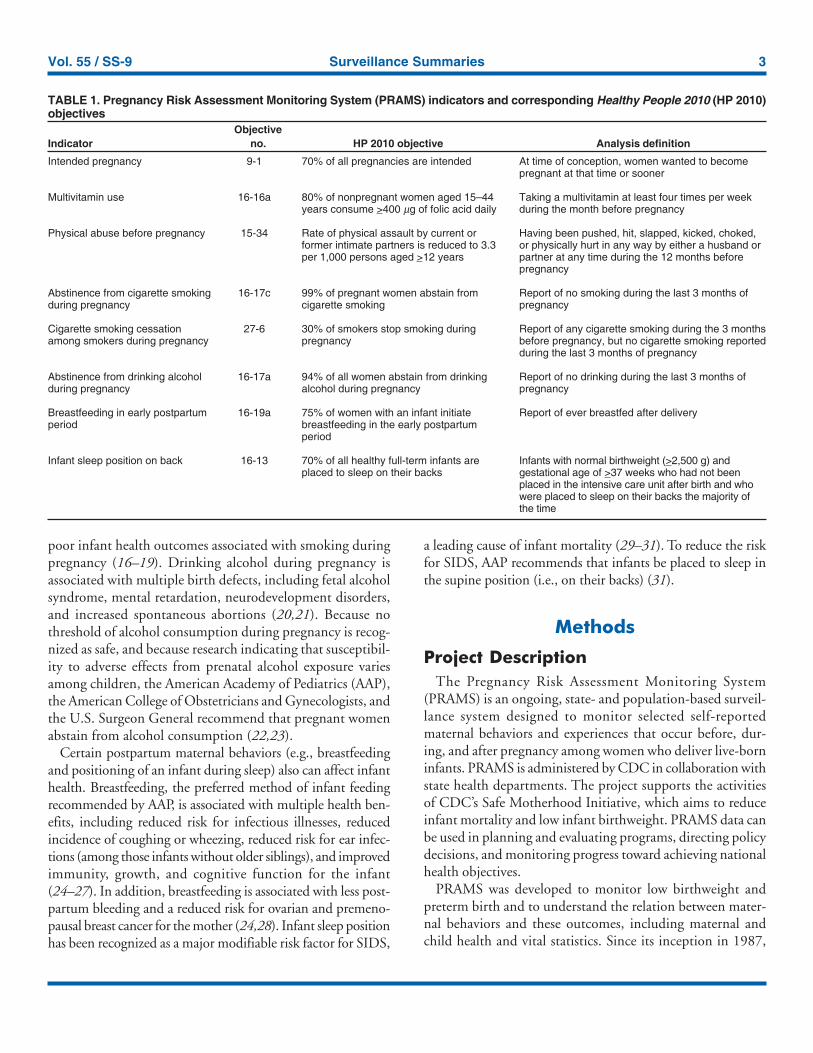
2 MMWR October 6, 2006
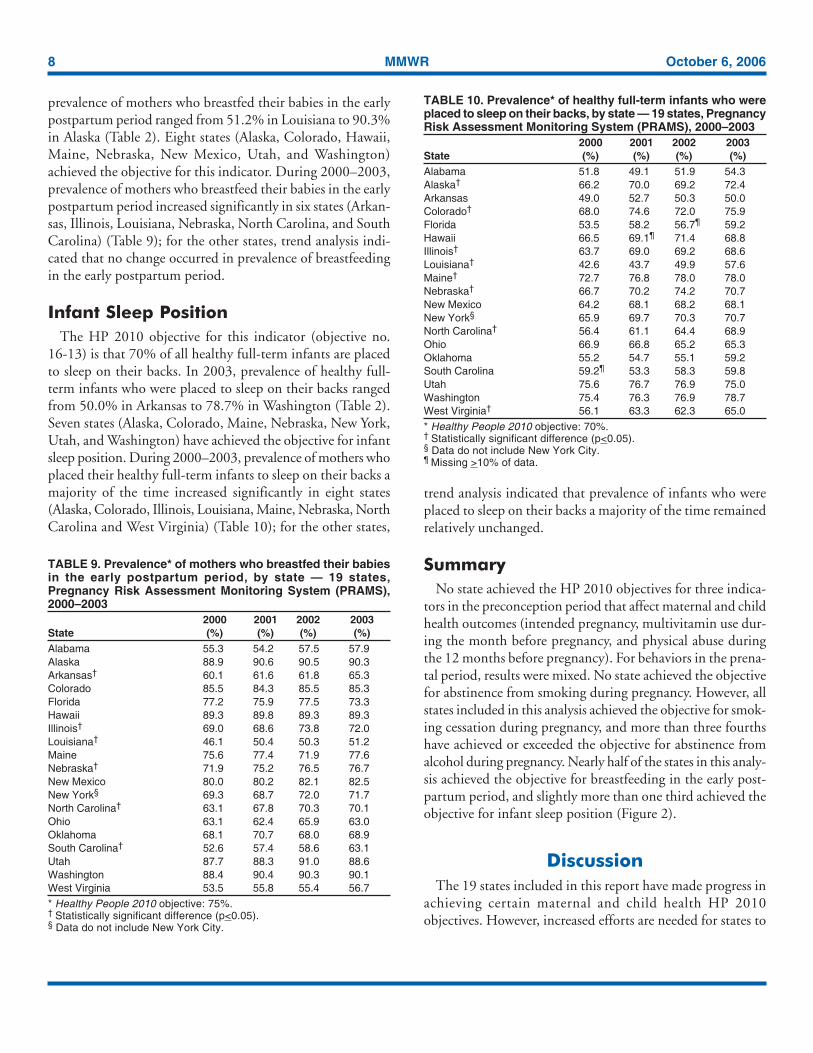
decreased significantly in Florida and Nebraska. In 2003, prevalence of mothers who breastfed their babies in the earlypostpartum period ranged from 51.2% in Louisiana to 90.3% in Alaska; during 2000–2003, significant increases wererecorded in six states (Arkansas, Illinois, Louisiana, Nebraska, North Carolina, and South Carolina). In 2003, preva-lence of healthy full-term infants who were placed to sleep on their backs ranged from 50.0% in Arkansas to 78.7% inWashington; during 2000–2003, significant increases were recorded in eight states (Alaska, Colorado, Illinois, Louisi-ana, Maine, Nebraska, North Carolina, and West Virginia). In 2003, all 19 states achieved or exceeded the HP 2010objective for smoking cessation during pregnancy, and 16 states achieved the HP 2010 objective for abstinence fromalcohol during the last 3 months of pregnancy. In addition, nearly half of the states achieved the objectives for breastfeedingin the early postpartum period and infant back sleep position. However, no state achieved the HP 2010 objectives forintended pregnancy, multivitamin use before pregnancy, absence of physical abuse before pregnancy, or abstinencefrom smoking during pregnancy.
Interpretation: PRAMS data indicate variability among states regarding progress toward achieving HP 2010 objectivesin the area of maternal and child health. More progress has been made in achieving objectives focused on the period duringand after pregnancy (e.g., smoking cessation and proper infant sleep position); less progress has been made in achievingobjectives related to behaviors and experiences in the preconception period (e.g., pregnancy intention and multivitamin use).
Public Health Action: State maternal and child health programs can use these state- and population-based data tomonitor progress toward achieving HP 2010 objectives, identify indicators to target for intervention, and plan andevaluate programs that promote positive maternal and infant health behaviors, experiences, and outcomes. These dataalso can be used to guide policy decisions that could affect the health of mothers and infants.
IntroductionHealthy People 2010 (HP 2010) serves as the national com-
prehensive guide for disease prevention and health promotion(1). The objectives outlined in HP 2010 cover a broad spec-trum of health topics and aim to increase the quality and yearsof healthy life and to eliminate health disparities among per-sons living in the United States. With respect to maternal,infant, and child health, the overall goal is to improve the healthand well-being of women, infants, children, and families. Thisreport focuses on perinatal indicators associated with the fol-lowing eight HP 2010 objectives regarding behaviors andexperiences before, during, and after pregnancy: 1) pregnancyintention, 2) multivitamin use, 3) physical abuse, 4) cigarettesmoking during pregnancy, 5) cigarette smoking cessation,6) drinking alcohol during pregnancy, 7) breastfeeding initia-tion, and 8) infant sleep position (Table 1).
In the preconception period, multiple factors (e.g., preg-nancy intention, folic acid consumption, and physical abuse)affect maternal and infant health status during and after preg-nancy. Women who experience an unintended pregnancyresulting in a live birth are more likely than those with anintended pregnancy to delay entry into prenatal care, havepoor maternal nutrition, use alcohol during pregnancy, andhave adverse maternal and infant outcomes (2). Folic acidconsumption before pregnancy reduces the incidence of neu-ral tube defects (NTDs) (3). NTDs affect an estimated 3,000pregnancies annually, and 95% of children born with an NTD
are born to couples with no history of these birth defects (4,5).Folic acid intake of >400 µg daily can reduce the incidence ofNTDs by 50% (6). The U.S. Public Health Service recom-mends that all women of childbearing age who are capable ofbecoming pregnant should consume 400 µg of folic acid dailythrough either supplementation or fortified foods (6). Physicalabuse before pregnancy is associated with late entry into prena-tal care, especially among older women of higher socioeconomicstatus (7). Abuse also is related to an increased risk for lowbirthweight and to increased mortality and morbidity for moth-ers and infants (8). Physical abuse before pregnancy often is astrong predictor of physical abuse during pregnancy (9,10).
Certain maternal behaviors and experiences during preg-nancy (e.g., cigarette smoking and alcohol consumption) alsoaffect maternal and infant health outcomes. Smoking duringpregnancy contributes to multiple complications in pregnancyand poor infant health outcomes, including placenta previa,abruptio placentae, preterm birth, low birthweight, and sud-den infant death syndrome (SIDS) (11–13). After delivery,maternal smoking continues to affect the health of the infantnegatively, and environmental tobacco smoke exposure amongchildren is associated with an increased risk for respiratorytract infections (e.g., bronchitis and pneumonia, otitis media,and childhood asthma) (14). The two causes of infant deathmost strongly associated with maternal smoking are respira-tory infections and SIDS (13–15). Smoking cessation, espe-cially early in pregnancy, has been determined to improve
Vol. 55 / SS-9 Surveillance Summaries 3
poor infant health outcomes associated with smoking duringpregnancy (16–19). Drinking alcohol during pregnancy isassociated with multiple birth defects, including fetal alcoholsyndrome, mental retardation, neurodevelopment disorders,and increased spontaneous abortions (20,21). Because nothreshold of alcohol consumption during pregnancy is recog-nized as safe, and because research indicating that susceptibil-ity to adverse effects from prenatal alcohol exposure variesamong children, the American Academy of Pediatrics (AAP),the American College of Obstetricians and Gynecologists, andthe U.S. Surgeon General recommend that pregnant womenabstain from alcohol consumption (22,23).
Certain postpartum maternal behaviors (e.g., breastfeedingand positioning of an infant during sleep) also can affect infanthealth. Breastfeeding, the preferred method of infant feedingrecommended by AAP, is associated with multiple health ben-efits, including reduced risk for infectious illnesses, reducedincidence of coughing or wheezing, reduced risk for ear infec-tions (among those infants without older siblings), and improvedimmunity, growth, and cognitive function for the infant(24–27). In addition, breastfeeding is associated with less post-partum bleeding and a reduced risk for ovarian and premeno-pausal breast cancer for the mother (24,28). Infant sleep positionhas been recognized as a major modifiable risk factor for SIDS,
a leading cause of infant mortality (29–31). To reduce the riskfor SIDS, AAP recommends that infants be placed to sleep inthe supine position (i.e., on their backs) (31).
Methods
Project DescriptionThe Pregnancy Risk Assessment Monitoring System
(PRAMS) is an ongoing, state- and population-based surveil-lance system designed to monitor selected self-reportedmaternal behaviors and experiences that occur before, dur-ing, and after pregnancy among women who deliver live-borninfants. PRAMS is administered by CDC in collaboration withstate health departments. The project supports the activitiesof CDC’s Safe Motherhood Initiative, which aims to reduceinfant mortality and low infant birthweight. PRAMS data canbe used in planning and evaluating programs, directing policydecisions, and monitoring progress toward achieving nationalhealth objectives.
PRAMS was developed to monitor low birthweight andpreterm birth and to understand the relation between mater-nal behaviors and these outcomes, including maternal andchild health and vital statistics. Since its inception in 1987,
TABLE 1. Pregnancy Risk Assessment Monitoring System (PRAMS) indicators and corresponding Healthy People 2010 (HP 2010)objectives
ObjectiveIndicator no. HP 2010 objective Analysis definition
9-1
16-16a
15-34
16-17c
27-6
16-17a
16-19a
16-13
70% of all pregnancies are intended
80% of nonpregnant women aged 15–44years consume >400 µg of folic acid daily
Rate of physical assault by current orformer intimate partners is reduced to 3.3per 1,000 persons aged >12 years
99% of pregnant women abstain fromcigarette smoking
30% of smokers stop smoking duringpregnancy
94% of all women abstain from drinkingalcohol during pregnancy
75% of women with an infant initiatebreastfeeding in the early postpartumperiod
70% of all healthy full-term infants areplaced to sleep on their backs
At time of conception, women wanted to becomepregnant at that time or sooner
Taking a multivitamin at least four times per weekduring the month before pregnancy
Having been pushed, hit, slapped, kicked, choked,or physically hurt in any way by either a husband orpartner at any time during the 12 months beforepregnancy
Report of no smoking during the last 3 months ofpregnancy
Report of any cigarette smoking during the 3 monthsbefore pregnancy, but no cigarette smoking reportedduring the last 3 months of pregnancy
Report of no drinking during the last 3 months ofpregnancy
Report of ever breastfed after delivery
Infants with normal birthweight (>2,500 g) andgestational age of >37 weeks who had not beenplaced in the intensive care unit after birth and whowere placed to sleep on their backs the majority ofthe time
Intended pregnancy
Multivitamin use
Physical abuse before pregnancy
Abstinence from cigarette smokingduring pregnancy
Cigarette smoking cessationamong smokers during pregnancy
Abstinence from drinking alcoholduring pregnancy
Breastfeeding in early postpartumperiod
Infant sleep position on back
4 MMWR October 6, 2006
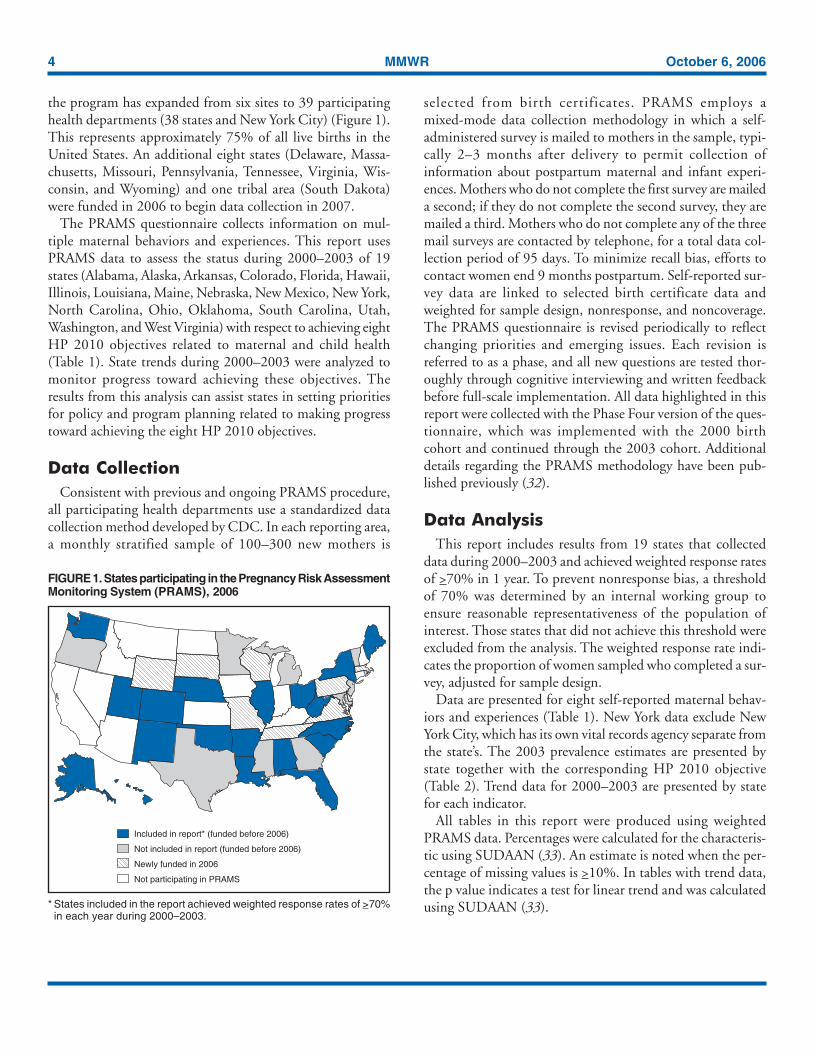
the program has expanded from six sites to 39 participatinghealth departments (38 states and New York City) (Figure 1).This represents approximately 75% of all live births in theUnited States. An additional eight states (Delaware, Massa-chusetts, Missouri, Pennsylvania, Tennessee, Virginia, Wis-consin, and Wyoming) and one tribal area (South Dakota)were funded in 2006 to begin data collection in 2007.
The PRAMS questionnaire collects information on mul-tiple maternal behaviors and experiences. This report usesPRAMS data to assess the status during 2000–2003 of 19states (Alabama, Alaska, Arkansas, Colorado, Florida, Hawaii,Illinois, Louisiana, Maine, Nebraska, New Mexico, New York,North Carolina, Ohio, Oklahoma, South Carolina, Utah,Washington, and West Virginia) with respect to achieving eightHP 2010 objectives related to maternal and child health(Table 1). State trends during 2000–2003 were analyzed tomonitor progress toward achieving these objectives. Theresults from this analysis can assist states in setting prioritiesfor policy and program planning related to making progresstoward achieving the eight HP 2010 objectives.
Data CollectionConsistent with previous and ongoing PRAMS procedure,
all participating health departments use a standardized datacollection method developed by CDC. In each reporting area,a monthly stratified sample of 100–300 new mothers is
selected from birth certificates. PRAMS employs amixed-mode data collection methodology in which a self-administered survey is mailed to mothers in the sample, typi-cally 2–3 months after delivery to permit collection ofinformation about postpartum maternal and infant experi-ences. Mothers who do not complete the first survey are maileda second; if they do not complete the second survey, they aremailed a third. Mothers who do not complete any of the threemail surveys are contacted by telephone, for a total data col-lection period of 95 days. To minimize recall bias, efforts tocontact women end 9 months postpartum. Self-reported sur-vey data are linked to selected birth certificate data andweighted for sample design, nonresponse, and noncoverage.The PRAMS questionnaire is revised periodically to reflectchanging priorities and emerging issues. Each revision isreferred to as a phase, and all new questions are tested thor-oughly through cognitive interviewing and written feedbackbefore full-scale implementation. All data highlighted in thisreport were collected with the Phase Four version of the ques-tionnaire, which was implemented with the 2000 birthcohort and continued through the 2003 cohort. Additionaldetails regarding the PRAMS methodology have been pub-lished previously (32).
Data AnalysisThis report includes results from 19 states that collected
data during 2000–2003 and achieved weighted response ratesof >70% in 1 year. To prevent nonresponse bias, a thresholdof 70% was determined by an internal working group toensure reasonable representativeness of the population ofinterest. Those states that did not achieve this threshold wereexcluded from the analysis. The weighted response rate indi-cates the proportion of women sampled who completed a sur-vey, adjusted for sample design.
Data are presented for eight self-reported maternal behav-iors and experiences (Table 1). New York data exclude NewYork City, which has its own vital records agency separate fromthe state’s. The 2003 prevalence estimates are presented bystate together with the corresponding HP 2010 objective(Table 2). Trend data for 2000–2003 are presented by statefor each indicator.
All tables in this report were produced using weightedPRAMS data. Percentages were calculated for the characteris-tic using SUDAAN (33). An estimate is noted when the per-centage of missing values is >10%. In tables with trend data,the p value indicates a test for linear trend and was calculatedusing SUDAAN (33).
FIGURE 1. States participating in the Pregnancy Risk AssessmentMonitoring System (PRAMS), 2006
* States included in the report achieved weighted response rates of >70%in each year during 2000–2003.
Included in report* (funded before 2006)
Not included in report (funded before 2006)
Newly funded in 2006
Not participating in PRAMS
Vol. 55 / SS-9 Surveillance Summaries 5
Results
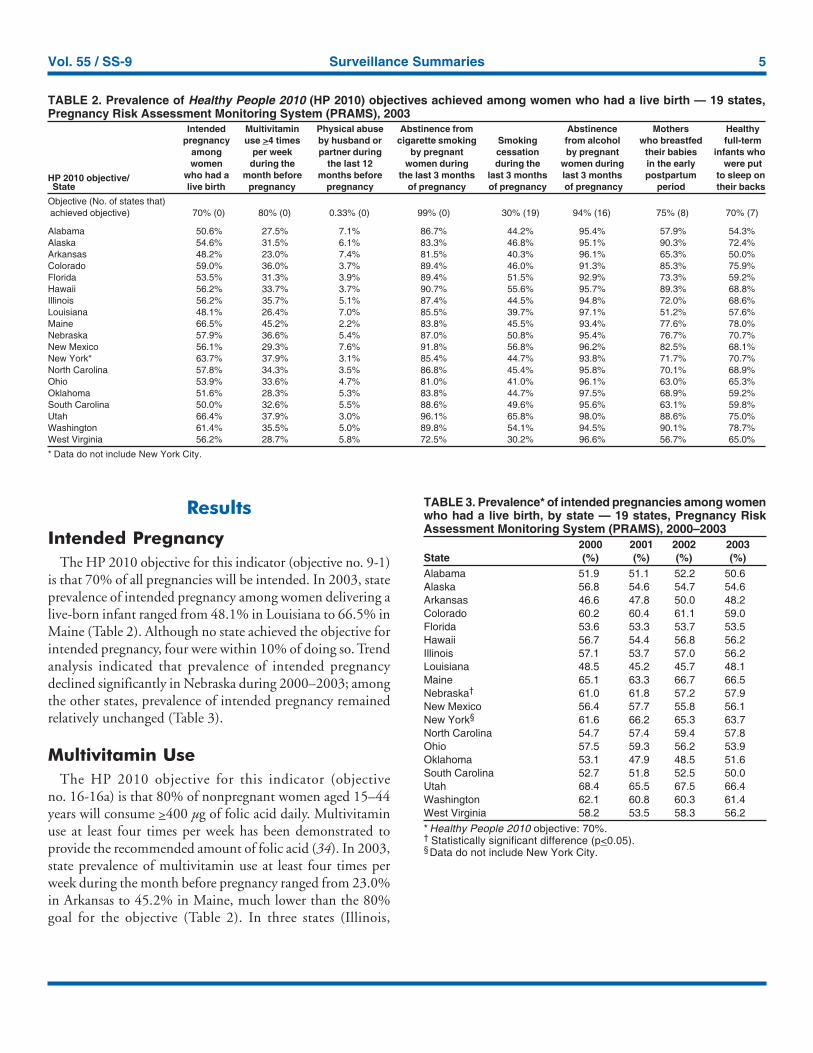
Intended PregnancyThe HP 2010 objective for this indicator (objective no. 9-1)
is that 70% of all pregnancies will be intended. In 2003, stateprevalence of intended pregnancy among women delivering alive-born infant ranged from 48.1% in Louisiana to 66.5% inMaine (Table 2). Although no state achieved the objective forintended pregnancy, four were within 10% of doing so. Trendanalysis indicated that prevalence of intended pregnancydeclined significantly in Nebraska during 2000–2003; amongthe other states, prevalence of intended pregnancy remainedrelatively unchanged (Table 3).
Multivitamin UseThe HP 2010 objective for this indicator (objective
no. 16-16a) is that 80% of nonpregnant women aged 15–44years will consume >400 µg of folic acid daily. Multivitaminuse at least four times per week has been demonstrated toprovide the recommended amount of folic acid (34). In 2003,state prevalence of multivitamin use at least four times perweek during the month before pregnancy ranged from 23.0%in Arkansas to 45.2% in Maine, much lower than the 80%goal for the objective (Table 2). In three states (Illinois,
TABLE 3. Prevalence* of intended pregnancies among womenwho had a live birth, by state — 19 states, Pregnancy RiskAssessment Monitoring System (PRAMS), 2000–2003
2000 2001 2002 2003State (%) (%) (%) (%)Alabama 51.9 51.1 52.2 50.6Alaska 56.8 54.6 54.7 54.6Arkansas 46.6 47.8 50.0 48.2Colorado 60.2 60.4 61.1 59.0Florida 53.6 53.3 53.7 53.5Hawaii 56.7 54.4 56.8 56.2Illinois 57.1 53.7 57.0 56.2Louisiana 48.5 45.2 45.7 48.1Maine 65.1 63.3 66.7 66.5Nebraska† 61.0 61.8 57.2 57.9New Mexico 56.4 57.7 55.8 56.1New York§ 61.6 66.2 65.3 63.7North Carolina 54.7 57.4 59.4 57.8Ohio 57.5 59.3 56.2 53.9Oklahoma 53.1 47.9 48.5 51.6South Carolina 52.7 51.8 52.5 50.0Utah 68.4 65.5 67.5 66.4Washington 62.1 60.8 60.3 61.4West Virginia 58.2 53.5 58.3 56.2* Healthy People 2010 objective: 70%.† Statistically significant difference (p<0.05).§Data do not include New York City.
TABLE 2. Prevalence of Healthy People 2010 (HP 2010) objectives achieved among women who had a live birth — 19 states,Pregnancy Risk Assessment Monitoring System (PRAMS), 2003
Intended Multivitamin Physical abuse Abstinence from Abstinence Mothers Healthypregnancy use >4 times by husband or cigarette smoking Smoking from alcohol who breastfed full-term
among per week partner during by pregnant cessation by pregnant their babies infants whowomen during the the last 12 women during during the women during in the early were put
HP 2010 objective/ who had a month before months before the last 3 months last 3 months last 3 months postpartum to sleep onState live birth pregnancy pregnancy of pregnancy of pregnancy of pregnancy period their backs
Objective (No. of states that)achieved objective) 70% (0) 80% (0) 0.33% (0) 99% (0) 30% (19) 94% (16) 75% (8) 70% (7)
Alabama 50.6% 27.5% 7.1% 86.7% 44.2% 95.4% 57.9% 54.3%Alaska 54.6% 31.5% 6.1% 83.3% 46.8% 95.1% 90.3% 72.4%Arkansas 48.2% 23.0% 7.4% 81.5% 40.3% 96.1% 65.3% 50.0%Colorado 59.0% 36.0% 3.7% 89.4% 46.0% 91.3% 85.3% 75.9%Florida 53.5% 31.3% 3.9% 89.4% 51.5% 92.9% 73.3% 59.2%Hawaii 56.2% 33.7% 3.7% 90.7% 55.6% 95.7% 89.3% 68.8%Illinois 56.2% 35.7% 5.1% 87.4% 44.5% 94.8% 72.0% 68.6%Louisiana 48.1% 26.4% 7.0% 85.5% 39.7% 97.1% 51.2% 57.6%Maine 66.5% 45.2% 2.2% 83.8% 45.5% 93.4% 77.6% 78.0%Nebraska 57.9% 36.6% 5.4% 87.0% 50.8% 95.4% 76.7% 70.7%New Mexico 56.1% 29.3% 7.6% 91.8% 56.8% 96.2% 82.5% 68.1%New York* 63.7% 37.9% 3.1% 85.4% 44.7% 93.8% 71.7% 70.7%North Carolina 57.8% 34.3% 3.5% 86.8% 45.4% 95.8% 70.1% 68.9%Ohio 53.9% 33.6% 4.7% 81.0% 41.0% 96.1% 63.0% 65.3%Oklahoma 51.6% 28.3% 5.3% 83.8% 44.7% 97.5% 68.9% 59.2%South Carolina 50.0% 32.6% 5.5% 88.6% 49.6% 95.6% 63.1% 59.8%Utah 66.4% 37.9% 3.0% 96.1% 65.8% 98.0% 88.6% 75.0%Washington 61.4% 35.5% 5.0% 89.8% 54.1% 94.5% 90.1% 78.7%West Virginia 56.2% 28.7% 5.8% 72.5% 30.2% 96.6% 56.7% 65.0%
* Data do not include New York City.
6 MMWR October 6, 2006
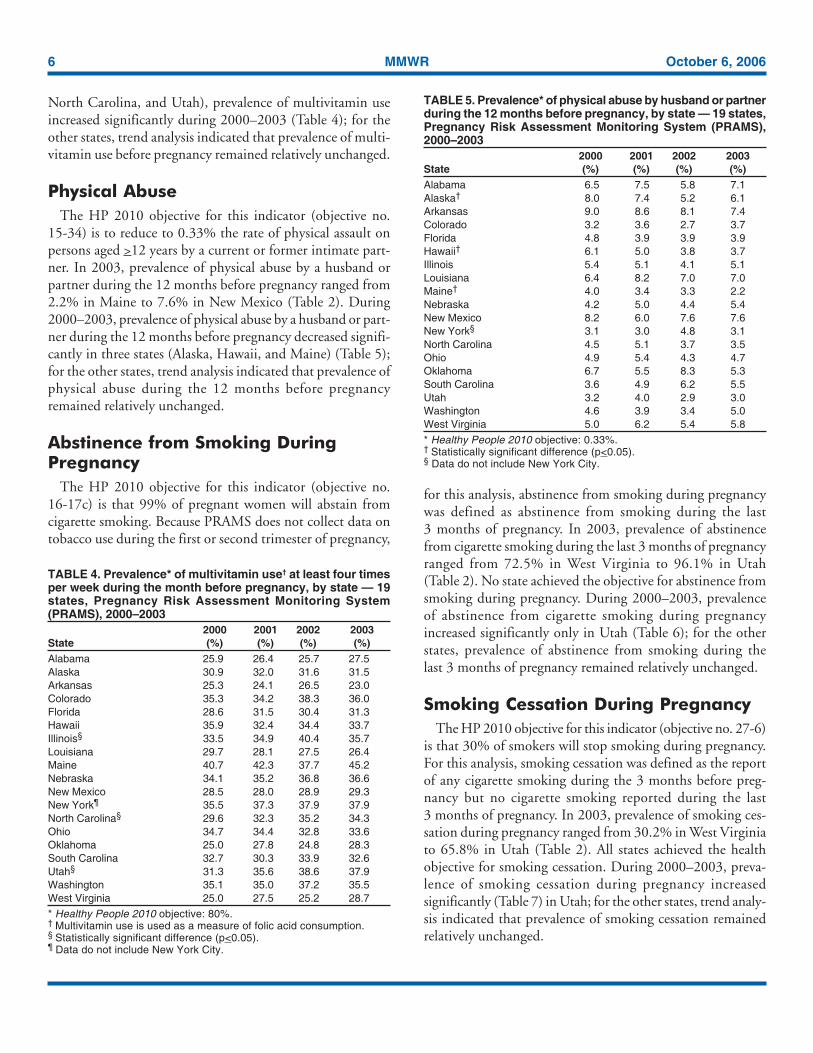
North Carolina, and Utah), prevalence of multivitamin useincreased significantly during 2000–2003 (Table 4); for theother states, trend analysis indicated that prevalence of multi-vitamin use before pregnancy remained relatively unchanged.
Physical AbuseThe HP 2010 objective for this indicator (objective no.
15-34) is to reduce to 0.33% the rate of physical assault onpersons aged >12 years by a current or former intimate part-ner. In 2003, prevalence of physical abuse by a husband orpartner during the 12 months before pregnancy ranged from2.2% in Maine to 7.6% in New Mexico (Table 2). During2000–2003, prevalence of physical abuse by a husband or part-ner during the 12 months before pregnancy decreased signifi-cantly in three states (Alaska, Hawaii, and Maine) (Table 5);for the other states, trend analysis indicated that prevalence ofphysical abuse during the 12 months before pregnancyremained relatively unchanged.
Abstinence from Smoking DuringPregnancy
The HP 2010 objective for this indicator (objective no.16-17c) is that 99% of pregnant women will abstain fromcigarette smoking. Because PRAMS does not collect data ontobacco use during the first or second trimester of pregnancy,
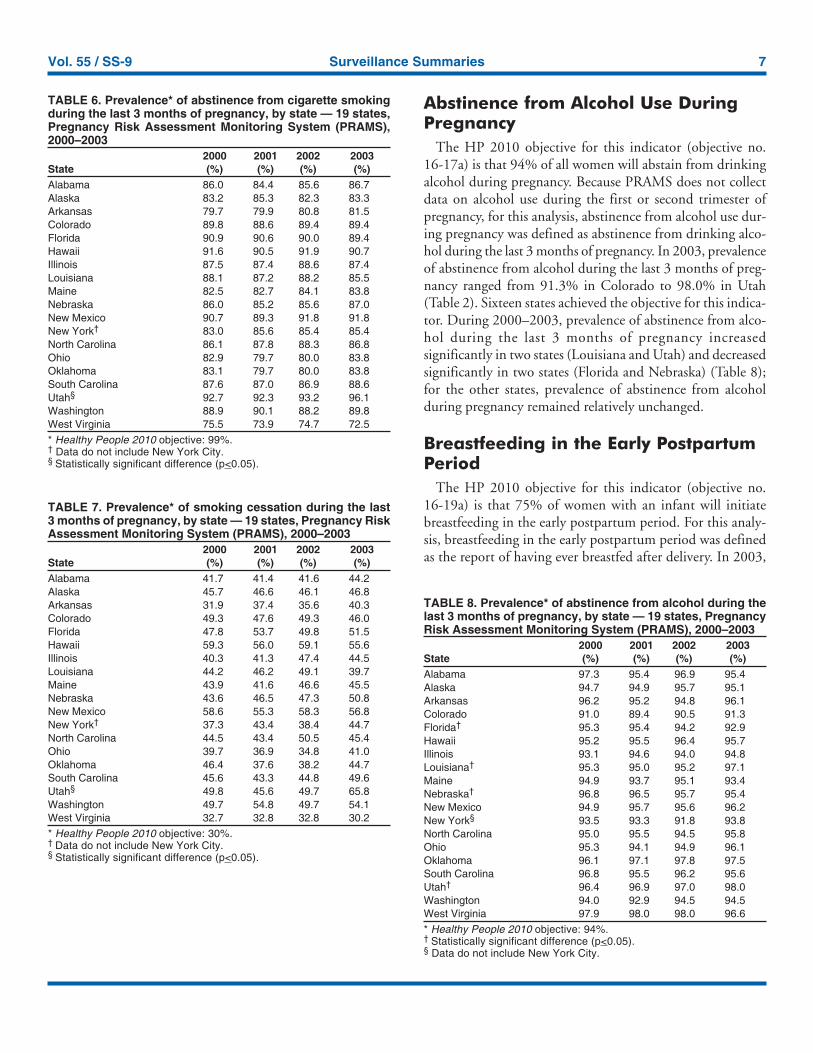
for this analysis, abstinence from smoking during pregnancywas defined as abstinence from smoking during the last3 months of pregnancy. In 2003, prevalence of abstinencefrom cigarette smoking during the last 3 months of pregnancyranged from 72.5% in West Virginia to 96.1% in Utah(Table 2). No state achieved the objective for abstinence fromsmoking during pregnancy. During 2000–2003, prevalenceof abstinence from cigarette smoking during pregnancyincreased significantly only in Utah (Table 6); for the otherstates, prevalence of abstinence from smoking during thelast 3 months of pregnancy remained relatively unchanged.
Smoking Cessation During PregnancyThe HP 2010 objective for this indicator (objective no. 27-6)
is that 30% of smokers will stop smoking during pregnancy.For this analysis, smoking cessation was defined as the reportof any cigarette smoking during the 3 months before preg-nancy but no cigarette smoking reported during the last3 months of pregnancy. In 2003, prevalence of smoking ces-sation during pregnancy ranged from 30.2% in West Virginiato 65.8% in Utah (Table 2). All states achieved the healthobjective for smoking cessation. During 2000–2003, preva-lence of smoking cessation during pregnancy increasedsignificantly (Table 7) in Utah; for the other states, trend analy-sis indicated that prevalence of smoking cessation remainedrelatively unchanged.
TABLE 4. Prevalence* of multivitamin use† at least four timesper week during the month before pregnancy, by state — 19states, Pregnancy Risk Assessment Monitoring System(PRAMS), 2000–2003
2000 2001 2002 2003State (%) (%) (%) (%)Alabama 25.9 26.4 25.7 27.5Alaska 30.9 32.0 31.6 31.5Arkansas 25.3 24.1 26.5 23.0Colorado 35.3 34.2 38.3 36.0Florida 28.6 31.5 30.4 31.3Hawaii 35.9 32.4 34.4 33.7Illinois§ 33.5 34.9 40.4 35.7Louisiana 29.7 28.1 27.5 26.4Maine 40.7 42.3 37.7 45.2Nebraska 34.1 35.2 36.8 36.6New Mexico 28.5 28.0 28.9 29.3New York¶ 35.5 37.3 37.9 37.9North Carolina§ 29.6 32.3 35.2 34.3Ohio 34.7 34.4 32.8 33.6Oklahoma 25.0 27.8 24.8 28.3South Carolina 32.7 30.3 33.9 32.6Utah§ 31.3 35.6 38.6 37.9Washington 35.1 35.0 37.2 35.5West Virginia 25.0 27.5 25.2 28.7* Healthy People 2010 objective: 80%.† Multivitamin use is used as a measure of folic acid consumption.§ Statistically significant difference (p<0.05).¶ Data do not include New York City.
TABLE 5. Prevalence* of physical abuse by husband or partnerduring the 12 months before pregnancy, by state — 19 states,Pregnancy Risk Assessment Monitoring System (PRAMS),2000–2003
2000 2001 2002 2003State (%) (%) (%) (%)Alabama 6.5 7.5 5.8 7.1Alaska† 8.0 7.4 5.2 6.1Arkansas 9.0 8.6 8.1 7.4Colorado 3.2 3.6 2.7 3.7Florida 4.8 3.9 3.9 3.9Hawaii† 6.1 5.0 3.8 3.7Illinois 5.4 5.1 4.1 5.1Louisiana 6.4 8.2 7.0 7.0Maine† 4.0 3.4 3.3 2.2Nebraska 4.2 5.0 4.4 5.4New Mexico 8.2 6.0 7.6 7.6New York§ 3.1 3.0 4.8 3.1North Carolina 4.5 5.1 3.7 3.5Ohio 4.9 5.4 4.3 4.7Oklahoma 6.7 5.5 8.3 5.3South Carolina 3.6 4.9 6.2 5.5Utah 3.2 4.0 2.9 3.0Washington 4.6 3.9 3.4 5.0West Virginia 5.0 6.2 5.4 5.8* Healthy People 2010 objective: 0.33%.† Statistically significant difference (p<0.05).§ Data do not include New York City.
Vol. 55 / SS-9 Surveillance Summaries 7
Abstinence from Alcohol Use DuringPregnancy
The HP 2010 objective for this indicator (objective no.16-17a) is that 94% of all women will abstain from drinkingalcohol during pregnancy. Because PRAMS does not collectdata on alcohol use during the first or second trimester ofpregnancy, for this analysis, abstinence from alcohol use dur-ing pregnancy was defined as abstinence from drinking alco-hol during the last 3 months of pregnancy. In 2003, prevalenceof abstinence from alcohol during the last 3 months of preg-nancy ranged from 91.3% in Colorado to 98.0% in Utah(Table 2). Sixteen states achieved the objective for this indica-tor. During 2000–2003, prevalence of abstinence from alco-hol during the last 3 months of pregnancy increasedsignificantly in two states (Louisiana and Utah) and decreasedsignificantly in two states (Florida and Nebraska) (Table 8);for the other states, prevalence of abstinence from alcoholduring pregnancy remained relatively unchanged.
Breastfeeding in the Early PostpartumPeriod
The HP 2010 objective for this indicator (objective no.16-19a) is that 75% of women with an infant will initiatebreastfeeding in the early postpartum period. For this analy-sis, breastfeeding in the early postpartum period was definedas the report of having ever breastfed after delivery. In 2003,
TABLE 7. Prevalence* of smoking cessation during the last3 months of pregnancy, by state — 19 states, Pregnancy RiskAssessment Monitoring System (PRAMS), 2000–2003
2000 2001 2002 2003State (%) (%) (%) (%)Alabama 41.7 41.4 41.6 44.2Alaska 45.7 46.6 46.1 46.8Arkansas 31.9 37.4 35.6 40.3Colorado 49.3 47.6 49.3 46.0Florida 47.8 53.7 49.8 51.5Hawaii 59.3 56.0 59.1 55.6Illinois 40.3 41.3 47.4 44.5Louisiana 44.2 46.2 49.1 39.7Maine 43.9 41.6 46.6 45.5Nebraska 43.6 46.5 47.3 50.8New Mexico 58.6 55.3 58.3 56.8New York† 37.3 43.4 38.4 44.7North Carolina 44.5 43.4 50.5 45.4Ohio 39.7 36.9 34.8 41.0Oklahoma 46.4 37.6 38.2 44.7South Carolina 45.6 43.3 44.8 49.6Utah§ 49.8 45.6 49.7 65.8Washington 49.7 54.8 49.7 54.1West Virginia 32.7 32.8 32.8 30.2* Healthy People 2010 objective: 30%.† Data do not include New York City.§ Statistically significant difference (p<0.05).
TABLE 6. Prevalence* of abstinence from cigarette smokingduring the last 3 months of pregnancy, by state — 19 states,Pregnancy Risk Assessment Monitoring System (PRAMS),2000–2003
2000 2001 2002 2003State (%) (%) (%) (%)Alabama 86.0 84.4 85.6 86.7Alaska 83.2 85.3 82.3 83.3Arkansas 79.7 79.9 80.8 81.5Colorado 89.8 88.6 89.4 89.4Florida 90.9 90.6 90.0 89.4Hawaii 91.6 90.5 91.9 90.7Illinois 87.5 87.4 88.6 87.4Louisiana 88.1 87.2 88.2 85.5Maine 82.5 82.7 84.1 83.8Nebraska 86.0 85.2 85.6 87.0New Mexico 90.7 89.3 91.8 91.8New York† 83.0 85.6 85.4 85.4North Carolina 86.1 87.8 88.3 86.8Ohio 82.9 79.7 80.0 83.8Oklahoma 83.1 79.7 80.0 83.8South Carolina 87.6 87.0 86.9 88.6Utah§ 92.7 92.3 93.2 96.1Washington 88.9 90.1 88.2 89.8West Virginia 75.5 73.9 74.7 72.5* Healthy People 2010 objective: 99%.† Data do not include New York City.§ Statistically significant difference (p<0.05).
TABLE 8. Prevalence* of abstinence from alcohol during thelast 3 months of pregnancy, by state — 19 states, PregnancyRisk Assessment Monitoring System (PRAMS), 2000–2003
2000 2001 2002 2003State (%) (%) (%) (%)Alabama 97.3 95.4 96.9 95.4Alaska 94.7 94.9 95.7 95.1Arkansas 96.2 95.2 94.8 96.1Colorado 91.0 89.4 90.5 91.3Florida† 95.3 95.4 94.2 92.9Hawaii 95.2 95.5 96.4 95.7Illinois 93.1 94.6 94.0 94.8Louisiana† 95.3 95.0 95.2 97.1Maine 94.9 93.7 95.1 93.4Nebraska† 96.8 96.5 95.7 95.4New Mexico 94.9 95.7 95.6 96.2New York§ 93.5 93.3 91.8 93.8North Carolina 95.0 95.5 94.5 95.8Ohio 95.3 94.1 94.9 96.1Oklahoma 96.1 97.1 97.8 97.5South Carolina 96.8 95.5 96.2 95.6Utah† 96.4 96.9 97.0 98.0Washington 94.0 92.9 94.5 94.5West Virginia 97.9 98.0 98.0 96.6* Healthy People 2010 objective: 94%.† Statistically significant difference (p<0.05).§ Data do not include New York City.
8 MMWR October 6, 2006
prevalence of mothers who breastfed their babies in the earlypostpartum period ranged from 51.2% in Louisiana to 90.3%in Alaska (Table 2). Eight states (Alaska, Colorado, Hawaii,Maine, Nebraska, New Mexico, Utah, and Washington)achieved the objective for this indicator. During 2000–2003,prevalence of mothers who breastfeed their babies in the earlypostpartum period increased significantly in six states (Arkan-sas, Illinois, Louisiana, Nebraska, North Carolina, and SouthCarolina) (Table 9); for the other states, trend analysis indi-cated that no change occurred in prevalence of breastfeedingin the early postpartum period.
Infant Sleep PositionThe HP 2010 objective for this indicator (objective no.
16-13) is that 70% of all healthy full-term infants are placedto sleep on their backs. In 2003, prevalence of healthy full-term infants who were placed to sleep on their backs rangedfrom 50.0% in Arkansas to 78.7% in Washington (Table 2).Seven states (Alaska, Colorado, Maine, Nebraska, New York,Utah, and Washington) have achieved the objective for infantsleep position. During 2000–2003, prevalence of mothers whoplaced their healthy full-term infants to sleep on their backs amajority of the time increased significantly in eight states(Alaska, Colorado, Illinois, Louisiana, Maine, Nebraska, NorthCarolina and West Virginia) (Table 10); for the other states,
trend analysis indicated that prevalence of infants who wereplaced to sleep on their backs a majority of the time remainedrelatively unchanged.
SummaryNo state achieved the HP 2010 objectives for three indica-
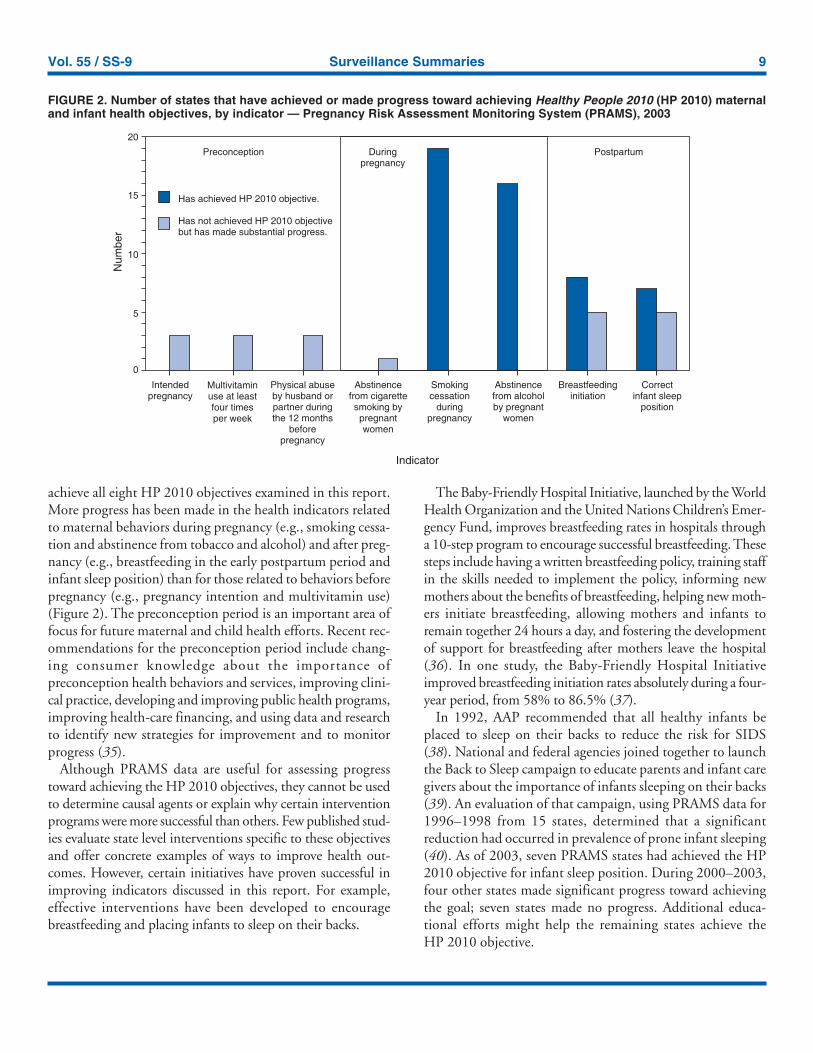
tors in the preconception period that affect maternal and childhealth outcomes (intended pregnancy, multivitamin use dur-ing the month before pregnancy, and physical abuse duringthe 12 months before pregnancy). For behaviors in the prena-tal period, results were mixed. No state achieved the objectivefor abstinence from smoking during pregnancy. However, allstates included in this analysis achieved the objective for smok-ing cessation during pregnancy, and more than three fourthshave achieved or exceeded the objective for abstinence fromalcohol during pregnancy. Nearly half of the states in this analy-sis achieved the objective for breastfeeding in the early post-partum period, and slightly more than one third achieved theobjective for infant sleep position (Figure 2).
DiscussionThe 19 states included in this report have made progress in
achieving certain maternal and child health HP 2010objectives. However, increased efforts are needed for states to
TABLE 9. Prevalence* of mothers who breastfed their babiesin the early postpartum period, by state — 19 states,Pregnancy Risk Assessment Monitoring System (PRAMS),2000–2003
2000 2001 2002 2003State (%) (%) (%) (%)Alabama 55.3 54.2 57.5 57.9Alaska 88.9 90.6 90.5 90.3Arkansas† 60.1 61.6 61.8 65.3Colorado 85.5 84.3 85.5 85.3Florida 77.2 75.9 77.5 73.3Hawaii 89.3 89.8 89.3 89.3Illinois† 69.0 68.6 73.8 72.0Louisiana† 46.1 50.4 50.3 51.2Maine 75.6 77.4 71.9 77.6Nebraska† 71.9 75.2 76.5 76.7New Mexico 80.0 80.2 82.1 82.5New York§ 69.3 68.7 72.0 71.7North Carolina† 63.1 67.8 70.3 70.1Ohio 63.1 62.4 65.9 63.0Oklahoma 68.1 70.7 68.0 68.9South Carolina† 52.6 57.4 58.6 63.1Utah 87.7 88.3 91.0 88.6Washington 88.4 90.4 90.3 90.1West Virginia 53.5 55.8 55.4 56.7* Healthy People 2010 objective: 75%.† Statistically significant difference (p<0.05).§ Data do not include New York City.
TABLE 10. Prevalence* of healthy full-term infants who wereplaced to sleep on their backs, by state — 19 states, PregnancyRisk Assessment Monitoring System (PRAMS), 2000–2003
2000 2001 2002 2003State (%) (%) (%) (%)Alabama 51.8 49.1 51.9 54.3Alaska† 66.2 70.0 69.2 72.4Arkansas 49.0 52.7 50.3 50.0Colorado† 68.0 74.6 72.0 75.9Florida 53.5 58.2 56.7¶ 59.2Hawaii 66.5 69.1¶ 71.4 68.8Illinois† 63.7 69.0 69.2 68.6Louisiana† 42.6 43.7 49.9 57.6Maine† 72.7 76.8 78.0 78.0Nebraska† 66.7 70.2 74.2 70.7New Mexico 64.2 68.1 68.2 68.1New York§ 65.9 69.7 70.3 70.7North Carolina† 56.4 61.1 64.4 68.9Ohio 66.9 66.8 65.2 65.3Oklahoma 55.2 54.7 55.1 59.2South Carolina 59.2¶ 53.3 58.3 59.8Utah 75.6 76.7 76.9 75.0Washington 75.4 76.3 76.9 78.7West Virginia† 56.1 63.3 62.3 65.0* Healthy People 2010 objective: 70%.† Statistically significant difference (p<0.05).§ Data do not include New York City.¶ Missing >10% of data.
Vol. 55 / SS-9 Surveillance Summaries 9
achieve all eight HP 2010 objectives examined in this report.More progress has been made in the health indicators relatedto maternal behaviors during pregnancy (e.g., smoking cessa-tion and abstinence from tobacco and alcohol) and after preg-nancy (e.g., breastfeeding in the early postpartum period andinfant sleep position) than for those related to behaviors beforepregnancy (e.g., pregnancy intention and multivitamin use)(Figure 2). The preconception period is an important area offocus for future maternal and child health efforts. Recent rec-ommendations for the preconception period include chang-ing consumer knowledge about the importance ofpreconception health behaviors and services, improving clini-cal practice, developing and improving public health programs,improving health-care financing, and using data and researchto identify new strategies for improvement and to monitorprogress (35).
Although PRAMS data are useful for assessing progresstoward achieving the HP 2010 objectives, they cannot be usedto determine causal agents or explain why certain interventionprograms were more successful than others. Few published stud-ies evaluate state level interventions specific to these objectivesand offer concrete examples of ways to improve health out-comes. However, certain initiatives have proven successful inimproving indicators discussed in this report. For example,effective interventions have been developed to encouragebreastfeeding and placing infants to sleep on their backs.
The Baby-Friendly Hospital Initiative, launched by the WorldHealth Organization and the United Nations Children’s Emer-gency Fund, improves breastfeeding rates in hospitals througha 10-step program to encourage successful breastfeeding. Thesesteps include having a written breastfeeding policy, training staffin the skills needed to implement the policy, informing newmothers about the benefits of breastfeeding, helping new moth-ers initiate breastfeeding, allowing mothers and infants toremain together 24 hours a day, and fostering the developmentof support for breastfeeding after mothers leave the hospital(36). In one study, the Baby-Friendly Hospital Initiativeimproved breastfeeding initiation rates absolutely during a four-year period, from 58% to 86.5% (37).
In 1992, AAP recommended that all healthy infants beplaced to sleep on their backs to reduce the risk for SIDS(38). National and federal agencies joined together to launchthe Back to Sleep campaign to educate parents and infant caregivers about the importance of infants sleeping on their backs(39). An evaluation of that campaign, using PRAMS data for1996–1998 from 15 states, determined that a significantreduction had occurred in prevalence of prone infant sleeping(40). As of 2003, seven PRAMS states had achieved the HP2010 objective for infant sleep position. During 2000–2003,four other states made significant progress toward achievingthe goal; seven states made no progress. Additional educa-tional efforts might help the remaining states achieve theHP 2010 objective.
FIGURE 2. Number of states that have achieved or made progress toward achieving Healthy People 2010 (HP 2010) maternaland infant health objectives, by indicator — Pregnancy Risk Assessment Monitoring System (PRAMS), 2003
0
5
10
15
20
Intendedpregnancy
Multivitaminuse at leastfour timesper week
Physical abuseby husband orpartner duringthe 12 months
beforepregnancy
Abstinencefrom cigarettesmoking bypregnantwomen
Smokingcessation
duringpregnancy
Abstinencefrom alcoholby pregnant
women
Breastfeedinginitiation
Correctinfant sleep
position
Has achieved HP 2010 objective.
Has not achieved HP 2010 objectivebut has made substantial progress.
Preconception Duringpregnancy
Postpartum
Indicator
Num
ber
10 MMWR October 6, 2006
LimitationsThe findings in this report are subject to at least five limita-
tions. First, PRAMS data are not generalizable to other states,the entire United States, or all pregnant women, only thosewho delivered live-born infants. Second, because PRAMSreports only on unintended pregnancies resulting in a live birth,prevalence of unintended pregnancies is probably underesti-mated. Third, because PRAMS does not collect data on alco-hol or tobacco use during the first or second trimesters ofpregnancy, estimates do not capture prevalence of women whoused alcohol or tobacco in early pregnancy. Fourth, smokingestimates are based on self-reported data, which likely under-estimated the true rate of smoking (41). Finally, theindicator for folic acid consumption, multivitamin use, doesnot capture women’s consumption for folic acid precisely, andPRAMS data therefore might not accurately reflect prevalenceof women achieving this objective.
ConclusionsPRAMS was established to provide state-level data on
women’s health before, during, and shortly after pregnancy toassist health agencies and researchers to monitor trends inmaternal and infant health indicators. This report provides asnapshot of how PRAMS data can be used to monitor stateprogress toward achieving maternal and child HP 2010 ob-jectives. Continued use of PRAMS data to monitor these ma-ternal behaviors is important for implementing, evaluating,and setting priorities for future initiatives at the state level.PRAMS data can be used to gain support for specific pro-grams and initiatives aimed at improving the health of womenand infants (42). In April 2006, PRAMS added nine addi-tional sites; the total number of sites collecting PRAMS datais 39 (38 states and New York City), representing approxi-mately 75% of all U.S. live births. This expansion bringsPRAMS closer to the goal of a nationwide maternal and childhealth surveillance system and provides the opportunity formore states to monitor progress toward achieving HP2010 objectives.
References1. US Department of Health and Human Services. Healthy people 2010.
2nd ed. With understanding and improving health and objectives forimproving health (2 vols.). Washington, DC: US Department of Healthand Human Services; 2000.
2. Hellerstedt W, Pirie P, Lando H, et al. Differences in preconceptionaland prenatal behaviors in women with intended and unintended preg-nancies. Am J Public Health 1998;88:663–6.
3. Locksmith G, Duff P. Preventing neural tube defects: the importanceof periconceptional folic acid supplements. Obstet Gynecol 1998;91:1027–34.
4. CDC. Spina bifida and anencephaly before and after folic acidmandate—United States, 1995–1996 and 1999–2000. MMWR 2004;53:362–5.
5. American Academy of Pediatrics. Folic acid for the prevention ofneural tube defects. Pediatrics 1999;104:325–7.
6. CDC. Recommendations for the use of folic acid to reduce the num-ber of cases of spina bifida and other neural tube defects. MMWR1992;41(No. RR-14).
7. Dietz P, Gazmararian J, Goodwin M, Bruce C, Johnson C, Rochat R.Delayed entry into prenatal care: effect of physical violence. ObstetGynecol 1997;90:221–3.
8. Boy A, Salihu H. Intimate partner violence and birth outcomes: a sys-tematic review. Int J Fertil Womens Med 2004;49:159–63.
9. Martin S, Mackie L, Kupper L, Buescher P, Moracco K. Physicalabuse of women, before, during and after pregnancy. JAMA 2001;285:1581–4.
10. Saltzman L, Johnson C, Colley Gilbert B, Goodwin M. Physical abusearound the time of pregnancy: an examination of prevalence and riskfactors in 16 states. Matern Child Health J 2003;7:31–43.
11. Andres R, Day M. Perinatal complications associated with maternaltobacco use. Semin Neonatal 2000;5:231–41.
12. Windham G, Hopkins B, Fenster L, Swan S. Prenatal active or passivetobacco smoke exposure and the risk of preterm delivery or low birthweight. Epidemiology 2000;11:427–33.
13. Shah N, Bracken M. A systematic review and meta-analysis of pro-spective studies on the association between maternal cigarette smok-ing and preterm delivery. Obstet Gynecol 2000;182:456–72.
14. DiFranza JR, Aligne CA, Weitzman M. Prenatal and postnatal envi-ronmental tobacco smoke exposure and children’s health. Pediatrics2004;113(Suppl 4):1007–15.
15. Jedrychowksi W, Flak E. Maternal smoking during pregnancy andpostnatal exposure to environmental tobacco smoke as predispositionfactors to acute respiratory infections. Eviron Health Perspect 1997;105:302–6.
16. Pollack H. Sudden infant death syndrome, maternal smoking duringpregnancy, and the cost-effectiveness of smoking cessation interven-tion. Am J Public Health 2001;91:432–6.
17. Lieberman E, Gremy I, Lang J, Cohen A. Low birthweight at termand the timing of fetal exposure to maternal smoking. Am J PublicHealth 1994;84:1127–31.
18. Li C, Windsor R, Perkins L, Goldenberg R, Lowe J. The impact oninfant birth weight and gestational age of cotinine-validated smokingreduction during pregnancy. JAMA 1993;269:1519–24.
19. MacArthur C, Knox E. Smoking in pregnancy: effects of stopping atdifferent stages. Br J Obstet Gynaecol 1988;95:551–5.
20. American Academy of Pediatrics. Fetal alcohol syndrome and alcohol-related neurodevelopmental disorders. Pediatrics 2000;106:358–61.
21. Windham G, Von Behren J, Fenster L, Schaefer C, Swan S. Moderatematernal alcohol consumption and risk of spontaneous abortion.Epidemiology 1998;8:509–14.
22. Sokol RJ, Delaney-Black V, Nordstrom B. Fetal alcohol spectrumdisorder. JAMA 2003;290:2996–9.
23. US Department of Health and Human Services. U.S. Surgeon Gen-eral releases advisory on alcohol use in pregnancy. Washington, DC:US Department of Health and Human Services; 2005. Available athttp://www.hhs.gov/surgeongeneral/pressreleases/sg02222005.html.
Vol. 55 / SS-9 Surveillance Summaries 11
24. American Academy of Pediatrics. Breastfeeding and the use of humanmilk. Pediatrics 1997;100:1035–9.
25. Anderson J, Johnstone B, Remley D. Breastfeeding and cognitivedevelopment: a meta-analysis. Am J Clin Nutr 1999;70:525–35.
26. Dewey K, Heinig M, Nommsen-Rivers L. Differences in morbiditybetween breast-fed and formula-fed infants. J Pediatr 1995;126:696–702.
27. Raisler J, Cheryl A, O’Campo P. Breast-feeding and infant illness:a dose-response relationship? Am J Public Health 1999;89:25–30.
28. Lawrence R. Breastfeeding: benefits, risks and alternatives. ObstetGynecol 2000;12:519–24.
29. Anderson R, Smith B. Deaths: leading causes for 2002. Natl Vital StatRep 2005;53(17).
30. Hoyert D, Heron M, Murphy S, Kung H. Deaths: final data for 2003.Natl Vital Stat Rep 2006;54(13).
31. American Academy of Pediatrics. Changing concepts of sudden infantdeath syndrome: implications for infant sleeping environment and sleepposition. Pediatrics 2000;105:650–6.
32. Shulman H, Colley Gilbert B, Lansky A. The Pregnancy Risk Assess-ment Monitoring System (PRAMS): current methods and evaluationsof 2001 response rates. Public Health Rep 2006;121:74–83.
33. Shah B, Barnwell B, Bieler G. SUDAAN user’s manual: software forthe statistical analysis of correlated data. Release 7.5. Research TrianglePark, NC: Research Triangle Institute; 1997.
34. CDC. Surveillance for selected maternal behaviors and experiencesbefore, during, and after pregnancy: Pregnancy Risk Assessment Sys-tem (PRAMS), 2000. In: CDC Surveillance Summaries, November14, 2003. MMWR 2003;52(No. SS-11).
35. CDC. Recommendations to improve preconception health and healthcare—United States: a report of the CDC/ATSDR Preconception CareWork Group and the Select Panel on Preconception Care. MMWR2006;55(No. RR-6).
36. Phillip BL, Merewood A, Miller LW, et al. Baby-friendly hospitalinitiative improves breastfeeding initiation rates in a US hospitalsetting. Pediatrics 2001;108:677–81.
37. World Health Organization, Division of Child Health and Develop-ment. Evidence for the ten steps to successful breastfeeding. Geneva,Switzerland: World Health Organization; 1998.
38. American Academy of Pediatrics. Positioning and sudden infant death(SIDS): update. Pediatrics 1996;98:1216–8.
39. National Institutes of Health, National Institute of Child Health andHuman Development. SIDS: Back to Sleep Campaign. Available athttp://www.nichd.nih.gov/sids.
40. Pollack H, Frohna J. Infant sleep placement after the Back to SleepCampaign. Pediatrics 2002;109:608–14.
41. Ford RP, Tappin DM, Schluter PJ, Wild CJ. Smoking during preg-nancy: how reliable are maternal self reports in New Zealand?J Epidemiol Community Health 1997;51:246–51.
42. D’Angelo D, Colley Gilbert B, eds. From data to action: using surveil-lance to promote public health. Examples from the Pregnancy RiskAssessment Monitoring System (PRAMS). Atlanta, GA: US Depart-ment of Health and Human Services, CDC; 2002.
Pregnancy Risk Assessment Monitoring System (PRAMS) Working GroupAlabama, Albert Woolbright, PhD; Alaska, Kathy Perham-Hester, MS, MPH; Arkansas, Gina Redford, MAP; Colorado, Alyson Shupe, PhD; Florida,Helen Marshall; Georgia, Carol Hoban, MS, MPH; Hawaii, Limin Song, MPH; Illinois, Theresa Sandidge, MA; Louisiana, Joan Wightkin; Maine, KimHaggan; Maryland, Diana Cheng, MD; Michigan, Yasmina Bouraoui, MPH; Minnesota, Jan Jernell; Mississippi, Linda Pendleton; Montana, JoAnnDotson; Nebraska, Jennifer Severe-Oforah; New Jersey, Lakota Kruse, MD; New Mexico, Ssu Weng, MD; New York, Anne Radigan-Garcia; New YorkCity, Candace Mulready, MPH; North Carolina, Paul Buescher, PhD; North Dakota, Sandra Anseth; Ohio, Amy Davis; Oklahoma, Dick Lorenz; Oregon,Ken Rosenberg, MD; Rhode Island, Sam Viner-Brown; South Carolina, Jim Ferguson, DrPH; Texas, Tanya J. Guthrie, PhD; Utah, Laurie Baksh; Vermont,Peggy Brozicevic; Washington, Linda Lohdefinck; West Virginia, Melissa Baker, MA; PRAMS Team, Division of Reproductive Health, National Center forChronic Disease Prevention and Health Promotion, CDC.
MMWR
The Morbidity and Mortality Weekly Report (MMWR) Series is prepared by the Centers for Disease Control and Prevention (CDC) and is available free of chargein electronic format. To receive an electronic copy each week, send an e-mail message to [email protected]. The body content should read SUBscribe mmwr-toc. Electronic copy also is available from CDC’s Internet server at http://www.cdc.gov/mmwr or from CDC’s file transfer protocol server at ftp://ftp.cdc.gov/pub/publications/mmwr. Paper copy subscriptions are available through the Superintendent of Documents, U.S. Government Printing Office, Washington, DC20402; telephone 202-512-1800.
Data in the weekly MMWR are provisional, based on weekly reports to CDC by state health departments. The reporting week concludes at close of business onFriday; compiled data on a national basis are officially released to the public on the following Friday. Data are compiled in the National Center for Public HealthInformatics, Division of Integrated Surveillance Systems and Services. Address all inquiries about the MMWR Series, including material to be considered forpublication, to Editor, MMWR Series, Mailstop E-90, CDC, 1600 Clifton Rd., N.E., Atlanta, GA 30333 or to [email protected].
All material in the MMWR Series is in the public domain and may be used and reprinted without permission; citation as to source, however, is appreciated.
Use of trade names and commercial sources is for identification only and does not imply endorsement by the U.S. Department of Health and Human Services.
References to non-CDC sites on the Internet are provided as a service to MMWR readers and do not constitute or imply endorsement of these organizations ortheir programs by CDC or the U.S. Department of Health and Human Services. CDC is not responsible for the content of these sites. URL addresses listed inMMWR were current as of the date of publication.
✩U.S. Government Printing Office: 2006-523-056/40074 Region IV ISSN: 1546-0738