Embed Size (px)
Citation preview

Monitoring Outcomes for Cuyahoga County’s Welfare Leavers: How Are They Faring?
Prepared for
Cuyahoga Work and Training and
U.S. Department of Health and Human Services Office of the Assistant Secretary for Planning and Evaluation
April 2001
Prepared by
Nandita Verma Manpower Demonstration
Research Corporation
Claudia Coulton Case Western
Reserve University
with Richard Hendra Engel Polousky

This research was funded by the U.S. Department of Health and Human Services, Office of the Assistant Secretary for Planning and Evaluation, under grant 98ASPE305A. The findings and conclusions presented in this report do not represent the official positions of any federal or state agency.

-iii-
Contents
Tables and Figures iv Acknowledgments vi Executive Summary 1 1. Studying Welfare Leavers 13
2. Who Leaves Welfare and Why? 22
3. From Welfare to Work: Employment Experiences, Job Characteristics, and Barriers to Work 26
4. Welfare Recidivism and Food Stamp and Medicaid Receipt 39
5. Income and Well-Being 48
Appendix: Survey Response Analysis 62 References 69

-iv-
Tables and Figures
Tables
1.1 Cash Assistance Caseloads in Cuyahoga County and State of Ohio: 1989-2000 16
1.2 Key Policy Provisions During the Period of Study 17
1.3 Economic Conditions in Cuyahoga County: 1995-1999 18
1.4 Definition of Welfare Leavers: 1996 and 1998 20
2.1 Selected Background Characteristics of Pre- and Post-TANF Caseloads and Leavers 23
3.1 Post-Exit Employment Experience for Pre- and Post-TANF Leavers 28
3.2 Post-Exit Earnings and Earnings Growth for Pre- and Post-TANF Leavers 29
3.3 Earnings Growth for Pre- and Post-TANF Leavers, by Employment Stability 30
3.4 Post-Exit Outcomes for Pre- and Post-TANF Leavers, by Work and Welfare History 32
3.5 Selected Characteristics of Current or Most Recent Job for Post-TANF Leavers 34
3.6 Child Care Arrangements, by Post-Exit Employment 36
3.7 Barriers to Work for Post-TANF Leavers, by Post-Exit Employment 38
4.1 Welfare Receipt in Four Quarters After Exit for Pre- and Post-TANF Leavers 40
4.2 Characteristics of Those Who Did/Did Not Return to Cash Assistance 42
4.3 Recidivism Rates, by Prior Employment and Welfare History 43
4.4 Post-Exit Food Stamp and Medicaid Receipt for Pre- and Post-TANF Leavers 45
4.5 Post-Exit Food Stamp and Medicaid Participation for Adults and Children 47
5.1 Income and Income Sources for Post-TANF Leavers 49
5.2 Household Members Receiving Income, by Source 51
5.3 Material and Economic Well-Being for Post-TANF Leavers 57
5.4 Perception of Neighborhood Quality for Post-TANF Leavers 61

-v-
Tables (continued)
A.1 Background Characteristics of Quarter 3 1998 Welfare Leavers, by Sampling Status 64
A.2 Estimated Regression Coefficients for the Probability of Quarter 3 1998 Welfare Leavers Being Sampled for the Follow-Up Survey 65
A.3 Background Characteristics of Quarter 3 1998 Welfare Leavers, by Response Status 66
A.4 Estimated Regression Coefficients for the Probability of Quarter 3 1998 Welfare Leavers Responding to the Follow-Up Survey 68
Figures
1 Trends in Annual AFDC/TANF Caseloads in Cuyahoga County and State of Ohio: 1989-2000 3
2 Pre- and Post-Exit Employment Rates 6
3 Pre- and Post-Exit Earnings Growth 6
4 Pre- and Post-Exit AFDC/TANF Receipt 9
5 Post-Exit Food Stamp Receipt 10
6 Post-Exit Medicaid Receipt 10
5.1 Household Income Sources and Poverty One Year After Exit for Quarter 3 1998 Welfare Leavers 52
5.2 Use of Support Services One Year After Exit for Quarter 3 1998 Welfare Leavers, by Welfare Status 53
5.3 Use of Support Services One Year After Exit for Quarter 3 1998 Welfare Leavers, by Post-Exit Work Status 55
5.4 Hardships Experienced One Year After Exit for Quarter 3 1998 Welfare Leavers, by Welfare Status 58
5.5 Hardships Experienced One Year After Exit for Quarter 3 1998 Welfare Leavers, by Work Status 59

-vi-
Acknowledgments
This report could not have been completed without the full cooperation of the people whose work and lives are documented in this report. We are deeply grateful to all the families involved in this study.
Special appreciation is due to staff at both the federal and local level. At the federal level, Julie Isaacs, Elizabeth Lower-Basch, and Christopher Snow, during the initial stages of the project, played an important role in developing the research and analysis and provided constructive feedback on the final report. At Cuyahoga Work and Training, Sandra Bizzell provided support and keen interest in the study. Jim Rohn, Susanna LaRicca, and Annette Shaughnessy contributed to the study on several occasions and provided valuable insights on local policy changes.
This report also reflects the cooperation and collaboration of a number of individuals and institutions. The productive collaboration of research teams at MDRC and CWRU was instrumental in bringing to fruition this study of welfare leavers in Cuyahoga County. At MDRC, Barbara Goldman and Charles Michalopoulos provided thoughtful guidance at various stages of the study. Judith Gueron, Gordon Berlin, and Dan Bloom reviewed an earlier draft of this report and offered valuable guidance. At CWRU, Meg Fernando and Neil Bania made major contributions to the analysis.
Sylvia Newman edited the report. Gilda Azurdia produced the tables and figures, and Stephanie Cowell prepared the document for publication.
The Authors

-1-
Executive Summary
Over the past few decades, welfare and other public policies for welfare-dependent families have focused on increasing employment and economic self-sufficiency by encouraging and supporting work. The 1996 Personal Responsibility and Work Opportunity Reconciliation Act (PRWORA), which ended the federal entitlement to cash assistance for families with children and created the Temporary Assistance for Needy Families (TANF) program, places an even greater emphasis on work as a primary means of ending dependence on government assistance. The new legislation limits the amount of time that families can receive federal cash assistance and requires most families to be engaged in employment-related activities to receive cash benefits. In conjunction with a greater emphasis on work, federal and state welfare policies are also doing more to encourage work among low-income families, especially those on welfare: the earned income credit, child care assistance, and other transitional benefits have all been expanded to encourage and promote work outside the welfare system. This combination of strict work requirements and increased benefits and supports for working parents provides an important context for studying welfare leavers.
The number of individuals receiving welfare has been declining since the mid 1990s; however, welfare caseloads have declined sharply since the passage of PRWORA. While welfare caseloads have always been dynamic, with families entering and leaving assistance programs each month, the unprecedented declines have led many to raise questions about what the rapid drop in caseloads means for states and families. National and local interest in this phenomenon has resulted in a number of studies of welfare leavers.
The study of Cuyahoga County welfare leavers was undertaken by Cuyahoga Work and Training as part of a grant from the Office of the Assistant Secretary for Planning and Evaluation of the U.S. Department of Health and Human Services (HHS). The Manpower Demonstration Research Corporation, in collaboration with Case Western Reserve University, conducted the research and analysis and prepared this final report. The Cuyahoga study was designed to inform local administrators and policy analysts about the circumstances of families leaving welfare. Specifically, the study was designed to address the following key questions:
• Who are the welfare leavers, and what are their background characteristics? How do pre-TANF leavers compare with Post-TANF leavers?
• What are the earnings and employment experiences of pre- and post-TANF welfare leavers?
• To what extent do pre- and post-TANF leavers return to welfare? What public and other supports do leavers rely on after they stop receiving cash assistance?
• What is the level of material well-being of post-TANF welfare leavers? What are their income sources, and what types of hardship do they experience?
To address these questions, the research focused on the post-exit experiences of two groups of welfare leavers: a pre-TANF group of leavers who exited welfare in quarter 3 of 1996 and a post-TANF group who exited welfare in quarter 3 of 1998. Cases of all single, female adult parents that closed in quarter 3 of 1996 and 1998 and did not reopen within two consecutive

-2-
months of closing were included in this study. This definition of a welfare leaver was adopted by most of the grantees funded by HHS to undertake leavers studies.
Outcomes were examined for approximately 6,151 adult welfare leavers. Administrative data were used to track welfare leavers for a total of nine quarters, including four quarters pre- exit, the quarter of exit, and four quarters post-exit. The welfare administrative records were the main source of data for selected background characteristics of welfare leavers, as well as monthly AFDC/TANF, Food Stamp, and Medicaid receipt. Wage files were obtained to examine pre- and post-exit employment rates and earnings patterns for the leavers.
To supplement the administrative records analysis, in-depth interviews were conducted with a sample of 306 TANF leavers who left cash assistance in quarter 3 of 1998. These interviews were conducted approximately 14 to 21 months after sample members exited welfare in 1998. The survey focused on topics that cannot be examined from administrative records alone. For example, the survey data on reasons for leaving welfare and reasons for returning to welfare supplement the administrative records analysis of welfare exits and returns. Further, the survey also provides detailed information on leavers’ job characteristics, income sources, housing circumstances, and material well-being. An 80 percent response rate was achieved on the survey.
I. Policy and Economic Context
Interpreting the study findings requires an understanding of the policy and economic environment at the time the welfare leavers in this study left cash assistance.
First, similar to national trends, the Cuyahoga County welfare caseload declined from a little over 125,000 recipients in 1990 to 65,331 by the end of 1999, a loss of approximately 48 percent of the caseload. As shown in Figure 1, caseloads in the state and county increased through 1993 and then began to fall, with the state losing AFDC cases at a much faster pace than the county. The groups of leavers in this study left welfare about the time that the county caseload was rapidly declining. Today, Cuyahoga accounts for close to 25 percent of the state’s welfare caseload but only 13 percent of the state’s population.
Cuyahoga’s welfare policy environment changed slightly between 1996 and 1998 — the period when the leavers in the study exited welfare — because of welfare reform efforts already under way before the implementation of TANF. OhioFirst, the state welfare reform initiative, which in some ways laid the groundwork for the state’s TANF legislation, was in effect at the time the pre-TANF cohort of leavers exited welfare; as a result, it is possible that the pre-TANF leavers were beginning to feel some effects of welfare reform at the time of exit. However, none of the 1996 leavers were subjected to the work requirements, sanction policies, or time limit provisions that are part of TANF.
Ohio Works First (OWF), the state’s TANF program, went into effect in October 1997. The post-TANF cohort of leavers in this study — or those who left welfare in quarter 3 of 1998 — were exposed to OWF for about one year before they left welfare. Like most states, Ohio welfare policy emphasizes rapid attachment to the labor force through mandatory job searches and has imposed a three-year time limit on welfare cash assistance; however, it is important to

-3-
50,000
100,000
150,000
200,000
250,000
300,000
350,000
400,000
450,000
500,000
550,000
600,000
650,000
700,000
750,000
800,000
1989 1990 1991 1992 1993 1994 1995 1996 1997 1998 1999 2000
Years
Figure 1Trends in Annual AFDC/TANF Caseloads in
Cuyahoga County and State of Ohio: 1989-2000
Cuyahoga County
State of Ohio
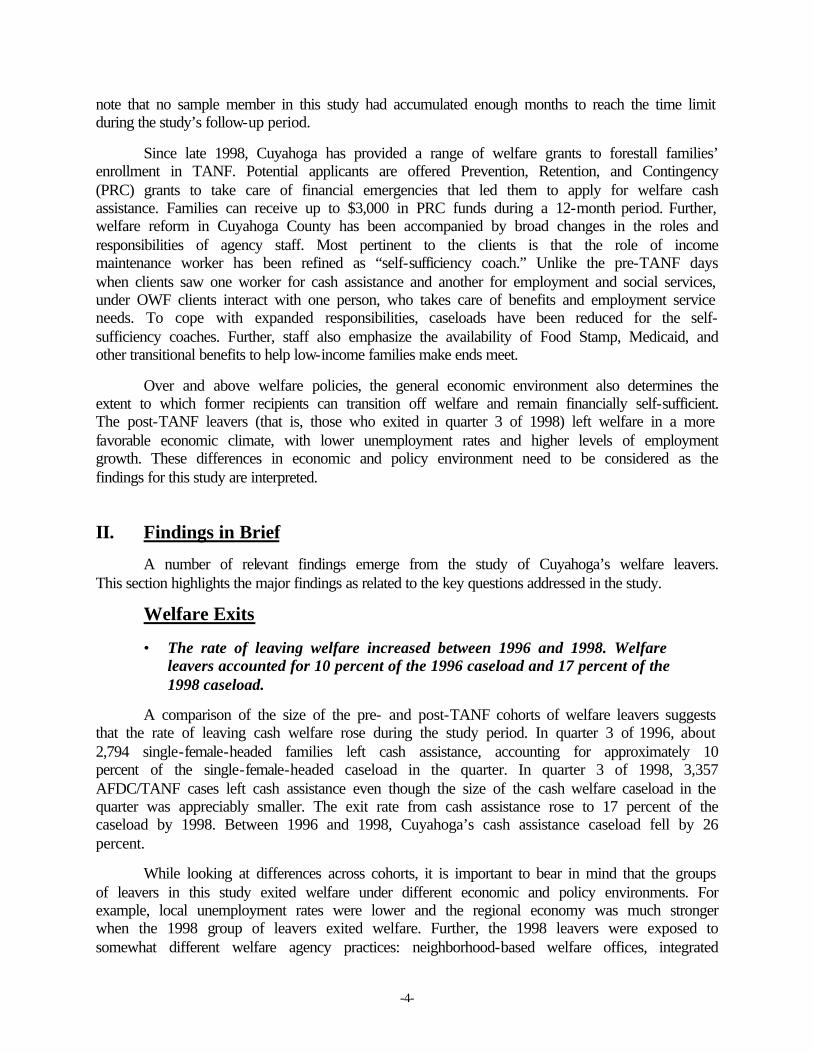
-4-
note that no sample member in this study had accumulated enough months to reach the time limit during the study’s follow-up period.
Since late 1998, Cuyahoga has provided a range of welfare grants to forestall families’ enrollment in TANF. Potential applicants are offered Prevention, Retention, and Contingency (PRC) grants to take care of financial emergencies that led them to apply for welfare cash assistance. Families can receive up to $3,000 in PRC funds during a 12-month period. Further, welfare reform in Cuyahoga County has been accompanied by broad changes in the roles and responsibilities of agency staff. Most pertinent to the clients is that the role of income maintenance worker has been refined as “self-sufficiency coach.” Unlike the pre-TANF days when clients saw one worker for cash assistance and another for employment and social services, under OWF clients interact with one person, who takes care of benefits and employment service needs. To cope with expanded responsibilities, caseloads have been reduced for the self-sufficiency coaches. Further, staff also emphasize the availability of Food Stamp, Medicaid, and other transitional benefits to help low-income families make ends meet.
Over and above welfare policies, the general economic environment also determines the extent to which former recipients can transition off welfare and remain financially self-sufficient. The post-TANF leavers (that is, those who exited in quarter 3 of 1998) left welfare in a more favorable economic climate, with lower unemployment rates and higher levels of employment growth. These differences in economic and policy environment need to be considered as the findings for this study are interpreted.
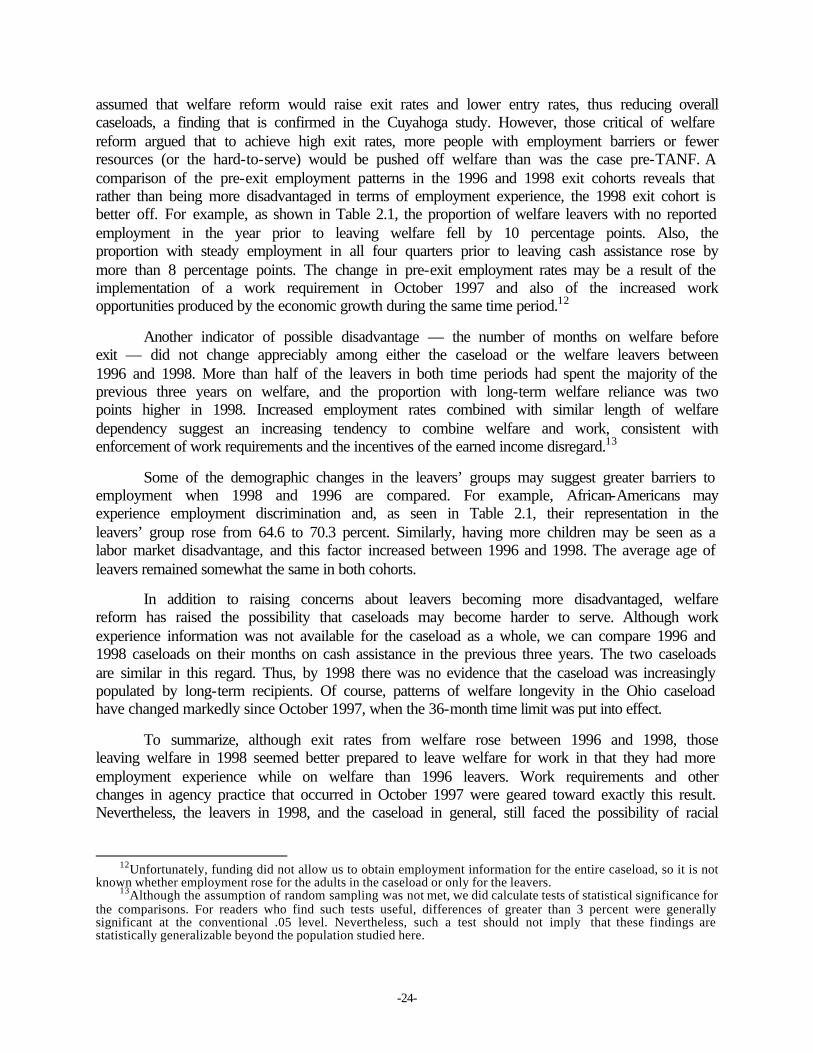
II. Findings in Brief
A number of relevant findings emerge from the study of Cuyahoga’s welfare leavers. This section highlights the major findings as related to the key questions addressed in the study.
Welfare Exits
• The rate of leaving welfare increased between 1996 and 1998. Welfare leavers accounted for 10 percent of the 1996 caseload and 17 percent of the 1998 caseload.
A comparison of the size of the pre- and post-TANF cohorts of welfare leavers suggests that the rate of leaving cash welfare rose during the study period. In quarter 3 of 1996, about 2,794 single-female-headed families left cash assistance, accounting for approximately 10 percent of the single-female-headed caseload in the quarter. In quarter 3 of 1998, 3,357 AFDC/TANF cases left cash assistance even though the size of the cash welfare caseload in the quarter was appreciably smaller. The exit rate from cash assistance rose to 17 percent of the caseload by 1998. Between 1996 and 1998, Cuyahoga’s cash assistance caseload fell by 26 percent.
While looking at differences across cohorts, it is important to bear in mind that the groups of leavers in this study exited welfare under different economic and policy environments. For example, local unemployment rates were lower and the regional economy was much stronger when the 1998 group of leavers exited welfare. Further, the 1998 leavers were exposed to somewhat different welfare agency practices: neighborhood-based welfare offices, integrated

-5-
case management, a more generous earned income disregard, combined with stricter work requirements and stronger penalties for noncompliance with work or other requirements. Thus, different factors probably account for more families exiting welfare between 1996 and 1998.
• A diverse group of recipients left welfare in 1996 and 1998. There were few differences in the background characteristics of pre- and post-TANF leavers.
Typical pre- and post-TANF leavers were about 29 years old, African-American, and likely to have received welfare for at least two of the three years before they left the rolls. A comparison of the characteristics of caseloads and exit cohorts suggests that the chances of leaving welfare were slightly greater for white women than African-American women, for women with fewer children, and for women with shorter welfare histories. Although most leavers had at least one quarter of formal employment in the year prior to leaving welfare, those who left in 1998 were somewhat more advantaged with respect to pre-exit employment. For example, the proportion of welfare leavers with no reported employment in the year prior to leaving welfare fell by 10 percentage points between 1996 and 1998. Also, the proportion with steady employment for all four quarters prior to leaving cash assistance rose by more than 8 percentage points during this time period. The higher levels of pre-exit employment observed among the 1998 leavers could be a result of the stricter work participation requirements in October 1997 and increased employment opportunities produced by the stronger economy during the same time period.
Employment and Earnings
Consistent with a number of other studies of welfare leavers, the Cuyahoga employment findings offer reasons for optimism and concern. Over 50 percent of pre- and post-TANF leavers worked three or more quarters in the year following exit. Further, between 59 and 70 percent of the welfare leavers were working in the first quarter after leaving welfare. Employment levels were also high in the quarter of exit, suggesting that most had transitioned to work before leaving welfare. These employment characterizations of welfare leavers are consistent with findings from other state and national studies of former recipients.
• Women who exited cash assistance in 1998 were more likely to find work than were those who exited in 1996. However, employment tended to be unstable for a significant proportion of leavers who worked after exit.
In general, employment rates obtained from administrative records were about 10 percentage points higher for the 1998 welfare leavers than for the 1996 leavers, and these differences remained constant over the follow-up period. As shown in Figure 2, employment rates began to rise two quarters preceding the quarter of exit, and by the first full quarter after exit (or quarter 1 in the figure), 59 percent of the 1996 leavers and 68 percent of the 1998 leavers were employed. By the end of the follow-up period, employment rates dropped for both groups, and the rates were lower than those observed in the first quarter of follow-up.
Seventy-two percent of the 1996 exit cohort and 82 percent of the 1998 exit cohort worked at least one quarter during the follow-up period. Although employment rates were somewhat higher for the 1998 leavers, employment stability remained somewhat the same for the

-6-
0
10
20
30
40
50
60
70
80
-4 -3 -2 -1 0 1 2 3 4
Quaters Relative to Welfare Exit
Post-TANF Leavers
Quarter of Exit
SOURCE: Calculations from Ohio unemployment insurance records.
Figure 2Pre- and Post-Exit Employment Rates
Cuyahoga County
Pre-TANF Leavers
0
500
1,000
1,500
2,000
2,500
3,000
3,500
-4 -3 -2 -1 0 1 2 3 4Quarter Relative to Welfare Exit
Post-TANF leavers
Pre-TANF Leavers
Figure 3Pre- and Post-Exit Earnings Growth
Cuyahoga County
SOURCE: Calculations from Ohio unemployment insurance records.
Quarter of Exit

-7-
two groups of leavers. Forty percent of the 1996 exit leavers and 47 percent of the 1998 leavers stayed employed for all four quarters of follow-up.
• The 1996 and 1998 leavers generally had low earnings and little earnings growth in their first year off cash assistance, and no improvement was seen in this regard.
Even though employment rates increased between 1996 and 1998, quarterly earnings for those employed declined slightly. As shown in Figure 3, median quarterly earnings (1998 dollars) in the first quarter after exit were higher for the 1998 leavers, but this trend is reversed during the follow-up period. Median earnings for the 1998 leavers in the first full quarter of follow-up was $2,744, $59 higher than earnings for the 1996 leavers; by the fourth quarter of follow-up, the median quarterly earnings of the 1998 leavers was about $127 lower than the earnings for the 1996 leavers. The majority of those working four quarters after exit were not earning enough to move their families above the poverty threshold if they were relying exclusively on their own earnings either before or after welfare reform.
In general, former recipients with jobs worked full time (35 hours a week) and reported mean earnings of about $7.50 an hour. Close to 23 percent of those who worked reported earning below the minimum wage. About 12 percent reported earning above $10 an hour. Over half of those with a job reported that their employer offered benefits such as sick or personal days, health insurance, or paid vacation.
• Women with less than stable work history were more likely to report the presence of barriers to work.
A significant portion of the post-TANF leavers reported having at least one employment-related barrier. Inadequate basic education or training, prior work experience, problems with child care, physical or mental health problems, or child health problems were examined to assess the types and levels of barriers limiting leavers’ ability to work. Close to 40 percent of the sample had less than a high school education and 19 percent reported that they had not worked in the year prior to leaving welfare. Fifteen percent of the sample reported having a physical or mental condition that prevented them from working or engaging in a work-related activity. Child care and child health problems were experienced by about 20 percent of the sample.
Multiple barriers were common as well. Sixty-three percent of the leavers who responded to the survey reported the presence of at least one barrier to work. Former recipients who worked steadily for four quarters after exit were less likely to report multiple barriers than those who had worked less or had not worked during the follow-up period. Those with less stable or no employment were more likely to report the presence of multiple barriers. The prevalence of barriers among all groups suggests a need to enhance delivery of transitional benefits and other support services to help former recipients move from welfare to work.
• Close to a third of the sample reported that they had received help from a government agency or other source for paying for child care costs since they left welfare.
Questions about child care were asked of 234 of the 306 survey respondents who had a child under age 13 living with them. Thirty-four percent of this group indicated that they had

-8-
received some form of assistance from a government agency or other source to pay for child care costs since they had left welfare. Twenty-five percent of the sample members were receiving help with child care payments at the time of the survey interview. Respondents who had worked in the first four quarters after exit were more likely to have received some assistance with child care payments. Thirteen percent of the households with a child under age 13 reported that their children had taken care of themselves on a regular basis. Reports of unsupervised care were higher for leavers who had worked steadily in the first four quarters after exit than for those with less steady employment during the same period (17 versus 11 percent).
Welfare Recidivism
• Most recipients who left welfare did not return within one year of exit. Welfare recidivism rates remained unchanged between 1996 and 1998.
Rates of return to welfare over the 12 months of follow-up remained nearly the same for the pre-TANF and post-TANF leavers. Roughly 37 percent of the pre-TANF leavers and 38 percent of the post-TANF leavers returned to welfare at least once after being off cash assistance for at least two consecutive months. It should be noted that no women in these cohorts had reached their welfare time limit, which is three years in Ohio. Although both groups experienced comparable levels of recidivism over the one-year follow-up period, the quarterly return rates for the 1998 cohort were slightly lower than the rates for the 1996 leavers (see Figure 4).
• Those who were least likely to sustain steady employment were more likely to return to welfare.
Whether or not former recipients return to welfare is an important marker of their ability to remain economically self-sufficient. Although a majority of sample members did not return to welfare, this study shows a few differences in the characteristics of those who returned to welfare during the follow-up period compared with those who did not. Among the 1996 and 1998 exit cohorts, steady employment (or working in all four quarters of follow-up) was clearly associated with staying off welfare, although, unexpectedly, median quarterly earnings for women staying off welfare declined from 1996 to 1998. An additional important finding is that the proportion of women who stayed off welfare but received Medicaid and Food Stamps rose by approximately 20 percentage points between 1996 and 1998. This suggests that these programs are important for meeting basic needs of families who stay off of cash assistance, because their earnings are very low.
Use of Other Government Supports
• Between 1996 and 1998, there was a marked increase in the rates of post-exit participation in Food Stamp and Medicaid programs. However, participation rates declined over time for both cohorts, and take-up rates appeared lower than expected.
Consistent with findings from a number of state and national welfare leavers studies, the proportion of Cuyahoga’s leavers retaining Food Stamp and Medicaid benefits increased between 1996 and 1998. Among the 1998 leavers, 56 percent received Food Stamps and 60 percent were covered by Medicaid in the first quarter after exit, a 10 to 20 percentage point increase compared with the 1996 leavers’ receipt of these supports. (See Figures 5 and 6.)

-9-
0
20
40
60
80
100
120
-4 -3 -2 -1 0 1 2 3 4Quater Relative to Welfare Exit
Post-TANF Leavers
Pre-TANF Leavers
SOURCE: Calculations from Ohio income maintenance files.
Quarter of Exit
Figure 4Pre- and Post-Exit AFDC/TANF Receipt
Cuyahoga County

-10-
0
10
20
30
40
50
60
1 2 3 4
Quarter Relative to Welfare Exit
Figure 5Post-Exit Food Stamp Receipt
Cuyahoga County
Pre-TANF Leavers
Post-TANF Leavers
0
10
20
30
40
50
60
70
1 2 3 4Quarter Relative to Welfare Exit
Figure 6Post-Exit Medicaid Receipt
Cuyahoga County
Post-TANF Leavers
Pre-TANF Leavers
SOURCE: Calculations from Ohio income maintenance files.

-11-
Participation in Medicaid and Food Stamps declined over the four quarters of follow-up, however, and the decline was greater for the 1998 leavers. As shown in Figure 5, Food Stamp receipt declined by about 3 percentage points for the 1996 leavers and about 9 percentage points for the 1998 leavers; decline in Medicaid participation was somewhat steeper. It appears from earnings reported for these two groups that the take-up rates declined for those who were eligible for Food Stamp and Medicaid programs.
Income and Well-Being
• Approximately 57 percent of the families leaving cash assistance live in households with incomes below the poverty threshold.
Transitioning off welfare is not the same as leaving poverty. The survey data show that the average monthly household income for the 1998 welfare leavers was $1,169, or about $14,028 annually. Other household members’ earnings appear to be critical to the income support for leaver households. Fifty-seven percent of the 1998 leavers were living in households with income below the poverty threshold. The poverty threshold for a family of three in 1999 was $13,880. Families living below the poverty threshold were more likely to have returned to welfare in the follow-up period and were more likely to be relying on public assistance than on work.
• Reports of post-exit material hardship varied by respondents’ work status in the follow-up period. Those with the least steady post-exit employment experience were likely to report higher levels of hardship and were more likely to report receiving social supports from government or other agencies.
Overall, 46 percent of the sample reported that they had experienced food insecurity after leaving welfare. The food insecurity level for the national population is about 10 percent. Food insecurity levels were higher for those who did not work or had stayed off welfare during the follow-up period. Leavers also reported housing-related hardship: nearly 50 percent of the sample paid over 30 percent of their income for housing expense, approximately 20 percent indicated that their utilities had been shut off because they were unable to pay bills, and another 48 percent indicated hardship with accessing either medical or dental care. The level of hardship documented among the post-TANF leavers, even among those with steady employment, suggests that leaving welfare does not translate into a higher level of well-being.
Reflections
This report presents an initial exploration of the characteristics and the experiences of people leaving welfare voluntarily or because of sanctions. Overall, in terms of a number of outcomes — whether leavers go to work, their earnings, whether they return to welfare, and their general well-being — the Cuyahoga leavers resemble the leavers in other parts of the nation. The Cuyahoga study finds that a significant proportion of families leaving welfare are making the transition from welfare to work, as reflected by the high levels of post-exit employment. However, the fact that close to one-third of the leavers return to welfare within 12 months of leaving and that fewer than one-half of those employed are able to maintain stable employment suggests that labor market transitions are tenuous for a segment of this population. Further, reports of relatively low earnings, high levels of material hardship, and lower than expected take-

-12-
up rates for Food Stamps and Medicaid suggest that welfare leavers still deserve the attention of policymakers.
The findings presented in this report are subject to a few caveats:
• The Cuyahoga leavers study, by design, focuses on single, female parents who head cases that stopped receiving cash assistance for at least two months after exiting welfare. Thus, by definition, the study excludes cases with “partial” exits, or cases in which some members of the case leave and it does not close completely in the period of observation. The study also excludes “child-only” cases and cases headed by males or two parents. Because of these exclusions, it is important to remember the limitations with respect to generalizing finding presented in this report.
• The use of a “two months off welfare” definition provides a conservative estimate of welfare exits. Because of this definition of welfare leavers, findings from this study are not directly comparable with studies that include cases that close for shorter periods.
• As a monitoring study of welfare leavers, the findings presented in this report are best suited to provide program managers and policy administrators with a description of how former recipients are faring after leaving welfare. The findings are useful to assess the extent to which former recipients are employed, whether they are progressing toward economic self-sufficiency, and whether they rely on government assistance to support their transition from welfare to work. The design of the study does not permit causal inferences about the effects of welfare reform on the observed outcomes.
• It is also important to keep in mind that the findings do not necessarily reflect the consequences of reaching the time limit. The study sample is largely made up of voluntary leavers, and no sample members had reached their time limits during the tracking period for this study. It is, however, possible that because Ohio’s three-year time limit is shorter than the five-year limit under TANF, women were influenced by this impending deadline in ways that affected their employment and other behavior.

-13-
Chapter 1
Studying Welfare Leavers
I. Introduction
Welfare caseloads have always been dynamic, with families entering and leaving assistance programs each month. Even before the implementation of the Personal Responsibility and Work Opportunity Reconciliation Act (PRWORA) of 1996, henceforth referred to as welfare reform, families left welfare for a number of reasons, including work and changes in household composition. However, unprecedented declines in welfare caseloads since the passage of welfare reform have led many to raise questions about what the rapid drop in caseloads means for states and families. While the outcomes of welfare reform are being debated on a number of fronts, there is some evidence that suggests that all families leaving welfare are not necessarily economically self-sufficient.1 Such disparate trends have resulted in an increased focus on the circumstances of welfare leavers.
The increased focus on former recipients is also in part due to the recent changes in the federal safety net. Before the passage of welfare reform, the main cash safety net for the poor, Aid to Families with Dependent Children (AFDC), allowed families to stay on welfare for an indefinite period, as long as they remained eligible for benefits. The new legislation imposes lifetime time limits on the number of years that a family can receive welfare.2 The federal time limit is five years, but states are allowed to legislate shorter time limits — as is the case in Ohio — and can exempt up to 20 percent of the caseload from the time limit. As people begin to reach a time limit, their options for returning to welfare diminish, and people leaving welfare in the future may experience greater hardship.
Policymakers and administrators want to know the level of economic well-being of people leaving welfare. They focus their concerns on whether welfare leavers find jobs, whether they are able to keep jobs, and whether they earn enough to raise their families out of poverty. States and localities have responded to these queries by studying former welfare recipients. Findings emerging from these studies are beginning to provide some evidence about post-exit employment, program participation, and well-being and are consistent across studies and with Current Population Survey data.3 Overall, the studies suggest that a majority of leavers are working within six months of leaving welfare and that employment outcomes vary dramatically for voluntary and nonvoluntary leavers. Reports of material well-being are somewhat mixed.
This report summarizes findings for one of the leaver studies funded by the Assistant Secretary for Planning and Evaluation (ASPE) of the Department of Health and Human Services (HHS). Cuyahoga County was one of 14 states and counties selected by ASPE in 1998 to study outcomes of welfare reform on families leaving TANF, who apply for cash assistance but do not
1See Primus et al. (1999). Between 1994 and 1998 welfare receipt dropped by 23 percent, but the average disposable income of the poorest 20 percent of single mothers fell by approximately 8 percent.
2Even before PRWORA, several states were granted federal waivers that allowed them to experiment with new welfare programs and time limits.
3Isaacs and Lyon (2000) and Brauner and Loprest (1999).

-14-
enroll because of diversion or noneligibility, and/or who appear to be eligible but do not enroll. Other grantees funded in 1998 include Arizona, District of Columbia, Florida, Georgia, Illinois, Massachusetts, Missouri, New York, South Carolina, Washington, Wisconsin, Los Angeles County, Cuyahoga County (Ohio), and a consortium of San Mateo, Santa Cruz, and Santa Clara Counties (California).4
The Cuyahoga leavers study focuses on two cohorts of people who left cash assistance: those who left in the third quarter of 1996, referred to as pre-TANF leavers, and those who left in the third quarter of 1998, or post-TANF leavers. This cohort comparison design, using pre- and post-TANF cohorts of leavers, strengthens the study’s ability to interpret information on families leaving welfare at different points in time.5 For example, in the absence of a comparison, it is hard to know whether the findings for the post-TANF leavers are encouraging or discouraging. In other words, without knowing what the employment rates have been for earlier cohorts of leavers, it hard to know whether a 60 percent employment rate is high or low.
As a monitoring and descriptive study, the Cuyahoga study focuses on providing a detailed description of welfare leavers before and after the implementation of welfare reform. Implicit in the overall study agenda are the following research questions:
• Who are the welfare leavers, and what are their background characteristics? How do pre-TANF leavers compare with post-TANF leavers?
• What are the earnings and employment experiences of individuals exiting welfare in 1996 and 1998? Who leaves welfare for work and who does not? How much do they work and where?
• To what extent do leavers return to welfare, and how does welfare recidivism vary for pre- and post-TANF cohorts of leavers? What public and other supports do leavers rely on after they stop receiving cash assistance?
• What is the level of material well-being of former recipients? What are their sources of income? What types of hardship do they experience?
In general, the report focuses on the typical or average outcomes for leavers to demonstrate whether the Cuyahoga data are showing patterns observed in other national and local studies of leavers. However, given that welfare leavers are not a homogeneous group, and that personal and background characteristics have been shown to be indicative of post-exit outcomes, such as employment, earnings, and recidivism, the report tracks outcomes for groups of welfare leavers defined by prior work and welfare history.
This is the final report in the HHS-funded Cuyahoga post-TANF study. An interim report, completed in 1999, described post-exit employment and welfare experiences of those who
4Grantees have worked together to establish common definitions of welfare leavers and selected post-exit
outcomes. Such coordination of methods increases the possibility of cross-state comparability of findings. 5Although the use of a cohort design implies that what preceded welfare reform (the AFDC program)
constitutes the relevant counterfactual, Ohio, similar to other states, had Section 1115 waivers at the time the pre-TANF cohort was selected.

-15-
stopped receiving welfare in quarter 3 of 1996 (or pre-TANF leavers).6 This report builds on the interim report by comparing the experiences of the pre- and post-TANF leavers and also includes data from a follow-up survey with a sample of post-TANF leavers.
While this study does have a fairly broad agenda, it is not designed to evaluate or assess the effects of welfare reform. By definition, to assess the effects of new welfare programs or policy, one needs to interpret the effects relative to a counterfactual or a control group — in other words, relative to a program that existed earlier.7 Many of the leavers studies under way are descriptive or monitoring studies, and their primary objective is to describe the circumstances of people leaving the rolls. Because these studies include only leavers, they cannot report on the effects of welfare reform on people who are discouraged from enrolling. Further, in such descriptive studies, no attempt is made to isolate the effects of causal factors and determine how much of the observed difference between the pre- and post-reform cohorts would have occurred naturally, how much is driven by the strong economy, and how much is due to welfare reform. The studies of welfare leavers, including this one, are best suited to provide program managers and policy administrators with indicators of well-being for the target population intended to be served by the program.
II. Cuyahoga County: Economic and Welfare Context
To interpret the results presented here, it is important to understand the welfare policy context and the regional and local economic climate during the period of this study in Cuyahoga. As mentioned above, although the study is not designed to separate the effects of welfare reform and the economy, each of these forces could be related to the trends observed.
Welfare Context
Cuyahoga County, which encompasses the City of Cleveland, is the largest county in Ohio. It contains about 13 percent of the state’s population and is home to a disproportionate share of the state’s welfare caseload. As shown in Table 1.1, Cuyahoga County represented a little over 25 percent of Ohio’s welfare caseload in 1999. Caseloads in the state and county increased through 1992 and then began to decline, with the state AFDC caseload falling at a faster rate than that of Cuyahoga County.8 Ohio is considered a moderate-grant state, and the typical cash grant is $362 for a single parent with two children.
As Cuyahoga’s welfare caseloads have declined, their characteristics have been changing as well. For example, new entrants to welfare have experienced ever-shortening welfare spells from 1992 while re-entrants to welfare have had longer spells.9 The dynamic nature of the caseload means that exit cohorts in the future may have different compositions, making it difficult to generalize from these two points in time.
6Coulton and Verma (1999). 7National Research Council (1999). 8Caseloads have fallen more slowly in many of the nation’s large cities than in the balance of the states. See
Allen and Kirby (2000). 9Coulton, Verma, and Guo (1996).

-16-
Table 1.1 Cash Assistance Caseloads in Cuyahoga County and State of Ohio:
1989-2000
Cuyahoga County State of Ohio Recipients % Change Recipients % Change
1989 128,214 632,226 1990 125,218 -2.34 626,754 -0.86 1991 125,505 0.23 663,434 5.85 1992 134,357 7.05 747,298 12.64 1993 137,650 2.45 720,476 -3.59 1994 135,680 -1.43 691,099 -4.08 1995 129,797 -4.33 629,719 -8.88 1996 118,882 -8.41 552,304 -12.29 1997 113,860 -4.22 518,595 -6.10 1998 94,121 -17.35 386,239 -25.52 1999 77,074 -18.11 284,482 -26.34 2000 65,331 -15.24 259,023 -8.95 SOURCE: Ohio Department of Job and Family Services counts for January of each year.
Table 1.2 presents key provisions of welfare policy in effect in Ohio during the time period covered by this study. As shown in the table, the two exit cohorts included in the study were exposed to somewhat different policy environments.10 The pre-TANF leavers, or those who left welfare in quarter 3 of 1996, were exposed to OhioFirst, the state welfare reform initiative, which, in some ways, laid the groundwork for the state’s post-TANF legislation. A number of provisions of OhioFirst were implemented under a waiver of AFDC rules from HHS. OhioFirst began on December 1, 1995; provisions that required federal waivers took effect on July 1, 1996, about the time the first cohort of leavers was beginning to leave the rolls. After PRWORA was enacted in August 1996, Ohio submitted a plan to HHS to continue operating its existing initiative, including the approved waivers, with only those changes that were necessary to bring it in line with the federal legislation. As a result of the waivers, it is possible that the pre-TANF leavers were beginning to feel some effect of welfare reform at the time of exit. None of the 1996 leavers had been subjected to the work requirements, sanction policies, or time limit provisions that are currently in effect.
10See Quint et al. (1999) for a full discussion of major changes in the county’s welfare reform agenda and
delivery of services pre- and post-TANF.

-17-
Table 1.2 Key Policy Provisions During the Period of Study
Cuyahoga County
Characteristic
Pre-TANF (Quarter 3 1996 Leavers)
Post-TANF (Quarter 3 1998 Leavers)
Name of state welfare reform initiative
OhioFirst Ohio Works First
Eligibility Earned income disregard
$250 of income earned in month plus 50% of the remainder for first 12 months of employment
$250 of income earned in month plus 50% of the remainder for the duration of the OWF check
Time limits Lifetime limit on cash welfare for most families
None 3 years; after 3 years, a family is ineligible for 24 months; following that, if the county determines that good cause exists, the family may be eligible for an additional 24 months
First recipients reach the time limit
Not applicable October 2000
Welfare-to-work Program focus Human capital development Labor force attachment
Participation Largely voluntary Mandatory; single parents with a child under 6 months of age exempt from participation requirements
Hours per week of participation required for single-parent families
30 30
Sanctions A 3-tier sanction for work program failures, excluding child support
A 3-tier sanction for noncooperation with child support enforcement efforts
Transitional benefits and supports
Transportation support; Emergency Assistance Program to help meet emergent needs
Medical coverage for 1 year; for families who leave welfare because of increased earnings, child care for children under age 13 for 1 year or until income exceeds 150% of the federal poverty level; transportation support; retention and contingency services to help participants meet emergency needs
SOURCES: Cuyahoga Work and Training; Quint et al. (1999).

-18-
The post-TANF leavers, those who left welfare in quarter 3 of 1998, exited welfare when Ohio Works First (OWF), the state’s welfare reform plan, was in effect. OWF, which went into effect on October 1, 1997, about one year before this cohort left welfare, includes a 36-month time limit, and all families on cash assistance are required to engage in work activities, except for the first 12 months following the birth of a child. As shown in Table 1.2, OWF is both more mandatory and more employment-focused than its predecessor. Between 1996 and 1998, Ohio’s earned income disregard also became much more generous by allowing families to earn more and receive benefits for a longer period of time.
Welfare reform in Cuyahoga County has also been accompanied by substantial changes in the organizational structure, administrative arrangements, staff functions, and delivery of services. Probably the most meaningful change from the client’s perspective is that a TANF client now interacts with one case manager on almost all aspects of her case. These case managers assist families with obtaining the services and supports that are necessary to quickly enter the labor market and transition from welfare to work. Prior to October 1997, welfare families in Cuyahoga County could receive welfare-to-work services, but these were provided on referral to a specialized employment worker, and only a small proportion of the caseload could be served.
Economic Context
It is important to recognize that the economic conditions in the county were changing as welfare caseloads continued their downward trend. Table 1.3 shows the employment levels in Cuyahoga County during the period covered by this study. As shown in the table, the economic climate changed between 1996 and 1998, and the 1998 leavers exited welfare in a more favorable economic climate.
Table 1.3
Economic Conditions in Cuyahoga County: 1995-1999
Number Employed Unemployment Rate (%)
1995 639,900 5.01996 641,600 5.11997 648,200 4.91998 643,800 4.51999 649,900 4.6SOURCE: Ohio Department of Job and Family Services labor market information.
Cleveland, like a number of other cities, has experienced a significant amount of job growth over the past decade. Much of this growth, however, is exclusively suburban in nature: with many enterprises relocating to the suburbs and with the development of new manufacturing and service sector jobs in outlying areas, the City of Cleveland is experiencing a positive employment growth rate, but the suburbs are growing at a faster rate. Between 1993 and 1996,

-19-
about the time the pre-TANF leavers exited welfare, the job growth rate was 4.5 percent for the City of Cleveland and 8.4 percent for the rest of the county.11
The suburbanization of jobs in the county adds another layer of complexity to the job of agencies entrusted with the responsibility of helping recipients transition from welfare to work. Close to 70 percent of Cuyahoga’s welfare population reside within the City of Cleveland, which accounts for a smaller share of the region’s entry-level jobs.
III. Welfare Leavers: Definitions and Data
Definitions
This is a study of single, female adult parents who head cases that stopped receiving cash assistance for at least two months in quarter 3 of 1996 and 1998. The majority of ASPE-funded studies have adopted the “two months off welfare” definition of welfare leavers. Because many one-month interruptions in welfare spells are due to administrative reasons, this study excludes all individuals who exited welfare for less than two months. Using “two months off welfare” as a criterion for sample selection provides a conservative estimate of welfare exits and will result in findings that cannot be compared with studies that include cases closed for only one month. Studies that include all cases that close find lower levels of employment and shorter spells off welfare. Male-headed cases were not included owing to their small numbers and the fact that men typically have different labor market experiences than women. Child-only cases were also excluded because they are not subjected to the same work requirements and sanction policies as adults.
To find the women who left cash benefits in quarter 3 of 1996 and quarter 3 of 1998, we began with females aged 18 and over who received AFDC-R in June of each of the years. (AFDC-R is the code for cash assistance to single parents used in Ohio’s public assistance data system.) These recipients were matched with July and August benefit information. Women who received AFDC-R in June but not in July and August, in July but not in August and September, and in August but not in September and October were classified as leavers. (See Table 1.4.) The next step was to identify the children who were in the AFDC cases with these adult leavers in the month prior to exit and to determine whether the children also stopped receiving cash. Cases in which the adult left but at least one child stayed on cash assistance were excluded from the analysis. These definitions resulted in an exit cohort of 2,794 women in 1996 and 3,357 in 1998. Thus, the exit cohorts are made up of all single women and the children in their assistance case in the month prior to exit who stopped receiving cash assistance in either July, August, or September and remained off welfare for the next consecutive month as well.
11Brennan and Hill (1999).

-20-
Table 1.4
Definition of Welfare Leavers: 1996 and 1998 Cuyahoga County
Month Recipient on Cash Assistance Months Recipient off Cash Assistance
June July and August July August and September August September and October
Data
Two types of data are used in this report: (1) longitudinal administrative records data that compare demographic characteristics, employment, and public assistance outcomes for the 1996 and 1998 exit cohorts and (2) follow-up survey data that provide additional detail on a wide range of outcomes for a sample of the 1998 leavers. Through administrative records adults in each exit cohort are followed for four quarters subsequent to the quarter of exit to determine their employment and earnings. The use of public assistance benefits in the 12 months subsequent to the month of exit is examined for the women and their children who left cash assistance.
Administrative records. The monthly income maintenance files (IMFs) supplied by the Ohio Department of Job and Family Services (ODJFS) to Cuyahoga County are the primary administrative data sources for this study. The files are a monthly extract made for each county from the state’s client registration system. IMF tapes were used to identify samples and to track benefits and program use for each assistance group and recipient after exit. The files contain information on AFDC and Food Stamp benefit receipt and Medicaid eligibility along with basic demographic information on recipients. Individuals identified as welfare leavers for this study were tracked for 12 months post-exit to determine whether they returned to cash assistance at any time during the period of observation. The administrative records data were also examined to see if leavers were still receiving Food Stamps or medical assistance after their exit.
Employment information for all adult recipients who left cash assistance was obtained for the four quarters preceding and following the quarter of their exit from ODJFS. ODJFS maintains records of employment and earnings under its unemployment insurance system. Almost all employers in Ohio are covered by this program and report the employment and earnings of their workers to the state. Workers who are self-employed, employed by the federal government, or work “off the books’’ are not in this database.
Administrative records were available for the entire population of welfare leavers in quarter 3 of 1996 and 1998. These two populations are compared in this report on a number of outcomes and characteristics. We do not report tests of statistical significance for these comparisons because populations rather than samples are being compared. Instead, in this report we focus on the size and direction of change from 1996 to 1998. Since only one quarter was studied in each of the years, we cannot determine whether the findings are generalizable to leavers in other quarters.
Follow-up survey. A subcontractor to MDRC administered a 30-minute interview to 306 quarter 3 1998 leavers. The interviews were conducted between September 1999 and April 2000,

-21-
about 14 to 21 months following exit from welfare; close to 50 percent of the survey respondents were interviewed by early December 1999. The interviews were administered primarily by telephone, with in-person interviews for those who could not be reached by phone. Approximately 80 percent of the sample responded to the survey.
Survey findings presented in the body of the report are weighted to compensate for the fact that older recipients with more months on welfare had a higher probability of being selected for the survey. Comparisons of the weighted samples of respondents and nonrespondents indicate little response bias. The Appendix provides a fuller discussion of the data and methods used to conduct the response bias analysis for the survey sample. The Appendix also describes how the weights were calculated for the survey sample.
Contents of the Report
As discussed earlier, this report focuses on a wide range of economic and noneconomic outcomes for individuals who left welfare before and after the implementation of welfare reform. The report uses administrative records data to examine employment, welfare recidivism, and Food Stamp and Medicaid receipt for a period of one year following exit from welfare. Survey data are used to supplement the administrative records analysis and to provide a more detailed picture of income and material well-being in leavers’ households.
The report is organized in five chapters; Chapters 2-5 begin with a summary of key findings. Chapter 2 examines the characteristics of single-parent welfare cases exiting welfare in quarter 3 of 1996 and 1998. Chapter 3 focuses on post-exit employment experiences, job characteristics, and the prevalence of barriers to work. Chapter 4 examines welfare recidivism and the extent to which leavers used other government supports such as Food Stamps and Medicaid in the year following exit. Finally, Chapter 5 details findings from the follow-up survey conducted with the post-TANF (or 1998) leavers and focuses on their income situation and experiences with hardships.

-22-
Chapter 2
Who Leaves Welfare and Why?
Before turning to a full discussion of how individuals fare after leaving welfare, it is important to understand the characteristics of those who leave welfare and why they leave. This chapter draws on survey and administrative records data to address the questions about leavers’ characteristics. The first part of the chapter draws on administrative records to describe selected demographic and other background characteristics of all single women and the children in their assistance case who stopped receiving cash assistance in quarter 3 of 1996 and 1998. The survey, which was conducted with a sample of the 1998 leavers, is used to examine the reasons that individuals exit the welfare rolls.
Findings in Brief
• The exit rates increased between the third quarters of 1996 and 1998. Welfare leavers accounted for 10 percent of the 1996 single-parent caseload and 17 percent of the 1998 caseload.
• Individuals who left welfare in 1998 were somewhat more advantaged with respect to pre-exit employment rates.
• Leavers identified increased income, earnings, or work as the main reasons for leaving welfare. Fewer than 20 percent of the sample left because of a sanction.
I. Characteristics of Pre- and Post-TANF Leavers
The characteristics of the 1996 and 1998 exit cohorts of single women with children are presented in Table 2.1. The characteristics of the single-parent caseload in the month prior to the quarter of exit (that is, June) are also presented in the table. At both points in time, the majority of the women are between ages 20 and 35 and African-American. The majority of the leavers received assistance for more than two of the previous three years. However, most also had at least one quarter of employment experience in the year prior to leaving cash assistance. A comparison of the characteristics of the caseloads and exit cohorts suggests that the chances of leaving welfare were greater in both 1996 and 1998 for white women than for African-American women, for women with fewer children, and for women with shorter welfare histories.
A comparison of the 1996 and 1998 leavers reveals some differences between the two cohorts. First, a comparison of the size of these two exit cohorts suggests that the rate of leaving cash assistance rose between 1996 and 1998. In quarter 3 of 1996, 2,794 single-female-headed families left cash assistance, which constituted approximately 10 percent of the single-female-headed caseload in the quarter. In quarter 3 of 1998, 3,357 single-female-headed families left cash assistance even though the size of the cash welfare caseload in the quarter was appreciably smaller. The exit rate from cash assistance rose to 16.6 percent of the caseload by 1998.
An important question is whether this increased exit rate resulted in a more disadvantaged exit cohort in 1998 than in 1996. When TANF was implemented in 1996, it was

-23-
Quarter 3 Quarter 3June 1996 June 1998
Characteristic 1996 Caseload (Pre-TANF Leavers) 1998 Caseload (Post-TANF Leavers)
Age in month of exit 18 – 19 5.9 5.4 6.3 5.5 20 - 24 24.8 26.5 24.2 26.6 25 – 29 22.8 22.6 23.2 25.2 30 – 34 19.4 17.6 17.7 16.6 35 – 39 14.7 14.9 14.8 14.3 40 or over 12.5 13.0 13.9 11.8
Mean age 29.9 29.9 30.0 29.4Standard deviation 8.08 8.04 8.26 7.79
Number of children 1 41.8 53.2 39.4 45.02 30.3 29.0 29.9 32.03 16.9 12.2 17.7 15.34 or more 11.0 5.6 13.1 7.7
Ethnicity White, non-Hispanic 23.0 28.8 19.4 22.7 African-American 70.9 64.6 75.0 70.3 Hispanic 4.8 5.2 4.6 5.6 Asian, Native American, other 1.1 1.3 1.0 1.5
Months on cash assistance in 3 years prior to exit 1-12 months of prior welfare 11.5 23.1 12.6 20.4 13-24 months of prior welfare 15.2 21.5 16.8 21.7 25-36 months of prior welfare 73.3 55.4 70.7 57.9Mean number of monthson assistance 28.7 23.9 27.9 24.5Standard deviation 10.1 11.6 10.3 11.2
Employment in 4 quarters prior to exit Not employed NA 31.9 NA 21.8 Employed 1 quarter NA 17.4 NA 16.5 Employed 2 quarters NA 14.3 NA 15.2 Employed 3 quarters NA 15.1 NA 17.5 Employed 4 quarters NA 21.2 NA 29.0Median earnings per quarter ($) NA 1,411 NA 1,497
Number of adults 27,729 2,794 20,209 3,357
Leavers as percent of caseload -- 10.1 -- 16.6
SOURCES: Calculations from Ohio income maintenance files and unemployment insurance records.
NOTE: Employment history is not available for the 1996 and 1998 caseloads.
Table 2.1
Selected Background Characteristics of Pre- and Post-TANF Caseloads and Leavers
Cuyahoga County
-24-
assumed that welfare reform would raise exit rates and lower entry rates, thus reducing overall caseloads, a finding that is confirmed in the Cuyahoga study. However, those critical of welfare reform argued that to achieve high exit rates, more people with employment barriers or fewer resources (or the hard-to-serve) would be pushed off welfare than was the case pre-TANF. A comparison of the pre-exit employment patterns in the 1996 and 1998 exit cohorts reveals that rather than being more disadvantaged in terms of employment experience, the 1998 exit cohort is better off. For example, as shown in Table 2.1, the proportion of welfare leavers with no reported employment in the year prior to leaving welfare fell by 10 percentage points. Also, the proportion with steady employment in all four quarters prior to leaving cash assistance rose by more than 8 percentage points. The change in pre-exit employment rates may be a result of the implementation of a work requirement in October 1997 and also of the increased work opportunities produced by the economic growth during the same time period.12
Another indicator of possible disadvantage — the number of months on welfare before exit — did not change appreciably among either the caseload or the welfare leavers between 1996 and 1998. More than half of the leavers in both time periods had spent the majority of the previous three years on welfare, and the proportion with long-term welfare reliance was two points higher in 1998. Increased employment rates combined with similar length of welfare dependency suggest an increasing tendency to combine welfare and work, consistent with enforcement of work requirements and the incentives of the earned income disregard.13
Some of the demographic changes in the leavers’ groups may suggest greater barriers to employment when 1998 and 1996 are compared. For example, African-Americans may experience employment discrimination and, as seen in Table 2.1, their representation in the leavers’ group rose from 64.6 to 70.3 percent. Similarly, having more children may be seen as a labor market disadvantage, and this factor increased between 1996 and 1998. The average age of leavers remained somewhat the same in both cohorts.
In addition to raising concerns about leavers becoming more disadvantaged, welfare reform has raised the possibility that caseloads may become harder to serve. Although work experience information was not available for the caseload as a whole, we can compare 1996 and 1998 caseloads on their months on cash assistance in the previous three years. The two caseloads are similar in this regard. Thus, by 1998 there was no evidence that the caseload was increasingly populated by long-term recipients. Of course, patterns of welfare longevity in the Ohio caseload have changed markedly since October 1997, when the 36-month time limit was put into effect.
To summarize, although exit rates from welfare rose between 1996 and 1998, those leaving welfare in 1998 seemed better prepared to leave welfare for work in that they had more employment experience while on welfare than 1996 leavers. Work requirements and other changes in agency practice that occurred in October 1997 were geared toward exactly this result. Nevertheless, the leavers in 1998, and the caseload in general, still faced the possibility of racial
12Unfortunately, funding did not allow us to obtain employment information for the entire caseload, so it is not
known whether employment rose for the adults in the caseload or only for the leavers. 13Although the assumption of random sampling was not met, we did calculate tests of statistical significance for
the comparisons. For readers who find such tests useful, differences of greater than 3 percent were generally significant at the conventional .05 level. Nevertheless, such a test should not imply that these findings are statistically generalizable beyond the population studied here.

-25-
discrimination and the burden of caring for young children, and these potential employment barriers need to be taken into account.
II. Reasons for Leaving Welfare
Data on administrative reasons for case closings were not available for this study. However, the follow-up survey conducted with the 1998 leavers, which asks sample members to report reasons that they left welfare, provides some clues as to why cases close. It is important to keep in mind that these are self-reported reasons and are not always consistent with the agency’s administrative reasons for case closure.14
Over half the sample (57 percent) said that they left welfare because they got a job or their income or earning made them ineligible. The second most cited reason for leaving welfare was sanction or failure to comply with agency regulations (15 percent of the 1998 leavers). A variety of other reasons were citied as well: for example, changes in family or household composition (for example, youngest child turning 18, marriage, moving in with partner or family), getting benefits from another program, not wanting or needing welfare, or believing the welfare grant was not large enough to justify the hassles. Although no one could have reached a time limit in Cuyahoga during the period of this study, a small number of respondents reported that they left welfare because of reaching the time limit.
While these results are not exactly comparable with other research on reasons for leaving, they do suggest that a fairly high proportion of recipients are leaving cash assistance for work. The National Survey of America’s Families (NSAF) found that 69 percent of the leavers reported work or increased income as a reason for leaving welfare. Investigation of leavers in the Three City Study reveals that about 65 percent of the sample left welfare because of a job or because of higher earnings.15 There is also some evidence that the proportion leaving for work is higher than it was in earlier periods: increased emphasis on work, stronger participation requirements, sanctions, and a robust economy are some of the key factors associated with this trend.
14Coulton et al. (2000) note discrepancies between self-reported and administrative reasons for case closure. In a
recent study of former recipients, 50 percent of the people whose administrative reason for closure was sanction and 60 percent of those whose cases closed for failure to complete redetermination reported that they left welfare because of increased income or earnings.
15Moffit and Roff (2000).

-26-
Chapter 3
From Welfare to Work: Employment Experiences, Job Characteristics, and Barriers to Work
Since a key goal of welfare reform is to reduce welfare dependency by increasing work, it is important to assess the extent to which welfare leavers rely on work and earnings after they leave welfare. Chapter 2 suggests that individuals leaving welfare, both pre- and post-TANF, vary dramatically in terms of their personal characteristics and their pre-exit employment experiences; post-TANF leavers appear to be somewhat less disadvantaged with respect to their pre-exit work history and earnings. This chapter explores the post-exit employment experiences of welfare leavers.
The chapter draws on administrative records for both cohorts and begins by looking at
• the proportion of welfare leavers working in jobs covered by the Ohio unemployment insurance (UI) system in the quarters following the quarter of exit;
• differences in post-exit employment-related outcomes for the 1996 and 1998 exit cohorts;
• the levels of quarterly earnings for those individuals who worked after leaving welfare; and
• the patterns of employment and earnings for subgroups defined by demographic characteristics available through administrative records, prior work history, and welfare history in the three years preceding the exit.
Follow-up survey data are used to supplement the administrative records analysis and to address a number of additional questions related to leavers’ job characteristics and the obstacles to work presented in this group.
Findings in Brief
• Women who left welfare in 1998 were more successful in finding and keeping jobs than were those who left in 1996.
• The 1996 and 1998 leavers generally had low earnings and little earnings growth in their first year off cash assistance, and no improvement was seen in this regard.
• Fewer than half of the leavers worked steadily in the year following exit. Those who did work steadily were not earning enough to move their families above the poverty threshold if they were relying exclusively on their own earnings.
• Women with less than stable work history were more likely to report the presence of multiple barriers to work.

-27-
I. Employment and Earnings
Employment for the 1996 and 1998 cohorts is determined from UI wage records filed by employers with the state. Women are considered employed if they have at least $100 in earnings in the quarter. Median earnings are calculated based on only those women who were employed in the quarter. Medians are reported instead of means because a number of cases had very high earnings. Many of these wage records may have been in error, but there is no way to determine which ones. Medians are not affected by these possibly erroneous extreme values.
Table 3.1 shows employment rates for single female case heads during the four quarters of follow-up, beginning with the first full quarter in which the entire cohort could have been off assistance. Employment rates were about 10 percentage points higher for the 1998 leavers than for the 1996 leavers in all four quarters. For example, in the first quarter after exit, 68 percent of the 1998 exit cohort were employed compared with only 59 percent of the 1996 exit cohort. By the fourth quarter after exit, the employment rates remained higher, at 64 percent according to official wage records, for the 1998 exit cohort. Official wage records typically miss some types of employment such as self-employment and unreported wages paid in cash. Thus, these are lower-bound estimates on employment rates.
Steadiness of employment also rose between 1996 and 1998, as shown in Table 3.1. The proportion of leavers who worked in all four quarters increased from 1996 to 1998. Almost 47 percent of the 1998 exit cohort worked in all four quarters compared with approximately 40 percent of the 1996 cohort. The proportion who were never employed, or worked zero quarters, over the year after exit also fell markedly, from 28 percent in 1996 to 18 percent in 1998.
Table 3.2 shows the median quarterly earnings of those who worked. While employment rates had risen, it appears that the median quarterly earnings for those who were employed declined slightly.16 The cohort differences are not constant across quarters. Earnings in the first quarter after exit were slightly higher for the 1998 leavers than the 1996 leavers. This advantage is reversed by the second, third, and fourth quarters after exit. Median earnings in both exit groups (in 1998 dollars) were about $2,600 per quarter, which is consistent with earning minimum wage or having less than full-time work. Such wages are too low for a single household head to support a typical family above the poverty threshold.
Table 3.2 also shows the proportion of employed leavers who achieved various earnings ranges. Those who earned more than $4,000 are of particular interest because they have a good chance of maintaining a family above the poverty line solely on their own earnings. While the proportion earning above this level varies by quarter, in the fourth quarter after exit approximately 28 percent in both 1996 and 1998 earned more than $4,000.
As welfare leavers gain work experience, there is the expectation that their earnings will rise accordingly. Table 3.3 examines the increases or decreases in earnings experienced by those members of both exit cohorts who worked in at least two quarters. The increases or decreases are calculated by comparing the first and last quarter worked, beginning with the first full quarter after exit. Women were slightly more likely to experience an earnings increase than a decrease
16Earnings for both cohorts are presented in 1998 dollars; the conversion was made using the consumer price
index.

-28-
Quarter 3 Quarter 3
1996 1998Outcome (Pre-TANF Leavers) (Post-TANF Leavers) Difference
Employment (%) 1 quarter after leaving welfare 59.3 68.3 9.0 2 quarters after leaving welfare 54.2 64.1 9.9 3 quarters after leaving welfare 55.8 66.8 11.0 4 quarters after leaving welfare 56.8 64.2 7.4
Quarters worked after exit (%) 0 quarters 28.3 18.3 -10.0 1 quarter after leaving welfare 10.2 9.1 -1.1 2 quarters after leaving welfare 8.9 10.1 1.2 3 quarters after leaving welfare 12.2 15.9 3.7
Number of adult leavers 2,794 3,357
SOURCES: Calculations from Ohio income maintenance files and unemployment insurance records.
Table 3.1
Post-Exit Employment Experience for Pre- and Post-TANF Leavers
Cuyahoga County
4 quarters after leaving welfare 40.3 46.6 6.3
Recipients Who Left Welfare in:

-29-
Table 3.2
Cuyahoga County
Quarter 3 Quarter 3 1996 1998
Outcome (Pre-TANF Leavers) (Post-TANF Leavers) Difference
Median quarterly earnings ($) 1 quarter after leaving welfare 2,685 2,744 59 2 quarters after leaving welfare 2,720 2,489 -231 3 quarters after leaving welfare 2,833 2,663 -170 4 quarters after leaving welfare 2,881 2,754 -127
Quarterly earning ranges (1998 dollars) 1 quarter after leaving welfare (%) $100 – $1,000 21.0 16.7 -4.3 $1,000 – $1,999 17.1 17.9 0.8 $2,000 – $2,999 19.8 20.1 0.3 $3,000 – 3,999 19.5 20.3 0.8 >= $4,000 22.6 24.9 2.3
2 quarters after leaving welfare (%) $100 – $1,000 18.6 20.6 2 $1,000 – $1,999 18.5 19.0 0.5 $2,000 – $2,999 21.2 21.0 -0.2 $3,000 – 3,999 19.0 19.3 0.3 >= $4,000 22.6 20.0 -2.6
3 quarters after leaving welfare (%) $100 – $1,000 20.1 19.1 -1 $1,000 – $1,999 16.9 17.4 0.5 $2,000 – $2,999 18.2 19.1 0.9 $3,000 – 3,999 18.7 19.0 0.3 >= $4,000 26.1 25.4 -0.7
4 quarters after leaving welfare (%) $100 – $1,000 21.6 18.4 -3.2 $1,000 – $1,999 16.1 17.4 1.3 $2,000 – $2,999 15.9 18.1 2.2 $3,000 – 3,999 18.3 18.5 0.2 >= $4,000 28.1 27.5 -0.6
Number of adult leavers 2,794 3,357
SOURCES: Calculations from Ohio income maintenance files and unemployment insurance records.
NOTE: Median earnings are shown for those who were employed.
Post-Exit Earnings and Earnings Growth for Pre- and Post-TANF Leavers
Recipients Who Left Welfare in:

-30-
Table 3.3
Earnings Growth for Pre- and Post-TANF Leavers, by Employment Stability
Cuyahoga County
Quarter 3 Quarter 3
1996 1998Outcome (Pre-TANF Leavers) (Post-TANF Leavers) Difference
Quarterly earnings increases/decreases (%)
Worked in 2 quarters Decrease > $1,000 17.6 25.3 7.7 Decrease $500 - $1,000 14.0 10.3 -3.7 Decrease $100 - $500 8.8 14.4 5.6 Increase or Decrease < $100 11.6 11.2 -0.4 Increase $100 - $500 12.8 12.6 -0.2 Increase $500 - $1,000 15.2 9.7 -5.5 Increase > $1,000 20.0 16.5 -3.5
Worked in 3 quarters Decrease > $1,000 23.7 26.4 2.7 Decrease $500 - $1,000 10.8 7.9 -2.9 Decrease $100 - $500 12.3 11.0 -1.3 Increase or Decrease < $100 8.2 8.2 0 Increase $100 - $500 12.0 9.2 -2.8 Increase $500 - $1,000 10.5 12.2 1.7 Increase > $1,000 22.5 25.1 2.6
Worked in 4 quarters Decrease > $1,000 19.1 22.2 3.1 Decrease $500 - $1,000 10.2 10.5 0.3 Decrease $100 - $500 9.6 11.8 2.2 Increase or Decrease < $100 6.5 6.1 -0.4 Increase $100 - $500 13.6 12.2 -1.4 Increase $500 - $1,000 14.3 12.3 -2 Increase > $1,000 26.7 24.9 -1.8
Number of adults who worked in 2 or more quarters 1,719 2,437Number of adult leavers 2,794 3,357
SOURCES: Calculations from Ohio income maintenance files and unemployment insurance records.
Recipients Who Left Welfare in:

-31-
and, as anticipated, the greatest earnings increases occurred for women who worked in all four quarters. However, there did not seem to be an improvement in earnings trajectories between 1996 and 1998. In fact, the earnings growth pattern was somewhat worse for women who worked in all four quarters in 1998 than in 1996.
Outcomes for Subgroups
The amount of women’s pre-exit work experience and length of time on welfare were used to define subgroups for this analysis. The purpose of examining these subgroups was to determine whether they differed in their employment outcomes and whether the patterns of change from 1996 to 1998 differed by subgroup. In Table 3.4, three employment outcomes are examined by subgroup: the proportion of women employed in the first quarter after exit, the median earnings in the first quarter, and the proportion who were employed in all four quarters after exit.
In the upper part of the table, subgroups are defined by the number of quarters they worked in the year before leaving welfare. Working while on welfare appears to be positively associated with the three employment outcomes examined in this analysis. Employment rates are higher in the first quarter after exit for women who worked more quarters before leaving cash assistance. Also, employment rates improved between 1996 and 1998 for all pre-exit employment subgroups. However, the employment rates tended to improve somewhat more for the subgroups with the shorter pre-exit work histories. These unexpected findings may reflect a ceiling effect in that women who worked the whole year prior to leaving welfare already had very high rates of employment in 1996 so there was little room for improvement.
With respect to earnings, Table 3.4 shows that the amount of pre-exit work experience is associated positively with wages after exit with one exception. Those who worked two quarters prior to exit had lower median earnings than those who worked only one quarter. This pattern appears in both 1996 and 1998. However, inflation-adjusted median earnings generally did not improve between 1996 and 1998 but tended to shrink for some subgroups. Women who were not employed while on welfare were the only subgroup who experienced much increase in earnings from 1996 to 1998. This may reflect the improved economy since this group did not participate in one of the key elements of welfare reform, which was the work requirement. It should also be noted that employment rates in the “no work” group remained fairly low, so those individuals who did work may be a fairly select group in terms of earnings.
An examination of the proportion of each subgroup who worked in all four quarters after exit suggests that those who work while on welfare are better able to hold steady jobs after leaving. For example, more than two-thirds of women who worked in four consecutive quarters before leaving welfare remained employed in all four quarters after leaving cash assistance as well, and this rate was similar in 1996 and 1998. However, the amount of advantage conferred by pre-exit work experience was smaller in 1998 than in 1996. In 1996, women with four quarters of work before exit were four times as likely to be steadily employed as women with no pre-exit employment. By 1998, this advantage was only threefold, owing to the improved employment stability of women who did not work while on welfare. It should be noted that the size of this “no pre-exit employment” group shrunk by 10 percentage points between 1996 and 1998 and may have been particularly affected by the improved economy.

-32-
Table 3.4
Post-Exit Outcomes for Pre- and Post-TANF Leavers, by Work and Welfare History
Cuyahoga County
Quarter 3 Quarter 3
1996 1998Outcome (Pre-TANF Leavers) (Post-TANF Leavers) Difference
Previous work experience subgroupsEmployed in 1st quarter after exit (%) No work in previous 4 quarters 29.4 35.2 5.8 Work in 1 previous quarter 61.6 63.9 2.3 Work in 2 previous quarters 65.3 73.9 8.6 Work in 3 previous quarters 75.7 75.9 0.2 Work in 4 previous quarters 87.0 88.1 1.1
Median earnings in 1st quarter after exit No work in previous 4 quarters 1,724 2,186 462 Work in 1 previous quarter 2,677 2,647 -30 Work in 2 previous quarters 2,487 2,478 -9 Work in 3 previous quarters 2,822 2,866 44 Work in 4 previous quarters 3,238 3,041 -197
Employed in all 4 quarters after exit (%) No work in previous 4 quarters 16.0 20.1 4.1 Work in 1 previous quarter 39.6 40.4 0.8 Work in 2 previous quarters 42.0 45.9 3.9 Work in 3 previous quarters 53.4 54.3 0.9 Work in 4 previous quarters 67.1 65.6 -1.5
Prior welfare receipt subgroupsEmployed in 1st quarter after exit (%) 1 - 12 months of prior welfare receipt 55.9 66.9 11.0 13 - 24 months of prior welfare receipt 64.9 71.2 6.3 25 - 36 months of prior welfare receipt 58.6 67.7 9.1
Median earnings in 1st quarter after exit 1 - 12 months of prior welfare receipt 2,942 3,218 276 13 - 24 months of prior welfare receipt 2,897 2,911 14 25 - 36 months of prior welfare receipt 2,553 2,596 43
Employed in all 4 quarters after exit 1 - 12 months of prior welfare receipt 40.4 48.1 7.7 13 - 24 months of prior welfare receipt 45.6 48.2 2.6 25 - 36 months of prior welfare receipt 38.3 45.4 7.1
Number of adult leavers 2,794 3,357
SOURCES: Calculations from Ohio income maintenance files and unemployment insurance records.
Recipients Who Left Welfare in:

-33-
The lower part of Table 3.4 examines earnings and employment outcomes for subgroups defined by welfare receipt in the 36 months prior to exit. Respondents were grouped into categories ranging from short-term (1-12 months) to long-term welfare dependence (25 to 36 months). It appears that employment rates, earnings, and duration of employment rose between 1996 and 1998 for all subgroups, but particularly for the short-duration group. A possible explanation for this pattern is that welfare reform in its initial phases focused on people who were enrolling in the program or coming into the agency for redetermination. Thus, women with shorter spells may have received greater exposure to the new emphasis on employment in the agency’s message and services. It should also be noted that the effect of welfare duration on employment rates is not linear. In both years the employment rates are somewhat lower for women with short durations than for those with moderate durations. The effect of welfare duration on median earnings and steadiness of employment is linear for the most part.
II. Job Characteristics and Child Care
Up to this point, the chapter has focused primarily on comparing employment rates and earnings for the pre- and post-exit welfare reform leavers. The analysis relied exclusively on administrative records and provides little information on the kinds of jobs that leavers take, their hourly earnings, or other job characteristics. This section turns to the follow-up survey to provide a more detailed picture of leavers’ jobs. As mentioned earlier, the follow-up survey was conducted with a sample of the 1998 leavers only, precluding any comparisons between the job characteristics of the 1996 and 1998 cohorts.
Employment rates found in surveys tend to be higher than those based on official wage records because respondents include some jobs that are not reported to state UI programs. The follow-up survey shows that almost 92 percent of the TANF leavers reported working at some point since their benefits ended in quarter 3 of 1998.17 Eighty-seven percent of this group reported working in a “regular” job, and the remaining 4 percent indicated that they had worked “off the books” during the period. Seventy percent of survey sample members were working in the month preceding the interview, with about 11 percent working at more than one job.
Table 3.5 presents selected characteristics of the current or most recent job held by former recipients who worked at some point since they left welfare in 1998. In general, employed former TANF recipients worked an average of 35 hours a week. Over three-fourths of those working in the month prior to the survey interview were working full time (30 hours per week or more). About 22 percent of the working respondents worked in regular evening and night shifts.
An important indicator of job quality is the availability of employer-provided benefits such as health insurance, vacation days, and investment in education and training. Table 3.5 shows the extent to which respondents received these benefits in their current or most recent job. Fifty-eight percent reported that that their employer provided health insurance coverage; however, only 47 percent of those offered coverage reported that they were actually enrolled in
17Also keep in mind that the survey was conducted between 14 and 21 months after people left welfare in 1998. The administrative records employment rates are based on four quarters of post-exit follow-up. Thus, the survey- and UI-based measures of employment are not exactly comparable.

-34-
All EmployedOutcome Leavers
Average number of hours worked per week 35.1Works full time (%) 78.7Works part time (%) 21.3
Average earnings per hour a ($) 7.50Average earnings per week a ($) 264.30
Employer-provided benefits (%)Job has sick/personal days with pay 50.0Job has paid vacation 63.0Job has health/medical insurance for respondent 58.4
Among those whose job has insurance, enrolled in job health plan (%) 46.6
Work schedule (%) Regular daytime shift 55.6 Regular evening 15.0 Regular night shift 7.2 Other (irregular, rotating, or split shift) 22.2
Commutes to work (%) Average commute (minutes) 26.4 Drives own car 33.6 Drives someone else’s car 8.7 Gets a ride with someone 13.1 Uses public transportation 40.7 Walks 6.5 Works at home 3.2 Sample size 306
SOURCE: Calculations from the follow-up survey.
Selected Characteristics of Current or Most Recent Job for Post-TANF Leavers
Cuyahoga County
Table 3.5
a Earnings were computed from other survey items. Therefore, outlying wages may be due to inconsistent responses to the components of the wage variable. For example, survey respondents can report their earnings annually, monthly, biweekly, weekly, daily, or hourly. They are then asked to provide a wage amount. Hourly wage is based on these components. Wages over $28 per hour were excluded from this analysis.

-35-
the employer’s health plan; not being eligible for health coverage or not being able to afford it were the primary reasons for not accessing employer-provided health benefits.
Employed respondents earned an average of $7.50 an hour. The median hourly wage was $7, and close to 23 percent of those who worked reported earning below the minimum wage. About 12 percent reported earning above $10 an hour.
Although not shown in the table, the current or most recent jobs held by the survey respondents are concentrated in service and retail industries with a greater number of entry-level jobs. Those in administrative and support staff jobs were likely to be earning higher hourly wages ($10 on average) and more likely to be in jobs that provided health insurance coverage.
Since the typical leaver in this study is a young woman with at least one child and most leavers were leaving welfare for work, the post-TANF survey asked a series of questions about child care, particularly as it relates to some or all of the children in the household. Although child care problems pose a barrier to work for some leavers, the discussion in this section focuses on the child care arrangements and the help that families receive to provide child care.
Table 3.6 presents information on child care arrangements for households with children. Of the 306 survey respondents, 234 were living with a child or grandchild under age 13. Thirty-four percent of this group indicated that they had received some form of assistance from a government agency or other source to pay for child care costs since they had left welfare. Twenty-five percent of the sample members were receiving help with child care payments at the time of the survey interview. Respondents who had worked in the first four quarters after exit were more likely to have received some assistance with child care payments. The survey also examined whether children in this age group tended to care for themselves as a result of their mother’s employment-related activities. Thirteen percent of the households with a child under age 13 reported that their children had taken care of themselves on a regular basis. Reports of unsupervised care were higher for leavers who had worked steadily in the first four quarters after exit than for those with less steady employment during the same period (17 versus 11 percent).
Given the relatively high levels of employment among the leavers, it is surprising that only about one-third of those off welfare had received some form of help with child care payments since the time they left welfare. It is unclear from this analysis whether employed leavers are aware of their eligibility for child care services under Ohio Works First. Further, this study cannot tell whether families are having trouble finding quality child care or whether they are opting to rely on informal help (that is, relatives and other family members) to care for their children. Clearly, a small proportion of welfare leavers’ children are taking care of themselves, which raises questions about safety and concerns about unsupervised care for these children.
III. Barriers to Work
To what extent do former recipients report major barriers to work? Existing research has identified several characteristics that present significant barriers to work among low-income mothers. Zedlewski (1999), for example, identifies six obstacles to work among welfare recipients: less than a high school education, no work experience and no employment in last three years, responsibility for a child under age 1, responsibility for a child receiving

-36-
Worked 1-3 Worked 4Quarters Quarters
Outcome All Leavers Post-Exit Post-Exit
Any child under age 13 a
Received help for paying child care costs (since benefits ended) (%) 33.6 23.7 43.8
Currently receiving any help for paying child care costs (%) 25.2 14.6 34.4
Some or all children take care of themselves on a regular basis, even for small amounts of time 13.2 11.3 17.3
Sample Size 234 66 129
SOURCE: Calculations from the follow-up survey.
NOTE: a This analysis applies to 234 respondents with at least one child under age 13.
Table 3.6
Child Care Arrangements, by Post-Exit Employment
Cuyahoga County

-37-
Supplemental Security Income (SSI), poor physical and mental heath, and limited English language proficiency. Danziger et al. (2000) identify 14 barriers that could impede recipients’ transition from welfare to work. Grouped into a number of domains, the barriers include: low education, work experience, jobs skills, and workplace norms; perceived discrimination; transportation problems; psychiatric disorders and substance abuse; physical health problems; and domestic violence.
In this study, we examine the prevalence of five potential barriers to work: lack of high school education, no employment in the year prior to exit, a physical or mental condition limiting work for the respondent, a child health problem, and general child care problems. Table 3.7 shows the prevalence of these barriers among the survey sample. The column labeled “all leavers” shows the proportion of the survey sample reporting a barrier. Several interesting findings emerge. Although high levels of employment are evident among the leavers in this study, a large number of survey respondents reported the presence of individual and family characteristics that present significant challenges to work. Overall, 38 percent of all leavers had less than a high school education (compared with 13 percent of the national female population aged 18-54); 19 percent had not worked in the year prior to leaving welfare; and 22 percent experienced child care problems.
Prevalence of barriers is also shown in the table for sample members who did not work in the year after leaving welfare, worked in one to three quarters, or worked in all four quarters after exit. When post-exit work status is taken into account, it appears that former recipients who had worked steadily after leaving welfare were less likely to report the barriers examined here. Individuals who did not work in the follow-up period were more likely to indicate the presence of a physical or mental condition that limited their ability to engage in work or education-related activities. Child care problems also appear to be a prominent concern for those who did not work or those with less steady employment in the first four quarters after leaving welfare.
Research suggests that having more than one barrier could present greater challenges to getting and keeping employment than the presence of any single barrier. For example, the lack of a high school diploma by itself may not constitute a barrier to work, but the presence of multiple problems reduces the opportunities for employment. Table 3.7 shows the proportion of former recipients reporting none, one, or two or more of the five barriers to work examined here. Consistent with other research, multiple barriers are common among former recipients: 63 percent of the survey sample reported having at least one barrier. Respondents who worked in all four quarters were less likely to report a barrier to work, and those who did not work in the period of analysis were more likely to report multiple barriers. These findings of prevalence of barriers have implications for service delivery as well as raise concerns about the employment prospects of former recipients faced with these conditions.

-38-
Worked 1-3 Worked 4All Did Not Work Quarters Quarters
Barriers to Work Leavers Post-Exit Post-Exit Post-Exit
38.0 40.0 49.1 31.0
18.8 52.2 18.9 8.5
Respondent with physical or mental conditionthat limits kind or amount of work,or education (%) 15.4 32.2 13.4 11.3
Child health problems:ill, disabled, or has condition that limitsrespondent from working (%) 16.4 11.5 19.1 16.1
Child care problems (%) 21.5 32.6 31.6 12.8
Multiple barriers (%) None 37.0 17.1 27.7 48.6
1 32.3 29.6 35.1 31.6 2 or more 30.6 53.3 37.2 19.9
Sample size 306 55 86 165
SOURCE: Calculations from the follow-up survey.
Less than a high school education (%)
Did not work in year prior to benefit termination (%)
Table 3.7
Barriers to Work for Post-TANF Leavers, by Post-Exit Employment
Cuyahoga County

-39-
Chapter 4
Welfare Recidivism and Food Stamp and Medicaid Receipt
An important marker of a weak or unsuccessful transition off welfare is a return to welfare. The existing literature on welfare dynamics suggests that a number of factors influence how long former recipients are able to stay off welfare and that the extent of dependence on the welfare system is highly correlated with individual, family, and community characteristics. Characteristics such as a recipient’s education level, work history, physical and health status, and access to networks are all factors shown to be associated with welfare dependence. Individuals with the greatest barriers to employment are considered most likely to return to welfare after relatively short spells off welfare.
The analysis presented in Chapter 2 raises some questions about leavers’ use of public assistance following exit. For example, fewer than half of the pre- and post-TANF leavers worked steadily in the year after exiting welfare; further, a significant proportion of both groups did not work at all during the follow-up period. This chapter examines the rate at which former recipients return to cash assistance within a year of leaving welfare and how long, on average, they stay off assistance. Patterns of Food Stamp receipt and Medicaid coverage for these groups are examined as well. Whether program participation varies for subgroups defined by prior work and welfare is also explored.
Findings in Brief
• Welfare recidivism rates remained nearly the same between 1996 and 1998. For both pre- and post-TANF leavers, roughly 35 percent of the sample returned to welfare within one year of exit.
• There was a marked increase between 1996 and 1998 in Food Stamp and Medicaid participation rates in the month after exit and at the 12-month follow-up point. However, participation rates decline over time for both cohorts, and the rates seem relatively low on the basis of the earnings reported for these groups.
I. Welfare Recidivism
The number and proportion of adult leavers who subsequently returned to welfare are shown in Table 4.1. In each of the four quarters after exit, individuals are counted as receiving assistance if they were active recipients for at least one month in the quarter. It is important to note that Cuyahoga defines leavers as those who left cash assistance for two consecutive months. Thus, individuals who returned after their first month off are not included in the study. Recidivism rates would be higher if the study population included one-month exits.
Table 4.1 shows that rates of return to welfare in the quarter after exit were about 20 percent for both the 1996 and 1998 exit cohorts. However, the return rates for quarters 2-4 were slightly lower in 1998 than in 1996. When welfare receipt for all four quarters after the quarter of exit is examined, nearly 62 percent of the women remained off welfare during the full four

-40-
Table 4.1
Welfare Receipt in Four Quarters After Exit for Pre- and Post-TANF Leavers
Cuyahoga County
Quarter 3 Quarter 3
1996 1998Outcome (Pre-TANF Leavers) (Post-TANF Leavers) DifferenceReceiving cash assistance (%) 1 quarter after leaving welfare 20.4 21.1 0.7 2 quarters after leaving welfare 27.5 24.3 -3.2 3 quarters after leaving welfare 29.6 25.3 -4.3 4 quarters after leaving welfare 28.7 24.9 -3.8
Ever received cash assistance, quarters 1-4 post-exit (%)
Number of adult leavers 2,794 3,357
SOURCE: Calculations from Ohio income maintenance files.
37.4 38.1 0.7
Recipients Who Left Welfare in:

-41-
quarters of follow-up in both cohorts. The fact that point-in-time recidivism rates fell while “ever back on welfare” rates stayed the same indicates that welfare spells were somewhat shorter in 1998 than in 1996. It should be noted that no women in these cohorts had reached their welfare time limit, which is three years in Ohio. Once individuals have used 36 months of benefits, they will not be able to return to cash assistance in the future, suggesting that recidivism rates should fall even further.
Table 4.2 examines post-exit employment differences between adults who remained off welfare for 12 consecutive months and those who returned to welfare for at least one month during the 12-month period. In this analysis the 12-month period begins for each study subject with her first month off welfare and ends after 12 months have elapsed. Thus, a person whose first month off welfare was July 1996 was classified as not returning to welfare if she were off every month through June 1997. Interestingly, the proportion never employed is about the same in both groups. Possibly women who were not employed remained off welfare because they were working outside the mainstream employment system, were supported by husbands or other family members, or had moved to another area. The most obvious difference between the two groups is in the proportion employed in all four quarters: twice as many nonreturnees as returnees. There are some differences in the findings for the 1996 and 1998 exit cohorts. The proportion of women never employed fell for both the returnees and the nonreturnees. The most notable difference between 1996 and 1998 is in the proportion of individuals who did not return to welfare and maintained steady employment: almost 55 percent of women who stayed off welfare for a year were employed in all four quarters in 1998. Contrary to the positive employment trends, median quarterly earnings for women staying off welfare declined from 1996 to 1998. An additional important finding is that the proportion of women who stayed off welfare but received Medicaid and Food Stamps rose by approximately 20 percentage points between 1996 and 1998. This suggests that these programs are important for meeting basic needs of families who stay off of cash assistance, because their earnings are very low.
Although reasons for leaving cash assistance could not be ascertained using agency administrative records, the follow-up survey provides some insights into why people returned to welfare within a year of leaving. The survey allowed respondents to provide more than one reason for returning to cash assistance, and the most commonly reported reasons were being unemployed (32.0 percent), income being too low or needing the money (10.4 percent), and changes in family composition (14.4 percent).
Table 4.3 examines recidivism rates for subgroups based on their pre-exit employment and welfare history. The subgroups are defined by the number of pre-exit employment quarters in the previous year and the number of 36 months pre-exit that they had spent on welfare. The focus of this table differs from Table 4.2, which examined post-exit outcomes. As shown in Table 4.3, recidivism rates were generally higher for women with two or three quarters of pre-exit work experience than for women with no work experience or four quarters of work experience. This puzzling finding is consistent with the marginal position that these women occupy in the labor market, frequently necessitating returns to welfare while working on and off. Longer pre-exit welfare durations show the expected, linear relationship with recidivism rates.
With a few exceptions, recidivism rates were lower in 1998 than in 1996 for all subgroups. The exceptions were for women with little work experience while on welfare and for those with a previous welfare spell of one year or less. It is possible that in 1998 the nonworking

-42-
Table 4.2
Characteristics of Those Who Did/Did Not Return to Cash Assistance
Cuyahoga County
Quarter 3 Quarter 3
1996 1998Outcome (Pre-TANF Leavers) (Post-TANF Leavers) Difference
Adult leavers returning to cash assistance Never employed (%) 26.6 18.2 -8.4 Employed 1 quarter (%) 15.1 13.8 -1.3 Employed 2 quarters (%) 13.3 16.3 3 Employed 3 quarters (%) 16.3 20.4 4.1 Employed 4 quarters (%) 28.6 31.3 2.7 Median quarterly earnings ($) 1,487 1,553 66 Ever on Food Stamps (%) 98.8 98.4 -0.4 Ever on Medicaid (%) 99.9 98.2 -1.7Total number of adults returning 985 1,188
Adult leavers not returning to cash assistance Never employed (%) 29.2 18.3 -10.9 Employed 1 quarter (%) 7.5 6.6 -0.9 Employed 2 quarters (% 6.6 6.7 0.1 Employed 3 quarters (%) 10.0 13.5 3.5 Employed 4 quarters (%) 46.7 54.9 8.2 Median quarterly earnings ($) 3,023 2,921 -102 Ever on Food Stamps (%) 34.7 51.6 16.9 Ever on Medicaid (%) 31.0 53.3 22.3Total number of adults not returning 1,809 2,169
Total number of adult leavers 2,794 3,357
SOURCES: Calculations from Ohio income maintenance files and unemployment insurance records.
NOTE: Median earnings are presented for those who were employed during the follow-up period.
Recipients Who Left Welfare in:

-43-
Table 4.3
Recidivism Rates, by Prior Employment and Welfare History
Cuyahoga County
Quarter 3 Quarter 3
1996 1998Outcome (Pre-TANF Leavers) (Post-TANF Leavers) Difference
Returning to cash assistance within one year (%) No work previous four quarters 28.7 29.7 1.0 Work 1 previous quarter 39.2 40.6 1.4 Work 2 previous quarters 42.8 41.2 -1.6 Work 3 previous quarters 44.9 40.3 -3.6 Work 4 previous quarters 37.3 34.6 -2.7
Returning to cash assistance within one year (%) 1 - 12 months of prior welfare receipt 25.9 27.0 1.1 13 - 24 months of prior welfare receipt 37.4 35.8 -1.6 25 - 36 months of prior welfare receipt 41.1 40.5 -0.6
Number of adult leavers 2,794 3,357
SOURCES: Calculations from Ohio income maintenance files and unemployment insurance records.
Recipients Who Left Welfare in:
Prior welfare history subgroups
Prior work history subgroups

-44-
or short-staying recipients experienced sanctions or other influences that made them leave cash assistance before they were ready, thus making them more likely to return to TANF within the year.
II. Food Stamp and Medicaid Receipt
Welfare leavers are eligible for noncash assistance to help support their transition off welfare. To a large extent, these benefits are available to those who qualify because of low income. Important questions for public policy arise around the extent to which low-income families rely on these transition supports and the role that these noncash supports play in helping people transition off welfare. We examine the use of two such government supports: Food Stamps and Medicaid. Although a number of other government benefits are available for former recipients (housing assistance, child care, transportation costs, work expenses, and more), our analysis is restricted to studying government supports for which complete data were easily available.
With the implementation of PRWORA, ties between cash assistance and Medicaid have been severed, and receiving cash assistance is no longer a requirement for medical assistance. Although Food Stamp receipt was not officially tied to cash assistance, both programs were administered by the same entity, thus resulting in confusion about eligibility for the Food Stamp benefits. There is growing evidence from national and local welfare studies that participation in Food Stamp and Medicaid programs has dropped dramatically since welfare reform was implemented. Although families with income below 130 percent of poverty are eligible for some Food Stamp receipt, there is growing evidence that former recipients with income below the poverty level are not utilizing these benefits. The maximum Food Stamp benefit for a single parent receiving a minimum wage is $260, making Food Stamps a significant income supplement for families transitioning from welfare to work.18
Welfare recipients leaving cash assistance can keep their medical assistance through several specific Medicaid programs. Families whose income is very low are eligible in Ohio for the Low-Income Family (LIF) Medicaid program, which has no time limit. Transitional Medicaid benefits are available for one year after leaving welfare to other families who would not be eligible for LIF Medicaid. Children are eligible for Healthy Start even when their family income exceeds the LIF threshold of below 200 percent of poverty. A small number of welfare leavers who move to disability programs are eligible for Medicaid for the disabled.
Table 4.4 shows Cuyahoga County leavers’ retention of Food Stamp and Medicaid benefits in the four quarters after exit. Overall, the proportion of leavers retaining Food Stamps or Medicaid increased by more than 10 percentage points from 1996 to 1998.19 In 1998, 56 percent of adults kept their Food Stamp benefits in the first quarter after leaving cash assistance and 60 percent kept their Medicaid coverage. Although the increase in retention of benefits is in a positive direction, participation in both programs is lower than would be expected given the
18Zedlewski and Brauner (1999). 19Cancian et al. (2000) also found an increase in the take-up rates of Food Stamps and Medicaid between the
1995 and 1997 cohorts of welfare leavers. However, consistent with the Cuyahoga analysis, they show a steady decline in the proportion of the leavers’ cohorts receiving Food Stamps or Medicaid over time.

-45-
Quarter 3 Quarter 3
1996 1998Outcome (Pre-TANF Leavers) (Post-TANF Leavers) Difference
Food Stamp receipt (%) 1 quarter after leaving welfare 42.5 55.6 13.1 2 quarters after leaving welfare 42.2 48.0 5.8 3 quarters after leaving welfare 41.2 48.3 7.1 4 quarters after leaving welfare 39.4 47.0 7.6
Ever received Food Stamps, quarters 1-4 55.4 67.8 12.4
Medicaid receipt (%) 1 quarter after leaving welfare 41.4 60.4 19 2 quarters after leaving welfare 41.7 55.0 13.3 3 quarters after leaving welfare 39.6 50.0 10.4 4 quarters after leaving welfare 37.7 45.5 7.8
Ever received Medicaid, quarters 1-4 54.4 69.6 15.2
Number of adult leavers 2,794 3,357
SOURCES: Calculations from Ohio income maintenance files.
Table 4.4
Post-Exit Food Stamp and Medicaid Receipt for Pre- and Post-TANF Leavers
Cuyahoga County
Recipients Who Left Welfare in:

-46-
low earnings of the welfare leavers. Also, Medicaid and Food Stamp rates fell over the four quarters post-exit.
Table 4.5 shows Food Stamp and Medicaid participation for women and children in the first and the last months of follow-up. There was a marked increase between 1996 and 1998 in Food Stamp and Medicaid participation rates in the month after exit from cash welfare. However, by the end of the follow-up period (or 12 months after exit), less than 15 percent of the leavers received Food Stamps and Medicaid. In general, children participated in both programs at a somewhat higher rate than the adults on their case.
While this report does not examine specific reasons why former recipients are going without Food Stamps or Medicaid coverage, some research suggests that people who are eligible for benefits are not getting them.20 For example, previous research in Cuyahoga County has shown that many families who lose their Medicaid and Food Stamp benefits left cash assistance because they did not complete their six-month redetermination application for welfare benefits; further, the majority of leavers were working in low-paying jobs (which were less likely to provide health benefits or raise these families out of poverty) and about 57 percent of them were receiving Food Stamps as well as Medicaid.21 At the time this study was conducted, failure to complete redetermination often resulted in the automatic ending of Medicaid and Food Stamp benefits as well. Even though the Food Stamp and Medicaid programs have been separated in policy, in practice and in the minds of participants they were tied together through the administrative procedures. Since this study was done, Ohio has reinstated many of the families who were cut off Medicaid when they lost cash assistance. It is anticipated that as administrative problems continue to be resolved, rates of keeping Medicaid and Food Stamp benefits will rise.
20See Quint and Widom (2001); Polit, London, and Martinez (2000). 21Coulton et al. (2000).

-47-
Quarter 3 Quarter 31996 1998
Outcome (Pre-TANF Leavers) (Post-TANF Leavers) Difference
Adult leavers 1st month after exit (%) Neither Food Stamps nor Medicaid 65.7 48.5 -17.2 Food Stamps only 10.4 7.1 -3.3 Medicaid only 9.0 13.8 4.8 Both Food Stamps and Medicaid 14.9 30.5 15.6
Adult leavers 12 months after exit (%) Neither Food Stamps nor Medicaid 80.7 64.5 -16.2 Food Stamps only 7.4 9.4 2.0 Medicaid only 5.5 11.4 5.9 Both Food Stamps and Medicaid 6.5 14.6 8.1
Children of leavers 1st month after exit (%) Neither Food Stamps nor Medicaid 67.3 45.9 -21.4 Food Stamps only 3.1 0.9 -2.2 Medicaid only 8.7 10.3 1.6 Both Food Stamps and Medicaid 20.9 43.0 22.1
Children of leavers 12 months after exit (%) Neither Food Stamps nor Medicaid 84.1 54.2 -29.9 Food Stamps only 1.7 0.6 -1.1 Medicaid only 6.5 18.0 11.5 Both Food Stamps and Medicaid 7.7 27.2 19.5
Number of adult leavers 2,794 3,357
SOURCES: Calculations from Ohio income maintenance files and unemployment insurance records.
Table 4.5
Post-Exit Food Stamp and Medicaid Participation for Adults and Children
Cuyahoga County
Recipients Who Left Welfare in:

-48-
Chapter 5
Income and Well-Being
This chapter draws on the post-TANF follow-up survey data to examine a range of outcomes that could not be assessed with administrative records. The survey provides a fairly comprehensive picture of household income and poverty; it also provides an opportunity to examine a range of measures of family well-being, including information about housing and neighborhood quality, material hardships, food insecurity, and the use of various supports.
As noted in the introduction to this report, the follow-up survey was administered to 306 individuals — 80 percent of the sample who were contacted for the survey — who stopped receiving cash assistance in quarter 3 of 1998; the 1996 leavers were not surveyed as part of this study. The survey interviews were conducted approximately 14 to 21 months after sample members exited welfare, providing somewhat longer-term follow-up than the administrative records analysis for this group of leavers. Analyses presented here are cross-sectional depictions of the economic circumstances of a later cohort of leavers. As the survey data were gathered before any time limits were imposed in Ohio, the findings offer limited information about how welfare reform (and time limits, for example) might affect the well-being of former recipients.
The questions addressed in this section include:
• What is the level of economic well-being of former recipients? What was their total family income in the month prior to the interview, including both the respondents’ own income and the income of other adults in the household? What are their income sources?
• What types of hardship do respondents experience after leaving welfare? Do people experience multiple hardships?
Findings in Brief
• Transitioning off welfare is not the same as leaving poverty. Fifty-seven percent of the households in which former recipients live have incomes that fall below the poverty threshold.
• Reports of material hardship and use of other supports (such as Food Stamps, Medicaid, and Housing Assistance) are higher among those with less stable or no work history.
I. Income and Poverty
To better understand income and income sources available to former recipients, the follow-up survey asked sample members to report their families’ income from all sources in the month prior to the survey interview. Table 5.1 presents income information for both respondents and other adults in the household. As shown in the table, the average monthly household income for the leavers is $1,169, or about $14,028 annually. Total household income includes earnings, TANF benefits, the dollar value of Food Stamp benefits, child support payments, Earned Income

-49-
Table 5.1
Income and Income Sources for Post-TANF Leavers
Cuyahoga County
Quarter 31998 Leavers
Characteristics (Post-TANF)
Household income ($) 1,169
Distribution of total monthly household income (%)$0 4.8$1-$999 38.2$1,000-$1,999 42.7$2,000-$2,999 10.4$3,000 or more 4.0
Income from earnings (%) 60.7
Average respondent income ($)
Total income 907Earnings 669TANF 56Food Stamps 94Child support 24SSI payments 25Outside family 27Other 12
Average income from others in the household ($)
Total income 262Earnings 198TANF 13Food Stamps 6Child support 0SSI payments 33Outside family 5Other 8
Sample size 306
SOURCE: Calculations from the follow-up survey.
NOTE: Respondents with nonmissing information on the income-related questions were included in this analysis. Of the 306 respondents, 271 provided complete, and valid, information.

-50-
Credit (EIC) refunds, Supplemental Security Income (SSI), and other income attributed to the respondent and other adults in the household.22 Close to 45 percent of the welfare leavers were residing in households where the average monthly income was under $1,000.
Table 5.1 also presents information on income attributable to the respondent and to other adults in the household. Earnings were a prominent source of income for welfare leavers, accounting for nearly 61 percent of their total income. Thirty-five percent of the leavers lived with other income-generating adults. A fairly significant portion of household income — about 25 percent — comes from income received by other household members (most of which is from earnings rather than welfare receipt). Thus, the contributions of other household members are critical to the income support for leaver households.23 Table 5.2 shows the proportion of respondents and other adults in the household reporting the income sources examined here.
Respondents’ total household income in the month prior to the interview is compared with the U.S. poverty threshold for their family size to estimate the poverty rate for leavers. The poverty threshold for a family of three in 1999 was $13,880. An estimated 57 percent of the families leaving cash assistance were living in households with incomes below the poverty threshold. About 21 percent were living above 150 percent of the poverty level. These poverty calculations are based on total household income, and poverty rates would be much higher if leavers’ households were solely reliant on the respondents’ earnings for support. When families at different levels of poverty are compared on their sources of income, it appears that families with income below the poverty level were more likely to have returned to welfare and were relying more heavily on public assistance than on work (see Figure 5.1).
Local and national studies of welfare leavers have shown that former recipients rely on a number of government programs and supports to get by. Cuyahoga follow-up survey respondents were asked to report whether they received the following supports: Food Stamps, Medicaid, Housing Assistance, child support, SSI, and food from soup kitchens or charitable agencies. At least 72 percent of the respondents indicated that they had received at least one of these since leaving welfare.
Figure 5.2 examines reliance on support services by the length of time that respondents stayed off welfare during the study’s follow-up period. Respondents were classified into two groups: those who remained off welfare during the follow-up period, approximately an 18-month period since the last benefit, and those who had returned to welfare during the follow-up period. As shown in the figure, the two groups differ with respect to their reliance on the supports examined here. Those who remained off welfare relied less on these support services; further, they were more likely to report that they were receiving child support. In comparison, respondents who returned to welfare were more likely to have relied on public and private supports. While there are clear differences in use of programs that are designed by the government to support leavers’ transition off welfare, this study cannot determine whether people are not using the programs because they are ineligible for them or because they do not want them or because they do not know about them.
22Income was calculated for all respondents with nonmissing and within-range responses to each component of
income. Because of missing or partial data, income was calculated for 271 of the 306 respondents. 23At the time of the follow-up survey interview, 47 percent of the sample lived in households that had other
adults.
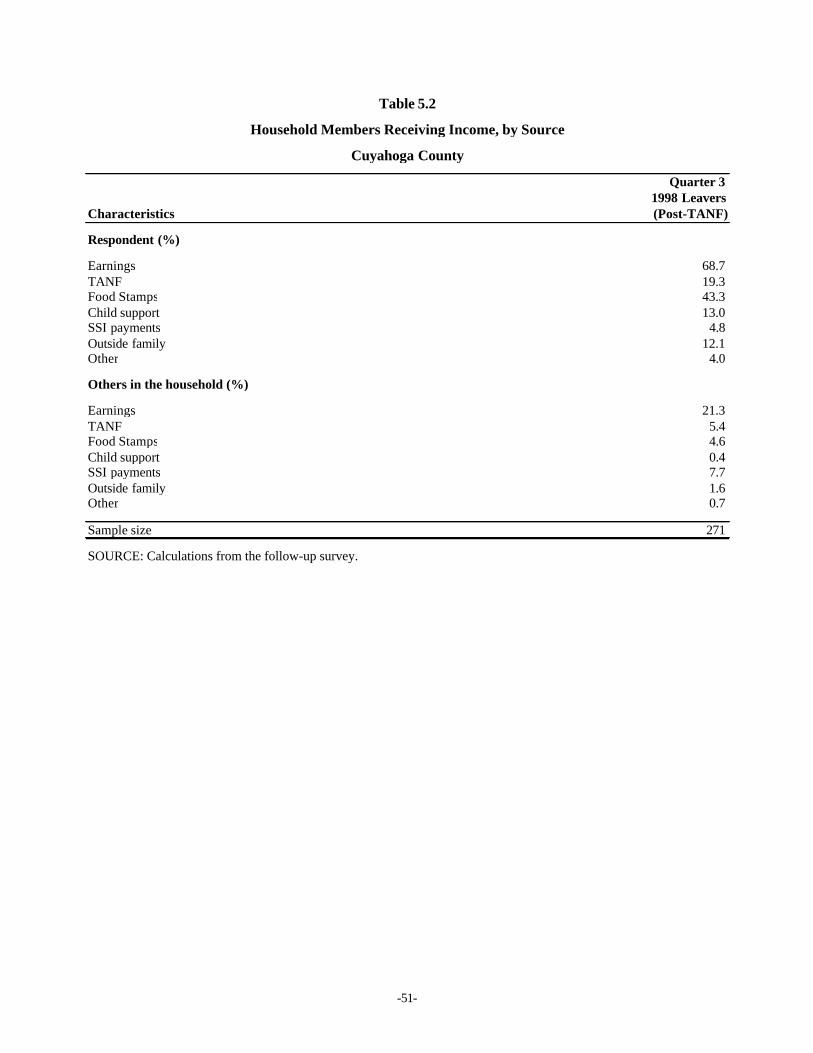
-51-
Quarter 31998 Leavers
Characteristics (Post-TANF)
Respondent (%)
Earnings 68.7TANF 19.3Food Stamps 43.3Child support 13.0SSI payments 4.8Outside family 12.1Other 4.0
Others in the household (%)
Earnings 21.3TANF 5.4Food Stamps 4.6Child support 0.4SSI payments 7.7Outside family 1.6Other 0.7
Sample size 271
SOURCE: Calculations from the follow-up survey.
Cuyahoga County
Household Members Receiving Income, by Source
Table 5.2

-52-
0%
10%
20%
30%
40%
50%
60%
70%
80%
90%
100%
< 50% of Poverty 51-100% of Poverty 101-150% of Poverty >150% of Poverty
Figure 5.1Household Income Sources and Poverty One Year After Exit for
Quarter 3 1998 Welfare Leavers Cuyahoga County
Earnings OtherChild SupportFood StampsWelfare Disability Income
SOURCE: Calculations from the follow-up survey.

43%
10%14%
5%
72%
9%
5%
60%
13%
30%
12%
6%
86%
37%
28%
15%
63%
27%
22%
35%
55%
0%
10%
20%
30%
40%
50%
60%
70%
80%
90%
All Leavers Did Not Return Returned
SOURCE: Calculations from the follow-up survey.
Figure 5.2Use of Support Services One Year After Exit for Quarter 3 1998 Welfare Leavers, by Welfare Status
Cuyahoga County
Food Stamps SSI PaymentsChild SupportPublic or Subsidized Housing
Food from Charity
Medicaid Used at Least One of the Supports
-53-

-54-
Figure 5.3 shows the use of support services by leavers’ work status in the four quarters after exit.24 Leavers were classified into three groups based on their post-exit work history reported in UI wage records: those who did not work in any of the four quarters of post-exit follow-up, those who worked in one to three quarters, and those who worked in all four quarters. (As of the time of the follow-up interview, 17 percent of the sample had not worked in the first four quarters of follow-up, 31 percent had worked in one to three quarters, and the remaining 52 percent had worked in all four quarters.)25 Not surprisingly, the rates of Food Stamp and Medicaid receipt appear quite low for all three groups. Those who did not work in the follow-up period appear to be least reliant on Food Stamps and Medicaid, but showed a somewhat higher use of housing assistance programs and SSI; they were also more likely to be receiving child support payments.
II. Material Well-Being
There is a small but growing body of information available on the well-being of former welfare recipients and their families. Findings from a few national studies are beginning to provide some information on the circumstances of families no longer receiving welfare. Reports based on the National Survey of America’s Families (NSAF) have shown that between one-third and one-half of former recipients appear to experience serious economic struggles, as reflected in their inability to provide food for their families and meet regular rent payments. Findings from the NSAF also indicate that former recipients tend to experience more material hardships than low-income mothers despite other similarities.26
It is important to note, however, that while former recipients tend to experience higher levels of material hardship than low-income mothers, there is little evidence that they experience more hardship than welfare stayers. A study of former and current recipients based on the NSAF data reports that there are no statistically significant differences in the health status of former and current recipients; further, these two groups did not differ with respect to their reported levels of hardship, such as food insecurity and difficulty paying bills.27 According to the report, the main differences among these groups had to do with the number of barriers to work: current recipients were more likely to report multiple barriers to work. The study also points to an association between reported number of barriers and employment outcomes.
24As noted earlier in the section on employment barriers, the employment-based subgroups are constructed
using UI wage records. Employment is measured for up to four quarters following exit; the survey interviews were conducted between 14 and 21 months after exit.
25Employment rates from the follow-up survey are not directly comparable to the rates produced from UI wage records. See footnote 24.
26Loprest (1999). 27Loprest and Zedlewski (1999).

43%
37%
10%
28%
14%
5%
72%
33% 32%
12%
31%
18%
13%
79%
49% 48%
10% 12%7%
73%
42%
31%
10%14%
2%
69%
28% 28%
0%
10%
20%
30%
40%
50%
60%
70%
80%
90%
100%
All Leavers Did Not Work Post-Exit Worked Less Than 4 Quarters Worked All 4 Quarters
SOURCE: Calculations using the follow-up survey.
Figure 5.3Use of Support Services One Year After Exit for Quarter 3 1998 Welfare Leavers, by Post-Exit Work Status
Cuyahoga County
Food Stamps Medicaid Food from Charity
Public or Subsidized Housing
Child Support SSI Payments Used at Least One of the Supports
-55-

-56-
This section looks at a range of indicators of economic struggle and hardship experienced by former recipients in the period after leaving cash assistance. The six-item U.S. Department of Agriculture Food Security Scale is used to measure the level of food insecurity experienced by welfare leavers in the month preceding the survey interview.28 The scale classifies respondents into three categories of food security: food secure, food insecure, and food insecure with hunger. To assess housing hardships, the section reports on housing-related indicators, ranging from excess rent burden and poor housing conditions to neighborhood characteristics.
Table 5.3 shows the levels of food security for those surveyed from the 1998 exit cohort. Over half the sample reported being food secure in the month prior to the follow-up interview. Forty-six percent of the respondents (compared with 10 percent nationally) in 1998 were classified as being food insecure; about 26 percent reported experiencing hunger (compared with 4 percent nationally). Food security also varied considerably by respondents’ post-exit work and welfare statuses. As shown in Figures 5.4 and 5.5, food insecurity was higher among those who did not work in the year following their exit from welfare and those who stayed off welfare during the follow-up period.
The second panel in Table 5.3 shows the extent to which former recipients experienced unmet medical or dental needs in the year preceding the follow-up interview. About 48 percent of sample members indicated that someone in their family was either unable to access medical or dental care because of lack of health insurance or resources. As noted before in this report, there is growing evidence that former welfare recipients are not getting Medicaid benefits, despite the fact that they are eligible for these benefits. A report from the Project on Devolution and Urban Change on the health status of poor urban women found that women in the study who had left welfare — whether or not they were working — were significantly more likely than current recipients to have health care access problems, including lack of health insurance and lack of a regular health care provider; they were also more likely to have unmet medical needs because of financial constraints.
The third panel in the table presents information on housing hardships. Forty-nine percent of the sample reported a rent burden (their monthly housing costs for rent and utilities exceeded 30 percent of their total income, which is considered a housing hardship by the government). A sizable proportion of the sample were not responsible for bearing the full cost of a market rent or burden: 28 percent were living in public or subsidized housing and another 21 percent were living rent-free with family or friends or in another arrangement, where they paid a part of the rent (not shown in table).
Survey respondents were also asked whether they had experienced problems with their housing conditions — such as leaky ceilings, broken windows, plumbing problems, running water or heat problems, and rats or bugs in their place of residence. As shown in the table, 27 percent of the sample indicated that they experienced at least one of these conditions in the year prior to the survey interview. Respondents who did not work steadily in the four quarters after exit and those whose benefits ended because of sanction were more likely to reported housing problems (not shown). Nineteen percent of the sample indicated that their utilities had been
28The six-item scale is an abridged version of the 18-item Household and Food Security Scale, which has been
administered by the U.S. Bureau of the Census through its Current Population Survey since 1995 to assess national food security (Carlson, Andrews, and Bickel, 1999). There is evidence that the abridged scale provides a valid assessment of food security.

-57-
Table 5.3
Material and Economic Well-Being for Post-TANF Leavers
Cuyahoga County
Quarter 31998 Leavers
Characteristics (Post-TANF)
Food security (%)
Food secure 54.1Food insecure 20.1Food insecure with hunger 25.8
Respondent or someone in family received food from charitable organization 10.2
Unmet medical or dental needs in past 12 months (%)
Someone in family needed to but could not see doctor or goto hospital because did not have money or insurance 39.7
Someone in family needed to but could not go to dentistbecause did not have money or insurance 41.4
Housing hardships in past 12 months (%)
Been evicted, stayed in emergency or domestic violence shelter, or been homeless 7.0
Housing problems such as leaking ceilings, broken windows,plumbing problems, water or heat problems, and rats or bugs 26.8
Gas or electricity ever shut off because could not pay bill 18.6
Excess rent burden 49.1
Debt (%)Household has more than $100 in debt 75.2Amount of debt (among those with debt)$1-$1,000 44.1$1,000-$2,000 16.5$2,001 or more 39.4
Sample size 306
SOURCE: Calculations from the follow-up survey.

49%
11%
7%
19%
77%
8%
20%
30%
79%
55%
19%
5%
16%
73%
26%27%
48%
7%
56%
27%
45%
36%
20%
26%
0%
10%
20%
30%
40%
50%
60%
70%
80%
90%
100%
Per
cent
Exp
erie
ncin
g H
ards
hip
All Leavers Did Not Return Returned
SOURCE: Calculations using the follow-up survey.
Figure 5.4Hardships Experienced One Year After Exit for Quarter 3 1998 Welfare Leavers, by Welfare Status
Cuyahoga County
Moved Owing to High Rent or Eviction
Poor Housing Conditions
Gas or Electricity Shut Off
Food Insecure with Hunger
Unmet Medical or Dental Needs
Any of These Hardships
Evicted, in Shelter or Homeless
Excess Rent Burden
-58-

49%
11%
7%
27%
77%
4%6%
28%
34% 34%
53%
81%
56%
21%
11%
31%
11%
21%
52%
80%
46%
9%5%
18%
26%
19%
26%
48%46%
24%
45%
74%
0%
10%
20%
30%
40%
50%
60%
70%
80%
90%
100%
Per
cent
Exp
erie
ncin
g H
ards
hip
All Leavers Did Not Work Post-Exit Worked Less Than 4 Quarters Worked All 4 Quarters
Figure 5.5 Hardships Experienced One Year After Exit for Quarter 3 1998 Welfare Leavers, by Work Status
Cuyahoga County
SOURCE: Calculations using the follow-up survey.
Excess Rent Burden
Moved Owing to High Rent or Eviction
Poor Housing Conditions
Evicted, in Shelter or Homeless
Gas or Electricity Shut Off
Food Insecure with Hunger
Unmet Medical or Dental Needs
Any of These Hardships
-59-

-60-
turned off in the past 12 months because they could not afford to pay a bill. Again, differences emerged by respondents’ work and welfare statuses.
Questions about neighborhood quality and satisfaction were asked of the respondents as well. These findings are presented in Table 5.4. Fifty percent of the sample reported that they were somewhat or very satisfied with their neighborhood; about 21 percent expressed dissatisfaction, and the others had mixed feelings. When asked to rate their neighborhood on selected neighborhood problems — such as gangs, unsupervised teenagers, assaults/fights,vandalism, theft, guns, and drugs — on a scale of 1 to 3 (a score of 1 = no problem and a score of 3 = a big problem), only 19 percent of survey respondents described their neighborhood as having none of these problems. On the other hand, an overwhelming 49 percent perceived the presence of four or more of the problems in their specific neighborhood. The presence of drugs, guns, unsupervised teenagers, and assaults and fights were among the problems that appeared to be of most concern to respondents.29
29There is some evidence that fears about safety keep low-income women and children secluded in their homes. See Polit
et al. (2000). It is beyond the scope of this study to examine the relationship between people’s perceptions about their neighborhood problems and their work experiences.

-61-
Table 5.4
Perception of Neighborhood Quality for Post-TANF Leavers
Cuyahoga County
Quarter 3 1998 Leavers
Characteristics (Post-TANF)
Neighborhood (%)
Very satisfied 27.8Somewhat satisfied 22.1Not satisfied nor dissatisfied 29.4Somewhat dissatisfied 7.5Very dissatisfied 13.1
Perceived neighborhood problems (%)
Gangs 32.9Lack of police protection 37.6Vandalism 40.0Theft 41.5Vehicle break-ins 42.6Assaults/fights 48.0Unsupervised teenagers 56.4Guns 39.9Drugs 63.1
Number of problems (%) 3.9None 19.11-3 32.34 or more 48.6
Sample size 306
SOURCE: Calculations from the follow-up survey.

-62-
Appendix
Survey Response Analysis
The information on sources of income, household composition, job characteristics, hardship indicators, and child and family outcomes was derived primarily from the follow-up survey. This appendix explores the extent to which the survey respondent sample is representative of the full survey sample and the full cohort of 1998 leavers.
The survey sample was drawn from the 3,357 individuals who left public assistance in quarter 3 of 1998, referred to as the 1998 cohort. A subset of this cohort was selected to participate in the follow-up survey. This survey sample includes the 385 members of the 1998 cohort who were selected.30 Of this group, 306 individuals (9 percent of the report sample and approximately 80 percent of the survey sample) completed the survey.31 Sample members who completed the survey are referred to as respondents, and sample members selected for the survey who did not complete it are referred to as nonrespondents.
Whenever survey response rates are less than 100 percent, it is important to examine differences between those who responded and the remainder of the report sample. In a study like this one, two types of factors may confound the interpretation of the findings. First, the sample that was selected for the survey may be systematically different from the remainder of the report sample. This is referred to as “sampling bias.” Second, survey respondents may be systematically different from nonrespondents. This is referred to as “response bias.” In either case, caution should be used when generalizing findings from the respondent sample to the full report sample.
To summarize the results presented below: substantial differences in background characteristics existed between the survey sample and the remainder of the 1998 cohort. To remedy the sampling bias, weights were generated to make the survey sample more representative of the full 1998 cohort. After weighting, most differences between the respondent sample and the remainder of the cohort disappeared. However, even after weighting, some differences remained owing to response bias. In other words, those who responded were slightly different on some background characteristics from nonrespondents within the survey sample. As a result, caution should be exercised when generalizing survey findings to the report sample. However, given the high overall response rate (80 percent of those attempted), the findings are reflective of the behavior of most of the survey sample.
30The survey sample is not a random sample of the report sample. Further analysis revealed that the survey
sample was older, had more welfare history, and was more likely to be nonwhite. To remedy this issue, weights were generated, as will be discussed below.
31Of the 79 nonrespondents, 40 could not be located; 18 were located, but the field period ended before the interview was completed (mostly due to missed appointments); 17 refused to complete the survey; and 4 did not complete the survey because they were incapacitated, incarcerated, deceased, institutionalized, or had a language barrier.

-63-
I. Comparisons Between the Survey Sample and the Report Sample
Table A.1 shows means on some background characteristics from the survey sample, the remainder of the 1998 cohort, and the weighted survey sample.32 Columns 1 and 2 show substantial differences between the survey sample and the remainder of the 1998 cohort. Specifically, survey sample members tended to be older, were more likely to be nonwhite, and tended to have longer pre-exit public assistance histories. For example, survey sample members were more than four years older, nearly 16 percentage points more likely to be black, and received about 1.5 months more of AFDC and Food Stamps prior to random assignment than the remainder of the 1998 cohort. Several of these differences are statistically significant.
While Table A.1 shows differences between the survey sample and the rest of the 1998 cohort, it is not clear how significant these differences are and which variables make the most important net contribution to the bias. To clarify these differences, Table A.2 presents results of a regression of background characteristics on whether sample members were selected for the survey sample. Not surprisingly, this regression was significant (p=.0001). Analysis based on the standardized coefficients (and a separate stepwise regression analysis) shows that the key contributors to the bias appear to be age and race. Further analysis determined that this bias was the result of a programming error at sample selection.
Because of the bias in the sample, weights based on age and race were created to give more influence to sample members with underrepresented characteristics and less influence to sample members with overrepresented characteristics.33 Column 3 of Table A.1 shows that, after weighting, several of the key differences between the survey sample and the rest of the 1998 cohort disappeared. For example, whereas prior to weighting the survey sample had been 4.4 years older, this difference largely disappeared after weighting. Further, the difference between the proportion who were black, which had been nearly 16 percentage points, dropped to less than 2 percentage points.
II. Comparisons Between Respondents and Nonrespondents Within the Survey Sample
Overall, 80 percent of the survey sample completed the follow-up survey. This response rate is higher than rates obtained in most other studies involving similar target populations. A key question for interpreting the findings from the survey is whether the respondents are representative of the survey sample. To address this question, Table A.3 presents weighted means on background characteristics for the respondent and nonrespondent samples. Because the sample members are weighted, this analysis will allow us to distinguish response bias from the
32The 1998 cohort was broken up into these nonoverlapping groups in order to permit statistical tests. 33The weights were computed in the following manner. The universe (sampling frame) was stratified into 12
subgroups based on race (white, black, all other) and age (18-19, 20-29, 30-39, and 40+). The probability of being selected for the sample was computed on this basis, and the sampling weight was computed as the inverse of the probability of selection. Other sources of bias were due to response, rather than sampling, bias. As the extent of this bias was relatively mild, weighting was not performed to correct for this.

-64-
Survey Remainder of Weighted Sample 1998 Exit Cohort Survey Sample
1.8 1.9 1.884.4 68.5 70.334.8 30.4 31.1
71.4 71.6 70.1Not employed pre-random assignment (%) 19.0 19.5 19.0
18.7 16.6 17.47,469 7,885 7,551
18.2 16.7 18.018.2 16.5 17.720.4 18.8 20.1
4.2 4.2 4.07.9 7.8 7.68.7 8.9 8.4
Sample size (total=3,357) 385 2,972 385
SOURCES: Calculations from administrative records data and the follow-up survey.
NOTES: Tests of significance were computed as two-way difference of means t-tests. Significance levels are indicated as *** = 1 percent,** = 5 percent, and * = 10 percent. a For nonrespondents we imputed interview dates based on the mean interview date in order to compute "age at interview."
Number of months of Food Stamps received pre-exit
Number of months of Food Stamps received post-exit Number of months eligible for Medicaid post-exit
Race/ethnicity: black (%)Age at interviewa
Employed in quarter of exit (%)
Not employed post-random assignment (%)
Number of months of AFDC received post-exit
Number of months eligible for Medicaid pre-exit
Number of months of AFDC received pre-exit
Table A.1
Background Characteristics of Quarter 3 1998 Welfare Leavers, by Sampling Status
Sum of post-exit earnings ($)
Number of children
Cuyahoga County

-65-
Parameter Standardized Variable Estimate Parameter P-Value
Intercept 96.230 0.000 0.134Employed in quarter of exit 0.000 0.010 0.764Not employed pre-random assignment -0.010 -0.010 0.522Not employed post-random assignment 0.010 0.010 0.576Sum of post-exit earnings 0.000 -0.020 0.338Number of children -0.020 -0.070 *** 0.000Black 0.080 0.110 *** 0.000Age at interview a 0.010 0.190 *** 0.000Number of months of AFDC received pre-exit 0.000 -0.030 * 0.451Number of months of Food Stamps received pre-exit 0.000 0.000 *** 0.935Number of months eligible for Medicaid pre-exit 0.000 0.100 * 0.033Number of months of AFDC received post-exit 0.000 0.040 * 0.129Number of months of Food Stamps received post-exit 0.000 -0.010 * 0.820Number of months eligible for Medicaid post-exit 0.000 -0.040 * 0.237Exit month -0.010 -0.030 * 0.133R squared 0.060F-statistic 14.080P-value of F-statistic 0.000
3,357
SOURCE: Calculations from the follow-up survey.
Statistical significance levels are indicated as *** = 1 percent, ** = 5 percent, and * = 10 percent.
NOTES: A two-tailed t-test was applied to each coefficient estimate. The column labeled "p-value" indicates the statistical significance level of the coefficient: that is, p is the probability that variation in a background characteristic did not contribute to whether or not a sample member was sampled for the survey.
a For nonrespondents we imputed interview dates based on the mean interview date in order to compute "age at interview."
Sample size
Table A.2
Estimated Regression Coefficients for the Probability of Quarter 3 1998 Welfare Leavers
Cuyahoga County
Being Sampled for the Follow-Up Survey

-66-
Variable
Not employed pre-random assignment (%)
*
******
NOTES: Tests of significance were computed as two-way difference of means t-tests.
a For nonrespondents we imputed interview dates based on the mean interview date in order to compute "age at interview."
Significance levels are indicated as *** = 1 percent,** = 5 percent, and * = 10 percent.
Sample size (total=385)
Number of months eligible for Medicaid post-exit 9.1 6.0
306 79
Number of months of Food Stamps received post -exit 8.3 5.1Number of months of AFDC received post-exit 4.3 3.1
Number of months of AFDC received pre-exit 17.7 18.1
Number of months eligible for Medicaid pre-exit 20.1 20.0Number of months of Food Stamps received pre-exit 17.5 18.3
Sum of post-exit earnings ($) 7,924 6,157
Employed in quarter of exit (%) 69.3 73.2
Not employed post-random assignment (%) 16.3 21.418.8 19.8
Number of children 1.8 1.7
Age at interviewa 30.9 31.8Race/ethnicity: black (%) 70.8 68.4
Respondent Nonrespondent Sample Sample
Weighted Weighted
Table A.3
Background Characteristics of Quarter 3 1998 Welfare Leavers, by Response Status
Cuyahoga County

-67-
sampling bias discussed above. Multiple regression was also used to determine the extent to which the average weighted characteristics of the respondents were different from those of nonrespondents. Table A.4 shows the results of this analysis. The parameter estimates in column 1 capture the effect of each variable on the probability of completing the survey. The asterisks and p-values show the statistical significance of this relationship.
Taken together, Tables A.3 and A.4 show that some response bias remains even after weighting. Although the survey sample has been made statistically comparable to the remainder of the report sample, those who responded to the survey appear to differ from those who did not (a not unexpected finding). Table A.3 shows that survey respondents had higher earnings and higher post-exit welfare histories than nonrespondents. For example, those who responded to the survey received over three months more of post-exit Food Stamps, on average, than those who did not respond. Further, respondents earned nearly $1,800 more than nonrespondents after they exited AFDC. While this might seem paradoxical, the same pattern has been seen in other studies.34 The bias seems to derive from having a record in a computerized tracking system. Those in the UI or Ohio public assistance records were more likely to be surveyed. This is not uncommon since administrative systems usually have more updated contact information about respondents that allows them to be more easily located. Importantly, since this appears to have happened with both UI and welfare records, the respondent sample is not particularly disadvantaged or advantaged compared with the full survey sample.
The F-statistic and its p-value at the bottom of Table A.4 show that, overall, the differences between survey respondents and survey nonrespondents were systematic and statistically significant. However, these differences are typical of this type of study. While the weights have made the survey sample comparable to the report sample, respondents differ in some minor ways from nonrespondents. Therefore, some caution should be exercised when generalizing results from the respondent sample to the full survey sample.
34See Bloom et al. (2000).

-68-
ParameterEstimate
Intercept 217.620 0.000 0.3760Employed in quarter of exit -0.140 -0.160 * 0.0230Not employed pre-random assignment 0.030 0.030 0.6350Not employed post-random assignment -0.060 -0.050 0.4070Sum of post-exit earnings 0.000 0.170 *** 0.0060Number of children 0.000 0.010 0.8500Black 0.010 0.010 0.9030Age at interview a 0.000 -0.020 0.6680Number of months of AFDC received pre-exit 0.000 0.000 0.9660Number of months of Food Stamps received pre-exit -0.010 -0.140 * 0.0660Number of months eligible for Medicaid pre-exit 0.010 0.100 0.4030Number of months of AFDC received post-exit -0.010 -0.090 0.2200Number of months of Food Stamps received post-exit 0.010 0.170 ** 0.0330Number of months eligible for Medicaid post-exit 0.010 0.170 * 0.0620Exit month -0.020 -0.040 0.3780R squared 0.088F-statistic 2.550P-value of F-statistic 0.002
385
SOURCES: Calculations from the follow-up survey.
Statistical significance levels are indicated as *** = 1 percent, ** = 5 percent, and * = 10 percent.
P-Value
a For nonrespondents we imputed interview dates based on the mean interview date in order to compute "age at interview."
NOTES: A two-tailed t-test was applied to each coefficient estimate. The column labeled "p-value" indicates the statistical significance level of the coefficient: that is, p is the probability that variation in a background characteristic did not contribute to whether or not a sample member was sampled for the survey.
Table A.4
Estimated Regression Coefficients for the Probability of Quarter 3 1998 Welfare Leavers
Cuyahoga County
Sample size
VariableStandardized
Parameter
Responding to the Follow-Up Survey

-69-
References
Allen, Katherine, and Maria Kirby. 2000. Unfinished Business: Why Cities Matter to Welfare Reform. Washington, DC: Brookings Institution.
Bloom, Dan, Laura Melton, Charles Michalopoulos, Susan Scrivener, and Johanna Walter. 2000. Jobs First: Implementation and Early Impacts of Connecticut’s Welfare Reform Initiative. New York: Manpower Demonstration Research Corporation.
Brauner, Sarah, and Pamela Loprest. 1999. Where Are They Now? What States’ Studies of People Who Left Welfare Tell Us. Washington, DC: Urban Institute.
Brennan, John, and Edward Hill. 1999. Where Are the Jobs? Cities, Suburbs and the Competition for Employment. Washington, DC: Brookings Institution.
Cancian, Maria, Robert Haveman, Thomas Kaplan, Daniel R. Meyer, Ingrid Rothe, and Barbara Wolfe, with Sandra Barone. 2000. Before and After TANF: The Utilization of Noncash Public Benefits by Women Leaving Welfare in Wisconsin. Madison: Institute for Research on Poverty, University of Wisconsin-Madison.
Carlson, S. J., M. S. Andrews, and G. W. Bickel, 1999. “Measuring Food Insecurity and Hunger in the United States: Development of a National Benchmark Measure and Prevalence Estimates.” Journal of Nutrition 129: 510S-516S.
Coulton, Claudia, Cara J. Pasqualone, Toby Martin, Neil Bania, Nina Lalich, and Lisa Nelson. 2000. How Are They Managing? A Six Month Retrospective of Cuyahoga County Families Leaving Welfare: Quarter 4, 1998 – Quarters 1-3, 1999. Cleveland: Center on Urban Poverty and Social Change.
Coulton, Claudia, and Nandita Verma. 1999. Employment and Return to Public Assistance Among Single, Female-Headed Families Leaving AFDC in Third Quarter, 1996, Cuyahoga County, Ohio. Cleveland: Case Western Reserve University Working Paper, Series: WP-99-01.
Coulton, Claudia, Nandita Verma, and Shenyang Guo. 1996. Time Limited Welfare and the Employment Prospects of AFDC Recipients in Cuyahoga County. Cleveland: Case Western Reserve University Working Paper, Series: WP-96-01.
Danziger, S., M. Corcoran, S. Danziger, C. Heflin, A. Kalil, J. Levine, D. Rosen, K. Seefeldt, K. Siefert, and R. Tolman. 2000. Barriers to the Employment of Welfare Recipients. Madison, WI: Institute for Research on Poverty.
Isaacs, Julia, and Matthew Lyon. 2000. A Cross-State Examination of Families Leaving Welfare: Findings from the ASPE-Funded Leavers Studies. Washington, DC: U.S. Department of Health and Human Services.
Loprest, Pamela. 1999. Families Who Left Welfare: Who Are They and How Are They Doing? Assessing the New Federalism Discussion Paper No. 99-02. Washington, DC: Urban Institute.
Loprest, Pamela, and Sheila Zedlewski. 1999. Current and Former Welfare Recipients: How Do They Differ? Assessing the New Federalism Discussion Paper No. 99-17. Washington, DC: Urban Institute.

-70-
Moffitt, Robert, and Jennifer Roff. 2000. The Diversity of Welfare Leavers. Welfare, Children, and Families Study. Policy Brief 00-2. Baltimore: Johns Hopkins University.
National Research Council. 1999. Evaluating Welfare Reform: A Framework and Review of Current Work. Interim Report. Panel on Data and Methods for Measuring the Effects of Changes in Social Welfare Programs. Robert A. Moffitt and Michele Ver Ploeg, Editors. Committee on National Statistics, Commission on Behavioral and Social Sciences and Education. Washington, DC: National Academy Press.
Polit, Denise, Andrew London, and John Martinez. 2000. Food Security and Hunger in Poor, Mother-Headed Families in Four U.S. Cities. New York: Manpower Demonstration Research Corporation.
Primus, Wendell, Lynette Rawlings, Kathy Larin, and Kathryn Porter. 1999. The Initial Impacts of Welfare Reform on the Economic Well-Being of Single Mother Families. Washington, DC: Center on Budget and Policy Priorities.
Quint, Janet, Kathryn Edin, Maria Buck, Barbara Fink, Yolanda Padilla, Olis Simmons-Hewitt, and Mary Valmont. 1999. Big Cities and Welfare Reform: Early Implementation and Ethnographic Findings from the Project on Devolution and Urban Change. New York: Manpower Demonstration Research Corporation.
Quint, Janet, and Rebecca Widom. 2001. Post-TANF Food Stamp and Medicaid Benefits: Factors That Aid or Impede Their Receipt. New York: Manpower Demonstration Research Corporation.
Zedlewski, Sheila. 1999. Work-Related Activities and Limitations of Current Welfare Recipients. Assessing the New Federalism Discussion Paper No. 99-06. Washington, DC: Urban Institute.
Zedlewski, Sheila, and Sarah Brauner. 1999. Declines in Food Stamp and Welfare Participation: Is There a Connection? Assessing the New Federalism Discussion Paper No. 99-13. Washington, DC: Urban Institute.