Embed Size (px)
Citation preview
1
I-MOVE
Monitoring of the influenza vaccine
effectiveness in Navarre, Spain,
2008-2012
Jesús CastillaInstitute of Public Health of Navarre
This activity has been supported by: - Government of Navarre- ECDC (I-MOVE network) - Carlos III Institute of Health, Government of Spain.
2
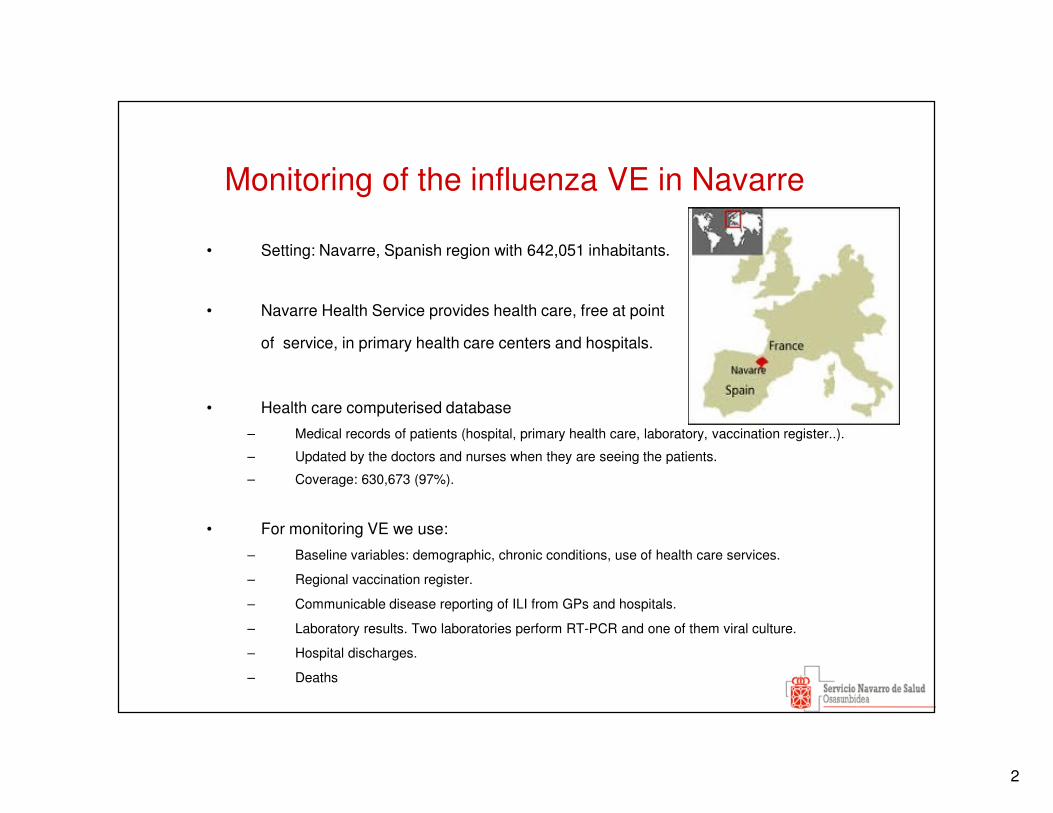
Monitoring of the influenza VE in Navarre
• Setting: Navarre, Spanish region with 642,051 inhabitants.
• Navarre Health Service provides health care, free at point
of service, in primary health care centers and hospitals.
• Health care computerised database
– Medical records of patients (hospital, primary health care, laboratory, vaccination register..).
– Updated by the doctors and nurses when they are seeing the patients.
– Coverage: 630,673 (97%).
• For monitoring VE we use:
– Baseline variables: demographic, chronic conditions, use of health care services.
– Regional vaccination register.
– Communicable disease reporting of ILI from GPs and hospitals.
– Laboratory results. Two laboratories perform RT-PCR and one of them viral culture.
– Hospital discharges.
– Deaths
3
Influenza vaccination programme in Navarre
1. Vaccine
– The regional government annually purchases ~120,000 doses (19% of population).
– Trivalent non-adjuvanted vaccine of subunits.
2. Free of charge offered to:
• ≥60 years old.
• <60 years old with comorbidity or risk factors.
• Others: health care workers, other professions, institutionalised.
3. Campaign in October and November.
4
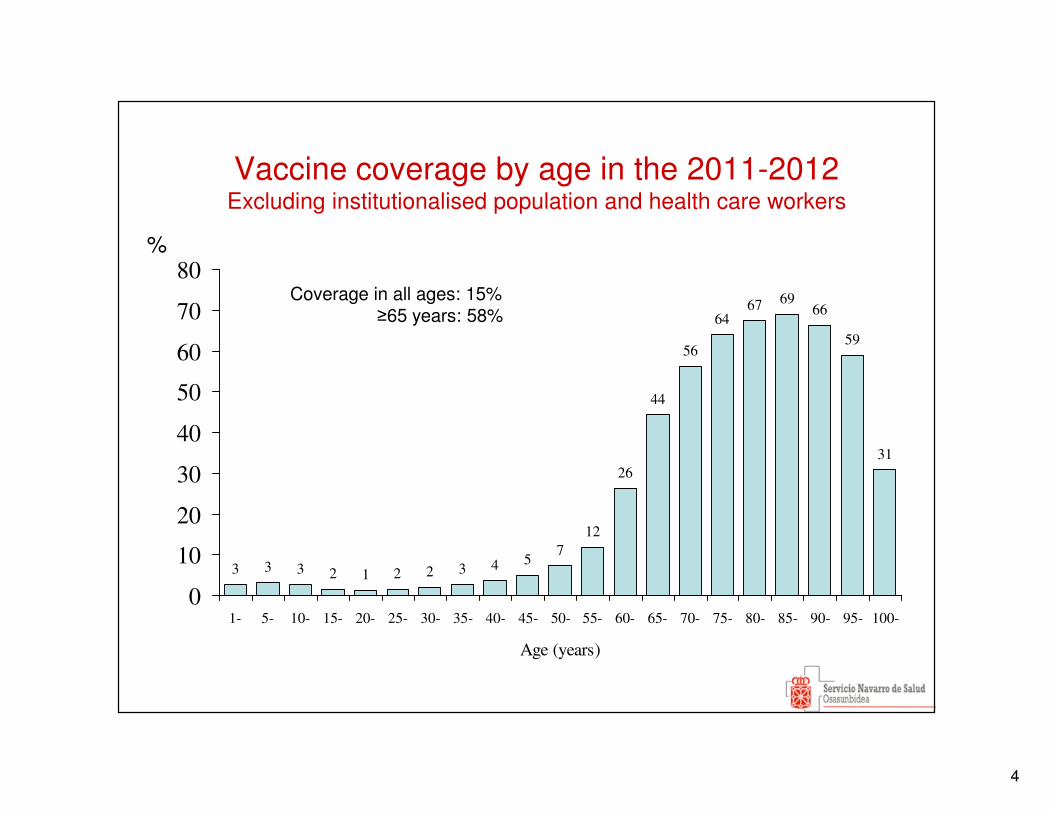
Vaccine coverage by age in the 2011-2012 Excluding institutionalised population and health care workers
3 3 2 1 2 2 3 4 57
12
26
44
56
6467 69
66
59
31
3
0
10
20
30
40
50
60
70
80
1- 5- 10- 15- 20- 25- 30- 35- 40- 45- 50- 55- 60- 65- 70- 75- 80- 85- 90- 95- 100-
Age (years)
Coverage in all ages: 15% ≥65 years: 58%
%
5
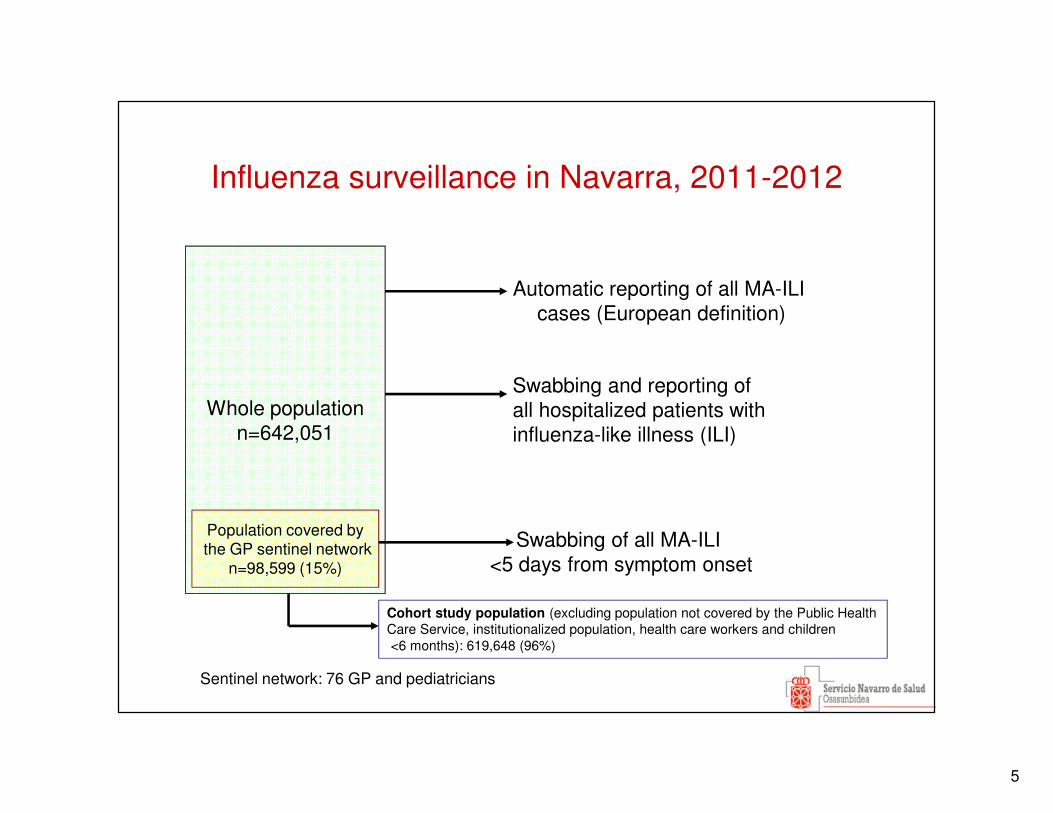
Influenza surveillance in Navarra, 2011-2012
Whole populationn=642,051
Population covered bythe GP sentinel network
n=98,599 (15%)
Swabbing and reporting ofall hospitalized patients with influenza-like illness (ILI)
Swabbing of all MA-ILI <5 days from symptom onset
Automatic reporting of all MA-ILI cases (European definition)
Sentinel network: 76 GP and pediatricians
Cohort study population (excluding population not covered by the Public Health Care Service, institutionalized population, health care workers and children<6 months): 619,648 (96%)
6
0
1000
2000
3000
4000
5000
6000
7000
8000
3-oc
t
17-o
ct
31-o
ct14
-nov
28-n
ov
12-d
ic
26-d
ic
9-en
e
23-e
ne
6-fe
b
20-f
eb
5-m
ar19
-mar
2-ab
r
16-a
br
30-a
br
0
100
200
300
400
500
600
700
800Doses of influenza vaccine
MA-ILI
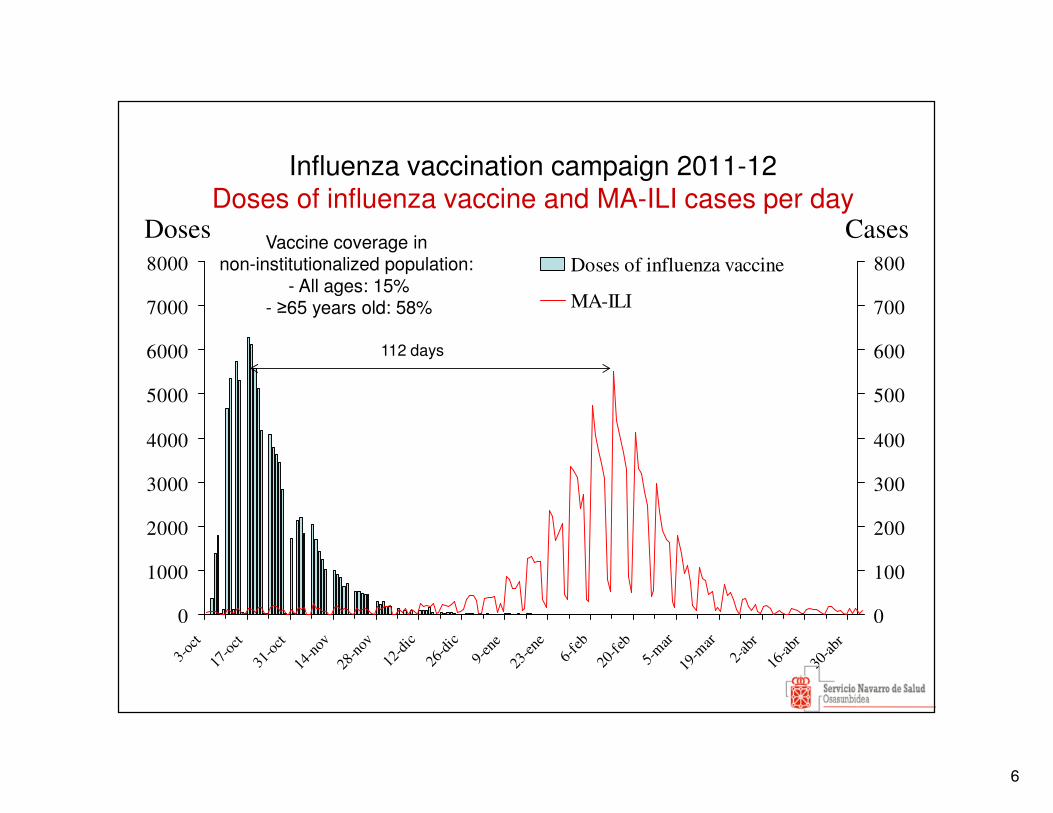
Influenza vaccination campaign 2011-12Doses of influenza vaccine and MA-ILI cases per day
Doses Cases
112 days
Vaccine coverage in non-institutionalized population:
- All ages: 15%- ≥65 years old: 58%
7
Objectives
� To evaluate the effectiveness of the influenza vaccine in preventing:
� MA-ILI
� Laboratory-confirmed influenza in primary health care
� Hospitalization with laboratory-confirmed influenza
� All-cause deaths
� To provide early reliable estimates of the VE. Weekly updated results starting before or in the peak.
8
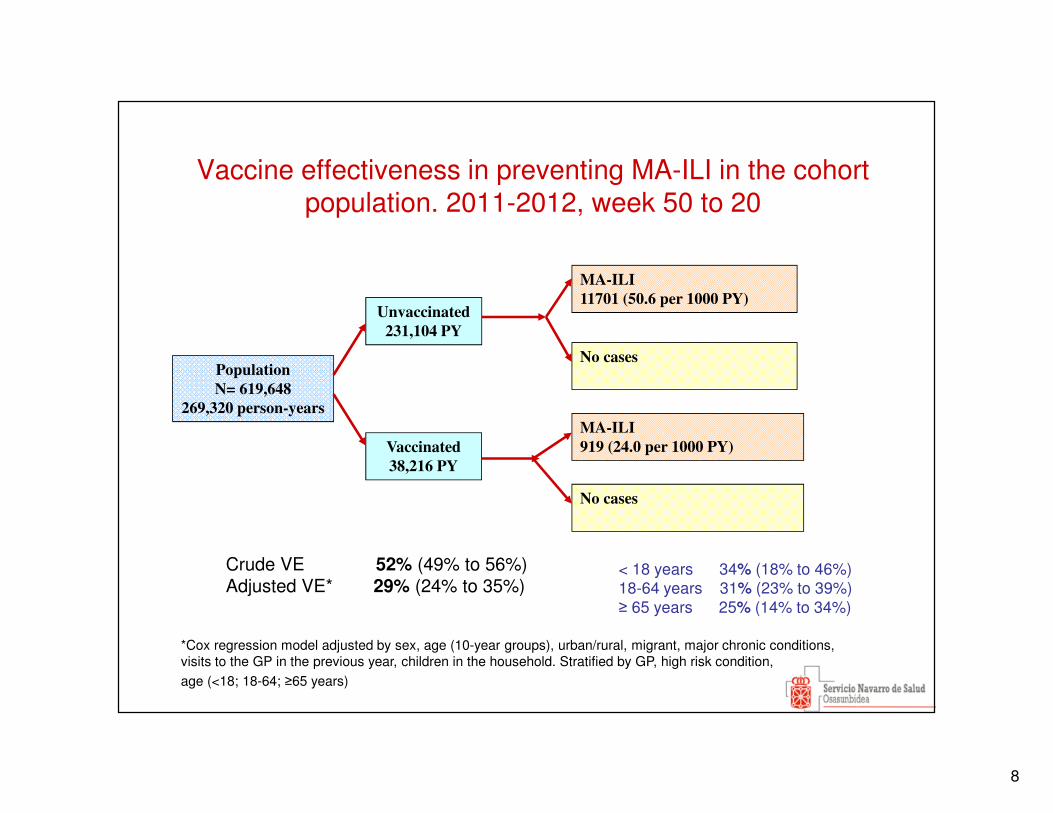
Vaccine effectiveness in preventing MA-ILI in the cohort population. 2011-2012, week 50 to 20
Population
N= 619,648
269,320 person-years
MA-ILI
919 (24.0 per 1000 PY)
No cases
MA-ILI
11701 (50.6 per 1000 PY)
Vaccinated
38,216 PY
Unvaccinated
231,104 PY
No cases
Crude VE 52% (49% to 56%)Adjusted VE* 29% (24% to 35%)
*Cox regression model adjusted by sex, age (10-year groups), urban/rural, migrant, major chronic conditions, visits to the GP in the previous year, children in the household. Stratified by GP, high risk condition,
age (<18; 18-64; ≥65 years)
< 18 years 34% (18% to 46%)18-64 years 31% (23% to 39%)≥ 65 years 25% (14% to 34%)
9
0
20
40
60
80
100
120
140
160
40 42 44 46 48 50 52 2 4 6 8 10 12 14 16 18 20
Week
Pa
tien
ts s
wa
bb
ed
0
50
100
150
200
250
300
350
400
450
Ra
te p
er 1
00
,00
0 i
nh
ab
ita
nts
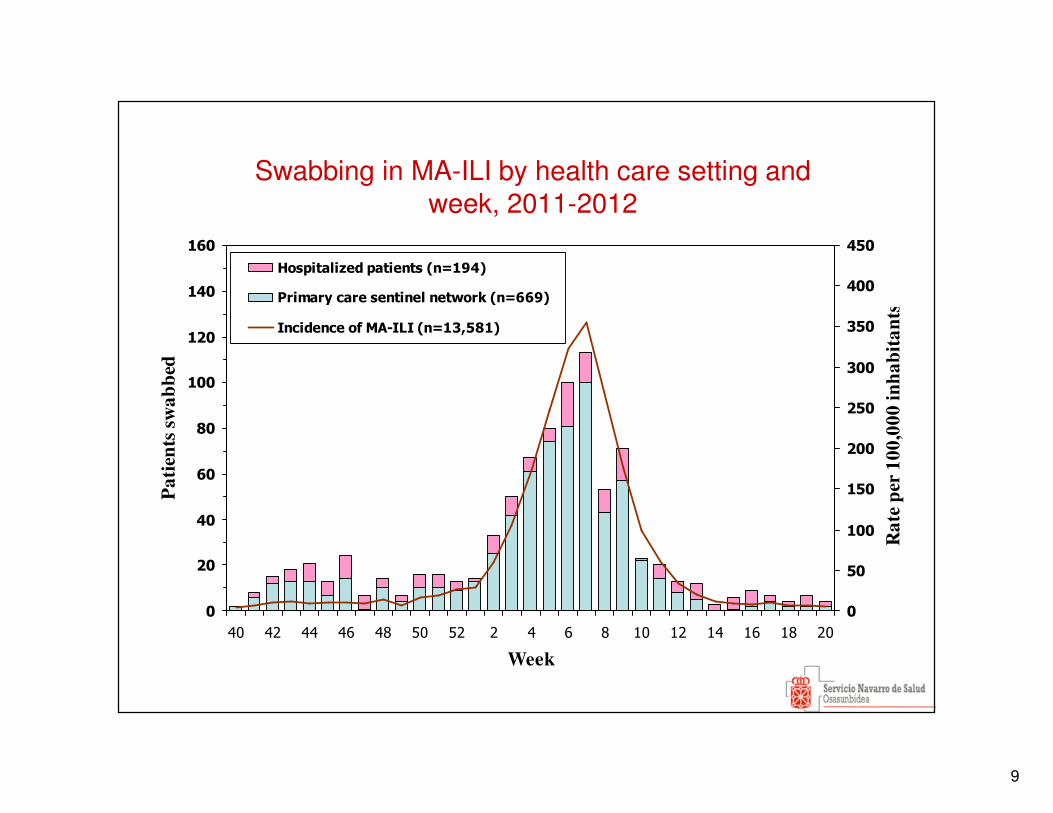
Hospitalized patients (n=194)
Primary care sentinel network (n=669)
Incidence of MA-ILI (n=13,581)
Swabbing in MA-ILI by health care setting and week, 2011-2012
10
0
20
40
60
80
100
120
140
160
40 42 44 46 48 50 52 2 4 6 8 10 12 14 16 18 20
Week
Pa
tien
ts s
wa
bb
ed
0
50
100
150
200
250
300
350
400
450
Ra
te p
er 1
00
,00
0 i
nh
ab
ita
nts
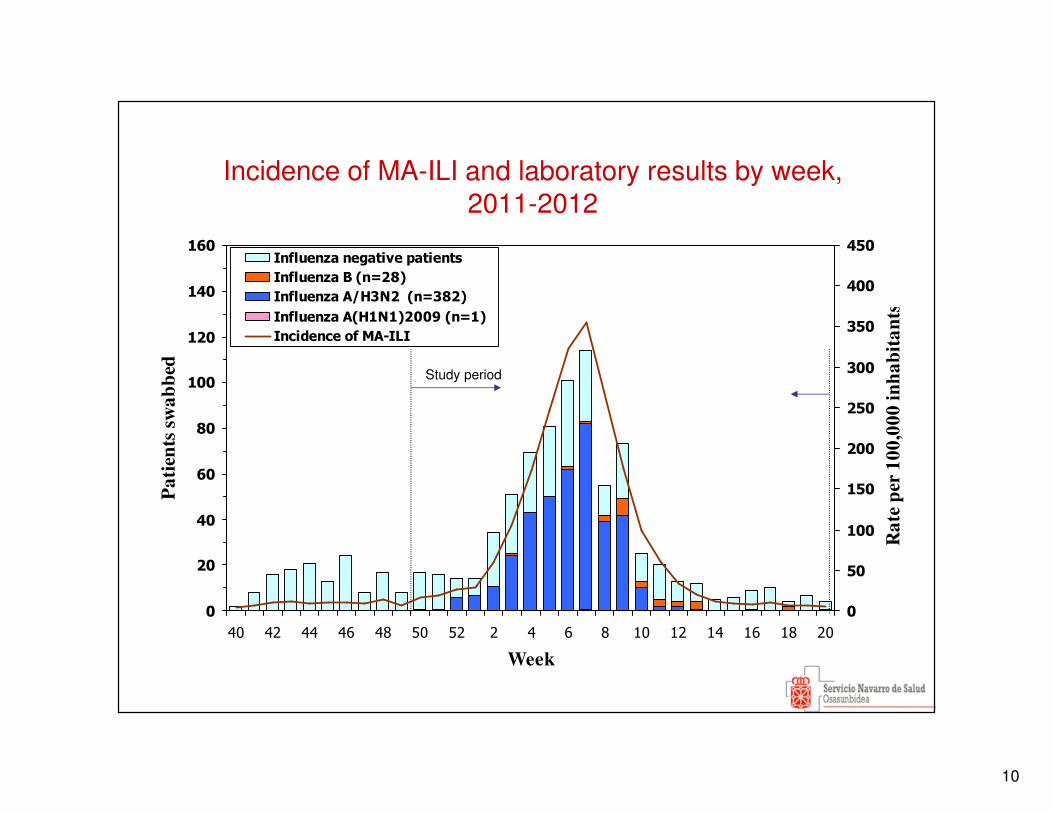
Influenza negative patients
Influenza B (n=28)
Influenza A/H3N2 (n=382)
Influenza A(H1N1)2009 (n=1)
Incidence of MA-ILI
Incidence of MA-ILI and laboratory results by week, 2011-2012
Study period
11
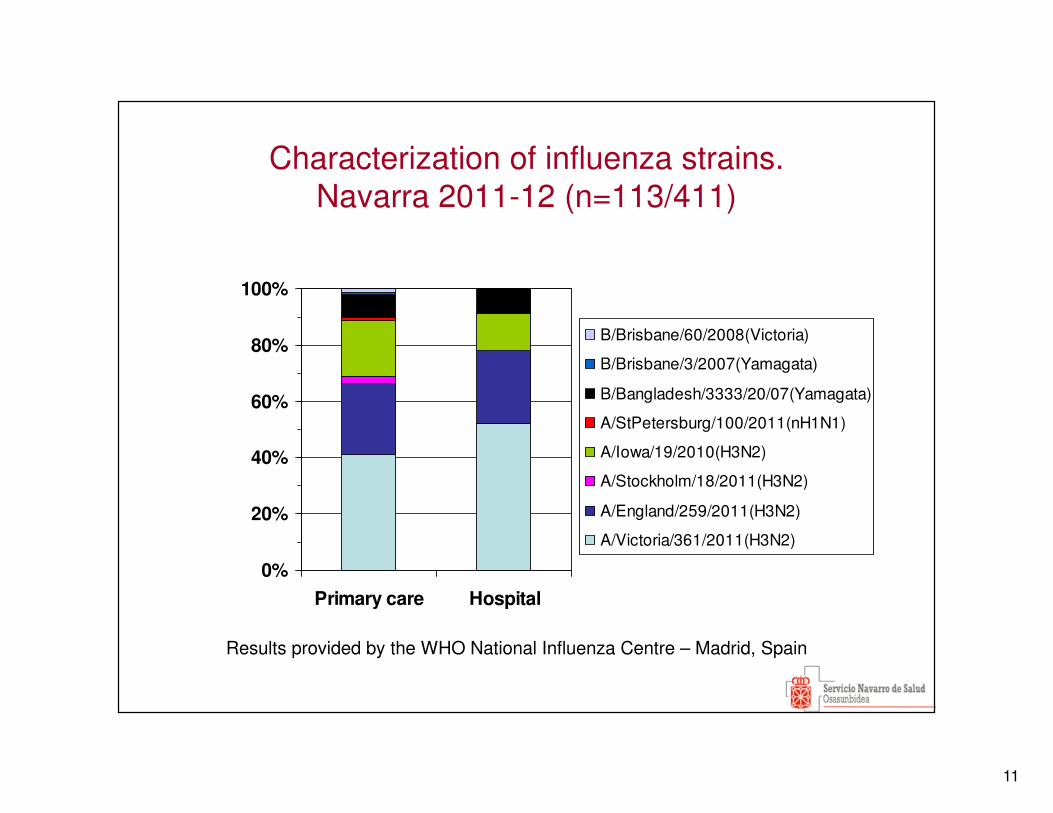
Characterization of influenza strains. Navarra 2011-12 (n=113/411)
0%
20%
40%
60%
80%
100%
Primary care Hospital
B/Brisbane/60/2008(Victoria)
B/Brisbane/3/2007(Yamagata)
B/Bangladesh/3333/20/07(Yamagata)
A/StPetersburg/100/2011(nH1N1)
A/Iowa/19/2010(H3N2)
A/Stockholm/18/2011(H3N2)
A/England/259/2011(H3N2)
A/Victoria/361/2011(H3N2)
Results provided by the WHO National Influenza Centre – Madrid, Spain
12
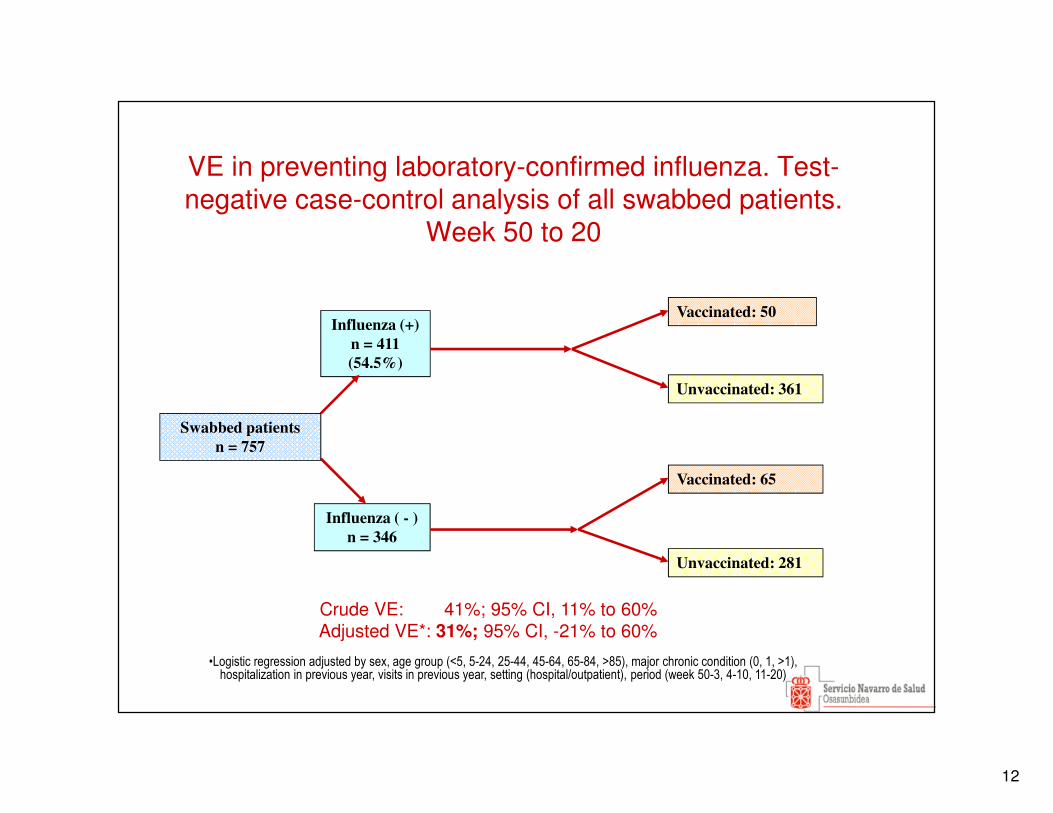
VE in preventing laboratory-confirmed influenza. Test-negative case-control analysis of all swabbed patients.
Week 50 to 20
Swabbed patients
n = 757
Vaccinated: 65
Unvaccinated: 361
Vaccinated: 50
Influenza ( - )
n = 346
Influenza (+)
n = 411
(54.5%)
Unvaccinated: 281
Crude VE: 41%; 95% CI, 11% to 60%Adjusted VE*: 31%; 95% CI, -21% to 60%
•Logistic regression adjusted by sex, age group (<5, 5-24, 25-44, 45-64, 65-84, >85), major chronic condition (0, 1, >1), hospitalization in previous year, visits in previous year, setting (hospital/outpatient), period (week 50-3, 4-10, 11-20)
13
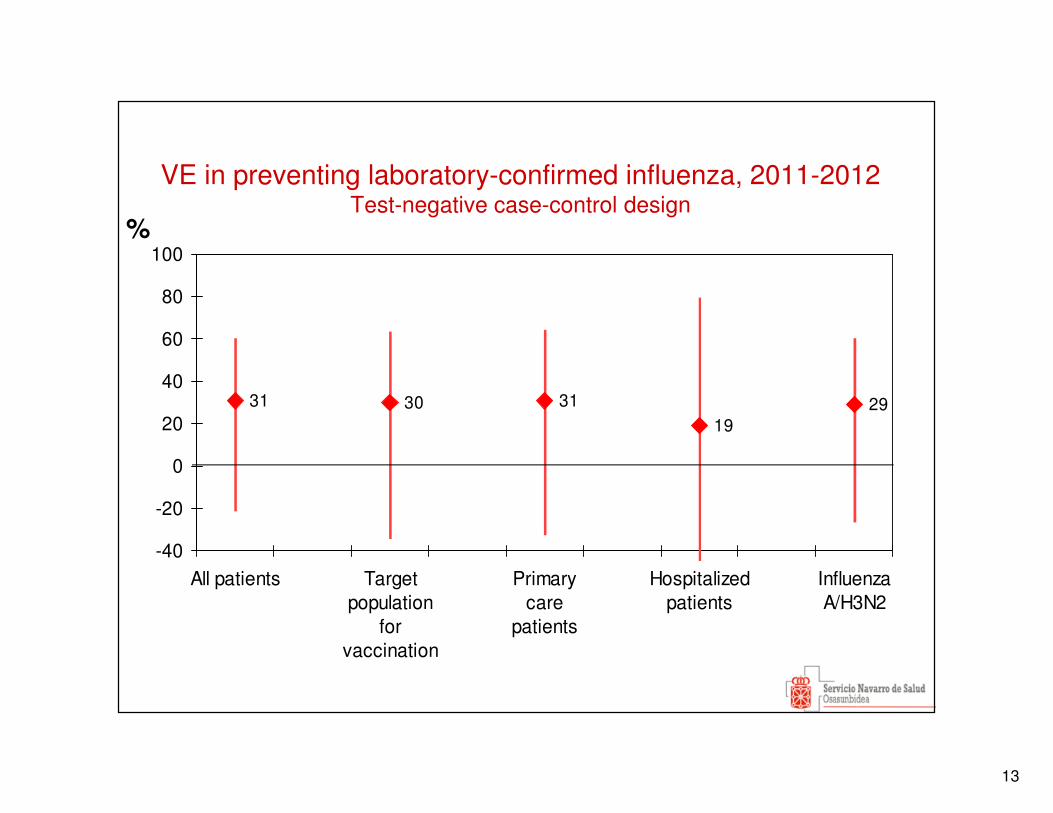
VE in preventing laboratory-confirmed influenza, 2011-2012 Test-negative case-control design
31 30 3119
29
-40
-20
0
20
40
60
80
100
All patients Targetpopulation
forvaccination
Primarycare
patients
Hospitalizedpatients
InfluenzaA/H3N2
%
14
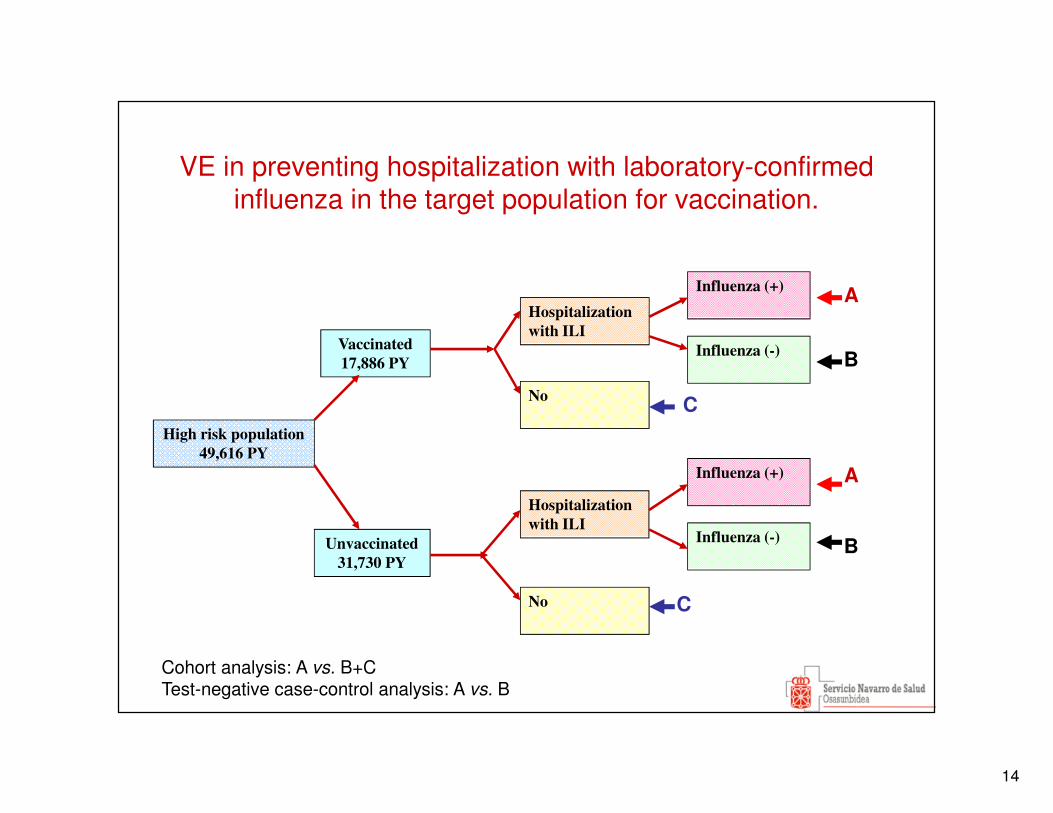
VE in preventing hospitalization with laboratory-confirmed influenza in the target population for vaccination.
High risk population
49,616 PY
Hospitalization
with ILI
No
Hospitalization
with ILI
Unvaccinated
31,730 PY
Vaccinated
17,886 PY
No
Influenza (+)
Influenza (-)
Influenza (+)
Influenza (-)
Cohort analysis: A vs. B+CTest-negative case-control analysis: A vs. B
A
B
A
B
C
C
15
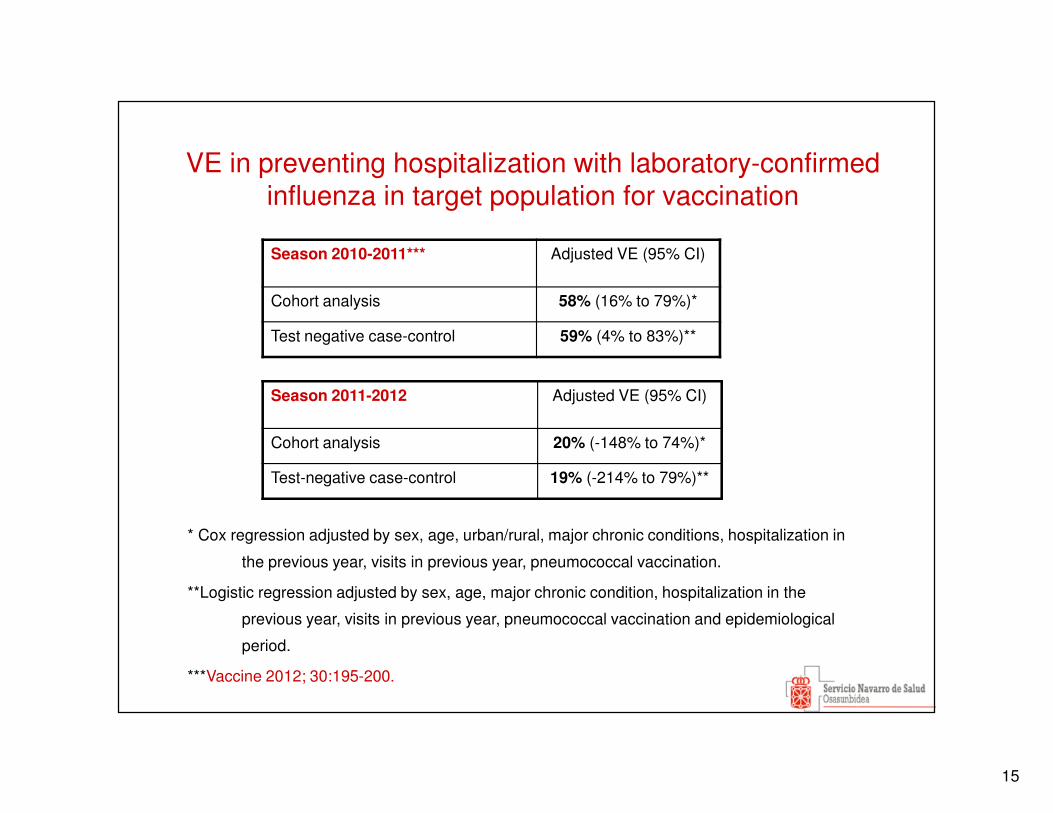
VE in preventing hospitalization with laboratory-confirmed influenza in target population for vaccination
Season 2011-2012 Adjusted VE (95% CI)
Cohort analysis 20% (-148% to 74%)*
Test-negative case-control 19% (-214% to 79%)**
* Cox regression adjusted by sex, age, urban/rural, major chronic conditions, hospitalization in
the previous year, visits in previous year, pneumococcal vaccination.
**Logistic regression adjusted by sex, age, major chronic condition, hospitalization in the
previous year, visits in previous year, pneumococcal vaccination and epidemiological
period.
***Vaccine 2012; 30:195-200.
Season 2010-2011*** Adjusted VE (95% CI)
Cohort analysis 58% (16% to 79%)*
Test negative case-control 59% (4% to 83%)**
16
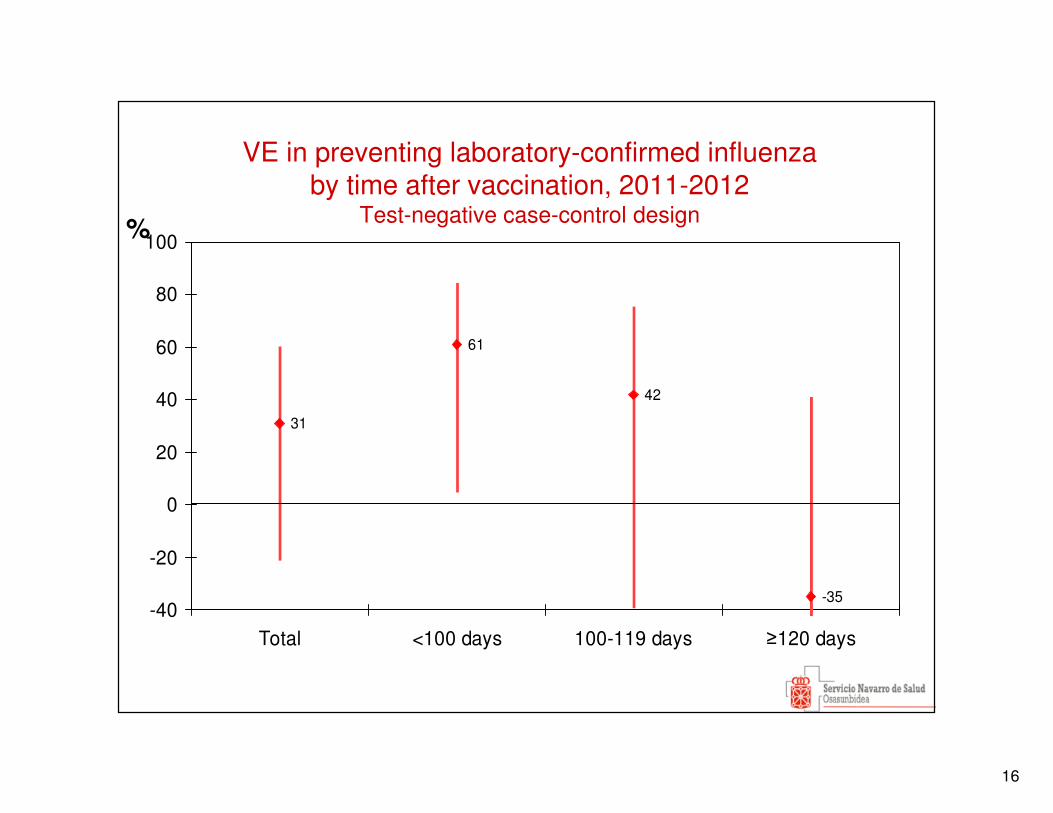
VE in preventing laboratory-confirmed influenza by time after vaccination, 2011-2012
Test-negative case-control design
31
61
42
-35-40
-20
0
20
40
60
80
100
Total <100 days 100-119 days ≥120 days
%
17
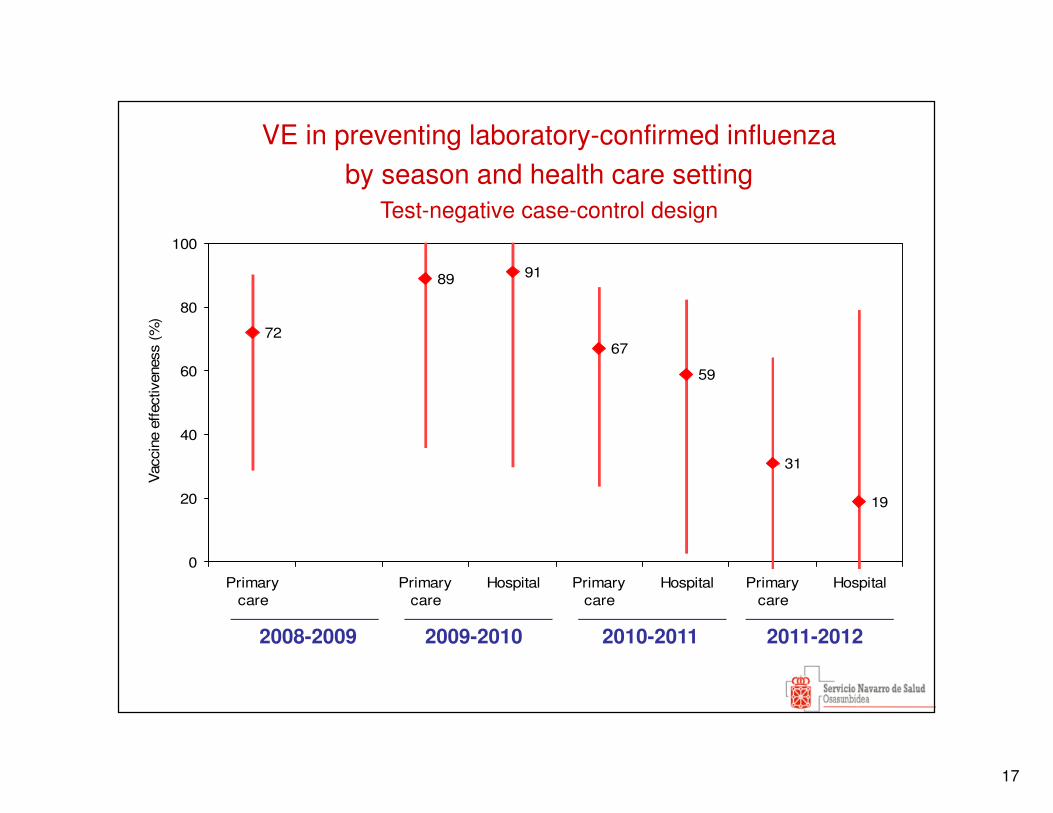
72
89 91
67
59
31
19
0
20
40
60
80
100
Primarycare
Primarycare
Hospital Primarycare
Hospital Primarycare
Hospital
Vac
cine
effec
tiven
ess
(%)
2008-2009 2009-2010 2010-2011 2011-2012
VE in preventing laboratory-confirmed influenza by season and health care setting
Test-negative case-control design
18
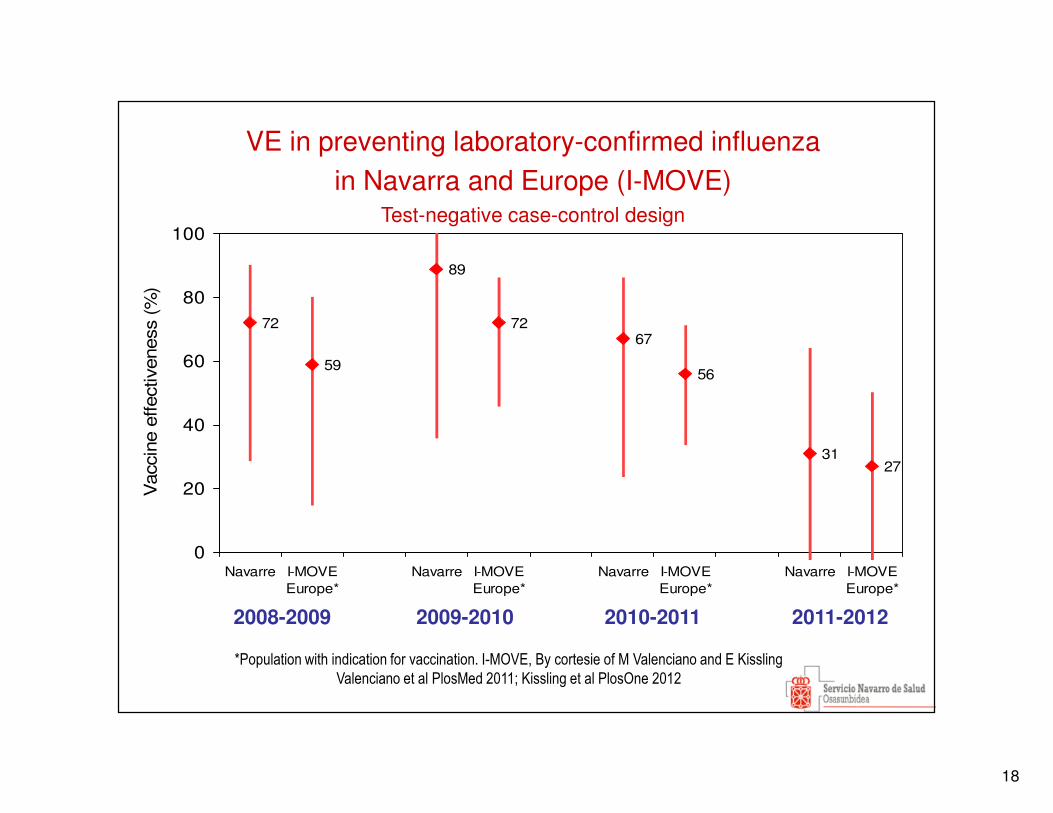
72
59
89
7267
56
3127
0
20
40
60
80
100
Navarre I-MOVEEurope*
Navarre I-MOVEEurope*
Navarre I-MOVEEurope*
Navarre I-MOVEEurope*
Vac
cine
effe
ctiv
enes
s (%
)
2008-2009 2009-2010 2010-2011 2011-2012
VE in preventing laboratory-confirmed influenza in Navarra and Europe (I-MOVE)
Test-negative case-control design
*Population with indication for vaccination. I-MOVE, By cortesie of M Valenciano and E Kissling
Valenciano et al PlosMed 2011; Kissling et al PlosOne 2012
19
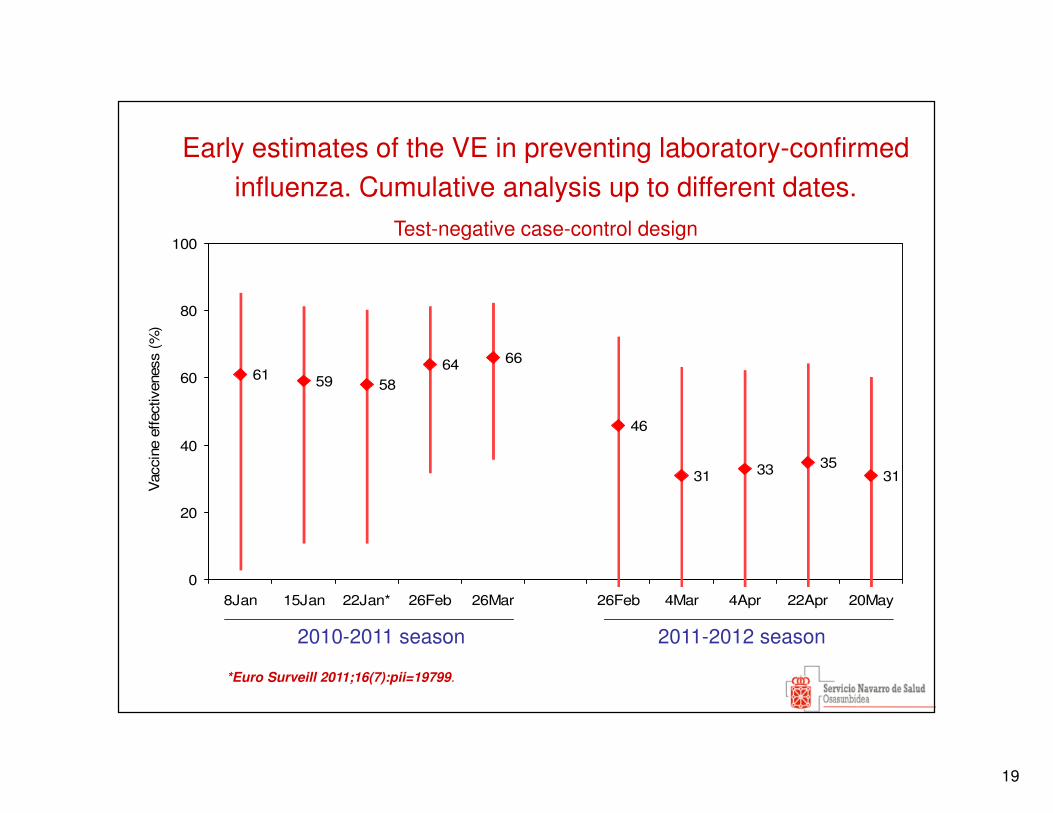
61 59 5864 66
46
31 33 3531
0
20
40
60
80
100
8Jan 15Jan 22Jan* 26Feb 26Mar 26Feb 4Mar 4Apr 22Apr 20May
Vac
cine
effec
tiven
ess
(%)
2010-2011 season 2011-2012 season
Early estimates of the VE in preventing laboratory-confirmed influenza. Cumulative analysis up to different dates.
Test-negative case-control design
*Euro Surveill 2011;16(7):pii=19799.
20
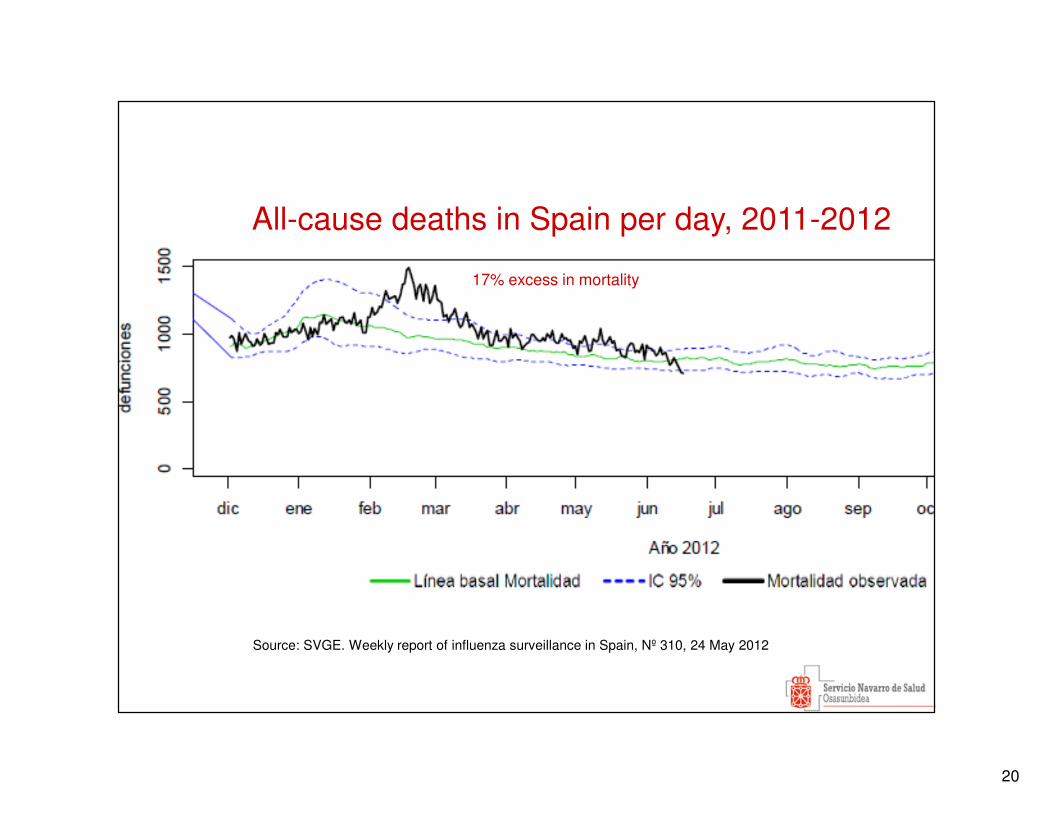
17% excess in mortality
Source: SVGE. Weekly report of influenza surveillance in Spain, Nº 310, 24 May 2012
All-cause deaths in Spain per day, 2011-2012
21
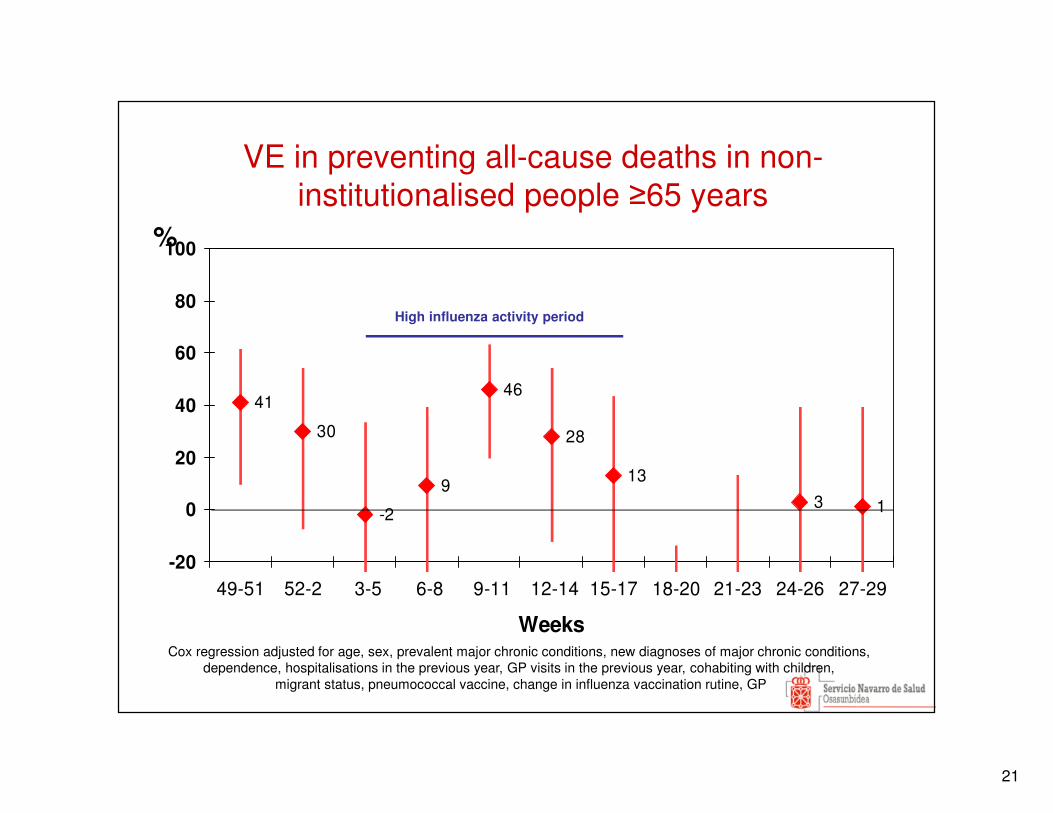
VE in preventing all-cause deaths in non-institutionalised people ≥65 years
41
30
-2
9
46
28
13
3 1
-20
0
20
40
60
80
100
49-51 52-2 3-5 6-8 9-11 12-14 15-17 18-20 21-23 24-26 27-29
Weeks
%
Cox regression adjusted for age, sex, prevalent major chronic conditions, new diagnoses of major chronic conditions, dependence, hospitalisations in the previous year, GP visits in the previous year, cohabiting with children,
migrant status, pneumococcal vaccine, change in influenza vaccination rutine, GP
High influenza activity period
22
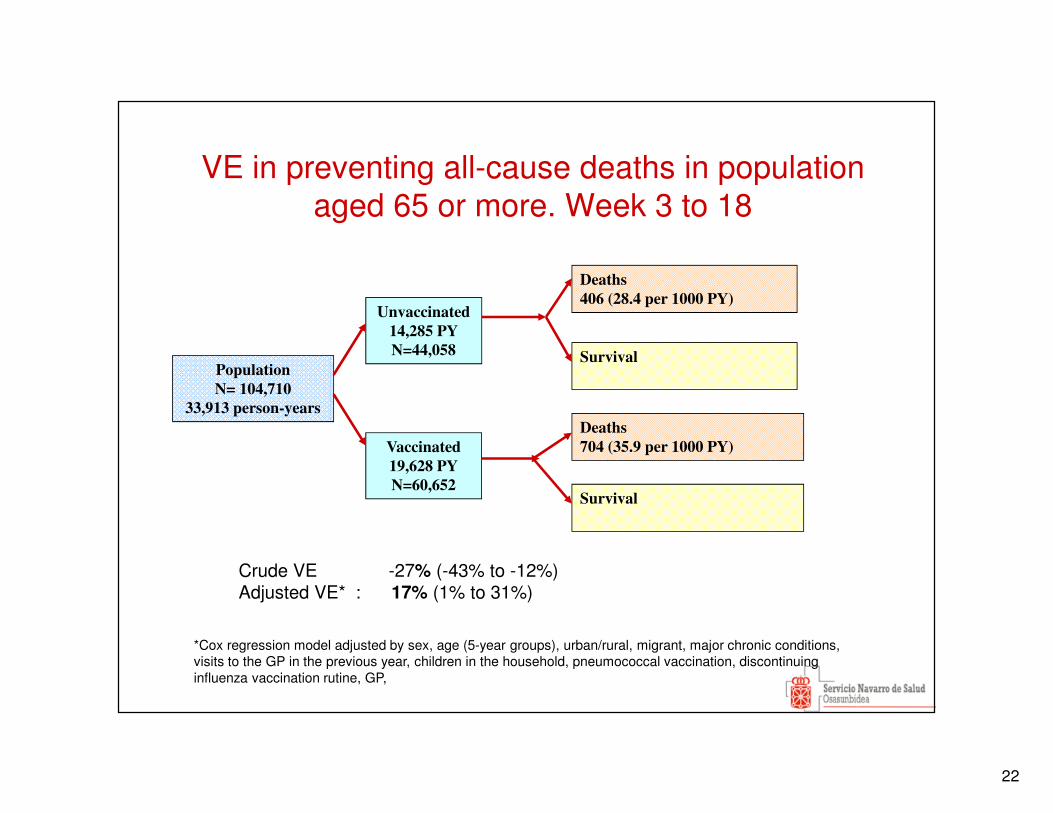
VE in preventing all-cause deaths in population aged 65 or more. Week 3 to 18
Population
N= 104,710
33,913 person-years
Deaths
704 (35.9 per 1000 PY)
Survival
Deaths
406 (28.4 per 1000 PY)
Vaccinated
19,628 PY
N=60,652
Unvaccinated
14,285 PY
N=44,058
Survival
Crude VE -27% (-43% to -12%)Adjusted VE* : 17% (1% to 31%)
*Cox regression model adjusted by sex, age (5-year groups), urban/rural, migrant, major chronic conditions, visits to the GP in the previous year, children in the household, pneumococcal vaccination, discontinuing influenza vaccination rutine, GP,
23
Strengths
• Real-time estimations
• VE against several outcomes.
• Laboratory-confirmed cases.
• Same methodology in subsequent years.
• More than one design to evaluate the same outcome.
• Financially sustainable. Based on routine activities (surveillance and vaccination
programme).
Limitations
• Study size could be small to obtain conclusive results in seasons with low
incidence or low VE.
• Results might be not generalizable to other regions and countries.
• We need some external funds to maintain a high number of laboratory tests and
to obtain early results.
Conclusion
Navarre is a good site for annual monitoring of influenza VE.
24
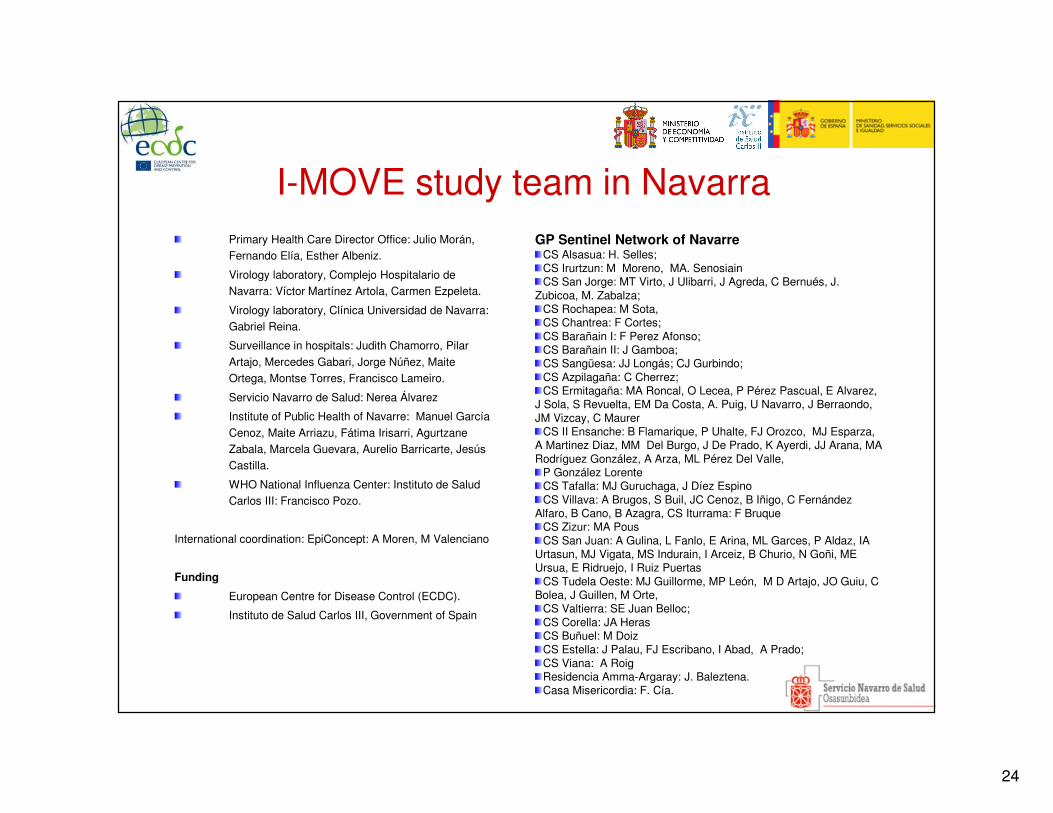
I-MOVE study team in NavarraPrimary Health Care Director Office: Julio Morán, Fernando Elía, Esther Albeniz.
Virology laboratory, Complejo Hospitalario de Navarra: Víctor Martínez Artola, Carmen Ezpeleta.
Virology laboratory, Clínica Universidad de Navarra: Gabriel Reina.
Surveillance in hospitals: Judith Chamorro, Pilar
Artajo, Mercedes Gabari, Jorge Núñez, Maite Ortega, Montse Torres, Francisco Lameiro.
Servicio Navarro de Salud: Nerea Álvarez
Institute of Public Health of Navarre: Manuel García
Cenoz, Maite Arriazu, Fátima Irisarri, Agurtzane Zabala, Marcela Guevara, Aurelio Barricarte, Jesús Castilla.
WHO National Influenza Center: Instituto de Salud Carlos III: Francisco Pozo.
International coordination: EpiConcept: A Moren, M Valenciano
Funding
European Centre for Disease Control (ECDC).
Instituto de Salud Carlos III, Government of Spain
GP Sentinel Network of NavarreCS Alsasua: H. Selles;CS Irurtzun: M Moreno, MA. Senosiain CS San Jorge: MT Virto, J Ulibarri, J Agreda, C Bernués, J.
Zubicoa, M. Zabalza; CS Rochapea: M Sota, CS Chantrea: F Cortes;CS Barañain I: F Perez Afonso;CS Barañain II: J Gamboa;CS Sangüesa: JJ Longás; CJ Gurbindo;CS Azpilagaña: C Cherrez;CS Ermitagaña: MA Roncal, O Lecea, P Pérez Pascual, E Alvarez,
J Sola, S Revuelta, EM Da Costa, A. Puig, U Navarro, J Berraondo, JM Vizcay, C Maurer
CS II Ensanche: B Flamarique, P Uhalte, FJ Orozco, MJ Esparza, A Martinez Diaz, MM Del Burgo, J De Prado, K Ayerdi, JJ Arana, MA Rodríguez González, A Arza, ML Pérez Del Valle,
P González LorenteCS Tafalla: MJ Guruchaga, J Díez Espino CS Villava: A Brugos, S Buil, JC Cenoz, B Iñigo, C Fernández
Alfaro, B Cano, B Azagra, CS Iturrama: F BruqueCS Zizur: MA PousCS San Juan: A Gulina, L Fanlo, E Arina, ML Garces, P Aldaz, IA
Urtasun, MJ Vigata, MS Indurain, I Arceiz, B Churio, N Goñi, ME Ursua, E Ridruejo, I Ruiz Puertas
CS Tudela Oeste: MJ Guillorme, MP León, M D Artajo, JO Guiu, C Bolea, J Guillen, M Orte,
CS Valtierra: SE Juan Belloc; CS Corella: JA HerasCS Buñuel: M DoizCS Estella: J Palau, FJ Escribano, I Abad, A Prado;CS Viana: A RoigResidencia Amma-Argaray: J. Baleztena.Casa Misericordia: F. Cía.