Embed Size (px)
Citation preview
Monitoring of Slope Stability by Using Global Positioning System (GPS)
Eric Ma1, Yongqi Chen2, Xiaoli Ding3
Department of Land Surveying and Geo-Informatics
Hong Kong Polytechnic University, Hung Hom, Hong Kong.
Email: [email protected] Phone: 27665967 Fax:23302994
Biography :
1. Mr. Ma received a Bachelor degree in Surveying and Geo-informatics from the Hong Kong
Polytechnic University in 1997. His research focuses are on GPS theory and application and he is
currently studying a part-time MPhil degree specialized in GPS. He now works in the Lands
Department of the Government of the Hong Kong Special Administrative Region as an Assistant
Land Surveyor and will be elected as a corporate member of the Hong Kong Institute of Surveyors
in June 2001.
2. Chen Yong-qi, chair professor and head of Department of Land Surveying and Geo-informatics at
the HK polytechnic university. He received his degree education from the Wuhan Technical
University of Surveying and Mapping, China and his PhD from the University of New Brunswick,
Canada. He was chairman of commission 6, FIG. He published over 200 technical papers and 6
books.
3. Dr. Xiaoli Ding received education in China and Australia. He has lectured in China, Australia and
Hong Kong and is currently an Associate Professor at the Hong Kong Polytechnic University.
Abstract :
Recently, the use of Global Positioning System (GPS) in slope deformation monitoring has received
great attention in various countries. However, in Hong Kong, this application is still in a planning stage.
The reasons may be the high expenses of purchasing numerous receivers for various monitored points
and the reduction of GPS accuracy due to biases such as multipath effect. This study developed a GPS
multi-antenna system for landslide detection in Hong Kong. In this system, a special electronic device
called GPS Multi-Antenna Selector (GMAS) was employed to connect various antennas to one receiver
and GPS data was taken sequentially from each of these antennas to the receiver. By adopting this
design, the expenses spent on purchasing receivers were dramatically reduced. Furthermore, the
adaptability of using long cables (longer than 60m) for data communication was evaluated. The
development and implementation of the system were discussed in detail. Additionally, we estimated the
multipath effect on slope environment by making use of its day-to-day repeatability characteristic. This
system can be applied widely in Hong Kong and many parts of the World to identify potential slope
failures and also can be used to study the stability of many other objects such as dams, high-rise
buildings and structures.

1. Introduction
Since Hong Kong is a small and hilly city with a
dense population, many people live in the areas
which have high risk of landslides. Today, many
of the over 50,000 existing slopes in Hong Kong
are unstable. More than 20,000 of them were
built decades ago and might collapse under
certain conditions. In order to avoid disasters, it
is necessary to accurately monitor the movement
of slopes.
In Hong Kong, two types of techniques have
been used to monitor the deformation of slopes.
They are the conventional survey techniques and
the geotechnical techniques. The main
drawbacks of conventional survey techniques are
the low efficiency, sensitivity to atmospheric
conditions and their requiring direct line-of-sight
between instrument stations and the measured
points. In addition, geotechnical techniques can
only measure relative deformations within a
limited area. As a result, an automatic system is
needed to continuous monitor the progressive
deformation of slopes with time.
GPS (Global positioning System) is a potential
tool used to measure ground displacements over
an extensive area in various engineering projects
involving high cut slopes, large open pit mines,
subsidence and landslide. Several researchers
have already studied the applications of GPS in
ground displacements (Chrzanowski, 1988;
Murria and Saab, 1988; Strange, 1989; Blodgett,
1990; Ding, 1996;Stewart et al., 1996b and
Tsakiri, 1996). Several factors make GPS an
attractive tool for ground displacements: less
labour intensive, the decrease in the price of
GPS hardware, it measure three dimensional
vector of displacements of the ground, real time
monitoring and its ability to measure ground
displacements over an extensive area.
Many scientists from different fields have spent
much of their time in developing GPS slope
monitoring system. For example, Kondo (1995)
developed a system to continuously determine
positions in real-time of up to ten locations using
GPS. Result shown that the order of 2 cm of
displacements could be detected by statistical
tests. Shimizu et al. (1996) also designed a
system to measure displacements of many points
simultaneously in real-time. They tested the
system in a limestone open quarry in Yamaguchi,
Japan and the result revealed that the system
could measure displacements almost as
accurately as total station surveying.
Furthermore, Shimizu (1994) proposed a method
for improving the accuracy of GPS displacement
measurements by using adaptive filtering. Other
applications to slope monitoring were also
conducted by Ananga (1996, 1997) and Sakurai
and Hamada (1996).
However, existing researches have used the
standard methods of attaching one GPS antenna
to a GPS receiver. To monitor a slope, a large
number of points usually need to be monitored.
As a result, numerous receivers must be required
to monitor a group of points. This approach is so
expensive that it can only been used on a very
limited scale. In addition, there have been few
studies in consideration of the special conditions
of slopes. GPS satellite signals are often
obstructed by tall vegetation and high-rise
buildings nearby. The slope surface can also
cause GPS signal multipath errors. More
importantly, there is little information available
on the application of GPS in slope monitoring in

Hong Kong. Therefore, this paper sets out to
develop a new GPS slope monitoring system,
which employs a single GPS receiver and
multiple antennas for monitoring slope
deformations in Hong Kong. This research
project includes tests of different hardware
configuration and software development. The
project also aims to study the methods to reduce
GPS signal multipath effect. Experimental
results from some preliminary tests of the system
will also be given. The accuracy, advantages and
limitations of GPS in deformation monitoring of
slope will also be evaluated.
2. System Overview
The GPS Multi-Antenna System is developed to
reduce the expenses of hardware in slope
monitoring survey (see figure 1). Some early
work on the system can be found from Chen et
al. (2000) and Ding et al. (2000). A GPS
Multi-Antenna Selector (GMAS) is used to
connect a number of antennas to one receiver so
the expenses spend on purchasing receivers are
dramatically reduced (see figure 2). The GMAS
does not change the structure of the GPS signal
and it scans the antennas sequentially so that
each antenna is connecting to the receiver for a
fixed time interval. User can set the interval in
advance according to their applications.
Figure 1 The basic element of the GPS Figure 2 GMAS - Antenna Connector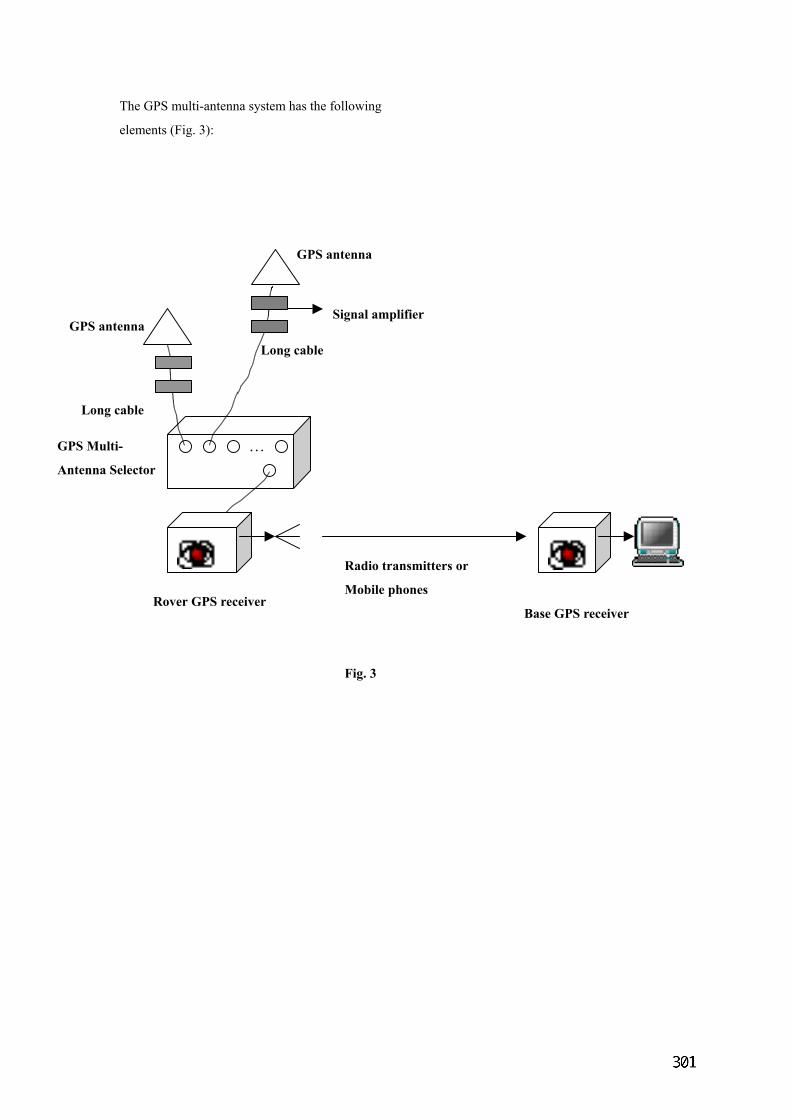
The GPS multi-antenna system has the following
elements (Fig. 3):
Rover GPS receiver Base GPS receiver
GPS antenna
GPS antenna
GPS Multi-
Antenna Selector
Long cable
Long cable
Radio transmitters or
Mobile phones
Signal amplifier
Fig. 3
…

2.1 GPS Multi-Antenna Selector (GMAS)
It is a special electronic device containing two
hardware. One is the antenna connector and the
other is the timing controller. The antenna
connector contains multi-input and one-output
terminals. Different antennas are connected to
these multi-input terminals and a receiver is
connected to the one-output terminal. GPS
signals received from different antennas, which
passing through these multi-input terminals, are
measured in the same receiver. On the other
hand, the timing controller is used to control
measuring period of each antenna. With the help
of the GMAS, only one receiver is used to
monitor a number of points.
2.1.2 GPS antenna and receiver
To achieve high accuracy result, using dual
frequency receivers are recommended in slope
deformation monitoring. In view of which model
of receiver should be chosen, this depends on the
purposes of the survey and location of the site.
2.1.3 Data transmission
Data communication is a vital part in this
research. We need to deal with two critical issues.
The first one is how the data is transferred from
the antennas to the rover receiver. The second
one is how the data is transferred from the rover
receiver to the base receiver. For the first
question, the problem is that in a slope site,
monitoring points are usually dispersed.
Therefore, long cables (longer than 60m) are
usually used to connect the antennas to the rover
receiver.
Generally, there are three types of cable can be
choose from. They are Twisted Pair cable,
Coaxial Cable and Fiber Optic Cable. Twisted
Pair cable is often considered a low-frequency
transmission medium Its main benefits are
relatively inexpensive and easy to install.
Coaxial Cable consists of a single wire in the
center surrounded by a core of insulating
material, with an outer conductive wrapping
which is usually a copper cylinder. This copper
cylinder is capable of absorbing any noise or
interference from the surroundings and then
sending them to the ground. This type of cable
transmits high frequencies like several hundred
Mbps. Compared with the above two types of
cable, Fiber Optical cable offers the widest
bandwidth, the lowest attenuation and is also the
most expensive one. It is especially suitable for
long distance data transmission up to 10 km.
In this project, Coaxial cable is selected. It is
because for twisted cable it is relatively too
sensitive to noise and providing the lowest
bandwidth. In addition, for transmitting GPS
signal through Fiber Optical cable, it is
necessary to convert the GPS signal, which is an
analog signal to optical signal using a GPS fiber
optic network. However, the cost of such a
network is about ten times higher than the cost
of using a coaxial cable linked with a signal
amplifier. This is not practical for most small
scale slope monitoring surveys. As a result,
Coaxial Cable is considered the most appropriate
one to be employed in this study.
After having selected the appropriate cable,
another problem is how to minimize the GPS
signal loss during data transmission. As GPS
signal is an analog signal, which is susceptible to
noise and the noise is an unwanted signal that
has sufficient amplitude to interfere with the
communication process. There are two
alternatives to solve this problem. The first one
is to convert the GPS signal from analog signal
to digital signal first for data transmission and
then convert the signal back to analog signal
when it arrives at the base receiver. This
conversion process can be done by using the
Pulse Code Modulation (PCM) method which is
a standardized method used in the telephone
network to change an analog signal to digital one
for data transmission. As digital signal is less
susceptible to noise, it can replaces analog signal
for long distance data transmission. However,
GPS signal may be destroyed after the PCM
conversion process and therefore is not
recommended in this project.
The second method, which has been adopted in
this research, is to use a signal amplifier to
compensate the GPS signal loss during data
transmission. GPS signal strength decreases with
increasing distance from a GPS antenna. This
attenuation is usually expressed in decibels (dB).
An attenuation of n dB means that the original
GPS signal is reduced by a factor of 10-0.1n. For
a 60m RG58A/U coaxial cable, the attenuation is
about 60 dB and this means the GPS signal
strength is reduced by about 1-0.6 of its original
strength. In this project, a GPS antenna with
25dB gain were linked with two 20dB signal
amplifiers to transmit signal over a 60m
RG58A/U coaxial cable. The function of the
signal amplifiers was to compensate the loss in
signal strength during long cable transmission.
The second critical issue in data transmission is
to send the GPS signal from the rover receiver to
the base receiver for data processing and
analysis. Various options can be adopted such as
mobile phones and radio transmitters. The
mobile phones are suitable for long distance data
transmission while the costs are higher
compared to radio transmitters. The radio
transmitters require direct ling-of-sight between
a pair of transmitters, thus they are only proper
for flat area and short distance application.
Generally speaking, the right choice to be used is
depended on the site environment and survey
requirement.
2.1.4 Solar panels and battery
To ensure the system can be capable of
continuous operating, a continuous power supply
should be provided. Therefore, it is suggested
that solar panels and the rechargeable battery
have to be used to power all the electronic
devices on site.
2.2 Reduction of the Multipath Effect
With the recent development in advance GPS
receiver technology and differential GPS
positioning methods, many of the errors sources
in GPS carrier-phase measurements have been
drastically reduced. For instance, most of the
errors in the carrier-phase measurements, such as
atmospheric delays, orbital and clock errors are
spatially correlated and generally cancel through
the differencing process. Consequently, GPS
multipath effect has become a dominant error
source for high precision applications and
extensive researches have been conducted to
reduce the effect. More importantly, high
multipath interference from slope surface has
limited the application of GPS in slope
monitoring.
Formation of Multipath effect on slope surface-
According to Hofmann-Wellenhof, B. et al.
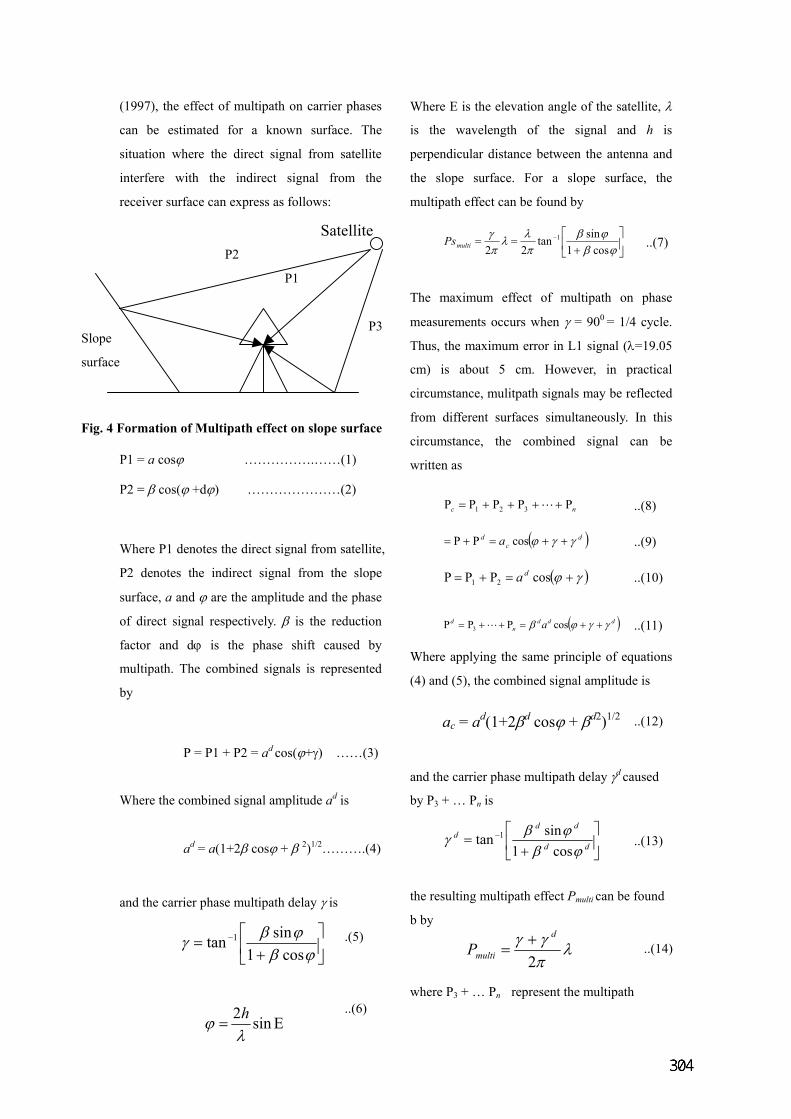
(1997), the effect of multipath on carrier phases
can be estimated for a known surface. The
situation where the direct signal from satellite
interfere with the indirect signal from the
receiver surface can express as follows:
P1 = a cosϕ …………….……(1)
P2 = β cos(ϕ +dϕ) …………………(2)
Where P1 denotes the direct signal from satellite,
P2 denotes the indirect signal from the slope
surface, a and ϕ are the amplitude and the phase
of direct signal respectively. β is the reduction
factor and dϕ is the phase shift caused by
multipath. The combined signals is represented
by
P = P1 + P2 = ad cos(ϕ+γ) ……(3)
Where the combined signal amplitude ad is
ad = a(1+2β cosϕ + β 2)1/2……….(4)
and the carrier phase multipath delay γ is
ere E is th f the satellite, λ
is the wavel gnal and h is
he maximum effect of multipath on phase
easurements occurs when γ = 900 = 1/4 cycle.
he
4) a
nd t
y P
he r
by
her
Wh e elevation angle o
ength of the si
perpendicular distance between the antenna and
the slope surface. For a slope surface, the
multipath effect can be found by
T
m
Thus, the maximum error in L1 signal (λ=19.05
cm) is about 5 cm. However, in practical
circumstance, mulitpath signals may be reflected
from different surfaces simultaneously. In this
circumstance, the combined signal can be
written as
W
(
a
b
t
b
w
Satellite
+
= −
ϕβϕβγ
cos1sintan 1
Ε= sin2λ
ϕ h
ϕcosmulti
+
== −
βϕβ
πλλ
πγ
1sintan
221Ps
nc L321 Ρ++Ρ+Ρ+Ρ=Ρ
.(5)
..(6)
..(7)
..(8)
P2
P1
P3 Slope
surface
Fig. 4 Formation of Multipath effect on slope surface
( )dc
d a γγϕ ++=Ρ+Ρ= cos ..(9)
( )γϕ +=Ρ+Ρ=Ρ cos21da
( )dddn
d a γγϕβ ++=Ρ++Ρ=Ρ cos3 L
..(10)
..(11)
re applying the same principle of equations
nd (5), the combined signal amplitude is
he carrier phase multipath delay γd caused
3 + … Pn is
ac = a (1+2β cosϕ + β ) d d d2 1/2
−dd
d ϕβ sin1
..(12)
esulting multipath effect Pmulti can be found
e P3
+ dd ϕβ cos1
=γ tan
γγ d+
..(13)
+ … Pn represent the multipath
λmultiP = ..(14)π2

signals from other reflected surfaces and Pd
nings
of the other terms are same as before.
For short baseline observation, most of the GPS
errors such as ionoshperic delays, orbital errors
and clock errors are very small compared to
multipath effect. In view of this, we can assume
that multipath effects are the major sources of
error contained in the observations. If we
compared a set of data with multipath effect
reflected from a slope surface with that do not
has the effect, we can determine the magnitude
of multipath effect reflected from a slope
surface.
According to equation (14), the resulting
multipath reflected from a slope surface and
other reflected surfaces is give as
On the
the othe
Therefo
the mu
can be
As mul
the mo
precise
out how
coordinate computation of the monitored points.
In the next section, experiments will be
conducted to examine the effect of multipath on
coordinate computations, deformation
measurements and observation residuals. We
will study the Day-to-Day repeatability
characteristics of multipath effect and make use
of these characteristics to reduce the effect on
GPS survey.
3. Experimental Results
3.1 Multi-Antenna GPS System
To demonstrate the utilization of the GPS
multi-antenna system, an experiment was
performed at the roof top of the Hong Kong
Polytechnic University. Location of the site was
shown on the figure 4.
represent their combined signal. The mea
γγ d+
contract, the multipath effect caused by
r reflected surface is equal to
re
ltip
fou
tip
st
G
λπ2multiP =
γ d
Roof top of the C-D cores
, minus equation (14) by equation (15),
ath effect caused by the slope surface
nd out
ath reflected from the slope surface is
significance error source affecting
PS slope monitoring, it is vital to find
large it is and how does it affect the
Af
an
ba
to
th
Th
ou
us
co
λπ2
multidP =
λπγ2
=multiPs
..(15)
..(16)
Figure 4 Location of the experiment site
ter detail investigation, one reference station
d two monitored points were selected. Two
selines were formed from the reference station
each monitored points individually. Both of
ese baselines were approximate 45 m in length.
e GMAS has six input terminals and one
tput terminal, only terminals 3 and 5 were
ed for illustration. Two antennas were
nnected to these input terminals and one

receiver was linked to the output terminal. A 60
m long cable linked with two 20 dB signal
amplifiers was used to connect the antenna to the
MAS so as to stimulate the slope environment.
al. The receiver did not recognize the
witch of the GMAS, thus the data logging kept
nd we needed
divide it into two parts in data processing.
G
The observation time of each terminal can be set
by user in advance. In this experiment, the time
interval was set as about 16 minutes which was
long enough for fast static positioning.
Two sessions of fast static positioning were
launched and the observation period for each
antenna was selected as 16 minutes. When the
maximum time interval was reached, the GMAS
would switch to the other terminal to collect
GPS sign
s
continue when GMS switch form one antenna to
the other. At the end, all the data from different
antennas were recorded as a file a
to
Terminal 3 Terminal 5
Coordinate Value in
Conventional Terrestrial
(CT) System
Coordinate Value in
Conventional Terrestrial
(CT) System
X Y Z X Y Z
*78.0216 *36.0814 *68.8746 *76.8583 *36. 4 4678 *69.148
*78.0147 *36.0710 *68.8733 *76.8612 *36.4688 *69.1515
Remark - Where * are the first five digits of the
coordinates and are the same for the two
monitored points.
of the experiments were to investigate the
ent, two points of 9.682 m apart
ere selected to form a baseline. One was the
s the rover station.
ere carefully
ion. More than three
ours observations were taken for each
xperiment. The experiments last 9 days,
owever only 6 days were recorded due to poor
eather condition. The results of the
xperiments were listed in table 1:
3.2 Reduction of Multiapth effect
Experiments were conducted to analyze the
multipath effect in monitoring survey. The aims
following factors :
a. The magnitude of the multipath on
coordinates;
b. The effect of multipath on
measurements of displacements;
c. The magnitude of the multipath effect
on L1 residuals and L2 residuals.
In this experim
w
base station and the other wa
The locations of the points w
selected so that they were free of obstructions
and located in a low multipath environment. The
tripods were fixed and the antennas were taken
down after each observation and were mounted
on before next observat
h
e
h
w
e
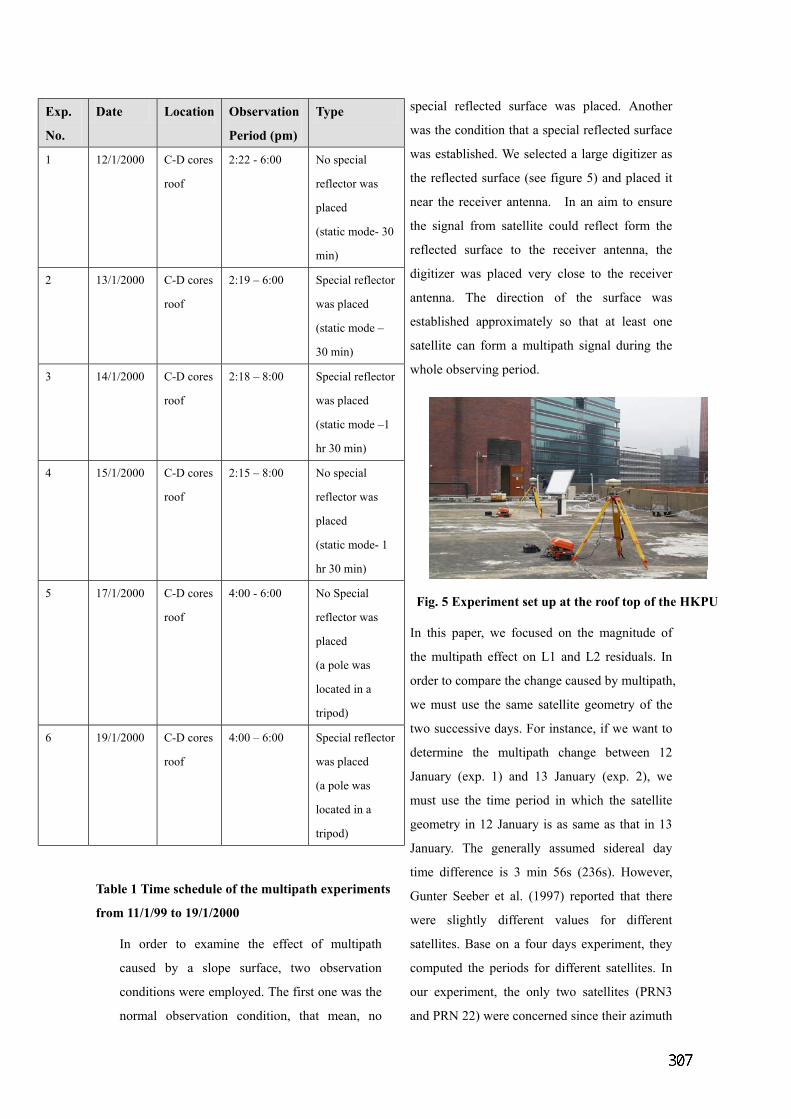
In order to examine the effect of multipath
urface was placed. Another
as the condition that a special reflected surface
was
the refle figure 5) and placed it
nea
the sign rm the
refl d
digitizer ceiver
antenna. The direction of the surface was
caused by a slope surface, two observation
conditions were employed. The first one was the
normal observation condition, that mean, no
special reflected s
w
established. We selected a large digitizer as
cted surface (see
r the receiver antenna. In an aim to ensure
al from satellite could reflect fo
ecte surface to the receiver antenna, the
was placed very close to the re
established approximately so that at least one
satellite can form a multipath signal during the
whole observing period.
roof was placed
(a pole was
located in a
tripod)
Tab of the multipath experiments
from 11/1/99 to 19/1/2000
le 1 Time schedule
PU
Fig. 5 Experiment set up at the roof top of the HK
magnitude of
he multipath effect on L1 and L2 residuals. In
rder to compare the change caused by multipath,
e must use the same satellite geometry of the
wo successive days. For instance, if we want to
In this paper, we focused on the
t
o
w
t
Exp.
No.
Date Location Observation
Period (pm)
Type
1 12/1
0
/2000 C-D cores
roof
2:22 - 6:00 No special
reflector was
placed
(static mode- 3
min)
2 13/1
roof
ial reflector
was placed
/2000 C-D cores 2:19 – 6:00 Spec
(static mode –
30 min)
3 14/1 r
/2000 C-D cores
roof
2:18 – 8:00 Special reflecto
was placed
(static mode –1
hr 30 min)
4 15/1
/2000 C-D cores
roof
2:15 – 8:00 No special
reflector was
placed
(static mode- 1
hr 30 min)
5 17/1/2000 C-D cores 4:00 - 6:00 No Special
r was
n a
pod)
roof reflecto
placed
(a pole was
located i
tri
6 19/1 or /2000 C-D cores 4:00 – 6:00 Special reflect
ea
u
e
a
m
u
e
a
o
u
n
d
J
m
g
J
ti
G
w
s
c
o
a
termine the multipath change between 12
nuary (exp. 1) and 13 January (exp. 2), we
st use the time period in which the satellite
ometry in 12 January is as same as that in 13
nuary. The generally assumed sidereal day
e difference is 3 min 56s (236s). However,
nter Seeber et al. (1997) reported that there
re slightly different values for different
tellites. Base on a four days experiment, they
mputed the periods for different satellites. In
r experiment, the only two satellites (PRN3
d PRN 22) were concerned since their azimuth
was around 30 to 70 degree during the
bservation period. This was the period when
ultipath signal would be reflected from the
pecial reflector. Therefore, we could investigate
e observation residuals of these two satellites
this period to determine the mulitpath effect
aused by the special reflector. These two
atellites are listed as follows:
ue to the fact that, the baseline used in this
xperiment is relatively short, the most of the
PS errors such as ionospheric delays, orbital
rrors and clock errors are very small compared
multipath effect. In view of this we can
ssume that multipath effects are the mainly
ources of error contained in the observation
esiduals. Therefore, these residuals can be
tilized as the estimation of the multipath effect.
e can compute the multipath effect cause by
e special reflector by computing the
ifferences of observation residuals of the two
bservation conditions in experiments 3 and 4
espectively.
here DL(t) is the differences of observation
esiduals, V15 denote the observation residuals of
o
m
s
th
in
c
s
D
e
G
e
to
a
s
r
u
W
th
d
o
r
W
r
15 January in experiment 4, V14 denote the
bservation residuals of 14 January in
xperiment 3, n is the differences of experiment
o
e
days (n=1 in this case) and α is the sidereal
day time difference.
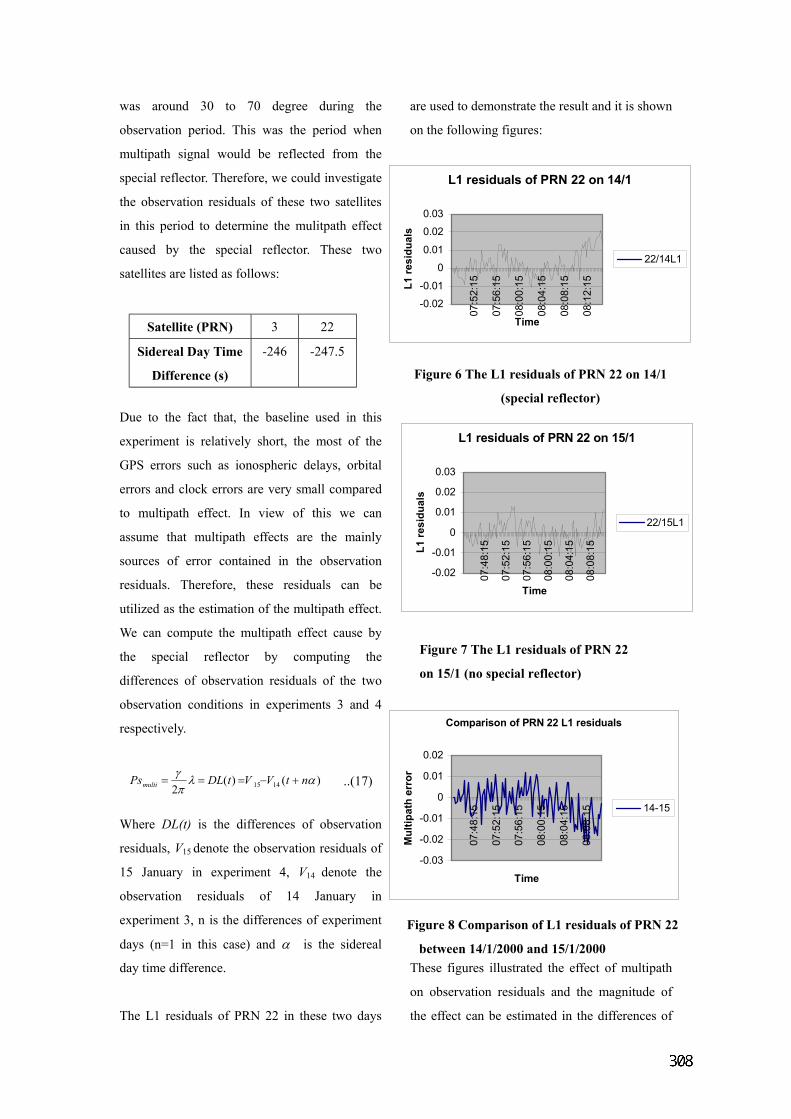
The L1 residuals of PRN 22 in these two days
are used to demonstrate the result and it is shown
on the following figures:
These figures illustrated the effect of multipath
on observation residuals and the magnitude of
the effect can be estimated in the differences of
)()(2 1415λπγ ntVVtDLPsmulti +−=== α
L1 residuals of PRN 22 on 14/1
-0.02
00.01
0.02
07:52:15
07:56:15
08:00:15
08:04:15
08:08:15
08:12:15
Time
-0.01
0.03
L1 re
sidu
als
22/14L1
Figure 6 The L1 residuals of PRN 22 on 14/1
(special reflector)
L1 residuals of PRN 22 on 15/1
-0.02
-0.01
0
0.01
0.02
0.0307:48:15
07:52:15
07:56:15
08:00:15
08:04:15
08:08:15
Time
L1 re
sidu
als
22/15L1
Figure 7 The L1 residuals of PRN 22
on 15/1 (no special reflector)
Comparison of PRN 22 L1 residuals
-0.02
-0.01
0
0.01
0.02
07:48:15
07:52:15
07:56:15
08:00:15
08:04:15
08:08:15
Time-0.03
Mul
tipat
h er
ror
14-15
Figure 8 Comparison of L1 residuals of PRN 22
between 14/1/2000 and 15/1/2000
..(17)
Satellite (PRN) 3 22
Sidereal Day Time
D s
-246 -247.5
ifference ( )

residuals. We here take figures 6, 7 and 8 as
examples to demonstrate the results. As
mentioned before, in this tests, the major source
of error contain in observation residuals is
multipath effect. Consequently, the fluctuation of
the observation residuals will reflect the
changing of the multipath effect. By comparing
figure 6 with figure 7, we can see that as a result
f multipath effect caused by the special
le of PRN 22 o 4/1 has
r at /1 ore,
e p residuals on 14/1 is 0.022
while that on 15/1 is only 0.015 m. This is
n slope monitoring and offer vital
dvantages over existing techniques.
dditionally, the multipath effect in
nvironment was studied. Some tests were
ity of this system in a real
ield will be evaluated by conducting some field
nment. In addition, the
ystem will be further developed for real-time
andslide detection.
cknowledgements :
Grateful acknowledgement is made to my
supervisor, Professor Chen Yong Qi for his
upervision, support and encouragement in
reparation and undertaking this research. I
ould also like to thank Dr. Ding who has given
arch. I wou owledge the
ong Kong Polytechnic University in providing
he grant (Project Account: G-V823) to me to
erform the study. Finally, thanks are given to
y family and my wife, Ms. Maris Lo for their
atience, understanding and support throughout
eferences :
nanga, N., and S. Sakurai (1996). “Sliding
ffects of a cut slope for tunnel construction.”
tional
Measurements,
ong Kong, 25-28 June, pp. 65-68.
nanga, N., S. Sakurai, and I. Kawashima
(1997). “Cut slope deformation determination
with GPS.” Journal of Survey Review, Vol. 34,
No. 265, pp. 144-150.
lodgett, J.C. (1990). “Monitoring land
ubsidence in Sacramento valley, California ,
o
ref ctor, L1 residuals n 1
la ger fluctuation than th
eak value of the
on 15 . Furtherm
th
m
resulted from the larger influence of multipath
effect on 14/1 than 15/1. According to equation
17, we can also estimate the magnitude of
multipath effect by comparing the differences of
the L1 residuals between the two days. Figure 8
illustrates the changing of the effect with time
and we can use it as estimation of the effect.
4. Conclusion and recommendation
A multi-antenna GPS system has been
introduced in detail. The development of the
system and some experiments were outlined.
The system can significantly reduce the cost of
applying GPS i
a
A slope
e
conducted and the results were presented in
depth. This method can be combined with the
multi-antenna GPS system to provide high
accuracy result for slope deformation detection
in Hong Kong.
In future, the availabil
f
tests. A longer cable (longer than 90m) linked
with 60 dB signal amplifier will be employed to
stimulate the slope enviro
s
l
A
s
p
w
valuable advice to me in conducting this
ld also like to acknrese
H
t
p
m
p
the whole research.
.
R
A
e
Proceedings of the 8th FIG Interna
Symposium on Deformation
H
A
B
s
using GPS.” Journal of Surveying Engineering,
SCE, Vol. 116(2), pp. 112-130. A
Chen, Y.Q., Ding, X.L., Huang, D.F. and Zhu, J.J.
(2000). “A Multi-Antenna GPS System for
Local Area Deformation Monitoring.” Earth,
Planets and Space. Vol. 52, No. 10, pp. 873-876.
Chrzanowski, A.,Y. Chen, R. Leeman and J. Leal
(1998). “Integration of the Global Positioning
System with geodetic levelling surveys in
ground subsidence studies.” Procdeedings of the
5th Int. (FIG) Symposium on Deformation
Measurements and 5th Canadian Symposium on
Mining Surveying and Rock Deformation
Measurements, the University of New
Brunswick Grafic Services, pp. 142-155.
Ding, X., Ren D., Su, B., Swindells, C.
Montgomery, B. and Jewell, R. (1996). “An
intelligent data acquisition and management
system for open pit slope deformation
monitoring.” Proceeding of the 8th Int. (FIG)
Symposium on Deformation Measurements,
Hong Kong, 25-28 June.
Ding, X.L., Chen, Y.Q., Huang, D.F., Zhu, J.J.,
f the satellite division of the
nstitute of Navigation, pp. 1877-1884.
d Rock Deformation
easurements, the University of New
ices, pp. 367-373.
PS real-time Monitoring
stem for Deformation Measurements and its
Proceedings of the 8th FIG
ination of
roundwater withdrawal subsidence.” Journal of
Ding (1996b). “Pit Wall
eformation monitoring using GPS.” Proceeding
ing (1996).
GPS navigation techniques in open pit
Tsakiri, M. and Stewart, M. (2000). “Slope
monitoring using GPS: a multi-antenna
approach.” GPS World, No. 3, Vol. 11, pp.
52-55.
Hofmann-Wellenhof, B., H. Lichtenegger and J.
Collins (1997). GPS theory and practice.
Springer Wien, New York.
Kondo, H., and E. Cannon (1995). “Real-time
landslide detection system using precise carrier
phase GPS.” Proceedings of the 8th International
Technical Meeting o
I
Murria, J., and J. A. Saab (1988). “Engineering
and construction in areas subjected to subsidence
due to oil production.” Proceedings of the 5th Int.
(FIG) Symposium on Deformation
Measurements and 5th Canadian Symposium on
Mining Surveying an
M
Brunswick Grafic Serv
Sakurai, S., and N. Shimizu (1994). “Assessment
of cut slopes by using the Global Positioning
System (GPS): a case study.” Proceedings of
MMIJ/AusIMM Joint Symposium, pp. 313-321.
Sakurai, S., and K. Hamada (1996). “Monitoring
of slope stability by means of GPS.”
Proceedings of the 8th FIG International
Symposium on Deformation Measurements,
Hong Kong, 25-28 June, pp. 55-60.
Shimizu, N., Y. Mizuta, H. Kondo, and H. Ono
(1996). “A New G
Sy
Application.”
International Symposium on Deformation
Measurements, Hong Kong, 25-28 June, pp.
47-54.
Strange, W. E. (1989). “GPS determ
g
Surveying Engineering, ASCE, Vol. 115(2), pp.
198-217.
Stewart, M., and X.
d
of the 37th Australian Surveyors Congress, Perth
13-18 April, pp. 213-221.
Tsakiri, M. M. Stewart and X. D
“
deformation monitoring.” Proceeding of the ION
GPS’96, Kansas, USA, 16-20 Sept.